Embed Size (px)
Citation preview
31 July 2013
Hutchison Telecommunications Hong Kong Holdings Limited (Stock Code: 215) 2013 Interim Results Presentation
Disclaimer
1
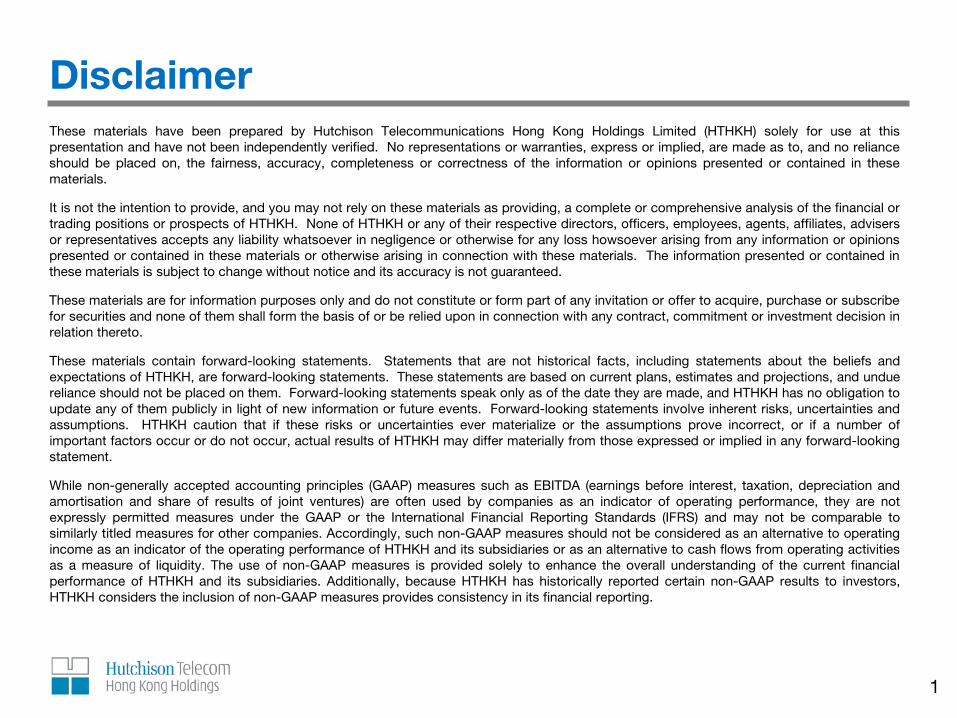
These materials have been prepared by Hutchison Telecommunications Hong Kong Holdings Limited (HTHKH) solely for use at this presentation and have not been independently verified. No representations or warranties, express or implied, are made as to, and no reliance should be placed on, the fairness, accuracy, completeness or correctness of the information or opinions presented or contained in these materials.
It is not the intention to provide, and you may not rely on these materials as providing, a complete or comprehensive analysis of the financial or trading positions or prospects of HTHKH. None of HTHKH or any of their respective directors, officers, employees, agents, affiliates, advisers or representatives accepts any liability whatsoever in negligence or otherwise for any loss howsoever arising from any information or opinions presented or contained in these materials or otherwise arising in connection with these materials. The information presented or contained in these materials is subject to change without notice and its accuracy is not guaranteed.
These materials are for information purposes only and do not constitute or form part of any invitation or offer to acquire, purchase or subscribe for securities and none of them shall form the basis of or be relied upon in connection with any contract, commitment or investment decision in relation thereto.
These materials contain forward-looking statements. Statements that are not historical facts, including statements about the beliefs and expectations of HTHKH, are forward-looking statements. These statements are based on current plans, estimates and projections, and undue reliance should not be placed on them. Forward-looking statements speak only as of the date they are made, and HTHKH has no obligation to update any of them publicly in light of new information or future events. Forward-looking statements involve inherent risks, uncertainties and assumptions. HTHKH caution that if these risks or uncertainties ever materialize or the assumptions prove incorrect, or if a number of important factors occur or do not occur, actual results of HTHKH may differ materially from those expressed or implied in any forward-looking statement.
While non-generally accepted accounting principles (GAAP) measures such as EBITDA (earnings before interest, taxation, depreciation and amortisation and share of results of joint ventures) are often used by companies as an indicator of operating performance, they are not expressly permitted measures under the GAAP or the International Financial Reporting Standards (IFRS) and may not be comparable to similarly titled measures for other companies. Accordingly, such non-GAAP measures should not be considered as an alternative to operating income as an indicator of the operating performance of HTHKH and its subsidiaries or as an alternative to cash flows from operating activities as a measure of liquidity. The use of non-GAAP measures is provided solely to enhance the overall understanding of the current financial performance of HTHKH and its subsidiaries. Additionally, because HTHKH has historically reported certain non-GAAP results to investors, HTHKH considers the inclusion of non-GAAP measures provides consistency in its financial reporting.

Business Performance
3
2013 1H
HK$ millions
2012 1H (Restated)
HK$ millions
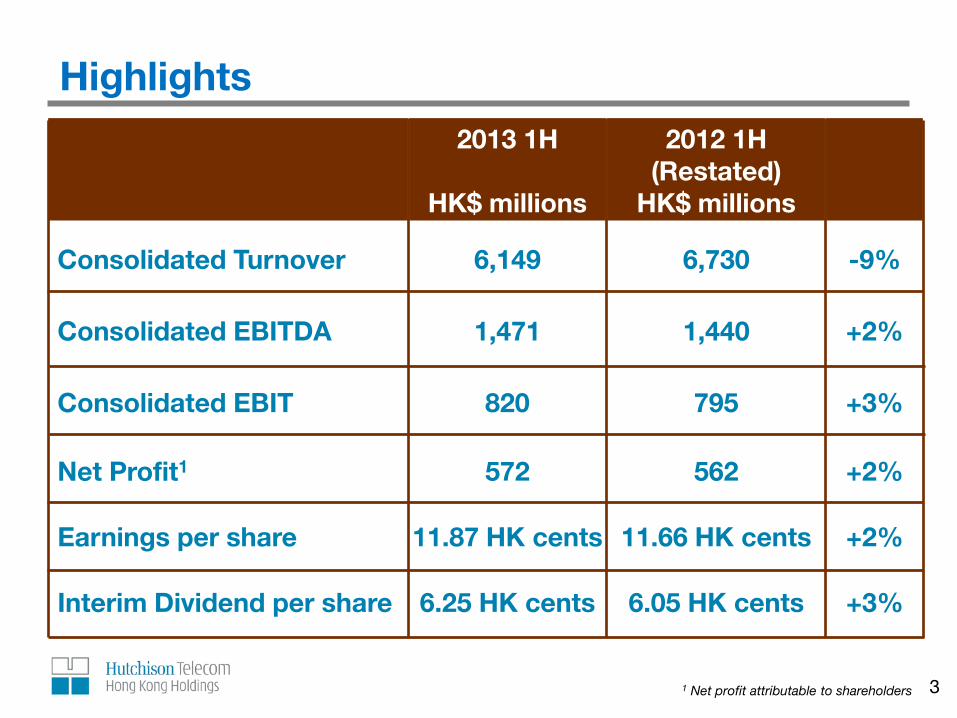
Consolidated Turnover 6,149 6,730 -9%
Consolidated EBITDA 1,471 1,440 +2%
Consolidated EBIT 820 795 +3%
Net Profit1 572 562 +2%
Earnings per share 11.87 HK cents 11.66 HK cents +2%
Interim Dividend per share 6.25 HK cents 6.05 HK cents +3%
1 Net profit attributable to shareholders
Highlights
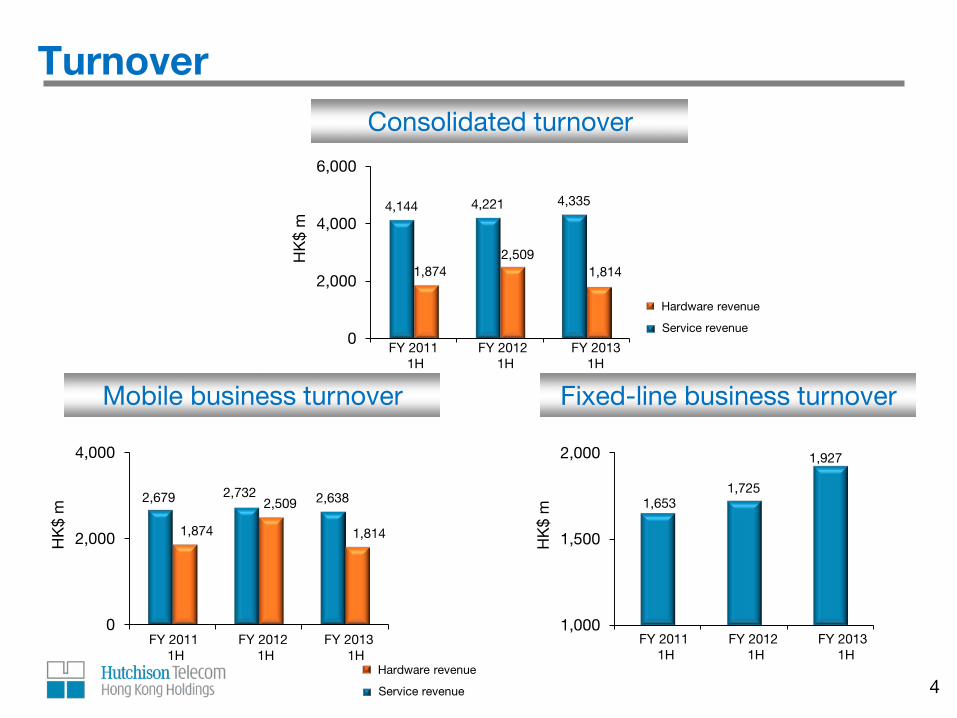
Turnover
1,630 1,653
Consolidated turnover
Mobile business turnover Fixed-line business turnover
4,144 4,221 4,335
1,874 2,509
1,814
0
2,000
4,000
6,000
FY 2011 1H FY 2012 1H FY 2013 1H
HK
$ m
2,679 2,732 2,638
1,874
2,509
1,814
0
2,000
4,000
FY 2011 1H FY 2012 1H FY 2013 1H
HK
$ m
Hardware revenue
Service revenue
1,000
1,500
2,000
FY 2011 1H FY 2012 1H FY2013 1H
HK
$ m
1,653 1,725
1,927
Hardware revenue
Service revenue
FY 2011 FY 2012 FY 2013 1H 1H 1H
FY 2011 FY 2012 FY 2013 1H 1H 1H
FY 2011 FY 2012 FY 2013 1H 1H 1H
4

Mobile
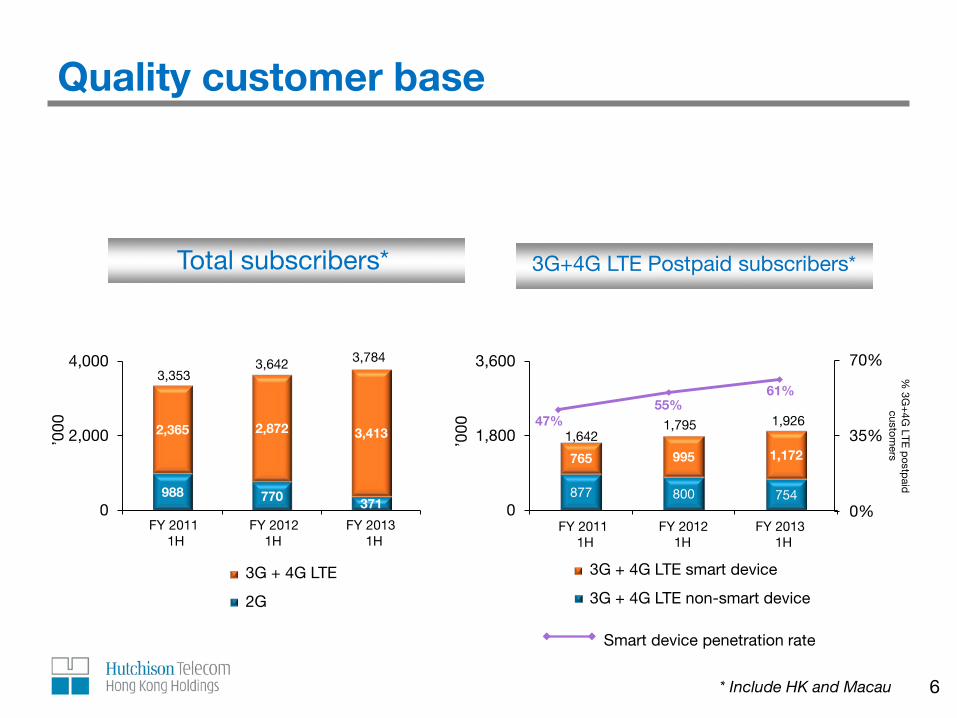
Quality customer base
2,014
* Include HK and Macau
3G + 4G LTE
2G
Total subscribers*
988 770 371
2,365 2,872 3,413
0
2,000
4,000
FY 2011 1H FY 2012 1H FY 2013 1H
’000
3,353 3,642 3,784
FY 2011 FY 2012 FY 2013 1H 1H 1H
6
47% 55%
61%
0%
35%
70%
% 3G
+4G
LTE p
ostpaid
custom
ers
877 800 754
765 995 1,172
0
1,800
3,600
FY 2011 1H FY 2012 1H FY 2013 1H
’000
1,642 1,795 1,926
3G+4G LTE Postpaid subscribers*
FY 2011 FY 2012 FY 2013 1H 1H 1H
Smart device penetration rate
3G + 4G LTE smart device
3G + 4G LTE non-smart device
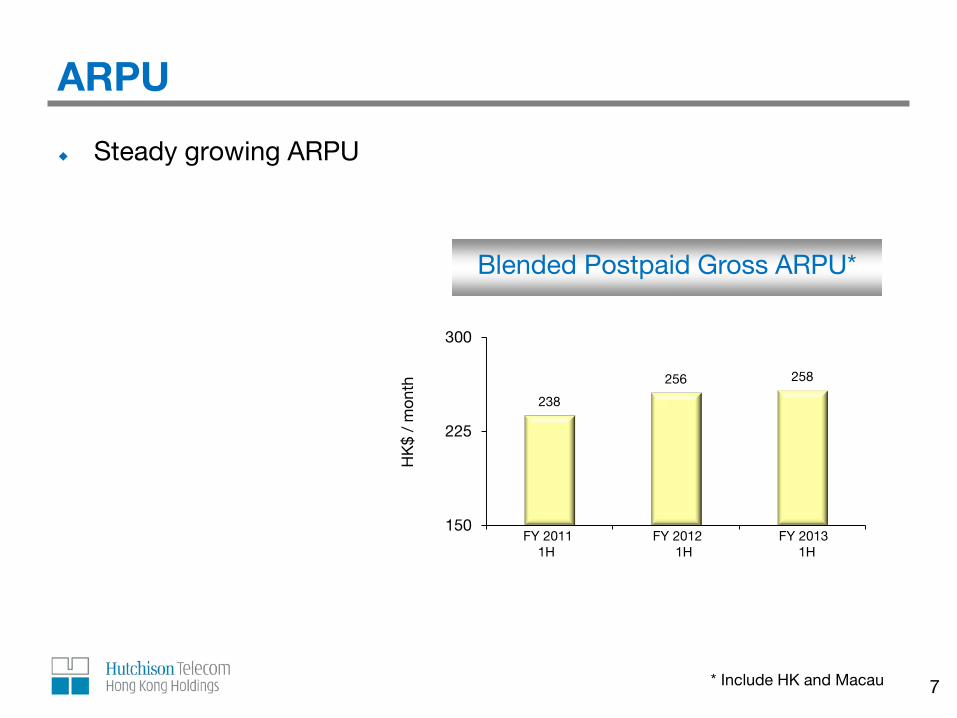
ARPU
* Include HK and Macau 7
Blended Postpaid Gross ARPU*
238
256 258
150
225
300
FY 2011 1H FY 2012 1H FY 2013 1H
HK
$ /
mon
th
FY 2011 FY 2012 FY 2013 1H 1H 1H
Steady growing ARPU
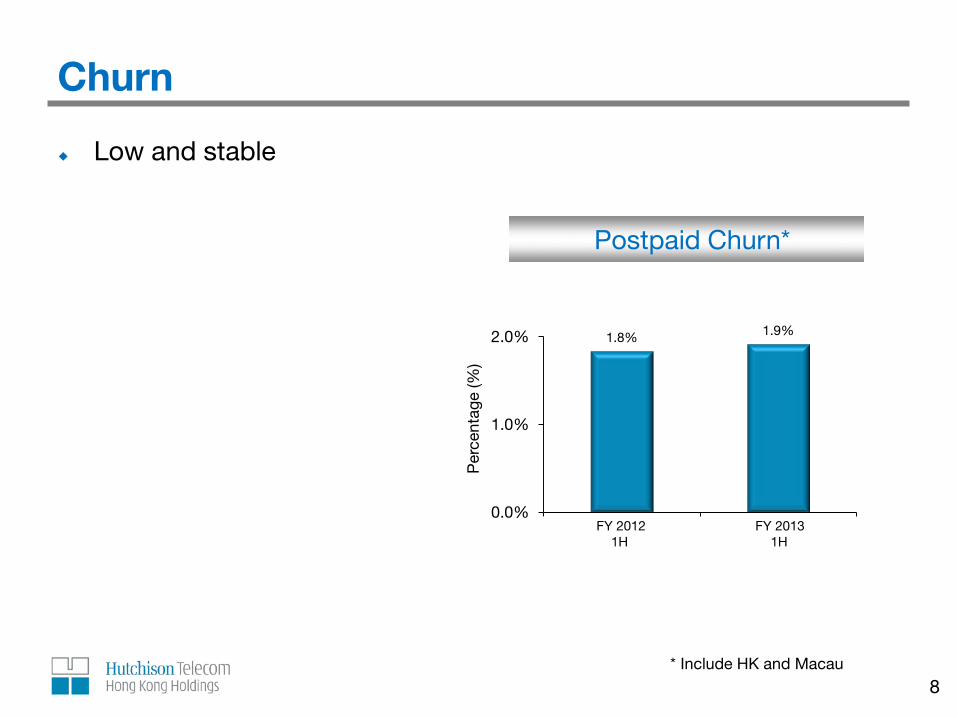
Churn
Low and stable
8 * Include HK and Macau
Postpaid Churn*
1.8% 1.9%
0.0%
1.0%
2.0%
FY 2012 1H FY 2013 1H
Per
cent
age
(%)
FY 2012 FY 2013 1H 1H
Fixed-line
10
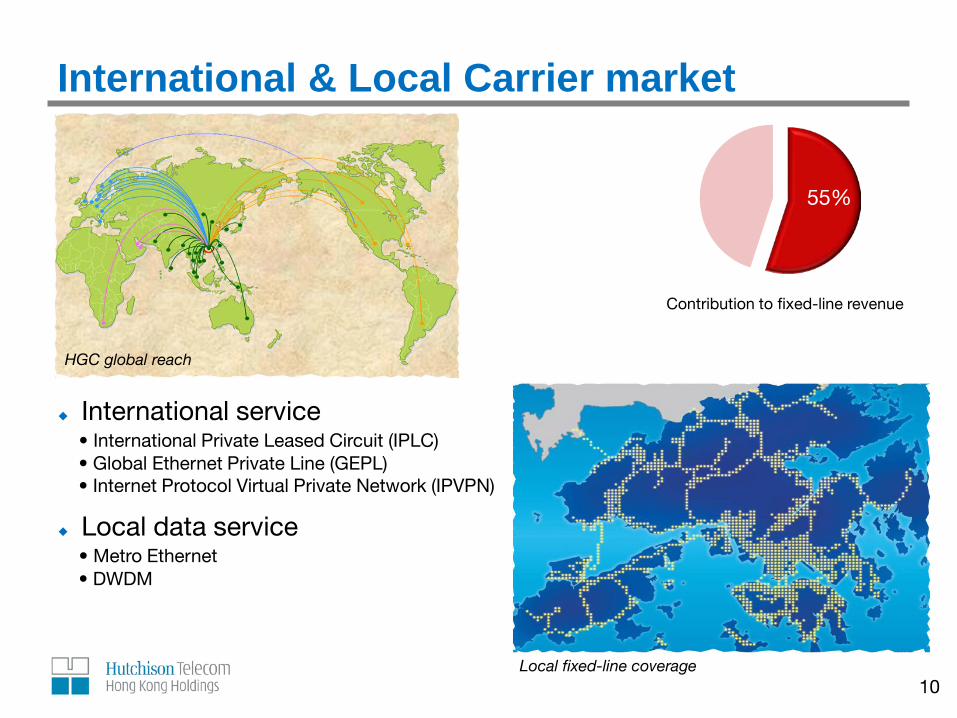
International & Local Carrier market
International service • International Private Leased Circuit (IPLC) • Global Ethernet Private Line (GEPL) • Internet Protocol Virtual Private Network (IPVPN)
Local data service • Metro Ethernet • DWDM
HGC global reach
Local fixed-line coverage
55%
Contribution to fixed-line revenue
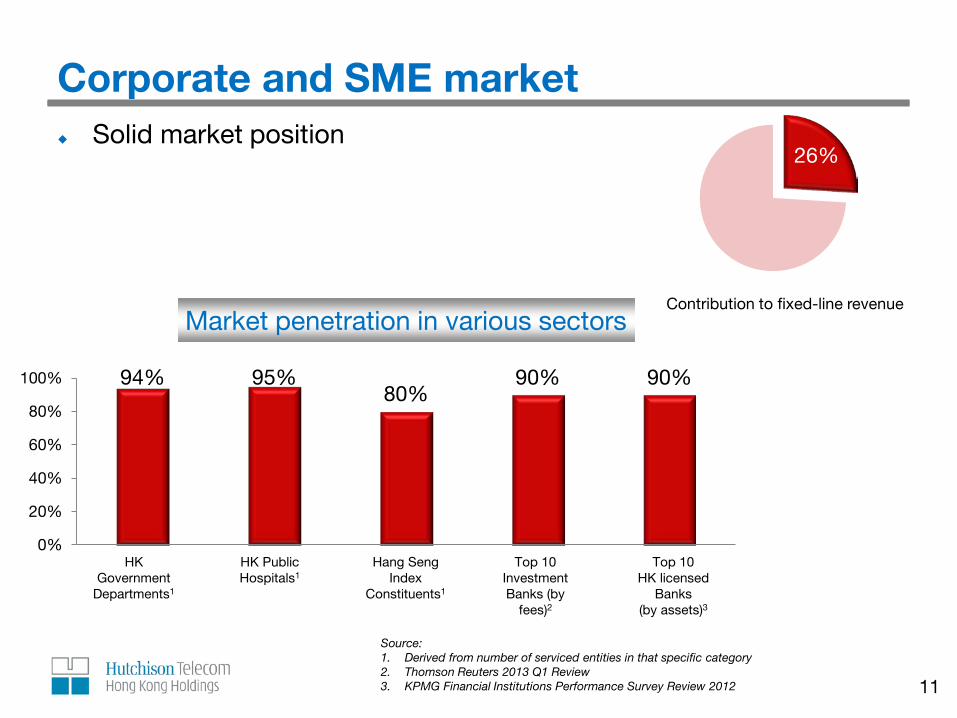
Corporate and SME market Solid market position
11
Market penetration in various sectors
94% 95% 80%
90% 90%
0%
20%
40%
60%
80%
100%
HK Government
Departments1
HK Public Hospitals1
Hang Seng Index
Constituents1
Top 10 Investment Banks (by
fees)2
Top 10 HK licensed
Banks (by assets)3
26%
Contribution to fixed-line revenue
Source: 1. Derived from number of serviced entities in that specific category 2. Thomson Reuters 2013 Q1 Review 3. KPMG Financial Institutions Performance Survey Review 2012
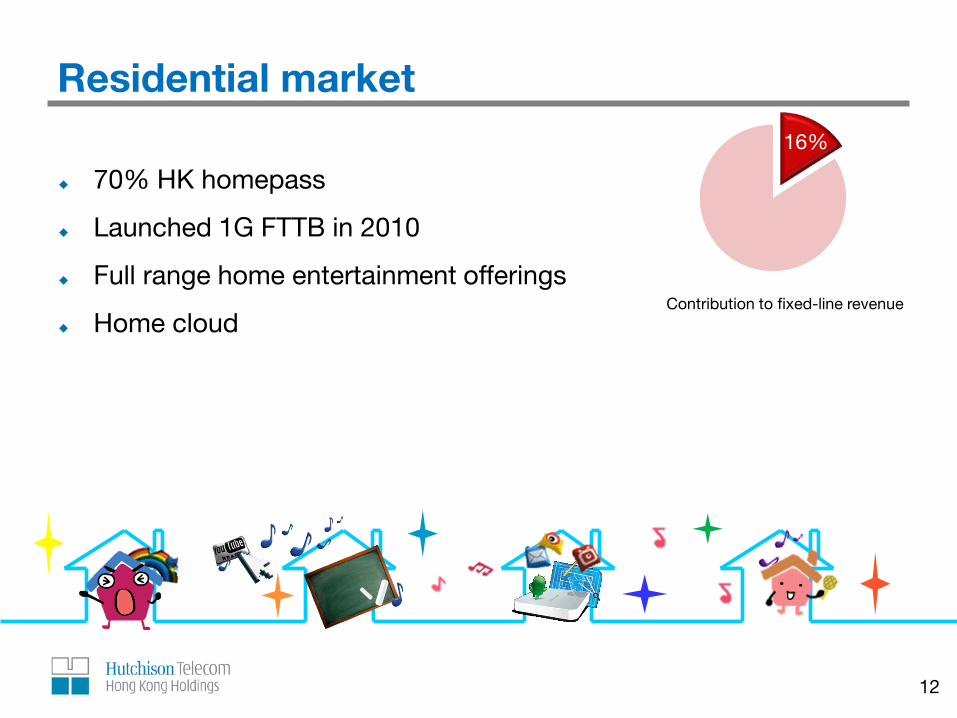
70% HK homepass
Launched 1G FTTB in 2010
Full range home entertainment offerings
Home cloud
12
Residential market 16%
Contribution to fixed-line revenue
Expertise in cloud computing
One-stop IT solution provider
Full range of cloud computing services
Collaboration with industry giants
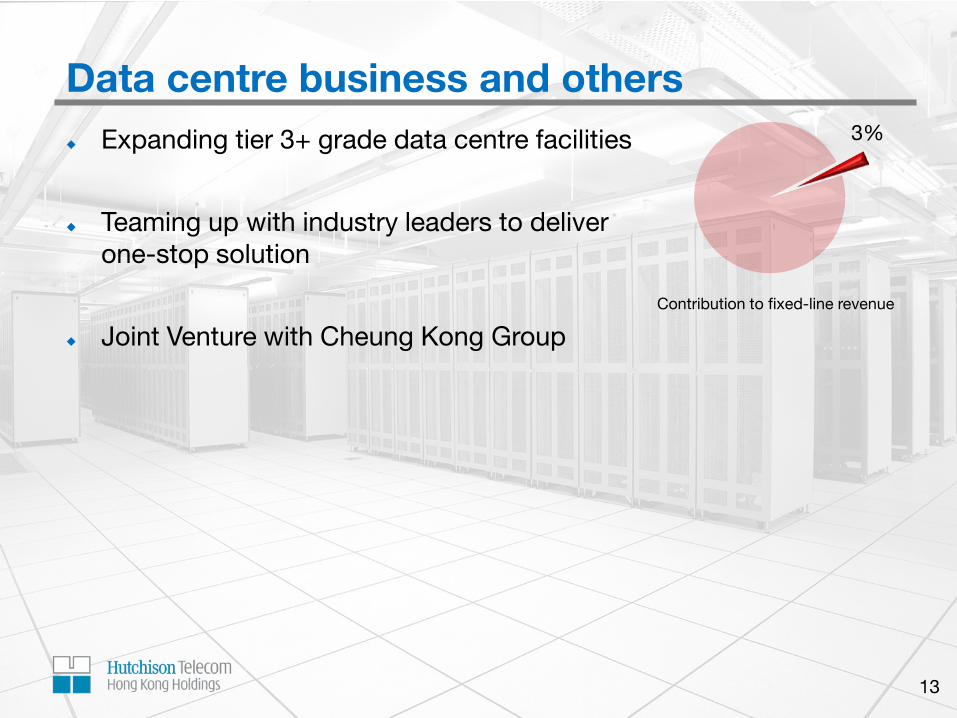
Expanding tier 3+ grade data centre facilities
Teaming up with industry leaders to deliver one-stop solution
Joint Venture with Cheung Kong Group
Data centre business and others
13
3%
Contribution to fixed-line revenue

Financial Overview
15
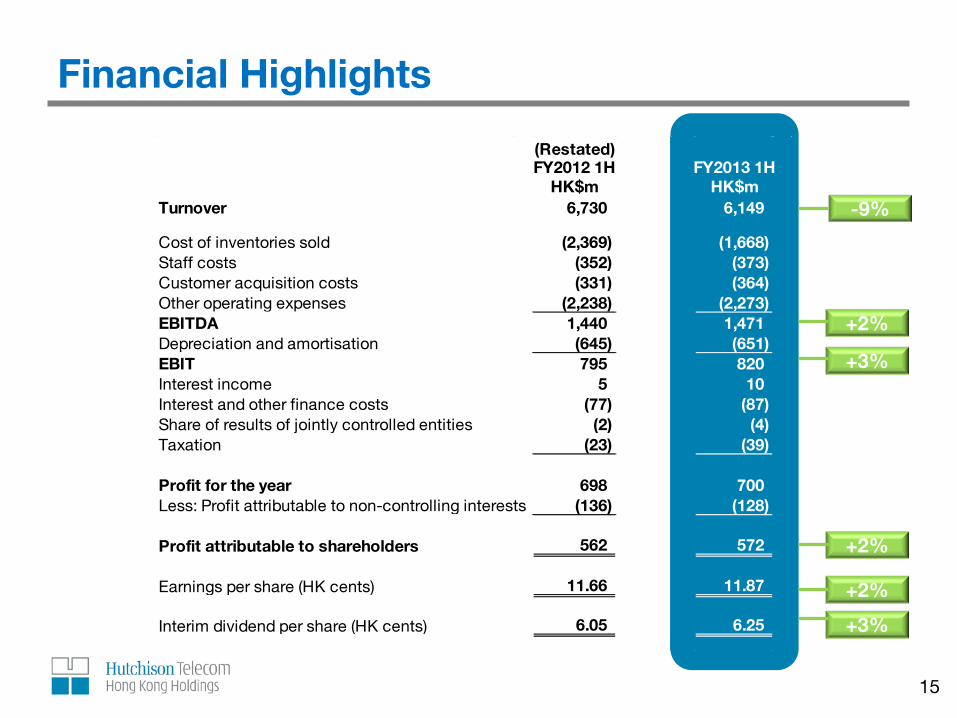
Financial Highlights
(Restated)FY2012 1H FY2013 1H
HK$m HK$mTurnover 6,730 6,149
Cost of inventories sold (2,369) (1,668) Staff costs (352) (373) Customer acquisition costs (331) (364) Other operating expenses (2,238) (2,273) EBITDA 1,440 1,471 Depreciation and amortisation (645) (651) EBIT 795 820 Interest income 5 10 Interest and other finance costs (77) (87) Share of results of jointly controlled entities (2) (4) Taxation (23) (39)
Profit for the year 698 700 Less: Profit attributable to non-controlling interests (136) (128)
Profit attributable to shareholders 562 572
Earnings per share (HK cents) 11.66 11.87
Interim dividend per share (HK cents) 6.05 6.25
-9%
+2%
+3%
+2%
+2%
+3%
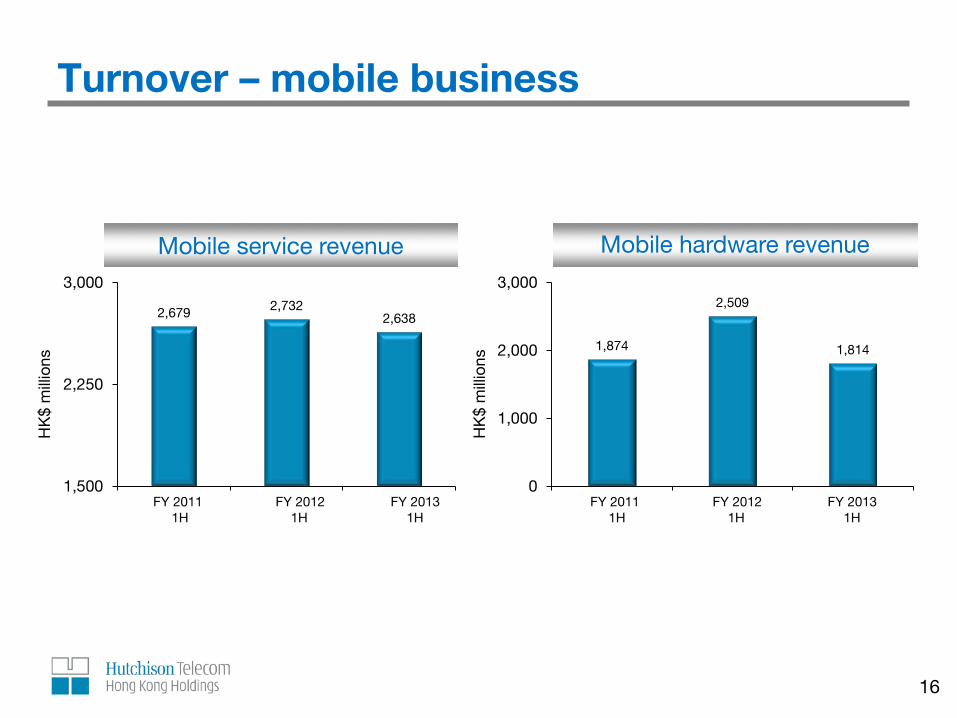
Turnover – mobile business
16
Mobile service revenue
2,679 2,732 2,638
1,500
2,250
3,000
FY 2011 1H FY 2012 1H FY 2013 1H
HK
$ m
illio
ns
FY 2011 FY 2012 FY 2013 1H 1H 1H
Mobile hardware revenue
1,874
2,509
1,814
0
1,000
2,000
3,000
FY 2011 1H FY 2012 1H FY 2013 1H
HK
$ m
illio
ns
FY 2011 FY 2012 FY 2013 1H 1H 1H
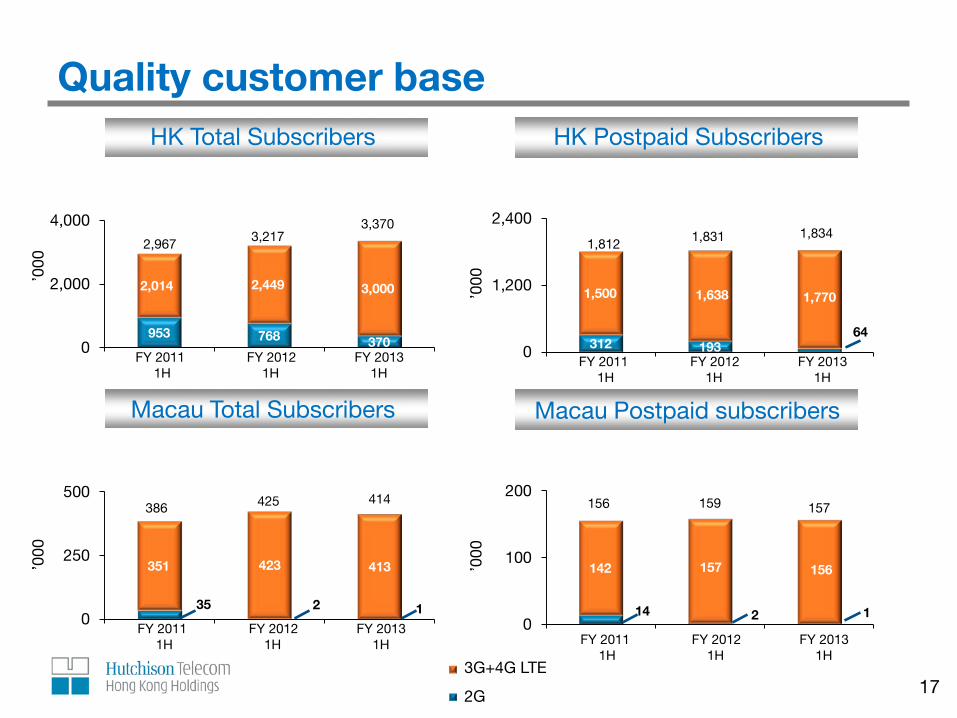
Quality customer base
17
1,519 1,761
2,014
All percentages represent compound annual growth rate
3G+4G LTE
2G
953 768 370
2,014 2,449 3,000
0
2,000
4,000
FY 2011 1H FY 2012 1H FY 2013 1H
’000
2,967 3,217 3,370
HK Total Subscribers
FY 2011 FY 2012 FY 2013 1H 1H 1H
312 193 64
1,500 1,638 1,770
0
1,200
2,400
FY 2011 1H FY 2012 1H FY 2013 1H
’000
1,812 1,831 1,834
HK Postpaid Subscribers
FY 2011 FY 2012 FY 2013 1H 1H 1H
35 2 1
351 423 413
0
250
500
FY 2011 1H FY 2012 1H FY 2013 1H
’000
386 425 414
Macau Total Subscribers
FY 2011 FY 2012 FY 2013 1H 1H 1H
14 2 1
142 157 156
0
100
200
FY 2011 1H FY 2012 1H FY 2013 1H
’000
156 159 157
Macau Postpaid subscribers
FY 2011 FY 2012 FY 2013 1H 1H 1H
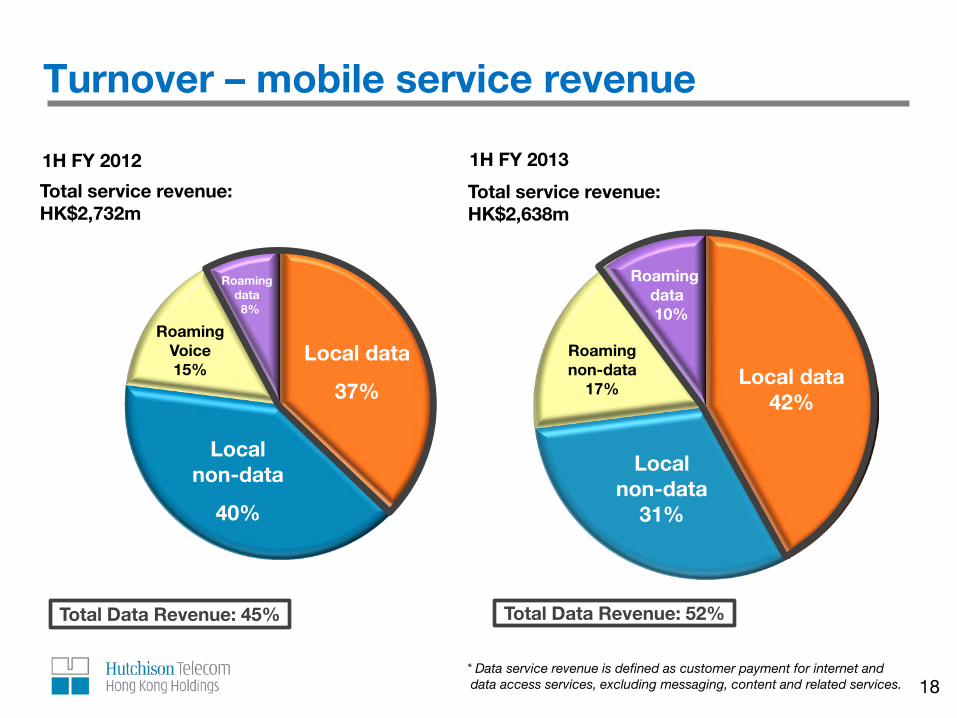
Turnover – mobile service revenue
1H FY 2012
Residential 20%
Total service revenue: HK$2,732m
Total service revenue: HK$2,638m
Local non-data
31%
Roaming non-data
17%
Roaming data
10%
Local data 42%
Total Data Revenue: 52%
Local non-data
40%
Local data
37%
Roaming Voice 15%
Total Data Revenue: 45%
Roaming data 8%
1H FY 2013
18 * Data service revenue is defined as customer payment for internet and data access services, excluding messaging, content and related services.
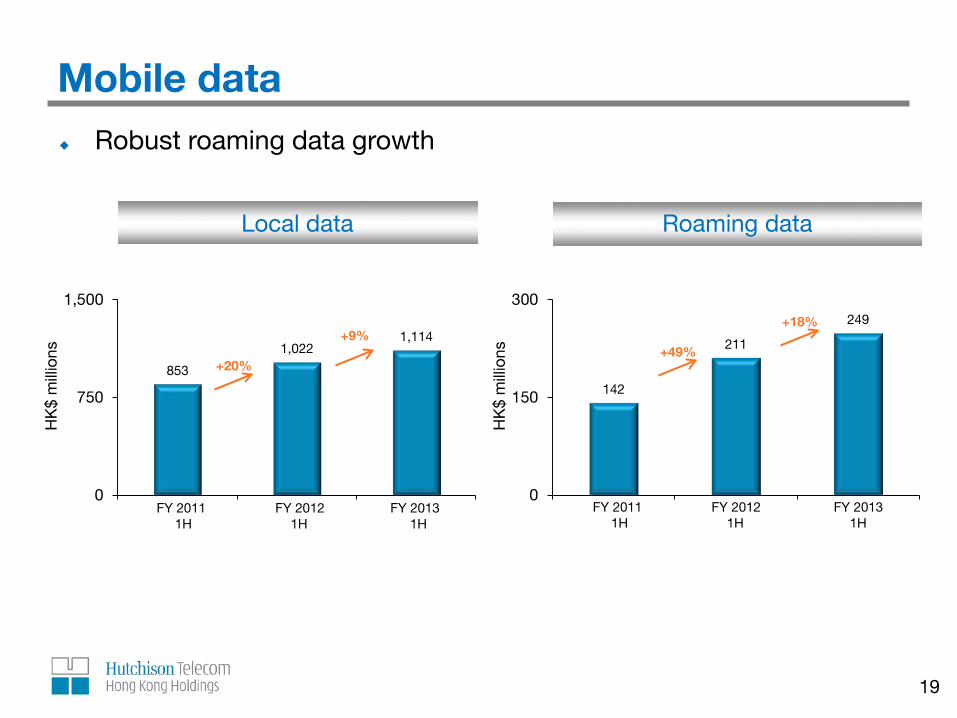
Mobile data
19
Robust roaming data growth
Roaming data
142
211
249
0
150
300
FY 2011 1H FY 2012 1H FY2013 1HH
K$
mill
ions
Local data
853
1,022 1,114
0
750
1,500
FY 2011 1H FY 2012 1H FY 2013 1H
HK
$ m
illio
ns
FY 2011 FY 2012 FY 2013 1H 1H 1H
FY 2011 FY 2012 FY 2013 1H 1H 1H
+20%
+9% +49%
+18%
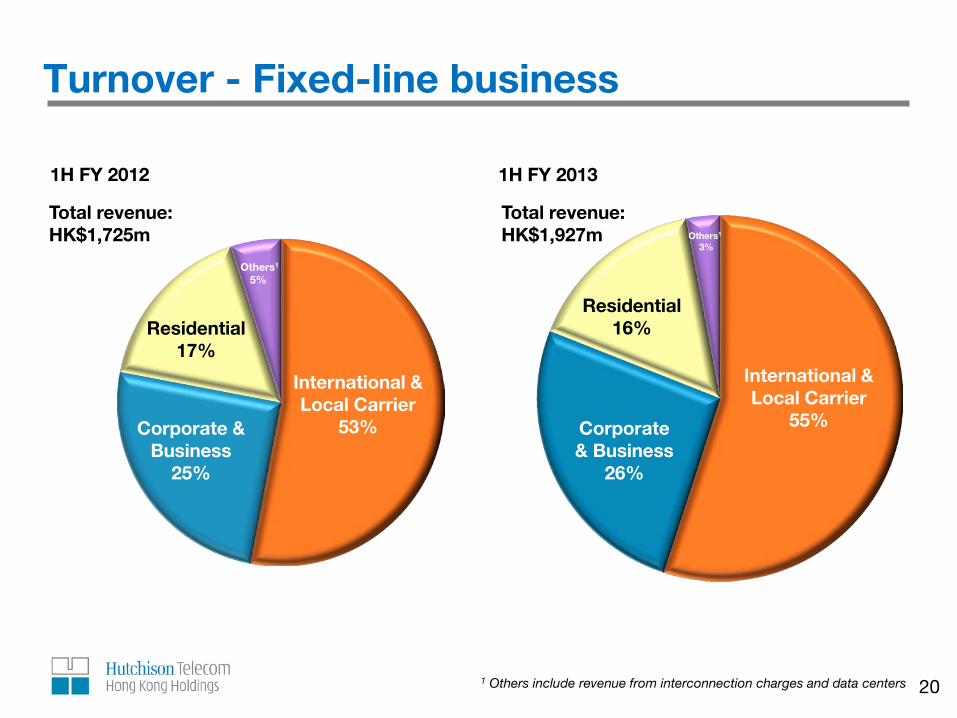
International & Local Carrier
55%
Others1 3%
Residential 16%
Corporate & Business
26%
International & Local Carrier
53%
Others1 5%
Residential 17%
Corporate & Business
25%
Turnover - Fixed-line business
20 1 Others include revenue from interconnection charges and data centers
1H FY 2012
Total revenue: HK$1,725m
Total revenue: HK$1,927m
1H FY 2013
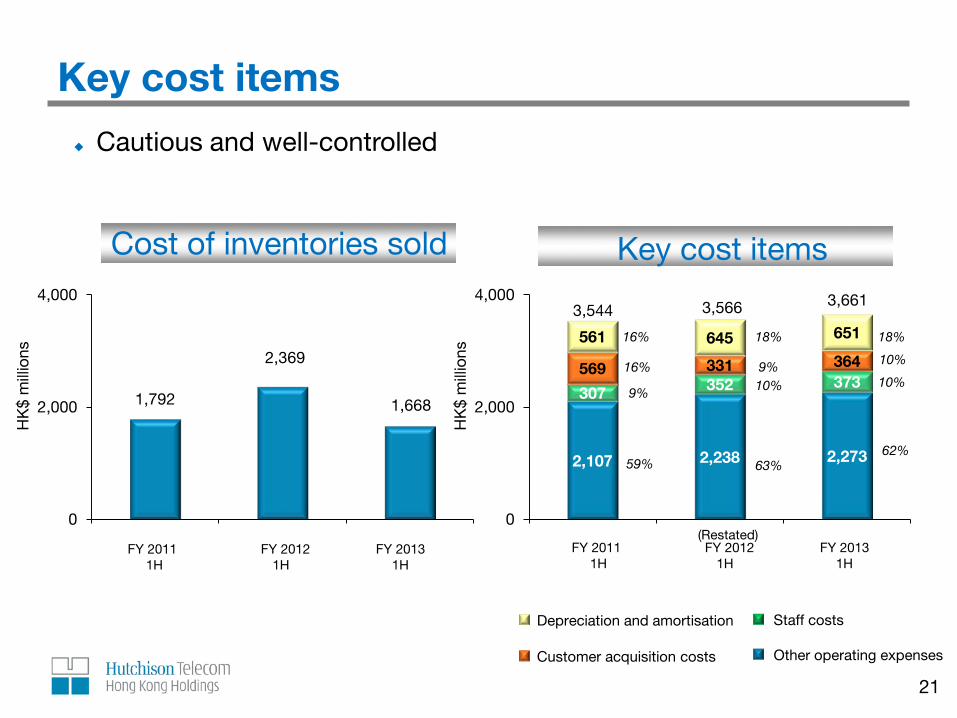
21
Key cost items
Cautious and well-controlled
65.0%
65.3% 64.9%
2,107 2,238 2,273
307 352 373 569 331 364
561 645 651
0
2,000
4,000
FY 2011 1H FY 2012 1H FY 2013 1H
HK
$ m
illio
ns
3,544 3,566 3,661
Key cost items
Customer acquisition costs
Staff costs
Other operating expenses
Depreciation and amortisation
1,792
2,369
1,668
0
2,000
4,000
FY 2011 1H FY 2012 1H FY 2013 1H
HK
$ m
illio
ns
Cost of inventories sold
16%
16%
9%
59%
18%
9% 10%
63%
FY 2011 FY 2012 FY 2013 1H 1H 1H
FY 2011 FY 2012 FY 2013 1H 1H 1H
18%
10%
10%
62%
(Restated)
Profitability
22
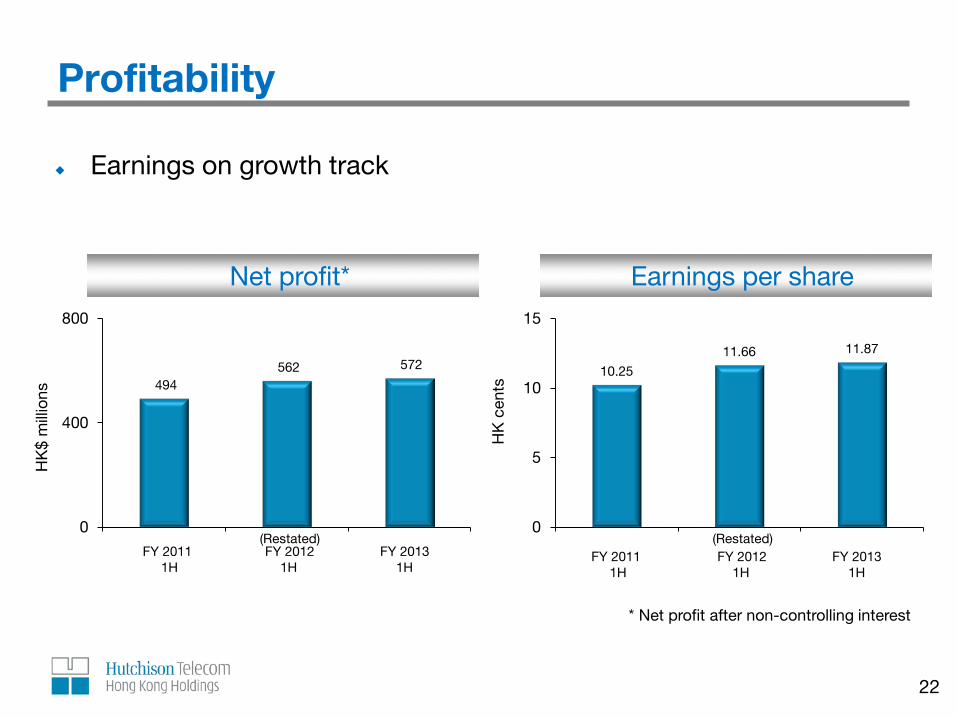
Earnings on growth track
494 562 572
0
400
800
FY 2011 1H FY 2012 1H FY 2013 1H
HK
$ m
illio
ns
Net profit*
10.25
11.66 11.87
0
5
10
15
FY 2011 1H FY 2012 1H FY 2013 1H
HK
cen
ts
Earnings per share
* Net profit after non-controlling interest
FY 2011 FY 2012 FY 2013 1H 1H 1H
FY 2011 FY 2012 FY 2013 1H 1H 1H
(Restated) (Restated)
Capex investment
1 Excluding revenue from sale of telecommunications hardware
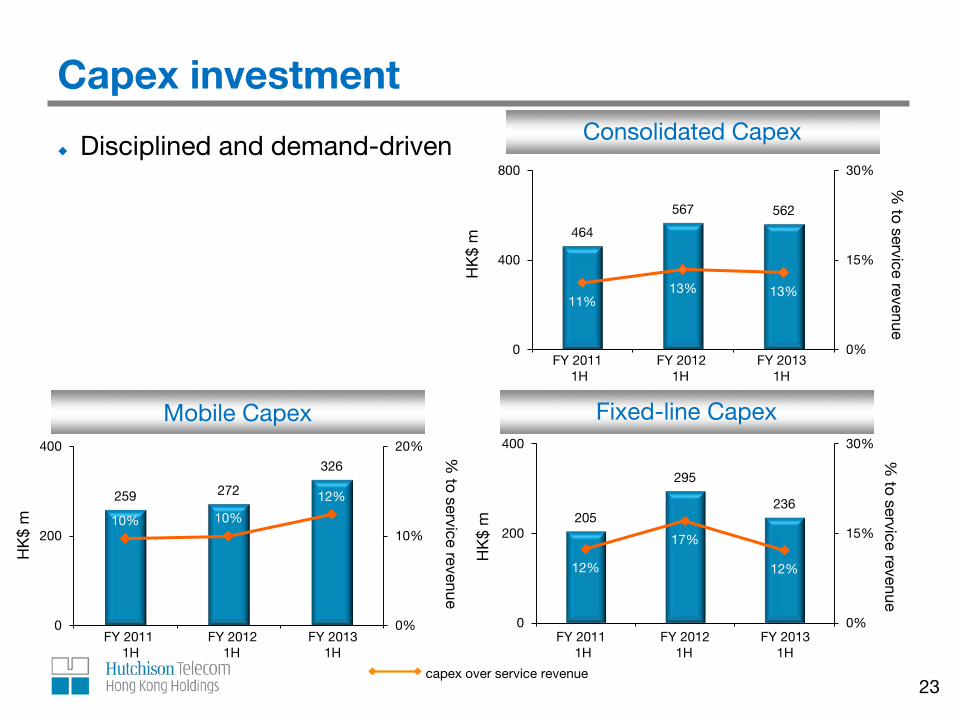
Mobile Capex
259 272
326
10% 10%
12%
0%
10%
20%
0
200
400
FY 2011 1H FY 2012 1H FY 2013 1H
% to service revenue
HK
$ m
15.5%
Disciplined and demand-driven
13.6%
Consolidated Capex
464
567 562
11% 13% 13%
0%
15%
30%
0
400
800
FY 2011 1H FY 2012 1H FY 2013 1H
% to service revenue
HK
$ m
Fixed-line Capex
205
295
236
12%
17%
12%
0%
15%
30%
0
200
400
FY 2011 1H FY 2012 1H FY 2013 1H
% to service revenue
HK
$ m
23
FY 2011 FY 2012 FY 2013 1H 1H 1H
FY 2011 FY 2012 FY 2013 1H 1H 1H
FY 2011 FY 2012 FY 2013 1H 1H 1H
capex over service revenue
Liquidity
24
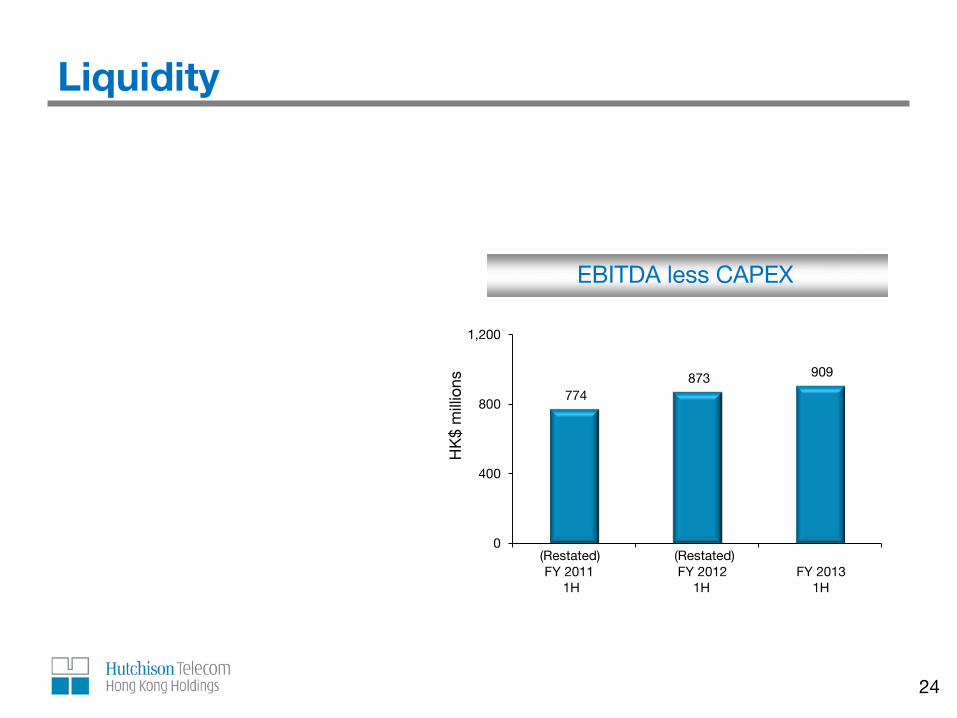
EBITDA less CAPEX
774 873 909
0
400
800
1,200
FY 2011 1H FY 2012 1H FY 2013 1H
HK
$ m
illio
ns
FY 2011 FY 2012 FY 2013 1H 1H 1H
(Restated) (Restated)
Strong financial position
25
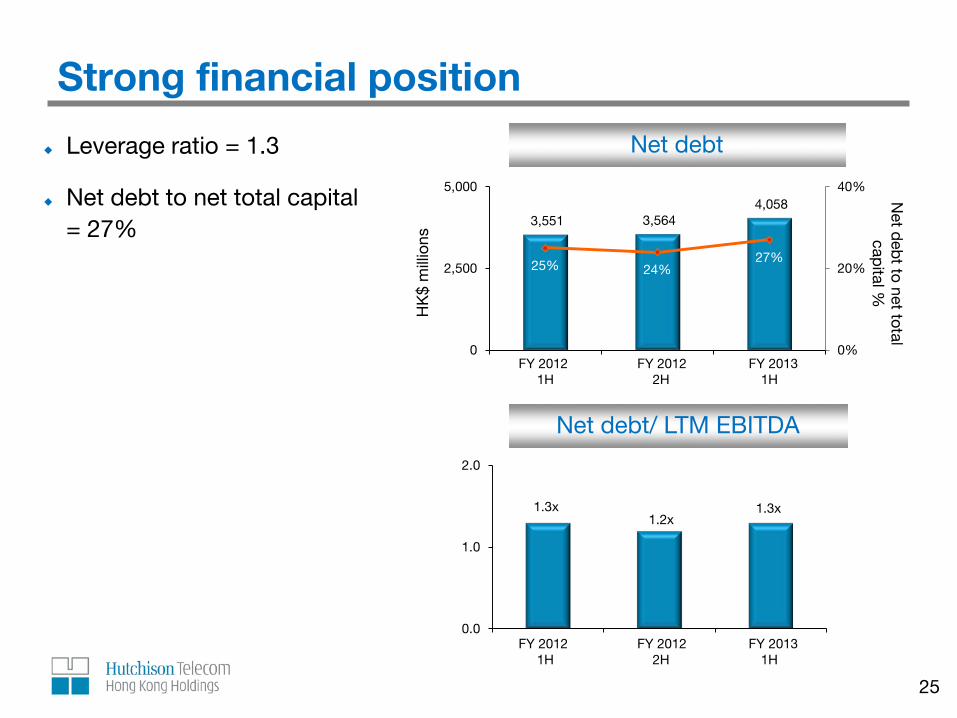
Leverage ratio = 1.3
Net debt to net total capital = 27%
Net debt
3,551 3,564 4,058
25% 24% 27%
0%
20%
40%
0
2,500
5,000
FY 2012 1H FY 2012 2H FY 2013 1H
Net d
ebt to net total
capital %
HK
$ m
illio
ns
Net debt/ LTM EBITDA
0.0
1.0
2.0
FY 2012 1H FY 2012 2H FY 2013 1H
1.3x 1.2x
1.3x
FY 2012 FY 2012 FY 2013 1H 2H 1H
FY 2012 FY 2012 FY 2013 1H 2H 1H
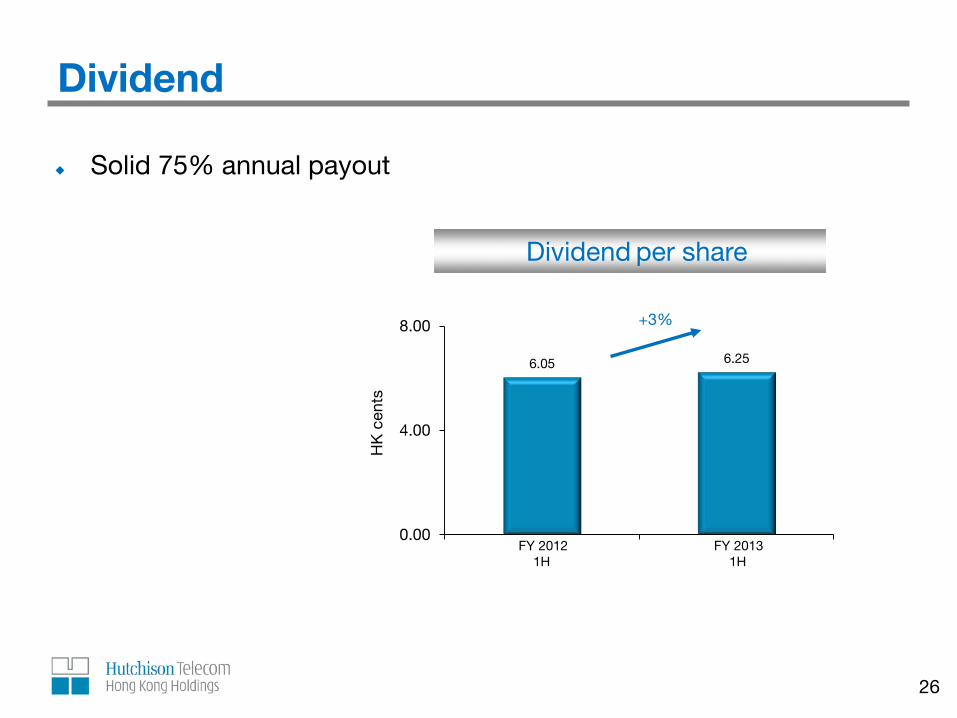
6.05 6.25
0.00
4.00
8.00
FY 2012 1H FY 2013 1H
HK
cen
ts
Dividend
26
Solid 75% annual payout Dividend per share
+3%
FY 2012 FY 2013 1H 1H

Forward
Outlook Group
Best positioned as an integrated operator in HK
Solid foundation to foster growth
Disciplined network investment
Increase returns for shareholders
Mobile
Embracing technology
Customer focus
Valued-added product development
Fixed-line
Further collaboration with overseas carriers and leading ICT players
Solution-based IT service provider
Full range residential multimedia offerings
28

Q & A

Thank You