Embed Size (px)
Citation preview
YEAR END REPORT 2019 Stockholm, February 4, 2020
Address Visiting address Telephone Reg. No. Web site NASDAQ OMX Stockholm Husqvarna AB (publ) Box 7454 SE-103 92 Stockholm Sweden
Regeringsgatan 28 +46 8 738 90 00 556000-5331 www.husqvarnagroup.com HUSQ A HUSQ B
Kai Wärn, President and CEO: “The seasonally small fourth quarter was characterized by a mixed market development. In Europe, sales developed positively, whereas in the US, sales were negatively impacted by trade partners continuing to reduce their inventories. In total, net sales decreased by 2% adjusted for currency effects and the exited Consumer Brands business. Operating income in the fourth quarter amounted to SEK -310m (-282), excluding items affecting comparability. The result was primarily impacted by significantly decreased manufacturing levels, which resulted in under absorption, as well as negative product mix effects. However, partly compensated by a net positive impact from an asset sale and write downs.
For the full-year 2019 Group net sales increased by 1%, adjusted for changes in exchange rates and the exited Consumer Brands business. Despite the challenging lawn and garden season during 2019, operating income increased by 21% or by SEK 674m to SEK 3,915m (3,241), representing an operating margin of 9.3% (7.9), excluding items affecting comparability. Direct operating cash flow improved to SEK 3,849m (1,336), driven by higher operating income and positive changes in working capital. The Board of Directors will propose a dividend for 2019 of SEK 2.25 (2.25) to the AGM.
Several important strategic steps were taken during 2019 supporting our journey of sustainable profitable growth. We presented an updated strategy building on a sharper focus on our end-customer segments and robotics and battery solutions, strengthening our winning core and growing our services and solutions business. We are proud to drive technology development exemplified by the introduction of the new Husqvarna EPOS technology to the market, providing robotic lawnmowing with virtual boundary technology.
For 2020, the top priority is to continue the trajectory towards sustainable profitable growth whilst finalizing exits of Consumer Brands business (SEK 2.2bn). We will drive strategic initiatives in all our divisions, enabled both through cost reductions from our efficiency measures and the restructuring activities announced in November 2019. The seasonal order situation and readiness are in line with the plans for the year. Based on the current status of information, we do not foresee any significant business disturbances related to the Corona virus outbreak, if component supply is normalized during next few weeks, whereas it might become material if they remain in March. In January, the Board of Directors appointed Henric Andersson as President and CEO, starting in April, 2020. I am pleased to hand over to Henric who has deep knowledge and experience of the business”.
Fourth quarter 2019
• Net sales decreased 1% to SEK 6,408m (6,470), or decreased 5% if adjusted for changes in exchange rates. Net sales decreased by 2% when adjusted for exit of Consumer Brands business and changes in exchange rates.
• Operating income amounted to SEK -493m (-1,104) including items affecting comparability related to the additional restructuring announced in November 2019 of SEK -183m (-822). Excluding items affecting comparability the operating income amounted to SEK -310m (-282), which includes a net positive impact, from the sale of an asset and asset write downs, of approximately SEK 100m.
• Earnings per share after dilution amounted to SEK -0.67 (-1.61).
January – December 2019
• Net sales amounted to SEK 42,277m (41,085), corresponding to a currency adjusted decrease of 2%. Net sales increased by 1% when adjusted for exit of Consumer Brands business and changes in exchange rates.
• Operating income amounted to SEK 3,690m (2,070) including items affecting comparability related to restructuring expenses of SEK -225m (-1,171). Excluding items affecting comparability the operating income amounted to SEK 3,915m (3,241), which includes a net positive impact, from the sale of an asset and asset write downs, of approximately SEK 60m (55).
• Earnings per share after dilution amounted to SEK 4.42 (2.12).
• Direct operating cash flow increased to SEK 3,849m (1,336).
• The Board of Directors will propose a dividend for 2019 of SEK 2.25 per share (2.25) to the AGM.
Group
SEKm
Net sales 6,408 6,470 -1 42,277 41,085 3
Currency adjusted change, % -5 0 - -2 2 -
Operating income -493 -1,104 55 3,690 2,070 78
Excl. items affecting comparability -310 -282 -10 3,915 3,241 21
Operating margin, % -7.7 -17.1 - 8.7 5.0 -
Excl. items affecting comparability -4.8 -4.4 - 9.3 7.9 -
Income for the period -387 -922 58 2,528 1,213 108
Earnings per share after dilution, SEK -0.67 -1.61 58 4.42 2.12 108
Net sales, Divisions
Husqvarna1
4,108 4,310 -5 27,506 27,156 1
Gardena1
710 746 -5 8,343 8,118 3
Construction 1,551 1,398 11 6,340 5,762 100 0 0
Operating income, Divisions
Husqvarna1
-225 -626 64 2,260 1,228 84
Excl. items affecting comparability1
-100 -77 -30 2,427 2,106 15
Gardena1
-348 -498 30 847 425 99
Excl. items affecting comparability1
-348 -274 -27 847 651 30
Construction 106 71 49 779 672 16
Excl. items affecting comparability 163 115 42 836 716 17
Q4
2018
Change,
%
Change,
%
1 Restatement of 2018 amounts due to allocation of the Consumer Brands Division, refer to "Distribution of the Consumer Brands Division".
Jan-Dec
2019
Jan-Dec
2018
Q4
2019

Husqvarna Group, Year-end Report 2019
2 (22)
FOURTH QUARTER
Net sales Net sales for the fourth quarter decreased by 1% to SEK 6,408m (6,470) or by 5% when adjusted for changes in exchange rates. Net sales decreased by 2% when adjusted for exit of Consumer Brands business and changes in exchange rates. The market development in Europe was favorable, with good growth for robotic lawn mowers and battery products, while the market was weak in the US, particularly for the wheeled segment, as trade partners continued to lower their inventories.
Operating income Operating income for the fourth quarter amounted to SEK -310m (-282), excluding items affecting comparability. The lower result was primarily related to significantly decreased manufacturing levels, which resulted in under absorption, as well as negative product mix effects. There was a net positive impact amounting to approximately SEK 100m resulting from the sale of an asset as well as some asset write downs. Changes in exchange rates contributed positively with approximately SEK 30m compared to last year, excluding items affecting comparability.
Financial items net Financial items net amounted to SEK -131m (-124).
Income after financial items Income after financial items amounted to SEK -624m (-1,228).
Taxes Income tax amounted to SEK 237m (306).
Earnings per share Income for the period attributable to equity holders of the Parent Company amounted to SEK -388m (-922), corresponding to SEK -0.67 (-1.61) per share after dilution.
JANUARY - DECEMBER
Net sales Net sales for January - December increased by 3% to SEK 42,277m (41,085) or decreased by 2% if adjusted for changes in exchange rates. Net sales increased by 1% when adjusted for exit of Consumer Brands business and changes in exchange rates.
Operating income Operating income for January - December increased by 21% to SEK 3,915m (3,241), excluding items affecting comparability, and the corresponding margin was 9.3% (7.9). The higher result was primarily related to price increases, restructuring and efficiency savings and was partly offset by continued investments in strategic growth initiatives as well as higher costs related to trade tariffs. There was a net positive impact, resulting from the sale of an asset as well as some asset write downs, amounting to approximately SEK 60m (55). Changes in exchange rates contributed positively with approximately SEK 350m compared to last year, excluding items affecting comparability.
Financial items net Financial items net amounted to SEK -568m (-509).
Income after financial items Income after financial items increased to SEK 3,122m (1,561).
Taxes Income tax amounted to SEK -594m (-348) corresponding to a tax rate of 19% (22).
Earnings per share Income for the period attributable to equity holders of the Parent Company increased to SEK 2,527m (1,212), corresponding to SEK 4.42 (2.12) per share after dilution.
Husqvarna Group, Year-end Report 2019
3 (22)
OPERATING CASH FLOW Operating cash flow for January - December increased to SEK 2,676m (-248) and direct operating cash flow increased to SEK 3,849m (1,336). The increase was related to higher operating income and positive effects from changes in inventories and trade receivables and was partly offset by changes in payables. Due to the seasonal build-up of working capital, operating cash flow is normally negative in the first quarter, followed by positive cash flow in the second and third quarters, while cash flow in the fourth quarter is negatively impacted by the pre-season production for the next year.
FINANCIAL POSITION Group equity as of December 31, 2019, excluding non-controlling interests, increased to SEK 17,281m (16,007), corresponding to SEK 30.2 (28.0) per share after dilution. Net debt increased to SEK 11,315m (9,875). The increase is mainly due to an increase in lease liabilities (other interest-bearing liabilities) of approximately SEK 1,500m as a result of the adoption of IFRS 16. For further information on the adoption of IFRS 16 refer to “New standards applicable from January 1, 2019”. The net pension liability increased to SEK 2,427m (1,943) other interest-bearing liabilities increased to SEK 11,786m (10,013), liquid funds and other interest-bearing assets increased to SEK 2,898m (2,081). The net debt/EBITDA ratio, excluding items affecting comparability, increased to 1.9 (1.8). See definition on page 21. The equity/assets ratio was 41% (41).
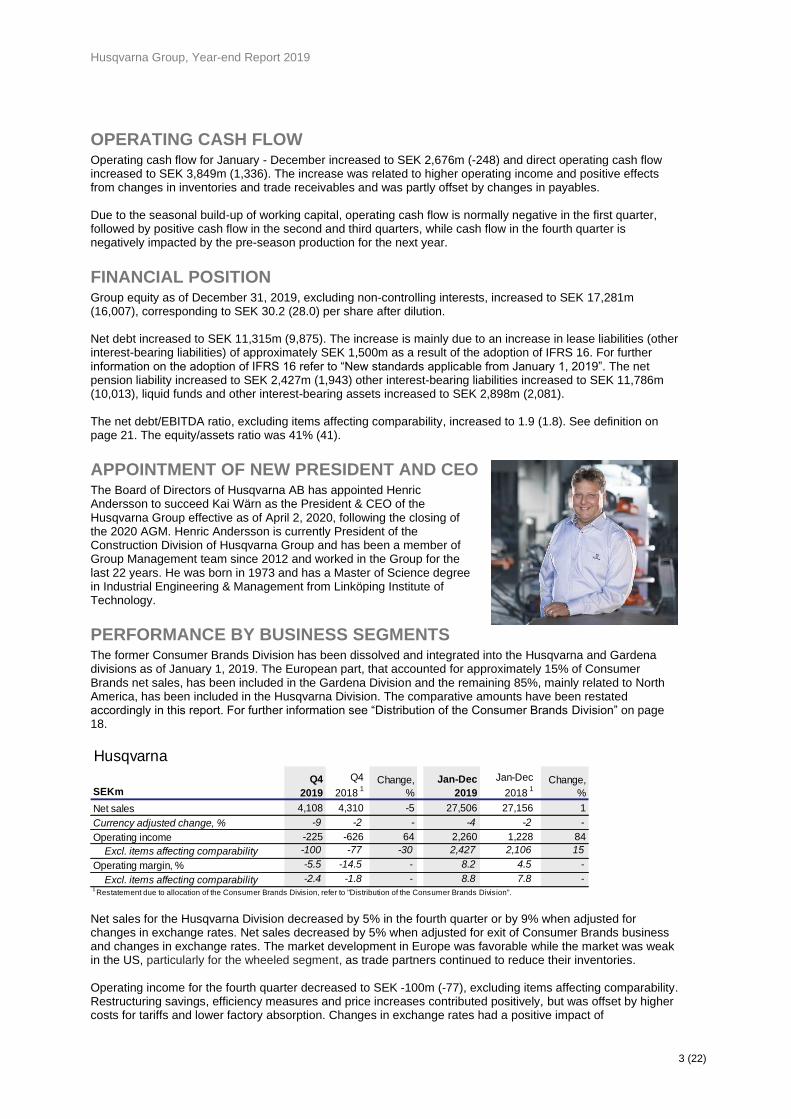
APPOINTMENT OF NEW PRESIDENT AND CEO The Board of Directors of Husqvarna AB has appointed Henric Andersson to succeed Kai Wärn as the President & CEO of the Husqvarna Group effective as of April 2, 2020, following the closing of the 2020 AGM. Henric Andersson is currently President of the Construction Division of Husqvarna Group and has been a member of Group Management team since 2012 and worked in the Group for the last 22 years. He was born in 1973 and has a Master of Science degree in Industrial Engineering & Management from Linköping Institute of Technology.
PERFORMANCE BY BUSINESS SEGMENTS The former Consumer Brands Division has been dissolved and integrated into the Husqvarna and Gardena divisions as of January 1, 2019. The European part, that accounted for approximately 15% of Consumer Brands net sales, has been included in the Gardena Division and the remaining 85%, mainly related to North America, has been included in the Husqvarna Division. The comparative amounts have been restated accordingly in this report. For further information see “Distribution of the Consumer Brands Division” on page 18.
Husqvarna
SEKm
Net sales 4,108 4,310 -5 27,506 27,156 1
Currency adjusted change, % -9 -2 - -4 -2 -
Operating income -225 -626 64 2,260 1,228 84
Excl. items affecting comparability -100 -77 -30 2,427 2,106 15
Operating margin, % -5.5 -14.5 - 8.2 4.5 -
Excl. items affecting comparability -2.4 -1.8 - 8.8 7.8 -
Jan-Dec
2018 1
Change,
%
1 Restatement due to allocation of the Consumer Brands Division, refer to "Distribution of the Consumer Brands Division".
Q4
2018 1
Change,
%
Jan-Dec
2019
Q4
2019
Net sales for the Husqvarna Division decreased by 5% in the fourth quarter or by 9% when adjusted for changes in exchange rates. Net sales decreased by 5% when adjusted for exit of Consumer Brands business and changes in exchange rates. The market development in Europe was favorable while the market was weak in the US, particularly for the wheeled segment, as trade partners continued to reduce their inventories. Operating income for the fourth quarter decreased to SEK -100m (-77), excluding items affecting comparability. Restructuring savings, efficiency measures and price increases contributed positively, but was offset by higher costs for tariffs and lower factory absorption. Changes in exchange rates had a positive impact of
Husqvarna Group, Year-end Report 2019
4 (22)
approximately SEK 20m on operating income in the fourth quarter compared to last year, excluding items affecting comparability.
Gardena
SEKm
Net sales 710 746 -5 8,343 8,118 3
Currency adjusted change, % -8 -2 - 0 8 -
Operating income -348 -498 30 847 425 99
Excl. items affecting comparability -348 -274 -27 847 651 30
Operating margin, % -49.0 -66.8 - 10.2 5.2 -
Excl. items affecting comparability -49.0 -36.7 - 10.2 8.0 -1 Restatement due to allocation of the Consumer Brands Division, refer to "Distribution of the Consumer Brands Division".
Change,
%
Jan-Dec
2018 1
Jan-Dec
2019
Q4
2019
Q4
2018 1
Change,
%
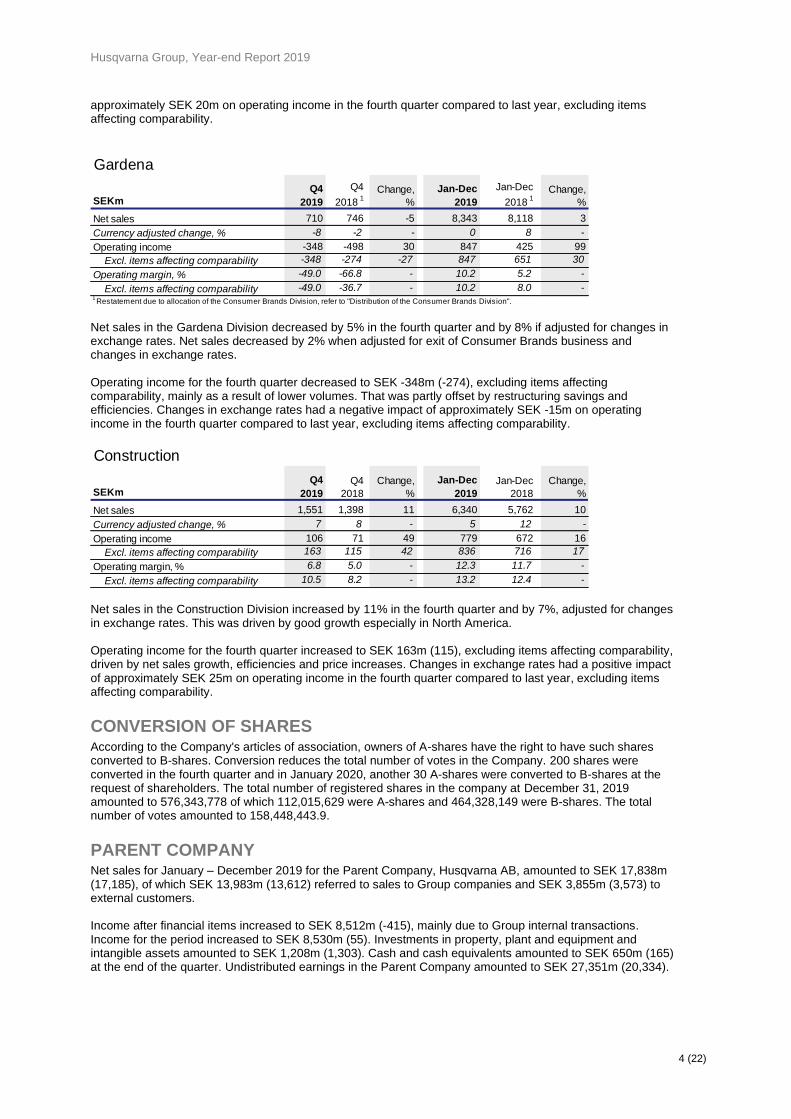
Net sales in the Gardena Division decreased by 5% in the fourth quarter and by 8% if adjusted for changes in exchange rates. Net sales decreased by 2% when adjusted for exit of Consumer Brands business and changes in exchange rates. Operating income for the fourth quarter decreased to SEK -348m (-274), excluding items affecting comparability, mainly as a result of lower volumes. That was partly offset by restructuring savings and efficiencies. Changes in exchange rates had a negative impact of approximately SEK -15m on operating income in the fourth quarter compared to last year, excluding items affecting comparability.
Construction
SEKm
Net sales 1,551 1,398 11 6,340 5,762 10
Currency adjusted change, % 7 8 - 5 12 -
Operating income 106 71 49 779 672 16
Excl. items affecting comparability 163 115 42 836 716 17
Operating margin, % 6.8 5.0 - 12.3 11.7 -
Excl. items affecting comparability 10.5 8.2 - 13.2 12.4 -
Jan-Dec
2018
Change,
%
Q4
2019
Q4
2018
Change,
%
Jan-Dec
2019
Net sales in the Construction Division increased by 11% in the fourth quarter and by 7%, adjusted for changes in exchange rates. This was driven by good growth especially in North America. Operating income for the fourth quarter increased to SEK 163m (115), excluding items affecting comparability, driven by net sales growth, efficiencies and price increases. Changes in exchange rates had a positive impact of approximately SEK 25m on operating income in the fourth quarter compared to last year, excluding items affecting comparability.
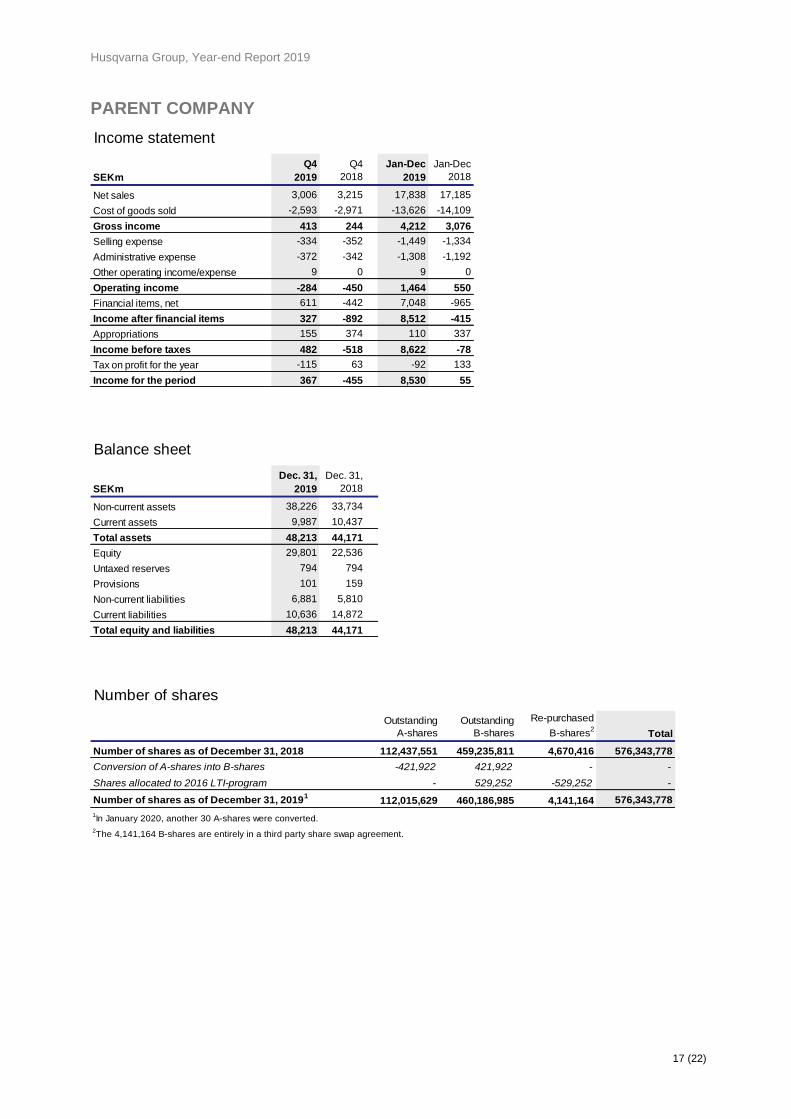
CONVERSION OF SHARES According to the Company's articles of association, owners of A-shares have the right to have such shares converted to B-shares. Conversion reduces the total number of votes in the Company. 200 shares were converted in the fourth quarter and in January 2020, another 30 A-shares were converted to B-shares at the request of shareholders. The total number of registered shares in the company at December 31, 2019 amounted to 576,343,778 of which 112,015,629 were A-shares and 464,328,149 were B-shares. The total number of votes amounted to 158,448,443.9.
PARENT COMPANY Net sales for January – December 2019 for the Parent Company, Husqvarna AB, amounted to SEK 17,838m (17,185), of which SEK 13,983m (13,612) referred to sales to Group companies and SEK 3,855m (3,573) to external customers. Income after financial items increased to SEK 8,512m (-415), mainly due to Group internal transactions. Income for the period increased to SEK 8,530m (55). Investments in property, plant and equipment and intangible assets amounted to SEK 1,208m (1,303). Cash and cash equivalents amounted to SEK 650m (165) at the end of the quarter. Undistributed earnings in the Parent Company amounted to SEK 27,351m (20,334).

Husqvarna Group, Year-end Report 2019
5 (22)
RESTRUCTURING OF THE CONSUMER BRANDS DIVISION As communicated in press releases in 2018, Husqvarna Group is exiting certain low-margin petrol-powered product segments in the underperforming former Consumer Brands Division and instead focusing on its strengths in premium offerings under the core brands of Husqvarna and Gardena. Restructuring measures were implemented 2018-2019 with a total cost of some SEK 1.2 billion before tax, of which some SEK 400m refers to cash items. In 2018, and in the first quarter of 2019 a total of SEK 1,171m and SEK 42m respectively was reported as restructuring related expenses and charged to the Group’s income statement. The restructuring measures has resulted in annual savings of around SEK 250m with full effect from 2020. The lower business volume will also reduce the net working capital need in the Group by up to SEK 1 billion over the coming years. In 2019 the Group exited net sales of SEK 1.4 billion.
ADDITIONAL RESTRUCTURING INITIATIVES In November 2019 additional efficiency initiatives were launched. The initiatives are expected to deliver annual cost savings of SEK 150m, of which the majority will be realized in 2020 and the remainder in 2021. Restructuring costs for the initiatives are expected to amount to about SEK 200m, whereof SEK 183m were charged to the result in the fourth quarter of 2019. In 2020, the group plan to exit about SEK 2.2 billion of low gross margin business that previously was within the Consumer Brands Division.
FINANCIAL TARGETS PRESENTED AT CAPITAL MARKETS DAY A Capital Markets Day was held on September 17, 2019. Financial targets was presented and as from 2020 the Group’s three financial targets are:
• Annual net sales growth of 4-5%, defined as 2 percentage points above market growth (historically 2-3%).
• An operating margin above 10%.
• Operating working capital in relation to net sales of a maximum of 25%.
GROUP MANAGEMENT CHANGES Pavel Hajman, Senior Vice President Operations Development, assumed the additional role as CIO (Chief Information Officer) effective October 11, 2019. Pavel Hajman replaces Hillevi Agranius, who left Husqvarna Group on October 11 for an external opportunity.
ACQUISITION OF POWER TROWEL BUSINESS Husqvarna Group’s Construction Division has acquired the Concrete Power Trowel business from Wacker Neuson Group. The acquisition included all the product, R&D and manufacturing assets relating to walk-behind and ride-on concrete power trowels. Sales in the power trowel segment (acquired assets) in 2018 amounted to about SEK 150m.
2020 ANNUAL GENERAL MEETING The AGM of Husqvarna AB (publ) will be held in Jönköping, Sweden on April 2, 2020.
Proposals to the AGM The notification to the AGM 2020 will be available on the Group’s website as of February 28, 2020. The full proposal to the AGM will be published on the Group's website no later than March 12, 2020.
Shareholders who wish to propose an item for the AGM agenda may do so by email to [email protected], or by post to Husqvarna AB, General Counsel, PO Box 7454, SE-103 92 Stockholm, no later than February 13, 2020.
SUBSEQUENT EVENTS
Dividend The Board of Directors will propose a dividend for 2019 of SEK 2.25 (2.25) per share to the AGM, corresponding to a total dividend payment of SEK 1,287m (1,286) based on the number of outstanding shares at the end of 2019.
Husqvarna Group, Year-end Report 2019
6 (22)
It is also proposed that the dividend is to be paid in two installments in order to better match the Group's cash flow profile. The first payment of SEK 0.75 per share in April and the second payment of SEK 1.50 per share in October. The proposed record dates are April 6, 2020 for the first payment and October 6, 2020, for the second payment.
RISKS AND UNCERTAINTY FACTORS A number of factors may affect Husqvarna Group’s operations in terms of operational and financial risks. Operational risks include general economic conditions, as well as trends in consumer and professional spending, particularly in North America and Europe, where the majority of the Group’s products are sold. An economic downturn in these markets may have an adverse effect on Group sales and earnings. Shifts in product technology as well as shifts in distribution structure and sales channels could also have a negative impact, as will fluctuations in prices of sourced raw materials and components.
Short term, demand for the Group’s products is impacted by weather conditions. The Group’s production processes and supply chain are therefore adapted to respond to changes in weather conditions. In the ordinary course of business, the Group is exposed to legal risks such as commercial, product liability and other disputes and provides for them as appropriate.
Husqvarna Group has operations, both sales and production, in the UK and thus can be impacted by the Brexit. The Group has performed an analysis and initiated mitigation activities in order to minimize any potential impact.
Financial risks refer primarily to currency exchange rates, interest rates, financing, tax and credit risks. Risk management within Husqvarna Group is regulated by a financial policy established by the Board of Directors.
For further information on risks and uncertainty factors, see the Annual Report 2018 which is available at www.husqvarnagroup.com/ir.
ACCOUNTING PRINCIPLES This interim report has been prepared in accordance with IAS 34, Interim financial reporting and the Swedish Annual Accounts Act. The financial statement of the Parent Company has been prepared in accordance with the Swedish Annual Accounts Act, chapter 9 and the Swedish Financial Reporting Board’s standard RFR 2 Accounting for Legal Entities. The accounting policies adopted are consistent with those presented in the Annual Report of 2018, which is available at www.husqvarnagroup.com/ir.
New standards applicable from January 1, 2019 Husqvarna Group applies IFRS 16 “Leases” from January 1, 2019. IFRS 16 replaces IAS 17 “Leases”. The new standard results in most leases being recognized in the balance sheet, as the distinction between operating and finance leases is removed. Under the new standard, an asset (the right to use the leased asset) and a financial liability (the obligation to make lease payments) will be recognized, with exceptions for short-term leases and low-value assets. The standard affects the accounting for the Group’s operating leases (mainly buildings, cars and forklifts). For further information of the impact of IFRS 16, refer to “New standards applicable from January 1, 2019”. Husqvarna Group applies IFRIC 23 “Uncertainty over income tax treatments” from January 1, 2019. IFRIC 23 is a new interpretation of uncertain income tax treatments within the scope of IAS 12 “Income taxes”. IFRIC 23 clarifies how to recognize and measure deferred and current income tax assets and liabilities where there is uncertainty over a tax treatment. Uncertain tax liabilities that has previously been recognized as deferred tax liabilities has been reclassified to current tax liabilities as at January 1, 2019 as a result of the adoption of IFRIC 23. For further information of the impact of IFRIC 23, refer to “New standards applicable from January 1, 2019”.
AUDITORS’ REVIEW REPORT This year-end report has not been subject to review by the auditors. Stockholm, February 4, 2020 Kai Wärn President and CEO
Husqvarna Group, Year-end Report 2019
7 (22)
Consolidated income statement
SEKm
Q4
2019
Q4
2018
Jan-Dec
2019
Jan-Dec
2018
Net sales 6,408 6,470 42,277 41,085
Cost of goods sold -4,976 -5,555 -29,748 -30,583
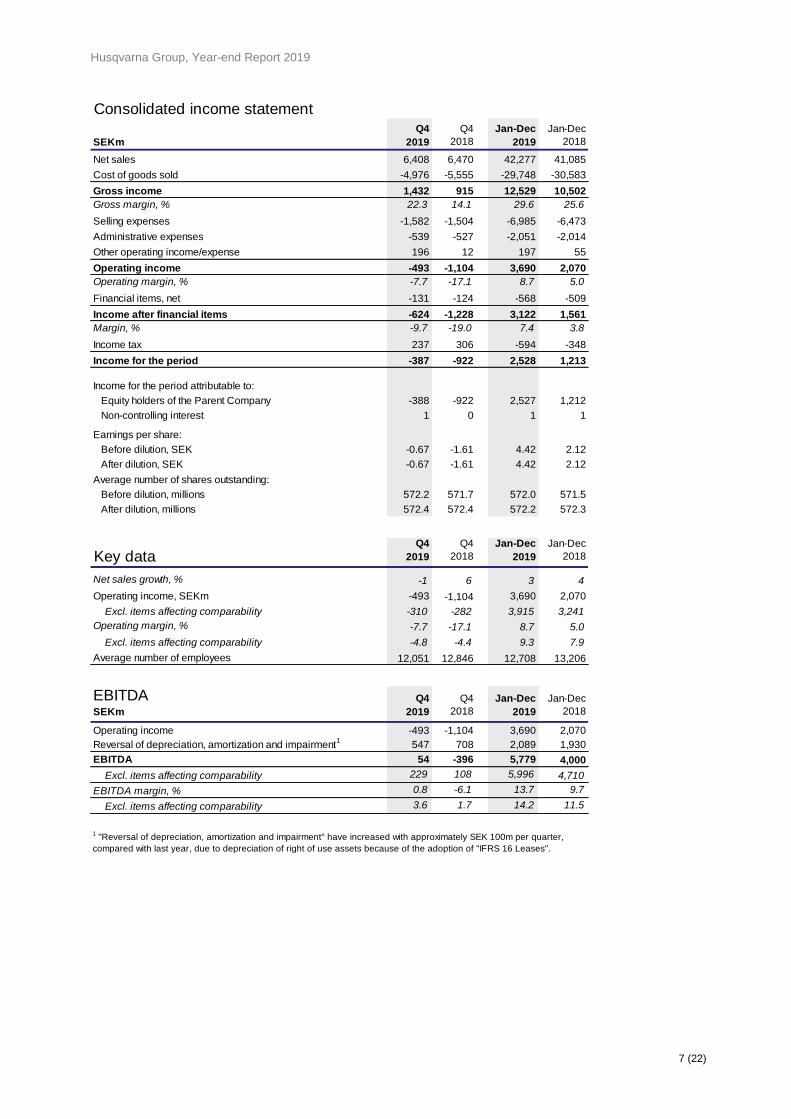
Gross income 1,432 915 12,529 10,502
Gross margin, % 22.3 14.1 29.6 25.6
Selling expenses -1,582 -1,504 -6,985 -6,473
Administrative expenses -539 -527 -2,051 -2,014
Other operating income/expense 196 12 197 55
Operating income -493 -1,104 3,690 2,070
Operating margin, % -7.7 -17.1 8.7 5.0
Financial items, net -131 -124 -568 -509
Income after financial items -624 -1,228 3,122 1,561
Margin, % -9.7 -19.0 7.4 3.8
Income tax 237 306 -594 -348
Income for the period -387 -922 2,528 1,213
Income for the period attributable to:
Equity holders of the Parent Company -388 -922 2,527 1,212
Non-controlling interest 1 0 1 1
Earnings per share:
Before dilution, SEK -0.67 -1.61 4.42 2.12
After dilution, SEK -0.67 -1.61 4.42 2.12
Average number of shares outstanding:
Before dilution, millions 572.2 571.7 572.0 571.5
After dilution, millions 572.4 572.4 572.2 572.3
Key dataQ4
2019
Q4
2018
Jan-Dec
2019
Jan-Dec
2018
Net sales growth, % -1 6 3 4
Operating income, SEKm -493 -1,104 3,690 2,070
Excl. items affecting comparability -310 -282 3,915 3,241
Operating margin, % -7.7 -17.1 8.7 5.0
Excl. items affecting comparability -4.8 -4.4 9.3 7.9
Average number of employees 12,051 12,846 12,708 13,206
EBITDASEKm
Q4
2019
Q4
2018
Jan-Dec
2019
Jan-Dec
2018
Operating income -493 -1,104 3,690 2,070
Reversal of depreciation, amortization and impairment1
547 708 2,089 1,930
EBITDA 54 -396 5,779 4,000
Excl. items affecting comparability 229 108 5,996 4,710
EBITDA margin, % 0.8 -6.1 13.7 9.7
Excl. items affecting comparability 3.6 1.7 14.2 11.5
1 "Reversal of depreciation, amortization and impairment" have increased with approximately SEK 100m per quarter,
compared with last year, due to depreciation of right of use assets because of the adoption of "IFRS 16 Leases".
Husqvarna Group, Year-end Report 2019
8 (22)
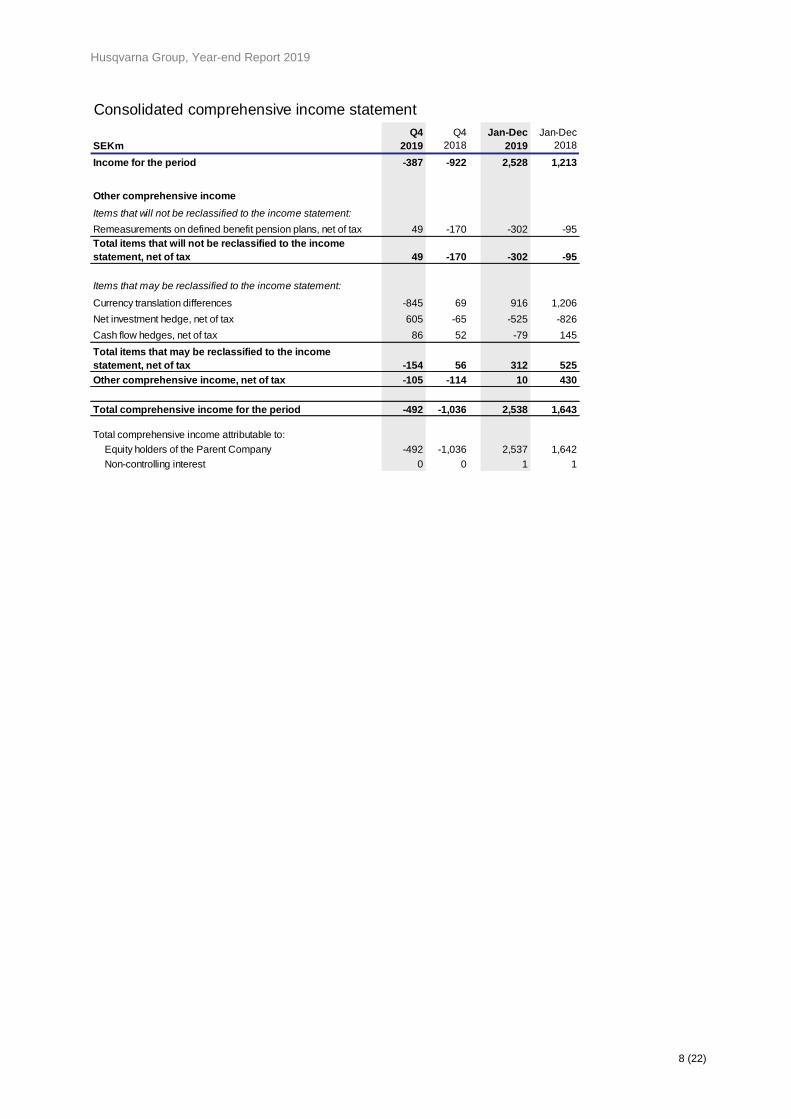
Consolidated comprehensive income statement
SEKm
Q4
2019
Q4
2018
Jan-Dec
2019
Jan-Dec
2018
Income for the period -387 -922 2,528 1,213
Other comprehensive income
Items that will not be reclassified to the income statement:
Remeasurements on defined benefit pension plans, net of tax 49 -170 -302 -95
Total items that will not be reclassified to the income
statement, net of tax 49 -170 -302 -95
Items that may be reclassified to the income statement:
Currency translation differences -845 69 916 1,206
Net investment hedge, net of tax 605 -65 -525 -826
Cash flow hedges, net of tax 86 52 -79 145
Total items that may be reclassified to the income
statement, net of tax -154 56 312 525
Other comprehensive income, net of tax -105 -114 10 430
Total comprehensive income for the period -492 -1,036 2,538 1,643
Total comprehensive income attributable to:
Equity holders of the Parent Company -492 -1,036 2,537 1,642
Non-controlling interest 0 0 1 1
Husqvarna Group, Year-end Report 2019
9 (22)
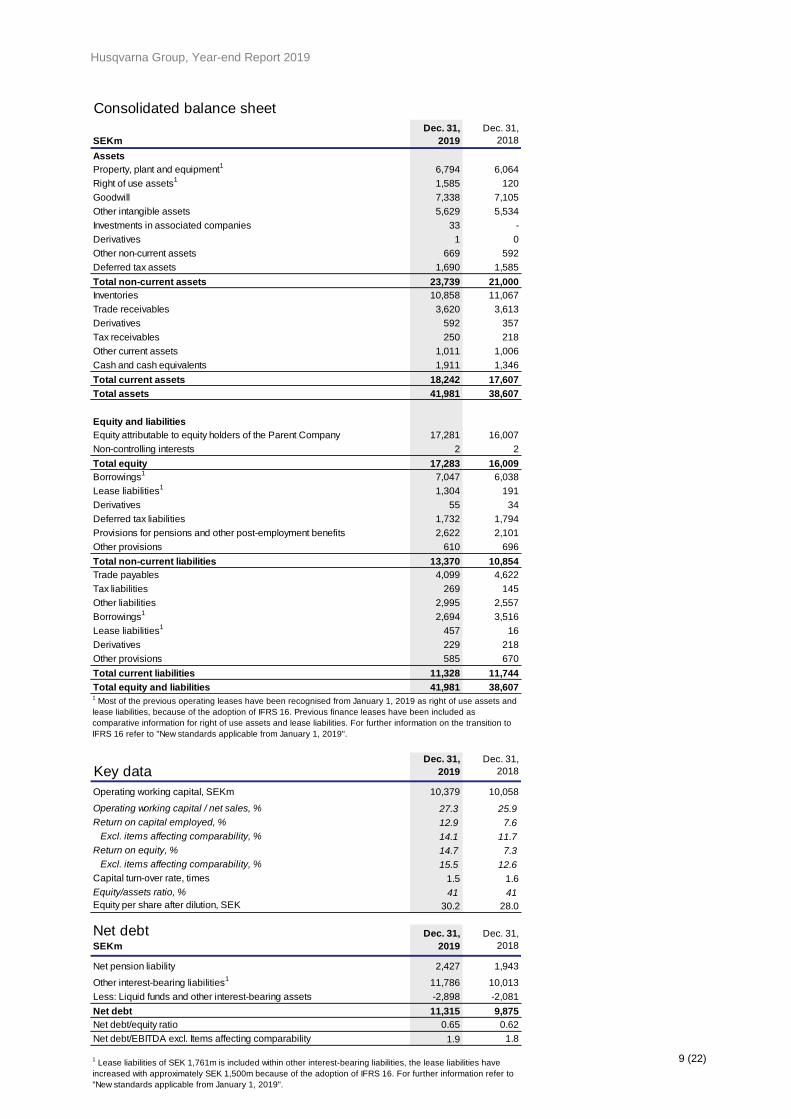
Consolidated balance sheet
SEKm
Dec. 31,
2019
Dec. 31,
2018
Assets
Property, plant and equipment1
6,794 6,064
Right of use assets1
1,585 120
Goodwill 7,338 7,105
Other intangible assets 5,629 5,534
Investments in associated companies 33 -
Derivatives 1 0
Other non-current assets 669 592
Deferred tax assets 1,690 1,585
Total non-current assets 23,739 21,000
Inventories 10,858 11,067
Trade receivables 3,620 3,613
Derivatives 592 357
Tax receivables 250 218
Other current assets 1,011 1,006
Cash and cash equivalents 1,911 1,346
Total current assets 18,242 17,607
Total assets 41,981 38,607
Equity and liabilities
Equity attributable to equity holders of the Parent Company 17,281 16,007
Non-controlling interests 2 2
Total equity 17,283 16,009
Borrowings1
7,047 6,038
Lease liabilities1
1,304 191
Derivatives 55 34
Deferred tax liabilities 1,732 1,794
Provisions for pensions and other post-employment benefits 2,622 2,101
Other provisions 610 696
Total non-current liabilities 13,370 10,854
Trade payables 4,099 4,622
Tax liabilities 269 145
Other liabilities 2,995 2,557
Borrowings1
2,694 3,516
Lease liabilities1
457 16
Derivatives 229 218
Other provisions 585 670
Total current liabilities 11,328 11,744
Total equity and liabilities 41,981 38,607
Key dataDec. 31,
2019
Dec. 31,
2018
Operating working capital, SEKm 10,379 10,058
Operating working capital / net sales, % 27.3 25.9
Return on capital employed, % 12.9 7.6
Excl. items affecting comparability, % 14.1 11.7
Return on equity, % 14.7 7.3
Excl. items affecting comparability, % 15.5 12.6
Capital turn-over rate, times 1.5 1.6
Equity/assets ratio, % 41 41
Equity per share after dilution, SEK 30.2 28.0
Net debtSEKm
Dec. 31,
2019
Dec. 31,
2018
Net pension liability 2,427 1,943
Other interest-bearing liabilities1
11,786 10,013
Less: Liquid funds and other interest-bearing assets -2,898 -2,081
Net debt 11,315 9,875
Net debt/equity ratio 0.65 0.62
Net debt/EBITDA excl. Items affecting comparability 1.9 1.8
1 Most of the previous operating leases have been recognised from January 1, 2019 as right of use assets and
lease liabilities, because of the adoption of IFRS 16. Previous finance leases have been included as
comparative information for right of use assets and lease liabilities. For further information on the transition to
IFRS 16 refer to "New standards applicable from January 1, 2019".
1 Lease liabilities of SEK 1,761m is included within other interest-bearing liabilities, the lease liabilities have
increased with approximately SEK 1,500m because of the adoption of IFRS 16. For further information refer to
"New standards applicable from January 1, 2019".

Husqvarna Group, Year-end Report 2019
10 (22)
Consolidated cash flow statement
SEKm
Q4
2019
Q4
2018
Jan-Dec
2019
Jan-Dec
2018
Cash flow from operations
Operating income -493 -1,104 3,690 2,070
Non cash items 627 1,220 2,359 2,606
Cash items
Paid restructuring expenses -42 -44 -272 -62
Net financial items, received/paid -102 -52 -490 -448
Taxes paid -60 -217 -811 -970
Cash flow from operations, excluding change in
operating assets and liabilities -70 -197 4,476 3,196
Change in operating assets and liabilities
Change in inventories -1,022 -2,186 627 -1,366
Change in trade receivables 878 1,087 114 -69
Change in trade payables 704 976 -656 296
Change in other operating assets/liabilities -371 -526 347 -70
Cash flow from operating assets and liabilities 189 -649 432 -1,209
Cash flow from operations 119 -846 4,908 1,987
Investments
Acquisitions and divestments of subsidiaries/operations and divestments of
property, plant and equipment 325 35 349 -237
Investments in property, plant and equipment and intangible assets -711 -763 -2,232 -2,235
Investments and divestments of financial assets -88 -2 -56 0
Cash flow from investments -474 -730 -1,939 -2,472
Cash flow from operations and investments -355 -1,576 2,969 -485
Financing
Dividend paid to shareholders -859 -858 -1,287 -1,286
Dividend paid to non-controlling interests - - -1 -6
Other financing activities 1,540 1,804 -1,159 1,204
Cash flow from financing 681 946 -2,447 -88
Total cash flow 326 -630 522 -573
Cash and cash equivalents at the beginning of the period 1,623 1,957 1,346 1,872
Exchange rate differences referring to cash and cash equivalents -38 19 43 47
Cash and cash equivalents at the end of the period 1,911 1,346 1,911 1,346
Operating cash flowSEKm
Q4
2019
Q4
2018
Jan-Dec
2019
Jan-Dec
2018
Cash flow from operations and investments -355 -1,576 2,969 -485
Acquisitions and divestments of subsidiaries/operations and divestments of
property, plant and equipment -325 -35 -349 237
Investments and divestments of financial assets 88 2 56 0
Operating cash flow -592 -1,609 2,676 -248
Direct operating cash flowSEKm
Q4
2019
Q4
2018
Jan-Dec
2019
Jan-Dec
2018
EBITDA excl. items affecting comparability 229 108 5,996 4,710
Change in inventories -1,022 -2,186 627 -1,366
Change in trade receivables 878 1,087 114 -69
Change in trade payables 704 976 -656 296
Investments in property, plant and equipment and intangible assets -711 -763 -2,232 -2,235
Direct operating cash flow 78 -778 3,849 1,336
Husqvarna Group, Year-end Report 2019
11 (22)
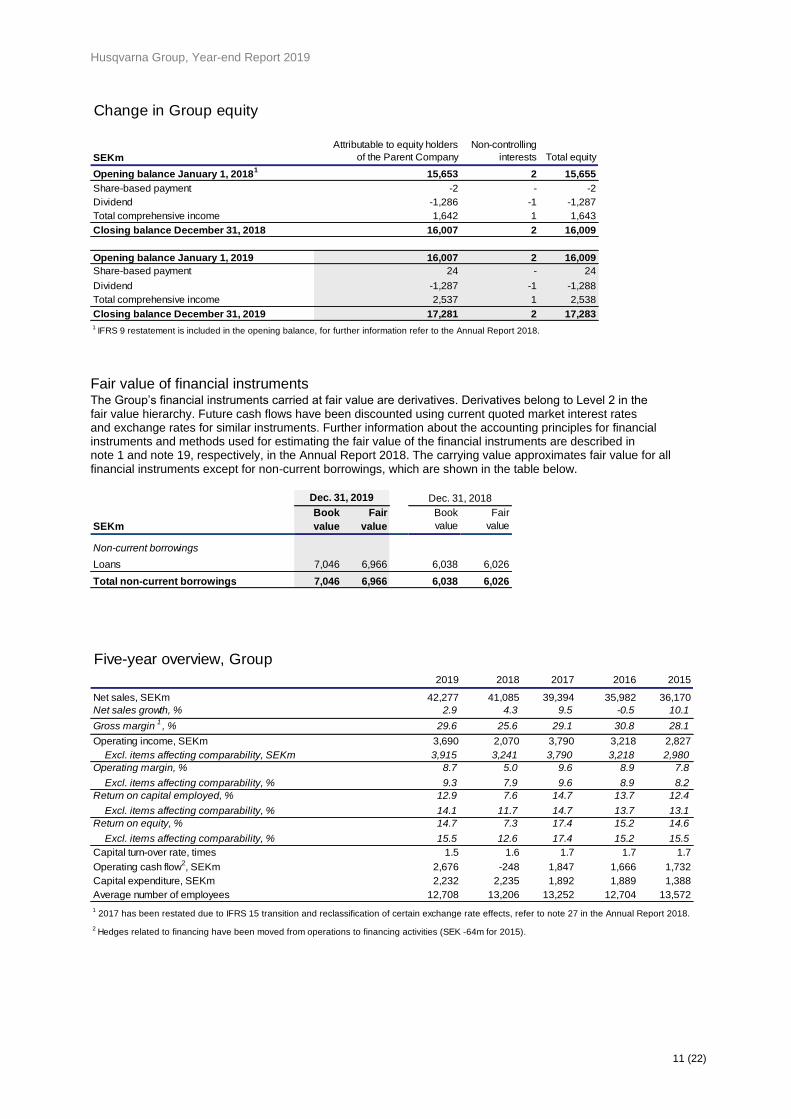
Change in Group equity
SEKm
Attributable to equity holders
of the Parent Company
Non-controlling
interests Total equity
Opening balance January 1, 20181
15,653 2 15,655
Share-based payment -2 - -2
Dividend -1,286 -1 -1,287
Total comprehensive income 1,642 1 1,643
Closing balance December 31, 2018 16,007 2 16,009
Opening balance January 1, 2019 16,007 2 16,009
Share-based payment 24 - 24
Dividend -1,287 -1 -1,288
Total comprehensive income 2,537 1 2,538
Closing balance December 31, 2019 17,281 2 17,283
1 IFRS 9 restatement is included in the opening balance, for further information refer to the Annual Report 2018.
Fair value of financial instruments The Group’s financial instruments carried at fair value are derivatives. Derivatives belong to Level 2 in the fair value hierarchy. Future cash flows have been discounted using current quoted market interest rates and exchange rates for similar instruments. Further information about the accounting principles for financial instruments and methods used for estimating the fair value of the financial instruments are described in note 1 and note 19, respectively, in the Annual Report 2018. The carrying value approximates fair value for all financial instruments except for non-current borrowings, which are shown in the table below.
SEKm
Book
value
Fair
value
Book
value
Fair
value
Non-current borrowings
Loans 7,046 6,966 6,038 6,026
Total non-current borrowings 7,046 6,966 6,038 6,026
Dec. 31, 2019 Dec. 31, 2018
Five-year overview, Group
2019 2018 2017 2016 2015
Net sales, SEKm 42,277 41,085 39,394 35,982 36,170
Net sales growth, % 2.9 4.3 9.5 -0.5 10.1
Gross margin1, % 29.6 25.6 29.1 30.8 28.1
Operating income, SEKm 3,690 2,070 3,790 3,218 2,827
Excl. items affecting comparability, SEKm 3,915 3,241 3,790 3,218 2,980
Operating margin, % 8.7 5.0 9.6 8.9 7.8
Excl. items affecting comparability, % 9.3 7.9 9.6 8.9 8.2
Return on capital employed, % 12.9 7.6 14.7 13.7 12.4
Excl. items affecting comparability, % 14.1 11.7 14.7 13.7 13.1
Return on equity, % 14.7 7.3 17.4 15.2 14.6
Excl. items affecting comparability, % 15.5 12.6 17.4 15.2 15.5
Capital turn-over rate, times 1.5 1.6 1.7 1.7 1.7
Operating cash flow2, SEKm 2,676 -248 1,847 1,666 1,732
Capital expenditure, SEKm 2,232 2,235 1,892 1,889 1,388
Average number of employees 12,708 13,206 13,252 12,704 13,572
1 2017 has been restated due to IFRS 15 transition and reclassification of certain exchange rate effects, refer to note 27 in the Annual Report 2018.
2 Hedges related to financing have been moved from operations to financing activities (SEK -64m for 2015).

Husqvarna Group, Year-end Report 2019
12 (22)
Net sales and income by quarter, Group
SEKm Q1 Q2 Q3 Q4 Full-year
Net sales, finished goods 2019 13,575 13,708 8,347 6,277 41,907
2018 12,248 14,184 7,964 6,401 40,797
2017 12,734 13,058 7,437 6,117 39,346
Net sales, services, royalty and other 2019 76 81 82 131 370
2018 55 86 78 69 288
2017 12 11 12 13 48
Net sales total 2019 13,651 13,789 8,429 6,408 42,277
2018 12,303 14,270 8,042 6,470 41,085
2017 12,746 13,069 7,449 6,130 39,394
Operating income 2019 1,644 2,125 414 -493 3,690
2018 1,373 1,925 -124 -1,104 2,070
2017 1,425 2,002 433 -70 3,790
Operating margin, % 2019 12.0 15.4 4.9 -7.7 8.7
2018 11.2 13.5 -1.5 -17.1 5.0
2017 11.2 15.3 5.8 -1.1 9.6
Income for the period 2019 1,140 1,506 269 -387 2,528
2018 940 1,380 -185 -922 1,213
2017 988 1,401 210 61 2,660
Earnings per share after dilution, SEK 2019 1.99 2.63 0.47 -0.67 4.42
2018 1.64 2.41 -0.32 -1.61 2.12
2017 1.72 2.43 0.37 0.10 4.62
Net sales and operating income, last twelve months, Group
SEKm Q1 Q2 Q3 Q4
Net sales 2019 42,433 41,952 42,339 42,277
2018 38,951 40,152 40,745 41,085
2017 37,367 38,932 39,032 39,394
Operating income 2019 2,341 2,541 3,079 3,690
Excl. items affecting comparability 2019 3,554 3,754 3,943 3,915
2018 3,738 3,661 3,104 2,070
Excl. items affecting comparability 2018 3,738 3,661 3,453 3,241
2017 3,477 3,750 3,752 3,790
Operating margin, % 2019 5.5 6.1 7.3 8.7
Excl. items affecting comparability 2019 8.4 8.9 9.3 9.3
2018 9.6 9.1 7.6 5.0
Excl. items affecting comparability 2018 9.6 9.1 8.5 7.9
2017 9.3 9.6 9.6 9.6
Items affecting comparability
SEKm Q1 Q2 Q3 Q4 Full-year
Restructuring related expenses 1
2019 -42 - - -183 -225
Restructuring related expenses 1
2018 - - -349 -822 -1,171
No items 2017 - - - - -
No items 2016 - - - - -
Restructuring related expenses 2015 - - - -153 -153
Restructuring related expenses
SEKm
Q4
2019
Q4
2018
Jan-Dec
2019
Jan-Dec
2018
Restructuring provisions -171 -329 -213 -382
Impairment of non-current assets -8 -318 -8 -461
Write down of inventory -4 -175 -4 -328
Total items affecting comparability -183 -822 -225 -1,171
Classification in the income statement
SEKm
Q4
2019
Q4
2018
Jan-Dec
2019
Jan-Dec
2018
Cost of goods sold -75 -768 -117 -1,077
Selling expenses -57 -33 -57 -48
Administrative expenses -51 -21 -51 -46
Total items affecting comparability -183 -822 -225 -1,171
1 Includes restructuring provisions, impairment of non-current assets and write down of inventory and other restructuring related expenses.

Husqvarna Group, Year-end Report 2019
13 (22)
Net sales (external) by segment
SEKm Q1 Q2 Q3 Q4 Full-year
Husqvarna 2019 9,506 8,688 5,204 4,108 27,506
2018 1
8,484 9,347 5,015 4,310 27,156
2017 1,2 9,238 8,867 4,931 4,185 27,221
Gardena 2019 2,630 3,373 1,630 710 8,343
2018 1
2,483 3,325 1,564 746 8,118
2017 1 2,310 2,859 1,255 727 7,151
Construction 2019 1,494 1,720 1,575 1,551 6,340
2018 1,328 1,590 1,446 1,398 5,762
2017 1,197 1,341 1,260 1,217 5,015
Group common costs3 2019 21 8 20 39 88
2018 8 8 17 16 49
2017 1 1 3 2 7
Total Group 2019 13,651 13,789 8,429 6,408 42,277
2018 12,303 14,270 8,042 6,470 41,085
2017 12,746 13,069 7,449 6,130 39,394
2 Restatement due to reclassification of certain sales between segments, refer to note 27 in the Annual Report 2018.
3 Royalty income is included in Group common costs.
Operating income by segment
SEKm Q1 Q2 Q3 Q4 Full-year
Husqvarna 2019 1,186 1,217 82 -225 2,260
Excl. items affecting comparability 2019 1,228 1,217 82 -100 2,427
2018 1
1,044 1,154 -344 -626 1,228
Excl. items affecting comparability 2018 1
1,044 1,154 -15 -77 2,106
2017 1,2 1,054 1,250 341 71 2,716
Gardena 2019 372 703 120 -348 847
2018 1
264 595 64 -498 425
Excl. items affecting comparability 2018 1
264 595 66 -274 651
2017 1 297 580 12 -224 665
Construction 2019 177 267 229 106 779
Excl. items affecting comparability 2019 177 267 229 163 836
2018 158 251 192 71 672
Excl. items affecting comparability 2018 158 251 192 115 716
2017 141 233 143 132 649
Group common costs 2019 -91 -62 -17 -26 -196
Excl. items affecting comparability 2019 -91 -62 -17 -25 -195
2018 -93 -75 -36 -51 -255
Excl. items affecting comparability 2018 -93 -75 -18 -46 -232
2017 -67 -62 -63 -48 -240
Total Group 2019 1,644 2,125 414 -493 3,690
Excl. items affecting comparability 2019 1,686 2,125 414 -310 3,915
2018 1,373 1,925 -124 -1,104 2,070
Excl. items affecting comparability 2018 1,373 1,925 225 -282 3,241
2017 1,425 2,002 433 -70 3,790
2 Restatement due to reclassification of certain sales between segments, refer to note 27 in the Annual Report 2018.
1 Restatement due to allocation of the Consumer Brands Division, refer to "Distribution of the Consumer Brands Division".
1 Restatement due to allocation of the Consumer Brands Division, refer to "Distribution of the Consumer Brands Division".
Husqvarna Group, Year-end Report 2019
14 (22)
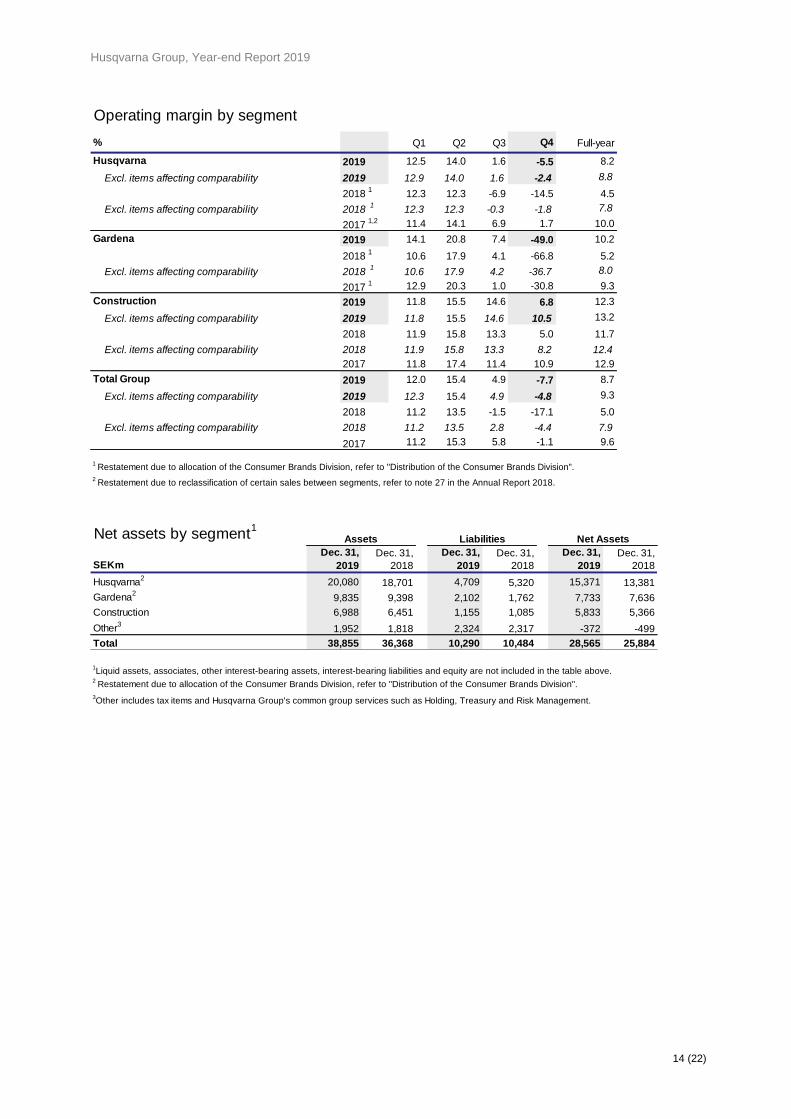
Operating margin by segment
% Q1 Q2 Q3 Q4 Full-year
Husqvarna 2019 12.5 14.0 1.6 -5.5 8.2
Excl. items affecting comparability 2019 12.9 14.0 1.6 -2.4 8.8
2018 1
12.3 12.3 -6.9 -14.5 4.5
Excl. items affecting comparability 2018 1
12.3 12.3 -0.3 -1.8 7.8
2017 1,2 11.4 14.1 6.9 1.7 10.0
Gardena 2019 14.1 20.8 7.4 -49.0 10.2
2018 1
10.6 17.9 4.1 -66.8 5.2
Excl. items affecting comparability 2018 1
10.6 17.9 4.2 -36.7 8.0
2017 1 12.9 20.3 1.0 -30.8 9.3
Construction 2019 11.8 15.5 14.6 6.8 12.3
Excl. items affecting comparability 2019 11.8 15.5 14.6 10.5 13.2
2018 11.9 15.8 13.3 5.0 11.7
Excl. items affecting comparability 2018 11.9 15.8 13.3 8.2 12.4
2017 11.8 17.4 11.4 10.9 12.9
Total Group 2019 12.0 15.4 4.9 -7.7 8.7
Excl. items affecting comparability 2019 12.3 15.4 4.9 -4.8 9.3
2018 11.2 13.5 -1.5 -17.1 5.0
Excl. items affecting comparability 2018 11.2 13.5 2.8 -4.4 7.9
2017 11.2 15.3 5.8 -1.1 9.6
2 Restatement due to reclassification of certain sales between segments, refer to note 27 in the Annual Report 2018.
1 Restatement due to allocation of the Consumer Brands Division, refer to "Distribution of the Consumer Brands Division".
Net assets by segment1
SEKm
Dec. 31,
2019
Dec. 31,
2018
Dec. 31,
2019
Dec. 31,
2018
Dec. 31,
2019
Dec. 31,
2018
Husqvarna2
20,080 18,701 4,709 5,320 15,371 13,381
Gardena2
9,835 9,398 2,102 1,762 7,733 7,636
Construction 6,988 6,451 1,155 1,085 5,833 5,366
Other3
1,952 1,818 2,324 2,317 -372 -499
Total 38,855 36,368 10,290 10,484 28,565 25,884
2 Restatement due to allocation of the Consumer Brands Division, refer to "Distribution of the Consumer Brands Division".
1Liquid assets, associates, other interest-bearing assets, interest-bearing liabilities and equity are not included in the table above.
3Other includes tax items and Husqvarna Group's common group services such as Holding, Treasury and Risk Management.
Net AssetsAssets Liabilities
Husqvarna Group, Year-end Report 2019
15 (22)
NEW STANDARDS APPLICABLE FROM JANUARY 1, 2019
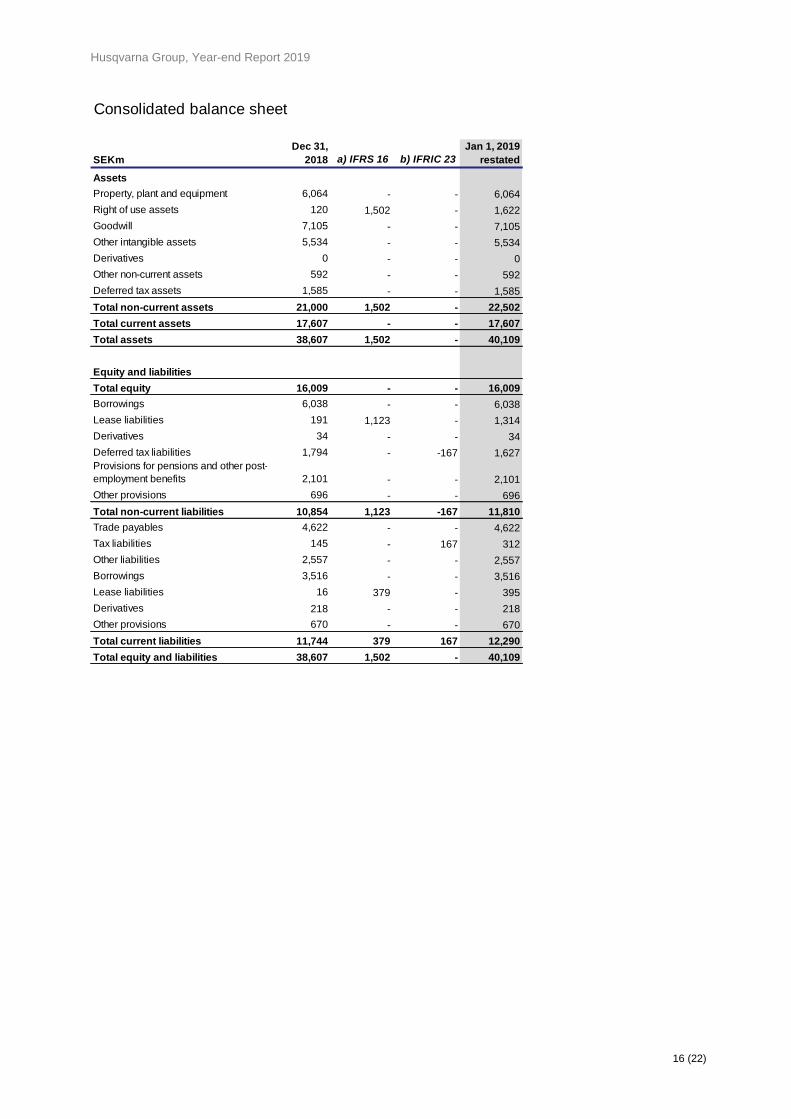
a) IFRS 16 “Leases” transition Husqvarna Group applies IFRS 16 “Leases” from January 1, 2019. IFRS 16 replaces IAS 17 “Leases”. The accounting principles have changed accordingly, the new accounting principles have been disclosed in the Annual Report 2018 (www.husqvarnagroup.com/ir). IFRS 16 results in most leases being recognized in the balance sheet, as the distinction between operating and finance leases is removed. Under the new standard, an asset (the right to use the leased asset) and a financial liability (the obligation to make lease payments) will be recognized, with exceptions for short-term leases and low-value assets. The standard affects the accounting for the Group’s operating leases (mainly buildings, cars and forklifts). Husqvarna Group adopts IFRS 16 “Leases” retrospectively from January 1, 2019 with the cumulative effect of initially applying the new standard recognized on January 1, 2019. Comparatives for the 2018 financial year have not been restated. On adoption of IFRS 16 the Group will recognize lease liabilities in relation to leases which have previously been classified as operating leases under IAS 17. These liabilities will be measured at the present value of the remaining lease payments, discounted using the incremental borrowing rate as at January 1, 2019. The weighted average discount rate was 2.2% as at January 1, 2019. The lease liability recognized as of January 1, 2019 increased by SEK 1,502m as a result of the adoption of IFRS16. The Group had non-cancellable operating lease commitments of SEK 1,586m as at December 31, 2018, SEK 1,484m when discounted. The difference can be explained by the exceptions for short-term leases and low-value assets and the use of extension options as according to IFRS 16. The Group has used the practical expedient permitted by the standard to exclude initial direct cost for the measurement of the right of use asset at the date of initial application, and the use of hindsight in determining the lease term where the contract contains options to extend or terminate the lease. The right of use assets has been measured at an amount equal to the lease liability at transition. Non-current assets increased by SEK 1,502m on January 1, 2019 due to recognized right of use assets. The total effect in the income statement is not significant, there is a slight shift in the income statement, where operating income increase and the financial items decrease.
b) IFRIC 23 “Uncertainty over income tax treatments” Husqvarna Group applies IFRIC 23 “Uncertainty over income tax treatments” from January 1, 2019. IFRIC 23 is a new interpretation of uncertain income tax treatments within the scope of IAS 12 Income taxes. IFRIC 23 clarifies how to recognize and measure deferred and current income tax assets and liabilities where there is uncertainty over a tax treatment. An uncertain tax treatment is any tax treatment applied by an entity where there is uncertainty over whether that treatment will be accepted by the tax authority. Husqvarna Group adopts IFRIC 23 “Uncertainty over income tax treatments” retrospectively from January 1, 2019 with the cumulative effect of initially applying the new standard recognized on January 1, 2019. Comparatives for the 2018 financial year have not been restated. Uncertain tax liabilities of SEK 167m that has previously been recognized as deferred tax liabilities has been reclassified to current tax liabilities as at January 1, 2019, as a result of the adoption of IFRIC 23. The following table shows the adjustments for each individual line item.
Husqvarna Group, Year-end Report 2019
16 (22)
Consolidated balance sheet
SEKm
Dec 31,
2018 a) IFRS 16 b) IFRIC 23
Jan 1, 2019
restated
Assets
Property, plant and equipment 6,064 - - 6,064
Right of use assets 120 1,502 - 1,622
Goodwill 7,105 - - 7,105
Other intangible assets 5,534 - - 5,534
Derivatives 0 - - 0
Other non-current assets 592 - - 592
Deferred tax assets 1,585 - - 1,585
Total non-current assets 21,000 1,502 - 22,502
Total current assets 17,607 - - 17,607
Total assets 38,607 1,502 - 40,109
Equity and liabilities
Total equity 16,009 - - 16,009
Borrowings 6,038 - - 6,038
Lease liabilities 191 1,123 - 1,314
Derivatives 34 - - 34
Deferred tax liabilities 1,794 - -167 1,627
Provisions for pensions and other post-
employment benefits 2,101 - - 2,101
Other provisions 696 - - 696
Total non-current liabilities 10,854 1,123 -167 11,810
Trade payables 4,622 - - 4,622
Tax liabilities 145 - 167 312
Other liabilities 2,557 - - 2,557
Borrowings 3,516 - - 3,516
Lease liabilities 16 379 - 395
Derivatives 218 - - 218
Other provisions 670 - - 670
Total current liabilities 11,744 379 167 12,290
Total equity and liabilities 38,607 1,502 - 40,109
Husqvarna Group, Year-end Report 2019
17 (22)
PARENT COMPANY
Income statement
SEKm
Q4
2019
Q4
2018
Jan-Dec
2019
Jan-Dec
2018
Net sales 3,006 3,215 17,838 17,185
Cost of goods sold -2,593 -2,971 -13,626 -14,109
Gross income 413 244 4,212 3,076
Selling expense -334 -352 -1,449 -1,334
Administrative expense -372 -342 -1,308 -1,192
Other operating income/expense 9 0 9 0
Operating income -284 -450 1,464 550
Financial items, net 611 -442 7,048 -965
Income after financial items 327 -892 8,512 -415
Appropriations 155 374 110 337
Income before taxes 482 -518 8,622 -78
Tax on profit for the year -115 63 -92 133
Income for the period 367 -455 8,530 55
Balance sheet
SEKm
Dec. 31,
2019
Dec. 31,
2018
Non-current assets 38,226 33,734
Current assets 9,987 10,437
Total assets 48,213 44,171
Equity 29,801 22,536
Untaxed reserves 794 794
Provisions 101 159
Non-current liabilities 6,881 5,810
Current liabilities 10,636 14,872
Total equity and liabilities 48,213 44,171
Number of shares
Outstanding
A-shares
Outstanding
B-shares
Re-purchased
B-shares2
Total
Number of shares as of December 31, 2018 112,437,551 459,235,811 4,670,416 576,343,778
Conversion of A-shares into B-shares -421,922 421,922 - -
Shares allocated to 2016 LTI-program - 529,252 -529,252 -
Number of shares as of December 31, 20191
112,015,629 460,186,985 4,141,164 576,343,778
1In January 2020, another 30 A-shares were converted.
2The 4,141,164 B-shares are entirely in a third party share swap agreement.

Husqvarna Group, Year-end Report 2019
18 (22)
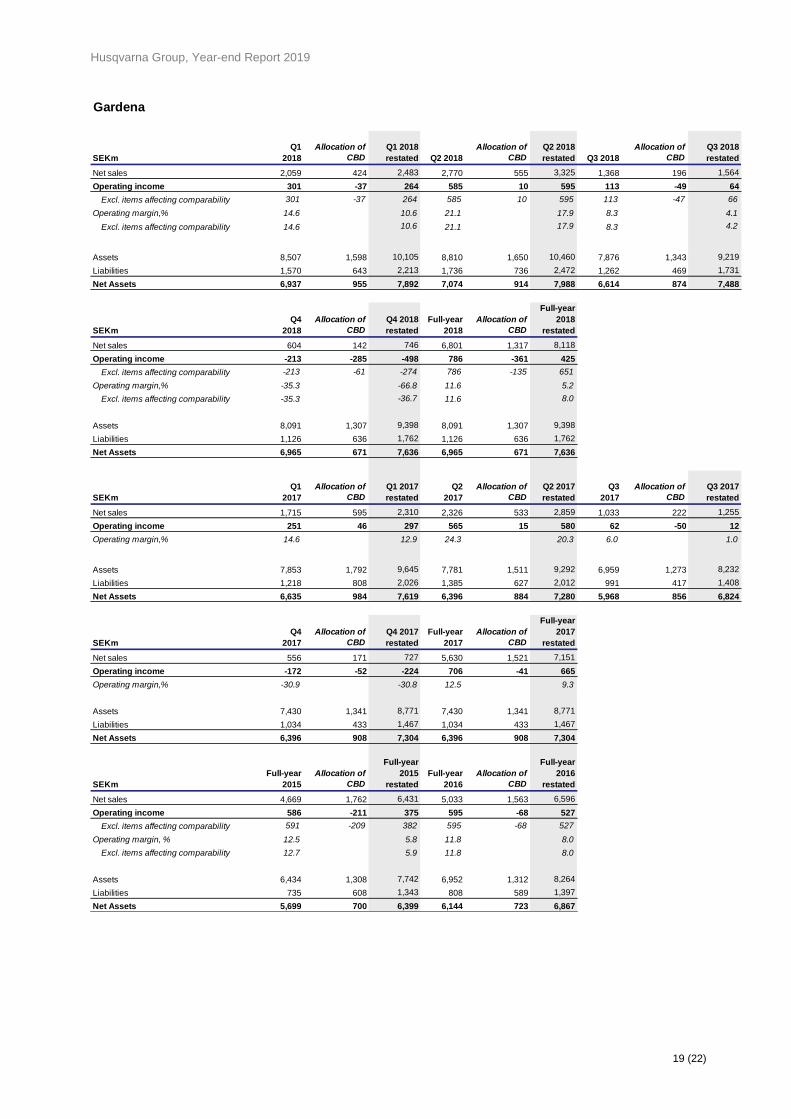
Distribution of the Consumer Brands Division (Dissolved as of January 1, 2019)
The Consumer Brands Division has been dissolved and integrated into the Husqvarna and Gardena divisions as of January 1, 2019. The European part, that accounted for approximately 15% of Consumer Brands net sales, has been included in the Gardena Division and the remaining 85%, mainly related to North America, has been included in the Husqvarna Division. The segment reporting in 2019 consists of three divisions: Husqvarna, Gardena and Construction. A restatement of the segment reporting in the new structure is presented below and the comparative amounts have been restated accordingly in this report.
Husqvarna
SEKm
Q1
2018
Allocation of
CBD
Q1 2018
restated
Q2
2018
Allocation of
CBD
Q2 2018
restated
Q3
2018
Allocation of
CBD
Q3 2018
restated
Net sales 6,049 2,435 8,484 6,719 2,628 9,347 3,689 1,326 5,015
Operating income 1,070 -26 1,044 1,201 -47 1,154 -19 -325 -344
Excl. items affecting comparability 1,070 -26 1,044 1,201 -47 1,154 47 -62 -15
Operating margin, % 17.7 12.3 17.9 12.3 -0.5 -6.9
Excl. items affecting comparability 17.7 12.3 17.9 12.3 1.3 -0.3
Assets 15,948 5,593 21,541 15,155 5,214 20,369 13,669 4,073 17,742
Liabilities 5,301 1,562 6,863 4,856 1,442 6,298 3,707 884 4,591
Net Assets 10,647 4,031 14,678 10,299 3,772 14,071 9,962 3,189 13,151
SEKm
Q4
2018
Allocation of
CBD
Q4 2018
restated
Full-year
2018
Allocation of
CBD
Full-year
2018
restated
Net sales 3,323 987 4,310 19,780 7,376 27,156
Operating income -140 -486 -626 2,112 -884 1,228
Excl. items affecting comparability -41 -36 -77 2,277 -171 2,106
Operating margin, % -4.2 -14.5 10.7 4.5
Excl. items affecting comparability -1.2 -1.8 11.5 7.8
Assets 14,647 4,054 18,701 14,647 4,054 18,701
Liabilities 4,100 1,220 5,320 4,100 1,220 5,320
Net Assets 10,547 2,834 13,381 10,547 2,834 13,381
SEKm
Q1
2017 1
Allocation of
CBD
Q1 2017
restated
Q2
2017 1
Allocation of
CBD
Q2 2017
restated
Q3
2017 1
Allocation of
CBD
Q3 2017
restated
Net sales 6,136 3,102 9,238 6,164 2,703 8,867 3,669 1,262 4,931
Operating income 1,032 22 1,054 1,180 70 1,250 388 -47 341
Operating margin, % 16.8 11.4 19.1 14.1 10.6 6.9
Assets 14,883 6,184 21,067 13,470 4,788 18,258 12,018 4,337 16,355
Liabilities 4,776 1,744 6,520 4,224 1,464 5,688 3,395 980 4,375
Net Assets 10,107 4,440 14,547 9,246 3,324 12,570 8,623 3,357 11,980
SEKm
Q4
2017 1
Allocation of
CBD
Q4 2017
restated
Full-year
2017 1
Allocation of
CBD
Full-year
2017
restated
Net sales 3,240 945 4,185 19,209 8,012 27,221
Operating income 127 -56 71 2,727 -11 2,716
Operating margin, % 3.9 1.7 14.2 10.0
Assets 12,741 4,430 17,171 12,741 4,430 17,171
Liabilities 3,856 1,025 4,881 3,856 1,025 4,881
Net Assets 8,885 3,405 12,290 8,885 3,405 12,290
SEKm
Full-year
2015
Allocation of
CBD
Full-year
2015
restated
Full-year
2016
Allocation of
CBD
Full-year
2016
restated
Net sales 17,624 8,174 25,798 17,960 7,325 25,285
Operating income 2,233 65 2,298 2,317 71 2,388
Excl. items affecting comparability 2,284 89 2,373 2,317 71 2,388
Operating margin, % 12.7 8.9 12.9 9.4
Excl. items affecting comparability 13.0 9.2 12.9 9.4
Assets 10,917 4,135 15,052 12,317 4,947 17,264
Liabilities 3,021 1,091 4,112 3,642 1,414 5,056
Net Assets 7,896 3,044 10,940 8,675 3,533 12,2081
Restatement due to reclassification of certain sales between segments, se note 27 in the Annual Report 2018.
Husqvarna Group, Year-end Report 2019
19 (22)
Gardena
SEKm
Q1
2018
Allocation of
CBD
Q1 2018
restated Q2 2018
Allocation of
CBD
Q2 2018
restated Q3 2018
Allocation of
CBD
Q3 2018
restated
Net sales 2,059 424 2,483 2,770 555 3,325 1,368 196 1,564
Operating income 301 -37 264 585 10 595 113 -49 64
Excl. items affecting comparability 301 -37 264 585 10 595 113 -47 66
Operating margin,% 14.6 10.6 21.1 17.9 8.3 4.1
Excl. items affecting comparability 14.6 10.6 21.1 17.9 8.3 4.2
Assets 8,507 1,598 10,105 8,810 1,650 10,460 7,876 1,343 9,219
Liabilities 1,570 643 2,213 1,736 736 2,472 1,262 469 1,731
Net Assets 6,937 955 7,892 7,074 914 7,988 6,614 874 7,488
SEKm
Q4
2018
Allocation of
CBD
Q4 2018
restated
Full-year
2018
Allocation of
CBD
Full-year
2018
restated
Net sales 604 142 746 6,801 1,317 8,118
Operating income -213 -285 -498 786 -361 425
Excl. items affecting comparability -213 -61 -274 786 -135 651
Operating margin,% -35.3 -66.8 11.6 5.2
Excl. items affecting comparability -35.3 -36.7 11.6 8.0
Assets 8,091 1,307 9,398 8,091 1,307 9,398
Liabilities 1,126 636 1,762 1,126 636 1,762
Net Assets 6,965 671 7,636 6,965 671 7,636
SEKm
Q1
2017
Allocation of
CBD
Q1 2017
restated
Q2
2017
Allocation of
CBD
Q2 2017
restated
Q3
2017
Allocation of
CBD
Q3 2017
restated
Net sales 1,715 595 2,310 2,326 533 2,859 1,033 222 1,255
Operating income 251 46 297 565 15 580 62 -50 12
Operating margin,% 14.6 12.9 24.3 20.3 6.0 1.0
Assets 7,853 1,792 9,645 7,781 1,511 9,292 6,959 1,273 8,232
Liabilities 1,218 808 2,026 1,385 627 2,012 991 417 1,408
Net Assets 6,635 984 7,619 6,396 884 7,280 5,968 856 6,824
SEKm
Q4
2017
Allocation of
CBD
Q4 2017
restated
Full-year
2017
Allocation of
CBD
Full-year
2017
restated
Net sales 556 171 727 5,630 1,521 7,151
Operating income -172 -52 -224 706 -41 665
Operating margin,% -30.9 -30.8 12.5 9.3
Assets 7,430 1,341 8,771 7,430 1,341 8,771
Liabilities 1,034 433 1,467 1,034 433 1,467
Net Assets 6,396 908 7,304 6,396 908 7,304
SEKm
Full-year
2015
Allocation of
CBD
Full-year
2015
restated
Full-year
2016
Allocation of
CBD
Full-year
2016
restated
Net sales 4,669 1,762 6,431 5,033 1,563 6,596
Operating income 586 -211 375 595 -68 527
Excl. items affecting comparability 591 -209 382 595 -68 527
Operating margin, % 12.5 5.8 11.8 8.0
Excl. items affecting comparability 12.7 5.9 11.8 8.0
Assets 6,434 1,308 7,742 6,952 1,312 8,264
Liabilities 735 608 1,343 808 589 1,397
Net Assets 5,699 700 6,399 6,144 723 6,867
Husqvarna Group, Year-end Report 2019
20 (22)
DEFINITIONS This report includes financial measures as required by the financial reporting framework applicable to Husqvarna Group, which is based on IFRS. In addition, there are other measures (alternative performance measures) used by management and other stakeholders to analyze trends and performance of the Group’s operations that cannot be directly read or derived from the financial statements. Husqvarna stakeholders should not consider these as substitutes, but rather as additions, to the financial reporting measures prepared in accordance with IFRS. Please note that the alternative performance measures as defined, may not be comparable to similarly titled measures used by other companies. Refer below for a list of definitions of all measures and indicators used, referred to and presented in this report. Computation of average amounts In computation of key ratios where averages of capital balances are included, the average capital balances are based on the opening balance and all quarter-end closing balances included in the reporting period, i.e five quarters.
Growth measures Net sales adjusted for changes in exchange rates Change in net sales adjusted for currency translation effects. Net sales are also disclosed adjusted for currency translation effects as Husqvarna Group is a global company generating significant transactions in other currencies than the reporting currency (SEK) and the currency rates have proven to be volatile. Net sales growth Change in net sales compared to previous period in percent. Organic growth Change in net sales, adjusted for acquisitions, divestments and currency translation effects. Profitability measures EBITDA EBITDA is a measure of earnings before interest, taxes, depreciation, amortization and impairment charges. EBITDA measures Husqvarna Group's operating performance and the ability to generate cash from operations, without considering the capital structure of the Group or its fiscal environment. For a reconciliation of EBITDA refer to table below the income statement. EBITDA margin EBITDA as a percentage of net sales. Gross margin Gross income as a percentage of net sales. Last twelve months (LTM) Last twelve months rolling has been included to assist stakeholders in their analysis of the seasonality that the Husqvarna Group's business is exposed to. Operating margin Operating income as a percentage of net sales. Return on capital employed Operating income plus financial income (last twelve months) as a percentage of average capital employed.
Return on equity Net income attributable to equity holders of the Parent Company last twelve months as a percentage of average equity attributable to equity holders of the Parent Company. Share-based measures Earnings per share, after dilution Net income attributable to equity holders of the Parent Company divided by the weighted average number of shares outstanding (net of treasury shares), after dilution. Equity per share, after dilution Equity attributable to equity holders of the Parent Company divided by the weighted average number of shares outstanding (net of treasury shares), after dilution. Capital indicators Capital employed Total equity and liabilities less non-interest-bearing debt including deferred tax liabilities. Capital expenditure Investments in property, plant and equipment, right of use assets and intangible assets. Interest bearing liabilities Long-term and short-term borrowings, net pension liability and fair value derivative liabilities. Liquid funds Cash and cash equivalents, short-term investments and fair value derivative assets. Net assets Total assets excluding liquid funds and interest-bearing assets less operating liabilities, non-interest-bearing provisions and deferred tax liabilities. Net debt Net debt describes the Group’s gearing and its ability to repay its debts from cash generated from the Group´s ordinary business (see operating cash flow below), if they were all due today. It’s also used to analyze how future net interest costs will
Husqvarna Group, Year-end Report 2019
21 (22)
impact earnings. Net debt is defined as total interest-bearing liabilities plus dividend payable, less liquid funds and interest-bearing assets. For a reconciliation of net debt refer to table below the balance sheet. Operating working capital Inventories and trade receivables less trade payables. Capital measures Equity/assets ratio Equity attributable to equity holders of the Parent Company as a percentage of total assets. Capital turnover rate Net sales last twelve months divided with average net assets. Net debt/EBITDA excl. items affecting comparability Average net debt in relation to EBITDA last twelve months, excluding items affecting comparability. Net debt/equity ratio Net debt in relation to total equity. Operating working capital/net sales Average operating working capital as a percentage of net sales last twelve months.
Other measures Direct operating cash flow Direct operating cash flow is a measure of the cash generated by the Groups operating business. The measure is defined as EBITDA, excluding items affecting comparability, adjusted for change in trade payables, inventory and trade receivables and investments in property, plant and equipment and intangible assets. For a reconciliation of direct operating cash flow refer to the table below the cash flow statement. Items affecting comparability To assist in understanding Husqvarna Group’s operations, we believe that it is useful to consider certain measures and ratios exclusive of items affecting comparability. Items affecting comparability includes items that are non-recurring, have a significant impact and are considered to be important for understanding the operating performance when comparing results between periods. The items affecting comparability are disclosed on page 12. All measures and ratios in this report have been disclosed including items affecting comparability first and then excluding items affecting comparability as a second measure when deemed appropriate. Operating cash flow Operating cash flow is a measure of the amount of cash generated by the Group’s ordinary business operations. The measure is defined as total cash flow from operations and investments, excluding acquisitions and divestments of subsidiaries/operations, divestments of property plant and equipment and investments/divestments of financial assets. For a reconciliation of operating cash flow refer to table below the cash flow statement.
Husqvarna Group, Year-end Report 2019
22 (22)
TELEPHONE CONFERENCE A combined press and telephone conference, hosted by Kai Wärn, President and CEO, and Glen Instone, CFO, will be held at Husqvarna Group’s office, Regeringsgatan 28, Stockholm at 10:00 CET on February 4, 2020. To participate, please dial +46 (0) 8 566 184 30 (Sweden) or +44 (0) 8 448 228 902 (UK) ten minutes prior to the start of the conference. Conference ID: Husqvarna or 4553429#. The conference call will also be audio cast live on www.husqvarnagroup.com/ir. A replay will be available later the same day.
DATES FOR FINANCIAL REPORTS 2020 April 24 Interim report for January-March July 16 Interim report for January-June October 20 Interim report for January-September The Group´s Annual Report 2019 and the Sustainability Report 2019 will be available on www.husqvarnagroup.com on March 12. The Annual General Meeting will be held in Jönköping, Sweden on April 2, 2020.
CONTACTS – Glen Instone, CFO, Senior Vice President, Finance, IR & Communication, +46 72 716 5032 – Johan Andersson, Director, Group Corporate Communications and Investor Relations, +46 702 100 451
This press release contains insider information that Husqvarna AB is required to disclose under the EU Market Abuse Regulation and the Securities Markets Act. The information was submitted for publication, through the contact person set out above, at 08.00 CET on February 4, 2020.
Factors affecting forward-looking statements
This report contains forward-looking statements in the sense referred to in the American Private Securities Litigation Reform Act of 1995. Such statements comprise, among other things, financial goals, goals of future business and financial plans. These statements are based on present expectations and are subject to risks and uncertainties that may give rise to major deviations in the result due to several aspects. These aspects include, among other things: consumer demand and market conditions in the geographical areas and lines of business in which Husqvarna operates, the effects of currency fluctuations, downward pressure on prices due to competition, a material reduction in sales by important distributors, success in developing new products and in marketing, outcome of product responsibility litigation, progress in terms of reaching the goals set for productivity and efficient use of capital, successful identification of growth opportunities and acquisition objects, integration of these into the existing business and successful achievement of goals for making the supply chain more efficient.