Embed Size (px)
Citation preview
HUSKY ENERGY INC. | Q2 | CONDENSED INTERIM CONSOLIDATED FINANCIAL STATEMENTS | 1
CONDENSED INTERIM CONSOLIDATED FINANCIAL STATEMENTS (unaudited)Condensed Consolidated Balance Sheets
(millions of Canadian dollars) June 30, 2017 December 31, 2016
Assets
Current assets
Cash and cash equivalents 2,500 1,319
Accounts receivable 936 1,036
Income taxes receivable 267 186
Inventories 1,320 1,558
Prepaid expenses 72 135
Restricted cash (note 4) 90 84
5,185 4,318
Restricted cash (note 4) 84 72
Exploration and evaluation assets (note 5) 1,204 1,066
Property, plant and equipment, net (note 6) 23,622 24,593
Goodwill 657 679
Investment in joint ventures 1,217 1,128
Long-term income taxes receivable 232 232
Other assets 171 172
Total Assets 32,372 32,260
Liabilities and Shareholders’ Equity
Current liabilities
Accounts payable and accrued liabilities 2,023 2,226
Short-term debt (note 7) 200 200
Long-term debt due within one year (note 7) 390 403
Contribution payable due within one year 102 146
Asset retirement obligations (note 8) 238 218
2,953 3,193
Long-term debt (note 7) 5,362 4,736
Other long-term liabilities (note 9) 1,128 1,020
Asset retirement obligations (note 8) 2,490 2,573
Deferred tax liabilities 3,034 3,111
Total Liabilities 14,967 14,633
Shareholders’ equity
Common shares (note 10) 7,296 7,296
Preferred shares (note 10) 874 874
Retained earnings 8,418 8,457
Accumulated other comprehensive income 806 989
Non-controlling interest 11 11
Total Shareholders’ Equity 17,405 17,627
Total Liabilities and Shareholders’ Equity 32,372 32,260
The accompanying notes to the condensed interim consolidated financial statements are an integral part of these statements.
HUSKY ENERGY INC. | Q2 | CONDENSED INTERIM CONSOLIDATED FINANCIAL STATEMENTS | 2
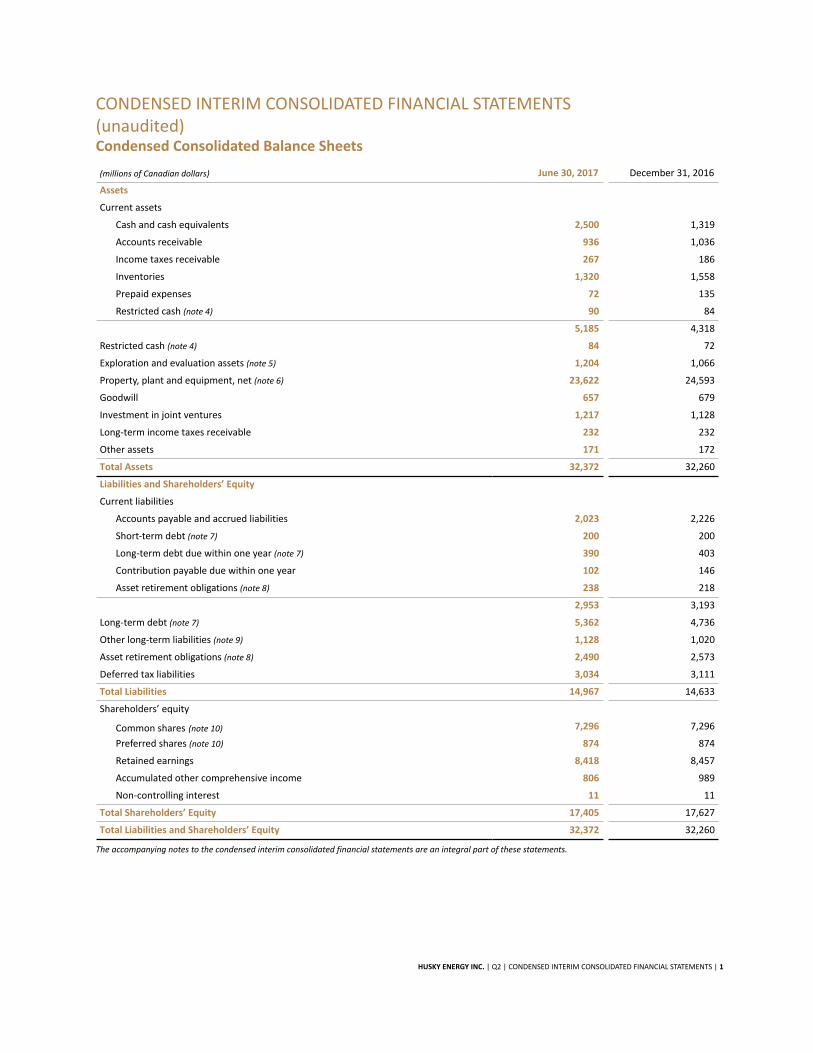
Condensed Consolidated Statements of Loss
Three months ended Six months ended
June 30, June 30,
(millions of Canadian dollars, except share data) 2017 2016 2017 2016
Gross revenues 4,617 3,243 9,196 5,923
Royalties (91) (90) (195) (144)
Marketing and other (1) 18 35 (84)
Revenues, net of royalties 4,525 3,171 9,036 5,695
Expenses
Purchases of crude oil and products 2,936 1,624 5,767 3,110
Production, operating and transportation expenses (note 11) 690 680 1,359 1,361
Selling, general and administrative expenses (note 11) 142 146 276 263
Depletion, depreciation, amortization and impairment (note 6) 862 697 1,562 1,419
Exploration and evaluation expenses 56 76 77 93
Loss (gain) on sale of assets (note 6) (33) 96 (31) 98
Other – net (65) 21 (56) (44)
4,588 3,340 8,954 6,300
Earnings (loss) from operating activities (63) (169) 82 (605)
Share of equity investment gain (loss) 23 (1) 48 (2)
Financial items (note 12)
Net foreign exchange gain (loss) (11) (9) (13) 4
Finance income 9 — 15 5
Finance expenses (103) (96) (196) (203)
(105) (105) (194) (194)
Loss before income taxes (145) (275) (64) (801)
Provisions for (recovery of) income taxes
Current 5 29 9 (32)
Deferred (57) (108) (51) (115)
(52) (79) (42) (147)
Net loss (93) (196) (22) (654)
Loss per share (note 10)
Basic (0.10) (0.20) (0.04) (0.67)
Diluted (0.10) (0.20) (0.04) (0.67)
Weighted average number of common shares outstanding (note 10)
Basic (millions) 1,005.5 1,005.5 1,005.5 1,004.4
Diluted (millions) 1,005.5 1,005.5 1,005.5 1,004.4
The accompanying notes to the condensed interim consolidated financial statements are an integral part of these statements.
HUSKY ENERGY INC. | Q2 | CONDENSED INTERIM CONSOLIDATED FINANCIAL STATEMENTS | 3
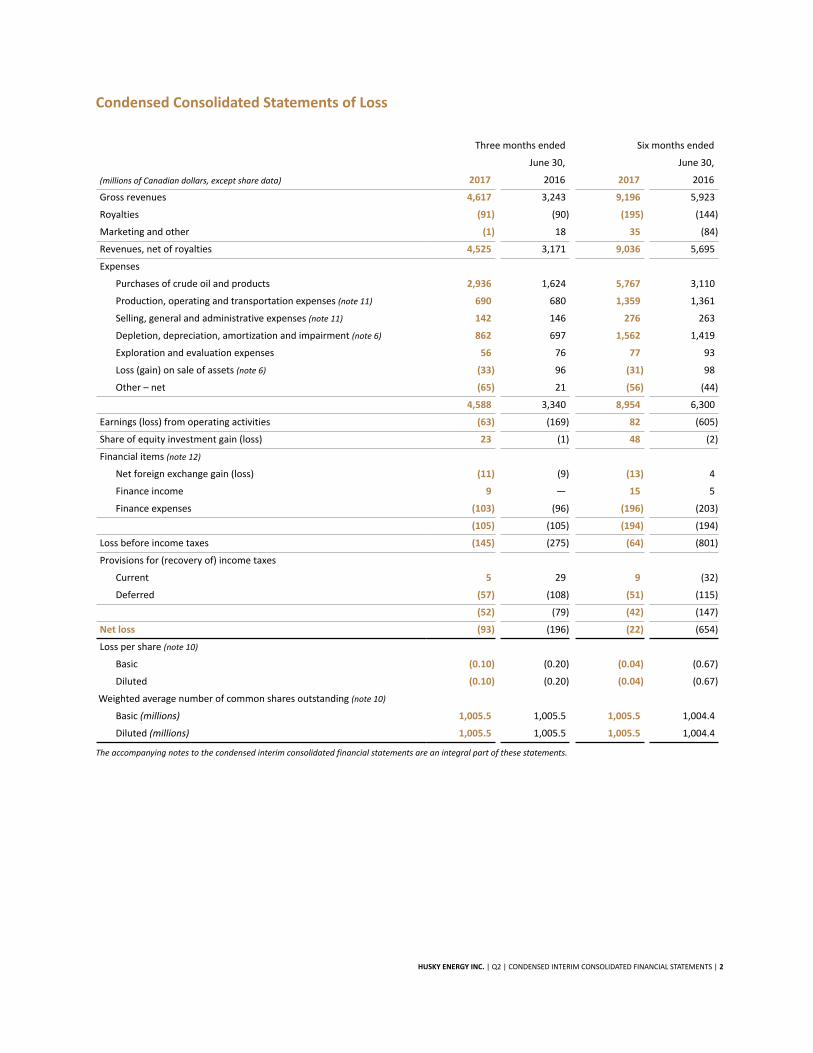
Condensed Consolidated Statements of Comprehensive Loss
Three months ended Six months ended
June 30, June 30,
(millions of Canadian dollars) 2017 2016 2017 2016
Net loss (93) (196) (22) (654)
Items that may be reclassified into earnings, net of tax:
Derivatives designated as cash flow hedges (note 14) (1) — (2) (1)
Equity investment - share of other comprehensive income 2 — 1 —
Exchange differences on translation of foreign operations (228) 27 (297) (521)
Hedge of net investment (note 14) 88 (11) 115 228
Other comprehensive income (loss) (139) 16 (183) (294)
Comprehensive loss (232) (180) (205) (948)
The accompanying notes to the condensed interim consolidated financial statements are an integral part of these statements.
HUSKY ENERGY INC. | Q2 | CONDENSED INTERIM CONSOLIDATED FINANCIAL STATEMENTS | 4
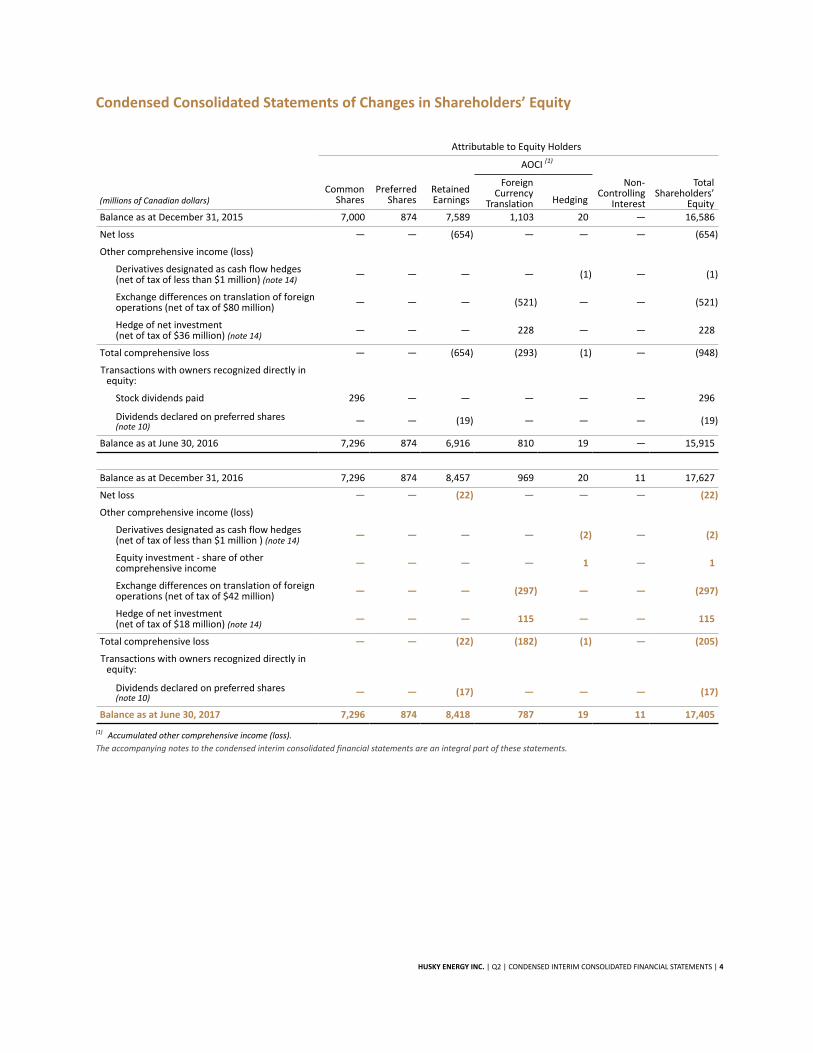
Condensed Consolidated Statements of Changes in Shareholders’ Equity
Attributable to Equity Holders
AOCI (1)
(millions of Canadian dollars)Common
SharesPreferred
SharesRetainedEarnings
ForeignCurrency
Translation Hedging
Non-Controlling
Interest
Total Shareholders’
EquityBalance as at December 31, 2015 7,000 874 7,589 1,103 20 — 16,586
Net loss — — (654) — — — (654)
Other comprehensive income (loss)
Derivatives designated as cash flow hedges (net of tax of less than $1 million) (note 14)
— — — — (1) — (1)
Exchange differences on translation of foreignoperations (net of tax of $80 million) — — — (521) — — (521)
Hedge of net investment (net of tax of $36 million) (note 14)
— — — 228 — — 228
Total comprehensive loss — — (654) (293) (1) — (948)
Transactions with owners recognized directly inequity:
Stock dividends paid 296 — — — — — 296
Dividends declared on preferred shares (note 10)
— — (19) — — — (19)
Balance as at June 30, 2016 7,296 874 6,916 810 19 — 15,915
Balance as at December 31, 2016 7,296 874 8,457 969 20 11 17,627
Net loss — — (22) — — — (22)
Other comprehensive income (loss)
Derivatives designated as cash flow hedges (net of tax of less than $1 million ) (note 14)
— — — — (2) — (2)
Equity investment - share of othercomprehensive income — — — — 1 — 1
Exchange differences on translation of foreignoperations (net of tax of $42 million) — — — (297) — — (297)
Hedge of net investment (net of tax of $18 million) (note 14)
— — — 115 — — 115
Total comprehensive loss — — (22) (182) (1) — (205)
Transactions with owners recognized directly inequity:
Dividends declared on preferred shares (note 10)
— — (17) — — — (17)
Balance as at June 30, 2017 7,296 874 8,418 787 19 11 17,405
(1) Accumulated other comprehensive income (loss).
The accompanying notes to the condensed interim consolidated financial statements are an integral part of these statements.
HUSKY ENERGY INC. | Q2 | CONDENSED INTERIM CONSOLIDATED FINANCIAL STATEMENTS | 5
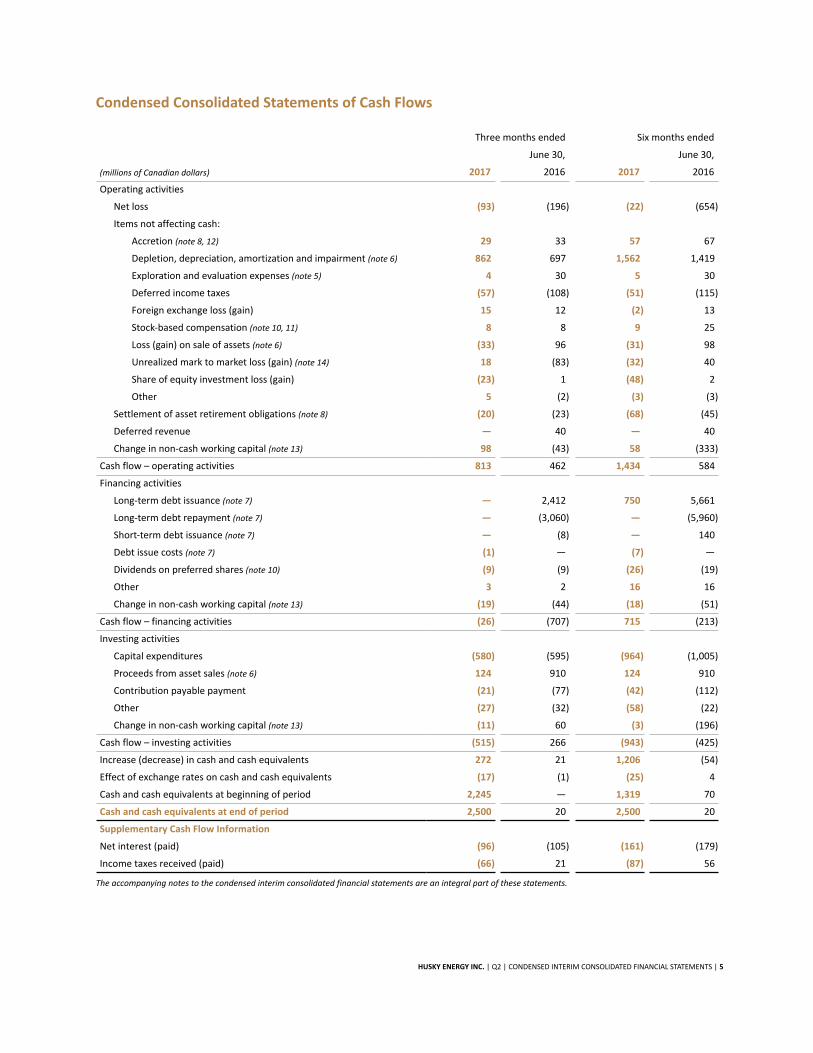
Condensed Consolidated Statements of Cash Flows
Three months ended Six months ended
June 30, June 30,
(millions of Canadian dollars) 2017 2016 2017 2016
Operating activities
Net loss (93) (196) (22) (654)
Items not affecting cash:
Accretion (note 8, 12) 29 33 57 67
Depletion, depreciation, amortization and impairment (note 6) 862 697 1,562 1,419
Exploration and evaluation expenses (note 5) 4 30 5 30
Deferred income taxes (57) (108) (51) (115)
Foreign exchange loss (gain) 15 12 (2) 13
Stock-based compensation (note 10, 11) 8 8 9 25
Loss (gain) on sale of assets (note 6) (33) 96 (31) 98
Unrealized mark to market loss (gain) (note 14) 18 (83) (32) 40
Share of equity investment loss (gain) (23) 1 (48) 2
Other 5 (2) (3) (3)
Settlement of asset retirement obligations (note 8) (20) (23) (68) (45)
Deferred revenue — 40 — 40
Change in non-cash working capital (note 13) 98 (43) 58 (333)
Cash flow – operating activities 813 462 1,434 584
Financing activities
Long-term debt issuance (note 7) — 2,412 750 5,661
Long-term debt repayment (note 7) — (3,060) — (5,960)
Short-term debt issuance (note 7) — (8) — 140
Debt issue costs (note 7) (1) — (7) —
Dividends on preferred shares (note 10) (9) (9) (26) (19)
Other 3 2 16 16
Change in non-cash working capital (note 13) (19) (44) (18) (51)
Cash flow – financing activities (26) (707) 715 (213)
Investing activities
Capital expenditures (580) (595) (964) (1,005)
Proceeds from asset sales (note 6) 124 910 124 910
Contribution payable payment (21) (77) (42) (112)
Other (27) (32) (58) (22)
Change in non-cash working capital (note 13) (11) 60 (3) (196)
Cash flow – investing activities (515) 266 (943) (425)
Increase (decrease) in cash and cash equivalents 272 21 1,206 (54)
Effect of exchange rates on cash and cash equivalents (17) (1) (25) 4
Cash and cash equivalents at beginning of period 2,245 — 1,319 70
Cash and cash equivalents at end of period 2,500 20 2,500 20
Supplementary Cash Flow Information
Net interest (paid) (96) (105) (161) (179)
Income taxes received (paid) (66) 21 (87) 56
The accompanying notes to the condensed interim consolidated financial statements are an integral part of these statements.
HUSKY ENERGY INC. | Q2 | CONDENSED INTERIM CONSOLIDATED FINANCIAL STATEMENTS | 6
NOTES TO THE CONDENSED INTERIM CONSOLIDATED FINANCIAL STATEMENTS(unaudited)
Note 1 Description of Business and Segmented Disclosures
Management has identified segments for the business of Husky Energy Inc. (“Husky” or the “Company”) based on differences in products, services and management responsibility. The Company’s business is conducted predominantly through two major business segments – Upstream and Downstream.
Upstream includes exploration for, and development and production of, crude oil, bitumen, natural gas and natural gas liquids (“NGLs”) (Exploration and Production) and marketing of the Company’s and other producers’ crude oil, natural gas, NGLs, sulphur and petroleum coke, pipeline transportation, the blending of crude oil and natural gas, and storage of crude oil, diluent and natural gas (Infrastructure and Marketing). Infrastructure and Marketing markets and distributes products to customers on behalf of Exploration and Production and is grouped in the Upstream business segment based on the nature of its interconnected operations. The Company’s Upstream operations are located primarily in Western Canada, offshore east coast of Canada (Atlantic) and offshore China and offshore Indonesia (Asia Pacific).
Downstream includes upgrading of heavy crude oil feedstock into synthetic crude oil in Canada (Upgrading), refining in Canada of crude oil, marketing of refined petroleum products including gasoline, diesel, ethanol blended fuels, asphalt and ancillary products, and production of ethanol (Canadian Refined Products) and refining in the U.S. of primarily crude oil to produce and market gasoline, jet fuel and diesel fuels that meet U.S. clean fuels standards (U.S. Refining and Marketing). Upgrading, Canadian Refined Products and U.S. Refining and Marketing all process and refine natural resources into marketable products and are grouped together as the Downstream business segment due to the similar nature of their products and services.
HUSKY ENERGY INC. | Q2 | CONDENSED INTERIM CONSOLIDATED FINANCIAL STATEMENTS | 7
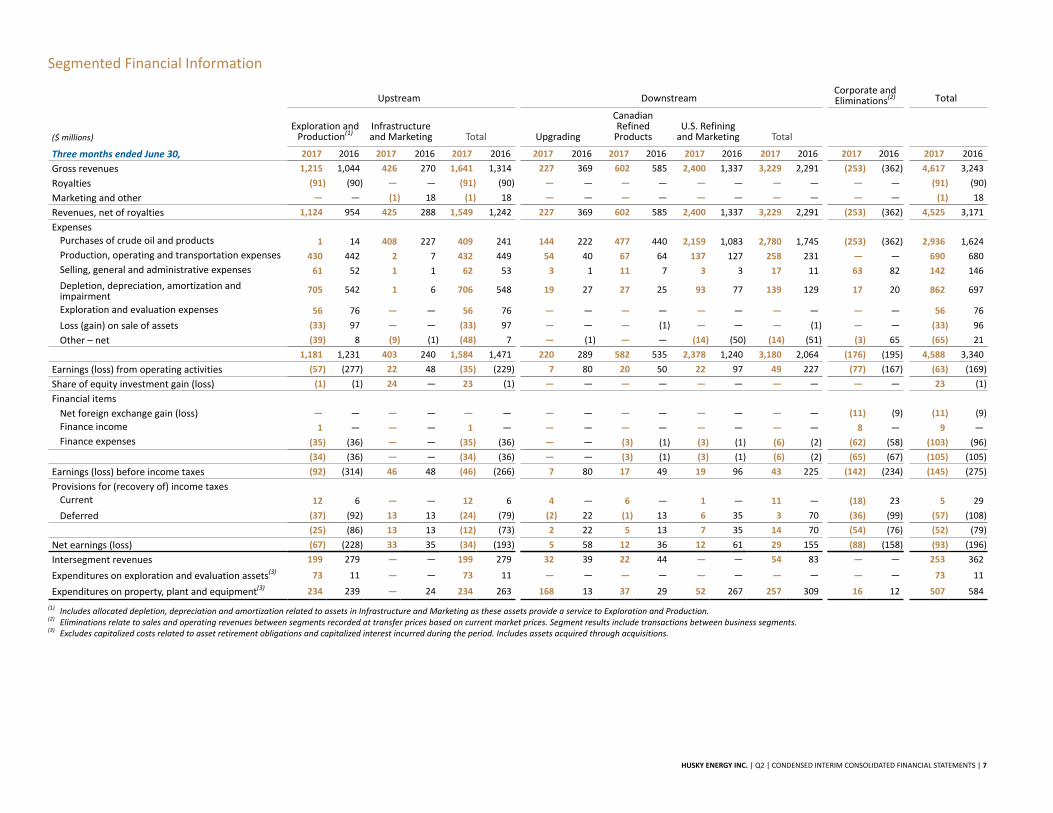
Segmented Financial Information
Upstream DownstreamCorporate and Eliminations(2) Total
($ millions)Exploration and
Production(1)Infrastructure and Marketing Total Upgrading
CanadianRefined
ProductsU.S. Refining
and Marketing Total
Three months ended June 30, 2017 2016 2017 2016 2017 2016 2017 2016 2017 2016 2017 2016 2017 2016 2017 2016 2017 2016
Gross revenues 1,215 1,044 426 270 1,641 1,314 227 369 602 585 2,400 1,337 3,229 2,291 (253) (362) 4,617 3,243
Royalties (91) (90) — — (91) (90) — — — — — — — — — — (91) (90)
Marketing and other — — (1) 18 (1) 18 — — — — — — — — — — (1) 18
Revenues, net of royalties 1,124 954 425 288 1,549 1,242 227 369 602 585 2,400 1,337 3,229 2,291 (253) (362) 4,525 3,171
ExpensesPurchases of crude oil and products 1 14 408 227 409 241 144 222 477 440 2,159 1,083 2,780 1,745 (253) (362) 2,936 1,624
Production, operating and transportation expenses 430 442 2 7 432 449 54 40 67 64 137 127 258 231 — — 690 680
Selling, general and administrative expenses 61 52 1 1 62 53 3 1 11 7 3 3 17 11 63 82 142 146
Depletion, depreciation, amortization andimpairment
705 542 1 6 706 548 19 27 27 25 93 77 139 129 17 20 862 697
Exploration and evaluation expenses 56 76 — — 56 76 — — — — — — — — — — 56 76
Loss (gain) on sale of assets (33) 97 — — (33) 97 — — — (1) — — — (1) — — (33) 96
Other – net (39) 8 (9) (1) (48) 7 — (1) — — (14) (50) (14) (51) (3) 65 (65) 21
1,181 1,231 403 240 1,584 1,471 220 289 582 535 2,378 1,240 3,180 2,064 (176) (195) 4,588 3,340
Earnings (loss) from operating activities (57) (277) 22 48 (35) (229) 7 80 20 50 22 97 49 227 (77) (167) (63) (169)
Share of equity investment gain (loss) (1) (1) 24 — 23 (1) — — — — — — — — — — 23 (1)
Financial items
Net foreign exchange gain (loss) — — — — — — — — — — — — — — (11) (9) (11) (9)
Finance income 1 — — — 1 — — — — — — — — — 8 — 9 —
Finance expenses (35) (36) — — (35) (36) — — (3) (1) (3) (1) (6) (2) (62) (58) (103) (96)
(34) (36) — — (34) (36) — — (3) (1) (3) (1) (6) (2) (65) (67) (105) (105)
Earnings (loss) before income taxes (92) (314) 46 48 (46) (266) 7 80 17 49 19 96 43 225 (142) (234) (145) (275)
Provisions for (recovery of) income taxesCurrent 12 6 — — 12 6 4 — 6 — 1 — 11 — (18) 23 5 29
Deferred (37) (92) 13 13 (24) (79) (2) 22 (1) 13 6 35 3 70 (36) (99) (57) (108)
(25) (86) 13 13 (12) (73) 2 22 5 13 7 35 14 70 (54) (76) (52) (79)
Net earnings (loss) (67) (228) 33 35 (34) (193) 5 58 12 36 12 61 29 155 (88) (158) (93) (196)
Intersegment revenues 199 279 — — 199 279 32 39 22 44 — — 54 83 — — 253 362
Expenditures on exploration and evaluation assets(3) 73 11 — — 73 11 — — — — — — — — — — 73 11
Expenditures on property, plant and equipment(3) 234 239 — 24 234 263 168 13 37 29 52 267 257 309 16 12 507 584
(1) Includes allocated depletion, depreciation and amortization related to assets in Infrastructure and Marketing as these assets provide a service to Exploration and Production.(2) Eliminations relate to sales and operating revenues between segments recorded at transfer prices based on current market prices. Segment results include transactions between business segments.(3) Excludes capitalized costs related to asset retirement obligations and capitalized interest incurred during the period. Includes assets acquired through acquisitions.
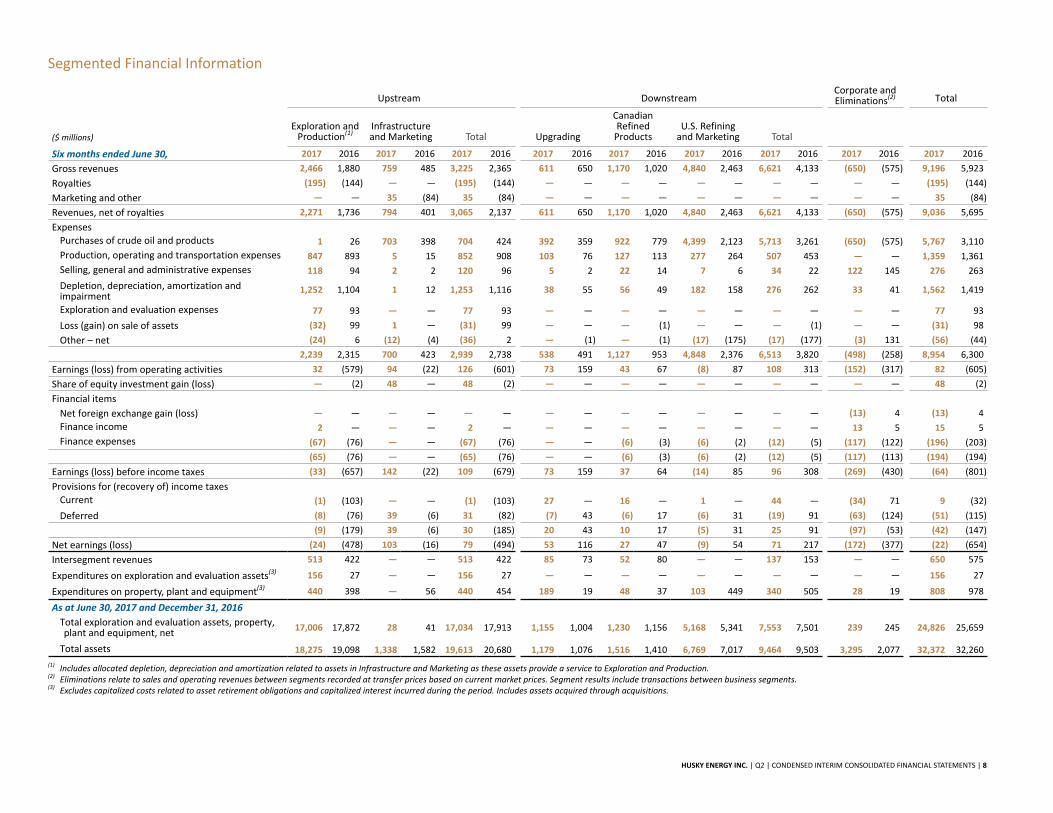
HUSKY ENERGY INC. | Q2 | CONDENSED INTERIM CONSOLIDATED FINANCIAL STATEMENTS | 8
Segmented Financial Information
Upstream DownstreamCorporate and Eliminations(2) Total
($ millions)Exploration and
Production(1)Infrastructure and Marketing Total Upgrading
CanadianRefined
ProductsU.S. Refining
and Marketing Total
Six months ended June 30, 2017 2016 2017 2016 2017 2016 2017 2016 2017 2016 2017 2016 2017 2016 2017 2016 2017 2016
Gross revenues 2,466 1,880 759 485 3,225 2,365 611 650 1,170 1,020 4,840 2,463 6,621 4,133 (650) (575) 9,196 5,923
Royalties (195) (144) — — (195) (144) — — — — — — — — — — (195) (144)
Marketing and other — — 35 (84) 35 (84) — — — — — — — — — — 35 (84)
Revenues, net of royalties 2,271 1,736 794 401 3,065 2,137 611 650 1,170 1,020 4,840 2,463 6,621 4,133 (650) (575) 9,036 5,695
ExpensesPurchases of crude oil and products 1 26 703 398 704 424 392 359 922 779 4,399 2,123 5,713 3,261 (650) (575) 5,767 3,110
Production, operating and transportation expenses 847 893 5 15 852 908 103 76 127 113 277 264 507 453 — — 1,359 1,361
Selling, general and administrative expenses 118 94 2 2 120 96 5 2 22 14 7 6 34 22 122 145 276 263
Depletion, depreciation, amortization andimpairment
1,252 1,104 1 12 1,253 1,116 38 55 56 49 182 158 276 262 33 41 1,562 1,419
Exploration and evaluation expenses 77 93 — — 77 93 — — — — — — — — — — 77 93
Loss (gain) on sale of assets (32) 99 1 — (31) 99 — — — (1) — — — (1) — — (31) 98
Other – net (24) 6 (12) (4) (36) 2 — (1) — (1) (17) (175) (17) (177) (3) 131 (56) (44)
2,239 2,315 700 423 2,939 2,738 538 491 1,127 953 4,848 2,376 6,513 3,820 (498) (258) 8,954 6,300
Earnings (loss) from operating activities 32 (579) 94 (22) 126 (601) 73 159 43 67 (8) 87 108 313 (152) (317) 82 (605)
Share of equity investment gain (loss) — (2) 48 — 48 (2) — — — — — — — — — — 48 (2)
Financial items
Net foreign exchange gain (loss) — — — — — — — — — — — — — — (13) 4 (13) 4
Finance income 2 — — — 2 — — — — — — — — — 13 5 15 5
Finance expenses (67) (76) — — (67) (76) — — (6) (3) (6) (2) (12) (5) (117) (122) (196) (203)
(65) (76) — — (65) (76) — — (6) (3) (6) (2) (12) (5) (117) (113) (194) (194)
Earnings (loss) before income taxes (33) (657) 142 (22) 109 (679) 73 159 37 64 (14) 85 96 308 (269) (430) (64) (801)
Provisions for (recovery of) income taxesCurrent (1) (103) — — (1) (103) 27 — 16 — 1 — 44 — (34) 71 9 (32)
Deferred (8) (76) 39 (6) 31 (82) (7) 43 (6) 17 (6) 31 (19) 91 (63) (124) (51) (115)
(9) (179) 39 (6) 30 (185) 20 43 10 17 (5) 31 25 91 (97) (53) (42) (147)
Net earnings (loss) (24) (478) 103 (16) 79 (494) 53 116 27 47 (9) 54 71 217 (172) (377) (22) (654)
Intersegment revenues 513 422 — — 513 422 85 73 52 80 — — 137 153 — — 650 575
Expenditures on exploration and evaluation assets(3) 156 27 — — 156 27 — — — — — — — — — — 156 27
Expenditures on property, plant and equipment(3) 440 398 — 56 440 454 189 19 48 37 103 449 340 505 28 19 808 978
As at June 30, 2017 and December 31, 2016
Total exploration and evaluation assets, property,plant and equipment, net 17,006 17,872 28 41 17,034 17,913 1,155 1,004 1,230 1,156 5,168 5,341 7,553 7,501 239 245 24,826 25,659
Total assets 18,275 19,098 1,338 1,582 19,613 20,680 1,179 1,076 1,516 1,410 6,769 7,017 9,464 9,503 3,295 2,077 32,372 32,260
(1) Includes allocated depletion, depreciation and amortization related to assets in Infrastructure and Marketing as these assets provide a service to Exploration and Production.(2) Eliminations relate to sales and operating revenues between segments recorded at transfer prices based on current market prices. Segment results include transactions between business segments.(3) Excludes capitalized costs related to asset retirement obligations and capitalized interest incurred during the period. Includes assets acquired through acquisitions.
HUSKY ENERGY INC. | Q2 | CONDENSED INTERIM CONSOLIDATED FINANCIAL STATEMENTS | 9
Note 2 Basis of Presentation
The condensed interim consolidated financial statements have been prepared by management and reported in Canadian dollars in accordance with International Accounting Standard (“IAS”) 34, “Interim Financial Reporting” as issued by the International Accounting Standards Board (“IASB”). These condensed interim consolidated financial statements do not include all of the information required for full annual consolidated financial statements and should be read in conjunction with the consolidated financial statements and the notes thereto in the Company’s 2016 Annual Report.
The condensed interim consolidated financial statements have been prepared, for all periods presented, following the same accounting policies and methods of computation as described in Note 3 to the consolidated financial statements for the fiscal year ended December 31, 2016, except for the newly issued standards and amendments as discussed below.
Certain prior period amounts have been reclassified to conform with the current period presentation.
These condensed interim consolidated financial statements were approved by the Chair of the Audit Committee and Chief Executive Officer on July 20, 2017.
Note 3 Significant Accounting Policies
Recent Accounting Standards
The Company has not early adopted any standard, interpretation or amendment that has been issued but is not yet effective.
Leases In January 2016, the IASB issued IFRS 16 Leases, which replaces the current IFRS guidance on leases. Under the current guidance, lessees are required to determine if the lease is a finance or operating lease, based on specified criteria. Finance leases are recognized on the balance sheet, while operating leases are recognized in the Consolidated Statements of Loss when the expense is incurred. Under IFRS 16, lessees must recognize a lease liability and a right-of-use asset for virtually all lease contracts. The recognition of the present value of minimum lease payments for certain contracts currently classified as operating leases will result in increases to assets, liabilities, depletion, depreciation and amortization, and finance expense, and a decrease to production, operating and transportation expense upon implementation. An optional exemption to not recognize certain short-term leases and leases of low value can be applied by lessees. For lessors, the accounting remains essentially unchanged. The standard will be effective for annual periods beginning on or after January 1, 2019. Early adoption is permitted, provided IFRS 15 Revenue from Contracts with Customers, has been applied, or is applied at the same date as IFRS 16.
The implementation of IFRS 16 consists of four phases: • Project awareness and engagement - This phase includes identifying and engaging the appropriate members of the
finance and operations teams, as well as communicating the key requirements of IFRS 16 to stakeholders, and creating a project steering committee.
• Scoping - This phase focuses on identifying and categorizing the Company’s contracts, performing a high-level impact assessment and determining the adoption approach and which optional recognition exemptions will be applied by the Company. This phase also includes identifying the systems impacted by the new accounting standard and evaluating potential system solutions.
• Detailed analysis and solution development - This phase includes assessing which agreements contain leases and determining the expected conversion differences for leases currently accounted for as operating leases under the existing standard. This phase also includes selection of the system solution.
• Implementation - This phase includes implementing the changes required for compliance with IFRS 16. The focus of this phase is the approval and implementation of any new accounting and tax policies, processes, systems and controls, as required, as well as the execution of customized training programs and preparation of disclosures under IFRS 16.
The Company is currently completing the project awareness and engagement phase of implementing IFRS 16. The impact on the Company’s consolidated financial statements upon adoption of IFRS 16 is currently being assessed.
HUSKY ENERGY INC. | Q2 | CONDENSED INTERIM CONSOLIDATED FINANCIAL STATEMENTS | 10
Revenue from Contracts with Customers In September 2015, the IASB published an amendment to IFRS 15, deferring the effective date of the standard by one year to annual periods beginning on or after January 1, 2018. IFRS 15 replaces existing revenue recognition guidance with a single comprehensive accounting model. The standard requires an entity to recognize revenue to reflect the transfer of goods and services for the amount it expects to receive, when control is transferred to the purchaser. Early adoption is permitted.
The implementation of IFRS 15 consists of four phases: • Project awareness and engagement - This phase includes identifying and engaging the appropriate members of the
finance and operations teams, as well as communicating the key requirements of IFRS 15 to stakeholders. • Scoping - This phase focuses on identifying the Company’s major revenue streams, documenting how and when revenue
is currently recognized and determination of whether any changes are expected upon adoption. • Detailed analysis and solution development - Steps in this phase include addressing any potential differences in revenue
recognition identified in the scoping phase, according to the priority assigned. This involves detailed analysis of the IFRS 15 revenue recognition criteria, review of contracts with customers to ensure revenue recognition practices are in accordance with IFRS 15 and evaluating potential changes to revenue processes and systems.
• Implementation - This phase includes implementing the changes required for compliance with IFRS 15. The focus of this phase is the approval and implementation of any new accounting and tax policies, processes, systems and controls, as required, as well as the execution of customized training programs and preparation of disclosures under IFRS 15.
The Company is currently in the scoping phase of implementation. No material impact is expected on the Company's consolidated financial statements upon adoption of IFRS 15.
Financial Instruments In July 2014, the IASB issued IFRS 9, “Financial Instruments” to replace IAS 39, which provides a single model for classification and measurement based on how an entity manages its financial instruments in the context of its business model and the contractual cash flow characteristics of the financial instruments. For financial liabilities, the change in fair value resulting from an entity’s own credit risk is recorded in other comprehensive income rather than net earnings, unless this creates an accounting mismatch. IFRS 9 includes a new, forward-looking ‘expected loss’ impairment model that will result in more timely recognition of expected credit losses. In addition, IFRS 9 provides a substantially-reformed approach to hedge accounting. The standard is effective for annual periods beginning on or after January 1, 2018, with required retrospective application and early adoption permitted.
The implementation of IFRS 9 consists of four phases: • Project awareness and engagement - This phase includes identifying and engaging the appropriate members of the
finance and operations teams, as well as communicating the key requirements of IFRS 9 to stakeholders. • Scoping - This phase focuses on identifying the Company’s financial instruments, determining accounting treatment for
in-scope financial instruments under IFRS 9, and determination of whether any changes are expected upon adoption. • Detailed analysis and solution development - This phase includes addressing differences in accounting for financial
instruments. Steps in this phase involve detailed analysis of the IFRS 9 recognition impacts, measurement and disclosure requirements, and evaluating potential changes to accounting processes.
• Implementation - This phase includes implementing the changes required for compliance with IFRS 9. The focus of this phase is the approval and implementation of any new accounting and tax policies, processes, systems and controls, as required, as well as the preparation of disclosures under IFRS 9.
The Company is currently in the implementation phase of implementing IFRS 9. The Company intends to retrospectively adopt the standard on January 1, 2018. The adoption of IFRS 9 is not expected to have a material impact on the Company's consolidated financial statements.
Changes in Accounting Policy
Effective January 1, 2017, the Company adopted the following new accounting standards issued by the IASB:
Amendments to IAS 7 Statements of Cash Flows In January 2016, the IASB issued amendments to IAS 7 to be applied prospectively for annual periods beginning on or after January 1, 2017 with early adoption permitted. The amendments require disclosure of information enabling users of financial statements to evaluate changes in liabilities arising from financing activities. The adoption of the IAS 7 amendments will require additional disclosure in the Company’s 2017 annual consolidated financial statements.
HUSKY ENERGY INC. | Q2 | CONDENSED INTERIM CONSOLIDATED FINANCIAL STATEMENTS | 11
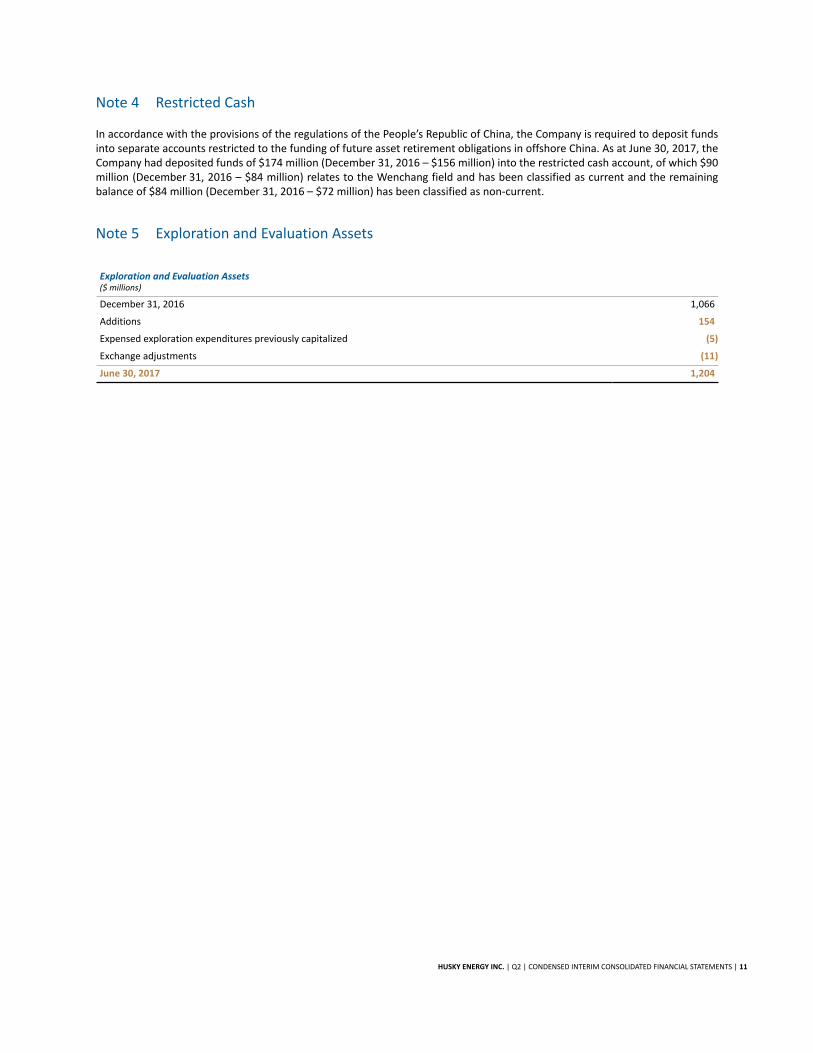
Note 4 Restricted Cash
In accordance with the provisions of the regulations of the People’s Republic of China, the Company is required to deposit funds into separate accounts restricted to the funding of future asset retirement obligations in offshore China. As at June 30, 2017, the Company had deposited funds of $174 million (December 31, 2016 – $156 million) into the restricted cash account, of which $90 million (December 31, 2016 – $84 million) relates to the Wenchang field and has been classified as current and the remaining balance of $84 million (December 31, 2016 – $72 million) has been classified as non-current.
Note 5 Exploration and Evaluation Assets
Exploration and Evaluation Assets($ millions)
December 31, 2016 1,066
Additions 154
Expensed exploration expenditures previously capitalized (5)
Exchange adjustments (11)
June 30, 2017 1,204
HUSKY ENERGY INC. | Q2 | CONDENSED INTERIM CONSOLIDATED FINANCIAL STATEMENTS | 12
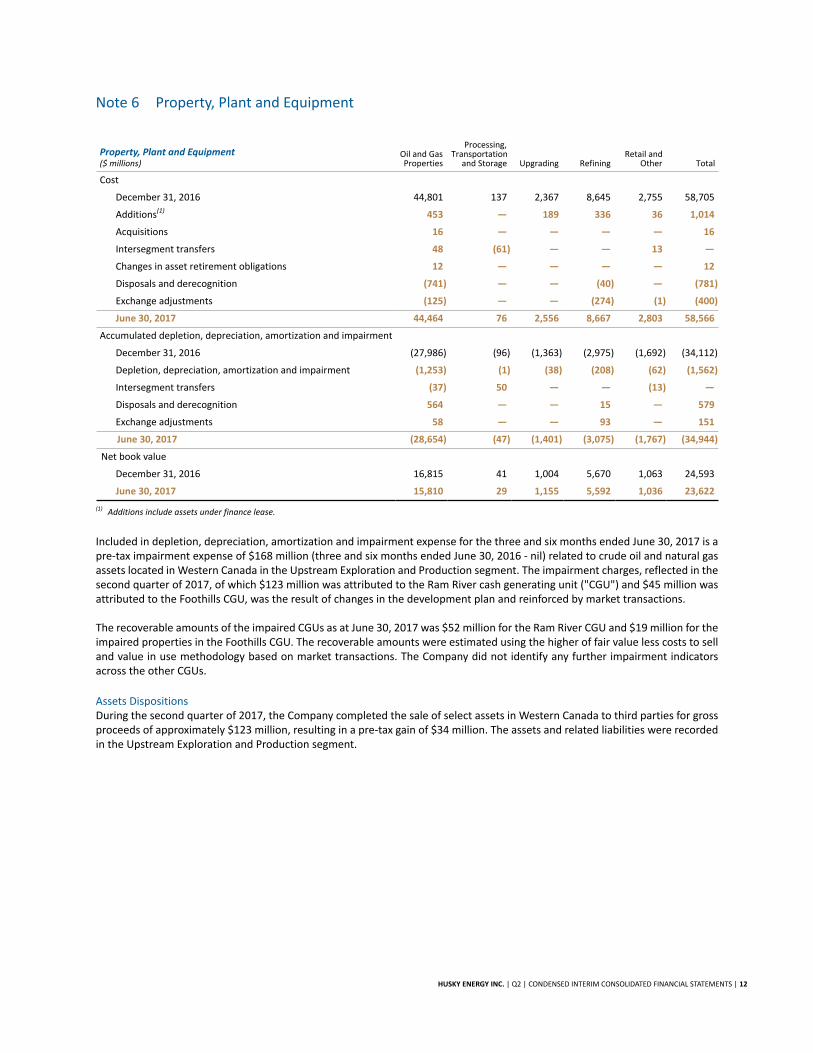
Note 6 Property, Plant and Equipment
Property, Plant and Equipment($ millions)
Oil and GasProperties
Processing,Transportation
and Storage Upgrading RefiningRetail and
Other Total
Cost
December 31, 2016 44,801 137 2,367 8,645 2,755 58,705
Additions(1) 453 — 189 336 36 1,014
Acquisitions 16 — — — — 16
Intersegment transfers 48 (61) — — 13 —
Changes in asset retirement obligations 12 — — — — 12
Disposals and derecognition (741) — — (40) — (781)
Exchange adjustments (125) — — (274) (1) (400)
June 30, 2017 44,464 76 2,556 8,667 2,803 58,566
Accumulated depletion, depreciation, amortization and impairment
December 31, 2016 (27,986) (96) (1,363) (2,975) (1,692) (34,112)
Depletion, depreciation, amortization and impairment (1,253) (1) (38) (208) (62) (1,562)
Intersegment transfers (37) 50 — — (13) —
Disposals and derecognition 564 — — 15 — 579
Exchange adjustments 58 — — 93 — 151
June 30, 2017 (28,654) (47) (1,401) (3,075) (1,767) (34,944)
Net book value
December 31, 2016 16,815 41 1,004 5,670 1,063 24,593
June 30, 2017 15,810 29 1,155 5,592 1,036 23,622
(1) Additions include assets under finance lease.
Included in depletion, depreciation, amortization and impairment expense for the three and six months ended June 30, 2017 is a pre-tax impairment expense of $168 million (three and six months ended June 30, 2016 - nil) related to crude oil and natural gas assets located in Western Canada in the Upstream Exploration and Production segment. The impairment charges, reflected in the second quarter of 2017, of which $123 million was attributed to the Ram River cash generating unit ("CGU") and $45 million was attributed to the Foothills CGU, was the result of changes in the development plan and reinforced by market transactions.
The recoverable amounts of the impaired CGUs as at June 30, 2017 was $52 million for the Ram River CGU and $19 million for the impaired properties in the Foothills CGU. The recoverable amounts were estimated using the higher of fair value less costs to sell and value in use methodology based on market transactions. The Company did not identify any further impairment indicators across the other CGUs.
Assets DispositionsDuring the second quarter of 2017, the Company completed the sale of select assets in Western Canada to third parties for gross proceeds of approximately $123 million, resulting in a pre-tax gain of $34 million. The assets and related liabilities were recorded in the Upstream Exploration and Production segment.
HUSKY ENERGY INC. | Q2 | CONDENSED INTERIM CONSOLIDATED FINANCIAL STATEMENTS | 13
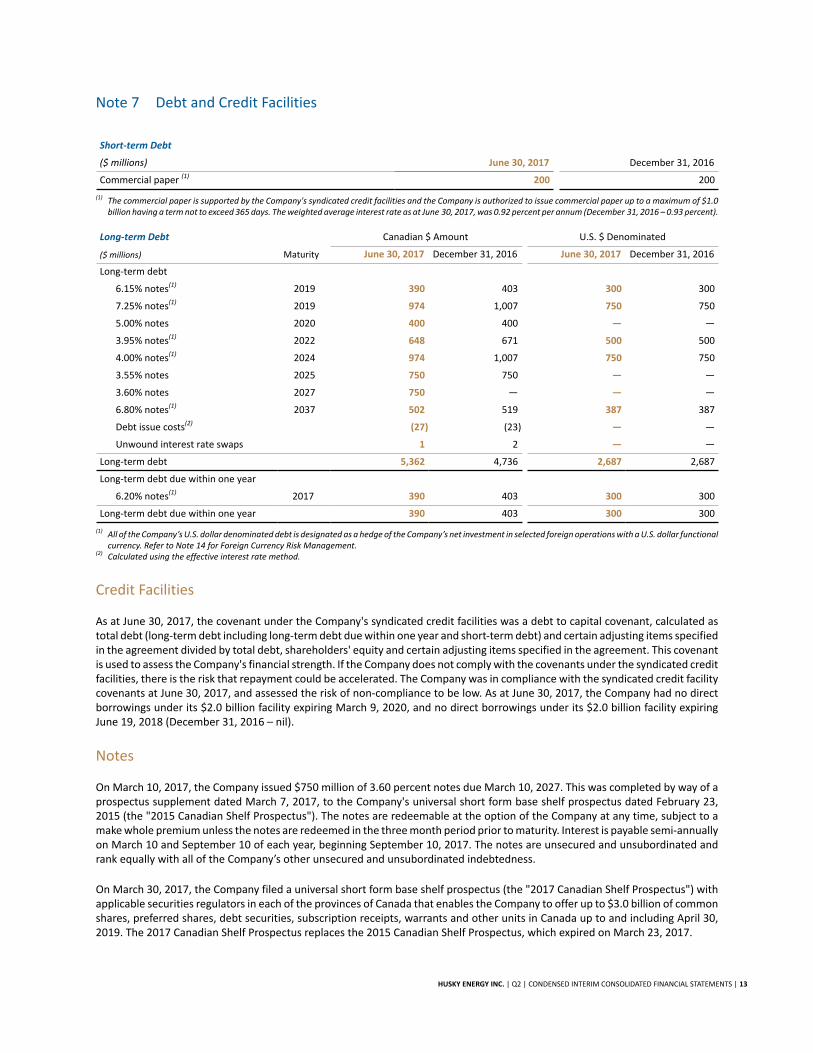
Note 7 Debt and Credit Facilities
Short-term Debt
($ millions) June 30, 2017 December 31, 2016
Commercial paper (1) 200 200
(1) The commercial paper is supported by the Company's syndicated credit facilities and the Company is authorized to issue commercial paper up to a maximum of $1.0 billion having a term not to exceed 365 days. The weighted average interest rate as at June 30, 2017, was 0.92 percent per annum (December 31, 2016 – 0.93 percent).
Long-term Debt Canadian $ Amount U.S. $ Denominated
($ millions) Maturity June 30, 2017 December 31, 2016 June 30, 2017 December 31, 2016
Long-term debt
6.15% notes(1) 2019 390 403 300 300
7.25% notes(1) 2019 974 1,007 750 750
5.00% notes 2020 400 400 — —
3.95% notes(1) 2022 648 671 500 500
4.00% notes(1) 2024 974 1,007 750 750
3.55% notes 2025 750 750 — —
3.60% notes 2027 750 — — —
6.80% notes(1) 2037 502 519 387 387
Debt issue costs(2) (27) (23) — —
Unwound interest rate swaps 1 2 — —
Long-term debt 5,362 4,736 2,687 2,687
Long-term debt due within one year
6.20% notes(1) 2017 390 403 300 300
Long-term debt due within one year 390 403 300 300
(1) All of the Company’s U.S. dollar denominated debt is designated as a hedge of the Company’s net investment in selected foreign operations with a U.S. dollar functional currency. Refer to Note 14 for Foreign Currency Risk Management.
(2) Calculated using the effective interest rate method.
Credit Facilities
As at June 30, 2017, the covenant under the Company's syndicated credit facilities was a debt to capital covenant, calculated as total debt (long-term debt including long-term debt due within one year and short-term debt) and certain adjusting items specified in the agreement divided by total debt, shareholders' equity and certain adjusting items specified in the agreement. This covenant is used to assess the Company's financial strength. If the Company does not comply with the covenants under the syndicated credit facilities, there is the risk that repayment could be accelerated. The Company was in compliance with the syndicated credit facility covenants at June 30, 2017, and assessed the risk of non-compliance to be low. As at June 30, 2017, the Company had no direct borrowings under its $2.0 billion facility expiring March 9, 2020, and no direct borrowings under its $2.0 billion facility expiring June 19, 2018 (December 31, 2016 – nil).
Notes
On March 10, 2017, the Company issued $750 million of 3.60 percent notes due March 10, 2027. This was completed by way of a prospectus supplement dated March 7, 2017, to the Company's universal short form base shelf prospectus dated February 23, 2015 (the "2015 Canadian Shelf Prospectus"). The notes are redeemable at the option of the Company at any time, subject to a make whole premium unless the notes are redeemed in the three month period prior to maturity. Interest is payable semi-annually on March 10 and September 10 of each year, beginning September 10, 2017. The notes are unsecured and unsubordinated and rank equally with all of the Company’s other unsecured and unsubordinated indebtedness.
On March 30, 2017, the Company filed a universal short form base shelf prospectus (the "2017 Canadian Shelf Prospectus") with applicable securities regulators in each of the provinces of Canada that enables the Company to offer up to $3.0 billion of common shares, preferred shares, debt securities, subscription receipts, warrants and other units in Canada up to and including April 30, 2019. The 2017 Canadian Shelf Prospectus replaces the 2015 Canadian Shelf Prospectus, which expired on March 23, 2017.
HUSKY ENERGY INC. | Q2 | CONDENSED INTERIM CONSOLIDATED FINANCIAL STATEMENTS | 14
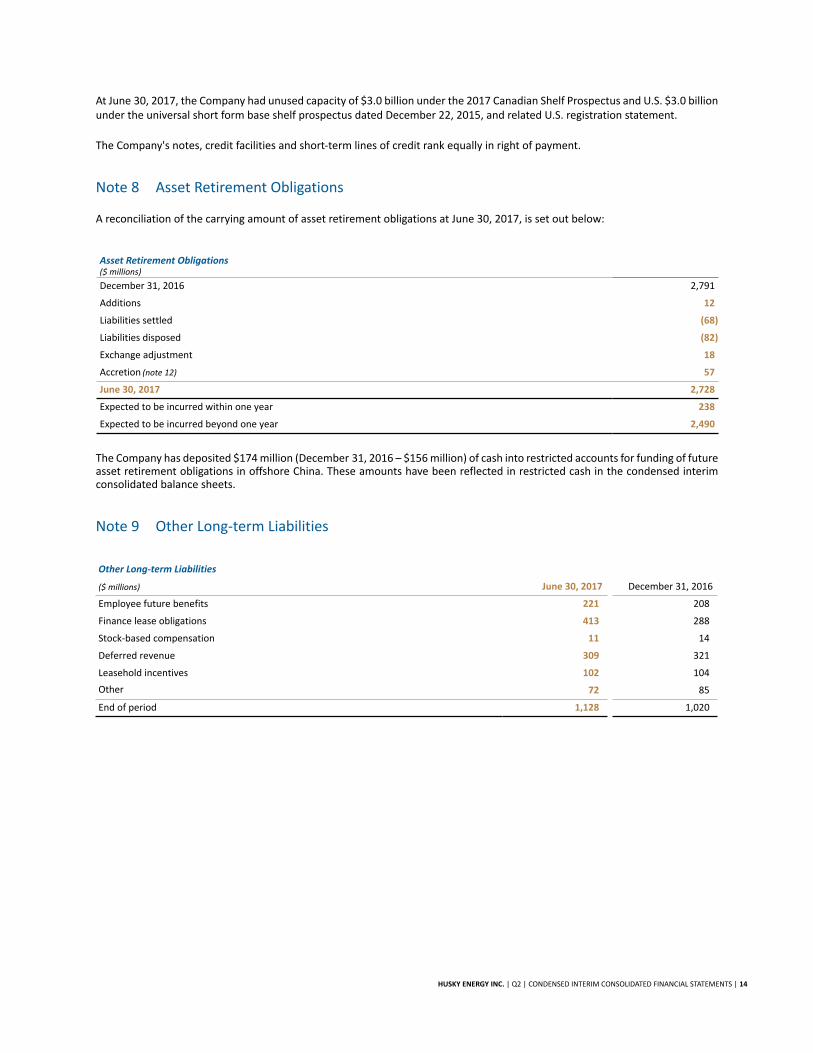
At June 30, 2017, the Company had unused capacity of $3.0 billion under the 2017 Canadian Shelf Prospectus and U.S. $3.0 billionunder the universal short form base shelf prospectus dated December 22, 2015, and related U.S. registration statement.
The Company's notes, credit facilities and short-term lines of credit rank equally in right of payment.
Note 8 Asset Retirement Obligations
A reconciliation of the carrying amount of asset retirement obligations at June 30, 2017, is set out below:
Asset Retirement Obligations($ millions)
December 31, 2016 2,791
Additions 12
Liabilities settled (68)
Liabilities disposed (82)
Exchange adjustment 18
Accretion (note 12) 57
June 30, 2017 2,728
Expected to be incurred within one year 238
Expected to be incurred beyond one year 2,490
The Company has deposited $174 million (December 31, 2016 – $156 million) of cash into restricted accounts for funding of future asset retirement obligations in offshore China. These amounts have been reflected in restricted cash in the condensed interim consolidated balance sheets.
Note 9 Other Long-term Liabilities
Other Long-term Liabilities
($ millions) June 30, 2017 December 31, 2016
Employee future benefits 221 208
Finance lease obligations 413 288
Stock-based compensation 11 14
Deferred revenue 309 321
Leasehold incentives 102 104
Other 72 85
End of period 1,128 1,020
HUSKY ENERGY INC. | Q2 | CONDENSED INTERIM CONSOLIDATED FINANCIAL STATEMENTS | 15
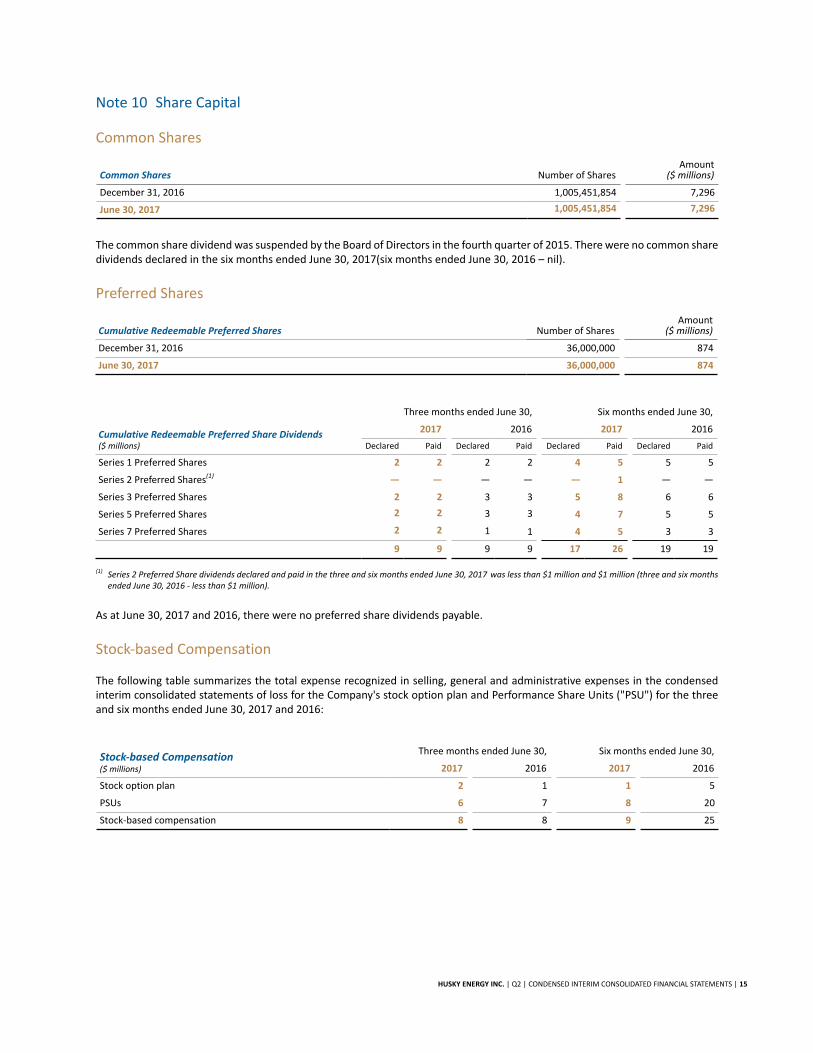
Note 10 Share Capital
Common Shares
Common Shares Number of SharesAmount
($ millions)
December 31, 2016 1,005,451,854 7,296
June 30, 2017 1,005,451,854 7,296
The common share dividend was suspended by the Board of Directors in the fourth quarter of 2015. There were no common share dividends declared in the six months ended June 30, 2017(six months ended June 30, 2016 – nil).
Preferred Shares
Cumulative Redeemable Preferred Shares Number of SharesAmount
($ millions)
December 31, 2016 36,000,000 874
June 30, 2017 36,000,000 874
Cumulative Redeemable Preferred Share Dividends($ millions)
Three months ended June 30, Six months ended June 30,
2017 2016 2017 2016
Declared Paid Declared Paid Declared Paid Declared Paid
Series 1 Preferred Shares 2 2 2 2 4 5 5 5
Series 2 Preferred Shares(1) — — — — — 1 — —
Series 3 Preferred Shares 2 2 3 3 5 8 6 6
Series 5 Preferred Shares 2 2 3 3 4 7 5 5
Series 7 Preferred Shares 2 2 1 1 4 5 3 3
9 9 9 9 17 26 19 19
(1) Series 2 Preferred Share dividends declared and paid in the three and six months ended June 30, 2017 was less than $1 million and $1 million (three and six months ended June 30, 2016 - less than $1 million).
As at June 30, 2017 and 2016, there were no preferred share dividends payable.
Stock-based Compensation
The following table summarizes the total expense recognized in selling, general and administrative expenses in the condensed interim consolidated statements of loss for the Company's stock option plan and Performance Share Units ("PSU") for the three and six months ended June 30, 2017 and 2016:
Stock-based Compensation($ millions)
Three months ended June 30, Six months ended June 30,
2017 2016 2017 2016
Stock option plan 2 1 1 5
PSUs 6 7 8 20
Stock-based compensation 8 8 9 25
HUSKY ENERGY INC. | Q2 | CONDENSED INTERIM CONSOLIDATED FINANCIAL STATEMENTS | 16
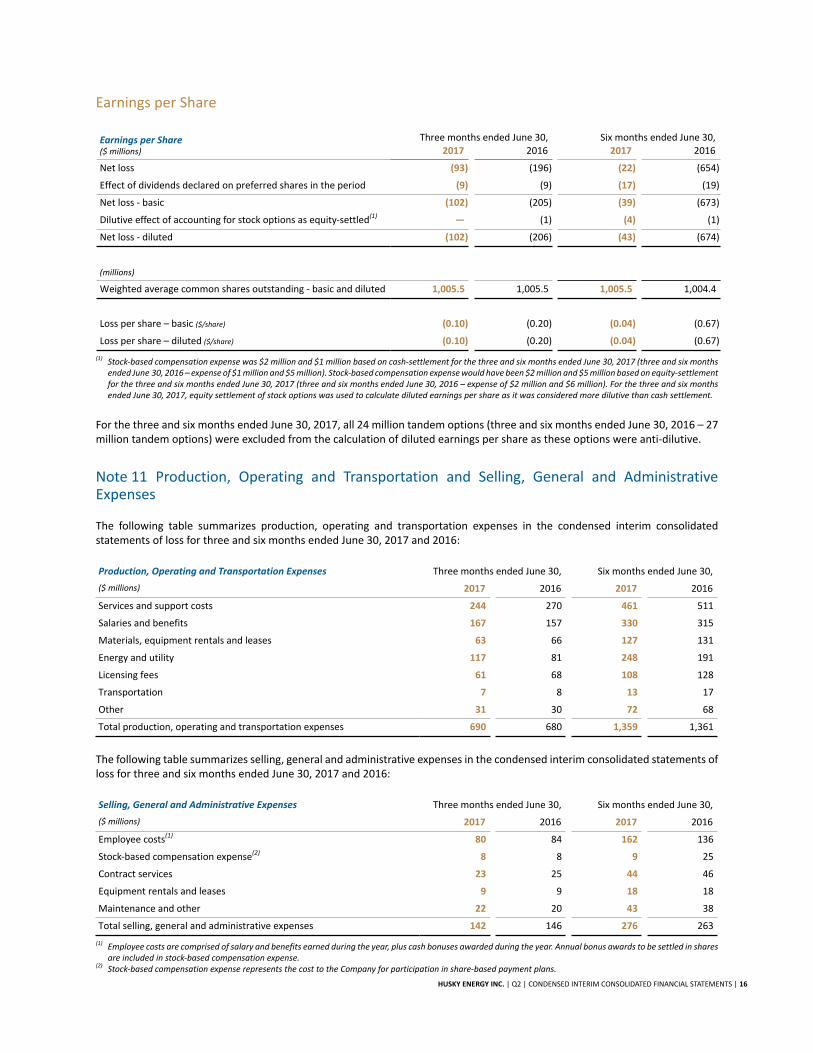
Earnings per Share
Earnings per Share($ millions)
Three months ended June 30, Six months ended June 30,2017 2016 2017 2016
Net loss (93) (196) (22) (654)
Effect of dividends declared on preferred shares in the period (9) (9) (17) (19)
Net loss - basic (102) (205) (39) (673)
Dilutive effect of accounting for stock options as equity-settled(1) — (1) (4) (1)
Net loss - diluted (102) (206) (43) (674)
(millions)
Weighted average common shares outstanding - basic and diluted 1,005.5 1,005.5 1,005.5 1,004.4
Loss per share – basic ($/share) (0.10) (0.20) (0.04) (0.67)
Loss per share – diluted ($/share) (0.10) (0.20) (0.04) (0.67)
(1) Stock-based compensation expense was $2 million and $1 million based on cash-settlement for the three and six months ended June 30, 2017 (three and six months ended June 30, 2016 – expense of $1 million and $5 million). Stock-based compensation expense would have been $2 million and $5 million based on equity-settlement for the three and six months ended June 30, 2017 (three and six months ended June 30, 2016 – expense of $2 million and $6 million). For the three and six months ended June 30, 2017, equity settlement of stock options was used to calculate diluted earnings per share as it was considered more dilutive than cash settlement.
For the three and six months ended June 30, 2017, all 24 million tandem options (three and six months ended June 30, 2016 – 27 million tandem options) were excluded from the calculation of diluted earnings per share as these options were anti-dilutive.
Note 11 Production, Operating and Transportation and Selling, General and Administrative Expenses
The following table summarizes production, operating and transportation expenses in the condensed interim consolidated statements of loss for three and six months ended June 30, 2017 and 2016:
Production, Operating and Transportation Expenses Three months ended June 30, Six months ended June 30,
($ millions) 2017 2016 2017 2016
Services and support costs 244 270 461 511
Salaries and benefits 167 157 330 315
Materials, equipment rentals and leases 63 66 127 131
Energy and utility 117 81 248 191
Licensing fees 61 68 108 128
Transportation 7 8 13 17
Other 31 30 72 68
Total production, operating and transportation expenses 690 680 1,359 1,361
The following table summarizes selling, general and administrative expenses in the condensed interim consolidated statements of loss for three and six months ended June 30, 2017 and 2016:
Selling, General and Administrative Expenses Three months ended June 30, Six months ended June 30,
($ millions) 2017 2016 2017 2016
Employee costs(1) 80 84 162 136
Stock-based compensation expense(2) 8 8 9 25
Contract services 23 25 44 46
Equipment rentals and leases 9 9 18 18
Maintenance and other 22 20 43 38
Total selling, general and administrative expenses 142 146 276 263
(1) Employee costs are comprised of salary and benefits earned during the year, plus cash bonuses awarded during the year. Annual bonus awards to be settled in shares are included in stock-based compensation expense.
(2) Stock-based compensation expense represents the cost to the Company for participation in share-based payment plans.
HUSKY ENERGY INC. | Q2 | CONDENSED INTERIM CONSOLIDATED FINANCIAL STATEMENTS | 17
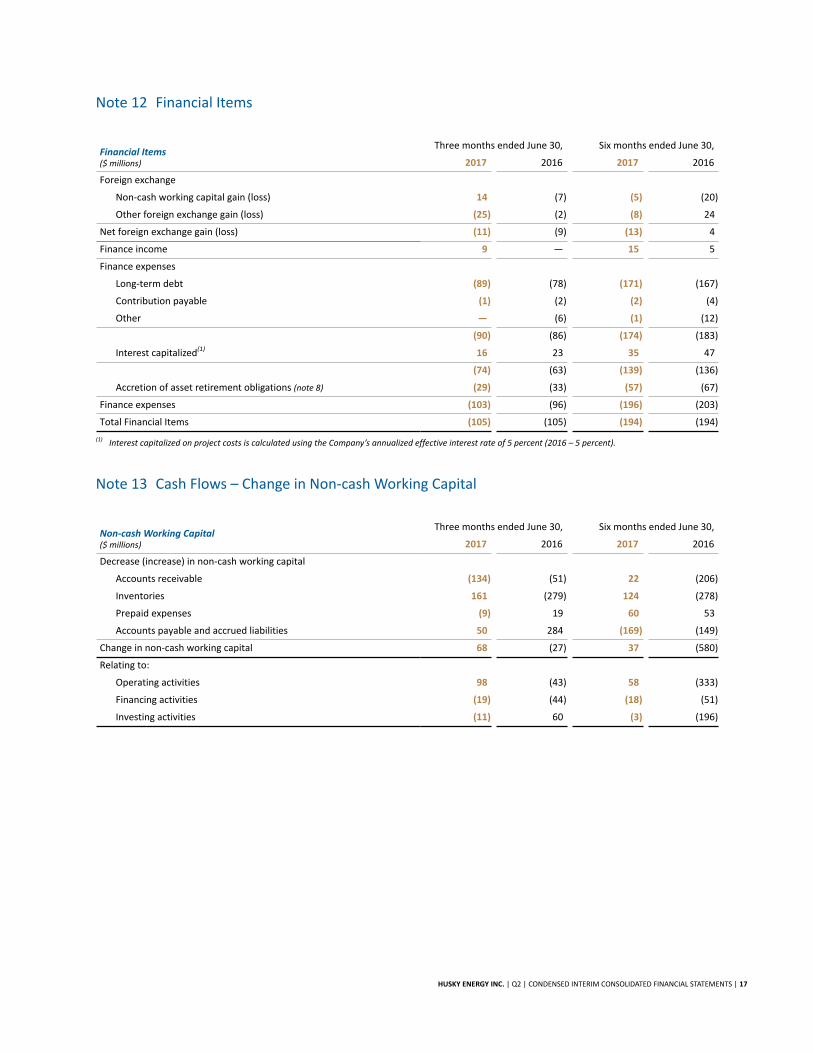
Note 12 Financial Items
Financial Items($ millions)
Three months ended June 30, Six months ended June 30,
2017 2016 2017 2016
Foreign exchange
Non-cash working capital gain (loss) 14 (7) (5) (20)
Other foreign exchange gain (loss) (25) (2) (8) 24
Net foreign exchange gain (loss) (11) (9) (13) 4
Finance income 9 — 15 5
Finance expenses
Long-term debt (89) (78) (171) (167)
Contribution payable (1) (2) (2) (4)
Other — (6) (1) (12)
(90) (86) (174) (183)
Interest capitalized(1) 16 23 35 47
(74) (63) (139) (136)
Accretion of asset retirement obligations (note 8) (29) (33) (57) (67)
Finance expenses (103) (96) (196) (203)
Total Financial Items (105) (105) (194) (194)
(1) Interest capitalized on project costs is calculated using the Company’s annualized effective interest rate of 5 percent (2016 – 5 percent).
Note 13 Cash Flows – Change in Non-cash Working Capital
Non-cash Working Capital($ millions)
Three months ended June 30, Six months ended June 30,
2017 2016 2017 2016
Decrease (increase) in non-cash working capital
Accounts receivable (134) (51) 22 (206)
Inventories 161 (279) 124 (278)
Prepaid expenses (9) 19 60 53
Accounts payable and accrued liabilities 50 284 (169) (149)
Change in non-cash working capital 68 (27) 37 (580)
Relating to:
Operating activities 98 (43) 58 (333)
Financing activities (19) (44) (18) (51)
Investing activities (11) 60 (3) (196)
HUSKY ENERGY INC. | Q2 | CONDENSED INTERIM CONSOLIDATED FINANCIAL STATEMENTS | 18
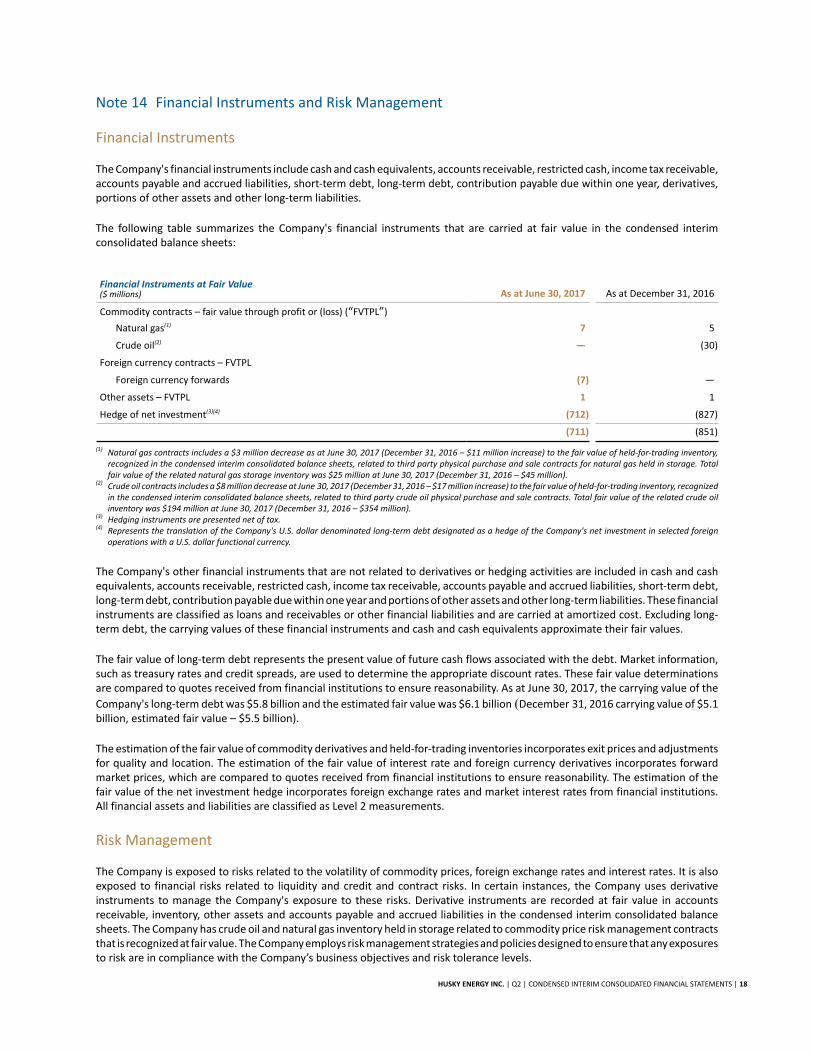
Note 14 Financial Instruments and Risk Management
Financial Instruments
The Company's financial instruments include cash and cash equivalents, accounts receivable, restricted cash, income tax receivable, accounts payable and accrued liabilities, short-term debt, long-term debt, contribution payable due within one year, derivatives, portions of other assets and other long-term liabilities.
The following table summarizes the Company's financial instruments that are carried at fair value in the condensed interim consolidated balance sheets:
Financial Instruments at Fair Value($ millions) As at June 30, 2017 As at December 31, 2016
Commodity contracts – fair value through profit or (loss) (“FVTPL”)
Natural gas(1) 7 5
Crude oil(2) — (30)
Foreign currency contracts – FVTPL
Foreign currency forwards (7) —
Other assets – FVTPL 1 1
Hedge of net investment(3)(4) (712) (827)
(711) (851)
(1) Natural gas contracts includes a $3 million decrease as at June 30, 2017 (December 31, 2016 – $11 million increase) to the fair value of held-for-trading inventory, recognized in the condensed interim consolidated balance sheets, related to third party physical purchase and sale contracts for natural gas held in storage. Total fair value of the related natural gas storage inventory was $25 million at June 30, 2017 (December 31, 2016 – $45 million).
(2) Crude oil contracts includes a $8 million decrease at June 30, 2017 (December 31, 2016 – $17 million increase) to the fair value of held-for-trading inventory, recognized in the condensed interim consolidated balance sheets, related to third party crude oil physical purchase and sale contracts. Total fair value of the related crude oil inventory was $194 million at June 30, 2017 (December 31, 2016 – $354 million).
(3) Hedging instruments are presented net of tax.(4) Represents the translation of the Company's U.S. dollar denominated long-term debt designated as a hedge of the Company's net investment in selected foreign
operations with a U.S. dollar functional currency.
The Company's other financial instruments that are not related to derivatives or hedging activities are included in cash and cash equivalents, accounts receivable, restricted cash, income tax receivable, accounts payable and accrued liabilities, short-term debt, long-term debt, contribution payable due within one year and portions of other assets and other long-term liabilities. These financial instruments are classified as loans and receivables or other financial liabilities and are carried at amortized cost. Excluding long-term debt, the carrying values of these financial instruments and cash and cash equivalents approximate their fair values.
The fair value of long-term debt represents the present value of future cash flows associated with the debt. Market information, such as treasury rates and credit spreads, are used to determine the appropriate discount rates. These fair value determinations are compared to quotes received from financial institutions to ensure reasonability. As at June 30, 2017, the carrying value of the
Company's long-term debt was $5.8 billion and the estimated fair value was $6.1 billion (December 31, 2016 carrying value of $5.1 billion, estimated fair value – $5.5 billion).
The estimation of the fair value of commodity derivatives and held-for-trading inventories incorporates exit prices and adjustments for quality and location. The estimation of the fair value of interest rate and foreign currency derivatives incorporates forward market prices, which are compared to quotes received from financial institutions to ensure reasonability. The estimation of the fair value of the net investment hedge incorporates foreign exchange rates and market interest rates from financial institutions. All financial assets and liabilities are classified as Level 2 measurements.
Risk Management
The Company is exposed to risks related to the volatility of commodity prices, foreign exchange rates and interest rates. It is also exposed to financial risks related to liquidity and credit and contract risks. In certain instances, the Company uses derivative instruments to manage the Company's exposure to these risks. Derivative instruments are recorded at fair value in accounts receivable, inventory, other assets and accounts payable and accrued liabilities in the condensed interim consolidated balance sheets. The Company has crude oil and natural gas inventory held in storage related to commodity price risk management contracts that is recognized at fair value. The Company employs risk management strategies and policies designed to ensure that any exposures to risk are in compliance with the Company’s business objectives and risk tolerance levels.
HUSKY ENERGY INC. | Q2 | CONDENSED INTERIM CONSOLIDATED FINANCIAL STATEMENTS | 19
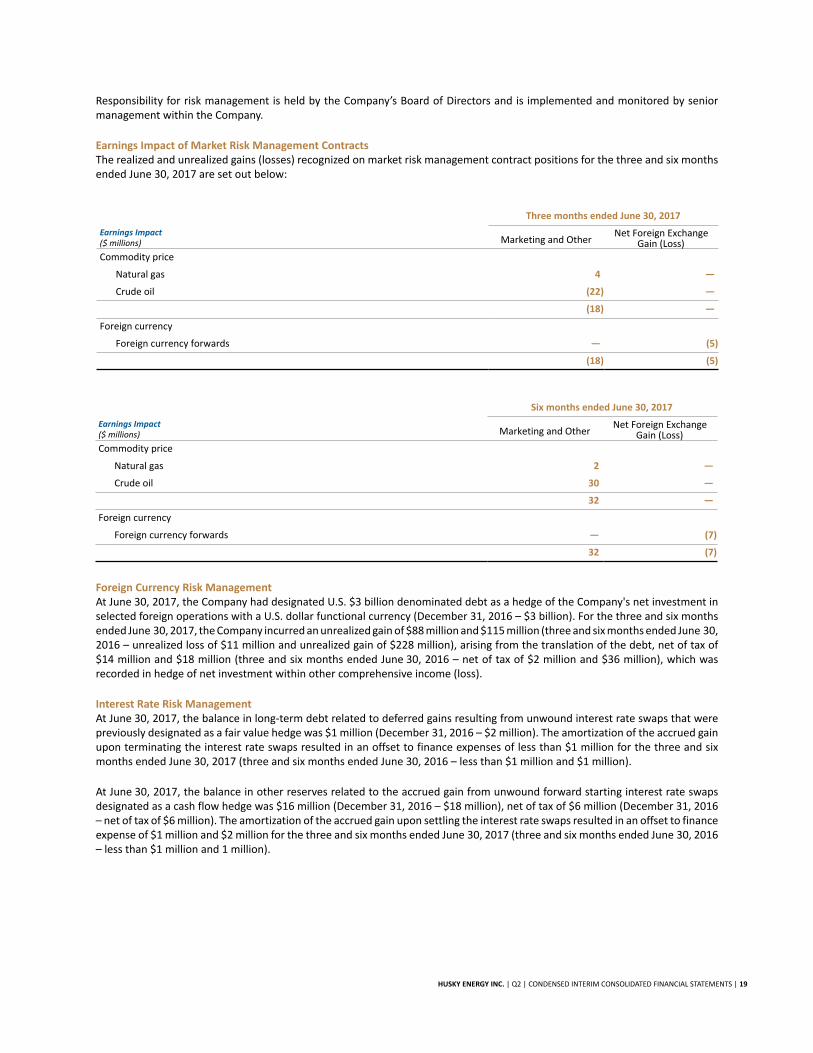
Responsibility for risk management is held by the Company’s Board of Directors and is implemented and monitored by senior management within the Company.
Earnings Impact of Market Risk Management ContractsThe realized and unrealized gains (losses) recognized on market risk management contract positions for the three and six months ended June 30, 2017 are set out below:
Three months ended June 30, 2017
Earnings Impact($ millions) Marketing and Other
Net Foreign ExchangeGain (Loss)
Commodity price
Natural gas 4 —
Crude oil (22) —
(18) —
Foreign currency
Foreign currency forwards — (5)
(18) (5)
Six months ended June 30, 2017
Earnings Impact($ millions) Marketing and Other
Net Foreign ExchangeGain (Loss)
Commodity price
Natural gas 2 —
Crude oil 30 —
32 —
Foreign currency
Foreign currency forwards — (7)
32 (7)
Foreign Currency Risk Management At June 30, 2017, the Company had designated U.S. $3 billion denominated debt as a hedge of the Company's net investment in selected foreign operations with a U.S. dollar functional currency (December 31, 2016 – $3 billion). For the three and six months ended June 30, 2017, the Company incurred an unrealized gain of $88 million and $115 million (three and six months ended June 30, 2016 – unrealized loss of $11 million and unrealized gain of $228 million), arising from the translation of the debt, net of tax of $14 million and $18 million (three and six months ended June 30, 2016 – net of tax of $2 million and $36 million), which was recorded in hedge of net investment within other comprehensive income (loss).
Interest Rate Risk Management At June 30, 2017, the balance in long-term debt related to deferred gains resulting from unwound interest rate swaps that were previously designated as a fair value hedge was $1 million (December 31, 2016 – $2 million). The amortization of the accrued gain upon terminating the interest rate swaps resulted in an offset to finance expenses of less than $1 million for the three and six months ended June 30, 2017 (three and six months ended June 30, 2016 – less than $1 million and $1 million).
At June 30, 2017, the balance in other reserves related to the accrued gain from unwound forward starting interest rate swaps designated as a cash flow hedge was $16 million (December 31, 2016 – $18 million), net of tax of $6 million (December 31, 2016– net of tax of $6 million). The amortization of the accrued gain upon settling the interest rate swaps resulted in an offset to finance expense of $1 million and $2 million for the three and six months ended June 30, 2017 (three and six months ended June 30, 2016– less than $1 million and 1 million).