Embed Size (px)
Citation preview

Hurstville City Council Fit For The Future Submission 1
TRIM Ref D15/53837
Template 2
Hurstville City Council Improvement Proposal
Hurstville City Council Fit For The Future Submission 2
Getting started . . .
Before you commence this template, please check the following:
• You have chosen the correct template – only councils that have sufficient scale and capacity and who do not intend to merge or become a Rural Council should complete this template (Template 2)
• You have obtained a copy of the guidance material for Template 2 and instructions for completing each question
• You have completed the self-assessment of your current performance, using the tool provided
• You have completed any supporting material and prepared attachments for your Proposal as PDF
documents. Please limit the number of attachments and ensure they are directly relevant to your proposal. Specific references to the relevant page and/or paragraph in the attachments should also be included.
• Your Proposal has been endorsed by a resolution of your Council.
Hurstville City Council Fit For The Future Submission 3
Council name: Hurstville City Council Date of Council resolution endorsing this submission: 22 June 2015
1.1 Executive Summary
Provide a summary (up to 500 words) of the key points of your Proposal including current performance, the
issues facing your council and your planned improvement strategies and outcomes.
It is with a sense of pride and satisfaction that Hurstville City Council takes this opportunity afforded by the NSW Government to
demonstrate to the Independent Pricing and Regulatory Tribunal (IPART) its fitness for the future as an independent Local
Government Authority.
The Fit for the Future (FFTF) initiative, including the methodology, templates and self-assessment tools have proven invaluable in
focusing Council’s attention on quantifiable measures of financial sustainability and the scale & capacity outcomes which are being
delivered through innovation and collaboration. We have proven to ourselves, and now endeavour to convince our audience, that
Councils do not have to be big to be strong and smart.
An essential prerequisite for any public authority is its probity and integrity. The Office of Local Government (OLG) undertook a
review of Hurstville practices and stated, “Overall, the review team finds that Hurstville City Council is a well-managed and efficient
local government authority”. It goes onto say, “Council appears to have a good track record in working with its diverse community to
plan and deliver services. A clear vision has been set1.”. In conclusion the report states “Hurstville City Council has had an
overarching plan to become an Employer of Choice and effectively manage its employees since 2007. Its workforce is diverse and
appears to be representative of the broader community it serves.” There were 15 areas where the OLG identified Council as
“exceeding good practice”. Council appears to take a strategic and integrated approach to managing its finances and assets.
Overall, the review team observed staff members to be enthusiastic, dedicated and skilled in their area of expertise. The key
findings stated that Council operates professionally and has demonstrated a number of areas where it is considered ‘best practice’
in the industry including the Community Strategic Plan 2021, Lead for Success Program and its Customer Service Charter.
1

Hurstville City Council Fit For The Future Submission 4
As long term residents of the region Council’s elected body have a wealth of knowledge, first-hand experience and detailed understanding of the aspirations of our community. This knowledge, experience and understanding has enabled the elected body to translate the community’s needs and desires into a reality through careful foresight and strategic planning. Council has accepted the challenge to produce an environment which is highly robust and supportive of a growing community.
Council’s vision is for Hurstville to be recognised as a centre of sub-regional standing in the broader city metropolitan area. In this regard, Council recognises the unique location characteristics of the Hurstville City Centre adjoining two major arterial roads and two public railway lines and being well serviced by public bus transport.
Council’s strategic commitment is to develop the Hurstville City Centre as its primary commercial, retail and high density residential centre surrounded by a suburban residential housing environment with local centres and activities established within walking distance of each of the nine railway stations which service the LGA.
Council’s participation in the State Government’s Sub-Regional Planning Process, contribution to other State Government agency forums setting a direction for the southern region of Sydney and other close associations with adjoining St George Councils enables to best contribute to and be informed on major strategic planning initiatives for the future. This is evidenced by the strategic planning approach taken in conducting major studies on future development of the LGA and its relationships with other adjoining LGA’s.
For example, Council’s Employment Lands Study is specifically designed to ensure important employment centres and capacities are achieved as the local population grows as well as permitting redevelopment of its local centres eg Beverly Hills, Penshurst and Mortdale into vibrant commercial, retail, and housing places.
Council has also recently adopted a comprehensive Local Environmental Plan which sets the basis for consideration of future planning proposals and along with the work carried out over several years for the City Centre will ensure Hurstville’s development as a significant strategic centre in the future.
Council’s emphasis in planning for the future also extends to fostering excellence in the design of its urban spaces. As a major participant in promoting design excellence Council’s involvement in the St George Urban Design Review Panel is a clear demonstration of its commitment to improving the liveability and creativity in development.

Hurstville City Council Fit For The Future Submission 5
Having established our governance and strategic planning credentials, Hurstville’s initial FFTF assessment based on financial
performance through 2013/14 showed Council met four of the seven benchmark criteria. Two were very close to target (Operating
Performance Ratio and Asset Maintenance Ratio). Only the Building and Infrastructure Renewal Ratio (BIRR) indicated a
significant gap (52%), which was not unplanned after an extended period of new facilities creation in cooperation with the State (eg- new $30 million Bus/Rail interchange with disabled access ramp, $15 million regional Aquatic Leisure Centre expansions, new $5
million Community Centre with LIRS loan-subsidy).
Council’s improvement plan is its 2015-2019 Delivery Program which has been developed in response to the Community Strategic
Plan 2025 (Attachment 1). A conscious decision to apply a greater proportion of Capital Expenditure to renewal rather than new
assets will see the BIRR increase to 83% in 2014/15. In addition, the implementation of the $25 per property Stormwater Drainage
Charge in 2015/16 will bring the BIRR up to 111%. In fact, our Long-Term Financial Forecast which has been verified by our
external auditors Hill Rogers Spencer Steer (Attachment 2) meets or exceeds all seven benchmarks in every one of the next ten
years. This has been achieved in one of the lowest per capita taxing/spending Local Government Areas in NSW, as indicated in
the following graph provided by SGS Economics:
1

Hurstville City Council Fit For The Future Submission 6
This position is not surprising given that since the introduction of rate pegging in 1977 Council determined on eight separate occasions not to pass on the permissible rate increase. This represents a compound loss of rate income of over 15% per annum equivalent in 2015 to $5.2M pa. The value of this forgone revenue remains with our community.
In 2006/7 Council was granted a 6.3% Special Rate Variation for its Infrastructure Plus program for 15 years. These funds, totaling $2.1M pa in 2015, are dedicated to capital expenditure on roads, footpaths, parks, buildings and town centres. There will no doubt be public support for the extension of this program and SRV as the community feedback has been nothing but positive since works have hit the ground.
Meanwhile, responsibility for the delivery of services and provision of facilities has been transferred from other tiers of government to local councils without the provision of adequate funding. According to the LGNSW Cost Shifting Survey, Hurstville City Council has quantified the impact of this funding gap to be $6.7 million per year, over 10% of our annual operating income.
The economic pressure outside of Council’s control further mounts with the Federal Government’s freezing of the Financial Assistance Grant for three years. For Hurstville City Council, the cumulative effect of lost CPI-indexation amounts to a grant shortfall of $367,000 from 2014/15 through 2016/17.
It would not be possible to achieve sustainable financial results in a political environment of rate pegging, cost shifting, grant capping and increasing public demand for services if Hurstville were not delivering the types of Scale & Capacity outcomes being sought from FFTF Councils. We will provide compelling examples against each of the ten Key Elements of Strategic Capacity enumerated in Box 3.1 of IPART Methodology for Assessment of Council Fit for the Future Proposals. For instance, Hurstville spearheaded a regional waste contract on behalf of the three St George Councils which saved $12.2 million over 8 years (a 35% reduction) which was passed on to ratepayers by way of an on-going $60 annual per household decrease in their domestic waste levy. Our methodology was awarded and emulated in Australia and overseas. For this and a host of other initiatives, it is not surprising that 82% of Hurstville residents indicated their satisfaction with Council in our latest Community Strategic Plan survey conducted by Woolcott Research.

Hurstville City Council Fit For The Future Submission 7
The Independent Local Government Review Panel recommended Hurstville amalgamate with Kogarah, Rockdale and Canterbury
Councils or alternatively with only Kogarah and Rockdale. In the absence of a business case for these recommendations against
which to compare ourselves and the lack of consensus amongst our neighbouring Councils to jointly explore merger options,
Hurstville engaged SGS Economics to assist us in quantifying the sustainability gaps and potential synergies for a range of
scenarios.
3 3
18 19
5760
95
6 83
24 11
Residents Phone 2010
(n=400)
Residents Phone 2014
(n=400)
Don’t know
Extremely dissatisfied
Very dissatisfied
Quite dissatisfied
Neither satisfied or
dissatisfied
Quite satisfied
Very satisfied
Extremely satisfied
78% 82%
1

Hurstville City Council Fit For The Future Submission 8
Based on SGS findings, only a merged Hurstville and Kogarah option has the potential of delivering positive economic benefits for our residents and businesses. From our own experience with Core Service Reviews over the years, it is worth noting that delivering cost savings through services and facilities rationalisation is extraordinarily difficult to achieve. The potential benefits which have been optimistically identified should not be taken as given, since pressure from special interest groups to retain the
$-
$85
$332
$540
$263
$-
$97
$182
$99
-$73
$- $- $10.5 $19.5 $10.5
-$100
$-
$100
$200
$300
$400
$500
$600
Hurstville Hurstville +
Kogarah
Hurstville +
Kogarah +
Rockdale
Hurstville +
Kogarah +
Rockdale +
Canterbury
Hurstville +
Canterbury
Mil
lio
ns
Amalgamation Scenarios Over 10 Years
Funding Gap
Synergy
FFTF Grant

Hurstville City Council Fit For The Future Submission 9
status quo will be great. In any event, combining Hurstville and Kogarah would fall far short of the 250,000 population critical mass
described in FFTF documentation and neither Council has resolved to explore this option.
To increase the awareness of our residents and businesses as well as gauge their feedback to FFTF amalgamation options,
Council undertook an extensive communication and survey process over recent months (Attachment 3). Apart from financial
considerations, a key factor in people’s minds was a cohesive community of interest. The demographics of the Local Government
Areas under review are widely diverse. For example, ethnicity is similar between Hurstville and Kogarah but significantly different
than Rockdale and Canterbury, as per this information provided by Profile ID:
We received an enormous response to the “Proposed Council Amalgamation” survey, with 5073 replies representing over 16% of
ratepayers. There was an overwhelming preference (64%) expressed for Hurstville to remain independent.
0%
5%
10%
15%
20%
25%
30%
UK Chinese Australian Greek Italian Lebanese
Hurstville Kogarah Rockdale Canterbury
1

Hurstville City Council Fit For The Future Submission 10
H = Hurstville K = Kogarah R = Rockdale C = Canterbury
H Standalone
63.7%
H + K + R
14.4%
H + K
14.2%
H + K + R + C
4.8%
H + C
1.0%
Invalid
2.0%
FFTF Hurstville Community Feedback (N=5073)

Hurstville City Council Fit For The Future Submission 11
Thus Council, having weighed up Hurstville’s:
Underlying financial sustainability,
Proven track record of delivering scale & capacity outcomes,
Absence of superior amalgamation recommendation(s) business case, and
Overwhelming community preference for remaining independent,
resolved to submit a Council Improvement Proposal (Existing Structure) to the Office of Local Government in response to the FFTF
program.
1.2 Scale and Capacity
Does your council have the scale and capacity broadly consistent with the recommendations of the Independent Local Government Review Panel (ie, the Panel did not recommend your council needed to merge or become a Rural Council) ?
Yes/No
If No, please indicate why you are not proceeding with a voluntary merger or creation of a Rural Council as recommended by the Independent Panel and demonstrate how your council has scale and capacity (up to 500 words).
Hurstville City Council is not proceeding with a voluntary merger as recommended by the Independent Panel for the following reasons:
1. No business case has been presented by the Independent Panel to justify either of the recommended amalgamation options, ie – St George (Hurstville + Kogarah + Rockdale) or St George + Canterbury
2. There has been no consensus between our and contiguous Councils to collaboratively explore merger options
1

Hurstville City Council Fit For The Future Submission 12
3. An independent economic assessment commissioned by Hurstville to quantify the sustainability gaps and potential synergies of various merger options has been unable to demonstrate nett benefits for our residents and businesses
4. Hurstville meets all FFTF financial sustainability benchmarks 5. Hurstville have a long track record of delivering FFTF Scale & Capacity outcomes against each of the ten Key Elements of
Strategic Capacity (Attachment 4) 6. After an extensive education and feedback process, our community overwhelmingly supports Hurstville remaining
independent. We have also taken into account a growing body of evidence which challenges the rationale and methodology employed by the Independent Panel in arriving at its recommended amalgamation options, eg – Review of TCorp’s Report ‘Financial Sustainability of the NSW Local Government Sector’ (Final Report 3 October 2014, John Comrie), Smoke and Mirrors: Fallacies in the NSW Government’s View on Local Government Financial Capacity (Peter Abelson and Roselyne Joyeux). However, we have not relied upon this argumentation to justify our Standalone position. Rather, we have demonstrated that Hurstville City Council is genuinely “fit for the future” in its own right through application of the NSW Office of Local Government’s Integrated Planning & Reporting framework and financial key performance indicators.
2. Your council’s current position
2.1 About your local government area Explain the key characteristics of your local government area, your community’s goals and priorities and the challenges you face in the future (up to 500 words). You should reference your Community Strategic Plan and any relevant demographic data for this section.
City Profile
The City of Hurstville is located 15 kilometres south of the Sydney CBD and is one of the major regional centres within the Sydney metropolitan region. Hurstville was proclaimed a City on 25 November 1988. Covering an area of 23 square km the City embraces
2

Hurstville City Council Fit For The Future Submission 13
wholly or partly the suburbs of Allawah, Beverly Hills, Carlton, Hurstville, Kingsgrove, Lugarno, Mortdale, Narwee, Oatley, Peakhurst, Peakhurst Heights, Penshurst and Riverwood.
The Hurstville local government area (LGA) is close to Sydney Airport and the M5 Motorway, as well as the foreshores of Botany Bay and the Georges River. The LGA is served by Stoney Creek Road, Forest Road, King Georges Road and the East Hills and Illawarra railway lines. It is the major public transport interchange for the St George region, with excellent access to train and bus services.
The LGA is bounded by the City of Canterbury to the north, Rockdale City Council to the north east, Kogarah City Council to the east, the Georges River and Sutherland Shire in the south, and Bankstown City Council to the west.
Hurstville also contains one of the largest native bush reserves in the St George region, Oatley Park. Hurstville Oval is one of Sydney’s finest and most historic cricket grounds. The City provides a wide range of regional, cultural and recreational facilities for the wider southern Sydney region including the Hurstville Aquatic and Leisure Centre, Hurstville Entertainment Centre, Hurstville City Library, Johnny Warren Indoor Sports Centre, Hurstville Museum and Gallery and the Hurstville Youth Centre.
2

Hurstville City Council Fit For The Future Submission 14
At a Glance – Hurstville Local Government Area
LOCALITY ECONOMY (continued) Area 24.8 square
kilometres Persons employed in the local
government area (Lawrence Consulting Feb 2014)
24,116
Distance from Sydney CBD 15 kilometres Projected additional jobs by 2031 (Draft Metropolitan Strategy 2013)
5,000
DEMOGRAPHICS Total businesses (June 2013
Australian Business Register) 7,388
Estimated residential population (ABS 2013)
84,859 Registered vehicles (June 2013)
33,572
Projected population in 2036 104,028 Gross Regional Product (2013-
14) $3,200M
Indigenous persons 0.6% SOCIETY
Persons born overseas 41.7% Rateable properties (March
2013) (28,777 residential & 2,234 business)
31,011
ENVIRONMENT Number of dwellings (Sept
2013) 30,318
Parks and reserves 280.3 hectares – 159 locations
Projected additional dwellings by 2031 (Draft Metropolitan Strategy 2011)
4,100
ECONOMY Number of families 20,698 Available labour force (Federal Department of Education, Employment and Workplace Relations – September 2014)
42,492
Number of households with children
13,731
Employed persons (Federal Department of Education, Employment and Workplace Relations – September 2014)
41,971
Disabled people 3,736
Hurstville City Council Fit For The Future Submission 15
Population
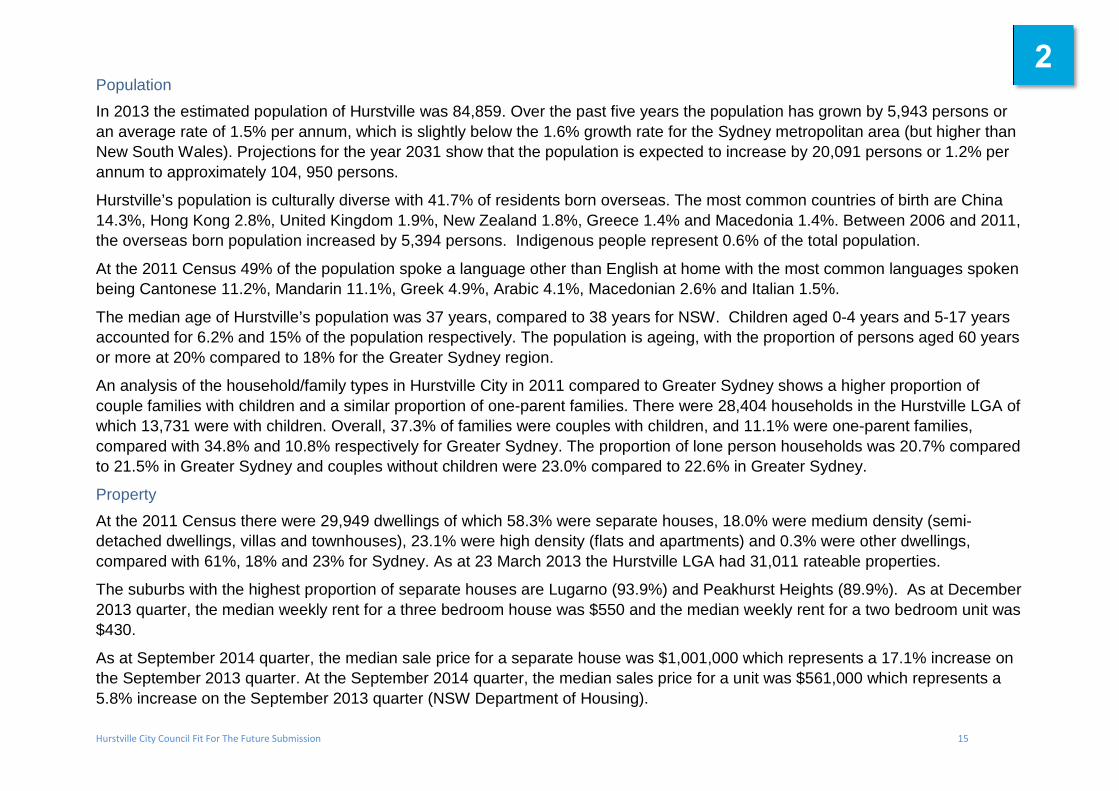
In 2013 the estimated population of Hurstville was 84,859. Over the past five years the population has grown by 5,943 persons or an average rate of 1.5% per annum, which is slightly below the 1.6% growth rate for the Sydney metropolitan area (but higher than New South Wales). Projections for the year 2031 show that the population is expected to increase by 20,091 persons or 1.2% per annum to approximately 104, 950 persons.
Hurstville’s population is culturally diverse with 41.7% of residents born overseas. The most common countries of birth are China 14.3%, Hong Kong 2.8%, United Kingdom 1.9%, New Zealand 1.8%, Greece 1.4% and Macedonia 1.4%. Between 2006 and 2011, the overseas born population increased by 5,394 persons. Indigenous people represent 0.6% of the total population.
At the 2011 Census 49% of the population spoke a language other than English at home with the most common languages spoken being Cantonese 11.2%, Mandarin 11.1%, Greek 4.9%, Arabic 4.1%, Macedonian 2.6% and Italian 1.5%.
The median age of Hurstville’s population was 37 years, compared to 38 years for NSW. Children aged 0-4 years and 5-17 years accounted for 6.2% and 15% of the population respectively. The population is ageing, with the proportion of persons aged 60 years or more at 20% compared to 18% for the Greater Sydney region.
An analysis of the household/family types in Hurstville City in 2011 compared to Greater Sydney shows a higher proportion of couple families with children and a similar proportion of one-parent families. There were 28,404 households in the Hurstville LGA of which 13,731 were with children. Overall, 37.3% of families were couples with children, and 11.1% were one-parent families, compared with 34.8% and 10.8% respectively for Greater Sydney. The proportion of lone person households was 20.7% compared to 21.5% in Greater Sydney and couples without children were 23.0% compared to 22.6% in Greater Sydney.
Property
At the 2011 Census there were 29,949 dwellings of which 58.3% were separate houses, 18.0% were medium density (semi-detached dwellings, villas and townhouses), 23.1% were high density (flats and apartments) and 0.3% were other dwellings, compared with 61%, 18% and 23% for Sydney. As at 23 March 2013 the Hurstville LGA had 31,011 rateable properties.
The suburbs with the highest proportion of separate houses are Lugarno (93.9%) and Peakhurst Heights (89.9%). As at December 2013 quarter, the median weekly rent for a three bedroom house was $550 and the median weekly rent for a two bedroom unit was $430.
As at September 2014 quarter, the median sale price for a separate house was $1,001,000 which represents a 17.1% increase on the September 2013 quarter. At the September 2014 quarter, the median sales price for a unit was $561,000 which represents a 5.8% increase on the September 2013 quarter (NSW Department of Housing).
2

Hurstville City Council Fit For The Future Submission 16
0 100 200 300 400 500
Financial & insurance services
Health care & social assistance
Construction
Wholesale trade
Manufacturing
Retail trade
Professional, scientific & technical…
Education & training
Public administration & safety
Transport, postal & warehousing
Administrative & support services
Rental, hiring & real estate services
Other services
Accommodation & food services
Electricity, gas, water & waste services
Information media &…
Arts & recreation services
Agriculture, forestry & fishing
Mining
2013/14 ($ Million)
Goods
Open Space
There are 280 hectares of parks and reserves located in 159 locations throughout the LGA. This represents approximately 3.3 hectares of open space per 1,000 residents in 2013. Hurstville also contains one of the largest native bush reserves in the St George region, Oatley Park.
Economic Profile
The Hurstville City Centre is southern Sydney’s primary centre boasting the major concentration of commercial and retail space in the region. The City is the preferred location for small to medium enterprises (SME’s) in sectors such as financial & insurance services, health care & social assistance, construction, wholesale, manufacturing and retail. State and Federal government departments, community services and education services are also an important part of the local economy.
Gross Regional Product
In June 2013 there were 7,388 businesses located in the Hurstville LGA with an average annual turnover of $337,800 (Lawrence Consulting, March 2015).The Gross Regional Product of the Hurstville LGA in the year 2013-2014 was $3.2 billion. (Lawrence Consulting, March 2015).
Contribution by Goods and Services Sectors to Gross Regional Product Source Lawrence Consulting

Hurstville City Council Fit For The Future Submission 17
Employment
As at the September 2014 quarter the number of employed persons residing in the City of Hurstville was 41,971 and the unemployment rate was 3.5%. The estimated number of people who worked in the City of Hurstville was 24,116 in 2013-14.
NSW Government Plans and Strategies
The NSW Government’s plans and strategies inform and guide local government planning and decision-making. The Sydney Metropolitan Strategy and South Subregional Strategy are two key plans which address future growth in Sydney and Hurstville.
Hurstville is designated a ‘major centre’ within the South Subregional Strategy. The draft South Subregional Strategy, released by the NSW Department of Planning in December 2007, established the broad framework for the long-term development of the Subregion. This strategy provided for a target of 3,000 additional jobs in Hurstville and 42,000 new dwellings to be accommodated in the Southern Sub Region by 2031.
A new Draft NSW Metropolitan Strategy for Sydney 2031 was released in March 2013 but details have not being worked out fully at LGA levels. Hurstville remains a major centre with a primary focus for additional office, retail, entertainment, cultural and public administration growth as well as higher intensity residential development. The aim is to provide capacity for at least 5,000 additional jobs by 2031. These targets were taken into account in the implementation of the new Comprehensive Local Environmental Plan and in developing Hurstville’s other planning instruments to ensure well-designed urban development.
2

Hurstville City Council Fit For The Future Submission 18
2.2 Key challenges and opportunities Strengths Weaknesses • Little external debt covered by income generation and LIRS
interest subsidy • Community priorities identified, programmed and funded • “Maintenance Council” with infrastructure and core services
in place • Well understood delivery programs and cost base, including
advantageous waste services contract • Good experience with Integrated Planning and Reporting
framework (CSP, LTFP,SAMP, WP) • Community engagement process well established • OLG “Better performing” organisation
• Industry best practice Price-Setting methodology
• Relentless cost shifting from Federal and State Governments
• Funding Council’s share of s94 Developer Contribution projects
Opportunities Threats • Significant Commercial Property portfolio and development
potential • Stormwater Environmental Levy to address drainage
renewal • Increasing collaboration/sharing/contracts with adjoining
Councils, regional organisations and other agencies • Boundary adjustments (eg - acquire Canterbury side of
Riverwood to M5 and Kogarah side of Hurstville CBD, relinquish Oatley East to Kogarah)
• Expected dividends from Lehman Brothers (CDO) liquidation
• Possible withdrawal of FAG grant • Potential non-renewal of Infrastructure Plus Special Rate
Variation post 2020/21 • Legislation changes, especially with respect to town
planning requirements • Economic fluctuations affecting interest rates and inflation • Political decisions delay implementation of projects

Hurstville City Council Fit For The Future Submission 19
2.3 Performance against the Fit for the Future benchmarks
Sustainability
Measure/ benchmark
2013 / 2014 performance
Achieves FFTF benchmark?
Forecast 2016 / 2017 performance
Achieves FFTF benchmark?
Operating Performance Ratio (Greater than or equal to break-even average over 3 years) -1.1% Almost 0.02% Yes
Own Source Revenue Ratio (Greater than 60% average over 3 years)
82.9%
Yes
83.12% Yes
Building and Infrastructure Asset Renewal Ratio (Greater than 100% average over 3 years)
52.4%
No 100.30%
Yes
If the Fit for the Future benchmarks are not being achieved, please indicate why. For example, historical constraints/context, one-off adjustments/factors, council policies and trade-offs between criteria. Hurstville City Council meets all Sustainability benchmarks according to our audited Long-Term Financial Forecast.
2

Hurstville City Council Fit For The Future Submission 20
2.3 Performance against the Fit for the Future benchmarks
Infrastructure and service management
Measure/ benchmark
2013 /2014 performance
Achieves FFTF benchmark?
Forecast 2016 / 2017 performance
Achieves FFTF benchmark?
Infrastructure Backlog Ratio (Greater than 2%)
0.89% Yes 0.66% Yes
Asset Maintenance Ratio (Greater than 100% average over 3 years)
87.3% Almost 114% Yes
Debt Service Ratio (Greater than 0% and less than or equal to 20% average over 3 years)
1.88% Yes 1.91% Yes
If the Fit for the Future benchmarks are not being achieved, please indicate why. Hurstville City Council meets all Infrastructure and Service Management benchmarks according to our audited Long-Term Financial Forecast. In particular, the Strategic Asset Management Plan describes the process undertaken with Woolcott Research to ascertain the community’s acceptable condition levels for various asset classes (see pages 16-18).
2

Hurstville City Council Fit For The Future Submission 21
2.3 Performance against the Fit for the Future benchmarks
Efficiency
Measure/ benchmark
2013 /2014 performance
Achieves FFTF benchmark?
Forecast 2016 / 2017 performance
Achieves FFTF benchmark?
Real Operating Expenditure per capita A decrease in Real Operating Expenditure per capita over time
0.68 Yes 0.66 Yes
If the Fit for the Future benchmarks are not being achieved, please indicate why. Hurstville City Council meets the Efficiency benchmark according to our audited Long-Term Financial Forecast.
2

Hurstville City Council Fit For The Future Submission 22
3. How will your council become/remain Fit for the Future?
Through the rigorous application of the NSW Office of Local Government’s Integrated Planning & Reporting framework since its introduction in 2009, Hurstville City Council has continued to meet community expectations and deliver more effective and efficient services and facilities. Thus we have become a “fit for the future” Council as a natural consequence of implementing the strategies and actions prioritised by our Councillors, developed by our staff, agreed with our community, adopted by Council and regularly monitored/reported to the public in the IP&R documents required by legislation (eg- Community Strategic Plan, Delivery Program, Operational Plan, Annual Budget and Fees & Charges, Quarterly Progress Reports, Annual Report). The record of our journey and future direction is there for all to see.
3.1 Sustainability
Summarise your council’s key strategies to improve performance against the Sustainability benchmarks in the 2016-20 period, including the outcomes you expect to achieve. Explain the key assumptions that underpin your strategies and expected outcomes. For example the key assumptions that drive financial performance including the use of SRVs, growth in rates, wage increases, Financial Assistance or other operating grants, depreciation, and other essential or major expense or revenue items. Please refer to Community Strategic Plan 2025 and Delivery Program 2015-19 (Attachment 1) and other IP&R documents regularly reported to OLG and the public. In particular, the Long Term Financial Plan details the assumptions, results and scenarios which have been assured by our external auditors.
3

Hurstville City Council Fit For The Future Submission 23
3.2 Infrastructure and Service Management Summarise your council’s key strategies to improve performance against the Infrastructure and service
management benchmarks in the 2016-20 period, including the outcomes you expect to achieve.
Explain the key assumptions that underpin your strategies and expected outcomes. Please refer to Community Strategic Plan 2025 and Delivery Program 2015-19 (Attachment 1) and other IP&R documents regularly reported to OLG and the public. 3.3 Efficiency Summarise your council’s key strategies to improve performance against the Efficiency measures in the 2016-20 period, including the outcomes you expect to achieve. Explain the key assumptions that underpin your strategies and expected outcomes. Please refer to Community Strategic Plan 2025 and Delivery Program 2015-19 (Attachment 1) and other IP&R documents regularly reported to OLG and the public.
3

Hurstville City Council Fit For The Future Submission 24
3.4 Improvement Action Plan
Summarise the key improvement actions that will be achieved in the first year of your plan.
Action plan
Actions Milestones
1. Introduction of Stormwater Management Charge as detailed in Delivery Plan 2015-2016
Levied with Rates on 1 July 2015
* Please attach detailed action plan and supporting financial modelling
Outline the process that underpinned the development of your Action Plan. For example, who was involved, any external assistance, consultation or collaboration, and how the council has reviewed and approved the plan. Please refer to Community Strategic Plan 2025 and Delivery Program 2015-19 (Attachment 1) and other IP&R documents regularly reported to OLG and the public. A key component of the Strategic Asset Management Plan and Long-Term Financial Plan is the new Stormwater Management Charge which will generate $700,000 per annum for investment in drainage infrastructure renewal.
3

Hurstville City Council Fit For The Future Submission 25
3.5 Other actions considered
In preparing your Improvement Action Plan, you may have considered other strategies/actions but decided not to adopt them. Please identify what these strategies/actions were and explain why you chose not to pursue them. For example, neighbouring council did not want to pursue a merger, unable to increase rates or increase borrowing, changes in policy or service standards. Although Hurstville City Council meets all the FFTF financial sustainability benchmarks and demonstrates all the scale & capacity outcomes expected of a FFTF Council, we endeavoured to rigorously test various merger options in search of a business case “superior” to our current independent situation from the point of view of our residents and businesses. The Independent Local Government Review Panel recommended Hurstville amalgamate with Kogarah, Rockdale and Canterbury
Councils or alternatively with only Kogarah and Rockdale. In the absence of a business case for these recommendations against
which to compare ourselves and the lack of consensus amongst our neighbouring Councils to jointly explore merger options,
Hurstville engaged SGS Economics to assist us in quantifying the sustainability gaps and potential synergies for a range of
scenarios.
SGS facilitated an in-house exercise with Council’s senior management based on publicly available information and the
professional experience of our staff. The challenge was to design the resources which might be required to service various
amalgamation areas to the level currently applying to the Hurstville LGA and then to quantify the potential rationalisation benefits.
These were then compared over a 10 year period to the corresponding funding gap as identified in the FFTF financial benchmarks.
Synergy benefits were identified in the areas of governance, senior staff, manpower, overheads, facilities, services and contracts
based on SGS experience in the areas, industry benchmarks and input from Hurstville staff. Merged Council cost estimations have
assumed that service delivery will be at the level currently experienced by Hurstville residents and businesses. In the options which
include Canterbury, this has resulted in dis-synergies as they have a lower current per capita expenditure to be redressed.
Rationalisation of surplus assets (eg- extraneous Council chambers, depots, libraries) is assumed to take over a 3-year period.
Grant funding to support amalgamations scenarios has been assumed as per FFTF documentation, with Hurstville standalone and
Hurstville + Kogarah options attracting no grant.
3

Hurstville City Council Fit For The Future Submission 26
Based on SGS findings, only a merged Hurstville and Kogarah option has the potential of delivering positive economic benefits for our residents and businesses. From our own experience with Core Service Reviews over the years, it is worth noting that delivering cost savings through services and facilities rationalisation is extraordinarily difficult to achieve. The potential benefits which have been optimistically identified should not be taken as given, since pressure from special interest groups to retain the status quo will be great. In any event, combining Hurstville and Kogarah would fall far short of the 250,000 population critical mass described in FFTF documentation and neither Council has resolved to explore this option.
$-
$85
$332
$540
$263
$-
$97
$182
$99
-$73
$- $- $10.5 $19.5 $10.5
-$100
$-
$100
$200
$300
$400
$500
$600
Hurstville Hurstville +
Kogarah
Hurstville +
Kogarah +
Rockdale
Hurstville +
Kogarah +
Rockdale +
Canterbury
Hurstville +
Canterbury
Mil
lio
ns
Amalgamation Scenarios Over 10 Years
Funding Gap
Synergy
FFTF Grant

Hurstville City Council Fit For The Future Submission 27
A refinement which would allow an independent Hurstville City Council to operate more efficiently and with increased “critical mass”
is realigning the Local Government Area boundaries with Canterbury and Kogarah. If the portion of Riverwood between the railway
line and the M5 Motorway was transferred from Canterbury, an area of 199.7 Ha and 6895 residents (2011 Census) would be
added to Hurstville. The logistical benefits accruing to both Councils would be similar to the voluntary boundary adjustment of
Beverly Grove Park which was implemented with Canterbury in 2011. This has not been addressed with Canterbury within the
context of preparing this FFTF submission and no detailed modelling has been undertaken.
Hurstville and Kogarah Councils have in the past contemplated an area swap where the portion of Hurstville CBD which lies south
of the railway line would transfer to Hurstville and the portion of Oatley which lies south-west of the railway line would transfer to
Kogarah. The benefits would include integrated Town Planning and transport optimisation in the Hurstville CBD and improved
service provision logistics for Oatley (eg – Hurstville vehicles need to drive through Kogarah LGA to reach isolated residents). This
has not been addressed with Kogarah within the context of preparing this FFTF submission and no detailed modelling has been
undertaken.
3

Hurstville City Council Fit For The Future Submission 28
4. How will your plan improve performance?
4.1 Expected improvement in performance Measure/ benchmark 2014/15 2015/16 2016/17 2017/18 2018/19 2019/20 Achieves FFTF
benchmark?
Operating Performance Ratio (Greater than or equal to break-even average over 3 years) -0.51% -0.46% 0.02% 1.16% 1.22% 1.63% Yes
Own Source Revenue Ratio (Greater than 60% average over 3 years) 80.70% 83.13% 83.12% 86.46% 87.35% 87.80% Yes
Building and Infrastructure Asset Renewal Ratio (Greater than100% average over 3 years)
58.28% 80.96% 100.30% 108.55% 106.23% 104.90% Yes
Infrastructure Backlog Ratio (Less than 2%) 0.85% 0.89% 0.66% 0.48% 0.44% 0.48% Yes
Asset Maintenance Ratio (Greater than 100% average over 3 years) 101% 111% 114% 116% 114% 113% Yes
Debt Service Ratio (Greater than 0% and less than or equal to 20% average over 3 years) 2.06% 2.06% 1.91% 1.84% 1.73% 1.62% Yes
Real Operating Expenditure per capita A decrease in Real Operating Expenditure per capita over time
0.69 0.68 0.66 0.65 0.64 0.62 Yes
4 4

Hurstville City Council Fit For The Future Submission 29
4.1 Expected improvement in performance
If, after implementing your plan, your council may still not achieve all of the Fit for the Future benchmarks, please explain the likely reasons why. For example, historical constraints, trade-offs between criteria, longer time required. Hurstville City Council meets all the Fit for the Future benchmarks every year according to our audited Long-Term Financial Forecast.
5. Putting your plan into action How will your council implement your Improvement Action Plan? For example, who is responsible, how the council will monitor and report progress against achieving the key strategies listed under Section 3. Please refer to Community Strategic Plan 2025 and Delivery Program 2015-19 (Attachment 1) and other IP&R documents regularly reported to OLG and the public.
6. Appendix Attachment 1 – Community Strategic Plan 2025 and Delivery Program 2015-19 Attachment 2 – Long Term Financial Model Assurance Report, Hill Rogers Spencer Steer Attachment 3 – The Future of Hurstville City Council, Proposed Council Amalgamation, Have Your Say Attachment 4 - Key Elements of Strategic Capacity – Hurstville’s Scale & Capacity Outcomes
5