Embed Size (px)
Citation preview

Hurricane Sandy After-‐Math Rebuilding with Social Justice
Addressing the Post-‐Storm Challenges to New Jersey’s Elderly, Jobless, Working Poor, Businesses, Nonprofits
60 Park Place, Suite 511 Newark, NJ 07102-‐5504 Phone: (973) 624-‐9400 E-‐mail: [email protected]
1
Contents
Contents .......................................................................................................................................................1
Message to the Community from Cornell William Brooks, President and CEO, NJISJ..................................3
Executive Summary ......................................................................................................................................4
Hurricane Sandy Was a Game-‐Changer........................................................................................................8
What Changed? ........................................................................................................................................8
Consequences and Remedies.................................................................................................................11
Sandy Hit New Jersey Harder than Any Other State ..................................................................................11
New Jersey Suffers from a Media Grey-‐Out ...........................................................................................12
Not Yet Recovered from Recession, NJ Had the Worst Blackout ...........................................................13
NJ Damage/GSP Was Double That of NY................................................................................................14
Death Rates Were Highest among the Elderly ...........................................................................................15
A Remediable Factor in Deaths – Physical and Social Isolation..............................................................18
Property Losses Hit the Poorest Owners and Renters Hardest ..................................................................19
Damage Is Greatest in Poorer Areas, Relative to Property Value ..........................................................20
Low-‐Wage (“ALICE”) Workers Vulnerable in NJ’s Hardest-‐Hit Counties ................................................25
Property Losses Greatest in Poorest Counties .......................................................................................29
How Underinsurance Hurts the Low-‐Wage Worker Hardest .....................................................................32
What Is Insured and What Is Not ...........................................................................................................32
Underinsurance Threatens Low-‐Wage Workers Most ...........................................................................33
Rising Flood Insurance Premiums Will Hit Modest Homes Hardest...........................................................36
“Moral Hazard” in Flood Insurance – NJ’s “Right to Rebuild..................................................................36
Consequences of “Right to Rebuild”: Rising Premiums..........................................................................37
Flood Maps and Asset Destruction.........................................................................................................38
Homeowners Lose Value If They Sell Under Pressure................................................................................41
Quick Sales Go Cheap and Waiting Keeps Value ....................................................................................42
Housing Values Recover for Those Who Can Afford to Wait..................................................................43
Foreclosure Suspension..........................................................................................................................44
The Costs of Strategic Options – Retreat, Rebuild, Prevent .......................................................................45
Costs of Retreat from the Waterfront ....................................................................................................45
Gentrification in NJ Communities with Highly Unequal Incomes...........................................................46
2
The Cost of Flood Prevention – Sea Barriers, Gates ...............................................................................48
Rebuilding NJ’s Prosperity on a Platform of Social Justice .........................................................................50
New Jersey’s Post-‐Sandy Government Leadership ................................................................................50
The Financial and Service Challenges for NJ Nonprofits.........................................................................51
The Plight of Small Businesses................................................................................................................55
Potential Jobs in Construction and Other Sectors from Rebuilding .......................................................56
The Need for Fairness and Cooperation in Rebuilding ...........................................................................57
Conclusions.................................................................................................................................................60
Potential Policy Responses and Recommendations from NJISJ .............................................................60
Acknowledgments ......................................................................................................................................64
3
Message to the Community from Cornell William Brooks, President and CEO, NJISJ The New Jersey Institute for Social Justice is a Newark-‐based research and advocacy organization dedicated to the advancement of low-‐income and minority groups. The Institute focuses on:
• Expanding access to economic opportunity for low-‐income and minority residents of Newark and other urban areas in the state
• Promoting local, regional and state government that is effective, equitable, and accountable to the concerns of urban residents and their communities
• Ensuring the civil rights and other basic entitlements for low-‐income individuals in the state. This report assesses the impact of Hurricane Sandy on New Jersey residents, with a focus on the unique obstacles faced by low-‐wage workers and communities. It was prepared primarily by our Chief Economist, Dr. John Tepper Marlin, who was located for us by ReServe, a talent recruiting service for nonprofit organizations. Dr. Marlin has served as a Federal Government economist for seven years, most recently as Senior Economist for the Joint Economic Committee of the Congress. Previously he served for more than 13 years as the Chief Economist for three New York City Comptrollers. He has been on the faculty of Baruch College, City University of New York and the Stern School of Business, New York University. We welcome Dr. Marlin to our team and look forward to your reactions to this report on social justice issues in New Jersey in the wake of Hurricane Sandy. What follows is essentially the commentary of an experienced economist focusing on the problems that NJISJ was created to address in the context of the Sandy disaster. We look forward to following up with our supporters on various aspects of this paper. Cornell William Brooks, Esq. President and CEO
4
Hurricane Sandy After-‐Math Rebuilding with Social Justice in New Jersey
Executive Summary The primary theme of this report is that the biggest losers from Hurricane Sandy are low-‐income owners of homes or businesses. Many without employment or property when the storm hit also suffered significantly but had less to lose. Hard-‐working people who had a foot on the bottom rung of the ladder of opportunity were knocked off the ladder by the storm. Many who were struggling successfully to break out of the cycle of poverty, who made what seemed reasonable investments of their life savings in a home or business, saw their main asset destroyed by Hurricane Sandy. Some lost their jobs or businesses, others their homes, some both. While extensions have been granted on some loans, a large number of these families are in danger of defaulting on their mortgages or business loans. Others cannot afford the expense of cleanup and repair. Many residents of hard-‐hit coastal areas will have to face rising insurance premiums and costlier building codes. These people are under pressure to sell their homes or businesses quickly, before the market has a chance to recover. In their recovery efforts, FEMA, nonprofit aid groups and New Jersey agencies and county and town officials should give special attention to the working poor who face foreclosure or an unnecessary significant loss of home or business equity. It would be a tragedy, on top of the tragedies that Hurricane Sandy has already brought, for these people and their families to fall into dependency simply because of lack of timely information about their options. New Jersey can expect $27 billion in federal aid. The exact sharing of Federal aid among the states is undisclosed. In the first round of HUD CDBG Disaster Recovery allocations New Jersey received $1.83 billion, or 33 percent. However, New Jersey’s share of the original $82.2 billion aid request was 45 per cent, so New Jersey might expect to benefit directly or indirectly (through the Federal agencies) from 45 percent of the approved amount of $60.2 billion, or approximately $27 billion in aid. New Jersey was hit harder than New York, relative to their economic size, and has more to do to recover. Based on official numbers from both states, damage was 5.8 percent of New Jersey’s gross state product vs. 2.7 percent of New York’s. Moreover, private insurance coverage in New Jersey appears to have been less complete than in New York, for a number of reasons. More of the New Jersey damage was non-‐commercial, a higher share of New Jersey business insurance was for small businesses, and more property was uninsured or underinsured. In November 2012, New Jersey processed an unprecedented 138,661 first-‐time unemployment claims – nearly as many as the 158,204 claims in New York.
5
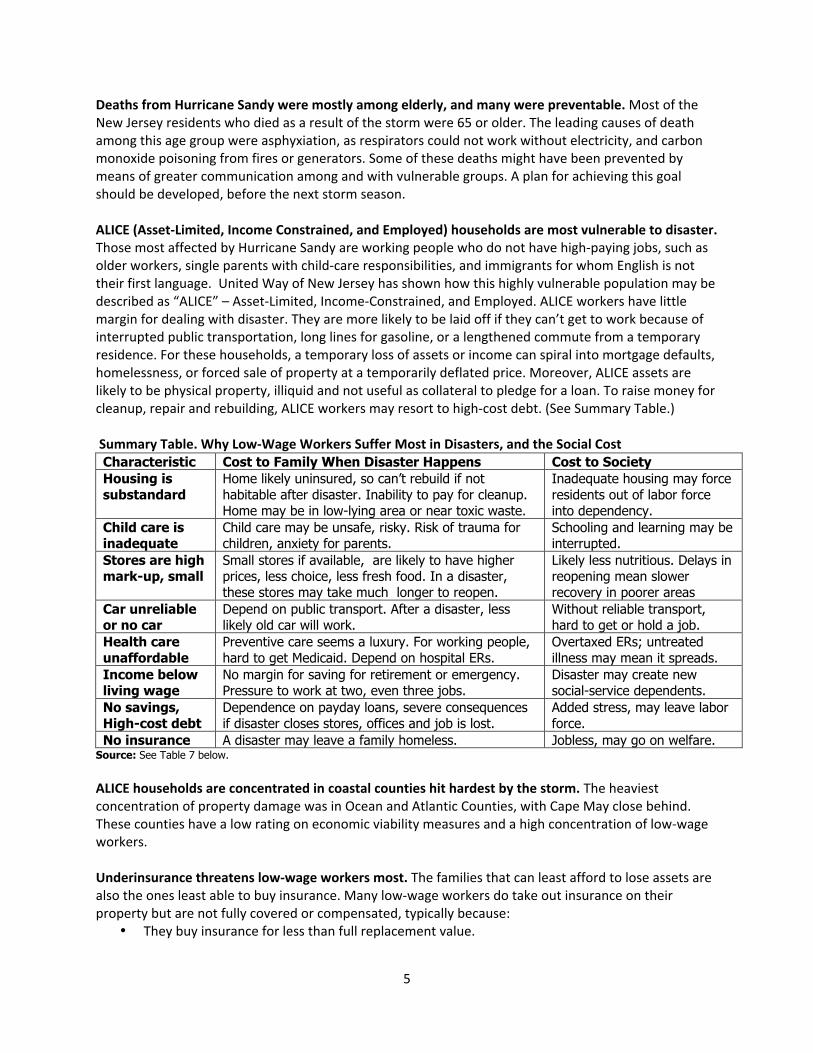
Deaths from Hurricane Sandy were mostly among elderly, and many were preventable. Most of the New Jersey residents who died as a result of the storm were 65 or older. The leading causes of death among this age group were asphyxiation, as respirators could not work without electricity, and carbon monoxide poisoning from fires or generators. Some of these deaths might have been prevented by means of greater communication among and with vulnerable groups. A plan for achieving this goal should be developed, before the next storm season. ALICE (Asset-‐Limited, Income Constrained, and Employed) households are most vulnerable to disaster. Those most affected by Hurricane Sandy are working people who do not have high-‐paying jobs, such as older workers, single parents with child-‐care responsibilities, and immigrants for whom English is not their first language. United Way of New Jersey has shown how this highly vulnerable population may be described as “ALICE” – Asset-‐Limited, Income-‐Constrained, and Employed. ALICE workers have little margin for dealing with disaster. They are more likely to be laid off if they can’t get to work because of interrupted public transportation, long lines for gasoline, or a lengthened commute from a temporary residence. For these households, a temporary loss of assets or income can spiral into mortgage defaults, homelessness, or forced sale of property at a temporarily deflated price. Moreover, ALICE assets are likely to be physical property, illiquid and not useful as collateral to pledge for a loan. To raise money for cleanup, repair and rebuilding, ALICE workers may resort to high-‐cost debt. (See Summary Table.) Summary Table. Why Low-‐Wage Workers Suffer Most in Disasters, and the Social Cost Characteristic Cost to Family When Disaster Happens Cost to Society Housing is substandard
Home likely uninsured, so can’t rebuild if not habitable after disaster. Inability to pay for cleanup. Home may be in low-lying area or near toxic waste.
Inadequate housing may force residents out of labor force into dependency.
Child care is inadequate
Child care may be unsafe, risky. Risk of trauma for children, anxiety for parents.
Schooling and learning may be interrupted.
Stores are high mark-up, small
Small stores if available, are likely to have higher prices, less choice, less fresh food. In a disaster, these stores may take much longer to reopen.
Likely less nutritious. Delays in reopening mean slower recovery in poorer areas
Car unreliable or no car
Depend on public transport. After a disaster, less likely old car will work.
Without reliable transport, hard to get or hold a job.
Health care unaffordable
Preventive care seems a luxury. For working people, hard to get Medicaid. Depend on hospital ERs.
Overtaxed ERs; untreated illness may mean it spreads.
Income below living wage
No margin for saving for retirement or emergency. Pressure to work at two, even three jobs.
Disaster may create new social-service dependents.
No savings, High-cost debt
Dependence on payday loans, severe consequences if disaster closes stores, offices and job is lost.
Added stress, may leave labor force.
No insurance A disaster may leave a family homeless. Jobless, may go on welfare. Source: See Table 7 below. ALICE households are concentrated in coastal counties hit hardest by the storm. The heaviest concentration of property damage was in Ocean and Atlantic Counties, with Cape May close behind. These counties have a low rating on economic viability measures and a high concentration of low-‐wage workers. Underinsurance threatens low-‐wage workers most. The families that can least afford to lose assets are also the ones least able to buy insurance. Many low-‐wage workers do take out insurance on their property but are not fully covered or compensated, typically because:
• They buy insurance for less than full replacement value.
6
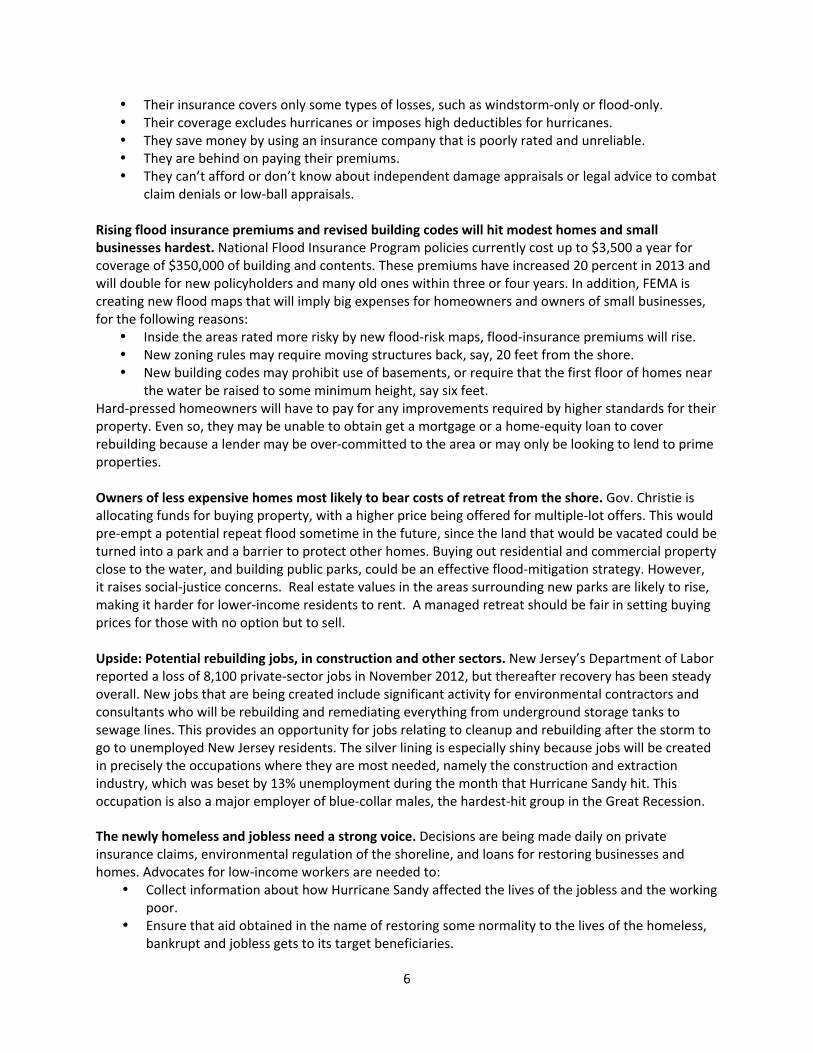
• Their insurance covers only some types of losses, such as windstorm-‐only or flood-‐only. • Their coverage excludes hurricanes or imposes high deductibles for hurricanes. • They save money by using an insurance company that is poorly rated and unreliable. • They are behind on paying their premiums. • They can’t afford or don’t know about independent damage appraisals or legal advice to combat
claim denials or low-‐ball appraisals. Rising flood insurance premiums and revised building codes will hit modest homes and small businesses hardest. National Flood Insurance Program policies currently cost up to $3,500 a year for coverage of $350,000 of building and contents. These premiums have increased 20 percent in 2013 and will double for new policyholders and many old ones within three or four years. In addition, FEMA is creating new flood maps that will imply big expenses for homeowners and owners of small businesses, for the following reasons:
• Inside the areas rated more risky by new flood-‐risk maps, flood-‐insurance premiums will rise. • New zoning rules may require moving structures back, say, 20 feet from the shore. • New building codes may prohibit use of basements, or require that the first floor of homes near
the water be raised to some minimum height, say six feet. Hard-‐pressed homeowners will have to pay for any improvements required by higher standards for their property. Even so, they may be unable to obtain get a mortgage or a home-‐equity loan to cover rebuilding because a lender may be over-‐committed to the area or may only be looking to lend to prime properties. Owners of less expensive homes most likely to bear costs of retreat from the shore. Gov. Christie is allocating funds for buying property, with a higher price being offered for multiple-‐lot offers. This would pre-‐empt a potential repeat flood sometime in the future, since the land that would be vacated could be turned into a park and a barrier to protect other homes. Buying out residential and commercial property close to the water, and building public parks, could be an effective flood-‐mitigation strategy. However, it raises social-‐justice concerns. Real estate values in the areas surrounding new parks are likely to rise, making it harder for lower-‐income residents to rent. A managed retreat should be fair in setting buying prices for those with no option but to sell. Upside: Potential rebuilding jobs, in construction and other sectors. New Jersey’s Department of Labor reported a loss of 8,100 private-‐sector jobs in November 2012, but thereafter recovery has been steady overall. New jobs that are being created include significant activity for environmental contractors and consultants who will be rebuilding and remediating everything from underground storage tanks to sewage lines. This provides an opportunity for jobs relating to cleanup and rebuilding after the storm to go to unemployed New Jersey residents. The silver lining is especially shiny because jobs will be created in precisely the occupations where they are most needed, namely the construction and extraction industry, which was beset by 13% unemployment during the month that Hurricane Sandy hit. This occupation is also a major employer of blue-‐collar males, the hardest-‐hit group in the Great Recession. The newly homeless and jobless need a strong voice. Decisions are being made daily on private insurance claims, environmental regulation of the shoreline, and loans for restoring businesses and homes. Advocates for low-‐income workers are needed to:
• Collect information about how Hurricane Sandy affected the lives of the jobless and the working poor.
• Ensure that aid obtained in the name of restoring some normality to the lives of the homeless, bankrupt and jobless gets to its target beneficiaries.

7
• Call for more robust public forums, such as State-‐sponsored assemblies and town hall meetings, that would give struggling New Jersey residents themselves a chance to provide their input on the recovery planning process.
Moreover, in the absence of strong advocacy programs, the working poor may be easy marks for predatory programs in the real estate brokerage, finance, paycheck lending, insurance and mortgage fields. An effort should be made to educate homeowners in danger of losing their homes, in order to separate predators from legitimate lenders. In the long term, advocates are needed to promote financial literacy programs, to ensure that low-‐income families have the means to face the next disaster.

8
n the cause of social justice, treating New Jersey fairly in the allocation of Federal aid for Hurricane Sandy deserves attention. The storm was especially burdensome for a state that took the brunt of the landfall, that had a more severe impact relative to its size than any other state, and that has been
lagging in recovery from the Great Recession. New Jersey’s victims are scattered throughout a state that suffers from a relative lack of media attention. The following questions are addressed in this report:
1. How badly was New Jersey affected? Which New Jersey counties were most affected? 2. What groups of New Jersey residents were hit hardest by the disaster? 3. When Sandy hit, what was New Jersey’s economic condition? 4. What opportunities to create jobs does rebuilding offer New Jersey? 5. What issues are raised by the coverage exclusions of insurance companies? 6. What type of homeowner or small business is most likely to have inadequate coverage? 7. What zoning issues and building-‐code issues are likely to emerge during the rebuilding
process, and how do these issues bear unevenly on different types of homeowners and businesses?
Hurricane Sandy Was a Game-Changer The overriding outcome of Hurricane Sandy is a rethinking of the Northeastern coastline in the light of unexpected floods. Properties were destroyed unexpectedly. People who are paid to estimate risks are readjusting their thinking. The broad implications of Hurricane Sandy are environmental and social.
• Environmentally, we need to expect and plan for more frequent flooding of the coast, especially where building has been on landfill, sand or swamps.
• From a social justice perspective, we need to think about groups that are adversely affected by coastal flooding, and what fair and compassionate path can be devised for their future.
What Changed? Put simply, the dangers of storms for New Jersey and New York were underestimated prior to Sandy:
• An emergency-‐planning paper prepared for New York City in 2009 put the odds of a hurricane hitting New York at 2.6 percent – or once in 38 years. Hurricane Sandy arrived just one year after Hurricane Irene, busting the odds.
• As Governor Cuomo said the day after the storm made landfall, “two hundred-‐year floods in two years” creates a “new reality” (http://bit.ly/TVxhvz), just as 9/11 created a new reality for investment in security and anti-‐terrorism intelligence.
Although Sandy was at times a full Category 2 hurricane in the Caribbean, where it killed 70 people before moving on to Atlantic City, NJ, by the time it hit New Jersey it was no longer a hurricane at all. Neither Irene in 2011 nor Sandy in 2012 involved winds of hurricane strength after hitting land. Category 1 is the weakest of the five categories of hurricane wind speed; it means wind speeds of 74-‐95 mph on the Saffir/Simpson Hurricane Scale (http://wxch.nl/RAhxeM). (Category 5 means wind speeds above 155 mph.) After Hurricane Sandy hit land, sustained winds were less than 74 mph, although winds of 90 mph were recorded occasionally in the broad swath of the storm.
I
9
But not being a Category 1 Hurricane did not mean that Sandy was benign:
• Sandy looked much more dangerous on the barometer. Normal barometric pressure at sea level is about 1013 millibars of mercury. Typically the eye of a tropical storm is where barometric pressure is lowest and in a hurricane it falls below 1000 millibars – the lower the number of millibars, usually the stronger the wind. In the hours before Sandy made landfall, the barometric pressure at its eye fell from 943 to 940, a level usually associated with Category 3-‐4 wind. The lowest barometric pressure ever measured in a U.S. hurricane was 882 for Hurricane Wilma. (NOAA, National Weather Service, National Hurricane Center, Blake and Gibney, 2011, accessible at http://1.usa.gov/RD7yUo)
• Sandy was a “Superstorm”. The flood surges magnified the impact of Sandy on the Atlantic coast, making the term Superstorm Sandy a good descriptor, especially because of its 820-‐mile-‐wide swath and two-‐million-‐square-‐mile coverage.
The Storm Surge The potential dangers from flood surges in New York Harbor have been well documented. New York City developed excellent flood probability maps based on feet above sea level and proximity to water and used them to create three evacuation zones that were highly predictive of danger to life and property. But key New York City officials three years ago opposed extensive infrastructure improvements in the Harbor to impede flood surges. Since Irene and now Sandy, this opposition is being reviewed. The most serious damage from both Irene and from Sandy appears to have been caused less by the direct impact of strong winds but rather by the “flood surge,” the hurricane equivalent of a post-‐earthquake tsunami. This was exacerbated during the period of Sandy’s visit by the unusually high tide, because the moon was full. The Mayor of New York City and the governors of New York and New Jersey instructed residents of low-‐lying coastal areas, especially the barrier islands, to evacuate to higher or better-‐protected ground. Those who preferred not to move were properly stigmatized as selfishly endangering the lives of first responders. New Jersey has 127 miles of coastline vulnerable to wind and flood. New York Harbor was hit by a surge from the south, although a feared simultaneous funnel effect through Long Island Sound does not appear to have been serious. Floods impose an especially great toll on businesses. After the 2011 hurricane season, a survey by BC Management of more than 3,000 businesses found that the average length of business interruption was between 7 and 8 days, but that businesses subject to flooding took nearly seven weeks to recover, i.e., six to seven times longer (on.wsj.com/SrL8EA). The National Hurricane Center says after the storm that Sandy's pure kinetic energy for storm surge and wave "destruction potential" reached a 5.8 on the National Oceanic and Atmospheric Administration's 0-‐to-‐6 scale, the highest it has ever measured (http://bit.ly/Rkuj3a). (See Table 1 for the New Jersey impact.)
10
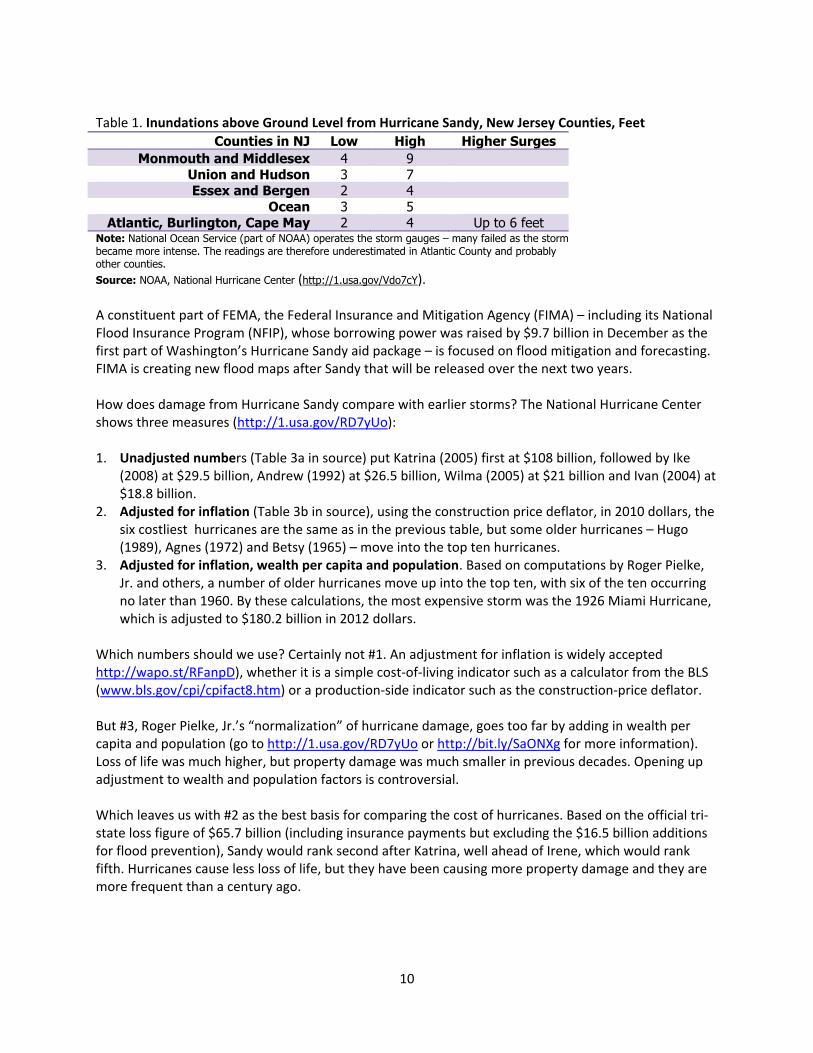
Table 1. Inundations above Ground Level from Hurricane Sandy, New Jersey Counties, Feet
Counties in NJ Low High Higher Surges Monmouth and Middlesex 4 9
Union and Hudson 3 7 Essex and Bergen 2 4
Ocean 3 5 Atlantic, Burlington, Cape May 2 4 Up to 6 feet
Note: National Ocean Service (part of NOAA) operates the storm gauges – many failed as the storm became more intense. The readings are therefore underestimated in Atlantic County and probably other counties. Source: NOAA, National Hurricane Center (http://1.usa.gov/Vdo7cY). A constituent part of FEMA, the Federal Insurance and Mitigation Agency (FIMA) – including its National Flood Insurance Program (NFIP), whose borrowing power was raised by $9.7 billion in December as the first part of Washington’s Hurricane Sandy aid package – is focused on flood mitigation and forecasting. FIMA is creating new flood maps after Sandy that will be released over the next two years. How does damage from Hurricane Sandy compare with earlier storms? The National Hurricane Center shows three measures (http://1.usa.gov/RD7yUo): 1. Unadjusted numbers (Table 3a in source) put Katrina (2005) first at $108 billion, followed by Ike
(2008) at $29.5 billion, Andrew (1992) at $26.5 billion, Wilma (2005) at $21 billion and Ivan (2004) at $18.8 billion.
2. Adjusted for inflation (Table 3b in source), using the construction price deflator, in 2010 dollars, the six costliest hurricanes are the same as in the previous table, but some older hurricanes – Hugo (1989), Agnes (1972) and Betsy (1965) – move into the top ten hurricanes.
3. Adjusted for inflation, wealth per capita and population. Based on computations by Roger Pielke, Jr. and others, a number of older hurricanes move up into the top ten, with six of the ten occurring no later than 1960. By these calculations, the most expensive storm was the 1926 Miami Hurricane, which is adjusted to $180.2 billion in 2012 dollars.
Which numbers should we use? Certainly not #1. An adjustment for inflation is widely accepted http://wapo.st/RFanpD), whether it is a simple cost-‐of-‐living indicator such as a calculator from the BLS (www.bls.gov/cpi/cpifact8.htm) or a production-‐side indicator such as the construction-‐price deflator. But #3, Roger Pielke, Jr.’s “normalization” of hurricane damage, goes too far by adding in wealth per capita and population (go to http://1.usa.gov/RD7yUo or http://bit.ly/SaONXg for more information). Loss of life was much higher, but property damage was much smaller in previous decades. Opening up adjustment to wealth and population factors is controversial. Which leaves us with #2 as the best basis for comparing the cost of hurricanes. Based on the official tri-‐state loss figure of $65.7 billion (including insurance payments but excluding the $16.5 billion additions for flood prevention), Sandy would rank second after Katrina, well ahead of Irene, which would rank fifth. Hurricanes cause less loss of life, but they have been causing more property damage and they are more frequent than a century ago.
11
Consequences and Remedies An attitude-‐changing event like Hurricane Sandy has the power to enrich some people and impoverish others. The immediate impact on properties was a huge mark-‐down of values in the hardest-‐hit areas. Those with adequate assets are able to hold their own in adverse circumstances by riding out the transition while making claims with their private insurers or with government bodies empowered to offer compensation. But many homeowners are not in a position to hold on. As Lord Keynes reportedly said, “The market can stay irrational longer than you can stay solvent.” Recommendations:
• We should improve our ability to predict floods. FEMA is doing this by preparing new flood maps with expectations built in that are more respectful of storms, oceans and Mother Nature.
• Along with flood maps, it would be useful to have an overall indicator of likely flood damage, following the New York City model and showing coastal elevations, and then taking into account (1) wind speeds, (2) likely flood surges based on different scenarios of landfall, and (3) population density of residential and commercial property in the track of the hurricane.
• We need weather forecasts that add the likelihood of flood surges. Hurricane Sandy hit landfall near high tide and the full moon, adding to the height of the tide and therefore to the surge. The geography of this surge was especially important in the case of the northern counties in New Jersey, in New York City and on Long Island, which were all hard hit by floods.
• We must pay attention to social injustices that may be happening right now in the transfer of property through foreclosures and the unwillingness of some lenders to finance cleanups or rebuilding. It is not the business of government to intervene arbitrarily in the housing market, but if a systematic tilt in the system is catching a whole group of homeowners in a temporary vise that does not make sense in the long term, some remedies should be examined.
Hurricane Sandy Hit New Jersey Harder than Any Other State Hurricane Sandy’s wind and flood hit New Jersey, New York and Connecticut the hardest of the 17 states that suffered damage to property or electrical blackouts. (See Sandy’s landfall in Chart 1.) The damage in New York City and on Long Island received most of the early attention, although Sandy landed on New Jersey and relative to its economy was the hardest hit of any state.
12
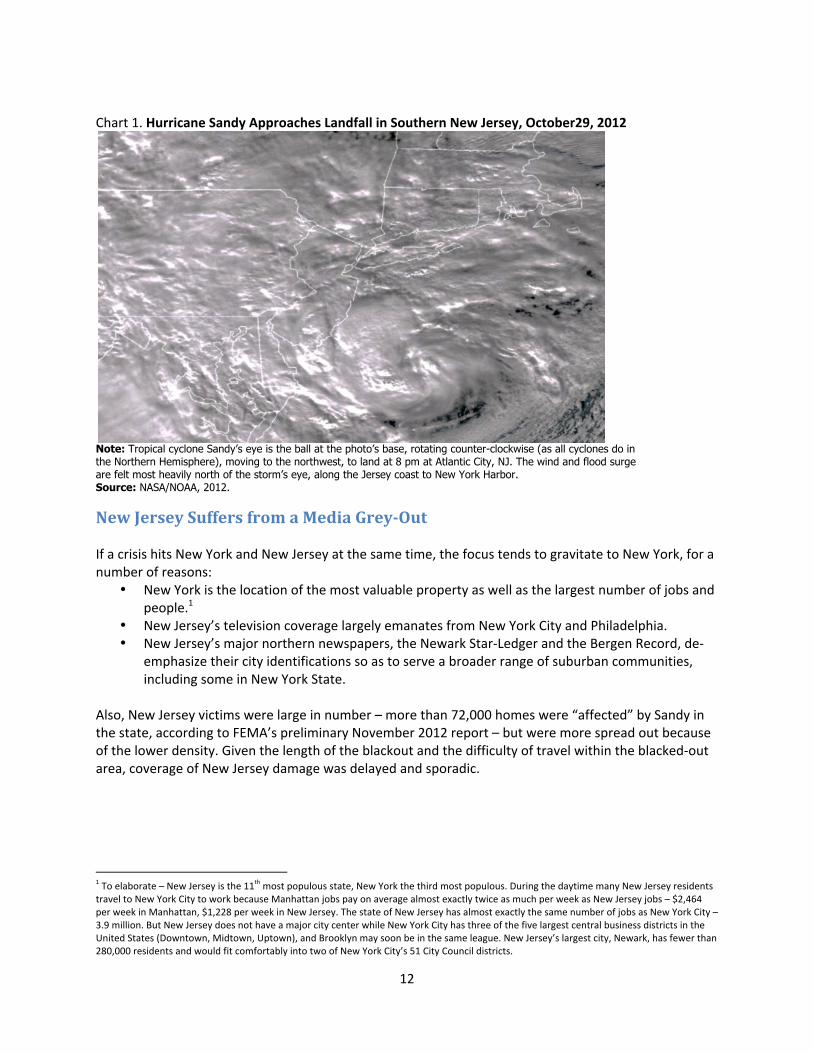
Chart 1. Hurricane Sandy Approaches Landfall in Southern New Jersey, October29, 2012
Note: Tropical cyclone Sandy’s eye is the ball at the photo’s base, rotating counter-clockwise (as all cyclones do in the Northern Hemisphere), moving to the northwest, to land at 8 pm at Atlantic City, NJ. The wind and flood surge are felt most heavily north of the storm’s eye, along the Jersey coast to New York Harbor. Source: NASA/NOAA, 2012.
New Jersey Suffers from a Media Grey-Out If a crisis hits New York and New Jersey at the same time, the focus tends to gravitate to New York, for a number of reasons:
• New York is the location of the most valuable property as well as the largest number of jobs and people.1
• New Jersey’s television coverage largely emanates from New York City and Philadelphia. • New Jersey’s major northern newspapers, the Newark Star-‐Ledger and the Bergen Record, de-‐
emphasize their city identifications so as to serve a broader range of suburban communities, including some in New York State.
Also, New Jersey victims were large in number – more than 72,000 homes were “affected” by Sandy in the state, according to FEMA’s preliminary November 2012 report – but were more spread out because of the lower density. Given the length of the blackout and the difficulty of travel within the blacked-‐out area, coverage of New Jersey damage was delayed and sporadic.
1 To elaborate – New Jersey is the 11th most populous state, New York the third most populous. During the daytime many New Jersey residents travel to New York City to work because Manhattan jobs pay on average almost exactly twice as much per week as New Jersey jobs – $2,464 per week in Manhattan, $1,228 per week in New Jersey. The state of New Jersey has almost exactly the same number of jobs as New York City – 3.9 million. But New Jersey does not have a major city center while New York City has three of the five largest central business districts in the United States (Downtown, Midtown, Uptown), and Brooklyn may soon be in the same league. New Jersey’s largest city, Newark, has fewer than 280,000 residents and would fit comfortably into two of New York City’s 51 City Council districts.
13
NOLA to New York A widely circulated email after Sandy hit was a “Get Well” card from Katrina survivors in New Orleans to Sandy victims, called “NOLA to New York” (see http://bit.ly/RBHtH2). New York? The eye of Hurricane Sandy actually hit landfall 100 miles south of New York City, close to Atlantic City, NJ (see Chart 1). More homes lost power in New Jersey than New York. Relative to their economies, the damage in New Jersey was twice as serious. Every county was declared a disaster area. But New York got the news coverage. The situation can be compared to being in a common accident with a VIP and sharing a hospital room. Many more doctors, nurses and visitors visit the VIP patient. Get Well cards, flowers and fruit baskets pile up in the other half of the room, with nothing for you. Well might you be distressed if you then discovered your bill was twice as large as the VIP’s bill and your reimbursement half as much.
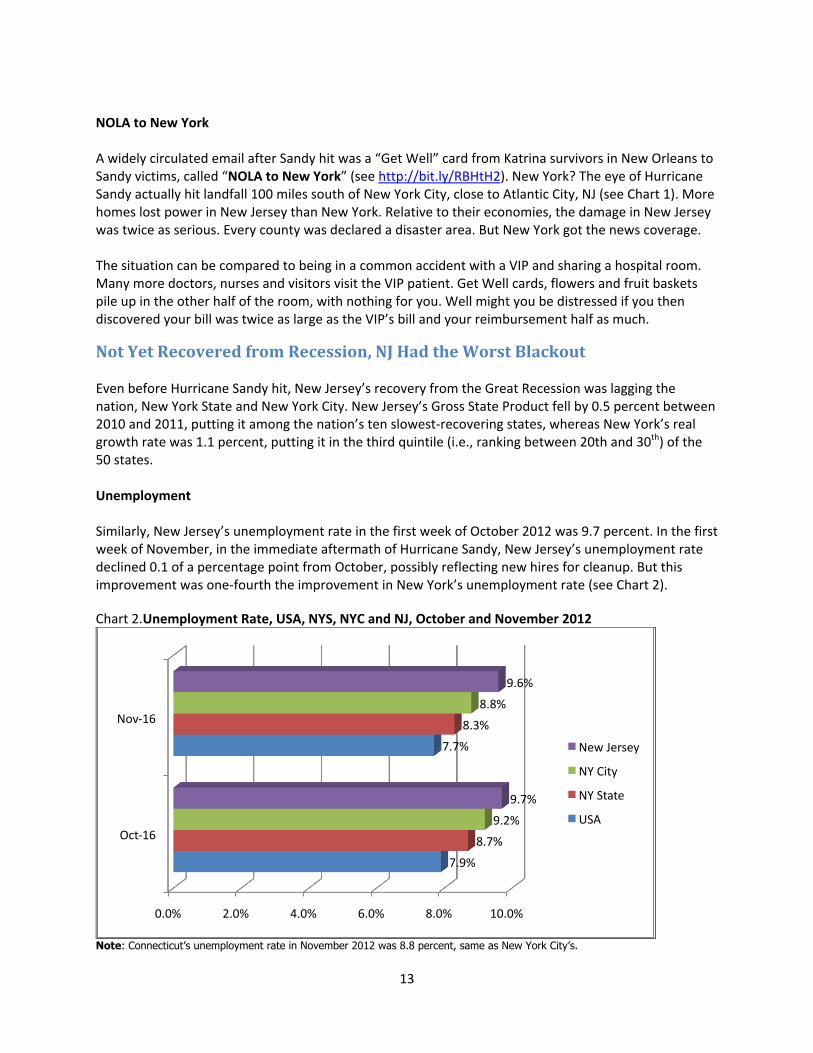
Not Yet Recovered from Recession, NJ Had the Worst Blackout Even before Hurricane Sandy hit, New Jersey’s recovery from the Great Recession was lagging the nation, New York State and New York City. New Jersey’s Gross State Product fell by 0.5 percent between 2010 and 2011, putting it among the nation’s ten slowest-‐recovering states, whereas New York’s real growth rate was 1.1 percent, putting it in the third quintile (i.e., ranking between 20th and 30th) of the 50 states. Unemployment Similarly, New Jersey’s unemployment rate in the first week of October 2012 was 9.7 percent. In the first week of November, in the immediate aftermath of Hurricane Sandy, New Jersey’s unemployment rate declined 0.1 of a percentage point from October, possibly reflecting new hires for cleanup. But this improvement was one-‐fourth the improvement in New York’s unemployment rate (see Chart 2).
Chart 2.Unemployment Rate, USA, NYS, NYC and NJ, October and November 2012
Note: Connecticut’s unemployment rate in November 2012 was 8.8 percent, same as New York City’s.
0.0% 2.0% 4.0% 6.0% 8.0% 10.0%
Oct-‐16
Nov-‐16
7.9%
7.7%
8.7%
8.3%
9.2%
8.8%
9.7%
9.6%
New Jersey
NY City
NY State
USA

14
Source: Chart by NJISJ based on data from BLS, December 21, 2012 (http://1.usa.gov/13xWA). The Blackout and Business Interruption Were Worst in NJ Nationwide, the day after landfall, October 30, Hurricane Sandy shut down electrical service for 8.2 million customers, households and businesses. The blackout was worst in New Jersey, with 2.7 million electricity customers (or 56 percent of customers) losing power. Three days after landfall, 43 percent of customers were still without power. By comparison, in New York State, 2.1 million customers (23 percent) initially lost power, and 16 percent were still without power three days later. In New Jersey, PSE&G recruited 4,000 extra utility workers from out of state, multiplying its workforce by nearly six-‐fold. Jersey Central Power had 6,000 workers attempting to bring power back to 269,000 of its 1.1 million customers. (See Chart 3.)
Chart 3. Electricity Outages from Hurricane Sandy
Source: Energy Information Agency, DOE (http://1.usa.gov/XQY5fU). The long delay on the part of area public utilities in bringing back power was the cause of many deaths. Basic preventive measures, such as trimming trees more aggressively and burying more wires where appropriate, are now a priority.
NJ Damage/GSP Was Double That of NY Sandy met two other storms bringing cold air from the northwest, which made the winds and flood surge more dangerous than indicated by wind speed alone. Loss Estimates Estimates of losses emerged in a sequence of announcements (see summary in Table 2). Insurance companies traditionally double insured losses to arrive at total losses. Eqecat departed from that formula and Munich Re did not, but they arrived at the same total. Munich Re AG urged more investment in flood prevention infrastructure noting that for 2012 the United States is by far the largest
15
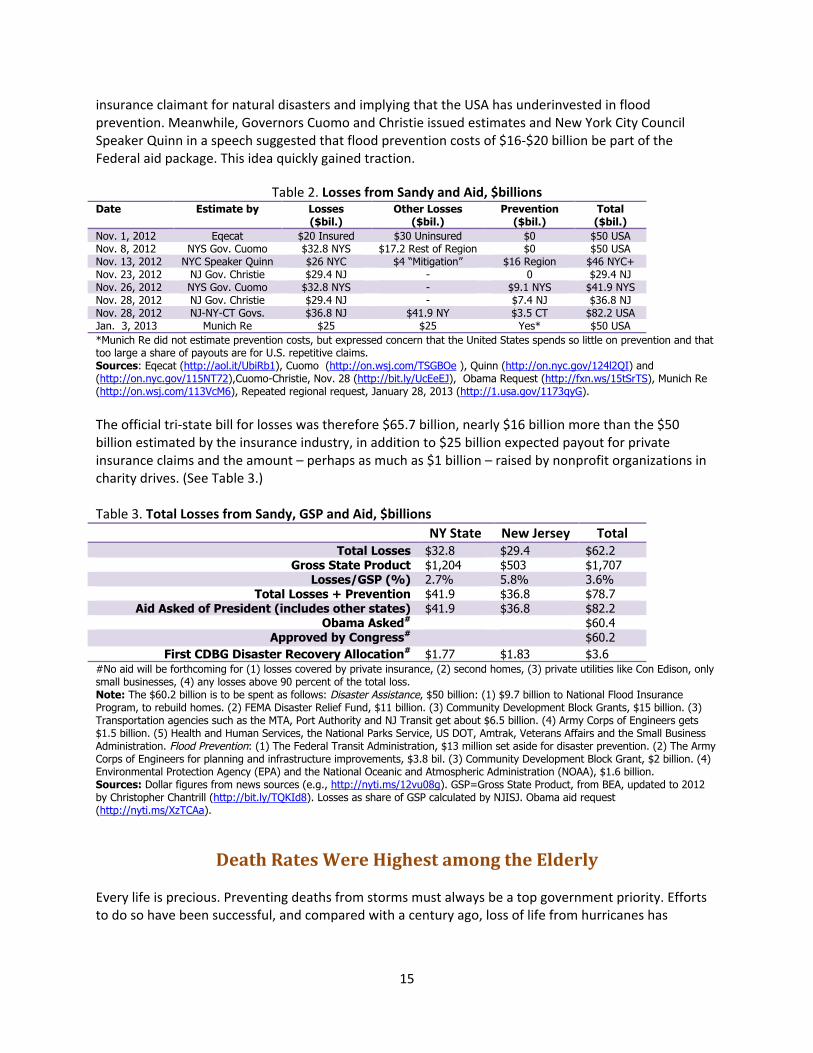
insurance claimant for natural disasters and implying that the USA has underinvested in flood prevention. Meanwhile, Governors Cuomo and Christie issued estimates and New York City Council Speaker Quinn in a speech suggested that flood prevention costs of $16-‐$20 billion be part of the Federal aid package. This idea quickly gained traction.
Table 2. Losses from Sandy and Aid, $billions
Date Estimate by Losses ($bil.)
Other Losses ($bil.)
Prevention ($bil.)
Total ($bil.)
Nov. 1, 2012 Eqecat $20 Insured $30 Uninsured $0 $50 USA Nov. 8, 2012 NYS Gov. Cuomo $32.8 NYS $17.2 Rest of Region $0 $50 USA Nov. 13, 2012 NYC Speaker Quinn $26 NYC $4 “Mitigation” $16 Region $46 NYC+ Nov. 23, 2012 NJ Gov. Christie $29.4 NJ - 0 $29.4 NJ Nov. 26, 2012 NYS Gov. Cuomo $32.8 NYS - $9.1 NYS $41.9 NYS Nov. 28, 2012 NJ Gov. Christie $29.4 NJ - $7.4 NJ $36.8 NJ Nov. 28, 2012 NJ-NY-CT Govs. $36.8 NJ $41.9 NY $3.5 CT $82.2 USA Jan. 3, 2013 Munich Re $25 $25 Yes* $50 USA *Munich Re did not estimate prevention costs, but expressed concern that the United States spends so little on prevention and that too large a share of payouts are for U.S. repetitive claims. Sources: Eqecat (http://aol.it/UbiRb1), Cuomo (http://on.wsj.com/TSGBOe ), Quinn (http://on.nyc.gov/124l2QI) and (http://on.nyc.gov/115NT72),Cuomo-Christie, Nov. 28 (http://bit.ly/UcEeEJ), Obama Request (http://fxn.ws/15tSrTS), Munich Re (http://on.wsj.com/113VcM6), Repeated regional request, January 28, 2013 (http://1.usa.gov/1173qyG). The official tri-‐state bill for losses was therefore $65.7 billion, nearly $16 billion more than the $50 billion estimated by the insurance industry, in addition to $25 billion expected payout for private insurance claims and the amount – perhaps as much as $1 billion – raised by nonprofit organizations in charity drives. (See Table 3.) Table 3. Total Losses from Sandy, GSP and Aid, $billions
NY State New Jersey Total Total Losses $32.8 $29.4 $62.2
Gross State Product $1,204 $503 $1,707 Losses/GSP (%) 2.7% 5.8% 3.6%
Total Losses + Prevention $41.9 $36.8 $78.7 Aid Asked of President (includes other states) $41.9 $36.8 $82.2
Obama Asked# $60.4 Approved by Congress# $60.2
First CDBG Disaster Recovery Allocation# $1.77 $1.83 $3.6 #No aid will be forthcoming for (1) losses covered by private insurance, (2) second homes, (3) private utilities like Con Edison, only small businesses, (4) any losses above 90 percent of the total loss. Note: The $60.2 billion is to be spent as follows: Disaster Assistance, $50 billion: (1) $9.7 billion to National Flood Insurance Program, to rebuild homes. (2) FEMA Disaster Relief Fund, $11 billion. (3) Community Development Block Grants, $15 billion. (3) Transportation agencies such as the MTA, Port Authority and NJ Transit get about $6.5 billion. (4) Army Corps of Engineers gets $1.5 billion. (5) Health and Human Services, the National Parks Service, US DOT, Amtrak, Veterans Affairs and the Small Business Administration. Flood Prevention: (1) The Federal Transit Administration, $13 million set aside for disaster prevention. (2) The Army Corps of Engineers for planning and infrastructure improvements, $3.8 bil. (3) Community Development Block Grant, $2 billion. (4) Environmental Protection Agency (EPA) and the National Oceanic and Atmospheric Administration (NOAA), $1.6 billion. Sources: Dollar figures from news sources (e.g., http://nyti.ms/12vu08g). GSP=Gross State Product, from BEA, updated to 2012 by Christopher Chantrill (http://bit.ly/TQKId8). Losses as share of GSP calculated by NJISJ. Obama aid request (http://nyti.ms/XzTCAa).
Death Rates Were Highest among the Elderly Every life is precious. Preventing deaths from storms must always be a top government priority. Efforts to do so have been successful, and compared with a century ago, loss of life from hurricanes has
16
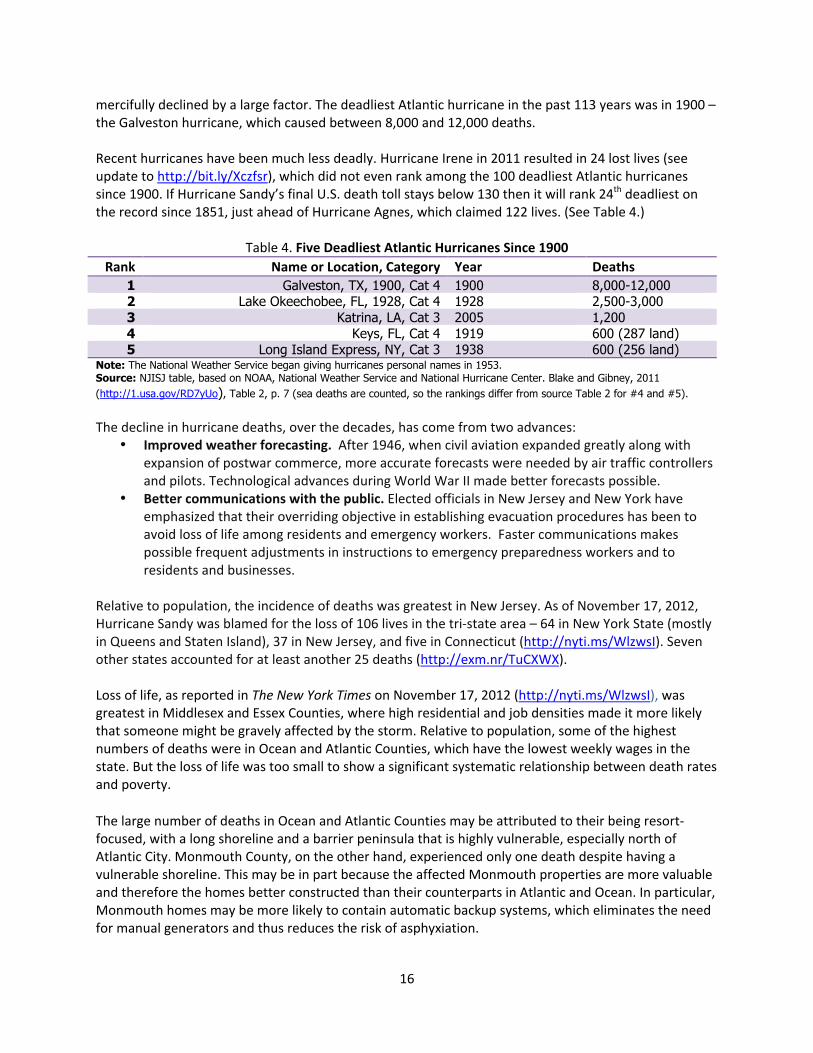
mercifully declined by a large factor. The deadliest Atlantic hurricane in the past 113 years was in 1900 – the Galveston hurricane, which caused between 8,000 and 12,000 deaths. Recent hurricanes have been much less deadly. Hurricane Irene in 2011 resulted in 24 lost lives (see update to http://bit.ly/Xczfsr), which did not even rank among the 100 deadliest Atlantic hurricanes since 1900. If Hurricane Sandy’s final U.S. death toll stays below 130 then it will rank 24th deadliest on the record since 1851, just ahead of Hurricane Agnes, which claimed 122 lives. (See Table 4.)
Table 4. Five Deadliest Atlantic Hurricanes Since 1900 Rank Name or Location, Category Year Deaths
1 Galveston, TX, 1900, Cat 4 1900 8,000-12,000 2 Lake Okeechobee, FL, 1928, Cat 4 1928 2,500-3,000 3 Katrina, LA, Cat 3 2005 1,200 4 Keys, FL, Cat 4 1919 600 (287 land) 5 Long Island Express, NY, Cat 3 1938 600 (256 land)
Note: The National Weather Service began giving hurricanes personal names in 1953. Source: NJISJ table, based on NOAA, National Weather Service and National Hurricane Center. Blake and Gibney, 2011 (http://1.usa.gov/RD7yUo), Table 2, p. 7 (sea deaths are counted, so the rankings differ from source Table 2 for #4 and #5).
The decline in hurricane deaths, over the decades, has come from two advances:
• Improved weather forecasting. After 1946, when civil aviation expanded greatly along with expansion of postwar commerce, more accurate forecasts were needed by air traffic controllers and pilots. Technological advances during World War II made better forecasts possible.
• Better communications with the public. Elected officials in New Jersey and New York have emphasized that their overriding objective in establishing evacuation procedures has been to avoid loss of life among residents and emergency workers. Faster communications makes possible frequent adjustments in instructions to emergency preparedness workers and to residents and businesses.
Relative to population, the incidence of deaths was greatest in New Jersey. As of November 17, 2012, Hurricane Sandy was blamed for the loss of 106 lives in the tri-‐state area – 64 in New York State (mostly in Queens and Staten Island), 37 in New Jersey, and five in Connecticut (http://nyti.ms/WlzwsI). Seven other states accounted for at least another 25 deaths (http://exm.nr/TuCXWX). Loss of life, as reported in The New York Times on November 17, 2012 (http://nyti.ms/WlzwsI), was greatest in Middlesex and Essex Counties, where high residential and job densities made it more likely that someone might be gravely affected by the storm. Relative to population, some of the highest numbers of deaths were in Ocean and Atlantic Counties, which have the lowest weekly wages in the state. But the loss of life was too small to show a significant systematic relationship between death rates and poverty.
The large number of deaths in Ocean and Atlantic Counties may be attributed to their being resort-‐focused, with a long shoreline and a barrier peninsula that is highly vulnerable, especially north of Atlantic City. Monmouth County, on the other hand, experienced only one death despite having a vulnerable shoreline. This may be in part because the affected Monmouth properties are more valuable and therefore the homes better constructed than their counterparts in Atlantic and Ocean. In particular, Monmouth homes may be more likely to contain automatic backup systems, which eliminates the need for manual generators and thus reduces the risk of asphyxiation.
17
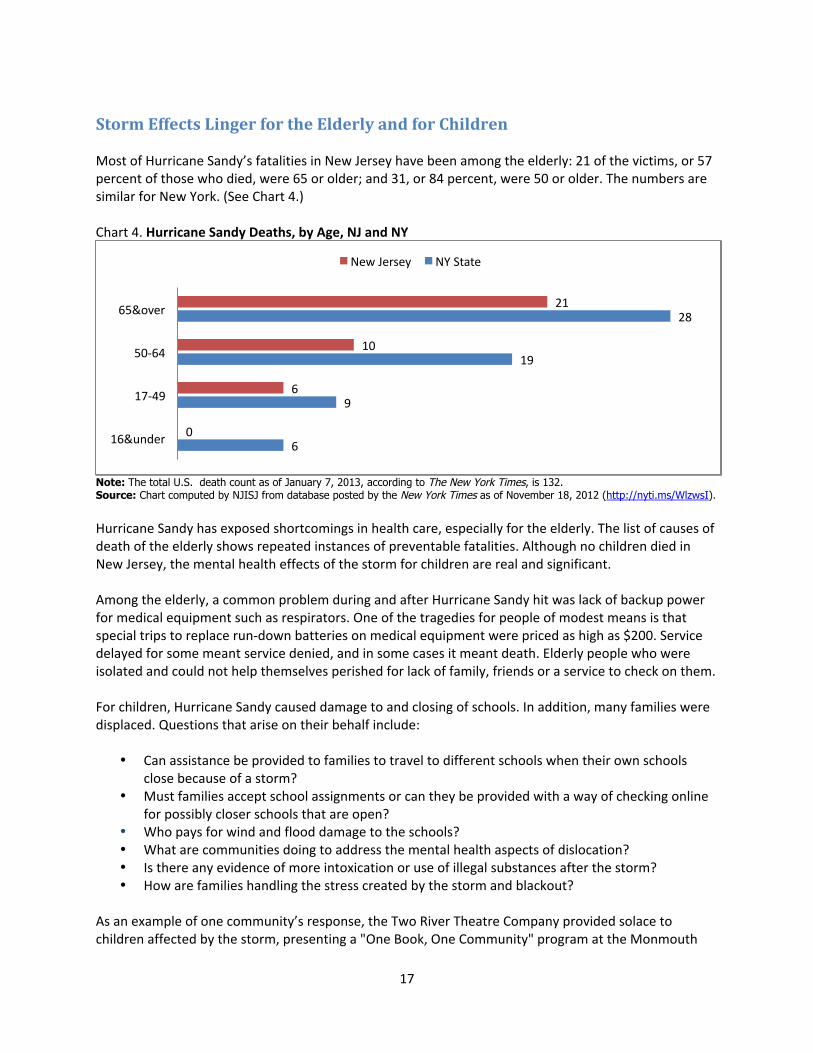
Storm Effects Linger for the Elderly and for Children Most of Hurricane Sandy’s fatalities in New Jersey have been among the elderly: 21 of the victims, or 57 percent of those who died, were 65 or older; and 31, or 84 percent, were 50 or older. The numbers are similar for New York. (See Chart 4.) Chart 4. Hurricane Sandy Deaths, by Age, NJ and NY
Note: The total U.S. death count as of January 7, 2013, according to The New York Times, is 132. Source: Chart computed by NJISJ from database posted by the New York Times as of November 18, 2012 (http://nyti.ms/WlzwsI). Hurricane Sandy has exposed shortcomings in health care, especially for the elderly. The list of causes of death of the elderly shows repeated instances of preventable fatalities. Although no children died in New Jersey, the mental health effects of the storm for children are real and significant. Among the elderly, a common problem during and after Hurricane Sandy hit was lack of backup power for medical equipment such as respirators. One of the tragedies for people of modest means is that special trips to replace run-‐down batteries on medical equipment were priced as high as $200. Service delayed for some meant service denied, and in some cases it meant death. Elderly people who were isolated and could not help themselves perished for lack of family, friends or a service to check on them. For children, Hurricane Sandy caused damage to and closing of schools. In addition, many families were displaced. Questions that arise on their behalf include:
• Can assistance be provided to families to travel to different schools when their own schools close because of a storm?
• Must families accept school assignments or can they be provided with a way of checking online for possibly closer schools that are open?
• Who pays for wind and flood damage to the schools? • What are communities doing to address the mental health aspects of dislocation? • Is there any evidence of more intoxication or use of illegal substances after the storm? • How are families handling the stress created by the storm and blackout?
As an example of one community’s response, the Two River Theatre Company provided solace to children affected by the storm, presenting a "One Book, One Community" program at the Monmouth
6
9
19
28
0
6
10
21
16&under
17-‐49
50-‐64
65&over
New Jersey NY State
18
County Library that allowed children to enjoy books and a show (http://bit.ly/UykAnC). However, Monmouth is a particularly wealthy county, and a fair question is whether some counties may not have the resources to support such nonprofit initiatives.
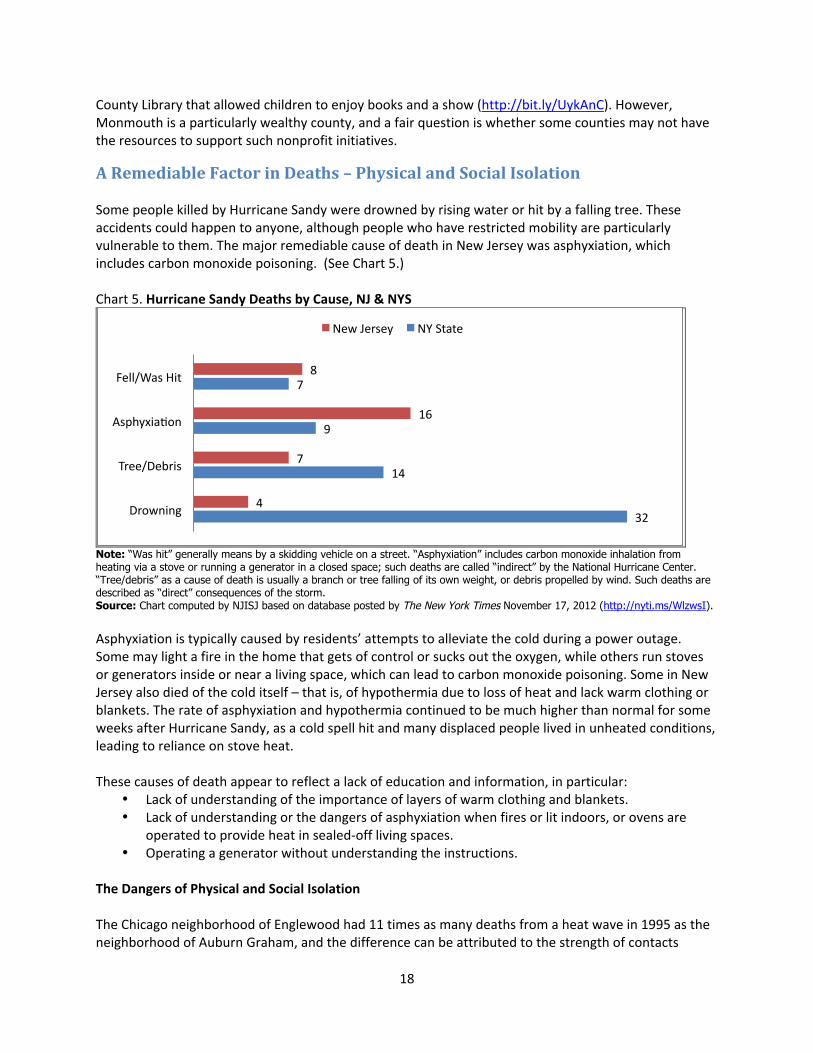
A Remediable Factor in Deaths – Physical and Social Isolation Some people killed by Hurricane Sandy were drowned by rising water or hit by a falling tree. These accidents could happen to anyone, although people who have restricted mobility are particularly vulnerable to them. The major remediable cause of death in New Jersey was asphyxiation, which includes carbon monoxide poisoning. (See Chart 5.) Chart 5. Hurricane Sandy Deaths by Cause, NJ & NYS
Note: “Was hit” generally means by a skidding vehicle on a street. “Asphyxiation” includes carbon monoxide inhalation from heating via a stove or running a generator in a closed space; such deaths are called “indirect” by the National Hurricane Center. “Tree/debris” as a cause of death is usually a branch or tree falling of its own weight, or debris propelled by wind. Such deaths are described as “direct” consequences of the storm. Source: Chart computed by NJISJ based on database posted by The New York Times November 17, 2012 (http://nyti.ms/WlzwsI). Asphyxiation is typically caused by residents’ attempts to alleviate the cold during a power outage. Some may light a fire in the home that gets of control or sucks out the oxygen, while others run stoves or generators inside or near a living space, which can lead to carbon monoxide poisoning. Some in New Jersey also died of the cold itself – that is, of hypothermia due to loss of heat and lack warm clothing or blankets. The rate of asphyxiation and hypothermia continued to be much higher than normal for some weeks after Hurricane Sandy, as a cold spell hit and many displaced people lived in unheated conditions, leading to reliance on stove heat. These causes of death appear to reflect a lack of education and information, in particular:
• Lack of understanding of the importance of layers of warm clothing and blankets. • Lack of understanding or the dangers of asphyxiation when fires or lit indoors, or ovens are
operated to provide heat in sealed-‐off living spaces. • Operating a generator without understanding the instructions.
The Dangers of Physical and Social Isolation
The Chicago neighborhood of Englewood had 11 times as many deaths from a heat wave in 1995 as the neighborhood of Auburn Graham, and the difference can be attributed to the strength of contacts
32
14
9
7
4
7
16
8
Drowning
Tree/Debris
Asphyxiason
Fell/Was Hit
New Jersey NY State
19
among members of these communities (Eric Klinenberg in “Adaptation”, The New Yorker, January 7, 2013, p. 32, http://nyr.kr/111DjP7). People in Auburn Gresham communicate, and life expectancy is high. Compared with Englewood, says Harvard sociologist Robert J. Sampson, communication in Auburn Gresham is as effective in preventing heat-‐related deaths as having a working air conditioner in every room. Communication among neighbors and centers of community activities is important for two reasons:
• It amplifies the transmission of useful information around the community, ensuring for example than no one is unaware of the risks of using a generator or how to mitigate those risks.
• It enables community members to step in when someone nearby needs help. Recommendations:
• Special efforts should be made in a storm to identify and communicate storm warnings and advice to elderly or disabled people. In an evacuation, plans should be made for retrieving pets, as many elderly people will not leave their pets behind.
• An educational campaign is needed to explain the shortcomings of ovens and generators as heating sources in a blackout. Public utilities could be enlisted to circulate information on avoiding death from this cause.
• When equipment is installed in the homes of elderly people, the length of time that backup batteries work should be communicated to the families and professionals who look after the elderly in case of a disaster, and a follow-‐up system needs to be in place. Governments’ and utilities’ storm warnings should alert people to check and recharge batteries. Similarly, the medical profession and pharmacies should alert patients to the need to have several weeks’ worth of life-‐sustaining prescriptions available in an emergency because it may not be possible in a blackout to dispense prescriptions.
• A buddy system can be created for the elderly, pairing those with phones with those who do not have them, and encouraging able-‐bodied and socially connected neighbors to keep tabs on the elderly in their community who would otherwise lack social support in a crisis. The cost of such a program would be minimal if volunteers could be recruited from churches, senior centers and other socially involved community meeting places.
Property Losses Hit the Poorest Owners and Renters Hardest Disasters hit hardest those who are unprepared. They are generally described either in a way that assigns blame, or a way that understands the reality of human life.
• The Unprepared Are Those Who Don’t Plan Ahead. The judgmental view is that those who are unprepared have only themselves to blame, because they don’t think ahead. They are like the crickets of La Fontaine’s fable, who enjoy singing when they should, like the ants, be preparing for winter. When harsh conditions arrive, the crickets cannot cope -‐ but whose fault is that?
• The Unprepared Could Be Anyone. A less judgmental view is that no one is prepared for every disaster. Unexpected things happen.
• Lack of Wealth and Income Mean Unpreparedness. The most realistic view is that the jobless
have only the income they receive from family or the state. Those with low-‐income jobs find it difficult to save or buy insurance. In a disaster, they have few resources on which they can rely.
20
Someone who has adequate savings and insurance to get through a disaster with equanimity deserves great credit for forethought. But people may under-‐save and under-‐insure because they don’t earn much. Someone may understand that insurance is valuable protection but not be able to afford to pay the premium to be fully insured. It is easy to underestimate the probability of a disaster, as anyone in the financial sector will admit since 2008.
Those least able to insure or save are the jobless – the disabled, children, or the very old. They depend on public services for their transportation, education, health care, even their food and shelter. It is widely acknowledged in the United States that the government has some responsibility to look after these groups. What the data that follow show is that Hurricane Sandy brings into relief a significant portion of Americans who are working but are still unable to cope well with a crisis, because their income does not allow them to buy (or rent) well-‐constructed housing. They take the biggest hit.
Damage Is Greatest in Poorer Areas, Relative to Property Value The damage along the New Jersey coast was unprecedented, as whole communities were inundated by water and sand. Boardwalks were destroyed, cars and other vehicles tossed yards from where they were parked, and boats pushed inland hundreds of yards from their moorings. Houses were lifted from their foundations – Governor Christie announced 346,000 housing units were damaged or destroyed, with 22,000 of them rendered uninhabitable. Breaks in natural gas lines, occurring as a result of the storm, caused fires in some locations, resulting in the destruction of many residences. Power and gas line repair is expected to cost $1 billion and repairs to the water and sewer services are estimated to cost another $3 billion. Damage occurred up and down the Jersey coast. The following are examples, with FEMA losses (see Table 8) in parentheses. Atlantic County ($61 million): Atlantic County was directly in Sandy’s eye as it landed. Floods surged through the streets of Atlantic City, with the waves destroying the boardwalk, the timbers floating on the water and causing more damage. Most of the city was under water. Many highway arteries were also flooded. The Borgata Hotel Casino & Spa reopened after four days, but other buildings were not as lucky.
Bergen County ($29 million): A levee breach caused flooding in Moonachie, Carlstadt and Little Ferry, N.J., with up to five feet of water. Hundreds had to be rescued.
Cape May County ($16 million): Cape May itself had much less serious flooding than Atlantic City. The storm was rotating counter-‐clockwise, so north of Atlantic City was worse off than south. Boats and marinas in Cape May were seriously damaged. Hudson County ($25 million): Hoboken streets were flooded, its PATH terminal closed. At least 20,000 of its residents were surrounded by water at the peak of the surge. The community center in Hoboken, its public works garage, three or four fire houses, and more than 1,700 homes were flooded. FEMA losses do not count lost government facilities; when they are included, total losses are likely to exceed
21
$100 million. Jersey City suffered massive street and building flooding, downed trees, power outages and a tree falling on a police car.
Middlesex County ($25.6 million): Flooding and wind damage occurred throughout the county. New Brunswick and Edison experienced flooding. A man died when a tree fell on his house in Hawthorne. The marina and several waterfront buildings in Perth Amboy, N.J. were destroyed. Twenty-‐four freight train cars were found on the New Jersey Turnpike in Carteret, N.J.
Monmouth County ($172 million): Major destruction occurred in Asbury Park, N.J., including flooding, damage to the boardwalk and the collapse of a car dealership. The southern part of the boardwalk in Asbury Park and in neighboring communities to the south was destroyed. Atlantic Highlands and Highlands were flooded. There was major damage in Belmar, N.J. including flooding, beach erosion and wind damage to buildings. Sea Bright was destroyed, and Union Beach was devastated with downed trees, utility poles, property damage and severe flooding. The boardwalk in Sea Girt, N.J. was destroyed. To the west of Union Beach, Sayreville suffered extensively from flooding. Route 36 along the Jersey Shore was closed because of debris in the roadway.
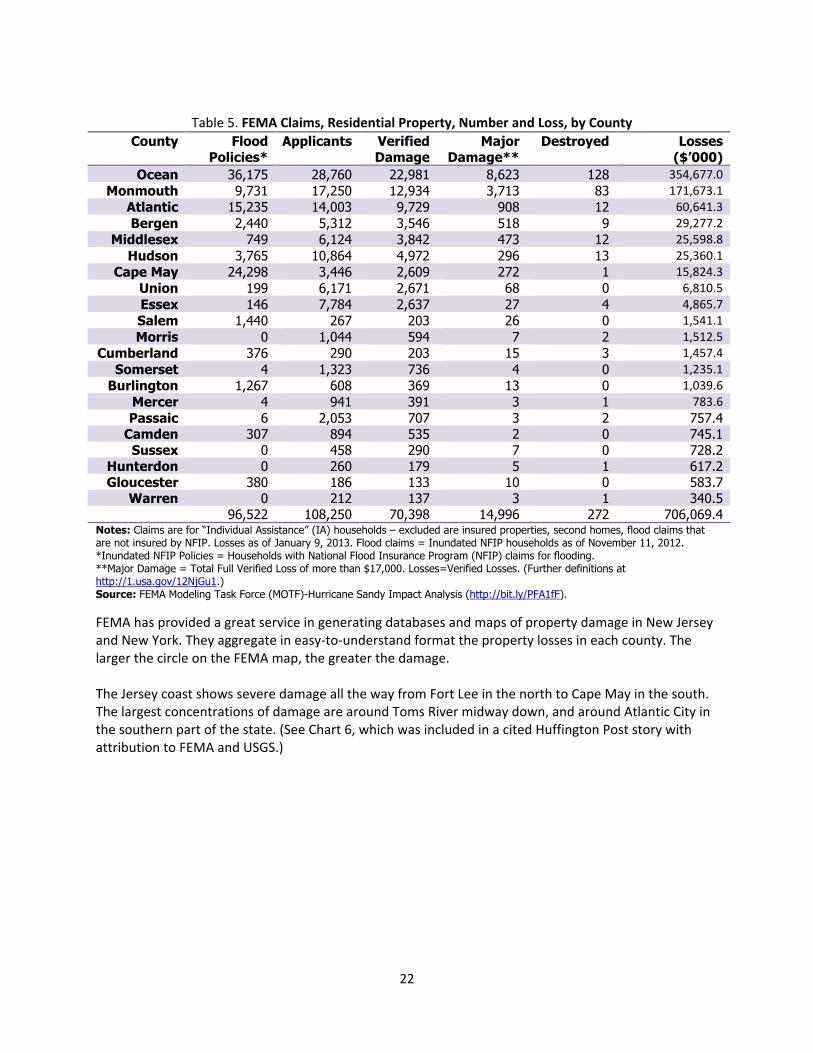
Ocean County ($355 million): In Mantoloking, a majority of structures were flooded, badly damaged, or destroyed. The surge made a path through the barrier island. In Seaside Heights, the iconic Casino Pier and Funtown Pier were destroyed, with damage to the boardwalk, destroying the local amusement park. Toms River, farther inland, also suffered heavy destruction, with boats tossed onto lawns. The FEMA map of Sandy damage shows the extent of the destruction. To the north, Long Beach Island, a barrier island, suffered catastrophic damage with nearly every house on the seaside shore extensively damaged. Union County ($6.8 million). Power lines and trees were down throughout the western end of the county, with many communities experiencing power outages. Inland waterways in the county, including the Rahway River, did not flood like they did with Hurricane Irene. The marina in the port area of Elizabeth, N.J. was destroyed in the tidal surge. The marina was largely destroyed and the boats were scattered in the surrounding neighborhood. Flooding from the tidal surge impacted 20-‐30 homes in the Trembly Point neighborhood of Linden, N.J. A summary of table claims lodged with FEMA by county shows total losses of $706.1 million. This figure grows each week as claims are filed. The table conveys the size and distribution of the losses and also the process of evaluating each claim. (See Table 5.)
22
Table 5. FEMA Claims, Residential Property, Number and Loss, by County
County Flood Policies*
Applicants Verified Damage
Major Damage**
Destroyed Losses ($’000)
Ocean 36,175 28,760 22,981 8,623 128 354,677.0 Monmouth 9,731 17,250 12,934 3,713 83 171,673.1
Atlantic 15,235 14,003 9,729 908 12 60,641.3 Bergen 2,440 5,312 3,546 518 9 29,277.2
Middlesex 749 6,124 3,842 473 12 25,598.8 Hudson 3,765 10,864 4,972 296 13 25,360.1
Cape May 24,298 3,446 2,609 272 1 15,824.3 Union 199 6,171 2,671 68 0 6,810.5 Essex 146 7,784 2,637 27 4 4,865.7 Salem 1,440 267 203 26 0 1,541.1 Morris 0 1,044 594 7 2 1,512.5
Cumberland 376 290 203 15 3 1,457.4 Somerset 4 1,323 736 4 0 1,235.1
Burlington 1,267 608 369 13 0 1,039.6 Mercer 4 941 391 3 1 783.6 Passaic 6 2,053 707 3 2 757.4
Camden 307 894 535 2 0 745.1 Sussex 0 458 290 7 0 728.2
Hunterdon 0 260 179 5 1 617.2 Gloucester 380 186 133 10 0 583.7
Warren 0 212 137 3 1 340.5 96,522 108,250 70,398 14,996 272 706,069.4
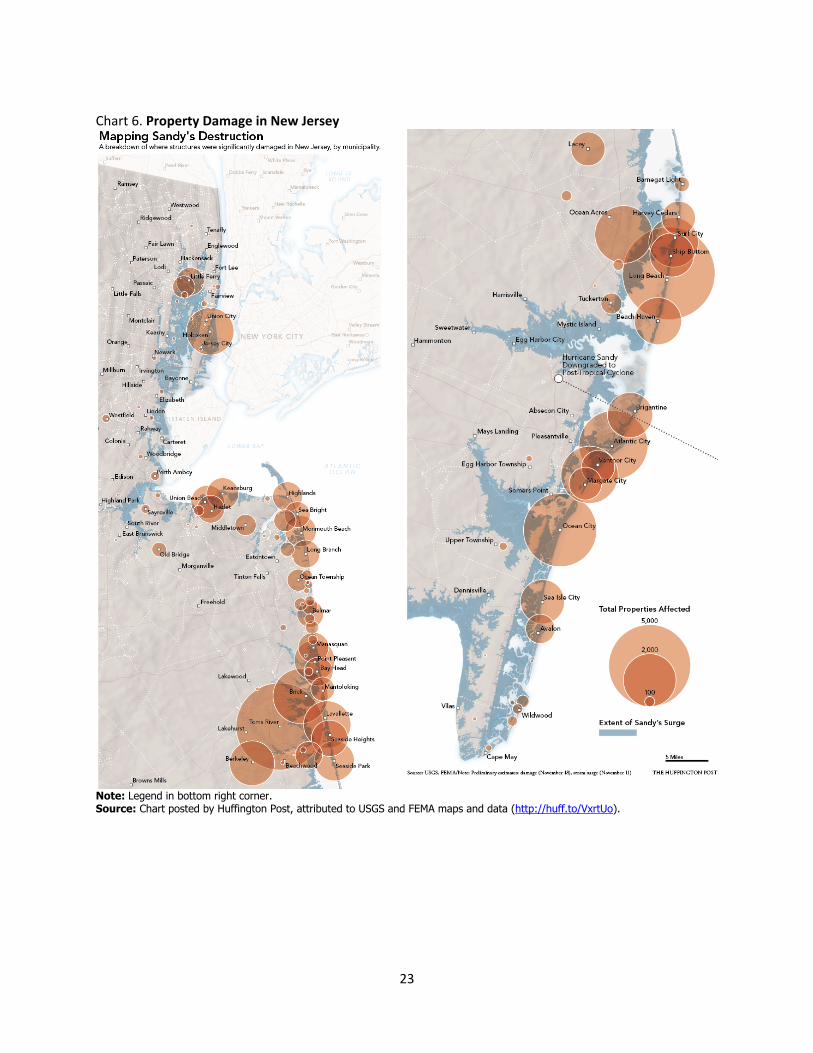
Notes: Claims are for “Individual Assistance” (IA) households – excluded are insured properties, second homes, flood claims that are not insured by NFIP. Losses as of January 9, 2013. Flood claims = Inundated NFIP households as of November 11, 2012. *Inundated NFIP Policies = Households with National Flood Insurance Program (NFIP) claims for flooding. **Major Damage = Total Full Verified Loss of more than $17,000. Losses=Verified Losses. (Further definitions at http://1.usa.gov/12NjGu1.) Source: FEMA Modeling Task Force (MOTF)-Hurricane Sandy Impact Analysis (http://bit.ly/PFA1fF). FEMA has provided a great service in generating databases and maps of property damage in New Jersey and New York. They aggregate in easy-‐to-‐understand format the property losses in each county. The larger the circle on the FEMA map, the greater the damage. The Jersey coast shows severe damage all the way from Fort Lee in the north to Cape May in the south. The largest concentrations of damage are around Toms River midway down, and around Atlantic City in the southern part of the state. (See Chart 6, which was included in a cited Huffington Post story with attribution to FEMA and USGS.)
23
Chart 6. Property Damage in New Jersey
Note: Legend in bottom right corner. Source: Chart posted by Huffington Post, attributed to USGS and FEMA maps and data (http://huff.to/VxrtUo).

24
Another way to look at the damage is to rank the number of homes and businesses damaged relative to population, by county. This shows that four counties bore the brunt of the damage – Ocean, Atlantic, Cape May and Monmouth. (See Chart 7.)
Chart 7. Number of Damaged Homes per 1,000 Residents, by County
Notes: County population estimates as of July 1, 2011. Sources: Home damage data from FEMA MOTF-Hurricane Sandy Impact Analysis (accessible at http://bit.ly/PFA1fF); income data from U.S. Census Bureau, 2011 American Community Survey; population data from U.S. Census Bureau, Annual Estimates of the Resident Population: April 1, 2010 to July 1, 2011 (http://factfinder2.census.gov/).
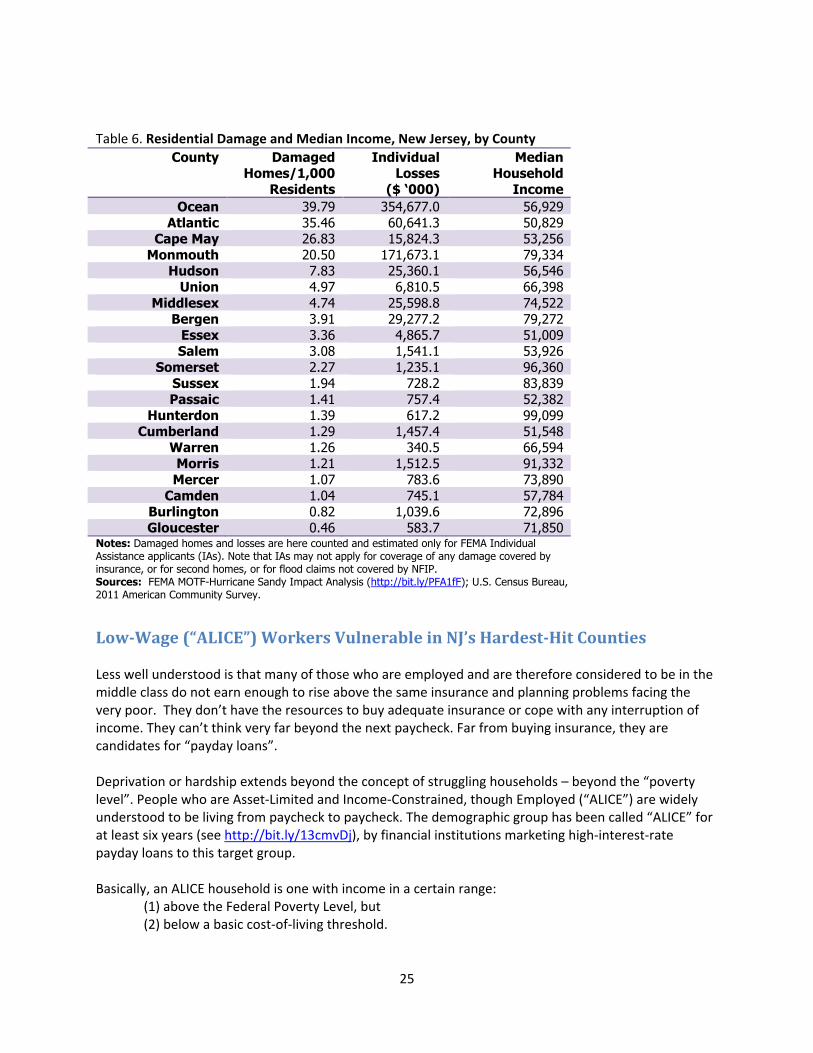
Four of the five hardest-‐hit counties are among the poorest – Ocean, Atlantic and Cape May and Hudson, all with median incomes of below $57,000. (See Table 6.) Monmouth is wealthier as a whole, but the lower half of the county (including Asbury Park) is not as well off as the area within easier commuting distance to New York City.
0.46 0.82 1.04 1.07 1.21 1.26 1.29 1.39 1.41 1.94 2.27
3.08 3.36 3.91
4.74 4.97
7.83 20.5
26.83 35.46
39.79
Gloucester Burlington
Camden Mercer
Morris Warren
Cumberland Hunterdon
Passaic Sussex
Somerset Salem Essex Bergen
Middlesex Union
Hudson Monmouth Cape May
Atlantic Ocean
25
Table 6. Residential Damage and Median Income, New Jersey, by County
County Damaged Homes/1,000
Residents
Individual Losses
($ ‘000)
Median Household
Income Ocean 39.79 354,677.0 56,929
Atlantic 35.46 60,641.3 50,829 Cape May 26.83 15,824.3 53,256
Monmouth 20.50 171,673.1 79,334 Hudson 7.83 25,360.1 56,546
Union 4.97 6,810.5 66,398 Middlesex 4.74 25,598.8 74,522
Bergen 3.91 29,277.2 79,272 Essex 3.36 4,865.7 51,009 Salem 3.08 1,541.1 53,926
Somerset 2.27 1,235.1 96,360 Sussex 1.94 728.2 83,839 Passaic 1.41 757.4 52,382
Hunterdon 1.39 617.2 99,099 Cumberland 1.29 1,457.4 51,548
Warren 1.26 340.5 66,594 Morris 1.21 1,512.5 91,332 Mercer 1.07 783.6 73,890
Camden 1.04 745.1 57,784 Burlington 0.82 1,039.6 72,896 Gloucester 0.46 583.7 71,850
Notes: Damaged homes and losses are here counted and estimated only for FEMA Individual Assistance applicants (IAs). Note that IAs may not apply for coverage of any damage covered by insurance, or for second homes, or for flood claims not covered by NFIP. Sources: FEMA MOTF-Hurricane Sandy Impact Analysis (http://bit.ly/PFA1fF); U.S. Census Bureau, 2011 American Community Survey.
Low-Wage (“ALICE”) Workers Vulnerable in NJ’s Hardest-Hit Counties Less well understood is that many of those who are employed and are therefore considered to be in the middle class do not earn enough to rise above the same insurance and planning problems facing the very poor. They don’t have the resources to buy adequate insurance or cope with any interruption of income. They can’t think very far beyond the next paycheck. Far from buying insurance, they are candidates for “payday loans”. Deprivation or hardship extends beyond the concept of struggling households – beyond the “poverty level”. People who are Asset-‐Limited and Income-‐Constrained, though Employed (“ALICE”) are widely understood to be living from paycheck to paycheck. The demographic group has been called “ALICE” for at least six years (see http://bit.ly/13cmvDj), by financial institutions marketing high-‐interest-‐rate payday loans to this target group. Basically, an ALICE household is one with income in a certain range:
(1) above the Federal Poverty Level, but (2) below a basic cost-‐of-‐living threshold.
26
In other words, at least one person in the household has a job, but one that pays less than a living wage. Therefore the household barely makes ends meet and is a target for borrowing money that it may end up never repaying in full. A study focusing on this group in New York City was published in 2000 by the Community Service Society (http://bit.ly/Ux4ysN). A recent Internet dialog includes comments about the potential revenue to be derived from ALICE customers. As real income falls, more Americans rely on “financial products” that help them get by, especially “unsecured short-‐term consumer loans” or “secured pawn loans” that are grouped together as payday loans because they are borrowed between paydays and are meant to be paid off when the worker gets paid. The comments by marketers of these loans suggest they see growing numbers of people living from paycheck to paycheck. Hardship for the families spells opportunity for high-‐interest short-‐term lenders:
Our payday loan customer is the Wal-‐Mart customer; the blue-‐collar, white-‐collar employee making $18,000 to $48,000 a year! As [someone] pointed out in a conference call, “The average wage rate for ALICE is shrinking against the rising tide of higher costs for food, gasoline, health care and other basic necessities”(http://bit.ly/WteymR).
“ALICE” in New Jersey and Hard-‐Hit Counties A five-‐year study for the United Way of New Jersey released in 2012 examined ALICE households in New Jersey and found:
• Twice as many households (829,000 in 2011) are in the ALICE category (below the ALICE threshold and above the poverty line) as are below the official poverty rate (319,968).
• One-‐third (34 percent) of New Jersey households are below the ALICE threshold. All of these households have too little or barely enough to support themselves, but only one-‐third are officially defined as poor.
• In the state of New Jersey, on the basis of the poverty line threshold, 131,931 households with children in 2010 were poor and 61,149 elderly households (i.e., at least one member over 65) were poor.
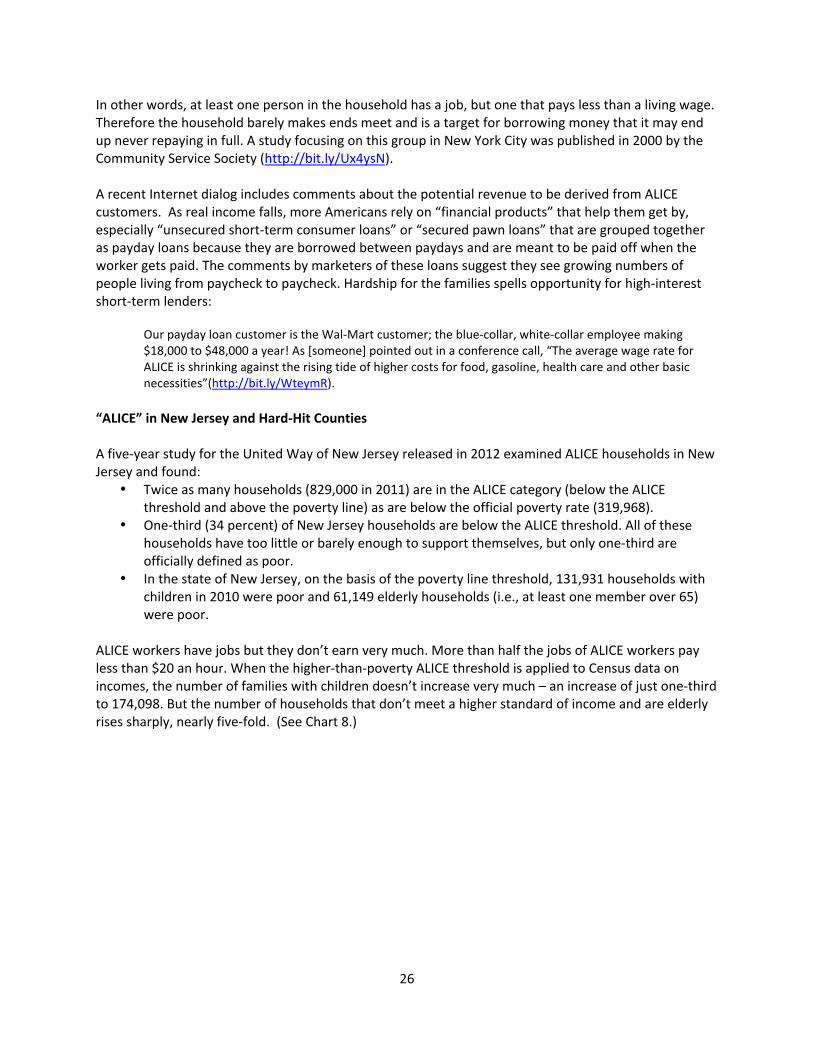
ALICE workers have jobs but they don’t earn very much. More than half the jobs of ALICE workers pay less than $20 an hour. When the higher-‐than-‐poverty ALICE threshold is applied to Census data on incomes, the number of families with children doesn’t increase very much – an increase of just one-‐third to 174,098. But the number of households that don’t meet a higher standard of income and are elderly rises sharply, nearly five-‐fold. (See Chart 8.)
27
Chart 8. Low-‐Wage Workers, the “ALICE” Threshold, New Jersey, 2010
Source: Chart by United Way of Northern New Jersey, ALICE: Financial Hardship in New Jersey, 2012 (http://bit.ly/SgS0tW), based on U.S. Census Bureau, American Community Survey, 2010 and 2007.
Source: Chart by United Way of Northern New Jersey, ALICE: Financial Hardship in New Jersey, 2012 (http://bit.ly/SgS0tW).
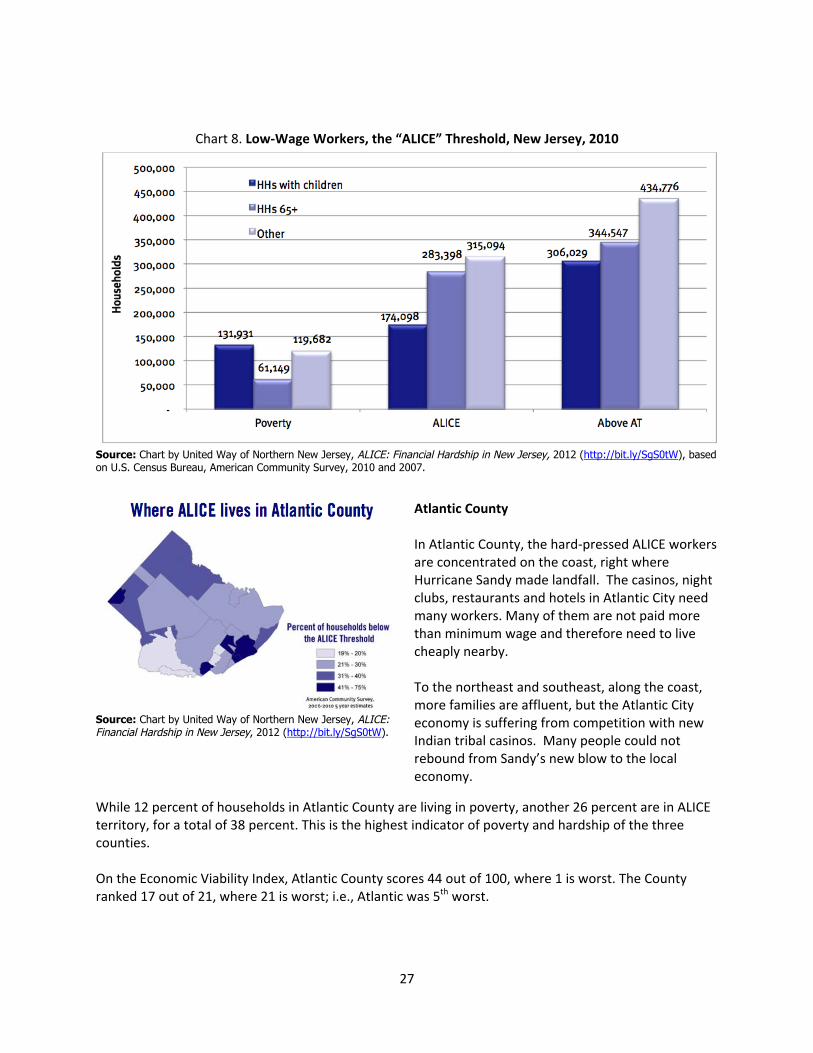
Atlantic County
In Atlantic County, the hard-‐pressed ALICE workers are concentrated on the coast, right where Hurricane Sandy made landfall. The casinos, night clubs, restaurants and hotels in Atlantic City need many workers. Many of them are not paid more than minimum wage and therefore need to live cheaply nearby. To the northeast and southeast, along the coast, more families are affluent, but the Atlantic City economy is suffering from competition with new Indian tribal casinos. Many people could not rebound from Sandy’s new blow to the local economy.
While 12 percent of households in Atlantic County are living in poverty, another 26 percent are in ALICE territory, for a total of 38 percent. This is the highest indicator of poverty and hardship of the three counties. On the Economic Viability Index, Atlantic County scores 44 out of 100, where 1 is worst. The County ranked 17 out of 21, where 21 is worst; i.e., Atlantic was 5th worst.
28
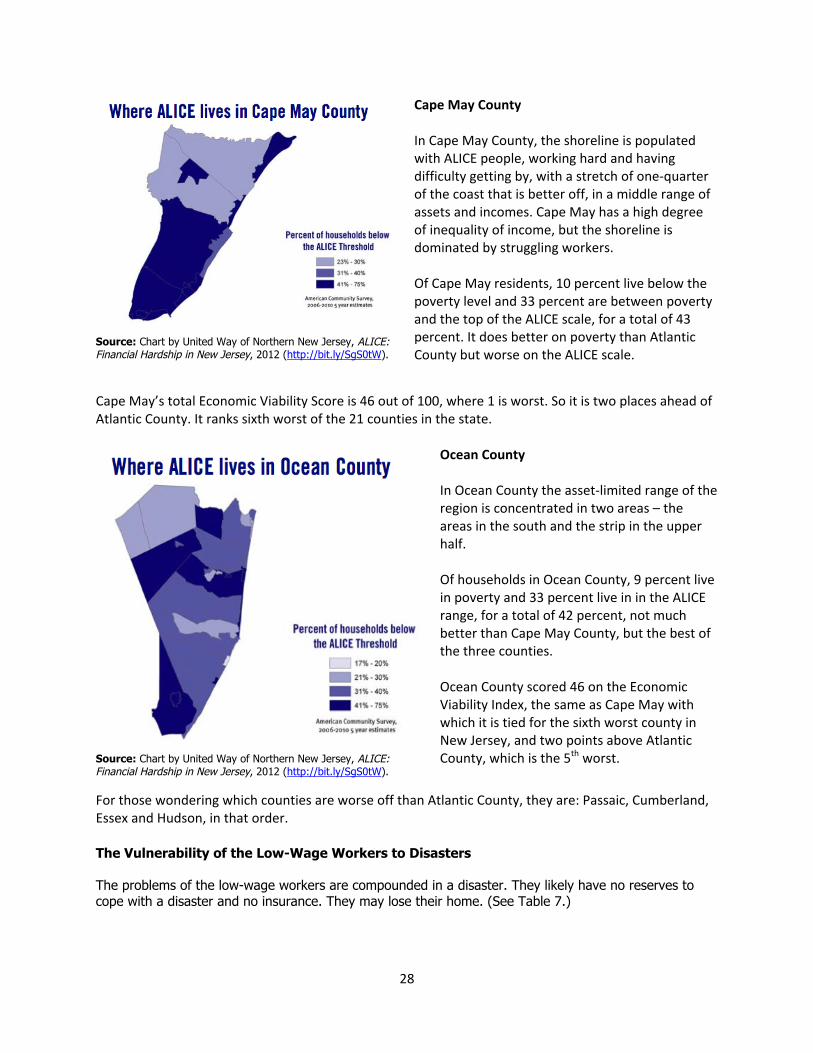
Source: Chart by United Way of Northern New Jersey, ALICE: Financial Hardship in New Jersey, 2012 (http://bit.ly/SgS0tW).
Cape May County In Cape May County, the shoreline is populated with ALICE people, working hard and having difficulty getting by, with a stretch of one-‐quarter of the coast that is better off, in a middle range of assets and incomes. Cape May has a high degree of inequality of income, but the shoreline is dominated by struggling workers. Of Cape May residents, 10 percent live below the poverty level and 33 percent are between poverty and the top of the ALICE scale, for a total of 43 percent. It does better on poverty than Atlantic County but worse on the ALICE scale.
Cape May’s total Economic Viability Score is 46 out of 100, where 1 is worst. So it is two places ahead of Atlantic County. It ranks sixth worst of the 21 counties in the state.
Source: Chart by United Way of Northern New Jersey, ALICE: Financial Hardship in New Jersey, 2012 (http://bit.ly/SgS0tW).
Ocean County In Ocean County the asset-‐limited range of the region is concentrated in two areas – the areas in the south and the strip in the upper half. Of households in Ocean County, 9 percent live in poverty and 33 percent live in in the ALICE range, for a total of 42 percent, not much better than Cape May County, but the best of the three counties. Ocean County scored 46 on the Economic Viability Index, the same as Cape May with which it is tied for the sixth worst county in New Jersey, and two points above Atlantic County, which is the 5th worst.
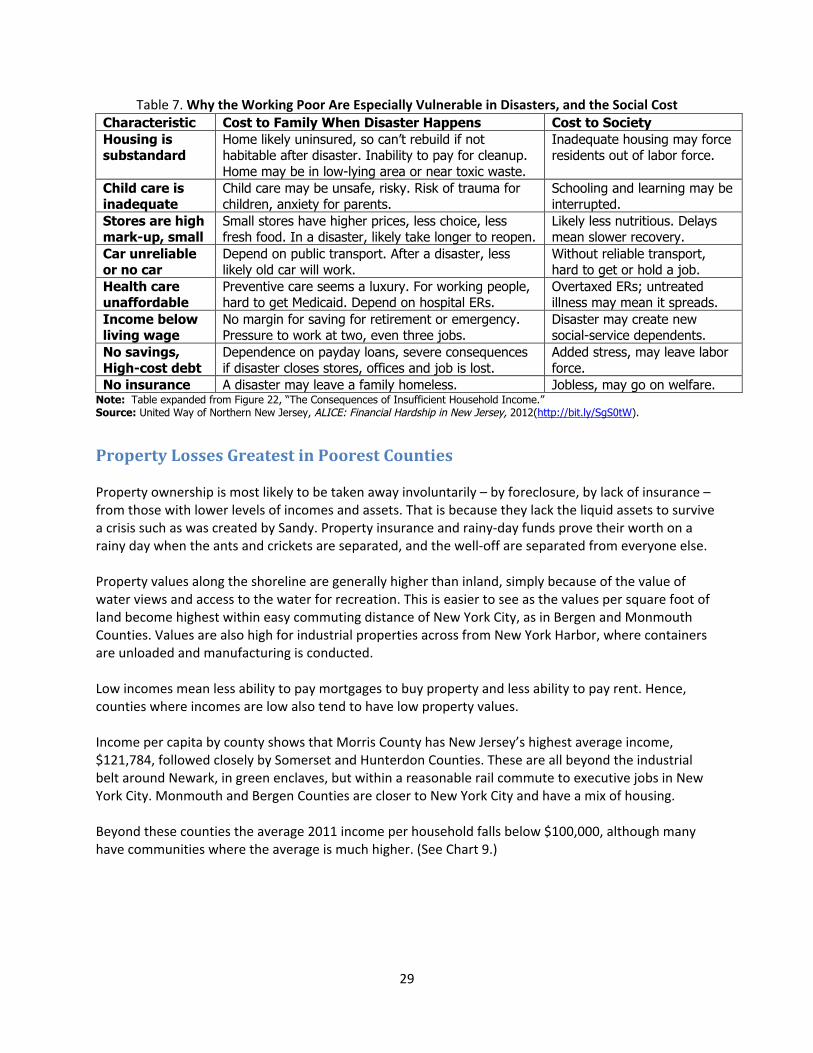
For those wondering which counties are worse off than Atlantic County, they are: Passaic, Cumberland, Essex and Hudson, in that order. The Vulnerability of the Low-Wage Workers to Disasters The problems of the low-wage workers are compounded in a disaster. They likely have no reserves to cope with a disaster and no insurance. They may lose their home. (See Table 7.)
29
Table 7. Why the Working Poor Are Especially Vulnerable in Disasters, and the Social Cost Characteristic Cost to Family When Disaster Happens Cost to Society Housing is substandard
Home likely uninsured, so can’t rebuild if not habitable after disaster. Inability to pay for cleanup. Home may be in low-lying area or near toxic waste.
Inadequate housing may force residents out of labor force.
Child care is inadequate
Child care may be unsafe, risky. Risk of trauma for children, anxiety for parents.
Schooling and learning may be interrupted.
Stores are high mark-up, small
Small stores have higher prices, less choice, less fresh food. In a disaster, likely take longer to reopen.
Likely less nutritious. Delays mean slower recovery.
Car unreliable or no car
Depend on public transport. After a disaster, less likely old car will work.
Without reliable transport, hard to get or hold a job.
Health care unaffordable
Preventive care seems a luxury. For working people, hard to get Medicaid. Depend on hospital ERs.
Overtaxed ERs; untreated illness may mean it spreads.
Income below living wage
No margin for saving for retirement or emergency. Pressure to work at two, even three jobs.
Disaster may create new social-service dependents.
No savings, High-cost debt
Dependence on payday loans, severe consequences if disaster closes stores, offices and job is lost.
Added stress, may leave labor force.
No insurance A disaster may leave a family homeless. Jobless, may go on welfare. Note: Table expanded from Figure 22, “The Consequences of Insufficient Household Income.” Source: United Way of Northern New Jersey, ALICE: Financial Hardship in New Jersey, 2012(http://bit.ly/SgS0tW).
Property Losses Greatest in Poorest Counties Property ownership is most likely to be taken away involuntarily – by foreclosure, by lack of insurance – from those with lower levels of incomes and assets. That is because they lack the liquid assets to survive a crisis such as was created by Sandy. Property insurance and rainy-‐day funds prove their worth on a rainy day when the ants and crickets are separated, and the well-‐off are separated from everyone else. Property values along the shoreline are generally higher than inland, simply because of the value of water views and access to the water for recreation. This is easier to see as the values per square foot of land become highest within easy commuting distance of New York City, as in Bergen and Monmouth Counties. Values are also high for industrial properties across from New York Harbor, where containers are unloaded and manufacturing is conducted. Low incomes mean less ability to pay mortgages to buy property and less ability to pay rent. Hence, counties where incomes are low also tend to have low property values. Income per capita by county shows that Morris County has New Jersey’s highest average income, $121,784, followed closely by Somerset and Hunterdon Counties. These are all beyond the industrial belt around Newark, in green enclaves, but within a reasonable rail commute to executive jobs in New York City. Monmouth and Bergen Counties are closer to New York City and have a mix of housing. Beyond these counties the average 2011 income per household falls below $100,000, although many have communities where the average is much higher. (See Chart 9.)

30
Chart 9. Average Income per Household, New Jersey Counties, 2011
Source: Chart by NJISJ based on data from BLS and NJ Department of Labor. The three counties that suffered the most loss from damaged homes are Atlantic, Ocean and Cape May. Cape May suffered the most relative to its population density. Note that these three counties on the southern end of New Jersey have much lower average incomes. Also, the resort areas have seasonal incomes. The difference between north and south Jersey is that the huge employer, New York City, is at the north end. Philadelphia is connected by rail all the way to Atlantic City, but the south-‐eastern end of the state has few employers other than (1) seasonal businesses in resorts and farms and (2) businesses that provide services to commuters to Philadelphia in suburban bedroom communities. Why wasn’t there more damage in Northern New Jersey? Given the 127 miles from Sandy Hook to Cape May (and longer from Fort Lee), and the fact that the hurricane was spinning counter-‐clockwise offshore before it made landfall just south of Atlantic City, why were the three hardest-‐hit counties – Cape May, Atlantic and Ocean – all in the southern part of the state? One answer is that the farther up the coast the shoreline is, the easier it is to commute north to New York City, where there are higher weekly incomes. A majority of workers in the northern counties leave
64,370 66,404 69,308 72,963 73,618 74,571 76,339 76,635 80,167 83,765 85,614
90,882 91,077 94,659 95,028 95,784 96,527
105,488 109,907
120,962 121,296 $121,784
-‐ 20,000 40,000 60,000 80,000 100,000 120,000 140,000
Cumberland County Atlansc County Salem County Ocean County Passaic County Camden County Hudson County
Cape May County Essex County
Gloucester County Warren County
New Jersey Average Middlesex County
Union County Burlington County
Mercer County Sussex County Bergen County
Monmouth County Hunterdon County Somerset County
Morris County

31
the county to work in New York City. Valuable real estate tends to include a solid concrete foundation to homes and construction that may include steel, stone or brick or at least wooden frames that are thick and have well-‐insulated walls. Less valuable real estate may have wooden homes with inadequate foundations and inadequate wall thickness and insulation. An indicator of the likelihood of having hurricane-‐resistant residences is the level of property taxes, since rates tend to be more uniform than property values. Seven of the ten counties with the highest median property taxes in the USA are in New Jersey. The remaining three are in New York State – Nassau, Westchester and Rockland, also within commuting distance of New York City. None of the five counties of New York City is on the list because NYC’s property tax rates are unusually low even by national standards. (See Table 8.) Table 8. Median Property Taxes, 2005-‐2009: 10 Top U.S. Counties Rank County State Median Residential
Property Taxes 1 Hunterdon County NJ $8,216 2 Nassau County NY $8,206 3 Westchester County NY $8,160 4 Bergen County NJ $7,925 5 Rockland County NY $7,676 6 Essex County NJ $7,489 7 Somerset County NJ $7,421 8 Morris County NJ $7,298 9 Union County NJ $7,075
10 Passaic County NJ $7,055 Note: Taxes in New York State and New Jersey are not primarily because of rates but because of property values. High property values should be a source of state and local pride. The other side of the coin is that high property values in New York and New Jersey mean a scarcity of housing for people who want to pay an average U.S. rent. It has been exceedingly difficult to find homes for families displaced by Sandy. Source: Based on U.S. Census Bureau data. By contrast, the non-‐commuting counties have much lower property values. The four counties that have the highest percentage of residents who work in their home counties (i.e., the fewest commuters) are: Atlantic (68.5 percent), Cape May (54.6 percent), Monmouth (44.3 percent) and Ocean (43.7 percent):
• Atlantic, Cape May and Ocean Counties (i.e., the three hardest-‐hit resort counties) are heavily into the summer rental business. Of housing units that are vacated during the year in shore counties, 72 per cent are seasonal units available for rent during the peak summer tourism season; the majority of the seasonally vacant units were in Cape May (48,814 units) and Ocean (42,056) Counties.
• Some of the homes are rented out for little money to low-‐wage workers. Destruction of these homes by Hurricane Sandy raises questions about replacing the income for the owners who may not be able to rebuild, as well as questions about finding places for low-‐income workers to stay in the summer of 2013.
• The fourth “non-‐commuting” county is Monmouth, which is a mixture, with many commuters on the northern end, but has many seasonal Jersey Shore homes on the southern end (http://bit.ly/V4HKpL).
32
How Underinsurance Hurts the Low-Wage Worker Hardest Private insurance pays for property damage, often loss of use of property, and, where covered, business interruption. Total insured property losses from Hurricane Sandy in the United States have been estimated by Munich Re AG in early January at $25 billion. For comparison, insurance claims for 9/11 came to $47 billion.
What Is Insured and What Is Not Insurance coverage depends on the policy. By and large, private insurers do not insure against flood damage, although they administer a government flood insurance program. Covered: Physical Property Insurance and Loss of Use/Business Interruption The two main kinds of insured property losses are loss of property and loss of use and business interruption. When a disaster hits, the property loss claims come in immediately – not just damage to buildings and their content, but also the cost of throwing out perishables after a power blackout. Loss of use and business interruption claims occur over time, as repairs begin and the extent of damage plays out in the attempt to use the space again. Insured Damage to Physical Property. Buildings and their contents can be destroyed by wind, flooding or a combination. To property owners, these destroyed buildings represent a loss of their wealth. The first wind damage may be from flying debris, the lifting off of roofs, or the flattening of flimsily constructed buildings. Delayed effects may include (a) loss of electricity from downed power lines, which means that many perishables have to be thrown out, and (b) flooding, which destroys or renders temporarily useless some kinds of property, especially if the flooding is from salt water. The salt deposits damage power and signal connections and create huge problems for reliable electricity supply and therefore the electricity-‐dependent transportation infrastructure. Insured Loss of Use/Business Interruption. The delayed effects of a hurricane also include business interruption, a cost that landlords and businesses increasingly insure against. When a restaurant or a theater remains closed because of floods that prevent people from showing up, it is hard to make up the loss because the business space has a limited capacity. Some businesses can recoup their losses after a disaster – retail stores, for example, that offer a post-‐disaster sale. But others – like restaurants or movie theaters – cannot pack in extra people because seating is limited. Business-‐interruption losses are included in figures for more recent years, but were not included in the numbers of a century ago, which biases later numbers upward even if the numbers are, as they should be, adjusted for inflation.
Types of Uninsured or Underinsured Properties Private insurance does not cover losses that are excluded from insurance policies, or are above a set upper limit, or losses on policies that are not paid up. Private insurance does not cover all losses. Policies must be taken out for certain amounts of loss and premiums must be paid that vary with the insured amount, the risk and the insured’s uncovered deductible from the loss amount. Uninsured

33
losses are ordinarily borne by the people who suffer the loss – the homeowner or the business property owner. Governments pay for cleanup and for public insurance programs such as flood insurance. Governments themselves frequently self-‐insure. When a disaster happens, they raise taxes, either through a special assessment or a general increase in property-‐tax rates. Uninsured Private Losses. The National Hurricane Center and the private forecasting firm Eqecat utilize the insurance-‐industry convention that uninsured private losses are equal to insured losses, this being an average that seems to fit experience. Uninsured losses to individuals are also losses to the economy, because they could mean a business closes or a rental property is uninhabitable. When the workers lose their paychecks – and these are most likely to be hourly paid workers in a resort context – they are no longer able to pay for goods and services in the neighborhoods where they live. Similarly, owners of small properties not covered by insurance, or with a high windstorm deductible, suffer losses that interfere with their ability to maintain their previous level of spending.
Government Losses. Government losses are extensive, and occur at the federal, state and local level, as governments assist individuals and businesses and absorb the extra costs associated with restoring their own facilities:
• At the national level, flood insurance is provided by FIMA’s flood insurance program, NFIP. Individuals pay a premium for this insurance, which varies with the degree of compliance with FIMA guidelines for risk mitigation. After a flood, insured individuals and businesses file claims. In its estimates of damage, the National Hurricane Center adds in the number for flood damage provided by the NFIP. The premium for flood insurance does not fully cover claims paid, and the first tranche of the Hurricane Sandy aid bill authorized $9.7 billion of borrowing for FIMA.
• Also at the national level, FEMA programs provide relief to local governments and individuals. • The cost of other Federal bodies like the dewatering unit of the Army Corps of Engineers must
be added. • States spend extra funds to use the National Guard and other emergency response teams. • Localities’ cost for police, fire, sanitation and ambulance overtime must also be factored in as
costs of a disaster. New York City by itself estimates that overtime costs for Hurricane Sandy were $154 million (http://fxn.ws/VFhqOt).
• State and local facilities – even though their lost value may not be tracked very well in U.S. national accounts – may require replacement or remediation, imposing government costs either for direct spending in the current budget or bonded spending that is paid back with interest in future budgets.
Underinsurance Threatens Low-Wage Workers Most For low-‐wage homeowners struggling to keep up their mortgage payments, premiums for property and flood insurance are a burden. Post-‐Sandy, these premiums are rising, for reasons that will be reviewed below. Faced with high premiums, homeowners can switch to a cheaper insurer, or they can accept a higher deductible (absorbing the first $1,000 of loss instead of the first $500, for example), lower the insured amount (taking the risk that the losses will exceed the amount of insurance), or simply to self-‐insure (i.e., buy no insurance). Self-‐insurance is not an option if a mortgage is required, since lenders usually require insurance and often administer premium payments to be sure insurance is in force. If a mortgage is federally insured
34
by the Federal Housing Administration, property insurance is explicitly required, including flood insurance in vulnerable zones (http://nyti.ms/TDZDcg). One reason the elderly underinsure, apart from being on fixed incomes, is that they may have paid off the mortgage on their house. If a homeowner initiates a mortgage at age 30, the typical mortgage is paid off by 60, although in practice the average length of a mortgage is 7 years because people sell their first and second homes and buy and refinance another one. If the property is inadequately insured, the homeowner’s wealth declines by the amount of the property damage. Whether or not the property is fully insured, the homeowner may see a loss in the value of the property because a storm exposes the vulnerability of the area to flood and windstorm loss. In a worst-‐case scenario, the homeowner cannot live in the property and does not have enough savings or insurance payments to rebuild. This problem is then compounded by the fact that the locality may decide to require that rebuilding meet new, higher zoning or building code standards, such as an increase in the minimum height of the ground floor above sea level or high tide. Two legal principles apply in this area:
• The right of a locality to expropriate land for a public purpose such as a road and • The Fifth Amendment, via its final clause on “non-‐taking” (“… nor shall private property be taken
for public use, without just compensation.”), which requires a locality to compensate homeowners when a zoning or code change can be construed as a taking of property.
For a homeowner struggling to make mortgage payments pre-‐Sandy, and facing several post-‐Sandy crises at the same time (job, children, home, transport), the availability of cash from the municipality to buy out his home may seem like a godsend. The crucial question may be the fairness of the price paid and the availability of rental housing or substitute homes. The Extent of Underinsurance Insurance companies use a rule of thumb to estimate total private losses in a community. They tend to be double what insurance will cover. One reason that underinsurance is prevalent is that insurance policies include deductibles from insurable amounts, and that homeowners struggling to pay premiums may seek a higher deductible to provide some relief from higher premiums. Another reason is that in some areas insurance companies insist on a high deductible (5 percent or more of claims) to protect themselves from losses and also to encourage owners to invest in hurricane-‐mitigation additions such as storm shutters. New Jersey and other states have insisted that hurricane deductibles not be invoked for Hurricane Sandy claims because it did not have hurricane-‐force winds at landfall. Some property owners do not insure their property at all or are underinsured (i.e., their insurance coverage is not sufficient to pay for rebuilding).The uninsured or underinsured could include:
• Policyholders who fail to pay their premiums on time. A late payment might result in cancellation of insurance, or in a refusal to pay up fully on a claim.
• Those who do not buy insurance for full replacement value. • Those who cover only some losses, like windstorm-‐ only or flood-‐only. • Those who buy insurance that excludes hurricanes, or only covers hurricanes, or imposes very
high deductibles for hurricanes. • Those who save money by selecting an insurance company that has both low premiums and a
low rating with the New Jersey-‐based insurance company rating agency, A. M. Best.
35
Self-‐insurers are people or institutions who decide they can afford to rebuild without insurance and believe that the risks do not justify the high premiums for windstorm insurance. Governmental bodies will frequently self-‐insure because they have their tax base to fall back on and in a crisis taxpayers understand that rebuilding costs money and private insurers have to add sales commissions, administration and profits to their premiums. Government losses include: cleanup overtime, rebuilding, losses on insurance programs provided to property owners, and lost revenue from all forms of taxes – sales, income and property. The impact of a storm on homeowners lingers many years, because:
• Insurance companies and governmental agencies at all levels seek to recover their losses from the storm by raising property and flood insurance premiums.
• At the same time they seek to prevent future losses by insisting on preventive measures, raising deductibles (as a way of addressing the problem of moral hazard, i.e., the danger that homeowners will rely on insurance instead of seeking to prevent losses) and reducing their exposure to too many risks in one area.
• When premiums, deductibles and building requirement all rise at the same time, the cumulative impact can be crushing is on those who are struggling hardest to make ends meet.
Many insurance policies have hurricane exclusions (the insurance company limits its exposure when a hurricane hits), so several states informed insurance companies that they could not call Sandy a hurricane for insurance purposes, since on landfall it did not reach a Category 1 wind. Insurance companies were not prepared for such big claims for a non-‐hurricane storm, and policies will surely be rewritten.
Predatory Agents and Bargain-‐Hunters
Tragically, the reality of disasters is that the most likely people to suffer are those who can least afford the loss. Do the owners of underinsured buildings represent a target for predatory lenders, who offer quick cash via complex mortgages that carry high interest rates and could set off another round of foreclosures? Are we seeing subprime loans emerging again? Are campaigns for reconstruction and home-‐improvement scams bubbling up, particularly for low-‐income and vulnerable groups (the elderly)? If signs of this activity are seen, is there a way to reduce the exposure of those who have lost their homes? How are insurance companies responding to claims from poor or ALICE policy holders? To what extent are they being penalized for not being able to produce documents? Are claims being paid on time, in full? How many claims are being rejected because the storm was not categorized as a hurricane? Lower-‐ income people have a more difficult time navigating the claims process. They are less likely than the well-‐off to have photos and inventories. Do insurance claims agents systematically take advantage of low-‐income individuals? Is there a role for public case managers or advocates? To file a claim, homeowners may need to file evidence of the value of destroyed property. ALICE households are less likely than others to have such records. It may be in their interest to have the damage appraised, and they are likely to be easy marks for appraisers going door to door or cold calling. The cost of an appraisal, which might be $300 or more, could be a burden. After the storm, mortgage lender orders for disaster inspection reports surged to 200 times the normal level. One provider, the Mercury Network service, announced it would waive some fees related to their reporting services (http://www.mercuryvmp.com/sandy/).
36
Bargain-‐hunters after a disaster are simply responding to an opportunity. Intelligent buyers know that some homeowners will be forced to sell if their insurance is inadequate. The problem for the ALICE homeowner is that the bargain-‐hunters will make very low offers for a distressed home and will thereby create a panic environment leading to a sale at a lower price than the property would otherwise have obtained.
Rising Flood Insurance Premiums Will Hit Modest Homes Hardest
The National Flood Insurance Program was created in 1968 to offer federally subsidized property insurance to homeowners, because many private insurers had given up trying to make money on this line of insurance. However, it has had to borrow increasing amounts of money to stay solvent, and the outlook is for higher premiums and stricter conditions.
“Moral Hazard” in Flood Insurance – NJ’s “Right to Rebuild
A “moral hazard” is said to exist in the property insurance industry when insurance companies cover all the losses, leaving no incentive for property owners to take reasonable precautions to prevent losses. This is an explanation of over-‐development of shore properties, repetitive insurance and rising premiums.
Since the government flood insurance program was created, it has been viewed by some as supporting over-‐development in coastal areas, such as New Jersey’s “right to rebuild”.
New Jersey has been a pioneer in implementing the idea that if Mother Nature erodes the shoreline, then human beings simply repair the buildings, put the sand back and hope/pray for the best. This concept has royal ancestry, from Persia’s King Xerxes, who ordered 300 lashes of the Hellespont for destroying his soldiers’ bridges, to King Canute, who believed the waves should retreat at his command.
Coastal researchers have called constant restoration of sand "New Jersey-‐ization". The U.S. Army Corps of Engineers in 1971 classified 81 percent of New Jersey's coastline as "critical" from beach erosion. New Jersey regulated large industrial or public developments, but residential developments with fewer than 25 units were for many years exempt, so 24-‐unit developments abounded on the Jersey Shore. A report on beach erosion produced by Rutgers University in 1977 concluded that the most responsible policy is “Discouraging residential or commercial development in a high-‐risk erosion area.” [Move cite to here.]
In the 1980s, the state tried to halt the wasteful practice of constantly rebuilding of severely storm-‐damaged homes and businesses near the beach. Gov. Kean, for example, signed in 1988 ordered more than 1,600 developments stopped.
However, it turned out that the wasteful rebuilding has a constituency – builders and the local governments that benefit from the jobs that the builders create along the coast. Coalitions of mayors and builders hired lobbyists to stop any attempt to control rebuilding. In the 1990s, pollution closed Jersey Shore beaches. A coalition of state legislators passed a law closing the 25-‐unit loophole in New Jersey's coastal development program, but the political price for that was homeowners’ getting an absolute right to rebuild homes destroyed by storms; after all, federal flood insurance was there to cover the cost (http://huff.to/12uLqEI).
37
New Jersey’s right to rebuild is unusual. North Carolina bars rebuilding in the same place after a structure is substantially damaged by a storm. Florida and Alabama require state reviews before rebuilding. South Carolina and Maine and other states require that property owners pull back from the ocean as much as possible following hurricane damage.
Consequences of “Right to Rebuild”: Rising Premiums What are the consequences of the “right to rebuild”?
• New Jersey has the third-‐highest repetitive insurance claims in the nation behind Florida and Louisiana. The rate is based on the number of properties in the state relative to population that have two or more claims in a ten-‐year period for more than $1,000.
• The program's discounted insurance premiums fail to reflect the true risks, critics argue, resulting in a distorted coastal real estate market: With the largess of the taxpayer as a backstop, buyers are willing to pay more for coastal properties than they otherwise would, driving up values.
• Repetitive loss properties comprise only about 1 percent of all flood insurance policies, but are paid 25 to 30 percent of all dollar claims. Even homeowners paying "full-‐risk" rates often pay less than they should, according to the Government Accountability Office, because many flood maps across the nation are decades out of date (http://www.gao.gov/assets/130/125283.pdf).
• Some experts assert that New Jersey and federal taxpayers cannot wait for a few years,
describing Hurricane Sandy as the sort of crisis that presents an historic opportunity to reconsider development policy -‐-‐ the sort of crisis that can easily be squandered.
• The bulk of the Hurricane Sandy HUD grants will be used for rebuilding and elevating homes (http://bit.ly/TToaLC).
• Hurricane Sandy will strain the National Flood Insurance Program, which already took on about $20 billion in debt seven years ago after Hurricanes Katrina and Rita. The Government Accountability Office has long rated the flood insurance program a "high risk" – a reflection of the fact that the federal government is insuring more than $41.3 billion of property on New Jersey’s coast alone.
• New flood maps will mandate minimum elevations for new construction. But many homes that
sustained less than 50 percent damage will be allowed to rebuild as they were, according to federal as well as New Jersey law. For many, flood insurance will compensate them for their losses.
• Flood insurance costs up to $3,000 a year for coverage up to $250,000 with another $500 a year for contents valued up to $100,000. Premiums will double for new policyholders and many old ones within three or four years under a new law passed July 1, 2012, with rates going up by an average of 20 percent after Jan. 1, 2013 (http://nyti.ms/TDZDcg).
• Primary homes with discounted rates based on having paid insurance for a long time will lose them if repairs exceed half the value of the home, if the home has more than one claim, or the
38
owner refuses to accept compensation for raising or moving the home. Discounts also expire when owners sell, make major improvements or allow their policies to lapse by non-‐payment.
The flood insurance program has not been breaking even. The remedy, already in place, is going to be bad news for hard-‐pressed homeowners:
• Flood-‐map revisions in 2013 will be followed by notices to New Jersey homeowners from mortgage lenders, advising them that they must buy flood insurance within 45 days, or the financing institution will buy it for them at a penalty price. Homeowners may find themselves for the first time in a high-‐flood-‐risk area, i.e., an area that has a 26 percent chance of being flooded during a 30-‐year mortgage – something like a once-‐in-‐a-‐hundred-‐years flood.
• Flood insurance Mortgage lenders and servicers enforce the rules of the National Flood Insurance Program. Recent changes incorporated in the Biggert-‐Waters Flood Insurance Reform Act will make the program solvent but will double the cost over the next several years (http://bit.ly/V6ghx8).
• The price of flood insurance is rising. FEMA says a policy costs about $625 per year on average, but can cost more than $3,000 a year for maximum coverage in the highest-‐risk areas. For first-‐time designees, new policies will carry subsidized rates, with premiums rising 20 percent a year for five years. Policy premiums depend on degree of risk.
• FEMA report following Hurricane Floyd found that storm damages cost half as much when structures were situated more than 30 feet back from a shoreline. The damage goes down another two-‐thirds if buildings were more than 100 feet behind a shoreline.
Flood Maps and Asset Destruction Disasters are poorly accounted for in U.S. economic statistics. A key reason is that the national GDP and state GSPs measure only the flow of money against goods and services. They show only partially and indirectly what has happened to national and state and city assets. If there were national or state balance sheet, disasters would show up as a significant loss in wealth. A disaster may create cleanup and repair and rebuilding work, but this is just a small silver lining to a giant cloud. At the end of the reconstruction, the economy will simply be back, in terms of assets, where it was before the disaster struck. It will have simply replaced a loss in wealth, as classical French economist Frederick Bastiat was at pains to show in his book That Which Is Seen, and That Which Is Not Seen. Like 9/11, Hurricane Sandy had a huge impact on real estate values in the tri-‐state area. Two major hurricane-‐level storms in 2011 and 2012 forced onto the consciousness of New Jersey and New York State residents the greater likelihood of flooding threats that in the past have been associated only with Florida and other southern states. Now, there is a threat to long-‐term sustainability of beaches and near-‐ocean structures up and down the East Coast. As Governor Cuomo said the day after Sandy made landfall, “two hundred-‐year floods in two years” creates a “new reality” (http://bit.ly/TVxhvz) for real estate and flood mitigation – just as 9/11 created a
39
new reality for investment in real estate, security and anti-‐terrorism intelligence. The huge mark-‐down in some assets that follows an attitude-‐changing event like Sandy has the power to enrich some people and impoverish others, while others are only able to ride out the destruction because they are insured and because Federal compensation and mitigation funding is available. Consider someone who owns property on the New Jersey coast that was seriously damaged by Sandy. Governor Christie in January adopted the new FEMA maps issued in December 2012. Intelligent leaders in each local community – which traditionally has the last word on land-‐use questions – will be considering new laws for commercial and residential properties, such as:
• New zoning restrictions that require moving structures back at least 20 feet from the previously defined coastal edge.
• New building codes that prohibit use of basements or require that the first floor of all homes near the water be raised to some minimum height, say six feet, by jacking up the house and if necessary putting it on stilts.
FEMA cannot force local communities to follow its guidelines. However, it has two very powerful ways to coax communities into doing the right thing:
• Stick Strategy: If communities don’t pay any attention to “minimum standards for floodplain management”, it can inform local property owners that it will no longer insure properties in that jurisdiction. An example might be granting a variance that allows for new construction in conflict with FEMA minimum-‐setback or height standards.
• Carrot Strategy: If communities go beyond minimum standards and take extra steps to improve floodplain management, they can qualify for the NFIP’s Community Rating System. This system awards points to communities that in turn trigger discounts in the premiums that property-‐owners pay for the flood insurance. The system is outlined clearly and in detail in a 2006 FEMA brochure (http://1.usa.gov/13skEfz).
FEMA has prepared flood maps that will guide communities in New Jersey regarding up-‐zoning coastal areas or upgrading building codes. Toms River, a township and the county seat of Ocean County, was a major center of damage from Hurricane Sandy and provides an example of changes in the flood risk map. (See Chart 10.)

40
Chart 10. FEMA Post-‐Sandy Flood Risk Map, Toms River (Ocean Co.), NJ
Note: Darker grid lines indicate that map region has been revised by FEMA post-Sandy. Source: FEMA Advisory Base Flood Elevations Map (http://fema.maps.arcgis.com/home/). Who wins and who loses by decisions about flood risks?
• Local builders win when risks are shown as increasing, because they will get new work to address the risks by homeowners seeking to pay lower flood-‐insurance premiums.
• Well-‐off owners may win or lose depending on the cost of complying with the code and whether their insurance will help pay for improvements required under the new code. After some inconvenience, however, the owners will end up with a safer property with lower-‐than-‐average flood-‐insurance premiums and ready access to financing.
• Hard-‐pressed owners will suffer in several predictable ways. Inside an area that is rated more risky by new flood-‐risk maps will see their flood-‐insurance premiums rise. They will have to pay for any improvements required by higher standards for their property. Even so, they may be unable to get a mortgage or a home-‐equity loan to cover rebuilding because a lender may be over-‐committed to the area or may only be looking to lend to prime properties. If in desperation they decide they must sell their property, they will sell at a discount from pre-‐Sandy days because buyers will want to set aside funds to upgrade after purchase to meet the new height or setback standards. Speculators hunt for such situations and offer low bids for properties and owners that are distressed, adding to the climate of panic. This is the big challenge for the ALICE community.
As these situations repeat themselves in different ways along the New Jersey coast and other places that Sandy left its calling card, neighborhoods will start to become sorted by the prevailing financial strength of homeowners. More prosperous areas will seek to satisfy the new codes so that properties can be readily insured with low premiums and financed at a favorable mortgage rate. People who can afford to live anywhere will acquire property from those who will decide they can’t afford to live so close to the shore. Shoreline communities will therefore either become gentrified by new zoning or blighted by it, as buyers decide where they want to own property in the post-‐Sandy world. The full extent of the problem may not be known immediately. Is the number of ALICE families growing as a share of all families, especially in the most affected counties? After Hurricane Sandy, was there an
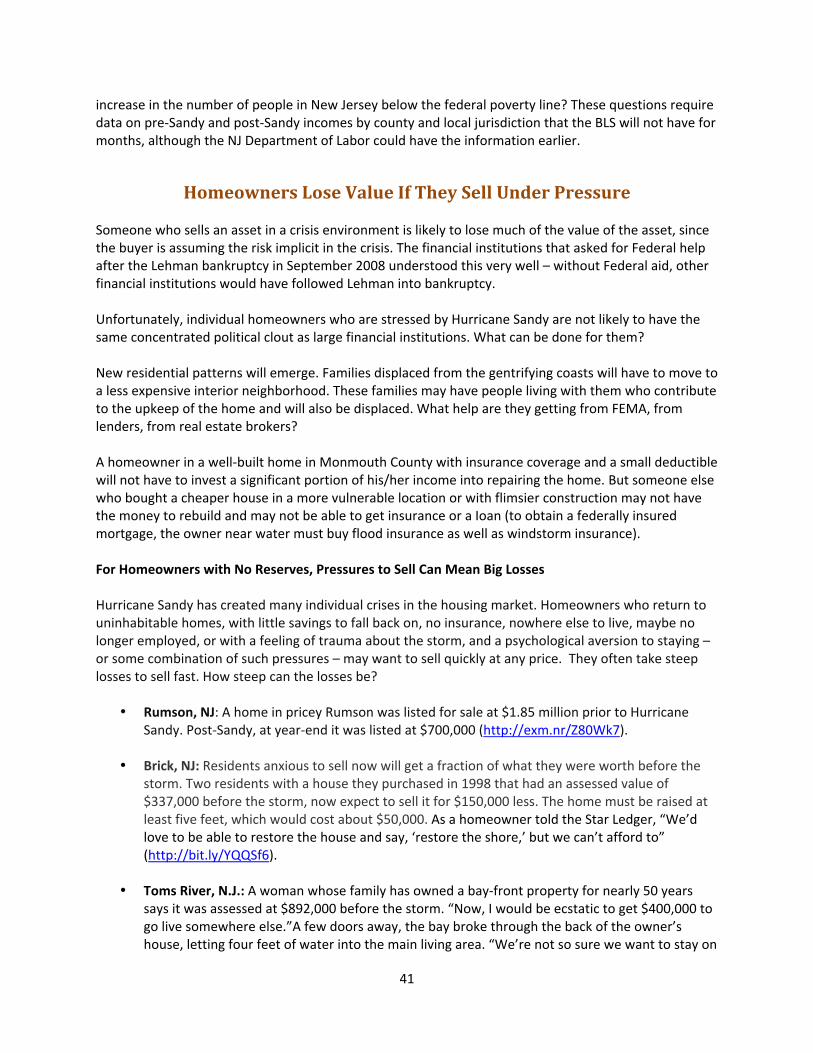
41
increase in the number of people in New Jersey below the federal poverty line? These questions require data on pre-‐Sandy and post-‐Sandy incomes by county and local jurisdiction that the BLS will not have for months, although the NJ Department of Labor could have the information earlier.
Homeowners Lose Value If They Sell Under Pressure Someone who sells an asset in a crisis environment is likely to lose much of the value of the asset, since the buyer is assuming the risk implicit in the crisis. The financial institutions that asked for Federal help after the Lehman bankruptcy in September 2008 understood this very well – without Federal aid, other financial institutions would have followed Lehman into bankruptcy. Unfortunately, individual homeowners who are stressed by Hurricane Sandy are not likely to have the same concentrated political clout as large financial institutions. What can be done for them? New residential patterns will emerge. Families displaced from the gentrifying coasts will have to move to a less expensive interior neighborhood. These families may have people living with them who contribute to the upkeep of the home and will also be displaced. What help are they getting from FEMA, from lenders, from real estate brokers? A homeowner in a well-‐built home in Monmouth County with insurance coverage and a small deductible will not have to invest a significant portion of his/her income into repairing the home. But someone else who bought a cheaper house in a more vulnerable location or with flimsier construction may not have the money to rebuild and may not be able to get insurance or a Ioan (to obtain a federally insured mortgage, the owner near water must buy flood insurance as well as windstorm insurance). For Homeowners with No Reserves, Pressures to Sell Can Mean Big Losses Hurricane Sandy has created many individual crises in the housing market. Homeowners who return to uninhabitable homes, with little savings to fall back on, no insurance, nowhere else to live, maybe no longer employed, or with a feeling of trauma about the storm, and a psychological aversion to staying – or some combination of such pressures – may want to sell quickly at any price. They often take steep losses to sell fast. How steep can the losses be?
• Rumson, NJ: A home in pricey Rumson was listed for sale at $1.85 million prior to Hurricane Sandy. Post-‐Sandy, at year-‐end it was listed at $700,000 (http://exm.nr/Z80Wk7).
• Brick, NJ: Residents anxious to sell now will get a fraction of what they were worth before the storm. Two residents with a house they purchased in 1998 that had an assessed value of $337,000 before the storm, now expect to sell it for $150,000 less. The home must be raised at least five feet, which would cost about $50,000. As a homeowner told the Star Ledger, “We’d love to be able to restore the house and say, ‘restore the shore,’ but we can’t afford to” (http://bit.ly/YQQSf6).
• Toms River, N.J.: A woman whose family has owned a bay-‐front property for nearly 50 years says it was assessed at $892,000 before the storm. “Now, I would be ecstatic to get $400,000 to go live somewhere else.”A few doors away, the bay broke through the back of the owner’s house, letting four feet of water into the main living area. “We’re not so sure we want to stay on
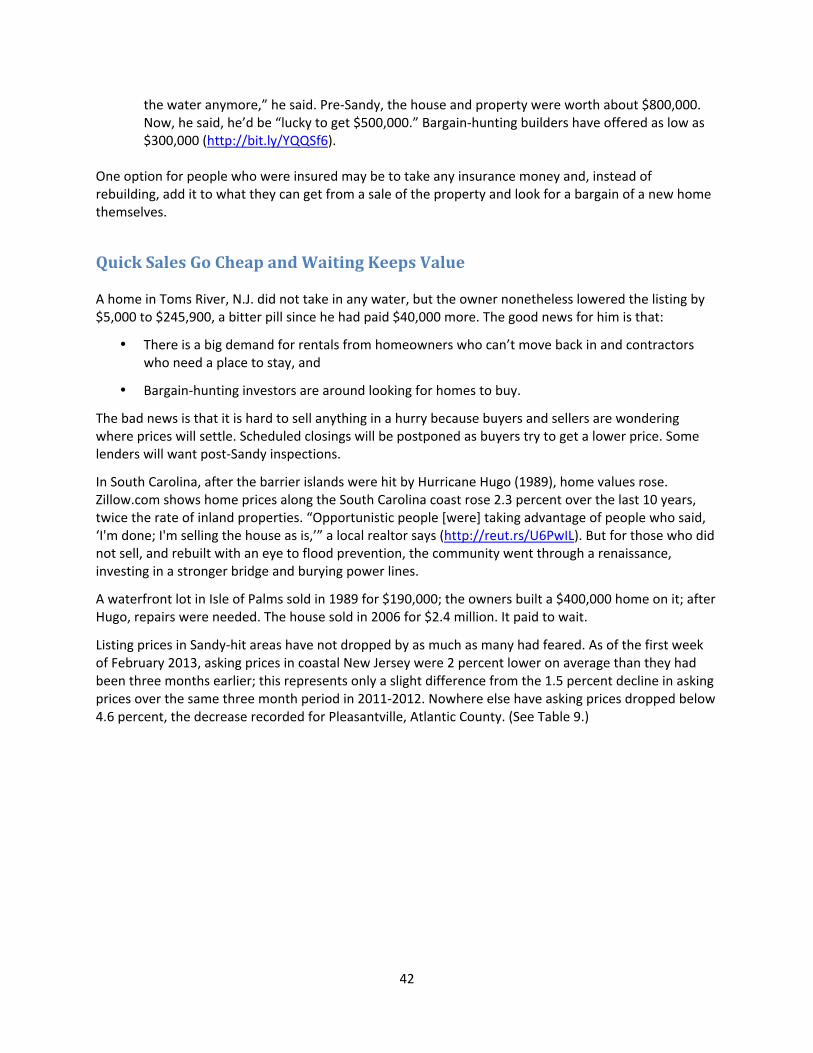
42
the water anymore,” he said. Pre-‐Sandy, the house and property were worth about $800,000. Now, he said, he’d be “lucky to get $500,000.” Bargain-‐hunting builders have offered as low as $300,000 (http://bit.ly/YQQSf6).
One option for people who were insured may be to take any insurance money and, instead of rebuilding, add it to what they can get from a sale of the property and look for a bargain of a new home themselves.
Quick Sales Go Cheap and Waiting Keeps Value A home in Toms River, N.J. did not take in any water, but the owner nonetheless lowered the listing by $5,000 to $245,900, a bitter pill since he had paid $40,000 more. The good news for him is that:
• There is a big demand for rentals from homeowners who can’t move back in and contractors who need a place to stay, and
• Bargain-‐hunting investors are around looking for homes to buy.
The bad news is that it is hard to sell anything in a hurry because buyers and sellers are wondering where prices will settle. Scheduled closings will be postponed as buyers try to get a lower price. Some lenders will want post-‐Sandy inspections.
In South Carolina, after the barrier islands were hit by Hurricane Hugo (1989), home values rose. Zillow.com shows home prices along the South Carolina coast rose 2.3 percent over the last 10 years, twice the rate of inland properties. “Opportunistic people [were] taking advantage of people who said, ‘I'm done; I'm selling the house as is,’” a local realtor says (http://reut.rs/U6PwIL). But for those who did not sell, and rebuilt with an eye to flood prevention, the community went through a renaissance, investing in a stronger bridge and burying power lines.
A waterfront lot in Isle of Palms sold in 1989 for $190,000; the owners built a $400,000 home on it; after Hugo, repairs were needed. The house sold in 2006 for $2.4 million. It paid to wait.
Listing prices in Sandy-‐hit areas have not dropped by as much as many had feared. As of the first week of February 2013, asking prices in coastal New Jersey were 2 percent lower on average than they had been three months earlier; this represents only a slight difference from the 1.5 percent decline in asking prices over the same three month period in 2011-‐2012. Nowhere else have asking prices dropped below 4.6 percent, the decrease recorded for Pleasantville, Atlantic County. (See Table 9.)

43
Table 9. Change in Average Asking Prices, Week after and 13 weeks after Hurricane Sandy Rank Zip Code City After Sandy Before Sandy Rank
1 08232 Pleasantville, Atlantic County -4.63% -3.67% 1 2 07723 Deal, Monmouth County -4.09% -1.88% 2 3 07717 Avon by the Sea, Monmouth County -3.94% -1.75% 3 4 08087 Tuckerton, Ocean County -3.65% -1.70% 4 5 07758 Port Monmouth, Monmouth County -3.50% -2.08% 5 6 07720 Bradley Beach, Monmouth County -3.40% -2.36% 6 7 07077 Sewaren, Middlesex County -3.23% -0.95% 7 8 08092 West Creek, Ocean County -3.23% -1.99% 8 9 07760 Rumson, Monmouth County -3.21% -1.89% 9 10 08244 Somers Point, Atlantic County -2.94% -1.36% 10 Note: The study was based on thousands of homes listed for sale on Point2Homes.com in coastal areas of New Jersey. Source: http://www.point2homes.com.
However, asking prices may not be a sufficient basis for assessing Hurricane Sandy’s impact on the coastal housing market. Some sellers deliberately maintain their asking price as they wait for the market to recover, while others may simply opt to leave listing prices alone as they wait to see where the market settles. Realtors in the northeast have reported that since Hurricane Sandy homes have taken longer to sell and longer to close, and sales have been down. So even where prices remain the same, it may take longer to receive an offer, and property damage complicates and lengthens the closing process (http://www.point2homes.com).
Housing Values Recover for Those Who Can Afford to Wait Hurricanes’ impact on housing prices varies with the location and the nature of the storm. Several forces are at work:
• More eager sellers, i.e., those who need to get their hands on some cash to ride out the aftermath of the storm.
• Bargains for buyers with cash. • Loss in the availability of move-‐in quality housing.
These forces can work in opposite directions over time or within a broader geographic area. For example, the average sale price in the Rockaways fell 30 percent in the fourth quarter of 2012, but the scarcity created by the loss of housing in the Rockaways drove up housing prices by 9.4 percent in Queens as a whole – a 40-‐percentage-‐point spread in housing-‐price changes. Bargain-‐hunting after a hurricane can mean a lack of sales as sellers decide they will wait. Seventy-‐one properties in flood zones of Brooklyn and Queens were taken off the market in the closing months of 2012 by people who could afford to wait, according to a subscription listings database (http://exm.nr/Z80Wk7). Housing sales on Coney Island in the fourth quarter of 2012 were one-‐eighth the number in the same quarter a year earlier (http://bit.ly/11W4Z7m).
As a rule, housing prices rebound quickly, although sometimes they take a few years to recover, as in Manhattan after 9/11.Sometimes housing prices may not even suffer a decline. The Federal Housing Finance Agency says housing prices in Miami rose sharply for two years after the city was hit hard by Hurricane Andrew in 1992. The lower-‐price pressure from concern that a hurricane might strike again

44
soon turned out to be less important than the higher-‐price pressure from reduction in housing supply (http://cbsn.ws/VYBb8E).
A 2010 Working Paper of the Federal Reserve Bank of Dallas by Anthony Murphy and Eric Strobl, reporting on a study of 13 hurricanes in nine East Coast states concludes that for these cases: (1) the hurricane depressed real incomes immediately and the depression took more than a decade to fade, but at the same time (2) real housing prices rose right after the hurricane to a peak 3-‐4 percent increase in three years over what they would have been in the absence of a hurricane, and then slid back toward prior level (http://bit.ly/UvaDu3).
Waterfront homes were relatively expensive before Sandy and can be expected to become so again. Much depends on the way the National Flood Insurance Program maps (http://1.usa.gov/uMAwr6) end up being drawn in 2014, and on the willingness of banks to make mortgages in the area. And a few years must pass without a repeat of Hurricane Sandy to reassure buyers and lenders that such destructive storms have not become a yearly occurrence in the era of climate change.
As rebuilding occurs and some of the uncertainty about future zoning and building codes is resolved, property values should rise again. The Hurricane Sandy-‐related property-‐tax crunch in local government finances is temporary, and aid from Washington will be helpful in encouraging rebuilding and getting past it. But it doesn’t really help county treasurers to know that their problems will be over in a few years, when they have to deal with the fiscal problems this year and next year.
Foreclosure Suspension FEMA aid might help recovery if it cuts back on foreclosure inventory. While Sandy hit the coast hardest, many inland properties also were affected, and they do not retain their value as well as houses near the water, according to Zillow (http://reut.rs/U6PwIL).
Mortgage delinquencies have jumped about four times the U.S. average in Sandy-‐damaged areas of New York, New Jersey and Connecticut, says Lender Processing Services Inc. In ZIP codes hit hardest by the storm, delinquencies surged 15.4 percent in Connecticut, 15.2 percent in New Jersey and 14.8 percent in New York (http://bit.ly/105Nfpv).
Fannie Mae and Freddie Mac said on Nov. 9 that they would suspend evictions and foreclosure sales for 90 days in storm-‐ disaster areas. The government-‐backed housing-‐finance agencies will allow firms that service their loans to extend forbearance plans for as long as 12 months (http://bit.ly/105Nfpv). The 90-‐day extension was repeated In February 2013. The Federal Housing Finance Agency and HUD announced they would extend foreclosure protections for homeowners displaced or negatively impacted by Hurricane Sandy. The Federal Housing Administration is also suspending evictions on properties secured by FHA mortgages in areas impacted by the storm through April 30 (http://bit.ly/TkAm83).
Possible Remedies. What can be done to assist ALICE homeowners, who could ride out the rebuilding period with a little help?
State Assistance. The State of New Jersey could assist with financing problems but the competitive nature of state tax and spending policies could be an obstacle. Presentations made at the November 2012 conference on the state economy suggest that the New Jersey State Treasurer is trying hard to lower New Jersey’s ranking as the second-‐highest-‐taxed state after New York. If state taxes are cut, then the legal requirement that the state balance its budget means that spending must be cut. Without
45
greater efficiency in other areas, the need to spend less makes it difficult to do more for any disadvantaged groups. The best hope might be to use some of the Federal aid for Sandy victims to assist stressed homeowners stressed by the property-‐improvement costs implied by the new flood-‐risk maps. This could be the best use of Sandy aid because a relatively small amount could allow a family to keep its home. President Obama in his Second Inaugural Address argued that social safety nets are the foundation for prosperity.
We do not believe that in this country, freedom is reserved for the lucky, or happiness for the few. We recognize that no matter how responsibly we live our lives, any one of us, at any time, may face a job loss, or a sudden illness, or a home swept away in a terrible storm. The commitments we make to each other – through Medicare, and Medicaid, and Social Security – these things do not sap our initiative; they strengthen us. They do not make us a nation of takers; they free us to take the risks that make this country great (http://nyti.ms/WBOpU5).
Federal Rental Assistance. FEMA announced a temporary rental assistance program for Hurricane Sandy survivors with disabilities.
• Support for Heavily Committed Banks. A bank concerned about losses it could face from Hurricane Sandy, since 18 percent of its loans are to consumers and businesses in New York, New Jersey and Connecticut, refused to increase its credit limit to a couple so that could finance a $10,000 advance for construction work to prevent mold growing in their Breezy Point, N.Y. home. Could the Federal Reserve or FEMA extend extra credit to banks in this situation?
• Encourage More Mortgage-‐Company Forbearance. Sandy victims say their mortgage companies are refusing loan assistance. Fannie Mae permits forbearances of up to a year, but some mortgage companies have not been using the facility or are offering inadequate assistance, such as just a two-‐week grace period or a loan suspension with a lump sum due in a few months. Families are faced with a choice between (1) being late with loan payments, having late fees assessed and facing possible foreclosure, (2) putting off repairs and risking more damage from mold and winter, or (3) trying to take on more debt (http://exm.nr/12Bbk91).
The Costs of Strategic Options – Retreat, Rebuild, Prevent The two primary questions facing coastal areas after Hurricane Sandy are:
(1) The choice between a prevention-‐and-‐rebuild strategy and a retreat-‐and-‐make-‐a-‐park strategy. (2) What kind of prevention-‐mitigation program to recommend or impose.
Costs of Retreat from the Waterfront Gov. Chris Christie said he wants New Jersey to use a portion of its federal Sandy aid money to buy up whole neighborhoods prone to flooding. At a press conference with U.S. Housing and Urban Development Secretary Shaun Donovan in Sea Bright, Christie said he would only entertain offers of buyouts for large swaths of contiguous properties, not individual parcels, to maximize mitigating flood hazards (http://njrereport.com/index.php/2013/02/08/warm-‐up-‐the-‐bulldozers/). Gov. Christie is asking local communities to see whether people whose homes have been destroyed by Hurricane Sandy might not be willing to give up on rebuilding them, so that the land could be made into

46
a park. This would pre-‐empt a potential repeat flood in future years, since the land that would be vacated could be turned into a park and a barrier to protect other homes. The Governors of both New Jersey and New York are allocating funds for buying property, with a higher price being offered for multiple-‐lot offers. (http://bit.ly/WvgnWL.) The Disaster Relief Recovery Act of 2013 provides for $16 billion in Community Development Block Grant (CDBG) Disaster Recovery funding to the states hit by Sandy, via HUD. New Jersey has already received $1.83 billion from HUD in the first round of allocations, and stands to receive a substantial portion of the $11 billion in remaining funds through two additional rounds. Although the bulk of the CDBG funding will go to rebuilding and elevating damaged homes, Governor Chris Christie has announced his intention to use some of that money to buy up damaged properties, thus enabling residents to relocate. A candidate for buyout is Sayreville, N.J., where homes were flooded twice in the 32 months before Hurricane Sandy hit. The town has hired someone to help residents sell their chronically flooded homes. About 180 owners in three neighborhoods have submitted letters of interest in being bought out. (http://bit.ly/TToaLC) If the government succeeds in buying out large enough swaths of adjacent properties, then that land will be freed for new uses such as public development and flood mitigation. One influential proposal is to convert the land thus vacated into public parks as a way of ensuring continued public access to the shore. Some may worry that this would lead to a loss in property tax revenue. However, the increased value of real estate surrounding the parks might be enough to compensate for that loss. Central Park in New York City adds greatly to the value of the buildings that face it. A more pressing concern is that such a boost in property values would displace lower-‐income residents of the areas surrounding the parks – and if a parking sticker is required might cut off access to the beach by nonresidents. Christie has said he is unwilling to condemn damaged areas and force residents out. He says it is “much more appropriate to let the community come to some type of consensus.” However, market forces via gentrification can force the hands of residents just as effectively as a government mandate. Accordingly, owners of undamaged properties adjacent to the projected sites of public parks ought to be (1) informed of the potential consequences of those parks for property values, and (2) given the same kind of democratic control over the use of vacated land that owners of damaged properties will enjoy when deciding whether to accept a buyout. Meanwhile, planners need to ensure that the new parks have adequate access to affordable public parking or other transportation.
Gentrification in NJ Communities with Highly Unequal Incomes Aggregated and averaged figures disguise the fact that within a few blocks of the typical glitzy boardwalk and beach resort are less expensive homes where seasonal workers live during the summer months. In the aftermath of a storm like Sandy, the greatest misery may be found a few blocks in from the shore, in neighborhoods where homes may be less well constructed and adequate insurance coverage was not seriously considered because of the additional cost.

47
Income Inequality by County The contrasts among households are probably greatest in New Jersey’s Cape May, Essex and Union Counties, where the mean income is 1.4 or more times higher than the median income. (See Chart 11.) Chart 11. Mean/Median Household Income, NJ Counties, 2010, Percent
Note: The mean/median ratio for each county is a measure of the degree of inequality in the county. The higher the mean is relative to the median, the more unequal the incomes. Source: Chart by NJISJ based on BLS and NJ Department of Labor data. The higher the mean is relative to the median for each county, the higher the degree of inequality in the county. Essex County includes the residences of well-‐paid office workers in single-‐family homes the west. It is also the home of less-‐well-‐paid people in urban areas to the east. Similarly, Cape May has lower-‐income year-‐round residents and better-‐off summertime residents. At the other extreme are farm workers in Sussex to the northwest and Gloucester County to the southwest, far from the shore resorts, and the middle-‐level executives in Middlesex County. In these places, incomes are closer together than in resort communities. Wealthier residents are more likely to have multiple homes, so damage to their home does not mean that they are necessarily homeless. They are also in a better position to submit claims, since they are likely to have records in more than one place and probably a file of photographs of property to show in support of insurance claims.
114.8 118.8 119.1 119.2 123.0 123.6 124.7 126.3 127.7 127.8 128.7 130.0 133.1 134.3 135.0 136.0 136.3 136.3 139.3 142.0 143.5
153.0
Sussex Gloucester Middlesex
Warren Salem
Hunterdon Cumberland
Atlansc Ocean
Burlington Somerset Camden Morris
NJ State Average Mercer
Monmouth Bergen Passaic Hudson Union
Cape May Essex
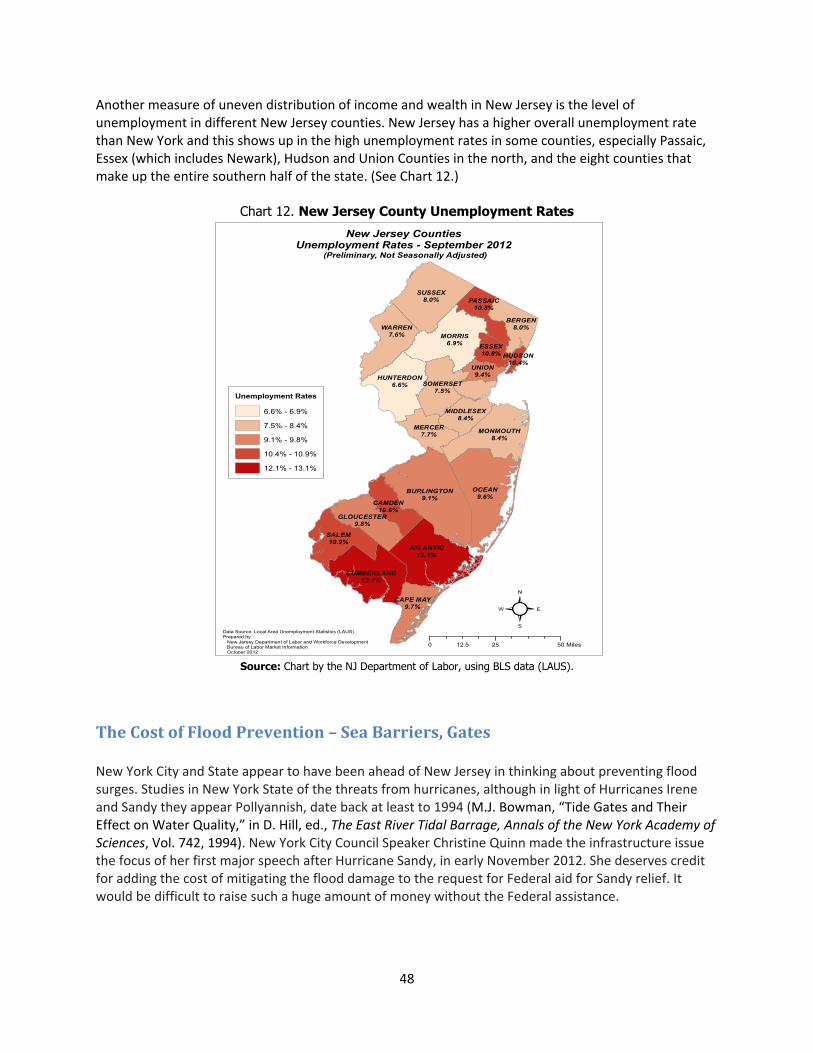
48
Another measure of uneven distribution of income and wealth in New Jersey is the level of unemployment in different New Jersey counties. New Jersey has a higher overall unemployment rate than New York and this shows up in the high unemployment rates in some counties, especially Passaic, Essex (which includes Newark), Hudson and Union Counties in the north, and the eight counties that make up the entire southern half of the state. (See Chart 12.)
Chart 12. New Jersey County Unemployment Rates
Source: Chart by the NJ Department of Labor, using BLS data (LAUS).
The Cost of Flood Prevention – Sea Barriers, Gates New York City and State appear to have been ahead of New Jersey in thinking about preventing flood surges. Studies in New York State of the threats from hurricanes, although in light of Hurricanes Irene and Sandy they appear Pollyannish, date back at least to 1994 (M.J. Bowman, “Tide Gates and Their Effect on Water Quality,” in D. Hill, ed., The East River Tidal Barrage, Annals of the New York Academy of Sciences, Vol. 742, 1994). New York City Council Speaker Christine Quinn made the infrastructure issue the focus of her first major speech after Hurricane Sandy, in early November 2012. She deserves credit for adding the cost of mitigating the flood damage to the request for Federal aid for Sandy relief. It would be difficult to raise such a huge amount of money without the Federal assistance.
New Jersey Counties Unemployment Rates - September 2012
(Preliminary, Not Seasonally Adjusted)
Data Source: Local Area Unemployment Statistics (LAUS)Prepared by: New Jersey Department of Labor and Workforce Development Bureau of Labor Market Information October 2012
OCEAN9.6%
SUSSEX8.0%
BURLINGTON9.1%
MORRIS6.9%
ATLANTIC12.1%
SALEM10.9%
WARREN7.6%
MONMOUTH8.4%
HUNTERDON6.6%
UNION9.4%
CUMBERLAND13.1%
BERGEN8.0%
SOMERSET7.5%
MERCER7.7%
CAMDEN10.6%
GLOUCESTER9.8%
PASSAIC10.8%
CAPE MAY9.7%
ESSEX10.8%
MIDDLESEX8.4%
HUDSON10.4%
Unemployment Rates
6.6% - 6.9%
7.5% - 8.4%
9.1% - 9.8%
10.4% - 10.9%
12.1% - 13.1%
0 25 5012.5 Miles
!

49
The sea gate concept was actually implemented in Long Island Sound outside of Stamford. It works. It effectively shielded the city from damage from Sandy. An engineering study recommended such a protective barrier around New York Harbor, along the lines of barriers in the Netherlands or London (http://nyti.ms/PYVnEG). New York City has prepared a flood map showing the areas likely to be flooded based on surges of increasing magnitude. A major five-‐mile-‐long sea gate is one option, between Sandy Hook, NJ and Rockaway Point, NY. It would protect the entire New York Harbor but would be a huge undertaking. Two less-‐expensive barriers could be erected between the southern tip of Staten Island and South Amboy and between Brooklyn and Staten Island over the Narrows. In either case, another tidal barrier is suggested at the mouth of Little Neck Bay. Either of the two southern-‐most barriers would have to be joint New York-‐New Jersey projects. (See Chart 13). At a 2009 conference sponsored by sections of the American Society of Civil Engineers and the New York Academy of Sciences, five engineering firms presented designs of barriers at these locations and described the geotechnical aspects of their placement, establishing their feasibility (D. Hill, M.J. Bowman and J.S. Khinda, eds., Storm Surge Barriers to Protect New York City: Against the Deluge, American Society of Civil Engineers, 2013). Douglas Hill, one of the authors, testified in favor of barriers at Public Hearing on Rebuilding After Sandy before the NYS Senate Investigations and Government Operations Committee, Mineola, NY, January 17, 2013. Chart 13. NYC Flood Map with Possible Storm Surge Barriers
Source: Underlying SLOSH map by NYC Office of Emergency Management, Natural Hazard Mitigation Plan, 2009, Section 3f, Figure 42, p. 84 (http://on.nyc.gov/122fshH). Proposed barriers represented by superimposed rectangles are inserted by Douglas Hill, Eng.Sc.D., P.E., “Testimony to the Public Hearing on Rebuilding After Sandy before the NYS Senate Investigations and Government Operations Committee, Mineola, NY, January 17, 2013, Figure 2, p. 4. Hill’s suggestions are based on a 2004 study by SUNY at Stony Brook – M.J. Bowman, B. Colle, R. Flood, D. Hill, R.E. Wilson, F. Buonaiuto, P. Cheng and Y. Zheng, Hydrological Feasibility of Storm Surge Barriers to Protect the Metropolitan New York-New Jersey Region, Summary Report. Stony Brook University. November2004.
50
If New Jersey does its own flood maps, it may find it helpful to locate additional sea gates at breaks in the barrier islands. This is the time to prepare maps to ensure that they are considered along with the New York barriers.
Rebuilding NJ’s Prosperity on a Platform of Social Justice The rebuilding process has already begun. Some homeowners are rebuilding immediately to restore their living space as soon as possible – and possibly in some cases to pre-‐empt changes in zoning laws or building codes. During the rebuilding process, issues of social justice appear in many places. This section reviews the New Jersey statewide response, some challenges facing local governments, and the services provided by nonprofits. It concludes with a discussion of the importance of regional cooperation in mitigating the area’s vulnerability to storms that Sandy revealed.
New Jersey’s Post-Sandy Government Leadership Governor Christie received national attention as a Republican Governor, when he went on tour of the Sandy-‐devastated New Jersey shoreline with President Obama. When asked whether this would be helpful to the President right before the election, he made clear that partisan issues were of little concern to him when faced with the overwhelming needs of his constituents. That was widely perceived as the correct answer to an inappropriate question. Relief Leadership Governor Christie on November 28 recruited attorney Marc-‐Philip Ferzan from PwC Consulting as New Jersey’s “Storm Czar”. One of Ferzan’s main tasks is to coordinate with the Federal Emergency Management Agency, FEMA (www.fema.org), and direct the relief efforts of the state, including those undertaken by the New Jersey Office of Emergency Management (www.ready.nj.gov) and the New Jersey Community Emergency Response Team (CERT) (http://bit.ly/XWRdLQ). Meanwhile, First Lady Mary Pat Christie has led the distinguished Board of the Hurricane Sandy New Jersey Relief Fund (https://sandynjrelieffund.org/), which has reportedly raised $31 million and has made periodic distributions. Governor Christie has received insufficient credit for his pioneering of the odd-‐even license plate rationing of fuel during the blackout when some fuel pumps were inoperable and the supply of fuel was inadequate. This form of rationing spread to those parts of New York State that were having fuel shortages. Finally, the Governor deserves great credit for working with Governor Cuomo on a joint aid request to the President. Coming from three governors (Connecticut joined in), with different party affiliations, rendered it especially powerful. It was in the interest of his constituents that Christie cooperate closely with the Democratic Governor of New York State, and he did it. Not every politician in the year 2013 made an equivalent decision. The bottom line is that the Sandy aid was approved.
51
The big question going forward will be how effectively the two states can cooperate on addressing the revealed risks from Hurricane Sandy’s catastrophic storm surges along 200 miles of shoreline from Cape May to Montauk. The re-‐benchmarking of climate change expectations will have a huge impact on the future of the region.
The Financial and Service Challenges for NJ Nonprofits Nonprofits in New Jersey played an important part in the relief effort and could play an even more important role in guiding the recovery and rebuilding. The nonprofit sector interfaces with the New Jersey government on relief issues through the Governor’s Nonprofit Information Center portal, which is a one-‐stop shop for nonprofits in New Jersey looking for funding and volunteers available through the State. The office was created in May 2011 by Governor Christie. The Department of State must maintain, in a single, accessible location, a directory of State departments and agencies that provide resources to assist nonprofits in their daily operations (www.state.nj.us/state/nonprofit.html). Nonprofits are being challenged on several fronts:
• Additional demands for immediate services created by Hurricane Sandy -‐ coordinating rapid delivery of donated supplies, utilizing volunteers for cleanup and rebuilding in concert with government agencies. People across the state have relied on nonprofit services for housing, food services, after-‐school programs, cultural performances, mental health counseling, community information and educational and vocational training.
• Addressing longer-‐term environmental, infrastructure and planning questions in partnership with government.
• Raising funds for relief efforts. • Lost revenue from cancelled events. Many nonprofits lost, and continue to lose, substantial
revenue from canceled performances and fundraising events. • Damage to their offices and equipment, creating disruptions in their daily operations. • Tracking and evaluating the response to Hurricane Sandy to maximize the impact of spending
and focus it on areas of special need. Monitoring governments’ responses to Sandy. • Partnering with government in providing relief and rebuilding. • Complying with the New Jersey Department of State filing requirements with the NJ Attorney
General. • Coordinating with other nonprofits, through the New Jersey Center for Nonprofits
(www.njnonprofits.org/Sandy.html) and the Council of New Jersey Grantmakers (www.cnjg.org). Occupy Wall Street, the group that started the conversation about the 1 percent vs. the 99 percent, acted quickly as Occupy Sandy to get volunteers to affected areas via churches, union halls or other vehicles. The organizations behind Occupy Sandy quickly raised $500,000 for relief. The New Jersey contingent was especially strong and continue to match donated supplies and services with areas that need them (http://bit.ly/U67Fsp). On the private side, the Geraldine R. Dodge Foundation took the lead, with the Community Foundation of New Jersey (which processes the gifts), in creating the New Jersey Recovery Fund. As of December 2012 the Fund had raised $3 million, with $1 million each from the Dodge Foundation and the Dave

52
Mathews Band/Bama Works, and $250,000 each from the John S. and James L. Knight Foundation and the Subaru of American Foundation. Other significant contributors have been the Community Foundation of South Jersey, the David & Lucile Packard Foundation, the Lisa & Douglas Goldman Fund, the National MahJongg League Foundation, the MetLife Foundation, Newman’s Own Foundation, the Rockefeller Brothers Fund and the Rita Allen Foundation (http://bit.ly/VH6HXV). Nonprofits affected by the storm are eligible for Federal assistance through FEMA (eligibility criteria are at http://bit.ly/U4Wo9B).
New York Benchmark: Governor Cuomo has launched several commissions to review the response to Hurricane Sandy and some of their recommendations are coming to light that may be useful for New Jersey (http://bit.ly/Y1wvLw). The New York State Attorney-‐General reports that as of December 2012, about $400 million had been raised for the victims of Hurricane Sandy in the state (see http://www.ag.ny.gov/ and http://bit.ly/WuAPQS). This may double-‐count some gifts, as a gift to a recovery fund may then be passed on to another foundation as a gift toward recovery programs. However, so far as can be determined it is a far larger sum than has been raised in New Jersey, even adjusting for the size of the economies of the two states.
Table 10. Fundraising for Sandy Victims – NY State, December 2012 Components Raised ($mil.) American Red Cross - Spent $110 million as of end of 2012 - 9 million meals in the disaster zone, $30 million in supplies, 81,000 shelter stays.
$188.0
Robin Hood Foundation $67.0 The Mayor's Fund to Advance New York City $45.0 Empire State Relief Fund 15.4 The Salvation Army, eastern U.S. division 14.3 Stephen Siller Tunnel to Towers Foundation (9/11 Memorial) $4.0 American Society for the Prevention of Cruelty to Animals $1.3 Subtotal $335.00 81 other nonprofits $65.00 NY State Total $400.0 Source: New York State Attorney General (http://www.ag.ny.gov/ or http://bit.ly/WuAPQS). Comparable information was not yet available from New Jersey sources as of January 2013, but informal reports suggest that New Jersey’s fundraising is likely to be one-tenth the size of New York’s. Industry Response – Auto Industry Many industry associations seek to improve their image by supporting causes, and relief efforts in a crisis are a popular vehicle for corporate philanthropy. That said, the auto industry stands out in its response to Sandy. Since many auto companies are based in New Jersey and a large percentage of imports come into the United States via Newark, the auto industry response is appropriate. Within a few weeks after Hurricane Sandy hit, the industry had raised $9.4 million, which is a substantial share of Sandy relief support (see Table 11).

53
Table 11. Auto Industry Aid to Sandy Relief ($9.4 million) Donor and recipient Amount BMW of North America, Woodcliff Lake, NJ, gave to the American Red Cross. $1.00 Chrysler gave $100,000 to the American Red Cross through its Ram truck brand, as well as 20 Ram 1500 Tradesman trucks (at $30,000=$600,000).
$0.70
Ferrari North America, HQ Englewood Cliffs, NJ gave $1.5 mil. to American Red Cross.
$1.50
Fisker, which lost 16 of its extended-range electric cars to fire after being flooded by Sandy, opened its factory in Wilmington, DE to house utility trucks and repair crews.
0
Ford gave $50,000 to the American Red Cross, and pledged to them $1 million for disaster relief and career training in health care for 200 vets or family members.
$1.05
General Motors gave 50 Chevrolet OnStar-equipped trucks and vans to support relief efforts (at $30,000 each, worth $1.5 million). The GM Foundation gave $250,000 to the Red Cross Disaster Responder Program.
$1.75
Hyundai gave to the American Red Cross. $0.50 Mazda has given $100,000 to the American Red Cross, and its nonprofit. $0.10 Mercedes-Benz, with HQ in New Jersey, gave $1 million to the American Red Cross. $1.00 Nissan offered "employee pricing and discounted financing” on Nissan and Infiniti vehicles to people in FEMA-designated disaster areas who lost vehicles to Sandy.
0
Subaru Foundation gave to the NJ Recovery Fund organized by the Dodge Foundation.
$0.25
Toyota gave $1 million to the American Red Cross, and matches gifts by employees. Its financing arm is offering "extensions and lease-deferred payments”.
$1.00
Volkswagen Foundation gave $500,000 to the American Red Cross. $0.50 Total $9.35 Source: The Car Connection (http://bit.ly/SW2mLo).
The Threat to Nonprofits from Federal Tax Reform Proposals
The increase in tax rates on top income earners in 2013 would be a plus for charitable giving if this was the only tax-‐reform plan going on in Washington. Higher tax rates encourage philanthropy among the wealthy. Education is the biggest beneficiary of gifts from the very wealthy, so it is likely to gain. But the charitable deduction is under review for almost the first time since it was introduced 96 years ago – four years after the income tax was first imposed. The Obama Administration is seeking to reduce the income tax revenue lost through deductions in order to reduce the Federal deficit. Ideas for reform include reducing the deductibility of charitable gifts, for example:
1. Creating a maximum share of income that may be deducted based on charitable donations, such as 10 or 50 percent.
2. De-‐linking the deductibility of a charitable donation from the nonprofit tax exemption, i.e., limiting the types of organizations eligible to receive tax-‐deductible donations.
3. Replacing the deduction with a 12, 20 or higher percent tax credit. This would benefit people with smaller incomes especially if the credit were refundable. It would greatly broaden the base of charitable giving.
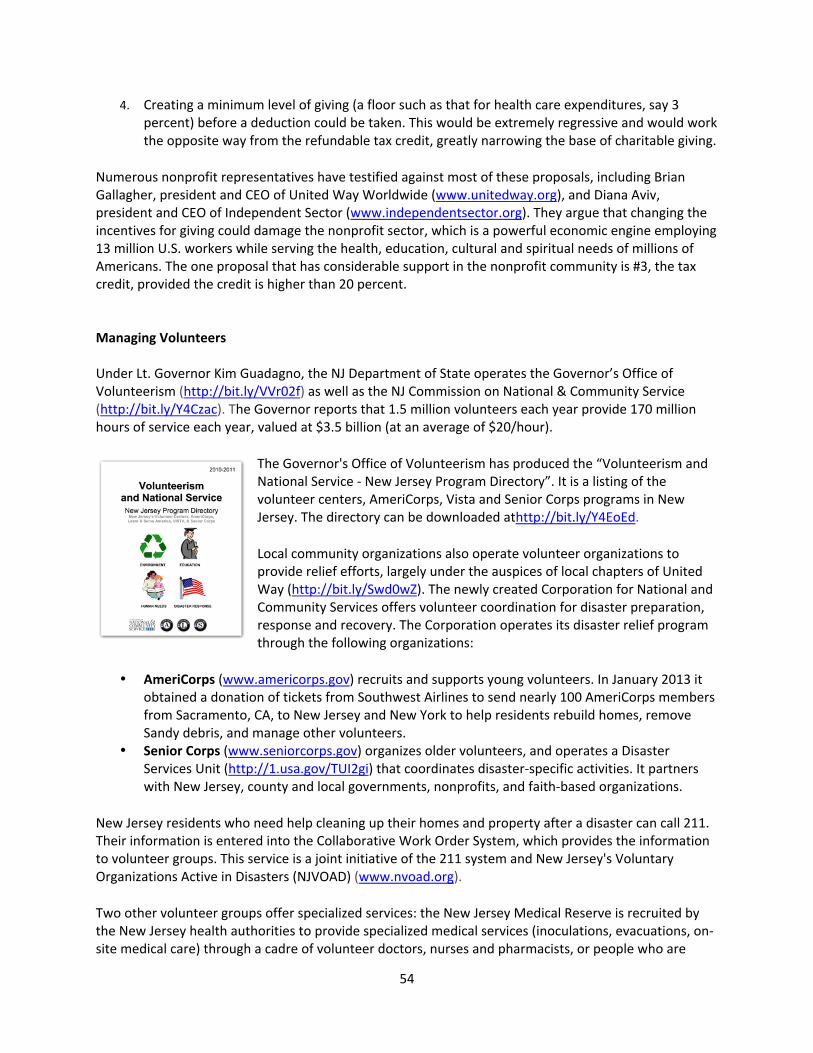
54
4. Creating a minimum level of giving (a floor such as that for health care expenditures, say 3 percent) before a deduction could be taken. This would be extremely regressive and would work the opposite way from the refundable tax credit, greatly narrowing the base of charitable giving.
Numerous nonprofit representatives have testified against most of these proposals, including Brian Gallagher, president and CEO of United Way Worldwide (www.unitedway.org), and Diana Aviv, president and CEO of Independent Sector (www.independentsector.org). They argue that changing the incentives for giving could damage the nonprofit sector, which is a powerful economic engine employing 13 million U.S. workers while serving the health, education, cultural and spiritual needs of millions of Americans. The one proposal that has considerable support in the nonprofit community is #3, the tax credit, provided the credit is higher than 20 percent.
Managing Volunteers Under Lt. Governor Kim Guadagno, the NJ Department of State operates the Governor’s Office of Volunteerism (http://bit.ly/VVr02f) as well as the NJ Commission on National & Community Service (http://bit.ly/Y4Czac). The Governor reports that 1.5 million volunteers each year provide 170 million hours of service each year, valued at $3.5 billion (at an average of $20/hour).
The Governor's Office of Volunteerism has produced the “Volunteerism and National Service -‐ New Jersey Program Directory”. It is a listing of the volunteer centers, AmeriCorps, Vista and Senior Corps programs in New Jersey. The directory can be downloaded athttp://bit.ly/Y4EoEd.
Local community organizations also operate volunteer organizations to provide relief efforts, largely under the auspices of local chapters of United Way (http://bit.ly/Swd0wZ). The newly created Corporation for National and Community Services offers volunteer coordination for disaster preparation, response and recovery. The Corporation operates its disaster relief program through the following organizations:
• AmeriCorps (www.americorps.gov) recruits and supports young volunteers. In January 2013 it obtained a donation of tickets from Southwest Airlines to send nearly 100 AmeriCorps members from Sacramento, CA, to New Jersey and New York to help residents rebuild homes, remove Sandy debris, and manage other volunteers.
• Senior Corps (www.seniorcorps.gov) organizes older volunteers, and operates a Disaster Services Unit (http://1.usa.gov/TUI2gi) that coordinates disaster-‐specific activities. It partners with New Jersey, county and local governments, nonprofits, and faith-‐based organizations.
New Jersey residents who need help cleaning up their homes and property after a disaster can call 211. Their information is entered into the Collaborative Work Order System, which provides the information to volunteer groups. This service is a joint initiative of the 211 system and New Jersey's Voluntary Organizations Active in Disasters (NJVOAD) (www.nvoad.org).
Two other volunteer groups offer specialized services: the New Jersey Medical Reserve is recruited by the New Jersey health authorities to provide specialized medical services (inoculations, evacuations, on-‐site medical care) through a cadre of volunteer doctors, nurses and pharmacists, or people who are

55
willing to be trained in these kinds of skills (https://njmrc.nj.gov/hcpr/index.html). Finally, the Points of light Institute (http://www.pointsoflight.org ) is a volunteer organization inspired by Martin Luther King that sends teams to help out with community-‐based volunteer centers such as local chapters of United Way.
The Plight of Small Businesses The same questions that apply to families apply to small businesses. After a disaster, a small business owner may be too rattled to go on. The combination of lost inventory, damage, lost customers, higher unemployment insurance premiums and scattered employees can be overwhelming. Many businesses can’t cope with the effort to rebuild their businesses after the storm. What is happening to New Jersey jobs and unemployment insurance claims? In New York State, the news is that the claims are soaring, and the unemployment insurance system has a built-‐in mechanism for recouping payments to unemployed workers by raising the premiums of small employers. This is an unanticipated extra burden for small-‐business owners slammed by Hurricane Sandy. It could be the last straw. Many small businesses never reopen after a disaster. On January 7, New Jersey-‐based retailer Big M announced it had filed for Chapter 11 bankruptcy protection disclosing liabilities of $50 million to 1,000 creditors. Headquartered in Totowa, NJ, Big M owns low-‐priced chains Mandee and Annie Sez. Kenneth Rosen of Lowenstein Sandler is handling the bankruptcy (http://bit.ly/U2QHw3). All businesses in the affected areas suffered from flooding and destruction. But the big chains have access to backup and financial resources. Small independent stores, and low-‐margin chains, do not. Large stores can obtain the resources they need and open their doors within days after a storm. Small family-‐owned businesses, such as small restaurants, or regional chains, must contend with weeks or months of closure issues related to damaged inventory (all refrigerated goods must be thrown out), lost or ruined supplies, and delays in settling insurance claims. Employees connected with these small businesses are often without health benefits or pensions. They become suddenly unemployed in a state and in counties with high unemployment rates. The effects are long-‐lasting. SBA loans to cope with Hurricane Sandy damage and business interruption are being approved more slowly than was true after other natural disasters.
• The Wall Street Journal reports that after the first six weeks the SBA has approved about 200 loans totaling $18.8 million—just 22 percent of processed applications. By comparison:
• The first 40 days after Tropical Storm Irene, SBA had a 30 percent application approval rate. • In a comparable period after Hurricane Katrina, the SBA approved 53 percent of loan
applications. A question for further study:
Was the impact of Hurricane Sandy greater on women-‐ and minority-‐owned businesses? A study in New York City indicates that immigrants had a more difficult time during the storm than other groups, because of language problems, paperwork, identification and access. Women-‐ and minority-‐owned businesses are usually small businesses. Is their recovery period longer than
56
that of other businesses? How will the uneven impact of Hurricane Sandy on these businesses affect the demographic composition of the recovery areas five years from now? Will the impact on small businesses intensify the gentrification of the coastal areas?
Potential Jobs in Construction and Other Sectors from Rebuilding In November 2012, New Jersey lost 8,100 private jobs and processed an unprecedented 138,661 first-‐time unemployment claims – nearly as many as New York State’s 158,204 claims. Those most affected are people who generally have a hard time finding jobs-‐-‐older workers, single parents with child-‐care issues, and immigrants speaking little English. Sandy has destroyed their clothing, computers, résumé files. Hurricane Sandy may have made them homeless and phoneless. (http://exm.nr/12Bbk91)
But the good news is that home construction could see a boost in areas affected by Sandy. Builders and construction workers will be delighted at a break in the dearth of work since the 2008 meltdown in the housing market. (http://cbsn.ws/VYBb8E). If we think of the economy as a game of snakes and ladders in which new technologies allow workers a ladder up to better jobs and productivity, a natural disaster is a snake that takes us back down to a prior stage. Replacing destroyed assets means retracing steps that we have already trod – except for the fact that in pacing the same route again we are more aware of the dangers along the way. The wisdom we gain from Hurricane Sandy means we will presumably rebuild more intelligently than we built the first time. The jobs that are being created in rebuilding include a flurry of activity for environmental contractors and consultants who will be hired to manage the process of rebuilding and remediating everything from underground storage tanks to sewage lines. There is an opportunity for jobs relating to cleanup and rebuilding after the storm to go to unemployed New Jersey residents. Could state funds be targeted to this group and to apprenticeship programs? Could there be (should there be?) substantial, monitored and enforced requirements for the hiring, through apprenticeships and otherwise, of people from groups historically excluded from this large sector of the workforce? The silver lining is especially attractive in 2013 because jobs will be created in precisely the occupations where they are needed most – the construction and extraction industry, which has a U.S. labor force of eight million of whom one million were unemployed the month that Hurricane Sandy hit. This occupation is also a major employer of blue-‐collar males, who have been the hardest-‐hit demographic group in the Great Recession (see Table 12).
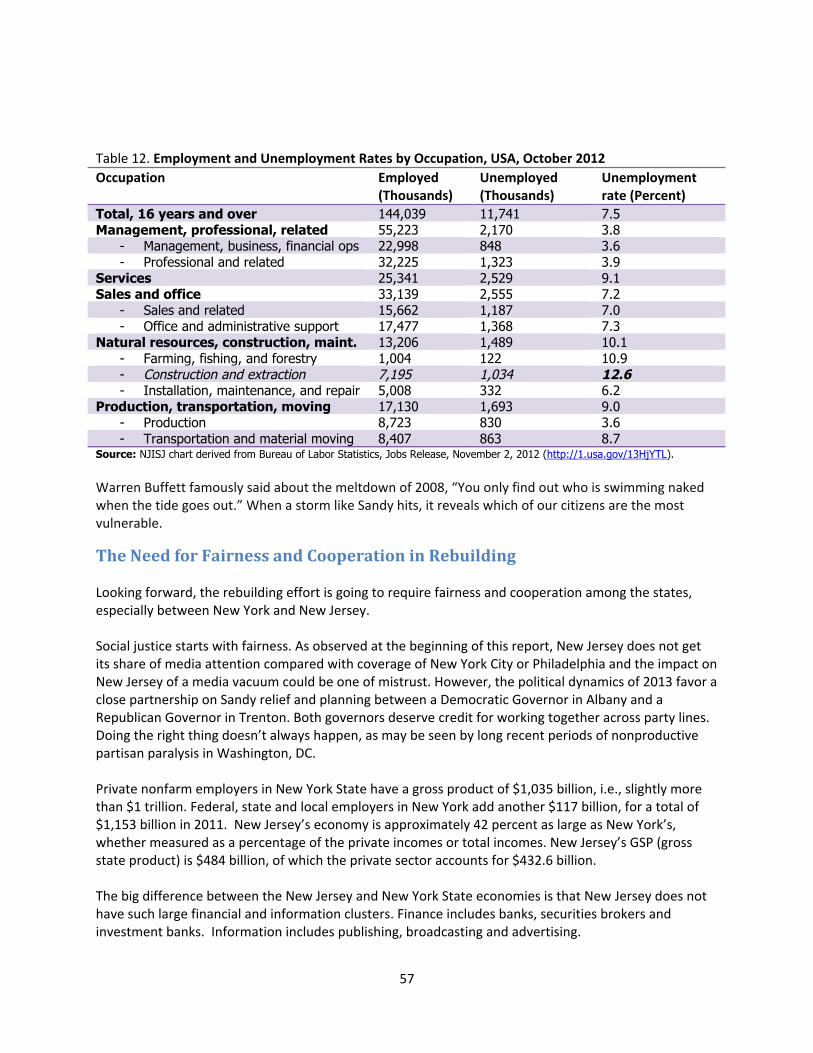
57
Table 12. Employment and Unemployment Rates by Occupation, USA, October 2012 Occupation Employed
(Thousands) Unemployed (Thousands)
Unemployment rate (Percent)
Total, 16 years and over 144,039 11,741 7.5 Management, professional, related 55,223 2,170 3.8
- Management, business, financial ops 22,998 848 3.6 - Professional and related 32,225 1,323 3.9
Services 25,341 2,529 9.1 Sales and office 33,139 2,555 7.2
- Sales and related 15,662 1,187 7.0 - Office and administrative support 17,477 1,368 7.3
Natural resources, construction, maint. 13,206 1,489 10.1 - Farming, fishing, and forestry 1,004 122 10.9 - Construction and extraction 7,195 1,034 12.6 - Installation, maintenance, and repair 5,008 332 6.2
Production, transportation, moving 17,130 1,693 9.0 - Production 8,723 830 3.6 - Transportation and material moving 8,407 863 8.7
Source: NJISJ chart derived from Bureau of Labor Statistics, Jobs Release, November 2, 2012 (http://1.usa.gov/13HjYTL). Warren Buffett famously said about the meltdown of 2008, “You only find out who is swimming naked when the tide goes out.” When a storm like Sandy hits, it reveals which of our citizens are the most vulnerable.
The Need for Fairness and Cooperation in Rebuilding Looking forward, the rebuilding effort is going to require fairness and cooperation among the states, especially between New York and New Jersey. Social justice starts with fairness. As observed at the beginning of this report, New Jersey does not get its share of media attention compared with coverage of New York City or Philadelphia and the impact on New Jersey of a media vacuum could be one of mistrust. However, the political dynamics of 2013 favor a close partnership on Sandy relief and planning between a Democratic Governor in Albany and a Republican Governor in Trenton. Both governors deserve credit for working together across party lines. Doing the right thing doesn’t always happen, as may be seen by long recent periods of nonproductive partisan paralysis in Washington, DC. Private nonfarm employers in New York State have a gross product of $1,035 billion, i.e., slightly more than $1 trillion. Federal, state and local employers in New York add another $117 billion, for a total of $1,153 billion in 2011. New Jersey’s economy is approximately 42 percent as large as New York’s, whether measured as a percentage of the private incomes or total incomes. New Jersey’s GSP (gross state product) is $484 billion, of which the private sector accounts for $432.6 billion. The big difference between the New Jersey and New York State economies is that New Jersey does not have such large financial and information clusters. Finance includes banks, securities brokers and investment banks. Information includes publishing, broadcasting and advertising.
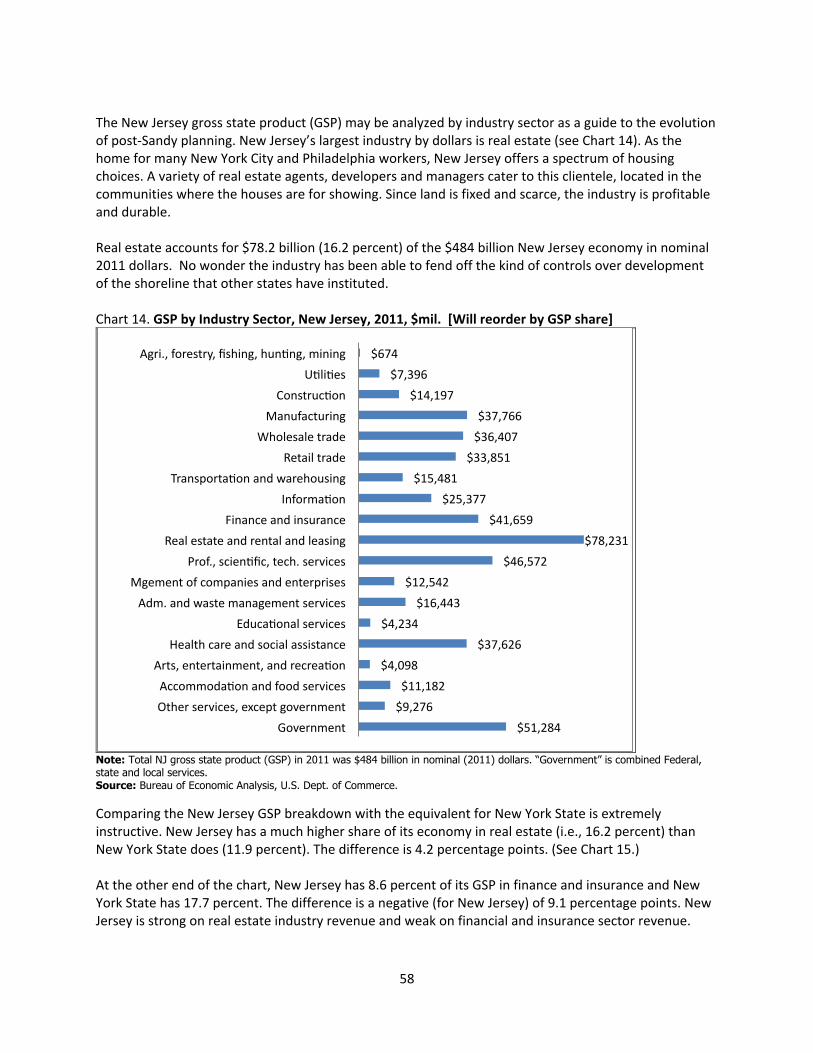
58
The New Jersey gross state product (GSP) may be analyzed by industry sector as a guide to the evolution of post-‐Sandy planning. New Jersey’s largest industry by dollars is real estate (see Chart 14). As the home for many New York City and Philadelphia workers, New Jersey offers a spectrum of housing choices. A variety of real estate agents, developers and managers cater to this clientele, located in the communities where the houses are for showing. Since land is fixed and scarce, the industry is profitable and durable. Real estate accounts for $78.2 billion (16.2 percent) of the $484 billion New Jersey economy in nominal 2011 dollars. No wonder the industry has been able to fend off the kind of controls over development of the shoreline that other states have instituted. Chart 14. GSP by Industry Sector, New Jersey, 2011, $mil. [Will reorder by GSP share]
Note: Total NJ gross state product (GSP) in 2011 was $484 billion in nominal (2011) dollars. “Government” is combined Federal, state and local services. Source: Bureau of Economic Analysis, U.S. Dept. of Commerce. Comparing the New Jersey GSP breakdown with the equivalent for New York State is extremely instructive. New Jersey has a much higher share of its economy in real estate (i.e., 16.2 percent) than New York State does (11.9 percent). The difference is 4.2 percentage points. (See Chart 15.) At the other end of the chart, New Jersey has 8.6 percent of its GSP in finance and insurance and New York State has 17.7 percent. The difference is a negative (for New Jersey) of 9.1 percentage points. New Jersey is strong on real estate industry revenue and weak on financial and insurance sector revenue.
$51,284
$9,276
$11,182
$4,098
$37,626
$4,234
$16,443
$12,542
$46,572
$78,231
$41,659
$25,377
$15,481
$33,851
$36,407
$37,766
$14,197
$7,396
$674
Government
Other services, except government
Accommodason and food services
Arts, entertainment, and recreason
Health care and social assistance
Educasonal services
Adm. and waste management services
Mgement of companies and enterprises
Prof., sciensfic, tech. services
Real estate and rental and leasing
Finance and insurance
Informason
Transportason and warehousing
Retail trade
Wholesale trade
Manufacturing
Construcson
Uslises
Agri., forestry, fishing, hunsng, mining

59
Chart 15. Gross State Product Mix by Industry NJ vs. NY State, 2011, %
Note: GSP=Gross state product. Differences are computed from BEA data that are more detailed than the rounded components as shown. Source: Chart by NJISJ. Percentages and differences calculated by NJISJ based on data from Bureau of Economic Analysis, U.S. Department of Commerce.
8.6
5.2
0.9
0.8
2.3
1.9
7.8
2.9
1.5
9.6
10.6
2.6
3.4
7.0
3.2
7.8
7.5
16.2
17.7
8.3
1.5
1.4
2.8
2.0
7.7
2.8
1.4
9.3
10.2
2.0
2.6
5.8
1.7
6.0
4.9
11.9
(9.1)
(3.1)
(0.7)
(0.5)
(0.5)
(0.1)
0.1
0.1
0.2
0.3
0.4
0.6
0.8
1.2
1.5
1.8
2.6
4.2
Finance and insurance
Informason
Educasonal services
Arts, entertainment, and recreason
Accommodason and food services
Other services, except government
Health care and social assistance
Construcson
Uslises
Professional, sciensfic, and technical services
Government
Management of companies and enterprises
Administrasve and waste management services
Retail trade
Transportason and warehousing
Manufacturing
Wholesale trade
Real estate and rental and leasing
NJ-‐NY% NY% NJ%
60
Conclusions This report focuses on how New Jersey was affected by Hurricane Sandy, how it has responded so far, and what groups have been most vulnerable or are not being treated fairly by the systems in place. The thorniest questions relate to housing and businesses near the shorelines and the question of rebuilding. These questions will in due course engage a large number of New Jersey residents as they grapple with living or working in areas subject to flooding and wind damage. Relative to its economy, New Jersey suffered most of all the states hit by Sandy. Losses were 2.7 percent of New York State’s economy and 5.8 percent of New Jersey’s. This is against a steady loss of jobs to New York City. In 2003 NJ had 13 percent more workers than NYC – now it has is only 2 percent higher.
• Total losses from Hurricane Sandy are estimated by Eqecat and Munich Re AG at $50 billion.
With funding of nearly $10 billion for flood prevention systems, total U.S. losses were $82.2 billion of which $20-‐$25 billion will be paid for by insurance companies. The rest has been funded by $62.2 billion in grants and authorizations.
• New Jersey’s share of Federal funds should approximate 45 percent, but the first payout was only 35 percent.
• At the same time, close regional cooperation will be required in reviewing the potential for a sea gate across the mouth of New York Harbor.
• Hurricane Sandy revealed that previous risk estimates for hurricanes were grossly underestimated, since two “100-‐year storms” occurred in two years. Therefore a mitigation plan is essential and the Congress and the President have agreed to fund it – up to 90 percent of uninsured losses and the mitigation-‐prevention program.
• Hurricane Sandy cut a wide swath and caused more damage than Hurricane Irene in 2011, including more than 100 deaths in New York State and New Jersey.
• In New Jersey, the deaths were largely from asphyxiation as respirators could not work without electricity, or from carbon monoxide poisoning from fires or generators.
• The fact that so many people in New Jersey died from respiratory problems suggests that even more efforts must be made to educate the public – especially elderly people – in advance of a storm about how to cope with a lack of electricity without poisoning or setting on fire a property while using temporary lighting or heat.
• Evacuation was an effective policy and continues to be a challenge. • Hurricane mitigation remains another challenge, especially in areas where houses are not solidly
constructed. • New Jersey is a high-‐income state. This means that homes were more solidly built than in
Louisiana and were by and large not blown away by the storm as with Katrina. But many homes and communities were completely destroyed, mostly in the three east-‐central counties of Atlantic, Ocean and Cape May.
Potential Policy Responses and Recommendations from NJISJ The following potential policy responses and recommendations are only partly derived from the paper that precedes it. Some of the recommendations come from early reports on recommendations being reviewed by state commissions, or the recommendations of published research studies. They are meant to be a focus of discussion.
61
To the President We thank the President for his early action to request $60.4 billion to assist the states most affected by Hurricane Sandy. We urge the President to instruct FEMA and other Federal disaster-‐assistance units to continue to share information with states and localities so that a transparent response program is in place within which states and localities can coordinate disaster responses and ensure faster availability of supplies such as emergency fuel. We urge the President to allocate Sandy funds according to needs, while rewarding cooperation among states. To the U.S. Congress We thank the 112thand 113th Congresses for authorizing$60.2 billion in federal resources to respond to, recover from and mitigate the weaknesses revealed by Hurricane Sandy. To New Jersey Governor Chris Christie and the State Legislature We thank Governor Christie for partnering across party lines with other Governors to help the beleaguered people and businesses of New Jersey. We recommend that he:
• Work with the New Jersey National Guard to reduce the dangers of blackouts and assist public utilities with power restoration and other emergency duties. Establish stockpiles for use in emergencies, including a fuel reserve.
• Require that commercial gasoline distribution sites be able to operate during a blackout. • Utilize text messaging/Twitter to communicate with residents. • Provide specialized emergency-‐response training for the National Guard that includes a
component on communication systems that can work with social media and private nonprofits working with volunteers. Strengthen cell phone networks and communication systems and develop a program to allow mass text messages to send messages to a specific geographic area.
• Coordinate public-‐private efforts to rebuild New Jersey’s devastated areas – designate a high-‐ranking Regional Disaster Coordinator in major recovery agencies to work with FEMA and nonprofit organizations to ensure that public and private skills and funding are optimally used.
• Update building codes to improve the resilience of buildings. • Provide homeowners in vulnerable locations with support to mitigate future threats or to
relocate. • Develop a plan to focus on the elderly and “ALICE” households in a disaster. • Provide a forum for thinking about rebuilding – storm barriers, state and local and nonprofit
purchase of shore properties, optimal changes in local zoning and building codes. In conjunction with other Atlantic states and the nation, intensify efforts to reduce the causes of climate change:
• Lower state and regional greenhouse gas emissions caps. • Increase alternative local renewable power sources. • Ensure a skilled energy workforce by expanding green career training and placement programs • Encourage use of green and natural infrastructure
62
Through the New Jersey Commissioner of Banking and Insurance: • Review the handling of Hurricane Sandy insurance claims • Seek to improve business coverage to insure against interruptions • Streamline claims-‐adjuster licensing regulations • Encourage coordinated place-‐based catastrophe response • Reduce flood underinsurance by publicizing availability of Federal programs • Monitor flood and private coverage in flood-‐prone areas • Protect policyholders from losing their policy coverage at the time they need it most
Too many people are still succumbing to the dangers of gas heating, or backup generators, or candles, during blackouts. The elderly and disabled are especially vulnerable. Through the New Jersey Board of Public Utilities, encourage or require utilities to:
• Organize teams of experts and leaders in the senior community to offer training in senior-‐citizen centers on use of generators and the dangers of gas ovens as heaters.
• Provide advice in bill stuffers and other vehicles about appropriate responses to lack of heat when the electricity supply is cut off.
• Offer or provide as standard equipment longer backup batteries for seniors reliant on electric machinery.
• Work with facilities pumping fuel for cars or boats to ensure continued service in the event of a prolonged blackout.
Leverage funding allocated for rebuilding devastated New Jersey communities to ensure that New Jersey citizens are employed for these public works, especially for longer-‐term work where skills can be taught to unemployed New Jersey residents. For example:
• Support a comprehensive coastal risk analysis of New York Harbor and the Jersey shore by the U.S. Army Corps of Engineers for the purpose of establishing a Hurricane Protection System for the Harbor and the NJ coast from Cape May to Sandy Hook.
• Consider possible infrastructure and construction improvements, zoning changes and beach protection along the Jersey coast, and their potential impact on the elderly, the poor and near-‐poor working people, small businesses and nonprofits.
• NJ Build already sets aside one-‐half of one percent of building funds to pay for apprentice training on public projects. If damaged infrastructure or landmark cultural reassures such as The Boardwalk are declared such public projects, apprenticeships could immediately be coordinated for maximum restoration-‐employment effect.
• Ask the Red Tape Commission to use Sandy as a case study, and search for bureaucratic impediments to efficient, fair and effective relief, restoration and rebuilding.
To New Jersey Municipalities
We thank the officials of the storm-‐pummeled counties and localities of New Jersey for their courage in facing the relief, recovery and rebuilding challenges, especially the challenge of coping with reduced
property-‐tax assessments.
Action is needed both in the urbanized and rural areas of New Jersey:
• Cities are environmentally superior to less densely populated areas in many ways, but storm water runoff is poorly handled. It needs to find places to go that are not likely to end up in rivers
63
and water supply systems. “Green infrastructure” systems rely less on large pipes. They are detailed in a recent tri-‐state Regional Plan Association report, “9 Ways to Make Green Infrastructure Work” (http://bit.ly/YuClq3) which shows municipalities how best to address water issues.
• Local governments and utilities can help prevent blackouts by simply being more aggressive about trimming trees. Many deaths were caused by falling branches, which either fell on people or brought down electrical wires. In some states like Wisconsin, trees must be trimmed back to a minimum distance from any electrical wires.
• Burying wires is often a good way to weather-‐proof the electrical supply, except where it would be extremely costly or susceptible to salt-‐water corrosion. Municipalities might ask utilities to offer customers a plan to bury wires in return for a charge on the electric bill until the cost is paid off.
• Building codes and zoning rules need to be reexamined to mitigate the potential for flooding based on the new FEMA flood maps. State guidelines might be provided to localities for carrying out such a review. The negative impact of changed rules on homeowners should be considered and in the interest of social justice (and the Fifth Amendment), pre-‐Sandy market value should be offered for buyouts or support for compliance with new zoning laws where appropriate.
• Governor Cuomo’s Milstein-‐Redlener Commission on readiness for disasters is urging extension of voluntary databases on vulnerable people for use before, during and after a disaster such as a hurricane, and more training by local officials (http://bit.ly/Wq9dMC). New Jersey should pursue the same thoroughness in compiling data with respect for privacy, and readiness to utilize it at the local level.
To the New Jersey Nonprofit Sector Hurricane Sandy offers an opportunity to see the nonprofit sector at work. While the disaster and the response are still before us, the state’s nonprofit leadership should:
• Survey key nonprofits engaged in relief and recovery, and assess fairly where they have succeeded in bringing resources to bear quickly for relief and where and for what reason the relief effort was slow or imperfectly managed.
• Identify what measures of effectiveness in the relief effort can be found in use or could be introduced. This will not be New Jersey’s last disaster. What can we learn from this one to be more prepared for the next one?
• Monitor the use of FEMA and other national relief funds, including money collected by nonprofits for Sandy relief efforts.
• Build on the excellent paper by United Way on ALICE (Asset Limited Income Constrained Employed) households. The paper shows the plight in New Jersey of the working poor. Has this kind of information been utilized in the relief effort? How?
• What municipalities might need and use some help to get flood mitigation efforts under way? • Develop proposals for addressing the safety and asset-‐protection problems of the elderly and of
poor and ALICE households, and submit these proposals to the Governor and Legislature. • Make sure that HUD Section 3 provisions are used to encourage local training and employment.
To New Jersey’s Universities Within the nonprofit sector, universities have a wealth of knowledge to share than can be brought to bear in a disaster and in planning for recovery, such as scientific information on the likelihood of certain types of disasters, optimal avenues for mitigation, and data on prior incidents and responses. We urge a
64
collaborative effort by New Jersey universities to follow the example of Columbia and NYU, which have catastrophe preparedness-‐and-‐response study centers, and:
• Prepare a near-‐term and long-‐term assessment of the effectiveness of relief, restoration and rebuilding efforts, with special concern for the disadvantaged for whom the storm was more than an inconvenient extra expense but involved loss of irreplaceable assets, personal financial ruin, loss of employment and trauma.
• As part of their own building programs, especially as funded by the higher-‐education bonding approved by referendum, seek opportunities to align university construction with Sandy rebuilding and restoration projects.
Note: The font used in the text of this paper is Calibri 11. For tables and charts it is usually Tahoma 10, and for notes and sources it is Tahoma 8.
Acknowledgments Dr. Marlin wishes to acknowledge the warm welcome he has been given at the New Jersey Institute for Social Justice, starting with the continuing dialog he has maintained with Cornell William Brooks about social justice and New Jersey. He is also grateful to Kevin Donahue of ReServe for contacting him about the need of the NJISJ for a Chief Economist. Many NJISJ staff members have given generously of their time to review drafts of this paper, especially: Kelly Dougherty, CFO and Chief of Staff; Mariana Giraudo, Research Project Manager; Craig Levine, Esq., Senior Counsel and Policy Director; Dr. Scott Nolen, Director of Equal Justice and Communications; and Albert Williams, Director of Workforce Development and Training. Stanford intern Alex Hecht played an extremely valuable role in the final weeks of preparation of this report, greatly improving both the content and the appearance of the document. Princeton Fellow Ashley Mitchell reviewed the document for grammar and other errors. Professor Bill Rodgers of Rutgers University helpfully showed the relevance to this report of the “ALICE” study by the United Way of Northern New Jersey. In addition, Dr. Marlin thanks staff members at the New Jersey Department of Labor for their cooperation in providing data, and is grateful to the New Jersey’s Treasurer, Andrew Sidamon-‐Eristoff, for including him in the second annual conference on the New Jersey economy in Trenton in November 2012. Finally, he thanks his wife, New Jersey native Alice Tepper Marlin – not to be confused with “ALICE” – for her valuable comments on the paper and for so many other kindnesses during 42 years of married life.
![HURRICANE SANDY RECOVERY WORKSHOP SUMMARY …...Hurricane Sandy Recovery Workshop Summary Report [2] Introduction On October 29, 2012, Hurricane Sandy made landfall north of Brigantine,](https://img.pdfslide.us/doc/110x75/5f0d17507e708231d438a277/hurricane-sandy-recovery-workshop-summary-hurricane-sandy-recovery-workshop.jpg)