Embed Size (px)
Citation preview

Florida International UniversityFIU Digital Commons
FIU Electronic Theses and Dissertations University Graduate School
11-10-2016
Hurricane Preparedness in a Construction Site: aFramework to Assess the ConstructionCompanies’ Current PracticesMICHELLE S. CHAVEZmchav084, [email protected]
DOI: 10.25148/etd.FIDC001187Follow this and additional works at: https://digitalcommons.fiu.edu/etd
Part of the Construction Engineering and Management Commons
This work is brought to you for free and open access by the University Graduate School at FIU Digital Commons. It has been accepted for inclusion inFIU Electronic Theses and Dissertations by an authorized administrator of FIU Digital Commons. For more information, please contact [email protected].
Recommended CitationCHAVEZ, MICHELLE S., "Hurricane Preparedness in a Construction Site: a Framework to Assess the Construction Companies’Current Practices" (2016). FIU Electronic Theses and Dissertations. 3047.https://digitalcommons.fiu.edu/etd/3047
FLORIDA INTERNATIONAL UNIVERSITY
Miami, Florida
HURRICANE PREPAREDNESS IN A CONSTRUCTION SITE: A FRAMEWORK
TO ASSESS THE CONSTRUCTION COMPANIES’ CURRENT PRACTICES
A thesis submitted in partial fulfillment of the
requirements for the degree of
MASTER OF SCIENCE
in
CONSTRUCTION MANAGEMENT
by
Michelle S. Chávez
2016

ii
To: Interim Dean Ranu Jung
College of Engineering and Computing
This thesis, written by Michelle S. Chávez, and entitled Hurricane Preparedness in a Construction Site: A Framework to Assess the Construction Companies’ Current Practices, having been approved in respect to style and intellectual content, is referred to you for judgment.
We have read this thesis and recommend that it be approved.
_______________________________________
Jose Faria
_______________________________________
Nipesh Pradhananga
_______________________________________
Youngjib Ham, Major Professor
Date of Defense: November 10, 2016
The thesis of Michelle S. Chávez is approved.
______________________________________ Interim Dean Ranu Jung
College of Engineering and Computing
_______________________________________
Andrés G. Gil Vice President for Research and Economic Development and Dean of the University Graduate School
Florida International University, 2016

iii
© Copyright 2016 by Michelle S. Chávez
All rights reserved.
iv
DEDICATION
I dedicate this thesis to my parents Miguel Angel and Beatriz. I hope that
this achievement makes you prouder, it’s a sample of all the hard work I have been
through to complete my Master’s program in the US. Thank you so much for your
support in spite of the physical distance that separates us, and for always giving
me the comforting word that I needed during the darkest time.
Also, to all my friends here in the US whom where an important support
and a second family during all this time.

v
ACKNOWLEDGMENTS
I would like to express my gratitude to my advisor Dr. Youngjib Ham, for
his guidance and support through all the thesis process.
I would also like to thank Dr. Jose Faria for his support during the survey
part of this research, his involvement allow me to interview industry people and
understand the problem. And, special thanks to all the professionals that helped
me with the survey-interviews.

vi
ABSTRACT OF THE THESIS
HURRICANE PREPAREDNESS IN A CONSTRUCTION SITE: A FRAMEWORK
TO ASSESS THE CONSTRUCTION COMPANIES’ CURRENT PRACTICES
by
Michelle S. Chávez
Florida International University, 2016
Miami, Florida
Professor Youngjib Ham, Major Professor
Civil infrastructure construction sites including incomplete structures and
unsecured resources are among the most vulnerable environments to hurricane
conditions. Hurricane driven damages cause disruption of construction sites and
considerable schedule delays, and thus negatively impact the efficiency of the
construction projects. This research aims to study current best practices on
securing construction sites from hurricane conditions and evaluate the
performance of the preparedness plan. To do that, first, an interview-survey is
conducted with key project personnel from multiple construction companies. Then,
the insight from the interviews serves to do a Micro and Macro Environmental
Analysis. For further analysis, a Balanced Scorecard is used to suggest metrics to
measure and improve the performance of the Hurricane Preparedness Plan. The
findings from this research improves the organizational processes and enhances
the assessment of disaster preparedness, which ultimately generates new and
highly specific knowledge on disaster mitigation and preparedness guidelines for
construction sites.
vii
TABLE OF CONTENTS
CHAPTER PAGE
1. INTRODUCTION ........................................................................................... 1
2. LITERATURE REVIEW .................................................................................. 4
2.1. Hurricanes Meteorological Background ......................................................... 4
2.2. Hurricane Preparedness in Construction Sites .............................................. 4
2.3. Insurance Companies Preparedness Recommendations .............................. 6
2.4. State Agencies Preparedness Recommendations ...................................... 13
2.5. Construction Companies Preparedness Recommendations ....................... 14
2.6. The Balanced Scorecard ............................................................................. 18
2.6.1. BSC Concept and Perspectives ............................................................... 19
2.7. The BSC in the Construction Industry – Previous Works ............................ 24
2.7.1. Scorecard Approach to Benchmarking Organizational Safety Culture in
Construction ....................................................................................................... 24
2.8. Limitations of Previous Works and Gaps-in-Knowledge .............................. 25
3. METHODOLOGY ......................................................................................... 27
3.1. Data Collection ............................................................................................ 28
3.1.1. Construction Companies Survey-Interview ............................................... 28
3.2. Survey general views .................................................................................. 30
3.2.1. Current practices, challenges, and limitations .......................................... 30
3.2.2. Measurement of the current practices ...................................................... 34
3.2.3. New Approach needed for hurricane preparedness ................................. 34
3.2.4. Cost and schedule issues related to hurricane preparedness .................. 35
3.3. Survey results and major factors identified .................................................. 36
3.4. Hurricane Preparedness in Construction Sites – Macro Environment
Analysis .............................................................................................................. 39
3.4.1. Political Factors ........................................................................................ 40
3.4.2. Economic Factors ..................................................................................... 41
3.4.3. Social Factors ........................................................................................... 42
viii
3.4.4. Technological Factors............................................................................... 44
3.4.5. The External Factor Evaluation (EFE) Matrix ........................................... 45
3.5. Hurricane Preparedness in Construction Sites - Micro Environment
Analysis .............................................................................................................. 49
3.5.1. Strengths and Weaknesses Factors ......................................................... 49
3.5.2. The Internal Factor Evaluation (IFE) Matrix .............................................. 50
3.6. The Internal and External Matrix .................................................................. 54
3.7. Hurricane Preparedness Balanced Scorecard............................................. 57
3.7.1. Management Perspective ......................................................................... 59
3.7.2. Customer Perspective .............................................................................. 61
3.7.3. Internal Process Perspective (Operational) .............................................. 64
3.7.4. Learning and Growth Perspective ............................................................ 66
3.7.5. Hurricane Preparedness Balanced Scorecard Summary Table ............... 68
4. RESULTS AND DISCUSSION ..................................................................... 69
4.1. Survey main aspects ................................................................................... 69
4.2. Balanced Scorecard main aspects .............................................................. 72
5. CONCLUSION ............................................................................................. 76
5.1. Summary ..................................................................................................... 76
5.2. Limitations and Future Studies .................................................................... 78
LIST OF REFERENCES .................................................................................... 80

ix
LIST OF TABLES
TABLE PAGE
Table 1: Preparedness plan important components and current practices……..32
Table 2: PEST Analysis Factors……………………………………………………. 45
Table 3: The External Factor Evaluation (EFE) Matrix…………………………….48
Table 4: Internal Analysis Factors…………………………………………………...50
Table 5: The Internal Factor Evaluation (IFE) Matrix……………………………...53
Table 6: SWOT Matrix………………………………………………………………...57
Table 7: Hurricane Preparedness BSC……………………………………………..69

1
1. INTRODUCTION
Hurricane losses in the United States have ascended to billions of dollars in
property damages, where Hurricane Katrina recognized as the costliest natural
disaster produced an aftermath of $108 billion. In the state of Florida, Hurricanes
Andrew and Wilma caused damages between $21 and $27 billion respectively
(Blake et al. 2011). The outcome of these events negatively affected civil
infrastructures in operation as well as unstructured construction sites including
incomplete structures and unsecured resources (e.g., materials, equipment, and
temporary facilities). For example, 2012 Hurricane Sandy caused over $185 million
worth of damages to the World Trade Center construction project in New York City
(Fermino 2013).
Current ordinances, regulations, and building codes in the construction industry;
mainly focus on the design of more resilient structures. Also, construction
companies located in hurricane prone-areas typically protect their job sites by the
application of extreme wind preparations. In addition, regulatory agencies such as
the Occupational Safety and Health Administration (OSHA) continuously work in
the supervision of construction companies and their vulnerable construction
environments. In general, assessment of hurricane preparedness (HP) is based
on agencies’ general standards that are improved following experiences of industry
professionals. Therefore, the entire responsibility relies on the contractors in terms
of the design, implementation, and monitoring of the on-site hurricane
preparedness plan (HPP) for construction projects.

2
This research aims to study current practices on securing construction sites from
extreme wind events such as hurricanes. Also, this study intends to analyze the
related organizational issues and then propose a framework that allows to evaluate
performance in construction projects. First, rigorous literature reviews are
conducted to understand prior hurricane preparations and the main criteria used
to measure performance. Subsequently, intensive interview-surveys are
conducted with key project personnel from multiple construction companies to
understand current operational protocols, best practices, and issues on disaster
preparedness plans in construction sites. Then, the insights from the domain
expert evaluations are fed into the micro environmental analysis of the problems,
and this task is followed by the macro environmental analysis. For further
exploration, a balanced scorecard is used to suggest objectives and metrics to
improve the performance of disaster preparedness plans of construction
companies, this in terms of the following four perspectives: (1) the Internal Process
Perspective, (2) the Learning & Growth Perspective, (3) the Customer Perspective,
and (4) the Financial Perspective.
This research is likely to help practitioners to integrate industry professionals’
experiences as critical factors that finally monitor the performance of disaster
preparedness. Also, the findings of this study have the potential to contribute to
specialists a better understanding of the need to apply strategic measurements or
performance indicators to assess the disaster preparedness of construction
projects. This work allows the possibility to improve organizational processes
enhancing the assessment of HP, which ultimately generates new and highly

3
specific knowledge on disaster mitigation and preparedness guidelines in
construction sites.

4
2. LITERATURE REVIEW
2.1. Hurricanes Meteorological Background
Storm systems include tropical cyclones characterized by a low-pressure system
and thunderstorms that produce strong wind and flooding rain that occurred in
tropical regions (Strobl 2011). Depending on their location and strength, the
systems are referred by other names such as hurricane, typhoon, tropical storm,
cyclonic storm, and tropical depression (Strobl 2011). A hurricane is defined as a
rotating mass of wind that circulates around a calm center called the eye, which is
surrounded by rain bands that extend in spirals. Hurricanes are potent forces which
duration can last for more than two weeks over water and can spread across 400
miles. Also, they are large-moving storm systems that can affect entire states or
regions among coastal development and inland areas (Schwab et al 2007). The
hurricane season in the Atlantic, Caribbean and Gulf of Mexico area ranges from
June 1 to November 30 each year (Allianz 2011). According to the Saffir/Simpson
Hurricane Wind Scale (SSHWS), hurricanes are classified in 5 categories
depending on certain wind values: (1) 74-95 mph (2) 96-110 mph (3) 111-130 mph
(4) 131-155 mph (5) > 155 mph.
2.2. Hurricane Preparedness in Construction Sites
Natural disaster studies related to the construction field have revealed that for a
$1 invested in prevention, $40 of loss are reduced (Pheng et al. 2006). Therefore,
construction sites protected with robust preventative planning mitigate potential
5
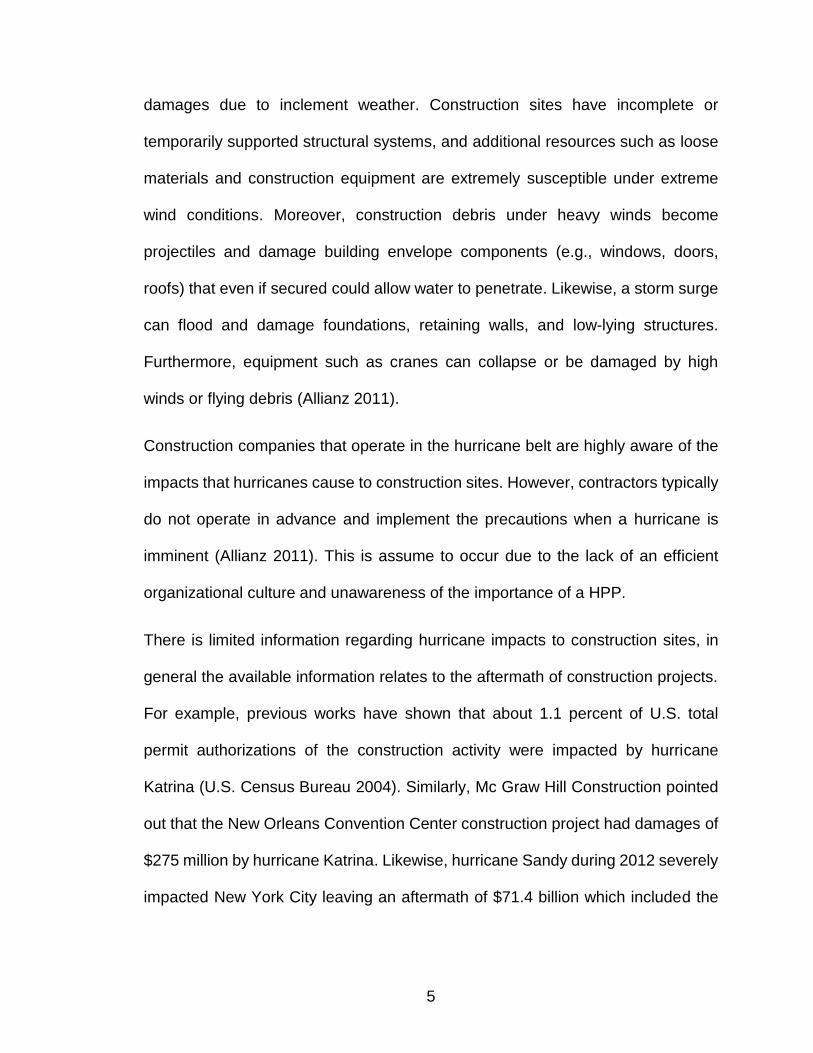
damages due to inclement weather. Construction sites have incomplete or
temporarily supported structural systems, and additional resources such as loose
materials and construction equipment are extremely susceptible under extreme
wind conditions. Moreover, construction debris under heavy winds become
projectiles and damage building envelope components (e.g., windows, doors,
roofs) that even if secured could allow water to penetrate. Likewise, a storm surge
can flood and damage foundations, retaining walls, and low-lying structures.
Furthermore, equipment such as cranes can collapse or be damaged by high
winds or flying debris (Allianz 2011).
Construction companies that operate in the hurricane belt are highly aware of the
impacts that hurricanes cause to construction sites. However, contractors typically
do not operate in advance and implement the precautions when a hurricane is
imminent (Allianz 2011). This is assume to occur due to the lack of an efficient
organizational culture and unawareness of the importance of a HPP.
There is limited information regarding hurricane impacts to construction sites, in
general the available information relates to the aftermath of construction projects.
For example, previous works have shown that about 1.1 percent of U.S. total
permit authorizations of the construction activity were impacted by hurricane
Katrina (U.S. Census Bureau 2004). Similarly, Mc Graw Hill Construction pointed
out that the New Orleans Convention Center construction project had damages of
$275 million by hurricane Katrina. Likewise, hurricane Sandy during 2012 severely
impacted New York City leaving an aftermath of $71.4 billion which included the
6
Midtown Manhattan 74-story skyscraper project that was under construction. The
major issue was the boom of the tower crane that collapsed. In the case of Miami-
Florida, hurricane Wilma impacted the Miami International Airport South Terminal
construction project leaving a total damage of $4,199,192 (FEMA 2012).
Despite the use of resources (e.g., automated forecasting, satellite-based
estimates, computer and communications systems, wind speed monitors) to
monitor construction sites from hurricanes, weather uncertainty prevails as a prime
factor towards robust HP. Nevertheless, the industry professionals perform daily
observations following the HPP recommendations for construction sites.
Additionally, for a complete and correct hurricane program implementation, there
is the need for construction companies to revise their internal processes and be
aware of how organizational procedures and participants-behaviors may influence
HP.
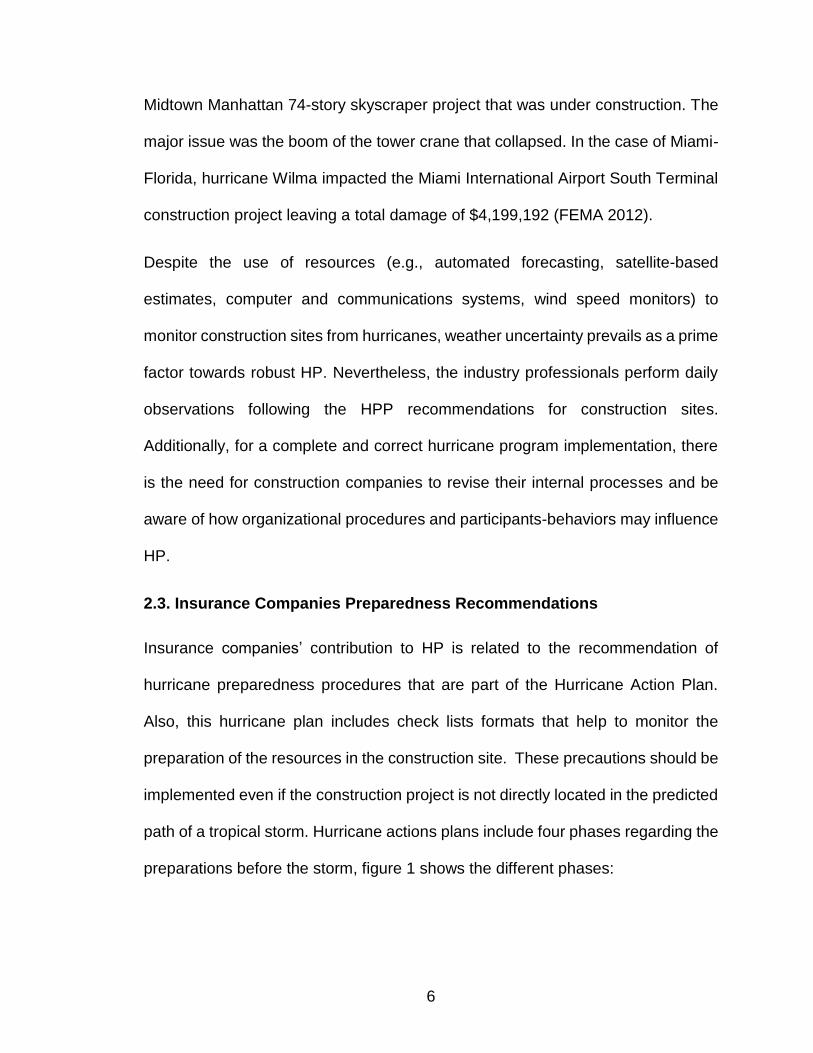
2.3. Insurance Companies Preparedness Recommendations
Insurance companies’ contribution to HP is related to the recommendation of
hurricane preparedness procedures that are part of the Hurricane Action Plan.
Also, this hurricane plan includes check lists formats that help to monitor the
preparation of the resources in the construction site. These precautions should be
implemented even if the construction project is not directly located in the predicted
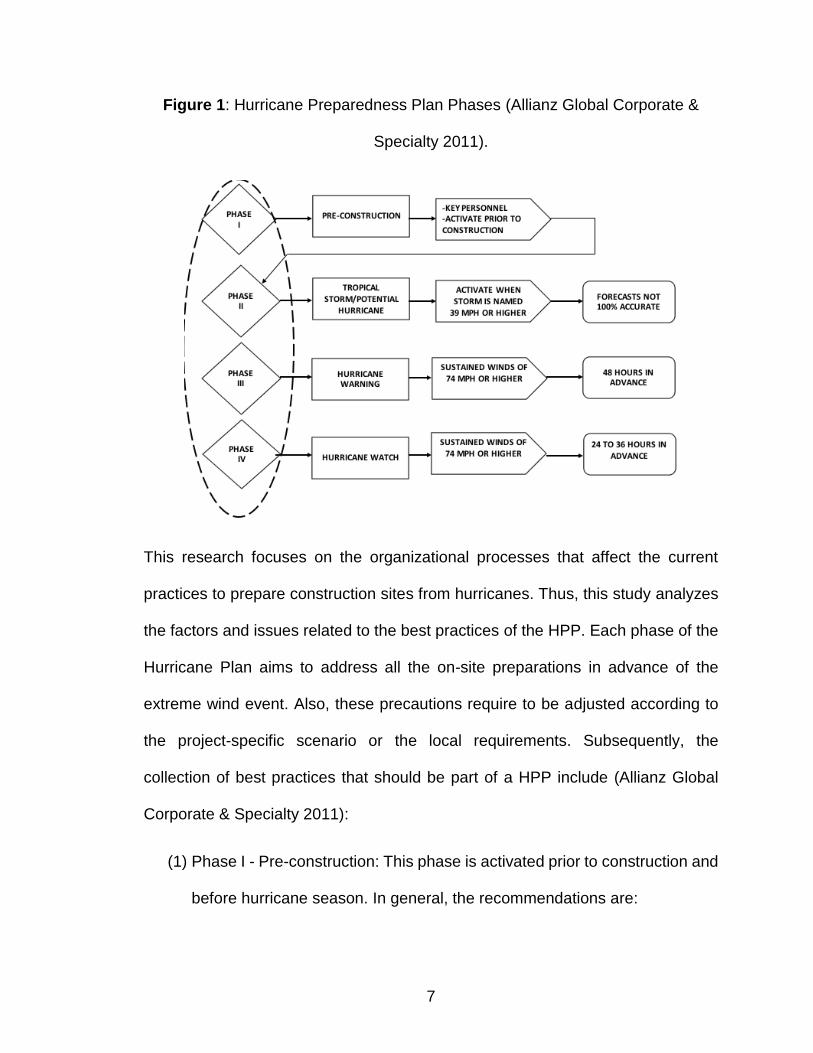
path of a tropical storm. Hurricane actions plans include four phases regarding the
preparations before the storm, figure 1 shows the different phases:
7
Figure 1: Hurricane Preparedness Plan Phases (Allianz Global Corporate &
Specialty 2011).
This research focuses on the organizational processes that affect the current
practices to prepare construction sites from hurricanes. Thus, this study analyzes
the factors and issues related to the best practices of the HPP. Each phase of the
Hurricane Plan aims to address all the on-site preparations in advance of the
extreme wind event. Also, these precautions require to be adjusted according to
the project-specific scenario or the local requirements. Subsequently, the
collection of best practices that should be part of a HPP include (Allianz Global
Corporate & Specialty 2011):
(1) Phase I - Pre-construction: This phase is activated prior to construction and
before hurricane season. In general, the recommendations are:

8
Have a person in charge of the plan implementation that has the
control during the emergency and assigns emergency responsibility
roles.
Develop the Hurricane Response and Recovery teams.
Have an emergency phone list for all key personnel and
subcontractors.
Meet, review, and discuss the Hurricane Action Plan, the team
members’ roles and responsibilities.
Assign responsibility for monitoring the weather and tracking the
storm when is named.
Think of possible project scenarios and specific courses of action for
each.
Develop an inspection and testing schedule for emergency
equipment.
Establish treaties with contractors, subcontractors, and suppliers.
Establish contracts prior to hurricane season with pre-negotiated
rates.
Perform pre-planning with local authorities.
Establish procedures to follow in the event of exposed energized
electrical wires, flammable or hazardous liquid leaks, leaking gas,
structural damage and utility damage.

9
Make provisions for security measures, salvage, and cleanup
operations.
(2) Phase II – Tropical Storm/Potential Hurricane: During this phase weather
forecasts are not 100% accurate. Consequently, precautions should be
implemented even if the construction site is not directly in the projected path
of the tropical storm. This phase is activated when the storm is named and
wind speeds are of 39 mph. In general, the recommendations are:
Review the Hurricane Action Plan and update if required.
Conduct a project meeting and review and confirm action items with
the individuals responsible.
Monitor material deliveries and foresee the impact of material
deliveries and the potential of stopping deliveries.
Determine material required to protect the site (e.g., plywood,
netting, banding, plastic sheeting, trailer anchors, and tie-downs,
concrete anchor screws).
Secure the jobsites (e.g., protect/secure materials and equipment,
cover exterior openings, complete structures, brace equipment,
clean site, etc.).
Update the project’s Critical Path Method (CPM) Schedule Logic
Diagram. This is useful to determine the project’s pre-storm status
and later establish the delays caused by the storm, damages and
repairs.

10
(3) Phase III – Hurricane Watch: This phase is activated 48 hours before the
storm and anticipated sustained wind speeds of 74 mph or higher. In
general, the recommendations are:
Stop all material deliveries.
Have subcontractors move any uninstalled materials to a safe
location.
Discontinue works on parts of the project that would be vulnerable to
damage by extreme wind-related events.
Complete work if it would minimize the impact of a storm event (e.g.,
roofs, openings).
Protect materials or equipment that cannot be moved (e.g., brace,
secure, band, bundle, elevate materials 4 inches above the floor).
Cover exterior openings (e.g., doors, windows, roof openings).
Close all doors and windows.
Remove, secure, isolate or neutralize chemicals to prevent any
release or reaction.
Anchor and tied down all construction trailers, shipping containers,
or storage boxes.
Remove loose jobsite materials and debris that could become
projectiles.
Remove or secure with nets dumpsters/garbage containers.
Relocate important documents and records to a safe location.

11
Finish work on partially completed structures to minimize damages.
Brace/secure if completion of structures is not possible.
Remove and secure formwork if it cannot be filled with concrete (e.g.,
secure using heavy structural steel components and banding).
Prepare structures to prevent water damage (e.g., grading,
sandbagging).
Have a design engineer examine and advise how to minimize
potential damage to the structures.
Remove scaffolds when possible. If removal is not feasible, remove
and secure all boards. Secure all mobile scaffolds to columns or
place them in shipping boxes.
(4) Phase III – Hurricane Warning: This phase is activated less than 24 to 36
hours before the storm, and during this stage there are sustained wind
speeds of 74 mph or higher. In general, the recommendations are:
Secure all exterior building openings, doors and windows.
Minimize the infiltration of water into the building and excavations
(e.g., install protective measures such as grading, berms, sandbags,
pipe caps).
Address housekeeping items such as debris removal from jobsites.
Secure materials that cannot be moved by placing them in interior
building locations or bind them.
Make sure that all roof drains are operational.

12
De-energize power at the circuit breakers as close to the main power
breaker as possible.
Shut down all gas lines and water lines that are not used for fire
protection.
Secure/protect fuel tanks and drums to prevent movement and
damage.
Remove or secure portable toilets.
Prepare flood cofferdams if it is the best option for damage
reduction.
Implement building code requirements governing hurricane and
high-wind preparations for cranes and hoisting equipment.
Remove portable equipment from jobsites, or store it in shipping
containers.
Backfill excavations if feasible.
Remove fence screening, signs, and banners.
Document with video and photographs jobsites and surrounding
properties (project condition and status prior to the storm).
After securing the construction site, instruct subcontractors and
employees to vacate the jobsite and return after the danger has
passed.

13
2.4. State Agencies Preparedness Recommendations
After hurricane Sandy devastating consequences, the New York City Department
of Buildings enforced preparedness regulations that contractors must complete as
part of their liability. These should include but not be limited to the following
constructions components (NYC DOB 2013):
(1) In general construction:
Construction materials and debris should not be stored closer than
10 feet to the perimeter of the building.
Masonry walls under construction or repair should be shored and
braced to prevent collapse under wind load.
Steel structural elements should be brace and/or shore as well as
secure with positive attachments (e.g., mails, bolts, welds). In the
case of planks, metal decks, wood floor, and roofing; uplift should be
prevented by weighing down the elements with sand bags or brick
pallets.
Unfinished building enclosures installation should be stopped in
advance of wind events.
Concrete construction that includes formwork should be removed if
it is not weighted down by concrete, other concrete works should
have nailed or bolted connections.

14
(2) Temporary installations:
Must be designed for wind conditions where not engineered
structures should be removed.
Perimeter netting or guardrails shall be cleaned of debris, inspected
and properly secured.
(3) Other construction components:
Scaffolds, construction fences and barriers, and material and personnel
hoisting equipment should be properly secured or follow the
manufacturer standards to operate under wind conditions.
2.5. Construction Companies Preparedness Recommendations
Construction companies working in hurricane prone areas have the obligation of
including the HPP as part of the construction projects. This plan is based on the
recommendations of insurance companies and state agencies regulations.
Additionally, companies must adjust the hurricane programs to each project
complexity and geographical location. The following information was obtained from
the hurricane programs provided by six different construction companies. The
documents were reviewed and classified into thirteen elements, where main
actions are identified as part of the logistics to secure construction sites:
1) Weather conditions – On a daily basis construction companies monitor the
winds by the use of technologies such as weather applications or weather
websites. Also, under high wind conditions, a common practice it to stop
heavy equipment operations (i.e., cranes). Weather conditions are

15
uncertain and influence contractor´s final decision on whether applying or
not costly preventive measurements.
2) Equipment – Vulnerable equipment under high wind conditions in
construction sites include: cranes, yarders, hoists, scaffolding systems,
hanging scaffolds, generators, dewatering pumps, outriggers. Securing
actions consist of sandbags to weight down the equipment or to construct
berms in low-lying areas of the site to relocate the equipment. In addition,
the manufacturer´s operation manuals are used to prepare the equipment
for heavy wind conditions.
3) Temporary structures and controls – The following elements must be
properly attached, nailed down, or reinforced to withstand heavy wind
conditions: fences, barriers/barricades, signage, sidewalk bridges,
perimeter netting, guardrails, gates, pedestrian walkway, sound blankets,
tarps, and hoist ways.
4) Loose building materials – These elements deserve special attention since
under high wind conditions they become airborne and cause serious
damages in construction sites and surrounding communities. Materials in
this classification include: piles of gravel, plywood, sheetrock, lumber,
formwork, and steel erection. Measures comprise proper storage and
monitoring material deliveries to be cancelled if programmed during the
hurricane warning.
5) Housekeeping/site cleaning – The following elements also become airborne
under high wind conditions: loose trash, debris, storm drains/catch basins,
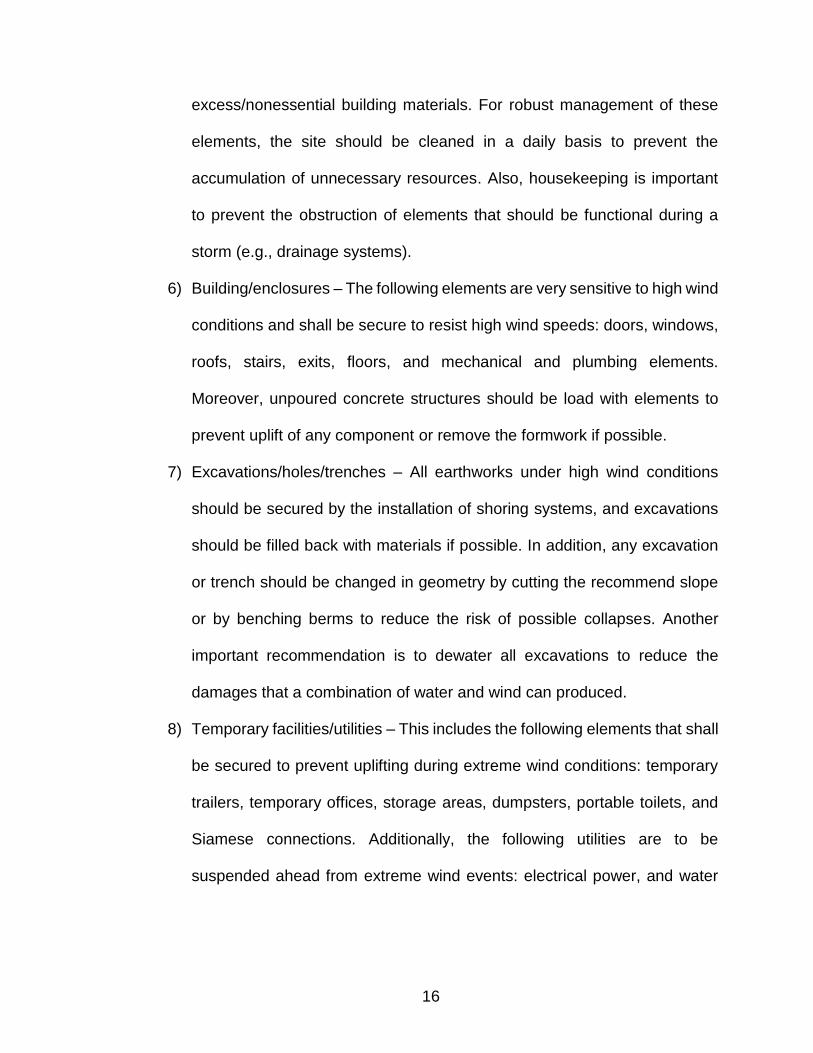
16
excess/nonessential building materials. For robust management of these
elements, the site should be cleaned in a daily basis to prevent the
accumulation of unnecessary resources. Also, housekeeping is important
to prevent the obstruction of elements that should be functional during a
storm (e.g., drainage systems).
6) Building/enclosures – The following elements are very sensitive to high wind
conditions and shall be secure to resist high wind speeds: doors, windows,
roofs, stairs, exits, floors, and mechanical and plumbing elements.
Moreover, unpoured concrete structures should be load with elements to
prevent uplift of any component or remove the formwork if possible.
7) Excavations/holes/trenches – All earthworks under high wind conditions
should be secured by the installation of shoring systems, and excavations
should be filled back with materials if possible. In addition, any excavation
or trench should be changed in geometry by cutting the recommend slope
or by benching berms to reduce the risk of possible collapses. Another
important recommendation is to dewater all excavations to reduce the
damages that a combination of water and wind can produced.
8) Temporary facilities/utilities – This includes the following elements that shall
be secured to prevent uplifting during extreme wind conditions: temporary
trailers, temporary offices, storage areas, dumpsters, portable toilets, and
Siamese connections. Additionally, the following utilities are to be
suspended ahead from extreme wind events: electrical power, and water
17
service. Power feeders and power panels are also elements that should be
properly attached.
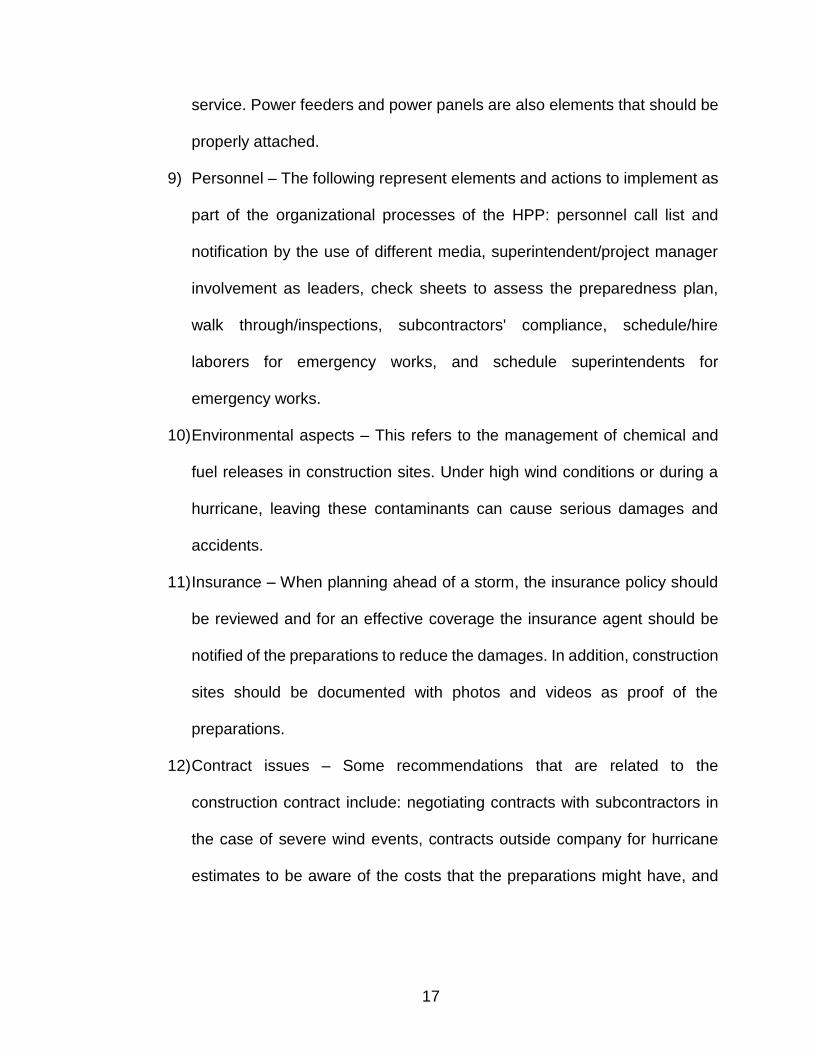
9) Personnel – The following represent elements and actions to implement as
part of the organizational processes of the HPP: personnel call list and
notification by the use of different media, superintendent/project manager
involvement as leaders, check sheets to assess the preparedness plan,
walk through/inspections, subcontractors' compliance, schedule/hire
laborers for emergency works, and schedule superintendents for
emergency works.
10) Environmental aspects – This refers to the management of chemical and
fuel releases in construction sites. Under high wind conditions or during a
hurricane, leaving these contaminants can cause serious damages and
accidents.
11) Insurance – When planning ahead of a storm, the insurance policy should
be reviewed and for an effective coverage the insurance agent should be
notified of the preparations to reduce the damages. In addition, construction
sites should be documented with photos and videos as proof of the
preparations.
12) Contract issues – Some recommendations that are related to the
construction contract include: negotiating contracts with subcontractors in
the case of severe wind events, contracts outside company for hurricane
estimates to be aware of the costs that the preparations might have, and
18
notify the owner about the delay due to preparations and clean-up of
construction sites.
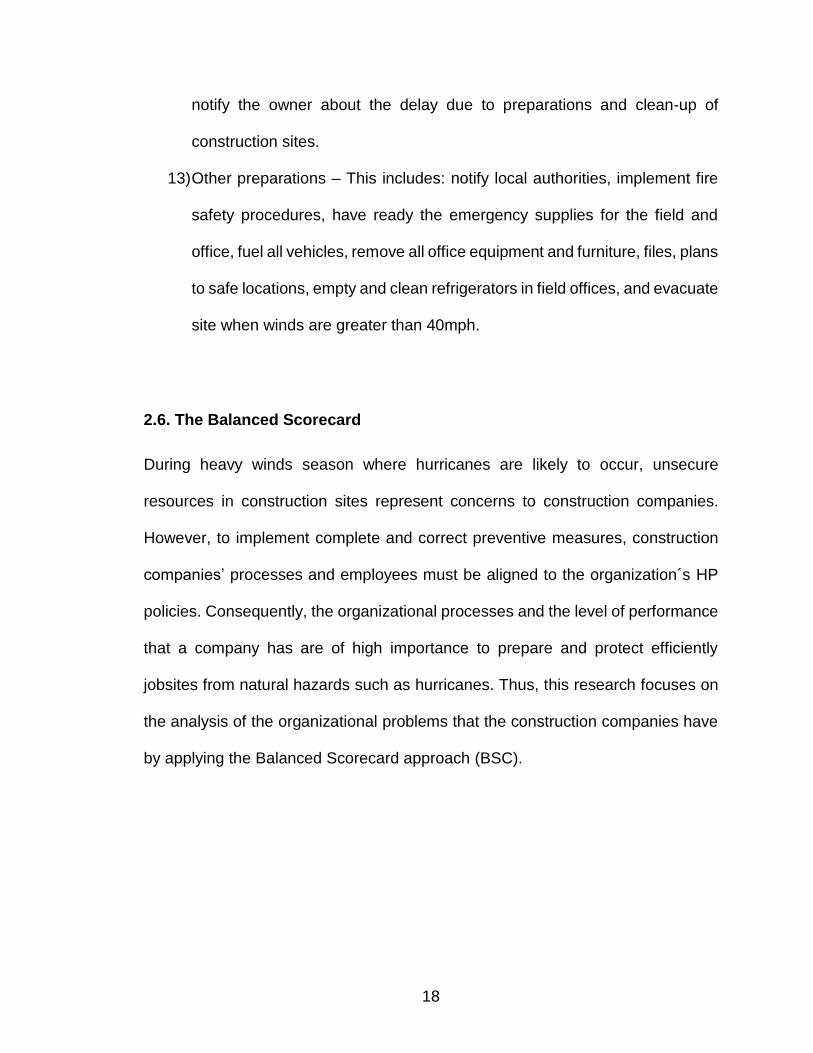
13) Other preparations – This includes: notify local authorities, implement fire
safety procedures, have ready the emergency supplies for the field and
office, fuel all vehicles, remove all office equipment and furniture, files, plans
to safe locations, empty and clean refrigerators in field offices, and evacuate
site when winds are greater than 40mph.
2.6. The Balanced Scorecard
During heavy winds season where hurricanes are likely to occur, unsecure
resources in construction sites represent concerns to construction companies.
However, to implement complete and correct preventive measures, construction
companies’ processes and employees must be aligned to the organization´s HP
policies. Consequently, the organizational processes and the level of performance
that a company has are of high importance to prepare and protect efficiently
jobsites from natural hazards such as hurricanes. Thus, this research focuses on
the analysis of the organizational problems that the construction companies have
by applying the Balanced Scorecard approach (BSC).

19
2.6.1. BSC Concept and Perspectives
The Balanced Scorecard (BSC) was first introduced by Kaplan and Norton (1992),
this performance measurement approach has two different applications. Initially
the method was developed to check the performance status of a business
organization, and further managerial requests made the tool applications to evolve
for project management (Stewart 2001). Through the application of the BSC,
project managers can identify problem areas in projects or programs of natural
disaster management that require improvement, and as a result an effective and
efficient implementation of the plan is possible (Tun Lin et al 2007). In the case of
this research, the BSC is used to analyze the issues on the HPP that construction
companies have regarding robust plan implementation.
The BSC framework increases awareness among managers and utilizes
measures that are adopted to improve the performance. The basic principle is to
relate these measurements to the strategies that are proposed to improve the
processes. Moreover, a common practice that executives have is to use short-term
financial indicators (e.g., return-on-investment, operating income) to measure the
performance of strategies and processes. However, the aim is to introduce
different indicators (i.e., measures) relevant to the new initiatives (i.e., objectives)
that the organization should activate for improving performance (Kaplan and
Norton 2000). Hence, the measures on the BSC are used in the business
organization to articulate and communicate the strategy, and to achieve common
goals by aligning individual, organizational, and cross-departmental initiatives
20
(Kaplan and Norton 1996). Subsequently, the scorecard analyzes four different
perspectives: (1) the management perspective, (2) the customer perspective, (3)
the internal business perspective, and (4) the learning and growth perspective. For
each perspective, strategies and objectives are established and then measures
are selected. Traditional financial measures are complemented with the strategic
measures of performance selected for the remaining of the BSC perspectives
(Kaplan and Norton 1996).
To asses HP, this research contemplates the information written in the hurricane
programs provided by construction companies. Also, this study includes for the
analysis other factors that are presented further and that represent issues that
should be reduced or eliminated for a robust hurricane program implementation.
Therefore, to evaluate the preparedness, this material in conjunction with the four
perspectives of the BSC are applied.
According to Kaplan and Norton (1996) the BSC perspectives contemplate:
(1) The Management Perspective (Financial Perspective) – The objectives and
measures selected in this perspective serve as the focus in all other
perspectives. This means that a cause-and-effect relationship exists
between all the measures selected for the system, which intends to improve
the financial performance of the organization.
Management commitment and involvement is the most important factor for
achieving satisfactory performance (Mohamed 2003). Consequently, the
21
enhancement of organizational culture is dependent upon the deliberate
manipulation of various organizational characteristics and activities that
impact management practices. In addition, for this perspective the following
question should be answered to assist the establishment of performance
measures in the particular case of disaster preparedness: What must
management excel at to achieve “zero” damage in property, accidents, and
production downtime?
(2) The Customer Perspective – This perspective influences the outcomes of
the management perspective strategic objectives and metrics. Also,
companies should achieve that their service delivery is of great value to all
customers. For instance, by incorporating on their planning all the
preventive procedures to secure a construction project from natural
disasters such as hurricanes. Additionally, managers should translate the
strategic statements into customer-based objectives, and at the same time
these should be communicated throughout the organization.
The BSC includes in this perspective two groups of customers: the client
and the employees. Clients, are customers that have special preferences
and value the attribute of the service differently. Employees, in the case of
the construction industry, include the employees of the organization and
project partners such as subcontractors.
22
This perspective, in the particular case of disaster preparedness, reflects
the following question: Compared to competing companies, how do
customers see the company in the context of being prepared? (Mohamed
2003). Furthermore, the measurement group used for this perspective may
include metrics which relate to customer retention and customer
satisfaction. Where, customers´ preferences are not always related to
safety, hence, the key is to develop a strategy that convinces them of the
importance of preparedness in the overall performance of projects (Kaplan
and Norton 1996).
(3) Internal Process Perspective (Operational) – This perspective strongly
relates to the strategy implementation. The principal objective of this
perspective is to strengthen the program through addressing operational
activities such as maintaining the working environment into a safe
workplace, improving working relationships, and being proactive in
detecting any omissions. Nonetheless, the fact that these activities may not
be measurable in all cases still affects the achievement of the management
perspective objectives. The following question explains the purpose of the
internal perspective: What must the company do to ensure the efficient
implementation of preparedness procedures? (Mohamed 2003).
The traditional performance measurement system of this perspective
focuses on controlling and improving existing responsibilities. Also,
concentrates on creating value and contributing to the company´s growth

23
through all the organizational process. Each organization has a unique set
of processes for creating value to customers and producing management
results.
(4) Learning and Growth Perspective – This perspective states that to achieve
positive outcomes, the organization´s measuring process should be
dynamic. Factors such as the market, climate, technology, clients, and
employees regularly lead to changes in the type of information use to
evaluate performance. Hence, this perspective explains the following: How
the company will continue to learn and improve? The focus of this
perspective is on the future as opposed to the current practices. This
perspective adds the dynamic part to the BSC framework, which is to
periodically measure the strategies through each of the four perspectives of
the Balanced Scorecard. In the particular case of HP, the human resource
is recognized as the most important driver to learn and improve the
organizational processes. Therefore, measures evaluate the human
resource of the company, where the investment is on personnel´s skills and
capabilities. Moreover, the goal is also to enhance organizational
procedures by motivating and empowering the workforce (Mohamed 2003).
This perspective establishes objectives and measures to drive
organizational learning and growth. Moreover, the objectives selected in the
other perspectives of the BSC identify what aspects the company must

24
excel to achieve the ideal performance. Nevertheless, one problem is that
usually management is evaluated through short-term financial performance,
and this prevents managers to invest on people´s capabilities, systems, and
organizational processes for a long term. The critical enablers of the
learning and growth perspective are employee: capabilities, motivation,
empowerment, and alignment.
2.7. The BSC in the Construction Industry – Previous Works
2.7.1. Scorecard Approach to Benchmarking Organizational Safety Culture
in Construction
This work promotes the adoption of a BSC tool to assess organizational safety
culture in construction and the basis of the BSC is the company´s safety policy. In
addition, this work states that construction companies agree that controlling the
physical aspects and technical hazards are not the only method to reduce
accidents (Mohamed 2003). Also, companies lack the insight to establish effective
performance measures to achieve a comprehensive management system. To
achieve an acceptable safety performance, a robust management system that
incorporates metrics to monitor the performance is essential. The purpose of the
BSC is to integrate all interests of key stakeholders (i.e., owners, customers,
employees) through the four perspectives and asses and measure the safety
culture of the organization. The tool is used to give a holistic and value-based
report as opposed to only accident statistics of construction sites.

25
To support the potential value of the BSC a survey is conducted. This included the
participation of project managers whom stated that tangible and intangible benefits
are gained by the implementation of the tool. The survey findings demonstrated
that industry interests are in the internal process and learning and growth
perspectives. This work concludes that the BSC from a practical standpoint is a
proven management framework, also, the participation of the industry members
was key to identify the best measurements of the strategic objectives selected
under the four perspectives (Mohamed 2003).
2.8. Limitations of Previous Works and Gaps-in-Knowledge
The HP information collected from state agencies and companies concentrates on
recommendations to secure the construction site during the different phases
before a hurricane. Furthermore, the current practice of monitoring and control the
preventive activities is conducted by observations and filling check-sheets. Thus,
the use of an organizational approach which measures performance by the use of
indicators is nonexistent.
Additionally, previous works that have applied the balanced scorecard approach
to analyze safety, management, or disaster preparedness problems; do not
emphasize the cause-effect relationships between the goals and performance
measures comprised per perspective of the BSC. Similarly, more detail should be
added on how the scorecard components were determined and understand what
objectives influence more the performance of safety culture in an organization.
26
Likewise, lagging indicators to measure performance are mainly use, and leading
indicators should be highlighted as performance enablers for the long term of the
organization.
This research, proposes a framework to increase awareness of the high
importance of the resources in a construction site, and the eminent risk that this
property has when is exposed to extreme wind conditions. To support the gaps-in-
knowledge regarding the limited consideration of hurricanes impacts to
construction sites, this work intends to assess the contractor´s current practices
which also are not considered in previous works. Also, this research takes into
account the issues that construction companies have and how this can influence
or impact the organizations overall performance during the preparations before a
storm. Thus, the focus is on the organizational processes that lead to hurricane-
preparedness-scorecard goals achievement. Consequently, to measure these
factors several strategic measurements are proposed under each perspective of
the BSC, this is presented further in chapter three.

27
3. METHODOLOGY
In the prior section, previous works on HP and performance management tools
were rigorously reviewed. Building on such information, in this section, intensive
interview-surveys are conducted with key project personnel from different
construction companies. This to understand current operational protocols, best
practices, and issues on HP that currently the industry has. Then, the insights from
the domain expert evaluations are applied for the Micro and Macro Environmental
Analysis of the problems. Both analysis allow to create the HP SWOT matrix (i.e.,
strengths, weaknesses, opportunities, and threats) which finally delivers the
strategies for the HPP assessment that are implicit in the BSC.
For further analysis, a BSC is used to recommend objectives and metrics to
improve the performance of the HPP of construction companies. This is achieved
in terms of the following perspectives: (1) the Internal Process Perspective, (2) the
Learning & Growth Perspective, (3) the Customer Perspective, and (4) the
Financial Perspective.
The BSC framework which is the outcome of this research mainly focuses on
issues related to human behaviors, these are understood to be extremely
influential in the organization performance. In this study, employees (e.g., workers,
operators) and project partners (i.e., subcontractors) play an important role in the
execution of the HPP best practices. The BSC goals and measurements for HP
are further depicted in this chapter. Figure 2 depicts the overview of this research:

28
Figure #2: Methodology overview
3.1. Data Collection
Multiple constructions companies were invited to participate in this research and
intensive survey-interviews were conducted to understand the current practices
and challenges that the industry currently has.
3.1.1. Construction Companies Survey-Interview
The literature review helped to understand the problems and identify the main
criteria established on the state of practice for securing construction sites. Building
upon the criteria identified from the literature review and the current HPP, one
structured interview form was created for industry professionals. The four
perspectives of the balanced scorecard were also integrated when formulating the
interview questions. The title of the eight interviewees is Senior Vice President of
Project Management & Construction (one), Safety Vice-President (one), Safety
Literature Review Survey (interview)
Data collectionMacro and Micro
Environmental Analysis, SWOT matrix
Balanced Scorecard

29
Director (two), Project Executive (one), Senior Safety Manager (one), Safety
Manager (one), and Superintendent (one). Two of the interviewees work at New
York and Ohio respectively and the remaining work at Miami. The interview
included two sections and the questions were:
Section I:
What is your general experience regarding severe wind conditions in a
construction site?
In your opinion, what are the important components to consider for
hurricane preparedness in the construction site, and what are the best
practices that the company has towards these important components?
How do you measure these best practices and components in the
construction site?
What are the challenges and limitations on implementing these best
practices?
Regarding hurricane preparedness and the best practices, what do you
think about government regulations and their effect to the construction site?
What new approach do you think is needed on site for hurricane
preparedness?
Section II:
Regarding the construction schedule, can you mention activities classified
as weather sensitive in the construction site?
30
If experienced a severe wind condition, approximately, what percentage did
the damages represent in the total cost of a construction project?
Can you approximately mention what percentage of the total construction
cost of a project, does the implementation cost represent?
What do project owners think about the action plan implementation during
a project?
3.2. Survey general views
The objective of this section is to gather general views of the industry
professionals. The interviewees’ responses helped to identify different views and
recognize the following observations for HP:
3.2.1. Current practices, challenges, and limitations
All the respondents agreed that weather monitoring is an important practice that is
conducted in a daily basis by the use of mobile applications or national weather
forecast webpages. Also, only half of the interviewees stated that internal training
of employees is imparted in their construction sites. Additionally, 75% of the
respondents mentioned that in Miami the hiring of unexperienced operators and
workers is a common practice. This due to the high demand of construction
projects, and in relation to this, 75% of the respondents stated that organizational
culture is a major issue that hinders robust preparedness plan implementation.
31
Based on the responses mostly workers and operators come from underdeveloped
countries and a strong barrier exists to implement such preparedness plans.
Furthermore, 75% of the respondents also mentioned that pre-negotiated rates of
contracts are not an important factor since in practice this is always included in the
contract document. Moreover, only 37.5% of the participants mentioned that the
HPP is always included as part of any ownership contract. Furthermore, 37.5% of
the respondents mentioned insurance companies’ participation as key for the
training process of employees. In contrast 12.5% of the respondents mentioned
that is “always the contractors’ responsibility” and that insurance companies inform
of implementation practices to avoid covering high cost if damages occur. This
last view could possibly be the reason why certain construction companies do not
set efforts on training the personnel for HP. Then, a high level of preparedness
culture is difficult to achieve without the insurance agencies support.
In regard to construction components (e.g., materials and equipment) or
uninstalled elements, 62.5% of the respondents think that roofs deserve special
attention. In addition, a current practice is to apply “effective weights” over the
sensitive uninstalled surfaces to counteract any uplift. Likewise, another key
concern is the highest level of a building under construction where the priority is to
secure the structural elements, 87.5% of the participants highlighted this.
Furthermore, 62.5% of the participants mentioned plywood is an important
component that should be secured in construction sites. Regarding construction
equipment, the majority of the respondents mentioned that tower cranes are the
most dangerous under extreme wind conditions, other participants mentioned
32
scaffolds and hoists. In relation to construction elements, plywood sheets deserve
special consideration since they easily become airborne and might impact the
construction project and surroundings. The nonexistence of proper storage of
construction components led the respondents to agree in a 75% that housekeeping
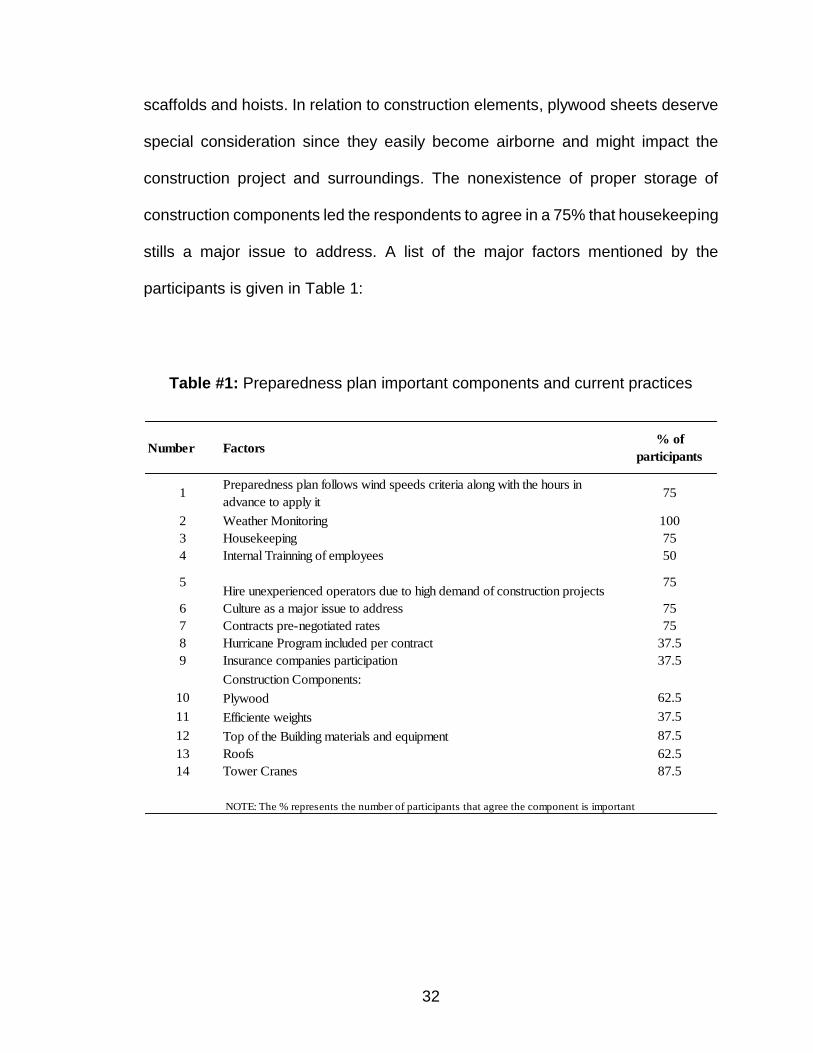
stills a major issue to address. A list of the major factors mentioned by the
participants is given in Table 1:
Table #1: Preparedness plan important components and current practices
Number Factors % of
participants
1Preparedness plan follows wind speeds criteria along with the hours in
advance to apply it75
2 Weather Monitoring 100
3 Housekeeping 75
4 Internal Trainning of employees 50
5Hire unexperienced operators due to high demand of construction projects
75
6 Culture as a major issue to address 75
7 Contracts pre-negotiated rates 75
8 Hurricane Program included per contract 37.5
9 Insurance companies participation 37.5
Construction Components:
10 Plywood 62.5
11 Efficiente weights 37.5
12 Top of the Building materials and equipment 87.5
13 Roofs 62.5
14 Tower Cranes 87.5
NOTE: The % represents the number of participants that agree the component is important
33
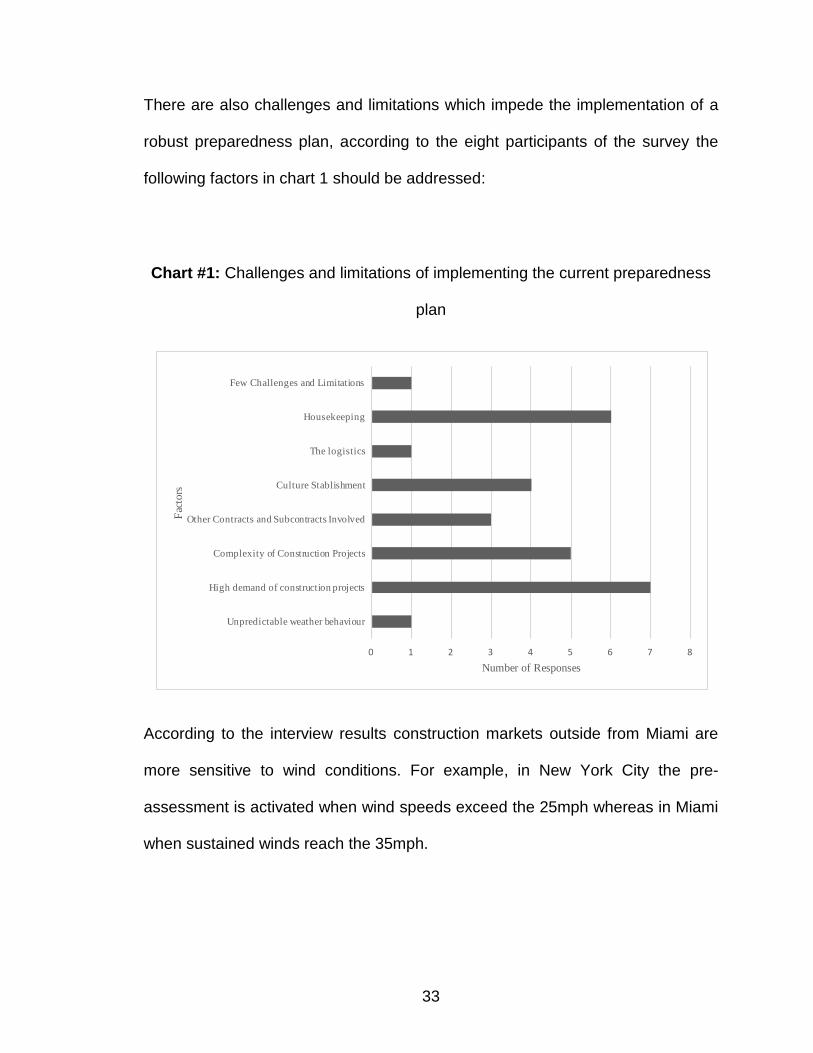
There are also challenges and limitations which impede the implementation of a
robust preparedness plan, according to the eight participants of the survey the
following factors in chart 1 should be addressed:
Chart #1: Challenges and limitations of implementing the current preparedness
plan
0 1 2 3 4 5 6 7 8
Unpredictable weather behaviour
High demand of construction projects
Complexity of Construction Projects
Other Contracts and Subcontracts Involved
Culture Stablishment
The logistics
Housekeeping
Few Challenges and Limitations
Number of Responses
Fac
tors
According to the interview results construction markets outside from Miami are
more sensitive to wind conditions. For example, in New York City the pre-
assessment is activated when wind speeds exceed the 25mph whereas in Miami
when sustained winds reach the 35mph.
34
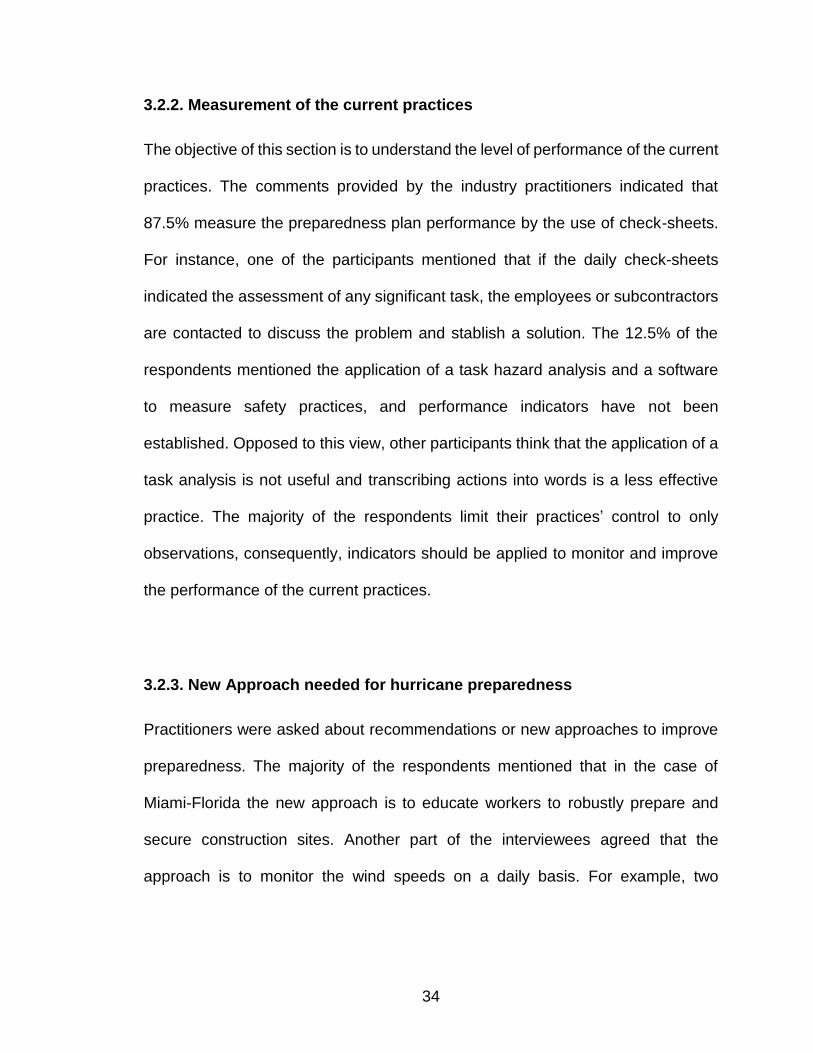
3.2.2. Measurement of the current practices
The objective of this section is to understand the level of performance of the current
practices. The comments provided by the industry practitioners indicated that
87.5% measure the preparedness plan performance by the use of check-sheets.
For instance, one of the participants mentioned that if the daily check-sheets
indicated the assessment of any significant task, the employees or subcontractors
are contacted to discuss the problem and stablish a solution. The 12.5% of the
respondents mentioned the application of a task hazard analysis and a software
to measure safety practices, and performance indicators have not been
established. Opposed to this view, other participants think that the application of a
task analysis is not useful and transcribing actions into words is a less effective
practice. The majority of the respondents limit their practices’ control to only
observations, consequently, indicators should be applied to monitor and improve
the performance of the current practices.
3.2.3. New Approach needed for hurricane preparedness
Practitioners were asked about recommendations or new approaches to improve
preparedness. The majority of the respondents mentioned that in the case of
Miami-Florida the new approach is to educate workers to robustly prepare and
secure construction sites. Another part of the interviewees agreed that the
approach is to monitor the wind speeds on a daily basis. For example, two
35
interviewees emphasized the importance of having “one ear and eye to the
weather”.
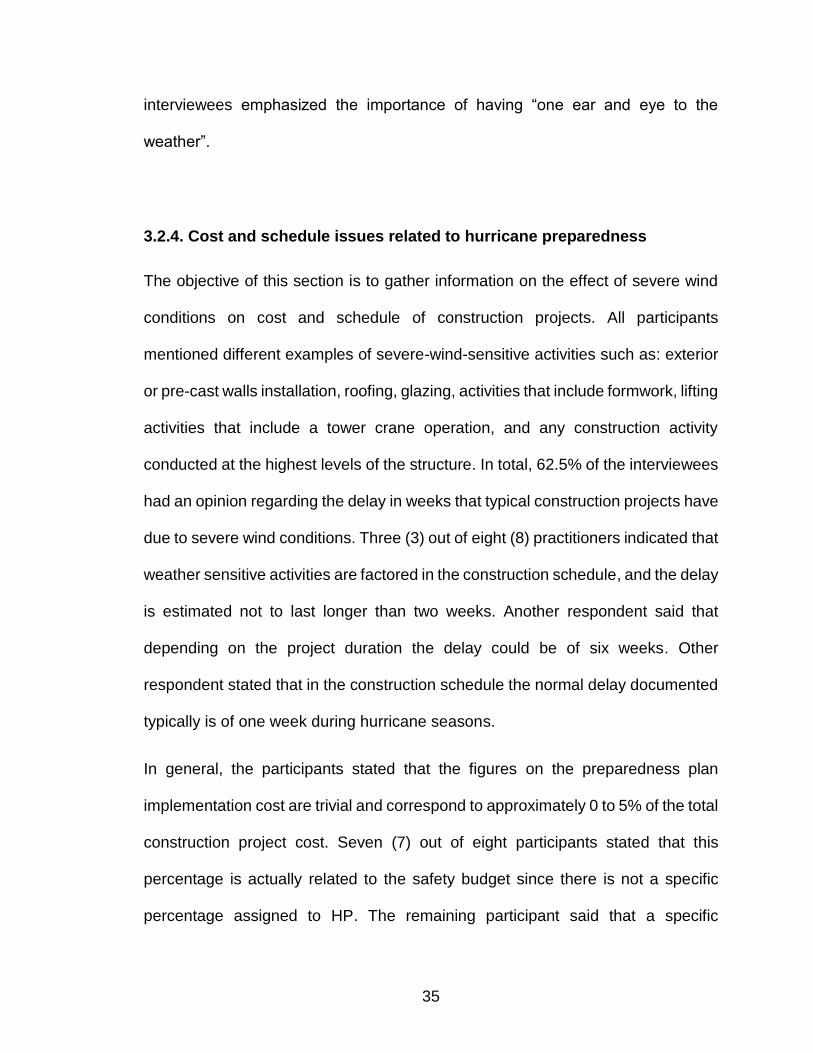
3.2.4. Cost and schedule issues related to hurricane preparedness
The objective of this section is to gather information on the effect of severe wind
conditions on cost and schedule of construction projects. All participants
mentioned different examples of severe-wind-sensitive activities such as: exterior
or pre-cast walls installation, roofing, glazing, activities that include formwork, lifting
activities that include a tower crane operation, and any construction activity
conducted at the highest levels of the structure. In total, 62.5% of the interviewees
had an opinion regarding the delay in weeks that typical construction projects have
due to severe wind conditions. Three (3) out of eight (8) practitioners indicated that
weather sensitive activities are factored in the construction schedule, and the delay
is estimated not to last longer than two weeks. Another respondent said that
depending on the project duration the delay could be of six weeks. Other
respondent stated that in the construction schedule the normal delay documented
typically is of one week during hurricane seasons.
In general, the participants stated that the figures on the preparedness plan
implementation cost are trivial and correspond to approximately 0 to 5% of the total
construction project cost. Seven (7) out of eight participants stated that this
percentage is actually related to the safety budget since there is not a specific
percentage assigned to HP. The remaining participant said that a specific
36
implementation percentage could be around 0.001% of the total construction
project cost.
The interviewees were also asked if they could give a percentage number of the
damages cost in construction projects due to severe wind conditions. This figure
was stated also to be very small as 3 to 5% of the total construction cost. Where,
only one of the participants said that when hurricane Andrew impacted Florida, the
complete jobsite under construction was destroyed.
Furthermore, the participants were asked as part of this section about the clients’
standpoint regarding HP and the possible project delays. One (1) of the
respondents mentioned that clients’ attitude depends on the type of market they
come from. For example, clients can come from an environment where safety is
set as a priority over cost-schedule. The remaining of the interviewees said that
other clients have four major components: budget, schedule, quality of work, and
safety. Where, the first option is not to invest in disaster preparedness and
understand the consequences for not complying with the procedures during
extreme wind conditions.
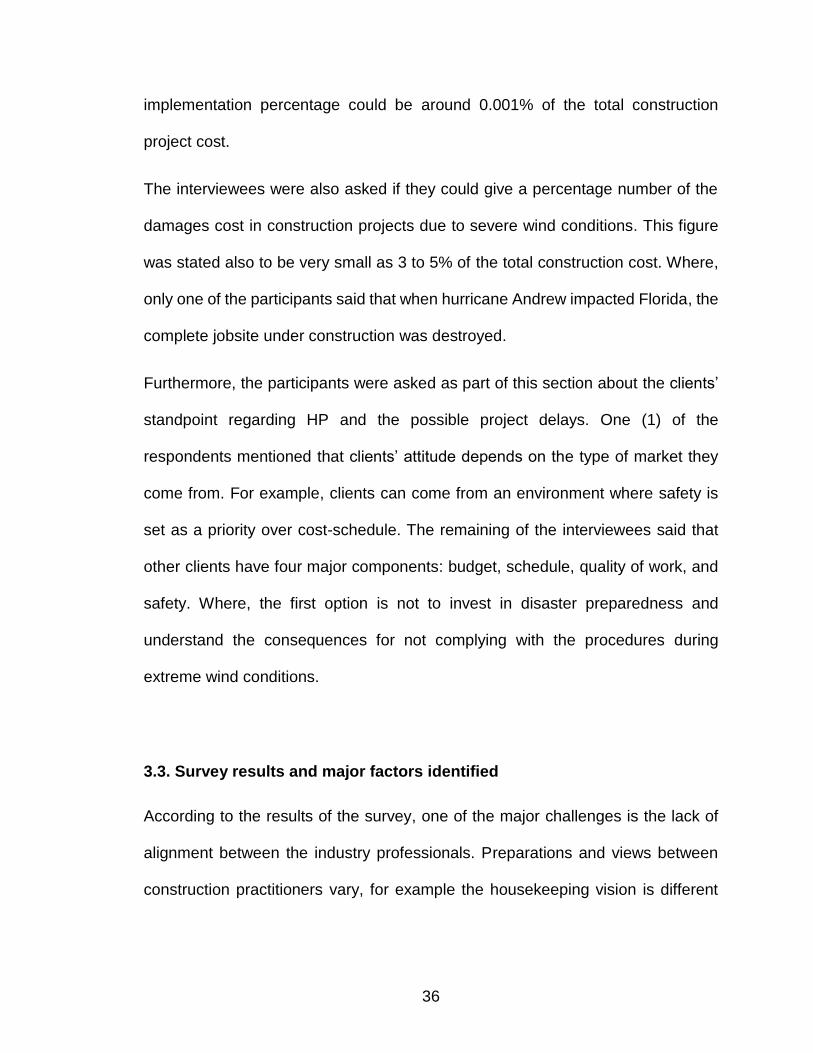
3.3. Survey results and major factors identified
According to the results of the survey, one of the major challenges is the lack of
alignment between the industry professionals. Preparations and views between
construction practitioners vary, for example the housekeeping vision is different

37
from a superintendent to a safety manager. This is revealed at the end of a work
day where unsecured resources of the jobsite are left without appropriate storage.
The following are photographs taken in a real construction site at the end of a work
day, these images belong to the SASC (Student Academic Success Center)
building project located at Florida International University Modesto-Maidique
Campus:
Photographs #1, 2, 3, 4, 5, 6: Unsecured construction resources such as
plywood, wooden and metallic debris; envelopes with unfinished walls and
openings.
The response time under extreme wind conditions varies among contractors and
subcontractors. Weather uncertainty and the fact that a hurricane has not strike

38
Miami area in years, influences subcontractors decisions. For example,
subcontractors are in general reluctant to secure the site in advance based on the
high cost that preventive measures represent. Related to this, one (1) of the
participants mentioned that one of the measures that subcontractors are not willing
to apply is to remove scaffolding systems.
Moreover, to establish preparedness culture there is the strong need to educate
construction professionals, and measure their current practices by the use of
performance indicators. Thus, monitor, control, and improve the performance of
the HPP.
Other major factor is the poor communication that exists from the contractors to
the clients. In some cases, clients are highly wind sensitive which means they
follow the regulations and standards related to HP. In other cases, clients have in
mind four major components: budget, schedule, quality of work, and safety. As the
majority of the respondents mentioned, it is difficult for them to find the initiative to
invest in disaster preparedness in spite of being aware of the consequences.
The results of the survey identified the current practices and the issues related to
HP. Construction resources such as materials and equipment are of great
concerns during heavy wind conditions, nonetheless to secure these is not a major
problem. The interviewees indicated that organizational errors are the most
common problem to apply efficient preventive measures in a construction site. In
this sense, the next section examines the issues by leveraging the macro
environmental analysis (external analysis) and the micro environmental analysis
39
(internal). Then, the factors obtained from both analyses are used to create the
strategies to construct a Balanced Scorecard that proposes strategic objectives
and measurements to monitor the most relevant actions for improving the
performance of the HPP.
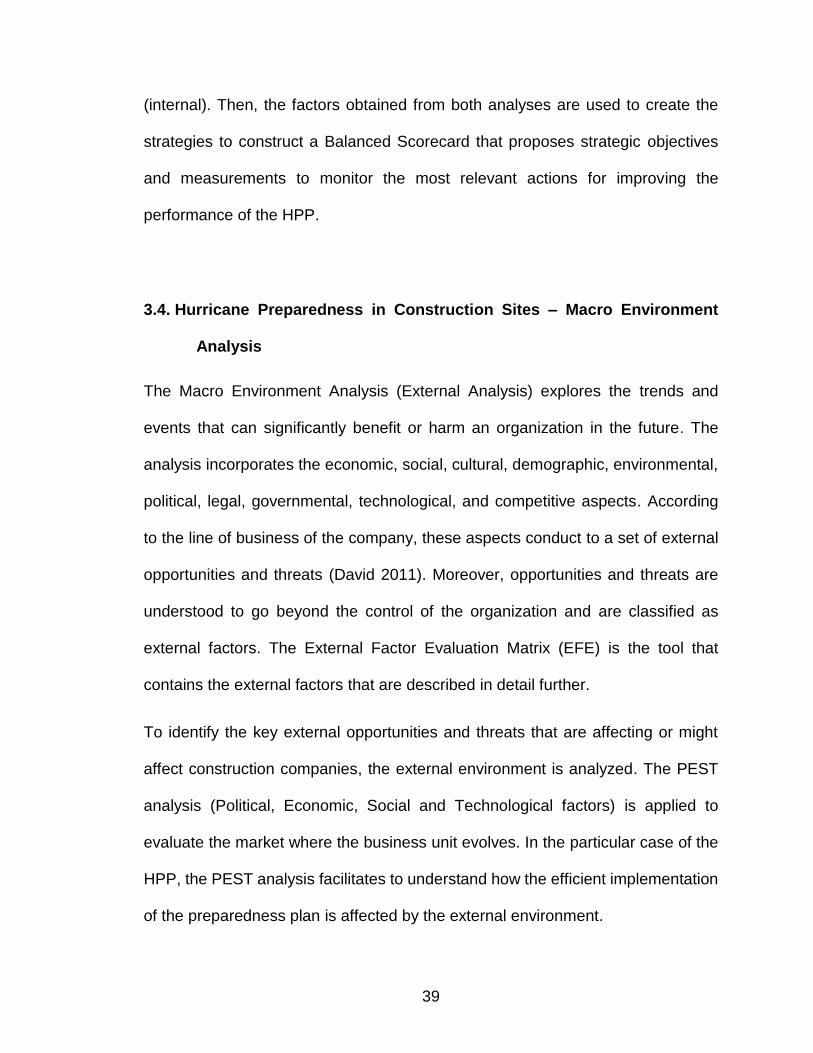
3.4. Hurricane Preparedness in Construction Sites – Macro Environment
Analysis
The Macro Environment Analysis (External Analysis) explores the trends and
events that can significantly benefit or harm an organization in the future. The
analysis incorporates the economic, social, cultural, demographic, environmental,
political, legal, governmental, technological, and competitive aspects. According
to the line of business of the company, these aspects conduct to a set of external
opportunities and threats (David 2011). Moreover, opportunities and threats are
understood to go beyond the control of the organization and are classified as
external factors. The External Factor Evaluation Matrix (EFE) is the tool that
contains the external factors that are described in detail further.
To identify the key external opportunities and threats that are affecting or might
affect construction companies, the external environment is analyzed. The PEST
analysis (Political, Economic, Social and Technological factors) is applied to
evaluate the market where the business unit evolves. In the particular case of the
HPP, the PEST analysis facilitates to understand how the efficient implementation
of the preparedness plan is affected by the external environment.
40
3.4.1. Political Factors
The political factors determine the extent to which the government (e.g. regulatory
bodies and processes, government policies) may influence and impact a certain
industry or company. In the case of construction companies’ HP, safety regulations
have been selected as the most influential political factor.
The Occupational Safety and Health Administration (OSHA) under the ‘29 CFR
1910.38 regulation’ specifies the requirements of an Emergency Action Plan. In
addition, OSHA as part of a mission assignment from the Federal Emergency
Management Agency (FEMA) created the Hurricane e-Matrix. This is a tool that
provides standards and regulations of specific construction tasks and operations.
These standards encompass general recommendations for hurricane preventive
actions that should be evaluated and adapted according to the hazards associated
with construction tasks. Construction companies might be impacted negatively for
violating an OSHA standard where according to the Field Operations Manual the
maximum penalty is around $7,000 for each violation and $70,000 for a repeated
or willful violation (OSHA FOM 2015).
Similarly, the Miami Dade Municipal Code chapter 8B-11 and 8B-18 related to HP
in construction sites describes the ordinances related to hoisting equipment and
loose construction materials. According to the ‘Chapter 8CC – Code Enforcement
section 8CC-10’, the civil penalty for failure to abide the procedures of the HPP is
$1,000 per day, which can ascend from $2,500 to $5,000 per day.

41
3.4.2. Economic Factors
These factors examine the outside economic issues that might affect the
construction industry. For HP, labor turnover, number of quits, skill workforce, and
seasonality/weather issues have been selected as the influential economic factors.
According to the Job Openings and Labor Turnover report, the total separations
rate (seasonally adjusted) in the construction industry is about 5.0%. This is one
of the highest turnover rates in comparison to the other industry sectors (Bureau
of Labor Statistics 2016). Additionally, the number of quits rate in the construction
sector is 2.4% which is a significant figure compared to the other industry sectors.
Construction companies are affected by these two factors that lead to significant
replacement cost of employees (i.e., applicants recruit, invest in training).
Furthermore, according to the survey conducted to 474 construction industry
executives in 48 states, more than 61 percent stated that is very challenging to find
qualified workers (Wells Fargo Construction Industry Forecast 2016). Ultimately,
this fact prevents the HPP implementation since industry-specific knowledge and
skills take time to master. Moreover, the turnover of qualified construction
personnel can result in loss of productivity and contributes to jobsite accidents
(Chih et al 2016).
In regard to seasonality or weather issues, the Atlantic hurricane season is most
likely to be near-normal and forecast uncertainty influences the difficult prediction
of the storms (NOAA 2016). In addition, a near-normal hurricane season prediction
suggests that there might be more hurricane activities in comparison to the last

42
three years. Moreover, the likelihood of having named storms with sustained winds
of 39 mph or higher is 70%, where a range of 10 to 16 storms are expected. Also,
a range of 4 to 8 hurricane systems of 74 mph can develop and evolved into 4
major hurricanes of categories 3, 4, or 5. Another important prediction is in relation
to La Niña occurrence, and as stated by NOAA’s Climate Prediction Center there
is a 70% chance that it evolves into more hurricane activities. However, model
predictions show levels of uncertainty related to the strength of La Niña reducing
the amount of impact it may cause. These factors influence weather systems
behavior, where uncertainty has an effect on hurricane preparedness-related
decision-makings. As a result, if the preventive measures are costly contractors
might not activate the plan in advance during hurricane season.
3.4.3. Social Factors
These factors analyze the demographic and cultural aspects of the sector where
construction companies develop. For HP, the following have been selected as the
most influential social factors: age distribution, attitudes toward work, job market
trends, and educational issues.
In relation to job market trends, employment in the construction industry has
increased by 3.2% and 2.6% in residential and non-residential building
construction respectively (U.S. Department of Labor 2016). However, the hiring of
new workers is not expected to increase largely during the following periods
because of the lack of suitable trained skilled personnel. For example, the job

43
openings and hires rate variation is very small for March 2015, February 2016, and
March 2016; respectively these rates are 2.7, 2.9, 3.0 (Bureau of Labor Statistics
2016). Additionally, due to the shortage of qualified workers, firms have reported
to increase payments and benefits to retain or recruit qualified staff.
Educational issues also play an important role. The report 2016 construction hiring
and business outlook states that firms are investing in training and development
programs for current and new workers. Where a 46 percent reports to have
increased their investments in training and development in 2016 compared to 2015
(AGC 2016). For HP, construction companies should invest in training efforts to
have experienced workers and implement an efficient HPP. However, the only
problem might be the employees’ commitment since their resignation leads to
negative effects and significant costs.
The remaining social factors, age distribution and attitudes toward works, are also
of high importance to the construction industry. The median age of workers in the
construction industry is 42 (American Community Survey 2013) and 40 percent of
construction workers are "baby boomers”, which predicts an exodus of
experienced workers from the industry in the next decade (Welch 2010). For HP,
this situation affects the plan performance since experienced construction workers
are retiring and younger people with a lack of expertise are entering the
organizations. Furthermore, the perception that workers have of the high risk
environment in construction sites influences their decision to shift to another
industry where they feel safer.

44
3.4.4. Technological Factors
These factors reflect how companies might be affected by the use of technology,
the technological expectations that users have, and the impact that technology
might have on their work. For HP is important to contemplate the technological
advancements and the government spending on technological research.
Both factors are directly related to weather forecasting which is critical for timely
HP. The National Oceanic and Atmospheric Administration (NOAA), the National
Weather Service (NWS), and the National Hurricane Center (NHC) thanks to
weather satellites can monitor temperatures inside a storm, cloud heights, rain,
and wind speeds. Also, data and products from a national information database
are used by other government agencies, the private sector, the public, and the
global community (NOAA NWS 2010). Moreover, construction companies with
such databases are able to monitor the winds behavior by the use of cellular
phones and weather applications.
After the factors are selected for the PEST Analysis, these are classified into
opportunities and threats. Table 2 represents this information:

45
Table 2: PEST Analysis Factors
3.4.5. The External Factor Evaluation (EFE) Matrix
After classifying the factors into opportunities and threats, first, a weight ranging
from 0 (not important) to 1 (very important) is assigned. This weight indicates the
relative importance of each factor for successful HPP implementations, and in
order to determine the values for each factor this research used the survey
responses. The survey outcomes significantly contributed to assign more
accurately the weight of each factor in the external matrix. Then, the rating is
Factor Effect Opportunity Threat
OSHA Standards and Muicipal Code regulations
improvement. More specific to construction hurricane season
scenario
x
Contractors work paralyzation due to standard violation x
Increment on penalties. More than $7,000 in the case of
OSHA and more than $5,000 in the case of Miami Dade
Municipality
x
High demand of Construction Projects (New construction
starts 2016 growth of 6%)x
Increase efforts on Hurricane Preparedness Plan to prevent
lossesx
Increase of more than 5% on Employee Turnover as reason
for loss on productivity and expertisex
Increase of more than 2.4% on the number of quits x
Increase on employees replacement cost (e.g., applicants
recruit and invest in training)x
70% likelihood of named storms ocurrence and La Niña
favoring hurricane activityx
Weather forecast uncertainty influences decision making
(among contractors and subcontractors)x
0.1% increase of new construction workers hires x
Increase on base pay rates, incentives, and benefits to retain
qualified workers or recruit themx
46% of the companies increase investing efforts on training
and development of programs for current and new workers x
Experienced workers resignation (age factor) x
Workers perception of the risks involved in the environment
where they workx
Government interest to spend on technological researchx
Government agencies available databases and infrastructure x
Wind speeds monitoring by the use of computer and internet
applications x
Political
Social
Economic
Technological

46
assigned to each factor which indicates how effective construction companies’
current practices and strategies are to respond to each factor, as in the case of the
weight of importance the survey responses were also used to stablish the rating
values. The rating used is between 1 and 4, where 4 = the response is superior, 3
= the response is above average, 2 = the response is average, and 1 = the
response is poor. Finally, each factor’s weight is multiplied by the rating to obtain
the weighted score. The highest possible weighted score for a company is 4.0 and
the lowest possible is 1.0.
In total sixteen factors among opportunities and threats are selected. Table 3
depicts the External Factor Evaluation (EFE) Matrix, and the following is the
explanation of the weight and ratings assigned for each factor:
Opportunity Factors – Factor 2, high demand of construction projects has the
highest weight of importance of 0.09. Currently, this situation obligates contractors
to hire many construction workers regardless of their background, and this is why
the given rating is 2. Factor 3, increase efforts on training and development of
programs for workers has also the highest weight of importance of 0.09 since it is
critical to invest efforts for robust HP implementation. The rating assigned is 2,
according to the survey only 50 percent of the participants have this as a practice.
Factor 6, wind speeds monitoring has an above average weight of 0.06. This is an
important and established practice for HP, has no negative effect and construction
companies perform this task on a daily basis. Therefore, the rating assigned is the
highest score of 4. The remaining factors relate to government available resources

47
which do not represent an issue for the construction industry, this is why the
importance weights assigned are lower than the average. Nevertheless, factor 1
has a rating of 2 since although construction companies are following HP
guidelines there are still opportunities for enhancement. Factor 4 has the lowest
rating value since the construction companies despite of the government efforts
on research are not interested on applying research to improve HP. Finally, factor
5 has the highest rating since the industry professional utilize all the available
government data to monitor hurricanes.
Threat Factors – Factor 9, employee turnover has the highest weight of importance
of 0.09. Currently, this represents loss on productivity and expertise. The rating is
1 due to the significant issue that construction companies have on retaining
experienced construction workers. Factor 11, increase on employee’s replacement
cost and base pay and benefits has also the highest weight of importance of 0.09.
The rating of this factor is 3 since the companies implement this practice to avoid
project delays. Factor 13, weather forecast uncertainty influences decision making
follows has a weight of importance of 0.08. This relates to the past storms that did
not impact the project areas. The rating is 2 since in certain cases subcontractors
are not willing to collaborate due to the high cost for implementing measures (e.g.,
scaffolds systems removal). Factor 14, increase of new construction workers hires
has 0.07 weight of importance and the rating is 2 since to hire qualified workers is
a challenge. Factor 10, increase on number of quits has above average weight of
importance of 0.06. The rating is 2 since despite of the construction companies’
efforts an employee resigning is an unpredictable and inevitable situation. Factor

48
15 and 16, experienced workers’ resignation and workers’ perception of the work
environment risks have an above average weight of importance of 0.06. The rating
in the two cases is 2 since some organizations lack efficient efforts to replace old
workers and educate the employees regarding the work environment.
The total weighted score of all factors is 2.31, which is below average. This
indicates that the construction companies should invest more efforts for an efficient
HPP implementation.
Table 3: The External Factor Evaluation (EFE) Matrix
Key External Factors Weight RatingWeighted
Score
label Opportunities
1 OSHA Standards and Municipal Code regulations regarding
hurricane season 0.03 2 0.06
2 High demand of Construction Projects 0.09 2 0.18
3
Increase efforts on Hurricane Preparedness. 46% of the
companies will invest efforts on training and development of
programs for current and new workers 0.09 2 0.18
4 Government interest to spend on technological research 0.04 1 0.04
5Government agencies available databases and
infrastructure 0.05 4 0.2
6Wind speeds monitoring by the use of computer and
internet applications 0.06 4 0.24
Threats
7Contractors work paralyzation due to standard violation 0.04 3 0.12
8
Increment on penalties. More than $7,000 in the case of
OSHA and more than $5,000 in the case of Miami Dade
Municipality 0.04 3 0.12
9Increase of more than 5% on Employee Turnover (loss on
productivity and expertise) 0.09 1 0.09
10 Increase of more than 2.4% on the Number of quits 0.06 2 0.12
11
Increase on employees replacement cost and base pay
rates, incentives, and benefits to retain qualified workers or
recruit them (e.g., applicants recruit, training) 0.09 3 0.27
1270% of likelihood of named storms ocurrence and La Niña
favoring hurricane activity 0.05 3 0.15
13Weather forecast uncertainty (past events) influences
decision making (among contractors and subcontractors) 0.08 2 0.16
14 0.1% increase of new construction workers hires 0.07 2 0.14
15 Experienced workers resignation (age factor) 0.06 2 0.12
16Workers perception of the risks involved in the environment
where they work 0.06 2 0.12
Total 1.00 2.31

49
3.5. Hurricane Preparedness in Construction Sites - Micro Environment
Analysis
The Micro Environment Analysis (Internal Analysis) refers to the internal factors or
capabilities impacting a company (David 2011). These factors include the
strengths and weaknesses (e.g., problems, constraints, uncertainties, and
disadvantages) in reaching the organization’s target. The strengths relate to the
core competencies that the company should have for achieving goals. The
weaknesses relate to the limitations that the company encounters on implementing
a strategy to achieve the goals. In strategic management, the internal analysis
benefits managers and employees to efficiently perform their activities and
understand how these affects other areas of the company. The Internal Factor
Evaluation Matrix (IFE) encapsulates major strengths and weaknesses in the
functional area of the business. The challenge of this part of the methodology is
that the information collection involves experienced personnel representing
various organizational interests and points of view.
3.5.1. Strengths and Weaknesses Factors
In the particular case of the HPP of construction companies, the results from the
survey and the contractors’ HPP allowed to list the factors and classify them into
strengths and weaknesses. Table 4 summarizes these factors:

50
Table #4: Internal Analysis Factors
3.5.2. The Internal Factor Evaluation (IFE) Matrix
The factors included in the internal analysis are prone to affect the construction
companies’ performance. After classifying the factors into strengths and
weaknesses, first, the weight ranging from 0 (not important) to 1 (very important)
is assigned. To assign the importance values for each weakness and strength
label STRENGHTS
1 Hurricane Plan included per contract with stablished pre-negotiated rates
2 A written plan which states the general administrative and on-site procedures
3 Preparedness Plan classified into phases depending on the wind speeds
4 Daily weather monitoring
5 Responsibilities under Project Executives, Managers, and Superintendents
6 Construction Companies hire instructed safety Professionals
7 Subcontractors collaboration to secure the site
8 Assessment of the hurricane preparedness plan through observations and check sheets
9 Insurance companies training support
WEAKNESSES
10 Hiring of safety non-educated workers and operators
11 Operators/Workers replacement
12Responsabilities in the written plan concentrated only among leadership positions and
minimum emphasis on securing uninstalled materials
13 Lack of pre-assessment by the use of wind speeds monitored in a daily basis
14Weak communication to employees/workers and lack of supervision of assigned
responsibilities
15 Weak safety culture stablished among workers
16 Internal Trainning of employees
17 Poor housekeeping
18 Subcontractors reluctance to secure the site in advance due to the high cost it represents
19 Assessment is not conducted by the use of a tool that supports observations
20 Negative perception of the insurance companies role
51
included in the internal matrix, the survey responses were also used. The weight
indicates the relative importance of the factors for successful implementations.
Similarly, rating values are assigned based on the survey outcomes. The rating is
assigned to each factor which indicates whether that factor represents a major
weakness (rating = 1), a minor weakness (rating = 2), a minor strength (rating =
3), or a major strength (rating = 4). Finally, each factor’s weight is multiplied by the
rating to obtain the weighted score. The highest possible weighted score for a
company is 4.0 and the lowest possible is 1.0. Therefore, if the total weighted score
is below 2.5 this means that the company is internally weak (David 2011).
The process is similar to the EFE Matrix explained in the previous section. The
following represents the explanation of the weights and ratings assigned per factor:
Strengths Factors – Factor 5, Responsibilities under key personnel (e.g., Project
Executives, Managers, and Superintendents) has the highest weight of importance
of 0.08, all tasks of the preparedness plan are under the direction of such proficient
industry professionals. Factor 9, Insurance companies training support has a
weight of importance of 0.07, the training sessions these institutions provide to
contractors’ could improve their knowledge. Factor 4, Daily weather monitoring has
an above average weight of importance of 0.06, this is a practice that contractors
implement on a daily basis and is of extreme importance to activate a robust HPP.
Regarding the remaining factors, these are required components of the HPP to
support the logistics. Therefore, these factors are assigned a lower than average

52
weight. In relation to the ratings, factors 4 and 9 represent a major strength (rating
= 4) and the other factors a minor strength (rating = 3).
Weaknesses Factors – Factor 10, Hiring of safety non-educated workers and
operators has the highest rate of importance of 0.09 and is a situation that
significantly affects construction companies. Factor 11, responsibilities in the
written plan concentrated only among leadership positions and minimum emphasis
on securing uninstalled materials has a weight of importance of 0.08,
responsibilities should also be assigned to other employees to efficiently monitor
the implementation. Factor 13, Weak safety culture established among workers
has also a high weight of importance of 0.08, currently interrupts the HPP
implementations, the problem is having employees of different backgrounds
joining the construction industry. Factor 12, Weak communication to
employees/workers and lack of supervision of assigned responsibilities has 0.07
of weight of importance. According to the survey not all safety managers are aware
of the employees’/workers performance. Factor 15, Poor housekeeping has an
above average weight of importance of 0.06, currently this is critical at construction
sites which results into weak communication, lack of supervision, and weak safety
culture. Factor 17, Assessment is not conducted by the use of a tool that supports
observations weight is also 0.06, apart from observations the construction
companies do not have other assessment tool to monitor the preparedness plans.
The remaining factors have lower weight of importance, however, they represent
findings of the survey to be address. In relation to the ratings, factors 10 to 17
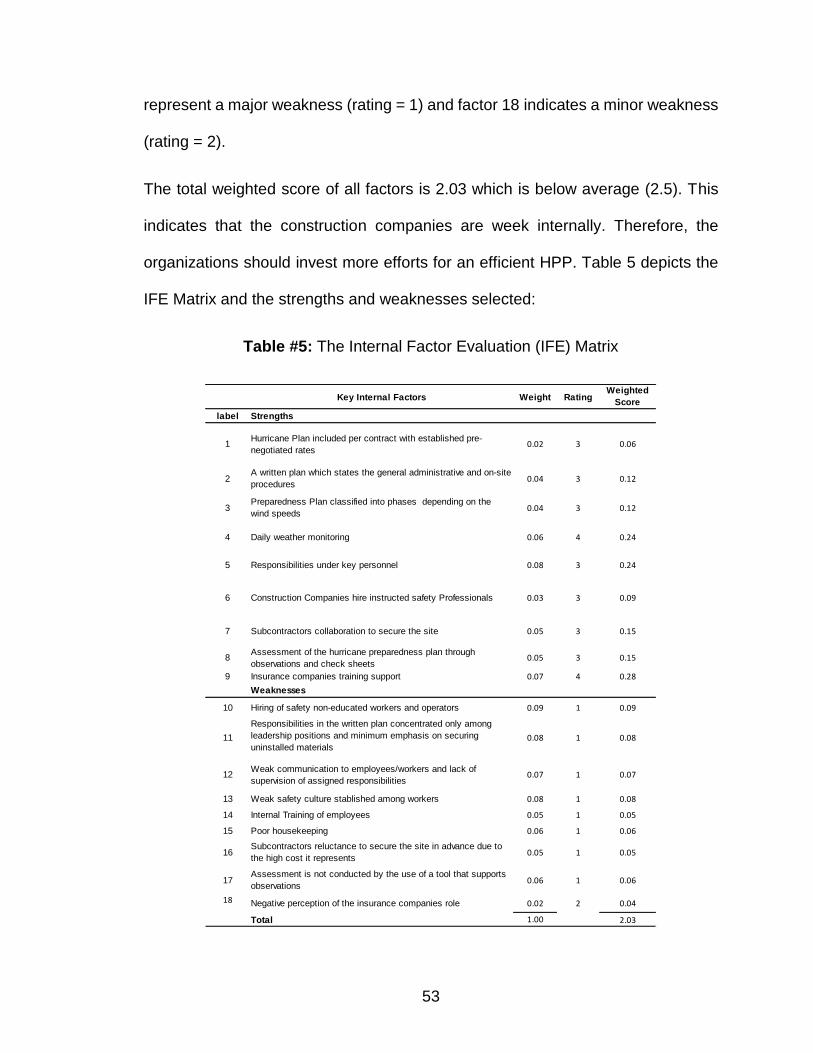
53
represent a major weakness (rating = 1) and factor 18 indicates a minor weakness
(rating = 2).
The total weighted score of all factors is 2.03 which is below average (2.5). This
indicates that the construction companies are week internally. Therefore, the
organizations should invest more efforts for an efficient HPP. Table 5 depicts the
IFE Matrix and the strengths and weaknesses selected:
Table #5: The Internal Factor Evaluation (IFE) Matrix
Key Internal Factors Weight RatingWeighted
Score
label Strengths
1Hurricane Plan included per contract with established pre-
negotiated rates0.02 3 0.06
2A written plan which states the general administrative and on-site
procedures 0.04 3 0.12
3Preparedness Plan classified into phases depending on the
wind speeds0.04 3 0.12
4 Daily weather monitoring 0.06 4 0.24
5 Responsibilities under key personnel 0.08 3 0.24
6 Construction Companies hire instructed safety Professionals 0.03 3 0.09
7 Subcontractors collaboration to secure the site 0.05 3 0.15
8Assessment of the hurricane preparedness plan through
observations and check sheets0.05 3 0.15
9 Insurance companies training support 0.07 4 0.28
Weaknesses
10 Hiring of safety non-educated workers and operators 0.09 1 0.09
11
Responsibilities in the written plan concentrated only among
leadership positions and minimum emphasis on securing
uninstalled materials0.08 1 0.08
12Weak communication to employees/workers and lack of
supervision of assigned responsibilities 0.07 1 0.07
13 Weak safety culture stablished among workers 0.08 1 0.08
14 Internal Training of employees 0.05 1 0.05
15 Poor housekeeping 0.06 1 0.06
16Subcontractors reluctance to secure the site in advance due to
the high cost it represents0.05 1 0.05
17Assessment is not conducted by the use of a tool that supports
observations0.06 1 0.06
18 Negative perception of the insurance companies role 0.02 2 0.04
Total 1.00 2.03
54
3.6. The Internal and External Matrix
After the Internal and External Analysis is finished, the next step is to combine the
factors contained in the EFE and IFE matrices and based on these formulate
strategies to improve HP. With the internal and external matrices, the strategy-
formulation technique used to identify, evaluate, and select the strategies for the
BSC is the Strengths-Weaknesses-Opportunities-Threats (SWOT) Matrix. The
SWOT matrix is known as a matching tool and the approach is to develop four
types of strategies: Strengths-Opportunities Strategies (SO), Weaknesses-
Opportunities Strategies (WO), Strengths-Threats Strategies (ST), and
Weaknesses-Threats Strategies (WT).
SO Strategies - The basis is that the internal strengths of the company are used
to take advantage of the external opportunities of the environment (David 2011).
For example, matching more than two strengths and weaknesses is used to create
a strategy; for this, the strengths and weaknesses are related or complement each
other. For example, table 6 strategy SO2 “Use the wind speeds values that are
daily observed” is created matching strengths S3 and S4, and opportunities O5
and O6. Where, there is the opportunity that the government agencies have
available databases and infrastructure related to winds monitoring, and also
technologies assist in the monitoring of winds behavior. Thus, construction
companies are able to establish a framework that utilizes the daily wind speed
observations and improves the management of resources in construction sites.
55
WO Strategies – The intend is to improve the internal weaknesses that the
company has by taking advantage of the external opportunities. Nevertheless, a
company´s internal weaknesses can prevent from exploiting key external
opportunities (David 2011). For example, in table 6, strategy WO6 “Conduct
training for all workers and operators” is created matching weaknesses W1 and
W4, and opportunities O2 and O3. In this regard, externally there is the opportunity
of high demand of construction projects, however, the construction companies
have developed weaknesses on hiring non-educated workers. As a result the
companies have a weak safety culture, nevertheless, there exists the opportunity
to increase the efforts on HP. For example, according to this year statistics, 46%
of the construction companies will invest efforts on training and development of
programs for current and new construction workers (AGC 2016). This is the
opportunity that can help to minimize the weaknesses that the companies are
currently facing. Thus, the industry should invest more on specific training
programs under the lines of heavy wind preparedness.
ST Strategies – The base is on the strengths that the company has to avoid or
reduce the impact of external threats (David 2011). For example, in table 6 strategy
ST4 “Assess subcontractor's preparedness” is created matching strength S7 and
threat T7. By instance, when subcontractors intend to collaborate to secure
construction sites (opportunity) the weather forecast uncertainty influences their
decision-makings. If subcontractors are not certain of a hurricane event they do
not respond in advance, and apply precautions to the last minute.
56
WT Strategies – These are constructed by reducing the internal weakness and
avoiding the external threats. A company facing numerous external threats and
internal weaknesses may indeed be in a precarious position (David 2011). For
example, table 6 strategy WT9 “Reduce employee turnover and replacement
costs” is created matching weakness W1 and threats T3 and T5. Therefore, the
weakness of hiring non-educated workers should be reduced with strategical
efforts to prevent the increase on employee turnover and replacement cost.
The following table contains all the strategies created with the strengths (S),
weaknesses (W), opportunities (O), and threats (T):

57
Table #6: SWOT Matrix
3.7. Hurricane Preparedness Balanced Scorecard
After identifying the strategies that construction companies should implement for
efficient HP, the next step is to establish strategic objectives. Then, strategic
measurements are assigned to each objective to monitor performance.
STRENGHTS WEAKNESSES
1 Hurricane Plan included per contract with
established pre-negotiated rates
1 Hiring of safety non-educated workers and operators
2 A written plan which states the general
administrative and on-site procedures
2 Responsibilities in the written plan concentrated only
among leadership positions and minimum emphasis
on securing uninstalled materials
3 Preparedness Plan classified into phases
depending on the wind speeds
3 Weak communication to employees/workers and
lack of supervision of assigned responsibilities
4 Daily weather monitoring 4 Weak safety culture stablished among workers
5 Responsibilities under preparedness plan
leaders
5 Internal Training of employees
6 Construction Companies hire instructed safety
Professionals
6 Poor housekeeping
7 Subcontractors collaboration to secure the site 7 Subcontractors reluctance to secure the site in
advance due to the high cost it represents
8 Assessment of the hurricane preparedness plan
through observations and check sheets
8 Assessment is not conducted by the use of a tool
that supports observations
9 Insurance companies training support 9 Negative perception of the insurance companies role
OPPORTUNITIES SO Strategies WO Strategies
1 OSHA Standards and Municipal Code regulations
regarding hurricane season
1. Review and Improve the Hurricane
Preparedness Plan Document (S2, O1, O2)
6. Conduct training for all workers/operators (W1,
W4, O2, O3)
2 High demand of Construction Projects 2. Use the wind speeds values that are daily
observed (S3, S4, O5, O6)
7. Measure employee's performance after each
training session (O3, W3, W4, W5)
3 Increase efforts on Hurricane Preparedness. 46% of the
companies will invest efforts on training and
development of programs for current and new workers
3. Create a training program per project (S6, S9,
O3)8. Reduce or eliminate unnecessary loose materials
or debris (W6, O3)
4 Government interest to spend on technological research
5 Government agencies available databases and
infrastructure
6 Wind speeds monitoring by the use of computer and
internet applications
THREATS ST Strategies WT Strategies
1 Contractors work paralyzation due to standard violation
2 Increment on penalties. More than $7,000 in the case of
OSHA and more than $5,000 in the case of Miami Dade
Municipality
4. Assess subcontractor's preparedness (S7,
T7)
9. Reduce employee turnover and replacement costs
(W1, T3, T5)
3 Increase of more than 5% on Employee Turnover (loss
on productivity and expertise)
5. Measure preparedness plan leaders
performance (S5, S6, T4, T5)
10. Reduce the number of employees' quits (W3, T4,
T10)
4 Increase of more than 2.4% on the Number of quits 11. Measure employee satisfaction (W4, W5, T8)
5 Increase on employees replacement cost and base pay
rates, incentives, and benefits to retain qualified workers
or recruit them (e.g., applicants recruit, training)
12. Reduce possible paralyzation and penalties by
assessing the most sensitive components registered
on the check sheets (W8, T1, T2)
6 70% of likelihood of named storms ocurrence and La
Niña favoring hurricane activity
13. Introduce per project as part of the training
program a special topic(s) that insurance companies
can impart (W9, T1, T2)
7 Weather forecast uncertainty (past events) influences
decision making (between contractors and
subcontractors)
8 0.1% increase of new construction workers hires
9 Experienced workers resignation (age factor)
10 Workers perception of the risks involved in the
environment where they work
SWOT MATRIX OF THE HURRICANE PREPAREDNESSES PLANS OF CONSTRUCTION COMPANIES

58
Strategies
These are selected from the external and internal analysis matrix (SWOT). The
strategies are first analyzed under the management perspective and then the
cause-and-effect relationships are established to link this perspective to the other
perspectives of the BSC. These strategies help on the development of the strategic
objectives of all the different perspectives of the BSC, for each objective is possible
to combine more than one strategy as presented further.
The strategies on table 6 are used to create the scorecard, in total there are
thirteen (13) strategies and the following numbers (e.g., SO1, SO2) are used
further to identify the link that exists between the strategies of the SWOT matrix
and the Objectives of the BSC: SO1 Review and Improve the HP Plan Document,
SO2 Use the wind speeds values that are daily observed, SO3 Create a training
program per project, ST4 Assess subcontractor's preparedness, ST5 Measure the
leader’s performance, WO6 Conduct training for all workers/operators, WO7
Measure employee's performance after each training session, WO8 Reduce or
eliminate unnecessary loose materials or debris, WT9 Reduce employee turnover
and replacement costs, WT10 Reduce the number of employees quits, WT11
Measure employee satisfaction, WT2 Reduce possible penalties by assessing the
most sensitive components registered on the check sheets, WT13 Introduce as
part of the training program the participation of insurance companies.

59
3.7.1. Management Perspective
The focus of this perspective is on the HP policy and the management commitment
and leadership. By the use of this elements in the BSC, the results reflect project
control activities (e.g., directing, leading, planning, and coordinating) with specific
measures to accomplish the objective of the HPP. To do that, once the
organization´s business strategy is identified, objectives are selected, and then the
objectives are translated into measures or indicators.
Strategic Objectives
This corresponds to the Hurricane Preparedness Plan Policy. The HPP policy
states that the organizations must take precautions prior a hurricane. This, to
minimize property damages, accidents, and production downtime for the
construction projects. The HPP policy is subdivided into strategic objectives to
select the indicators, also, the strategies constructed with the SWOT tool are taken
into account for the strategic objectives of the BSC. The SWOT strategies used to
construct the objectives are mentioned in parenthesis next to each objective, and
the number assigned in the previous section is used to identify them (e.g., ST5,
SO1).
The strategic objectives proposed for the management perspective are: Lead by
example (ST5), Contribute to the HPP operating performance (ST5, SO1),
Contribute to the improvement of the HPP (SO1, WT13).

60
Strategic measurements
These are the indicators to measure the strategic objectives, these measurements
are classified into leading and lagging indicators. The lagging indicators represent
traditional performance measures; these are normally used by the organizations
to assess the status of the company or project. The leading indicators represent
proactive measures that reflect the effectiveness of the management activities. In
this research, both type of indicators are used for the HP BSC.
The strategic measurements of this perspective are: Extent of management
involvement to improve preparedness, Monitoring of each perspective of the BSC,
Number of hurricane preparedness initiatives:
To measure Extent of management involvement to improve preparedness,
construction companies can develop questionnaires or conduct group
interviews. This captures the behavioral, situational, and psychological
aspects to understand the level of involvement of each member in the
organization that has an active role in the decision-makings (Mohamed
2003).
To measure Monitoring of each perspective of the BSC, the preparedness
team should simply monitor the goals and indicators that are proposed for
the other BSC perspectives. These are presented further in this section.
To measure the Number of hurricane preparedness initiatives, companies
would have to register the number of initiatives that are proposed during
each meeting to review the hurricane plans.

61
The measurements of this part were adapted from the previous work of
Mohamed (2003) that applied the BSC for safety assessment.
3.7.2. Customer Perspective
This perspective of the BSC embraces two types of customers: the clients and the
employees. Regarding HP, clients are classified as highly-wind-sensitive or not;
this depends on their backgrounds and the construction markets they come from.
For example, there are cities where the hurricane standards are more conservative
making their markets more sensitive towards preparedness. As a result, clients
support all procedures that are required to secure construction sites even if these
causes schedule overruns. In contrast to this, clients might be reluctant to stop the
daily progress of the construction works in spite of the potential risk that heavy
wind conditions represent. Also, in the construction industry clients tend to base
their project preferences along dimensions like: price, time, quality, functionality,
and service; where preparedness or safety procedures have poor importance.
Moreover, the significance is to understand how these customers perceive the role
of preparedness and the efforts of the organization to achieve HP culture.
The customer perspective is used to assess how employees or clients perceive
HP on construction sites. Thus, it is important to set indicators of the extent to
which the members are actually implementing the BSC. This, indicates if additional
opportunities exist for improving the preparedness plan performance and
enhancing preparedness culture in the organizations (Mohamed 2003).
62
Consequently, descriptive measures are selected to capture clients as well as
workers’ opinions regarding the preparations that the company should implement
for HP. The measures should reflect the customers understanding or awareness
of HP, also, how they perceive the work environment and the attitude they have
towards their organizational obligations.
Strategic Objectives
The strategies from the SWOT analysis are also used to stablish the strategic
objectives of this perspective. The SWOT strategies used to construct the
objectives are mentioned in parenthesis next to each objective, and the number
assigned in the previous section is used to identify them (i.e., SO1). The strategic
objectives proposed for this research are: Increase customer (clients and
employees) understanding of the on-site preparations and efforts in case of heavy
winds (SO1), Foment employee satisfaction and Reinforce workforce morale
(WT9, WT10, WT11), Exceed Clients expectations (SO1).
Strategic measurements
After determining the strategic objectives of this perspective, the metrics to
measure them are constructed. Therefore, to measure the objectives of the
customer perspective the following indicators are proposed: Extent of meetings,
Extent of rewarding employees with excellent performance, Response time under
heavy wind events:
63
The extent of meetings indicator helps to improve the level of
communication between the construction companies and the customers.
This is measured by the number of meetings with customers. For example,
the construction companies would have to establish monthly meetings with
clients to inform of the status of the project and the changes in schedule
due to HP. Likewise, remind to employees HP guidelines in a daily basis for
example as part of the pre-shift planning meetings before starting the
construction works.
To measure the Extent of rewarding employees with excellent performance,
the construction companies can simply establish a program where the best
employees are rewarded monthly.
The Response time under heavy wind events is measured by how in
advance a construction company prepares for a storm. For example, the
companies can register the time they spend to secure the construction site
and test it during an emergency drill. Currently, construction companies in
Miami do not have hurricane drills and the practice of such could
significantly help them to improve their best practices. Also, the response
time not necessarily needs to start 72 hours in advance of the event (as the
HPP suggests) but could be activated before this time for a better use of the
resources.
64
3.7.3. Internal Process Perspective (Operational)
The core component of management systems are rules and procedures.
Moreover, a safety management system program is based upon the statement that
safety is a management responsibility and a line function (Mohamed 2003).
However, the success of preparedness programs depends on the ability of site
management to assure that rules and policies are followed during daily work
operations. Therefore, this perspective is concerned with the efficient
implementation of HP procedures in construction sites. Furthermore, the greatest
strength that the BSC provides is that employees are more aware of the relation
between policy, procedures and performance targets. This helps to identify
opportunities for meaningful improvement on HP guidelines and as a result
achieve a high level of compliance of the hurricane program.
Strategic Objectives
The objectives proposed for this research under this perspective mainly focus on
the core issue that currently construction companies have: the employees’
performance and the subcontractors’ compliance with HP. The SWOT strategies
are also used to construct the objectives and are mentioned in parenthesis next to
each objective, and the number assigned in the previous section is used as well to
identify them. Then, the following objectives are proposed to improve the
performance: Reduce number of incidents (WO8, WT12), Implement an efficient
follow-up system (ST5, WO7, WT11, SO1), Emphasize subcontractor´s
awareness (ST4), Establish a suitable working environment with all working
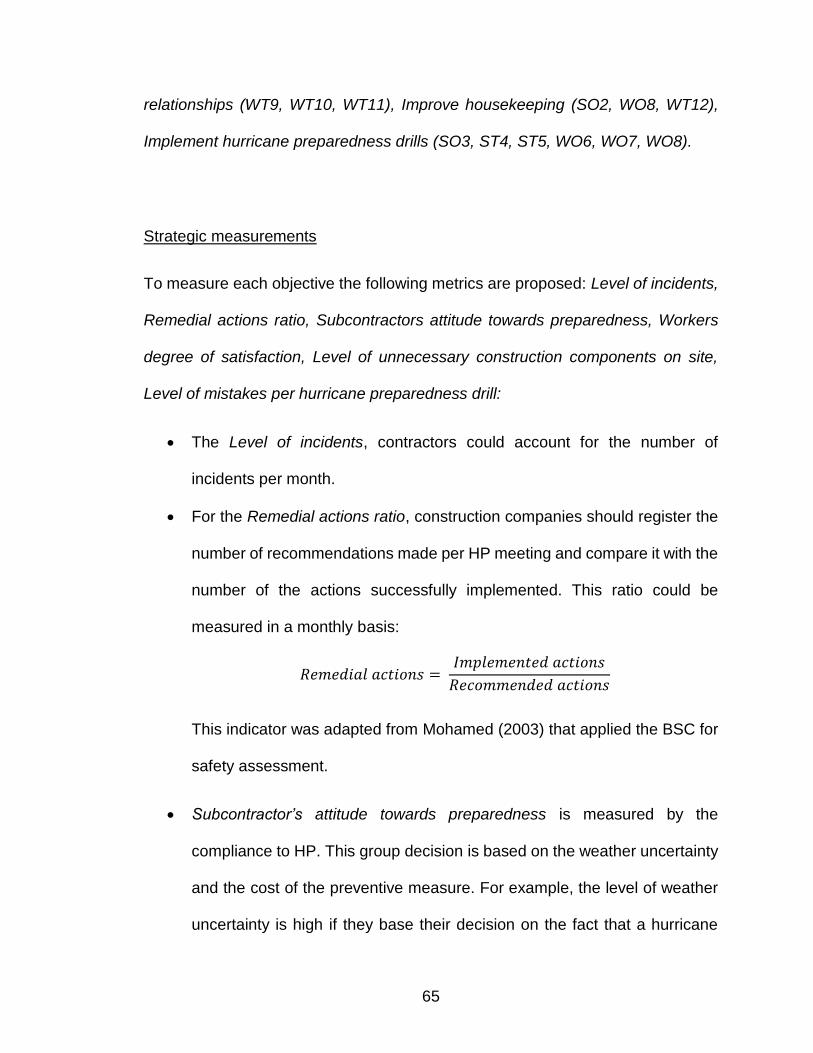
65
relationships (WT9, WT10, WT11), Improve housekeeping (SO2, WO8, WT12),
Implement hurricane preparedness drills (SO3, ST4, ST5, WO6, WO7, WO8).
Strategic measurements
To measure each objective the following metrics are proposed: Level of incidents,
Remedial actions ratio, Subcontractors attitude towards preparedness, Workers
degree of satisfaction, Level of unnecessary construction components on site,
Level of mistakes per hurricane preparedness drill:
The Level of incidents, contractors could account for the number of
incidents per month.
For the Remedial actions ratio, construction companies should register the
number of recommendations made per HP meeting and compare it with the
number of the actions successfully implemented. This ratio could be
measured in a monthly basis:
𝑅𝑒𝑚𝑒𝑑𝑖𝑎𝑙 𝑎𝑐𝑡𝑖𝑜𝑛𝑠 = 𝐼𝑚𝑝𝑙𝑒𝑚𝑒𝑛𝑡𝑒𝑑 𝑎𝑐𝑡𝑖𝑜𝑛𝑠
𝑅𝑒𝑐𝑜𝑚𝑚𝑒𝑛𝑑𝑒𝑑 𝑎𝑐𝑡𝑖𝑜𝑛𝑠
This indicator was adapted from Mohamed (2003) that applied the BSC for
safety assessment.
Subcontractor’s attitude towards preparedness is measured by the
compliance to HP. This group decision is based on the weather uncertainty
and the cost of the preventive measure. For example, the level of weather
uncertainty is high if they base their decision on the fact that a hurricane

66
has not hit Miami for approximately ten years. Consequently,
subcontractors are not willing to apply costly preventive solutions.
The measure Workers degree of satisfaction the construction companies
can conduct satisfaction surveys to get inform of their attitude towards the
company. For this, a scale could be fixed where 1 is very dissatisfied and
10 very satisfied. Another way of recognizing if workers are satisfied is by
looking to the employees’ turnover and level of performance indicators
which are explained further.
For the Level of unnecessary construction components on site, the
construction companies can monitor this per week by accounting for the
number of equipment, materials, and debris that should be storage properly
during hurricane season (specially the days of high winds).
For the Level of mistakes per hurricane preparedness drill is necessary to
implement a drill system for hurricanes. To measure the mistakes,
companies would have to simply register the number of omissions of the
hurricane drill (activities not accomplished during the time of this exercise).
3.7.4. Learning and Growth Perspective
This perspective relates to a periodic review of the BSC, for this the objectives and
metrics should reflect core elements of the BSC that should be monitored during
a timeframe and contribute to the problems identification. Additionally, the BSC
reviews suggest the modification of the scorecard by including only the pending

67
goals. Likewise, the BSC strategy, goals, and measures should always have the
focus on learning and improvement identifying the gaps between the goals and
existing performance.
Strategic Objectives
Similarly to the other perspectives, the SWOT strategies are used to construct the
objectives and are mentioned in parenthesis next to each objective, the number
assigned in the previous section is used to identify them. Moreover, the key to
achieve performance is represented by organizational culture, employees’ attitude,
and education. Therefore, in order to enhance the human capital of the
organization the following objectives are proposed: Provide adequate training to
workers (SO3, WO6, WT13), Upgrade employees’ competencies (WO7),
Empower workforce (WT9, WT10).
Strategic measurements
To measure the goals of this perspective the following metrics are selected:
Workers competency, Employee Performance, Extent of workforce proactive
involvement to improve the level of preparedness:
Workers competency is measured by the following ratio:
𝑊𝑜𝑟𝑘𝑒𝑟𝑠 𝑐𝑜𝑚𝑝𝑒𝑡𝑒𝑛𝑐𝑦 = 𝑁𝑢𝑚𝑏𝑒𝑟 𝑜𝑓 ℎ𝑜𝑢𝑟𝑠 𝑜𝑓 𝑡𝑟𝑎𝑖𝑛𝑖𝑛𝑔 𝑟𝑒𝑐𝑒𝑖𝑣𝑒𝑑
𝑁𝑢𝑚𝑏𝑒𝑟 𝑜𝑓 𝑖𝑑𝑒𝑎𝑙 ℎ𝑜𝑢𝑟𝑠 𝑜𝑓 𝑡𝑟𝑎𝑖𝑛𝑖𝑛𝑔
Where, the number of ideal hours of training should be of 30 hours
according to OSHA, and the minimum is 10 hours.
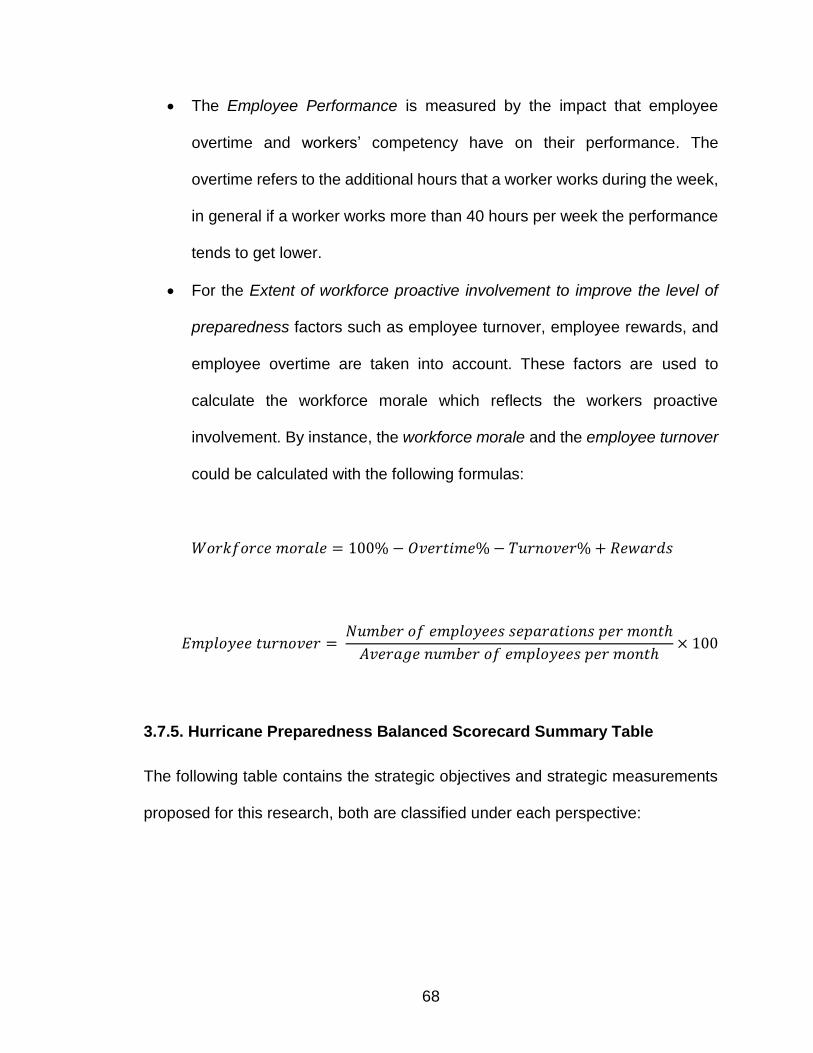
68
The Employee Performance is measured by the impact that employee
overtime and workers’ competency have on their performance. The
overtime refers to the additional hours that a worker works during the week,
in general if a worker works more than 40 hours per week the performance
tends to get lower.
For the Extent of workforce proactive involvement to improve the level of
preparedness factors such as employee turnover, employee rewards, and
employee overtime are taken into account. These factors are used to
calculate the workforce morale which reflects the workers proactive
involvement. By instance, the workforce morale and the employee turnover
could be calculated with the following formulas:
𝑊𝑜𝑟𝑘𝑓𝑜𝑟𝑐𝑒 𝑚𝑜𝑟𝑎𝑙𝑒 = 100% − 𝑂𝑣𝑒𝑟𝑡𝑖𝑚𝑒% − 𝑇𝑢𝑟𝑛𝑜𝑣𝑒𝑟% + 𝑅𝑒𝑤𝑎𝑟𝑑𝑠
𝐸𝑚𝑝𝑙𝑜𝑦𝑒𝑒 𝑡𝑢𝑟𝑛𝑜𝑣𝑒𝑟 = 𝑁𝑢𝑚𝑏𝑒𝑟 𝑜𝑓 𝑒𝑚𝑝𝑙𝑜𝑦𝑒𝑒𝑠 𝑠𝑒𝑝𝑎𝑟𝑎𝑡𝑖𝑜𝑛𝑠 𝑝𝑒𝑟 𝑚𝑜𝑛𝑡ℎ
𝐴𝑣𝑒𝑟𝑎𝑔𝑒 𝑛𝑢𝑚𝑏𝑒𝑟 𝑜𝑓 𝑒𝑚𝑝𝑙𝑜𝑦𝑒𝑒𝑠 𝑝𝑒𝑟 𝑚𝑜𝑛𝑡ℎ× 100
3.7.5. Hurricane Preparedness Balanced Scorecard Summary Table
The following table contains the strategic objectives and strategic measurements
proposed for this research, both are classified under each perspective:

69
Table #7: Hurricane Preparedness BSC
4. RESULTS AND DISCUSSION
4.1. Survey main aspects
The survey interviews incorporated safety managers, superintendents, and project
executives, where a total of eight views described current practices and issues
regarding HP. Furthermore, the survey questions included the following topics: (1)
Current practices, challenges, and limitations; (2) Measurement of the current
practices; (3) New approach needed for hurricane preparedness; and (4) Cost and
schedule issues related to hurricane preparedness.
The study revealed that construction markets out from Florida are more sensitive
to severe wind conditions. For example, according to the HPP of a construction
Perspective Strategic Objectives Strategic Measurements
Lead by example Extent of management involvement to improve
preparedness
Contribute to the HPP operating performance Monitoring of each perspective of the BSC
Contribute to the improvement of the HPP Number of hurricane preparedness initiatives
Increase customer understanding of the on-site
preparations and efforts in case of heavy winds
Extent of meetings
Foment employee satisfaction and Reinforce workforce
morale
Extent of rewarding employees with excellent
performance
Exceed Clients expectations Response time under heavy wind events
Reduce number of incidents Level of incidents
Implement an efficient follow-up system Remedial actions ratio
Emphasize subcontractor´s awareness Subcontractors attitude towards preparedness
Establish a suitable working environment with all
working relationships
Workers degree of satisfaction
Improve housekeeping Level of unnecessary construction components on site
Implement hurricane preparedness drills Level of mistakes per hurricane preparedness drill
Provide adequate training to workers Workers competency
Upgrade employees competencies Employee Performance
Empower workforce Extent of workforce proactive involvement to improve the
level of preparedness
Management
Customer
Internal Process
Learning and Growth

70
company from New York City, the pre-assessment starts when wind speeds
exceed the 25mph. In contrast, the HPP of Miami construction companies is
activated when sustained winds reach the 35mph. Since the last severe storm was
hurricane Sandy which principally affected NYC, standards and regulations are
stricter in areas away from Florida. Thus, the lessons learned encouraged this
industry professionals to develop more HP guidelines and enrich their safety-
preparedness culture. Consequently, these guidelines are currently used as a
base by construction companies located in Florida.
The survey responses also revealed that clients of the construction industry have
different perceptions regarding HP. Depending on the clients’ background, they
are more aware of the importance of implementing a HPP and understand the
possible changes in the construction schedule. Moreover, for the type of clients
that are unaware of the importance of the hurricane practices, is necessary to
extent the efforts of communicating them the plan and the status of the project
during hurricane season.
Additionally, the survey results indicated that one of the major factors to improve
is housekeeping, this basically is present due to the lack of alignment among
industry professionals. Hurricane preparations and views among the players of a
construction company vary, for example, between superintendents to safety
managers. This is noted at the end of a work day in the construction site, where
unsecured resources are not properly storage and could get up-lifted causing
damages. To reduce or eliminate this problem, construction companies should

71
establish a specific monitoring system where they are able to monitor the amount
of unsafe resources per week and correct the issue.
Another view of the survey showed that the application of preventive measures in
advance of the storm could be challenging among subcontractors. For instance,
since weather is uncertain and in the past hurricanes did not strike Miami,
subcontractors are in general reluctant to secure the site because of the high cost
that it may represent. In reference to this, one of the survey participants mentioned
that this normally happens when subcontractors have to remove scaffolding
systems. To overcome this problem, contractors should enforce the construction
site protection in advance by the use of clauses in the contract documents, also
another alternative is to extent the efforts towards subcontractors’ compliance.
Finally, the survey results demonstrated that the main problem to not implement a
correct HPP is related to the employees of the organization. Where, contractors in
Miami-Florida have the tendency to hire non-educated workers due to the high
demand of projects. Therefore, the interviewees indicated that there is the high
requirement to educate the personnel, specially workers and operators. Their lack
of experience and diversity of backgrounds reflect an immense challenge to
accomplish the objectives of a HP culture. Nevertheless, to improve this situation
construction companies should invest more efforts on training the personnel. A
major problem is that previous studies have revealed that in Florida immigrant
construction workers are treated different. For example, they are not receiving
complete training due to their language barrier (Nissen 2007). Thus, construction

72
industry should work hard to address this inconvenient and set special efforts to
nurture the education and enhance the competency of this segment of construction
employees.
4.2. Balanced Scorecard main aspects
The BSC proposed in this research reflects the strategic objectives recommended
to improve the performance of a HPP. These objectives were constructed after
analyzing the strength, weaknesses, opportunities, and threats that might affect
the hurricane plan. After the SWOT analysis all main criteria is synthesized into
thirteen strategies which lead finally to the strategic objectives.
The HP BSC recommends in total fifteen (15) strategic objectives which are
classified under the perspectives of the scorecard (i.e., management, customer,
internal process, learning and growth). Also, fifteen (15) metrics are recommended
to monitor and control the performance of each strategic objective of the HPP (the
objectives and metrics are depicted in table # 7).
In addition, the BSC framework contains top-down strategies and represent a
chain of cause and effect relationships. Therefore, the proposed BSC should be
viewed as a set of hypotheses about cause and effect relationships that affect the
performance of the HPP. A top-down driven strategy method means that the top
level perspective affects the following perspectives. For example, if the
management perspective objectives are not achieved, the customer perspective
objectives are not either. To understand this better, the four perspectives are
discussed and summarized:

73
The Management Perspective involves the management active participation which
contributes to the HPP operations’ improvement. To increase the extent of the
management involvement, this research highly recommends that the organizations
stablish a follow up system of the activities and goals related to HP. Also, to monitor
the managers’ involvement surveys or meetings could be conducted, by this the
construction company can assure that management is complying with the plan.
Other measurements of the scorecard under this perspective require that
management contributes with initiatives to the plan and monitor their performance.
Thus, management should add value to the organization’s HPP by offering
initiatives during every meeting related to this topic. For example, these initiatives
could be part of the scorecard’s strategic objectives and metrics. Then, to enhance
the HP practices and improve the BSC outcomes managers should monitor the
performance of the other perspectives in the scorecard.
The Customer Perspective incorporates the customer understating of HP which
benefits the hurricane decision-makings. The BSC has as customer’s clients and
employees, and through the objectives of this perspective the aim is to increase
the understanding of the HPP. Thus, this research recommends that companies
schedule strategic meetings to discuss this special topic. Also, is imperative to
foment employees’ satisfaction to improve their performance. Then, this research
suggests that the companies define a monthly reward system for the employees
that best comply with all the plan’s requirements. As a result, employees’
performance is enhanced and by responding in advance to heavy wind events the
company exceeds client expectations of protecting the construction site.
74
The Internal Process perspective comprises recommended activities to implement
an efficient HPP. The goals of this perspective consist of reducing the incidents
that occur in a monthly basis (omission of a preventive measure). To measure the
level of incidents of the HPP this research recommends the construction
companies to establish a scale that represents the level of incidents (i.e., high,
medium, low). This simple method, helps companies to recognize the activities for
more supervision and improvement. Also, by recognizing the level of incidents the
companies can decide a “target level” of incidents to achieve periodically.
Moreover, to follow-up the execution of HP initiatives, this research recommends
that construction companies stablish a “remedial actions ratio”. This ratio
compares the implemented remedial actions with the total proposed actions. The
remedial actions correspond to the HP initiatives or corrective actions that the team
suggests as part of the improvements of the plan. Another key component of this
perspective relates to enhance subcontractor’s awareness and to measure their
attitude towards preparedness. Thus, a recommendation is that companies
increase the subcontractors’ understanding and enforce hurricane preparations
within the legal contract. By the determination of rigorous penalties subcontractors
unquestionably comply and their performance is improved. The following
recommendation under this perspective relates to establish a suitable environment
for workers. For example, by measuring the employees’ satisfaction via survey.
This helps the organizations to recognize the employees’ attitudes at work and
prevent a high turnover rate by understanding the employees’ preferences. The
last objectives of this perspective recommends housekeeping improvement and to
75
put in practice hurricane emergency drills. For this, the construction site should be
monitor in a weekly basis regarding all the materials and equipment that are not
storage properly. Once this is identified, a scale to measure the levels (i.e., high,
medium, low) of unnecessary components in the construction site shall be created.
This allows industry professionals to monitor and control housekeeping with a
scale basis, also, the method creates housekeeping consciousness among all
employees by showing the results of this goal of the BSC. Finally, to test the
feasibility of the hurricane emergency drill a recommendation is to create also a
scale to measure the level of mistakes per drill.
The Learning and Growth Perspective highlights the core aspects to enhance the
overall performance of the BSC, the purpose of this perspective is to periodically
monitor goals (strategic measurements). The objectives of this level of the
scorecard are related to the employees training enhancement which ultimately
delivers competent workers. For example, a recommendation is to monitor the
number of hours of training received which intends to fill the gap related to workers’
education that in Florida deserves special attention. Furthermore, to know if the
level of training is delivering progress among all the construction workers then
competencies should be upgraded. This could be identified by measuring the
workers’ performance and the effect of doing overtime. This metric can serve to
compare workers’ performance and improve the weekly work schedule to reduce
unnecessary additional work hours. Finally, the workforce empowerment is of
extreme importance to increase the employees’ involvement in the HPP. For this
the workforce morale should be strengthen by reducing the amount of overtime
76
which is proved to impact productivity, also as mentioned before, rewards shall be
implemented. Another recommended factor to measure the employees’
involvement is the employee turnover which ultimately affects the workforce
morale. The reason of this cause-effect relationship is that to terminate the working
relation creates a negative work environment that influences all workers’
performance towards HP.
5. CONCLUSION
5.1. Summary
HP current state of practice principally focuses on the compilation of total damages
and design codes improvements in pro of a resilient construction site. However,
uninstalled and unsecured elements in the case of engineering structures and
resources are highly vulnerable components regarding extreme wind conditions
such as hurricanes. In general, inclement wind driven damages cause interruption
to construction sites planned schedules which lead to delay, and as a result
negatively affect construction projects efficiency. Additionally, the lack of alignment
of an organization team is the principle cause which interrupts an efficient HPP
execution. To contribute to this situation, the HP current practices and main issues
of the construction companies were evaluated through a comprehensive study that
included interview surveys and a BSC approach.
The construction companies that were the subjects of this study are organizations
strongly positioned in the construction market, however, for HP there is room for
improvement and creating certain capabilities among employees. Moreover, once

77
the survey was conducted and the current practices and main issues were
identified, this research applied a PEST analysis and an Internal-External
Environmental Analysis. Both tools utilized information from the survey and
literature regarding the construction industry´s political, economic, social, and
technological factors that influence HP. After this analysis is done, strategies are
constructed in order to recommend the construction companies particular areas of
improvement.
This research recommends strategic goals and metrics to monitor and accomplish
a high performance which eventually improves the safety-hurricane-preparedness
culture in the construction organizations. From a practical standpoint, the BSC is
a recognized management framework which identifies links between objectives
and measurements. This tool allows construction companies to assign
responsibilities and targets per each perspective to monitor and control the
progress of the scorecard. This framework also offers a company to proactively
manage HP and asses the problem apart from only using observations and check-
sheets. Moreover, the information of the BSC adds value to HP by delivering
relevant and aligned information available to all stakeholders. For this, construction
companies should select a handful of objectives and measures that represent the
HP policy without having information overload.
A fundamental premise of the BSC is that each perspective is reviewed on a
regular basis to monitor performance and improve it, this is why targets and
responsibilities could be set as part of the framework. Furthermore, the BSC

78
method can influence employees by their actions which eventually encourages
behavioral changes to achieve optimum performance and a zero-incidents
preparedness culture.
5.2. Limitations and Future Studies
Limitations
The constraint of information under the HP topic is a limitation of this research.
Therefore, the analysis was constructed only with the responses of interview-
surveys of certain construction companies. This situation leads to the standpoints
of a specific group of practitioners and does not mean that the practices and
problems revealed by them could be generalized to all construction companies.
Consequently, a limitation is that the recommendations stated in this work might
not apply to all industry cases.
Another limitation of this study is the reduced interest of construction companies
regarding the HP topic. Thus, it was challenging to obtain specific information
related to cost-schedule issues and as a result this was not included as part of the
BSC analysis. Likewise, information related to performance indicators was also
difficult to obtain since the companies do not apply this as metrics to measure their
performance. Thus, certain indicators proposed in the BSC were adapted from
previous works and others created without a solid base.

79
Future studies
Future studies of HP in construction sites include the validation of the performance
indicators proposed in the BSC of this research. This should be achieved by
reviewing the BSC metrics with the industry professionals and improve the input
information used to calculate each performance indicator. Thus, the strategic
measurements propose as part of this research framework can result into stronger
tools to measure the performance level of construction companies.
Finally, to increase the understanding of the cause-effect relationships of the BSC
components an Agent Based Simulation (ABS) could be constructed. This may
include a model capable of absorbing the BSC framework and data that should be
provided by the industry professionals to increase the accuracy of the method. The
simulation framework could be applied to model all the attributes of HP and by this
test the viability of performance indicators. Likewise, the application of an Agent-
Based model enables practitioners to analyze complex systems such as the
construction site environment. Where, the benefit of constructing this kind of model
is that the influence of human behaviors is also included as part of the analysis
which compliments the BSC framework.

80
LIST OF REFERENCES
Strobl, E. (2011). "The economic growth impact of hurricanes: evidence from US coastal counties." Rev.Econ.Stat., 93(2), 575-589. Steen, S. L., Echeverry, D., Aboushousha, M., and Kim, S. S. (1991). Severe Weather Impact Analysis for Military Construction Projects,. Sui Pheng, L., Raphael, B., and Kwan Kit, W. (2006). "Tsunamis: some pre-emptive disaster planning and management issues for consideration by the construction industry." Structural Survey, 24(5), 378-396. Blake, E. S., Landsea, C., and Gibney, E. J. (2007). The deadliest, costliest, and most intense United States tropical cyclones from 1851 to 2006 (and other frequently requested hurricane facts). NOAA/National Weather Service, National Centers for Environmental Prediction, National Hurricane Center,. FEMA-1609-DR-FL, Miami-Dade County, Miami International Airport-South Terminal, Project Worksheet (PW) 8889. Allianz Global Corporate & Specialty. (2011). The Calm before the Storm: Construction Site Hurricane Protection. Munich Re, pages 1-33. LiMandri, R. Alacha, M. Eschenasy D. (2013). Preparing Sites for Extreme Weather. NYC Department of Buildings, New York, pages 1-7. Fermino, Jennifer. (2013). “Sandy caused $185M in damage to WTC site”. <http://nypost.com/2013/03/20/sandy-caused-185m-in-damage-to-wtc-site/>. (October 26, 2015). Kaplan, R. S., and Norton, D. P. (1996). The balanced scorecard: translating strategy into action. Harvard Business Press,.

81
Kaplan, R. S., and Norton, D. P. (2000). "Having trouble with your strategy? Then map it." Focusing Your Organization on Strategy—with the Balanced Scorecard, 49. Kaplan, R. S., and Norton, D. P. (2005). "The balanced scorecard: measures that drive performance." Harv.Bus.Rev., 83(7), 172. Mohamed, S. (2003). "Scorecard approach to benchmarking organizational safety culture in construction." J.Constr.Eng.Manage., 129(1), 80-88.
Kagioglou, M., Cooper, R., and Aouad, G. (2001). "Performance management in construction: a conceptual framework." Constr.Manage.Econ., 19(1), 85-95. Tun Lin Moe Fritz Gehbauer Stefan Senitz Marc Mueller, (2007),"Balanced scorecard for natural disaster management projects", Disaster Prevention and Management: An International Journal, Vol. 16 Iss 5 pp.785 – 806 David, F. R. (2011). "Strategic management: Concepts and cases." U.S. Census Bureau (2004). “Frequently asked Questions Hurricane Katrina’s
Effect on New Residential Construction”.
<https://www.census.gov/construction/nrc/pdf/newresconst_200508_notes.pdf>(
OCT 3, 2016)
MunicodeLibrary,Miami.(2016).“ Requirement To Secure Loose Materials”.
<https://www2.municode.com/library/fl/miami_dade_county/codes/code_of_ordin
ances?searchRequest=%7B%22searchText%22:%22hurricane%20preparednes
s%20fines%22,%22pageNum%22:1,%22resultsPerPage%22:25,%22booleanSe
arch%22:false,%22stemming%22:true,%22fuzzy%22:false,%22synonym%22:fal
se,%22contentTypes%22:%5B%22CODES%22%5D,%22productIds%22:%5B%
5D%7D&nodeId=PTIIICOOR_CH8BEMMA_S8B-18RESELOMA> (MAY 27,
2016).
MunicodeLibrary,Miami.(2016).“Schedule of civil penalties”.
<https://www2.municode.com/library/fl/miami_dade_county/codes/code_of_ordin
ances?searchRequest=%7B%22searchText%22:%22hurricane%20preparednes
s%20fines%22,%22pageNum%22:1,%22resultsPerPage%22:25,%22booleanSe

82
arch%22:false,%22stemming%22:true,%22fuzzy%22:false,%22synonym%22:fal
se,%22contentTypes%22:%5B%22CODES%22%5D,%22productIds%22:%5B%
5D%7D&nodeId=PTIIICOOR_CH8CCCOEN_S8CC-10SCCIPE> (MAY 27,
2016).
Occupational Safety and Health Administration. (2015). Field Operations Manual
(FOM). U.S. Department of Labor. 6-2.
Dodge Data & Analytics. <http://construction.com/about-us/press/New-
Construction-Starts-in-2016-to-Grow-6-percent.asp> Jun 7 2016 “New
Construction Starts in 2016 to Grow 6% to $712 Billion According to Dodge Data
& Analytics”
Wells Fargo Equipment Finance. (2016). Wells Fargo 2016 Construction Industry
Forecast. 13-22.
U.S. Department of Labor, Bureau of Labor Statistics. (2016). “Job Openings and
Labor Turnover – April 2016”. <http://www.bls.gov/news.release/pdf/jolts.pdf>
(March 30, 2016).
U.S. department of Commerce, National Oceanic and Atmospheric Administration.
(2016). “Near-normal Atlantic hurricane season is most likely this year”.
<http://www.noaa.gov/near-normal-atlantic-hurricane-season-most-likely-year>
(March 30, 2016)
Building Design and Construction, Market Data. (2015). “2016 forecast: Continued
growth expected for the construction industry”.
<http://www.bdcnetwork.com/2016-forecast-continued-growth-expected-
construction-industry> (May 31, 2016)
The Associated General Contractors of America. (2015). “The Challenges Facing
A Growing Industry: The 2016 Construction Hiring And Business Outlook”.
<https://www.agc.org/sites/default/files/Files/Communications/2016_Construction
_Hiring_and_Business_Outlook_Report.pdf> (May 31, 2016)
83
Welch, Laura. (2010). “The Aging Worker in the U.S. Construction Industry”
<https://ohsonline.com/articles/2010/03/01/the-aging-worker.aspx> (Jun 1, 2016)
Zhao, Na. (2015). “Age of the Construction Labor Force”.
<http://eyeonhousing.org/2015/12/age-of-the-construction-labor-force/> (Jun 1,
2016)
National Weather Service. (2010). “Who we are”.
<http://www.weather.gov/media/mkx/general/noaa-nws-who-we-are.pdf> (Jun 1,
2016)
Jurevicius,Ovidijus.(2014).“IFE&EFEMatrices”.<https://www.strategicmanagemen
tinsight.com/tools/ife-efe-matrix.html> (May 25, 2016)
Business Balls. (2016).“Pest market analysis
tool“.<http://www.businessballs.com/pestanalysisfreetemplate.htm> (May 30,
2016)
Arline, Katherine. (2014). “PEST Analysis: Definition, Examples &
Templates”.<http://www.businessnewsdaily.com/5512-pest-analysis-definition-
examples-templates.html> (May 25, 2016)
Mohamed, S. (2003). "Scorecard approach to benchmarking organizational
safety culture in construction." J.Constr.Eng.Manage., 129(1), 80-88.
Ali, Hany Abd Elshakour M, Al-Sulaihi, I. A., and Al-Gahtani, K. S. (2013).
"Indicators for measuring performance of building construction companies in
Kingdom of Saudi Arabia." Journal of King Saud University-Engineering
Sciences, 25(2), 125-134.
Moon, H., Yu, J., and Kim, C. (2007). "Performance Indicators Based on TFV
Theory'." Proceedings of 15th International Conference of the International Group
for Lean Construction. Michigan, USA,.

84
Nissen, B. (2007). "Immigrant Construction Workers and Safety and Health in
South Florida." Center for Labour and Studies: Florida International University,
Florida.___Published by European Centre for Research Training and
Development UK (Www.Eajournals.Org, .