Embed Size (px)
Citation preview
8/8/2019 Hurricane Prediction A Century of Advances
http://slidepdf.com/reader/full/hurricane-prediction-a-century-of-advances 1/13
Oceanography Vol. 19, No. 2, June 200624
Tropical cyclones, typhoons, and hur-
ricanes are common words used around
the world to describe the same natural
phenomenon—one of the most deadly,
costly, and feared weather systems on
Earth. These small, intense tropical
weather systems have killed more people
than any other natural catastrophe (see
Keim, this issue). In the United States
during the 20th century, ten times as
many deaths and more than three times
as much damage occurred from tropical
cyclones as compared with earthquakes
(Gray, 2003). The continuous rapid rise
in coastal populations along the hur-
ricane-prone coast of the southeast
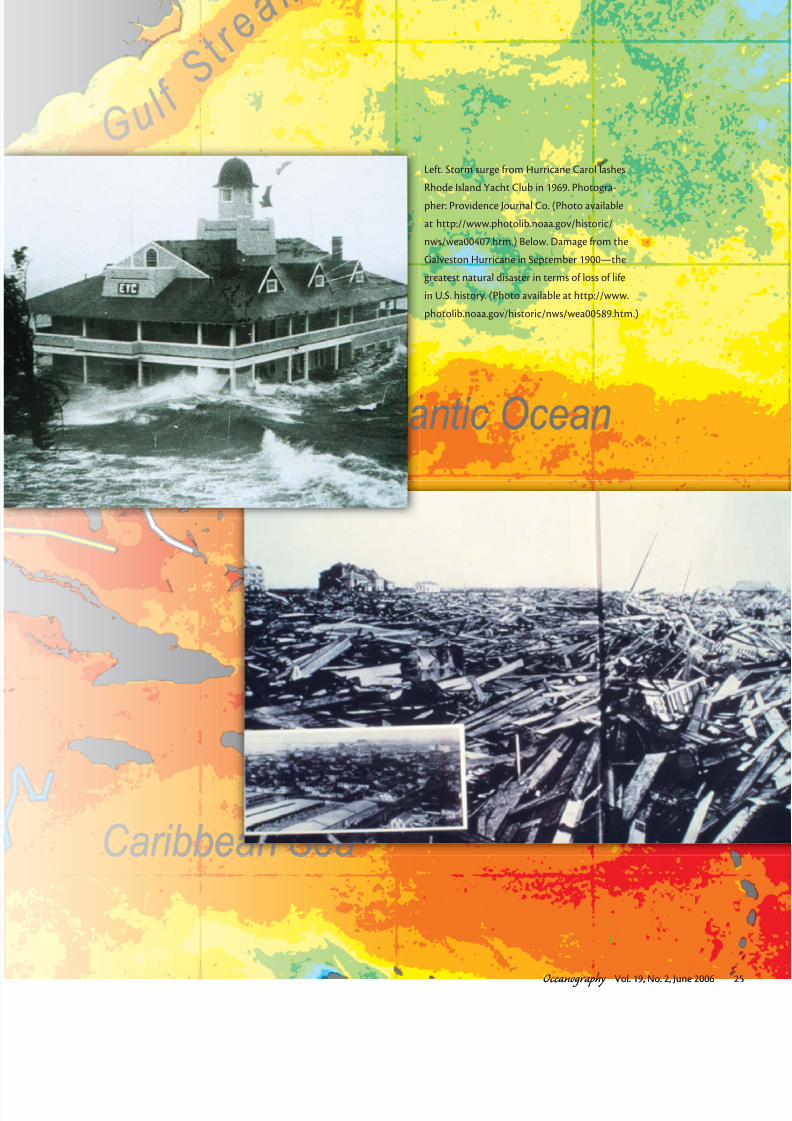
United States since the 1950s (Figure 1)has placed more of the public at risk to
coastal and inland flooding (see Bowen
et al., this issue and Bowen case study,
this issue). Nevertheless, advances in
technology, communication, and fore-
casting have reduced risks to public
health as is shown by the significant re-
duction in hurricane-related mortalities
between 1900 and 2000 (Figure 1).
However, since 1995, there has been
an upswing in Atlantic hurricane activ-
ity compared with the 1970s and 1980s
(Webster et al., 2005). The strongest hur-
ricanes, categories 4 and 5 on the Saffir-
Simpson Scale (Figure 2), increased by
25 percent in the North Atlantic during
1990–2004 compared with 1975–1989, a
trend that was documented for all ocean
basins (Webster et al., 2005). Although
Emanuel (2005a) shows a correlation
between increasing water temperatures
in the tropical Atlantic and hurricane
energy, this relationship does not hold
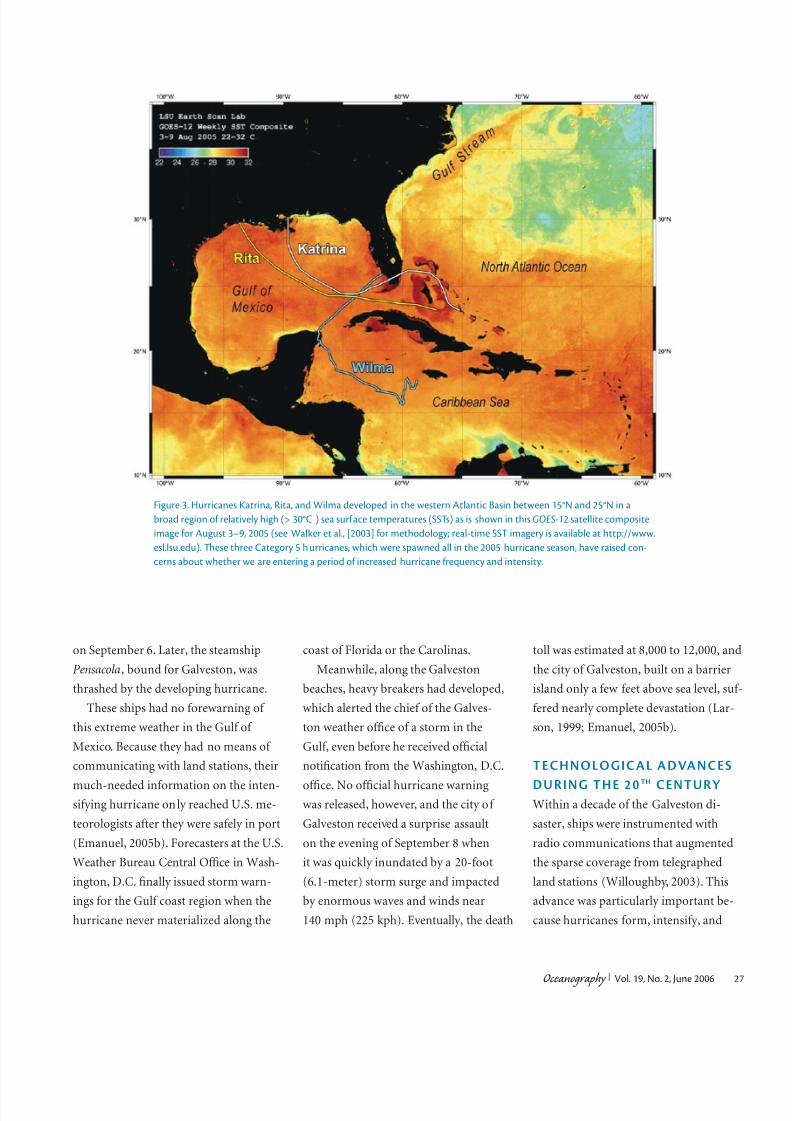
for other oceans (Webster et al., 2005).In 2005, records were broken when three
Category 5 hurricanes intensified in the
western Atlantic Ocean basin within a
two-month period (Figure 3). The in-
creased vigor of hurricanes is a grow-
ing concern for public health and safety,
and presents serious challenges not only
to modelers of hurricane track, inten-
sity, and coastal surge but to emergency
managers, traffic engineers, the insur-
ance industry, and government budgets.
In this article, we review the major ad-
vances in hurricane prediction during
the 20th century and the possibilities for
continued technological advances that
will potentially improve public health
and safety in the years to come.
LOOKING BACK IN TIME:
GALVESTON 1900
At the turn of the 20th century, the only
organized weather information available
to hurricane forecasters was collected
at land-based weather stations, as radiocommunications with ocean-going ships
had not yet been developed. The “sur-
prise” hurricane that flooded the thriving
coastal city of Galveston on September 8,
1900 need not have killed 10,000 people
if two ships transiting the Gulf of Mexico
had been able to report their weather in-
H E O C E A N S A N D H U M A N H E A L H
HurricanePredictionA Century of Advances
B Y N A N D . W A L K E R , A L A R I C H A A G , S H R E E K A N H B A L A S U B R A M A N I A N ,
R O B E R L E B E N , I V O R V A N H E E R D E N , P A U L K E M P, A N D H A S S A N M A S H R I Q U I
Oceanography Vol. 19, No. 2, June 200624
8/8/2019 Hurricane Prediction A Century of Advances
http://slidepdf.com/reader/full/hurricane-prediction-a-century-of-advances 2/13
Oceanography Vol. 19, No. 2, June 2006 25
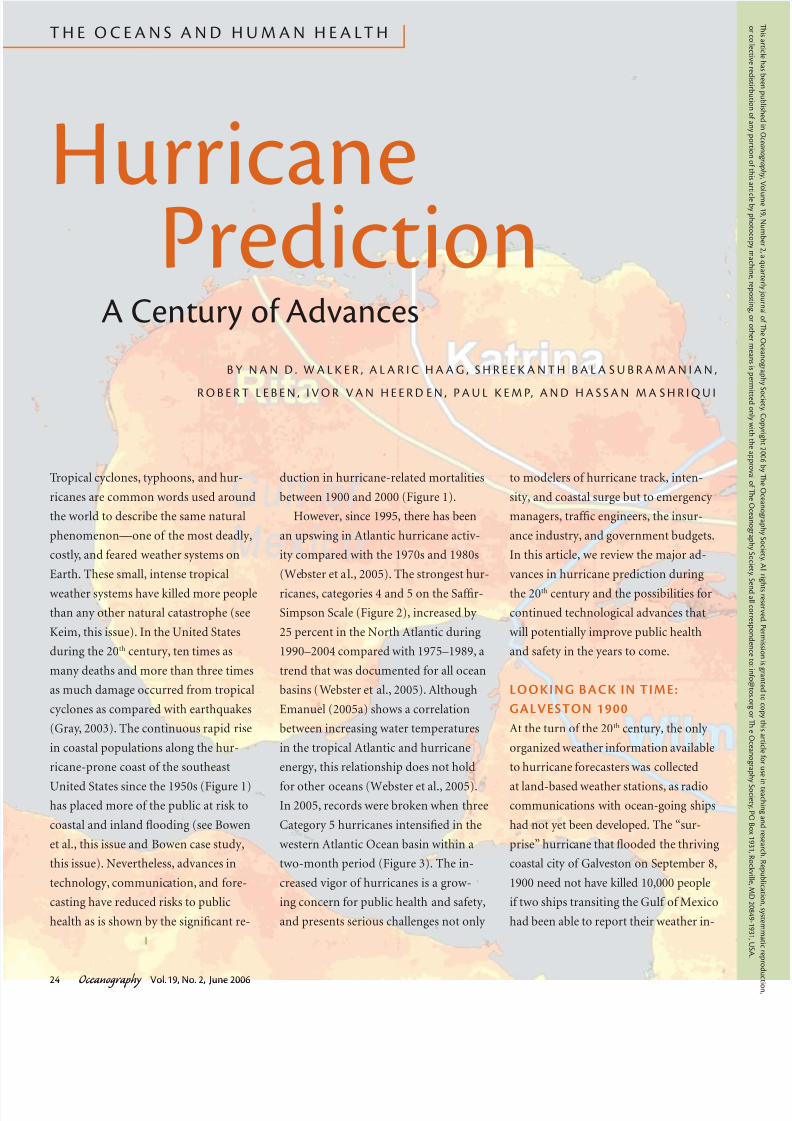
Left. Storm surge from Hurricane Carol lashes
Rhode Island Yacht Club in 1969. Photogra-
pher: Providence Journal Co. (Photo available
at http://www.photolib.noaa.gov/historic/
nws/wea00407.htm.) Below. Damage from the
Galveston Hurricane in September 1900—the
greatest natural disaster in terms of loss of life
in U.S. history. (Photo available at http://www.
photolib.noaa.gov/historic/nws/wea00589.htm.)
Oceanography Vol. 19, No. 2, June 2006 25
8/8/2019 Hurricane Prediction A Century of Advances
http://slidepdf.com/reader/full/hurricane-prediction-a-century-of-advances 3/13
Oceanography Vol. 19, No. 2, June 200626
formation to land-based hurricane fore-
casters (Frank, 2003; Emanuel, 2005b).
As early as September 4, Cuban me-
teorologists provided an accurate predic-
tion of the path of this hurricane based
on their observations as it tracked over
Cuba and their experience with former
hurricanes. Although the Cuban meteo-
rologists predicted that the hurricane
would move northwest across the Gulf of
Mexico, U.S. forecasters issued hurricane
warnings for the east coast of the Unit-
ed States, believing that the hurricane
would continue to turn north and then
northeast. Meanwhile, the weak hurri-
cane intensified rapidly over the eastern
and central Gulf, where the steamship
Louisiana recorded a pressure of 973 mb
with wind speeds of 100 mph (161 kph)
Nan D. Walker ([email protected]) is As-
sociate Professor and Director, Earth Scan
Laboratory, Department of Oceanography
and Coastal Sciences, Louisiana State Uni-
versity (LSU), Baton Rouge, LA, USA. Alaric
Haag is Systems Administrator, Coastal
Studies Institute Earth Scan Laboratory,
LSU, Baton Rouge, LA, USA. Shreekanth
Balasubramanian is Computer Analyst,
Coastal Studies Institute Earth Scan Labora-
tory, LSU, Baton Rouge, LA, USA. Robert
Leben is Professor, Colorado Center for
Astrodynamics Research, University of Colo-
rado, Boulder, CO, USA. Ivor van Heerden
is Associate Professor and Deputy Director,
LSU Hurricane Center, Department of Civiland Environmental Engineering, LSU, Baton
Rouge, LA, USA. Paul Kemp is Associate
Professor, School of the Coast and Environ-
ment, LSU, Baton Rouge, LA, USA. Hassan
Mashriqui is Assistant Professor, Depart-
ment of Civil and Environmental Engineer-
ing, LSU, Baton Rouge, LA, USA.
C o a s t a l
P o p u
l a t i o n
T e x a
s t o V i r g
i n i a
1900 1920 1940 1960 1980 20000 0
100
200
300
400
500
600
700
A v e r a g e D e a t h s P e r
Y e a r
5
10
15
20
25
30
35
P o p u l a t i o n ( m i l l i o
n s )
Year
Hurricane Mortality
Category CentralPressure
Winds (mph) Surge Damage
>18'18'
13'-18'3'-18'
9'-12''-12'
6'-8''-8'
4'-5''-5'
Catastrophicatastrophic
Extremextreme
Extensivextensive
Moderateoderate
Minimalinimal
>18'
13'-18'
9'-12'
6'-8'
4'-5'
Catastrophic
Extreme
Extensive
Moderate
Minimal
27.91-28.50
979-965
28.47-27.91
964-945
27.88-
27.17
944-
920
<27.17<920
28.94980
Millibars Inches
1
2
>155
3
4
5
131-155
111-130
96-110
74-95
Figure 1. Population growth along the southeast U.S. coastline compared with mor-
tality from hurricanes within the 20th century (modified from Willoughby [2003]).
Figure 2. Hurricane intensity is commonly rated using the Saffi r-Simpson scale where categories
1–5 provide information on central pressure, sustained maximum wind speed, storm surge, and
damage potential (courtesy of the National Hurricane Center; more information available at
http://www.nhc.noaa.gov).
Oceanography Vol. 19, No. 2, June 200626
8/8/2019 Hurricane Prediction A Century of Advances
http://slidepdf.com/reader/full/hurricane-prediction-a-century-of-advances 4/13
Oceanography Vol. 19, No. 2, June 2006 27
on September 6. Later, the steamship
Pensacola, bound for Galveston, was
thrashed by the developing hurricane.
These ships had no forewarning of
this extreme weather in the Gulf of
Mexico. Because they had no means of
communicating with land stations, their
much-needed information on the inten-sifying hurricane only reached U.S. me-
teorologists after they were safely in port
(Emanuel, 2005b). Forecasters at the U.S.
Weather Bureau Central Office in Wash-
ington, D.C. finally issued storm warn-
ings for the Gulf coast region when the
hurricane never materialized along the
coast of Florida or the Carolinas.
Meanwhile, along the Galveston
beaches, heavy breakers had developed,
which alerted the chief of the Galves-
ton weather office of a storm in the
Gulf, even before he received official
notification from the Washington, D.C.
office. No official hurricane warningwas released, however, and the city of
Galveston received a surprise assault
on the evening of September 8 when
it was quickly inundated by a 20-foot
(6.1-meter) storm surge and impacted
by enormous waves and winds near
140 mph (225 kph). Eventually, the death
toll was estimated at 8,000 to 12,000, and
the city of Galveston, built on a barrier
island only a few feet above sea level, suf-
fered nearly complete devastation (Lar-
son, 1999; Emanuel, 2005b).
TECHNOLOGICAL ADVANCES
DURING THE 20TH
CENTURY
Within a decade of the Galveston di-
saster, ships were instrumented with
radio communications that augmented
the sparse coverage from telegraphed
land stations (Willoughby, 2003). This
advance was particularly important be-
cause hurricanes form, intensify, and
Figure 3. Hurricanes Katrina, Rita, and Wilma developed in the western Atlantic Basin between 15°N and 25°N in a
broad region of relatively high (> 30°C ) sea surface temperatures (SSs) as is shown in this GOES-12 satellite composite
image for August 3–9, 2005 (see Walker et al., [2003] for methodology; real-time SS imagery is available at http://www.
esl.lsu.edu). Tese three Category 5 hurricanes, which were spawned all in the 2005 hurricane season, have raised con-
cerns about whether we are entering a period of increased hurricane frequency and intensity.
8/8/2019 Hurricane Prediction A Century of Advances
http://slidepdf.com/reader/full/hurricane-prediction-a-century-of-advances 5/13
Oceanography Vol. 19, No. 2, June 200628
spend most of their lives over the ocean.
In 1912, thirty ships steaming regularly
from New York to New Orleans began
sending weather observations twice daily
by wireless telegraph. Besides these ob-
servations from ocean-going vessels and
sporadic upper-air observations from
weather balloons beginning in the 1930s,
major advances in hurricane tracking
and prediction were not realized until
the early 1940s. Military operations dur-
ing World Wars I and II led to important
technological advances that spilled over
into the world of weather forecasting.
These advances brought forth improve-
ments in the detection, tracking, and
warning of hurricanes as well as the first
information on the internal structure
and development of tropical cyclones
(Rappaport and Simpson, 2003).
The two most important gifts to me-
teorology as fallout from wartime tech-
nology were the development of weather
RADAR and aircraft reconnaissance. The
RADAR (i.e., radio detection and rang-
ing) was developed in Great Britain after
World War I, yielding, in 1944, the first
view of the internal rain-band structure
within a hurricane. In 1943, Colonel
Joseph Duckworth and his navigator,
Lt. Ralph O’Hair, became the first to de-
liberately fly an aircraft into the eye of a
hurricane, near Galveston. This flight of
“curiosity” in a single-engine Air Force
AT-6 quickly led to the development of
a formal program (the following cycloneseason) of daily reconnaissance of Atlan-
tic hurricanes by both the U.S. Air Force
and Navy.
In 1943, Grady Norton, the first di-
rector of the newly established Miami
Hurricane Forecast Office, was greatly
concerned about predicting hurricane
landfall positions and understanding the
steering currents that he believed to con-
trol hurricane motion. His hypotheses
led to the “piggy-backing” of research
missions on hurricane reconnaissance
flights. In 1947, two missions were flown
into the Great Atlantic Hurricane of
September 15th, which eventually hit
New Orleans. These missions revealed
startling new discoveries on the internal
structure of the developing hurricane
and energy processes within the eye
(Rappaport and Simpson, 2003).
The invention of weather satellites in
the early 1960s rapidly solved the prob-
lems of hurricane detection and track-
ing, meaning that “surprise” hurricanes
were a problem of the past. The first
meteorological satellite sensors orbited
the poles, capturing data in the visible
and infrared wavelengths every six hours.
These data clearly revealed developing
storm systems in isolated ocean areas,
crude motion over time, and cloud-top
temperatures, which could be related to
hurricane strength. The next major ad-
vance in hurricane detection from space
occurred with the design and launch in
1966 of the first geostationary weather
satellite , ATS-1, carrying Professor Verner
Suomi’s famous spin-scan cloud imager
(Willoughby, 2003). These satellites, posi-
tioned over the equator, imaged the same
area of Earth every 20 minutes, providing
superior repeat coverage, so essential to
emergency-response activities.A major breakthrough in satellite me-
teorology is attributed to Vern Dvorak,
who designed a cloud-recognition tech-
nique for estimating the intensity of
tropical cyclones from satellite images
that has been broadly used by hurricane
forecasters around the world (Dvorak,
1975; Gray, 2003). More recently, his
techniques have been automated, adding
to the suite of satellite-based guidance
tools used by National Hurricane Center
(NHC) forecasters (Velden et al., 2003).
During the 1980s, image processing
and visualization systems proliferated,
and analysts and forecasters used them.
The NHC Director, Neil Frank, soon
introduced color-enhanced animated
movie loops of hurricane motion on
TV to educate and help warn the public
about approaching storms (Velden et al.,
2003). Satellite images and image anima-
tions have since become a staple on TV
weather broadcasts and on the World
Wide Web.
Hurricane-related applications for
the data from geostationary satellites
continued to grow with the launch of
GOES-I , the first of a new generation of
geostationary operational environmental
satellites covering the tropical Atlantic
and Pacific Oceans (Menzel and Purdom,
1994). Weather processes over the entire
globe are now under constant surveil-
lance using geostationary satellites. In
rapid-scan mode, satellite measurements
of cloud-top temperatures and atmo-
spheric water vapor are available every
few minutes and from which wind speed
and direction at the upper levels of the
atmosphere can now be determined by
tracking cloud and water-vapor features
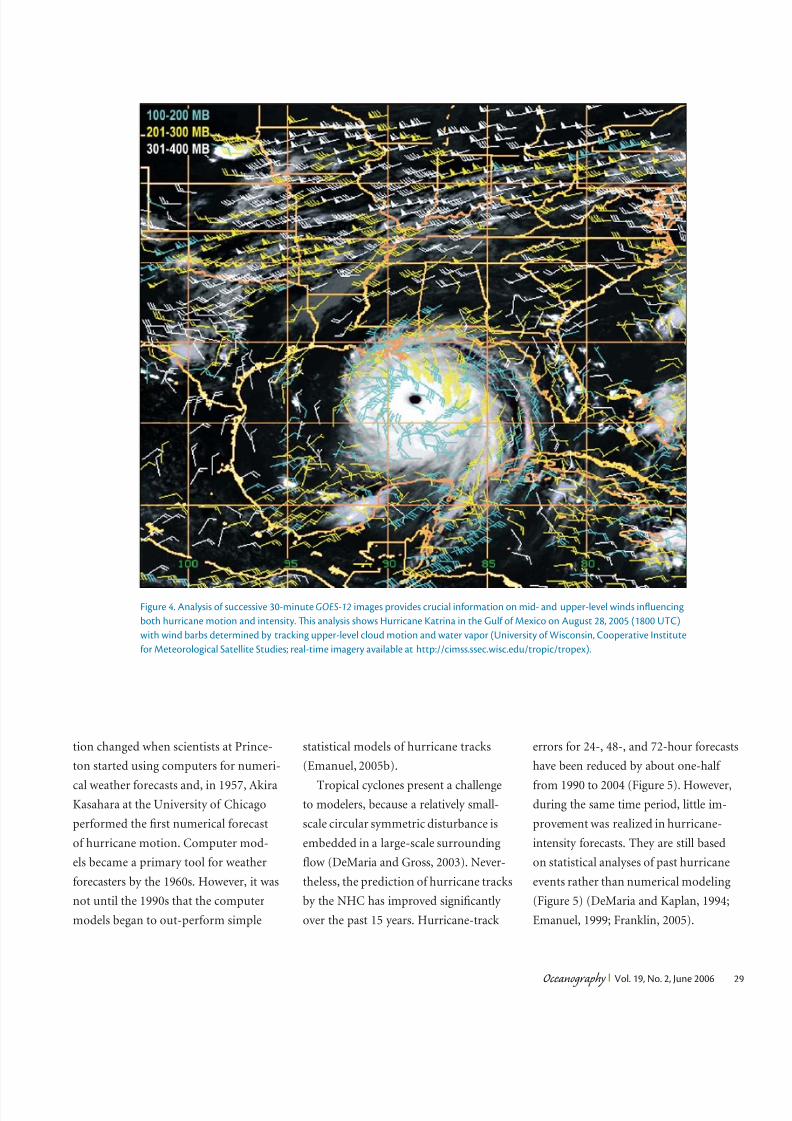
over remote ocean areas (Figure 4). These
satellite measurements are of particularvalue over remote ocean areas where at-
mospheric-profile data are unavailable.
FORECASTING HURRICANE
TRACKS AND WIND INTENSITY
Until the late 1950s, forecasting was
largely a subjective exercise. This situa-
8/8/2019 Hurricane Prediction A Century of Advances
http://slidepdf.com/reader/full/hurricane-prediction-a-century-of-advances 6/13
Oceanography Vol. 19, No. 2, June 2006 29
Figure 4. Analysis of successive 30-minute GOES-12 images provides crucial information on mid- and upper-level winds influencing
both hurricane motion and intensity. Tis analysis shows Hurricane Katrina in the Gulf of Mexico on August 28, 2005 (1800 UC)
with wind barbs determined by tracking upper-level cloud motion and water vapor (University of Wisconsin, Cooperative Institute
for Meteorological Satellite Studies; real-time imagery available at http://cimss.ssec.wisc.edu/tropic/tropex).
tion changed when scientists at Prince-
ton started using computers for numeri-
cal weather forecasts and, in 1957, AkiraKasahara at the University of Chicago
performed the first numerical forecast
of hurricane motion. Computer mod-
els became a primary tool for weather
forecasters by the 1960s. However, it was
not until the 1990s that the computer
models began to out-perform simple
statistical models of hurricane tracks
(Emanuel, 2005b).
Tropical cyclones present a challengeto modelers, because a relatively small-
scale circular symmetric disturbance is
embedded in a large-scale surrounding
flow (DeMaria and Gross, 2003). Never-
theless, the prediction of hurricane tracks
by the NHC has improved significantly
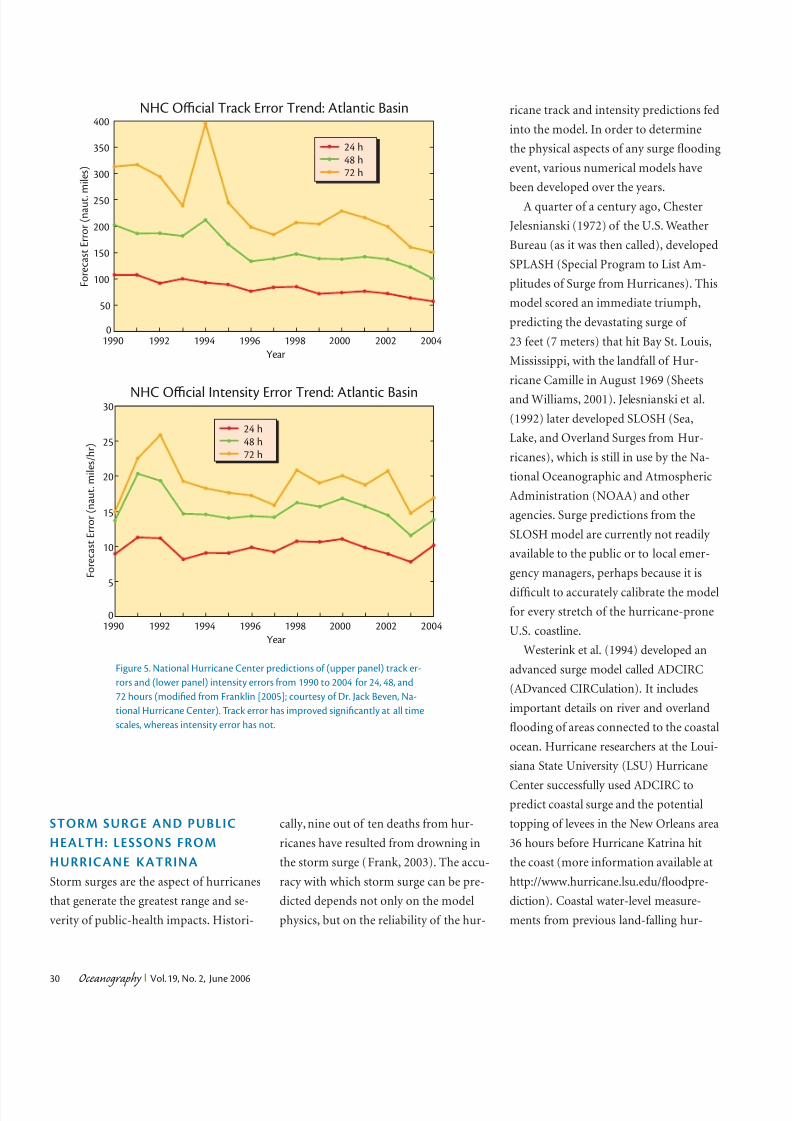
over the past 15 years. Hurricane-track
errors for 24-, 48-, and 72-hour forecasts
have been reduced by about one-half
from 1990 to 2004 (Figure 5). However,during the same time period, little im-
provement was realized in hurricane-
intensity forecasts. They are still based
on statistical analyses of past hurricane
events rather than numerical modeling
(Figure 5) (DeMaria and Kaplan, 1994;
Emanuel, 1999; Franklin, 2005).
8/8/2019 Hurricane Prediction A Century of Advances
http://slidepdf.com/reader/full/hurricane-prediction-a-century-of-advances 7/13
Oceanography Vol. 19, No. 2, June 200630
400
350
300
250
200
150
100
50
01990 1992 1994 1996 1998 2000 2002 2004
F o r e c a s t E r r o r ( n a u t .
m i l e s )
Year
NHC Official rack Error rend: Atlantic Basin
24 h48 h72 h
1990 1992 1994 1996 1998 2000 2002 2004
Year
0
5
10
15
20
25
30NHC Official Intensity Error rend: Atlantic Basin
24 h48 h72 h
F o r e c a s t E r r o r ( n a u t . m i l e s / h r )
Figure 5. National Hurricane Center predictions of (upper panel) track er-
rors and (lower panel) intensity errors from 1990 to 2004 for 24, 48, and
72 hours (modified from Franklin [2005]; courtesy of Dr. Jack Beven, Na-
tional Hurricane Center). rack error has improved significantly at all time
scales, whereas intensity error has not.
STORM SURGE AND PUBLIC
HEALTH: LESSONS FROM
HURRICANE KATRINA
Storm surges are the aspect of hurricanes
that generate the greatest range and se-
verity of public-health impacts. Histori-
cally, nine out of ten deaths from hur-
ricanes have resulted from drowning in
the storm surge (Frank, 2003). The accu-
racy with which storm surge can be pre-
dicted depends not only on the model
physics, but on the reliability of the hur-
ricane track and intensity predictions fed
into the model. In order to determine
the physical aspects of any surge flooding
event, various numerical models have
been developed over the years.
A quarter of a century ago, Chester
Jelesnianski (1972) of the U.S. Weather
Bureau (as it was then called), developed
SPLASH (Special Program to List Am-
plitudes of Surge from Hurricanes). This
model scored an immediate triumph,
predicting the devastating surge of
23 feet (7 meters) that hit Bay St. Louis,
Mississippi, with the landfall of Hur-
ricane Camille in August 1969 (Sheets
and Williams, 2001). Jelesnianski et al.
(1992) later developed SLOSH (Sea,
Lake, and Overland Surges from Hur-
ricanes), which is still in use by the Na-
tional Oceanographic and Atmospheric
Administration (NOAA) and other
agencies. Surge predictions from the
SLOSH model are currently not readily
available to the public or to local emer-
gency managers, perhaps because it is
difficult to accurately calibrate the model
for every stretch of the hurricane-prone
U.S. coastline.
Westerink et al. (1994) developed an
advanced surge model called ADCIRC
(ADvanced CIRCulation). It includes
important details on river and overland
flooding of areas connected to the coastal
ocean. Hurricane researchers at the Loui-
siana State University (LSU) Hurricane
Center successfully used ADCIRC topredict coastal surge and the potential
topping of levees in the New Orleans area
36 hours before Hurricane Katrina hit
the coast (more information available at
http://www.hurricane.lsu.edu/floodpre-
diction). Coastal water-level measure-
ments from previous land-falling hur-
8/8/2019 Hurricane Prediction A Century of Advances
http://slidepdf.com/reader/full/hurricane-prediction-a-century-of-advances 8/13
Oceanography Vol. 19, No. 2, June 2006 31
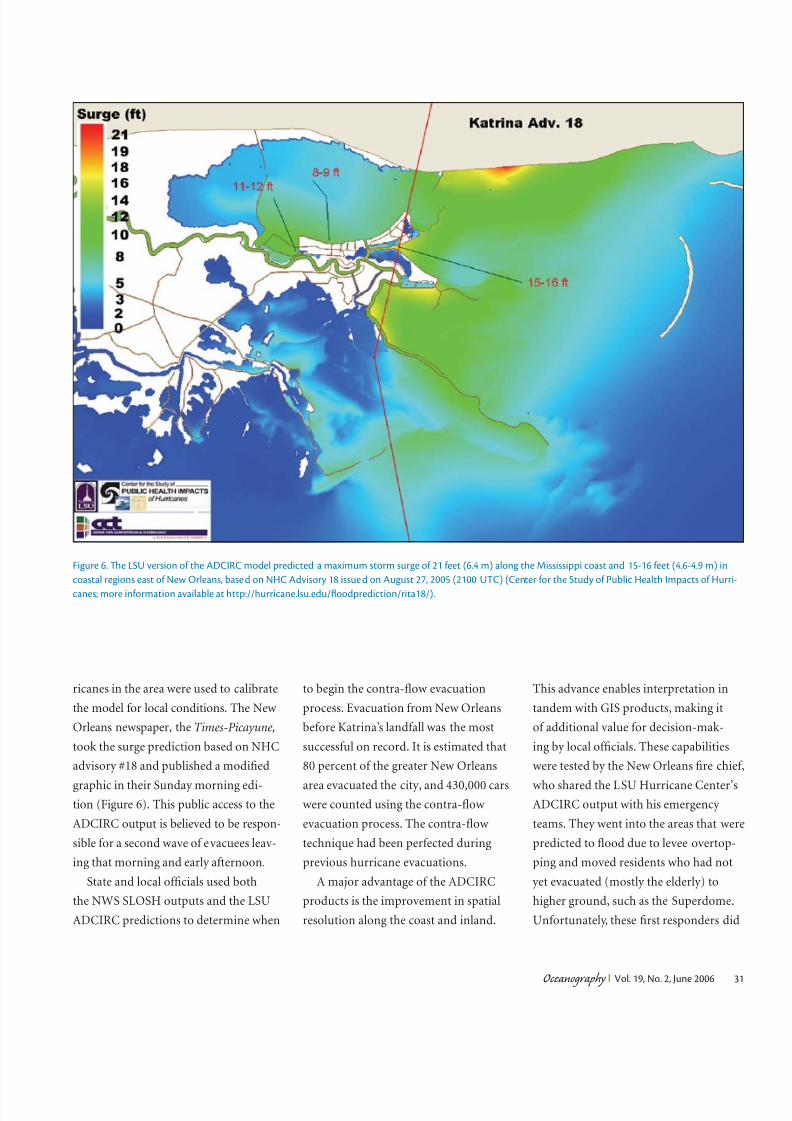
ricanes in the area were used to calibrate
the model for local conditions. The New
Orleans newspaper, the Times-Picayune,
took the surge prediction based on NHC
advisory #18 and published a modified
graphic in their Sunday morning edi-tion (Figure 6). This public access to the
ADCIRC output is believed to be respon-
sible for a second wave of evacuees leav-
ing that morning and early afternoon.
State and local officials used both
the NWS SLOSH outputs and the LSU
ADCIRC predictions to determine when
to begin the contra-flow evacuation
process. Evacuation from New Orleans
before Katrina’s landfall was the most
successful on record. It is estimated that
80 percent of the greater New Orleans
area evacuated the city, and 430,000 carswere counted using the contra-flow
evacuation process. The contra-flow
technique had been perfected during
previous hurricane evacuations.
A major advantage of the ADCIRC
products is the improvement in spatial
resolution along the coast and inland.
This advance enables interpretation in
tandem with GIS products, making it
of additional value for decision-mak-
ing by local officials. These capabilities
were tested by the New Orleans fire chief
who shared the LSU Hurricane Center’sADCIRC output with his emergency
teams. They went into the areas that were
predicted to flood due to levee overtop-
ping and moved residents who had not
yet evacuated (mostly the elderly) to
higher ground, such as the Superdome.
Unfortunately, these first responders did
Figure 6. Te LSU version of the ADCIRC model predicted a maximum storm surge of 21 feet (6.4 m) along the Mississippi coast and 15-16 feet (4.6-4.9 m) in
coastal regions east of New Orleans, based on NHC Advisory 18 issued on August 27, 2005 (2100 UC) (Center for the Study of Public Health Impacts of Hurri-
canes; more information available at http://hurricane.lsu.edu/floodprediction/rita18/).
8/8/2019 Hurricane Prediction A Century of Advances
http://slidepdf.com/reader/full/hurricane-prediction-a-century-of-advances 9/13
Oceanography Vol. 19, No. 2, June 200632
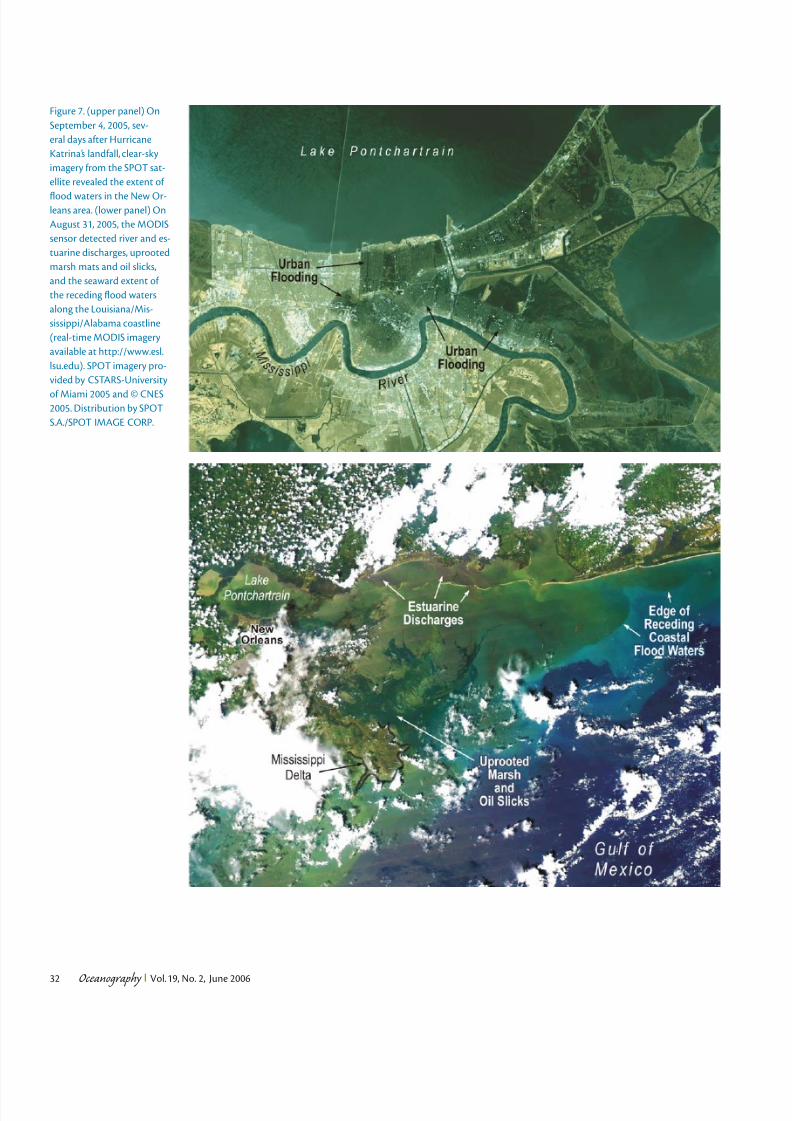
Figure 7. (upper panel) On
September 4, 2005, sev-
eral days after Hurricane
Katrina’s landfall, clear-sky
imagery from the SPO sat-
ellite revealed the extent of
flood waters in the New Or-leans area. (lower panel) On
August 31, 2005, the MODIS
sensor detected river and es-
tuarine discharges, uprooted
marsh mats and oil slicks,
and the seaward extent of
the receding flood waters
along the Louisiana/Mis-
sissippi/Alabama coastline
(real-time MODIS imagery
available at http://www.esl.
lsu.edu). SPO imagery pro-
vided by CSARS-University
of Miami 2005 and © CNES2005. Distribution by SPO
S.A./SPO IMAGE CORP.
8/8/2019 Hurricane Prediction A Century of Advances
http://slidepdf.com/reader/full/hurricane-prediction-a-century-of-advances 10/13
Oceanography Vol. 19, No. 2, June 2006 33
not realize that the dome surroundings
would eventually flood due to the nu-
merous levee breaks that characterized
this catastrophe.
Two days after Hurricane Katrina hit,
approximately 80 percent of greater New
Orleans was under water, which in some
areas exceeded 12 feet (3.66 m) in depth.
The extent of flood waters in New Or-
leans was imaged by the SPOT (Satellite
Pour l’Observation de la Terre) satellite
on several successive days (Figure 7).
The receding floodwaters were detect-
able along the coast within a few days of
the catastrophe. Various water masses
were revealed by MODIS (Moderate
Resolution Imaging Spectroradiometer)
true-color imagery, including discharge
from flooded rivers and an expansive
mass of discolored water extending from
Gulf Shores, Alabama to the mouth of
the Mississippi River (Figure 7). Reports
from aircraft observers indicated that
marsh debris and surface oil slicks were
in abundance in coastal waters (see Pine,
this issue). A few weeks after the flood
waters were pumped from New Orleans,
Hurricane Rita re-flooded many coastal
lakes and bays.
FUTURE FORECASTING
AVENUES AND CHALLENGES
The very active hurricane season of 2005
should act as a catalyst to stimulate fur-
ther advances in hurricane forecasts,
especially the predictions of hurricaneintensity, which have lagged far behind
the hurricane-track predictions. The in-
tensity forecast is of great importance to
the prediction of maximum surge along
the coast. A focus on understanding and
forecasting the development of strong
hurricanes (i.e., above Category 2)
would be of particular benefit to public
health and safety because it is the stron-
gest hurricanes that produce most of
the damage, both from wind and coastal
flooding. During the 1900 to 1990 peri-
od, Category 3, 4 and 5 land-falling hur-
ricanes accounted for 86 percent of the
total damage (Gray, 2003).
Emanuel (1999) provides hope that
hurricane intensity can be forecast using
simple models, given an accurate forecast
of the hurricane’s track and information
on a limited number of controlling fac-
tors. These factors include the storm’s
initial intensity, atmospheric conditions
along its path, and heat exchange with
the upper layer of the ocean. Many of the
essential atmospheric and oceanic mea-
surements are already available from the
current suite of Earth-observing satel-
lites. In terms of atmospheric conditions,
real-time updates of satellite-derived
winds have reduced forecast errors in
numerical models of hurricane motion
(Goerss et al., 1998; Velden et al., 1998;
Soden et al., 2001; Velden et al., 2003).
These data, in tandem with advances in
satellite observations of the upper ocean,
may provide the initial measurements
necessary for advancing the development
of numerical models for hurricane in-
tensity prediction.
Hurricanes Katrina and Rita provided
two vivid examples of how oceanic heat
content can fuel rapid hurricane intensi-
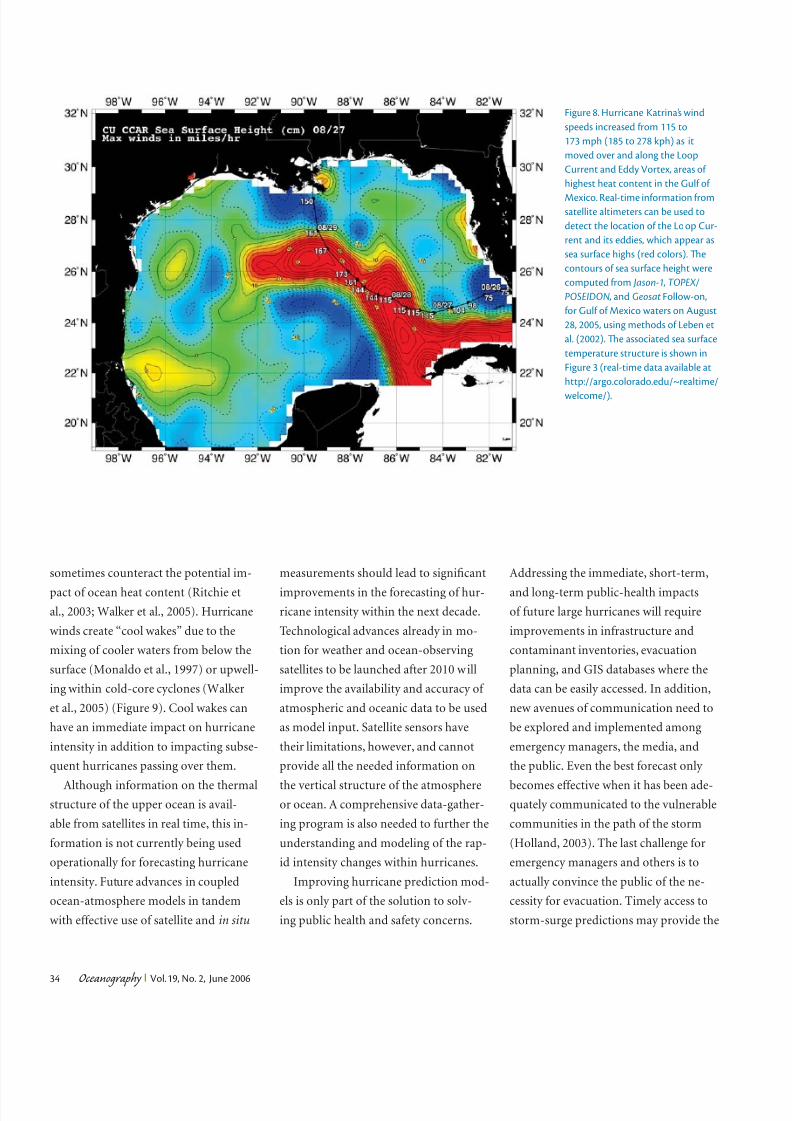
fication. Both Katrina and Rita were rela-tively weak hurricanes (Category 2) until
they moved over Loop Current waters in
the Gulf of Mexico, where they rapidly
became Category 5 monsters (Figure 8).
The Loop Current is the Gulf of Mexico
portion of an enormous moving mass
of warm water, which enters the Gulf
from the Caribbean Sea and eventually
forms the Gulf Stream off the U.S. East
Coast. The complete circulation of this
important current encompasses much
of the North Atlantic Ocean and the Ca-
ribbean Sea from the surface ocean to
several hundred meters in water depth.
Although scientists have used satellite
data to routinely and accurately measure
sea surface temperatures (SST) since the
early 1980s, locating the Loop Current
from SST data is not always possible dur-
ing hurricane season because the sur-
rounding Gulf of Mexico surface waters
are equally warm, typically 29°–31°C.
In the summer, scientists rely on sat-
ellites that measure sea surface height
(SSH) to locate the high-heat-content
“hot spots,” where hurricanes are likely
to intensify (Figure 8). Relatively small
changes in satellite-measured SSH
(< 100 cm) equate to large differences in
potential heat, which can fuel a develop-
ing hurricane. Surface-water tempera-
tures exceeding 26°C are essential for
development and maintenance of hur-
ricanes. Within the Loop Current and
its warm eddies during summer, water
temperatures exceed 26°C to a depth of
100 m or more, whereas outside of the
current, the layer of warm water is only
50 m or so deep (Goni and Trinanes,
2003). This difference impacts the avail-
able heat that can be transferred to the
hurricane through evaporation.
Although hurricane strengtheninghas been previously documented and
modeled over the high-heat-content
Loop Current waters (Shay et al., 2000;
Emanuel, 2005b), other factors such as
upper-level winds and large cold water
upwelling along the hurricane path also
impact hurricane-intensity changes and
8/8/2019 Hurricane Prediction A Century of Advances
http://slidepdf.com/reader/full/hurricane-prediction-a-century-of-advances 11/13
Oceanography Vol. 19, No. 2, June 200634
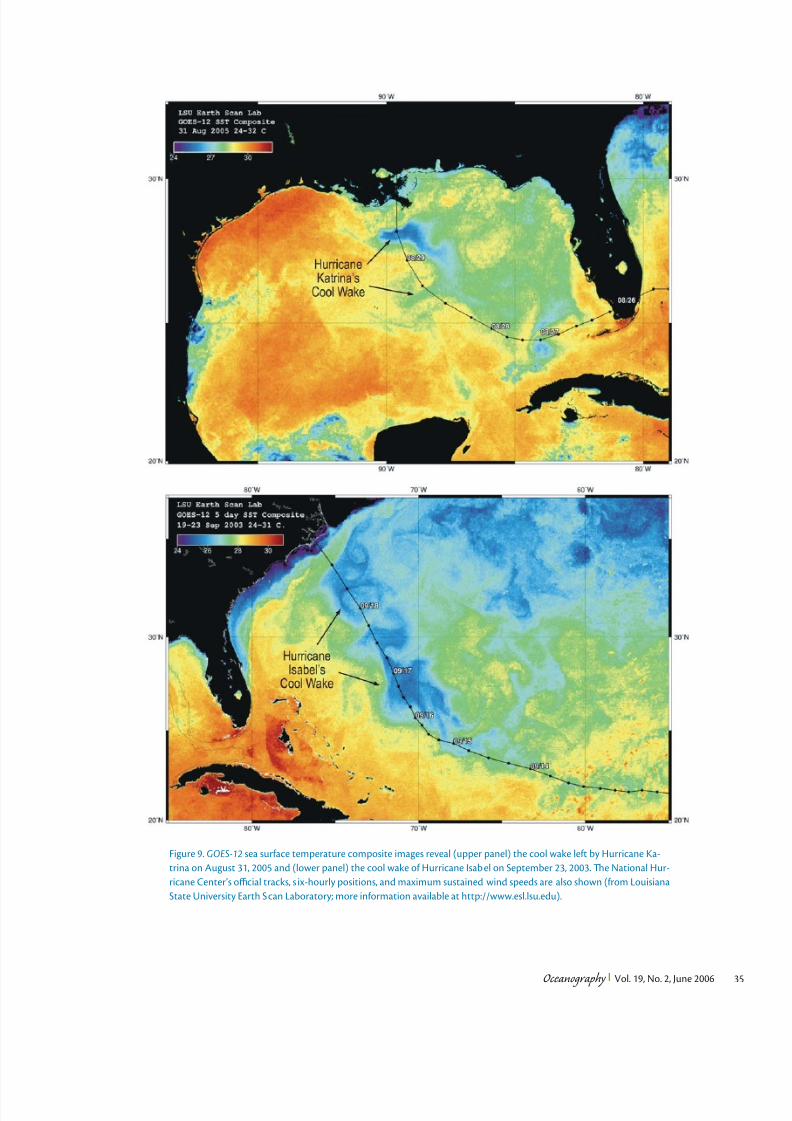
sometimes counteract the potential im-
pact of ocean heat content (Ritchie et
al., 2003; Walker et al., 2005). Hurricane
winds create “cool wakes” due to the
mixing of cooler waters from below the
surface (Monaldo et al., 1997) or upwell-
ing within cold-core cyclones (Walker
et al., 2005) (Figure 9). Cool wakes can
have an immediate impact on hurricane
intensity in addition to impacting subse-
quent hurricanes passing over them.
Although information on the thermalstructure of the upper ocean is avail-
able from satellites in real time, this in-
formation is not currently being used
operationally for forecasting hurricane
intensity. Future advances in coupled
ocean-atmosphere models in tandem
with effective use of satellite and in situ
measurements should lead to significant
improvements in the forecasting of hur-
ricane intensity within the next decade.
Technological advances already in mo-
tion for weather and ocean-observing
satellites to be launched after 2010 will
improve the availability and accuracy of
atmospheric and oceanic data to be used
as model input. Satellite sensors have
their limitations, however, and cannot
provide all the needed information on
the vertical structure of the atmosphereor ocean. A comprehensive data-gather-
ing program is also needed to further the
understanding and modeling of the rap-
id intensity changes within hurricanes.
Improving hurricane prediction mod-
els is only part of the solution to solv-
ing public health and safety concerns.
Addressing the immediate, short-term,
and long-term public-health impacts
of future large hurricanes will require
improvements in infrastructure and
contaminant inventories, evacuation
planning, and GIS databases where the
data can be easily accessed. In addition,
new avenues of communication need to
be explored and implemented among
emergency managers, the media, and
the public. Even the best forecast only
becomes effective when it has been ade-quately communicated to the vulnerable
communities in the path of the storm
(Holland, 2003). The last challenge for
emergency managers and others is to
actually convince the public of the ne-
cessity for evacuation. Timely access to
storm-surge predictions may provide the
Figure 8. Hurricane Katrina’s wind
speeds increased from 115 to
173 mph (185 to 278 kph) as it
moved over and along the Loop
Current and Eddy Vortex, areas of
highest heat content in the Gulf of
Mexico. Real-time information fromsatellite altimeters can be used to
detect the location of the Loop Cur-
rent and its eddies, which appear as
sea surface highs (red colors). Te
contours of sea surface height were
computed from Jason-1 , TOPEX/
POSEIDON , and Geosat Follow-on,
for Gulf of Mexico waters on August
28, 2005, using methods of Leben et
al. (2002). Te associated sea surface
temperature structure is shown in
Figure 3 (real-time data available at
http://argo.colorado.edu/~realtime/
welcome/).
8/8/2019 Hurricane Prediction A Century of Advances
http://slidepdf.com/reader/full/hurricane-prediction-a-century-of-advances 12/13
Oceanography Vol. 19, No. 2, June 2006 35
Figure 9. GOES-12 sea surface temperature composite images reveal (upper panel) the cool wake left by Hurricane Ka-
trina on August 31, 2005 and (lower panel) the cool wake of Hurricane Isabel on September 23, 2003. Te National Hur-
ricane Center’s offi cial tracks, s ix-hourly positions, and maximum sustained wind speeds are also shown (from Louisiana
State University Earth Scan Laboratory; more information available at http://www.esl.lsu.edu).
8/8/2019 Hurricane Prediction A Century of Advances
http://slidepdf.com/reader/full/hurricane-prediction-a-century-of-advances 13/13
most effective means of motivating the
public to evacuate, especially given the
extreme and long-lived flooding of New
Orleans after Hurricane Katrina’s land-
fall in 2005.
ACKNOWLEDGEMENTS
Funding was provided by the Louisi-
ana Board of Regents Millennium Trust
Health Excellence Fund, Contract HEF
(2001-06) -01, the Minerals Manage-
ment Service-LSU Coastal Marine In-
stitute Cooperative Agreement 1435-
01-00-CA-30951/85247, and NASA
HBCU NCC13-03001. Mary Lee Eggart
and Clifford Duplechin are thanked
for cartographic assistance. Sait Ahmet
Binsalam is thanked for producing the
storm-surge graphic. Earth Scan Labora-
tory students and staff are acknowledged
for assisting in image processing.
REFERENCES
DeMaria, M., and J. Kaplan. 1997. An operational
evaluation of a statistical hurricane intensity
prediction scheme (SHIPS). Reprints of the
22nd Conference on Hurricanes and Tropical
Meteorology. American Meteorological Society,
Boston, 280–281.
DeMaria, M., and J.M. Gross. 2003. Evolution of
Prediction Models. In: Hurricanes! Coping with
Disaster , R. Simpson, ed. American Geophysical
Union, Washington, D.C., 10.1029/055SP02.
Dvorak, V. 1975. Tropical cyclone intensity analysis
and forecasting from satellite imagery. Monthly
Weather Review 103:420–430.
Emanuel, K.A. 1999. Thermodynamic control of
hurricane intensity. Nature 401:665–669.
Emanuel, K.A. 2005a. Increasing destructiveness of
tropical cyclones over the past 30 years. Nature
436:686–688.
Emanuel, K.A. 2005b. Divine Wind: The History
and Science of Hurricanes. Oxford University
Press. Inc., New York, NY, 285 pp.
Frank, N.L. 2003. The great Galveston Hurricane
of 1900. In: Hurricanes! Coping with Disaster,
R. Simpson, ed., American Geophysical Union,
Washington, D.C. 10.1029/055SP02.
Franklin, J.L. 2005. A verification of National Hur-
ricane Center Tropical Cyclone Forecasts in
2004. Shore and Beach 73:25–28.
Goni, G.J., and J.A. Trinanes. 2003. Ocean thermal
structure monitoring could aid in the intensity
forecast of tropical cyclones. EOS Transactions
84:573–580.
Goerss, J.S., C.S. Velden, and J.D. Hawkins. 1998.
The impact of multispectral GOES-8 windinformation on Atlantic tropical cyclone track
forecasting in 1995. Part II. NOGAPS Forecasts.
Monthly Weather Review 126:1,219–1,227.
Gray, W.M. 2003. Twentieth century challenges
and milestones. In: Hurricanes! Coping with
Disaster,.R. Simpson, ed. American Geophysical
Union, Washington, D.C. 10.1029/055SP02.
Holland, G. 2003. A century after Galveston, 1900.
2003. In: Hurricanes! Coping with Disaster,.R.
Simpson, ed., American Geophysical Union,
Washington, D.C. 10.1029/055SP02.
Jelesnianski, C.P. 1972. SPLASH (Special Program
to List Amplitudes of Surges from Hurricanes)
I. Landfall Storms, NOAA Technical Memoran-dum NWS TDL-46 . National Weather Service
Systems Development Office, Silver Spring, MD,
56 pp.
Jelesnianski, C.P., J. Chen and W.A. Shaffer. 1992.
SLOSH: Sea, Lake, and Overland Surges from
Hurricanes. NOAA Technical Report NWS 48.
National Weather Service, Silver Spring, MD,
71 pp.
Larson, E. 1999. Isaac’s Storm. Crown Publishing
Group Toronto, Canada, 352 pp.
Leben. R.R., G.H. Born, and B.R. Engebreth. 2002.
Operational altimeter data processing for meso-
scale monitoring. Marine Geodesy 25:3–18.
Menzel, P.W., and J.F.W. Purdom. 1994. Introduc-ing GOES-I: The first of a new generation of
Geostationary Operational Environmental
Satellites. Bulletin of the American Meteorologi-
cal Society 75:757–781.
Monaldo, F.M., T.D. Sikora, S.M. Babin, and R.E.
Sterner. 1997. Satellite imagery of sea surface
temperature cooling in the wake of Hurricane
Edouard (1996). Monthly Weather Review
125:2,716–2,721.
Rappaport, E.N., and R.H. Simpson. 2003. Impact
of technologies from two world wars. In: Hur-
ricanes! Coping with Disaster, R. Simpson, ed.
American Geophysical Union, Washington,
D.C., 10.1029/055SP02.Ritchie, E.A., J. Simpson, W.T. Liu, J. Halverson, C.
Velden, K.F. Brueske, and H. Pierce. 2003. In:
Hurricanes! Coping with Disaster, R. Simpson,
ed. American Geophysical Union, Washington,
D.C., 10.1029/055SP02.
Shay, L.K., G.G. Goni, and P.G. Black. 2000. Effects
of a warm oceanic feature on Hurricane Opal.
Monthly Weather Review 128:1,366–1,383.
Sheets, B., and J. Williams. 2001. Hurricane-Watch:
Forecasting the Deadliest Storms on Earth. Vin-
tage Books, New York, NY.
Sodden, B.J., C.S. Velden, and R.E. Tuleya. 2001.
The impact of satellite winds on experimen-
tal GFDL hurricane model forecasts. Monthly
Weather Review 129:835–852.
Velden, C.S., T.L. Olander, and R.M. Zehr. 1998.
Development of an objective scheme to esti-mate tropical cyclone intensity from digital
geostationary satellite infrared imagery. Weather
and Forecasting 13:172–186.
Velden, C., J. Simpson, W. Liu, J. Hawkins, K.
Brueske, and R. Anthes. 2003. The burgeoning
role of weather satellites. 2003. In: Hurricanes!
Coping with Disaster, R. Simpson, ed. Ameri-
can Geophysical Union, Washington, D.C.,
10.1029/055SP02.
Walker, N., S. Myint, A. Babin, and J. Haag. 2003.
Advances in satellite radiometry for the surveil-
lance of surface temperatures, ocean eddies and
upwelling processes in the Gulf of Mexico using
GOES-8 measurements during summer Geo- physical Research Letters 30(1854), doi:10.1029/
2003GL017555.
Walker, N.D., R.R. Leben, and S. Balasubramanian.
2005. Hurricane-forced upwelling and chloro-
phyll a enhancement within cold-core cyclones
in the Gulf of Mexico. Geophysical Research Let-
ters 32, L18610, doi:101029/2005GL023716.
Webster, P.J., G.J. Holland, J.A. Curry, and H.-R.
Chang. 2005. Changes in tropical cyclone num-
ber, duration, and intensity in a warming envi-
ronment. Science 309:1,844–1,846.
Westerink, J.J., R.A. Luettich, Jr., and J. Muccino.
1994. Modeling tides in the western North At-
lantic using unstructured graded grids. Tellus 46a:178–199.
Willoughby, H.E. 2003. A century of progress in
tracking and warning. In: Hurricanes! Cop-
ing with Disaster, R. Simpson, ed. Ameri-
can Geophysical Union, Washington, D.C.
10.1029/055SP02.