Embed Size (px)
Citation preview
JANUARY 23, 2018
HURRICANE HARVEY DATA CALL
TEXAS DEPARTMENT OF INSURANCE
PRESENTATION TO THE SENATE BUSINESS AND
COMMERCE COMMITTEE
HURRICANE HARVEY DATA CALL TDI PRESENTATION TO THE SENATE BUSINESS AND COMMERCE COMMITTEE
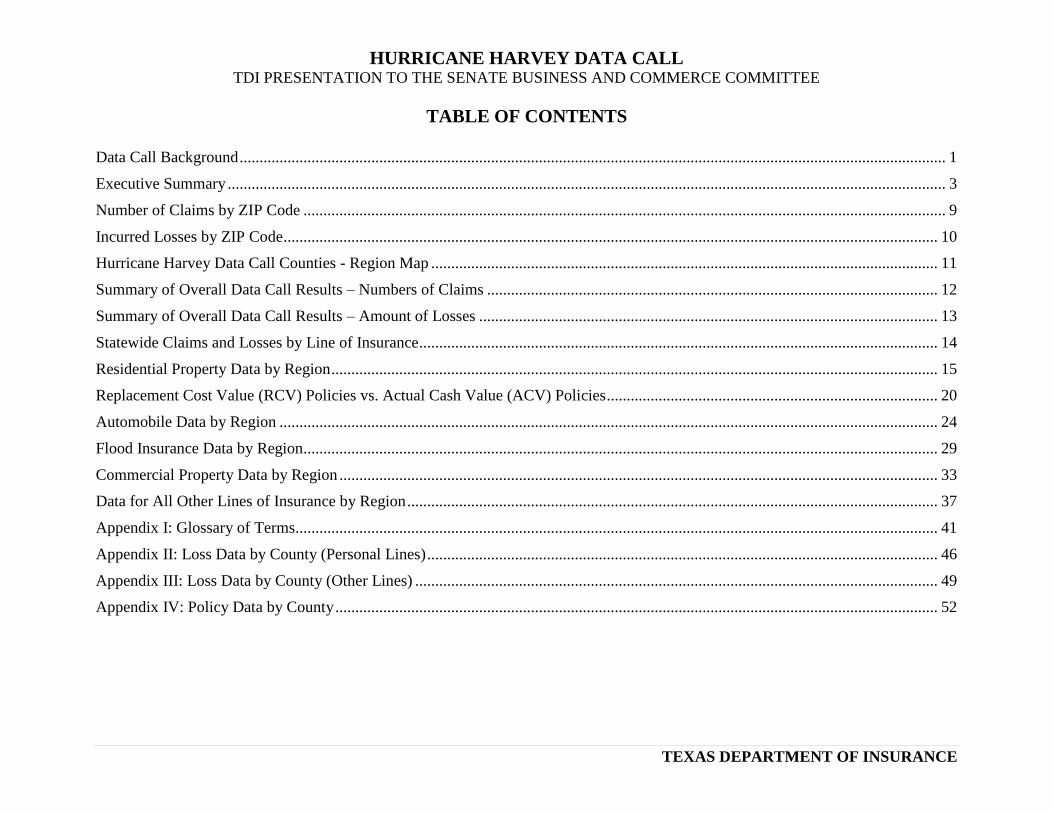
TABLE OF CONTENTS
TEXAS DEPARTMENT OF INSURANCE
Data Call Background ................................................................................................................................................................................. 1
Executive Summary .................................................................................................................................................................................... 3
Number of Claims by ZIP Code ................................................................................................................................................................. 9
Incurred Losses by ZIP Code .................................................................................................................................................................... 10
Hurricane Harvey Data Call Counties - Region Map ............................................................................................................................... 11
Summary of Overall Data Call Results – Numbers of Claims ................................................................................................................. 12
Summary of Overall Data Call Results – Amount of Losses ................................................................................................................... 13
Statewide Claims and Losses by Line of Insurance .................................................................................................................................. 14
Residential Property Data by Region ........................................................................................................................................................ 15
Replacement Cost Value (RCV) Policies vs. Actual Cash Value (ACV) Policies ................................................................................... 20
Automobile Data by Region ..................................................................................................................................................................... 24
Flood Insurance Data by Region............................................................................................................................................................... 29
Commercial Property Data by Region ...................................................................................................................................................... 33
Data for All Other Lines of Insurance by Region ..................................................................................................................................... 37
Appendix I: Glossary of Terms ................................................................................................................................................................. 41
Appendix II: Loss Data by County (Personal Lines) ................................................................................................................................ 46
Appendix III: Loss Data by County (Other Lines) ................................................................................................................................... 49
Appendix IV: Policy Data by County ....................................................................................................................................................... 52
Hurricane Harvey Data Call TDI Presentation to the Senate Business and Commerce Committee
1
Texas Department of Insurance
Data Call Background
On August 25, 2017, Hurricane Harvey made landfall near Rockport as a Category 4 hurricane with maximum sustained winds of 130 m.p.h.
Hurricane Harvey then moved inland over Texas, stalled, headed back over the Gulf of Mexico, and on August 30, 2017, made another landfall in
Western Louisiana as a tropical storm. In addition to damage in the Coastal Bend region and south Central Texas caused by Hurricane Harvey’s
storm surge and hurricane-force winds, Harvey’s rains caused extensive catastrophic flooding in south Central Texas, the greater Houston
metropolitan area, and Southeast Texas.
Immediately after landfall, the Texas Department of Insurance (TDI) hosted Texas State Disaster Coalition conference calls with the industry about
Hurricane Harvey responses. On August 31, TDI notified the industry that a data call would be issued to collect data from insurers about the
financial impact of Hurricane Harvey, to monitor the market in terms of claims handling, and to provide aggregate data to policymakers and public
officials.
TDI issued the Hurricane Harvey data call on September 21. All companies, including admitted and surplus lines companies, the Texas Windstorm
Insurance Association (TWIA), and the Texas Fair Access to Insurance Requirements Plan (FAIR Plan) were required to report monthly beginning
with data through September 30, which was due October 31. Thereafter, the data call required companies to report data for the previous month on
the 15th of the following month.
The data call required companies to report by ZIP code: the number of reported claims, the number of claims closed with payment (paid claims),
the number of claims closed without payment, the number of reopened claims, the number of claims with total losses, the total amount of paid
losses, and the total amount of claim reserves. The data call required that companies report this data separately for following types of insurance:
homeowners, residential dwelling, mobile homeowners, farmowners, businessowners, the business interruption portion of commercial property, all
other commercial property, personal automobile, commercial automobile, federal flood – Write Your Own,1 private flood, and all other lines of
insurance. In addition, the data call required insurers to provide statewide estimates of their ultimate Hurricane Harvey losses both before and after
reinsurance.
About 850 companies responded to the data call, with about 545 companies submitting data for the first submission. These companies represent
about 98 percent of the total property and automobile market in Texas.
1 Data for federal flood insurance only includes data reported by private insurers selling federal flood through the “Write Your Own” federal flood program. It does not include
claims for flood insurance policies written directly by National Flood Insurance Program.
Hurricane Harvey Data Call TDI Presentation to the Senate Business and Commerce Committee
2
Texas Department of Insurance
Data Call Challenges TDI has checked the data for reasonability in the aggregate at the ZIP code level, but TDI did not audit or verify the data because this is outside the
normal practice for data calls and would have required TDI to perform on-site reviews of insurers' books and records. As of December 26, 2017,
there are still a number of unresolved data anomalies at the ZIP code level that TDI is attempting to resolve with the companies. These anomalies
mostly affect the “unknown” ZIP code region.
TDI had difficulty obtaining information from some companies on insurers’ estimated ultimate Hurricane Harvey losses both before and after
reinsurance. While TDI has resolved this issue with most companies, TDI has not resolved this issue for some companies. For this reason the
ultimate gross loss estimates and ultimate net loss estimates are likely too low (see pages 3 and 13).
For the first data submission, companies were instructed to provide data as of September 30. However, a number of companies, including at least
one large insurer, were unable to provide complete data as of that date. Instead, some companies reported data for the first submission that was as
of mid- to late October (see also Data Call Reporting Date, Page 2).
TDI had a number of ongoing challenges in collecting this information that caused requests for corrections or resubmissions. Those issues include:
Companies failing to provide, or providing incorrect, company identifying information.
Companies failing to provide complete information, such as estimates of ultimate Hurricane Harvey losses before and after reinsurance.
Companies deleting, overwriting, or altering preset formulas against explicit TDI instructions not to do so.
However, TDI notes that the data call was complex, required insurers to provide a lot of information in a short period of time, and required insurers
to carefully read and follow lengthy instructions. Many insurers also were responding to data calls issued by other jurisdictions such as Florida
(Hurricane Irma) and California (wildfires).
Data Call Reporting Date Data provided in this report is as of the first reporting date of the Hurricane Harvey data call. For most companies, this date is September 30, 2017. But
some companies, including at least one large insurer, were not able to provide the data as of September 30, 2017. For these insurers, the reporting date
was as of mid- to late October.
Hurricane Harvey Data Call TDI Presentation to the Senate Business and Commerce Committee
3
Texas Department of Insurance
Executive Summary
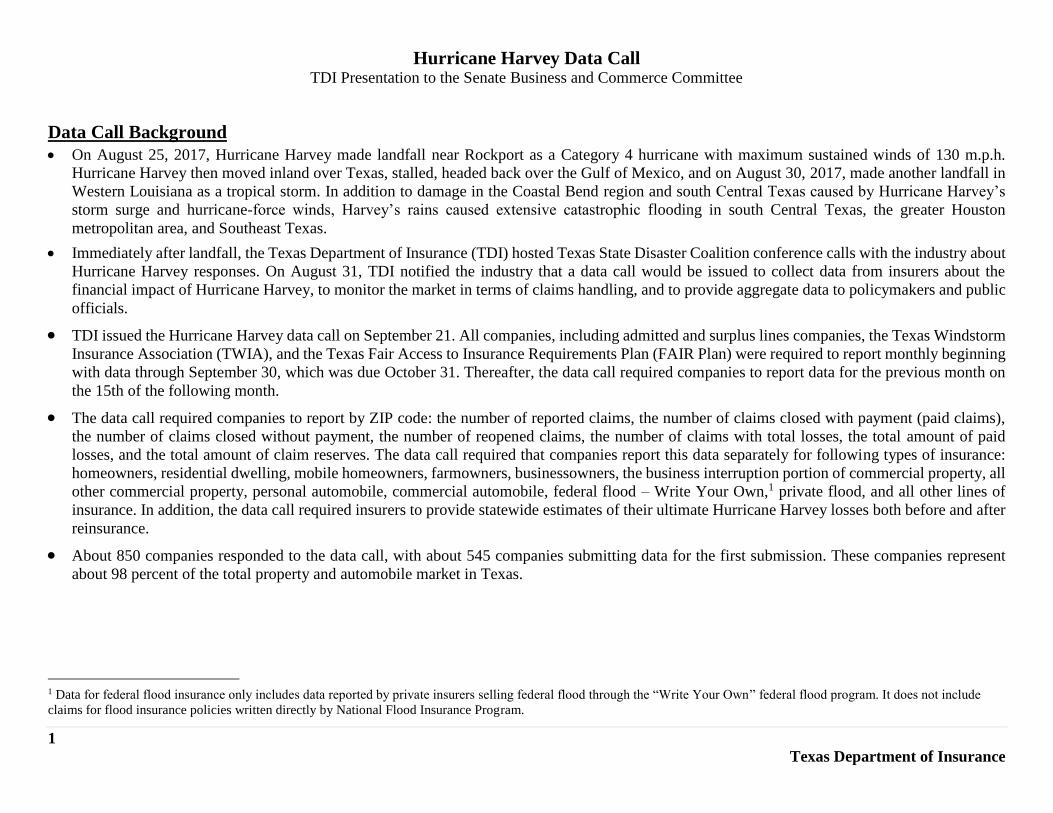
As of the data call reporting date, Hurricane Harvey generated about 670,000 claims to private insurers, TWIA, and the Texas FAIR Plan for all
personal and commercial lines of insurance. This includes about 354,000 residential property claims and about 203,000 automobile claims.
Residential property consists of homeowners (226,000 claims), residential dwelling (113,000 claims), and mobile homeowners (15,000 claims).
(Page 12).
As of the data call reporting date, insurers have made 4.5 billion in claim payments (paid losses), and insurers estimate they will ultimately pay out
a total of $15.7 billion. These numbers will change as more claims are reported, settled, and closed (Page 13).
While most of the claims are for residential property insurance, most of the losses are from flood and automobile claims. Automobile insurance
commonly covers flood under “comprehensive” coverage, while residential property insurance usually does not provide coverage for flood.
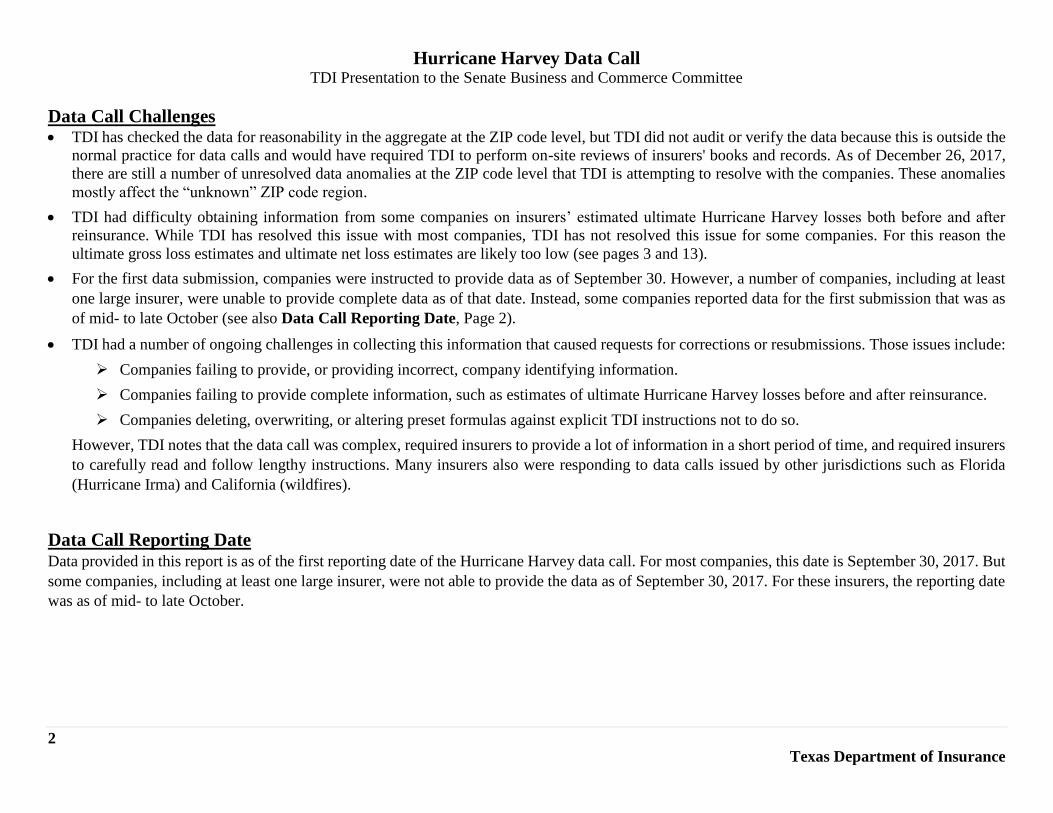
In comparison, as of October 31, 2008, or about 45 days after the storm, Hurricane Ike generated about 730,000 claims with approximately
570,000 residential property claims and approximately 73,000 automobile claims. As of October 31, 2008, insurers had paid about $3.2 billion in
paid losses. However, these figures do not include claims or loss payments for federal flood insurance. Also, Hurricane Ike was largely a wind
event, whereas Hurricane Harvey was predominantly a flood event.
354 (53%)
66 (10%)37 (5%)
203 (30%)
12 (2%)Reported Claims
(in thousands)
Residential Property Flood Insurance
Commercial Property Automobile
All Other
$0.8 (17%)
$1.3 (29%)
$0.4
(9%)
$1.9
(43%)
$0.1 (2%)Amount of
Losses Paid
(in billions)
Residential Property Flood Insurance
Commercial Property Automobile
All Other
$2.5
(16%)
$7.2 (46%)
$2.9
(19%)
$2.7
(17%)
$0.3 (2%)Estd. Ultimate
Gross Losses
(in billions)
Residential Property Flood Insurance
Commercial Property Automobile
All Other
Hurricane Harvey Data Call TDI Presentation to the Senate Business and Commerce Committee
4
Texas Department of Insurance
*Hurricane Ike data is as of October 31, 2008.
**For Hurricane Ike, includes only private flood insurance. For Hurricane Harvey, includes both private flood and federal flood through the “Write
Your Own” federal flood program; not claims for flood insurance policies written directly by the National Flood Insurance Program.
About 90 percent of Hurricane Harvey claims and paid losses are in Houston and Southeast Texas (collectively Houston Area) or the Coastal Bend
and Other Seacoast (collectively Coastal Bend) regions (see also map on Page 11).
0
200
400
600
800
Harvey Ike*
(in
th
ou
san
ds)
Reported Claims
Residential Property Flood Insurance**
Commercial Property Automobile
All Other
$-
$1.0
$2.0
$3.0
$4.0
$5.0
Harvey Ike*
(in
bil
lion
s)
Paid Losses
Residential Property Flood Insurance**
Commercial Property Automobile
All Other
17%
74%
5%
1% 3%
Reported Claims
Coastal Bend Houston Area Central Texas
All others Unknown
15%
76%
2%
1%
6%
Paid Losses
Coastal Bend Houston Area Central Texas
All others Unknown
Hurricane Harvey Data Call TDI Presentation to the Senate Business and Commerce Committee
5
Texas Department of Insurance
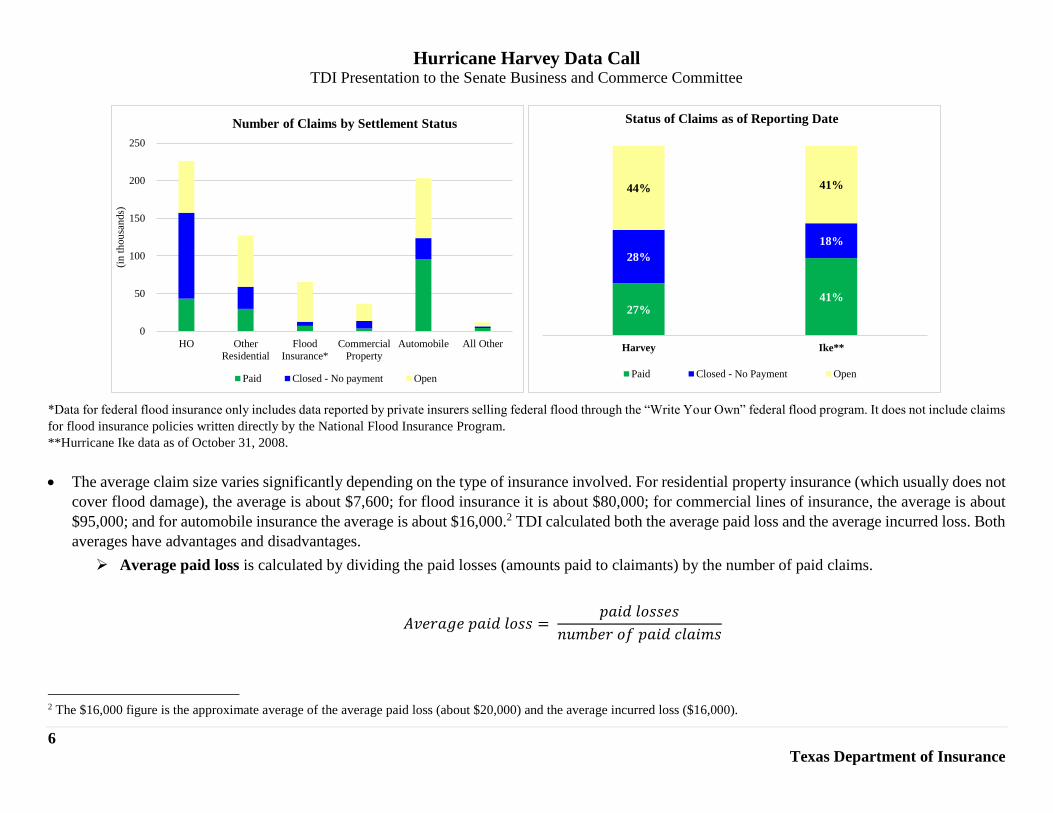
As of the reporting date, for all types of insurance combined, about 27 percent of claims are paid (closed with a loss payment), 28 percent are closed
without a loss payment, 44 percent are still open, and 7 percent have been reopened. A claim that is open may involve partial payments, such as
payments for additional living expenses or business interruption, as well as payments for damage. Reasons an insurer may close a claim without
payment, include:
The damage fell below the deductible;
The damage resulted from a peril that was not covered under the policy. For example, homeowners policies typically do not cover flooding,
or a homeowner may have called their homeowner insurer in situations where TWIA covers the wind damage;
The policyholder did not have a policy in effect at the time the damage occurred. For example, the policy had expired; or
The claim was a duplicate claim. For example, a homeowner may file a claim both through their agent and through a smartphone app and
this may generate two different claim numbers within the company’s claims system.
These percentages differ by type of insurance. This is particularly true in the case of homeowners. The high percentage of homeowners claims
closed without payment appear to be from the Houston and Southeast Texas region that experienced significant flooding, which typically is not
covered by homeowners insurance. Some homeowners may have filed a claim under their homeowners’ insurance policy to get a denial to apply
for FEMA assistance. Details on the number of claims by settlement status by type of insurance are on pages 17, 23, 26, 31, 35, and 39.
In comparison, as of October 31, 2008, or about 45 days after Hurricane Ike, companies reported that 41 percent of all claims were closed with
payment, 18 percent were closed without payment, and 41 percent were still open.
Hurricane Harvey Data Call TDI Presentation to the Senate Business and Commerce Committee
6
Texas Department of Insurance
*Data for federal flood insurance only includes data reported by private insurers selling federal flood through the “Write Your Own” federal flood program. It does not include claims
for flood insurance policies written directly by the National Flood Insurance Program.
**Hurricane Ike data as of October 31, 2008.
The average claim size varies significantly depending on the type of insurance involved. For residential property insurance (which usually does not
cover flood damage), the average is about $7,600; for flood insurance it is about $80,000; for commercial lines of insurance, the average is about
$95,000; and for automobile insurance the average is about $16,000.2 TDI calculated both the average paid loss and the average incurred loss. Both
averages have advantages and disadvantages.
Average paid loss is calculated by dividing the paid losses (amounts paid to claimants) by the number of paid claims.
𝐴𝑣𝑒𝑟𝑎𝑔𝑒 𝑝𝑎𝑖𝑑 𝑙𝑜𝑠𝑠 = 𝑝𝑎𝑖𝑑 𝑙𝑜𝑠𝑠𝑒𝑠
𝑛𝑢𝑚𝑏𝑒𝑟 𝑜𝑓 𝑝𝑎𝑖𝑑 𝑐𝑙𝑎𝑖𝑚𝑠
2 The $16,000 figure is the approximate average of the average paid loss (about $20,000) and the average incurred loss ($16,000).
0
50
100
150
200
250
HO Other
Residential
Flood
Insurance*
Commercial
Property
Automobile All Other
(in
th
ou
san
ds)
Number of Claims by Settlement Status
Paid Closed - No payment Open
27%41%
28%
18%
44% 41%
Harvey Ike**
Status of Claims as of Reporting Date
Paid Closed - No Payment Open
Hurricane Harvey Data Call TDI Presentation to the Senate Business and Commerce Committee
7
Texas Department of Insurance
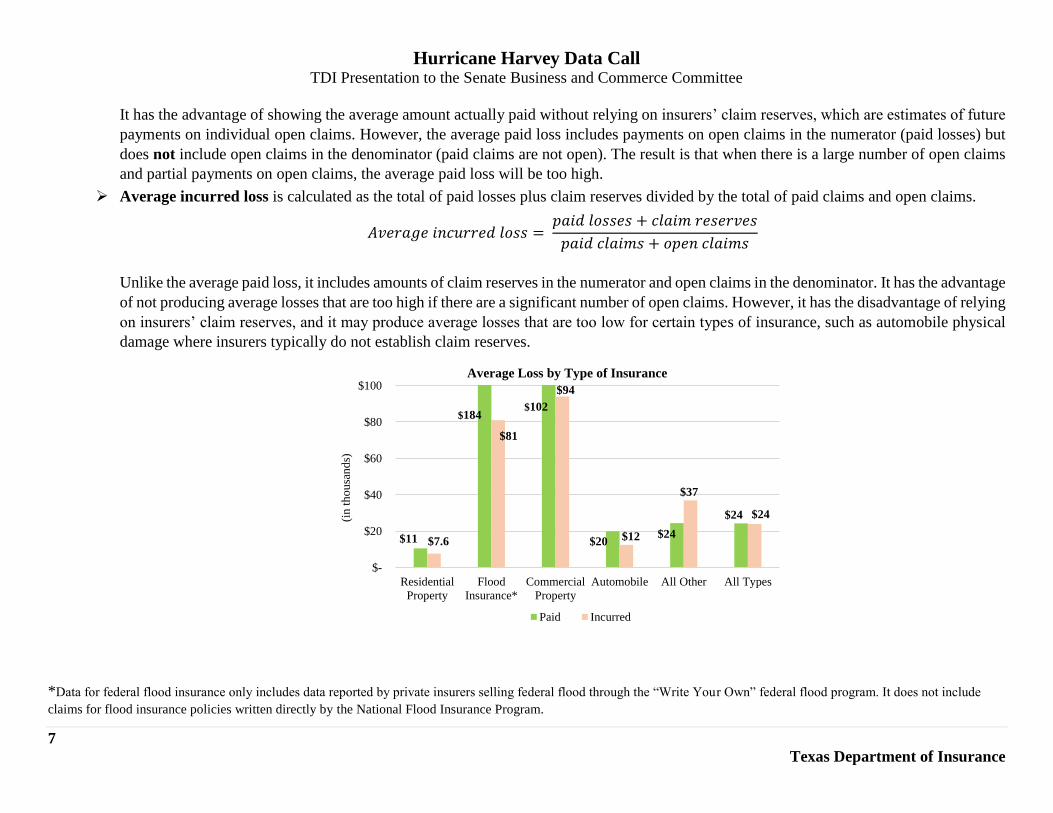
It has the advantage of showing the average amount actually paid without relying on insurers’ claim reserves, which are estimates of future
payments on individual open claims. However, the average paid loss includes payments on open claims in the numerator (paid losses) but
does not include open claims in the denominator (paid claims are not open). The result is that when there is a large number of open claims
and partial payments on open claims, the average paid loss will be too high.
Average incurred loss is calculated as the total of paid losses plus claim reserves divided by the total of paid claims and open claims.
𝐴𝑣𝑒𝑟𝑎𝑔𝑒 𝑖𝑛𝑐𝑢𝑟𝑟𝑒𝑑 𝑙𝑜𝑠𝑠 = 𝑝𝑎𝑖𝑑 𝑙𝑜𝑠𝑠𝑒𝑠 + 𝑐𝑙𝑎𝑖𝑚 𝑟𝑒𝑠𝑒𝑟𝑣𝑒𝑠
𝑝𝑎𝑖𝑑 𝑐𝑙𝑎𝑖𝑚𝑠 + 𝑜𝑝𝑒𝑛 𝑐𝑙𝑎𝑖𝑚𝑠
Unlike the average paid loss, it includes amounts of claim reserves in the numerator and open claims in the denominator. It has the advantage
of not producing average losses that are too high if there are a significant number of open claims. However, it has the disadvantage of relying
on insurers’ claim reserves, and it may produce average losses that are too low for certain types of insurance, such as automobile physical
damage where insurers typically do not establish claim reserves.
*Data for federal flood insurance only includes data reported by private insurers selling federal flood through the “Write Your Own” federal flood program. It does not include
claims for flood insurance policies written directly by the National Flood Insurance Program.
$11 $20 $24
$24
$7.6
$81
$94
$12
$37
$24
$-
$20
$40
$60
$80
$100
Residential
Property
Flood
Insurance*
Commercial
Property
Automobile All Other All Types
(in
th
ou
san
ds)
Average Loss by Type of Insurance
Paid Incurred
$184$102
Hurricane Harvey Data Call TDI Presentation to the Senate Business and Commerce Committee
8
Texas Department of Insurance
Details of the average losses by type of insurance and region are on pages 18, 27, 32, 36, and 40.
For residential property insurance, other than mobile homeowners, TDI collected claims data separately for policies that provide actual cash value
(ACV) coverage to the dwelling (or roof) versus policies that provide replacement cost value (RCV) coverage to the dwelling (or roof). Replacement
cost refers to the cost to replace the property at current prices, without any regard to depreciation. Actual cash value refers to the cost to replace the
property after deducting for depreciation due to aging, and wear and tear.
About 16 percent of residential property claims (excluding mobile homeowners) were on policies providing ACV coverage for the dwelling
or roof, and 84 percent were on policies providing RCV coverage (Page 20).
About 16 percent of residential property incurred losses (excluding mobile homeowners) were on policies providing ACV coverage for the
dwelling or roof, and 84 percent were on policies providing RCV coverage.
Both types of policies had a similar percentage of claims closed without payment (41 percent versus 42 percent), but these percentages
varied by region (Page 22).
ACV policies also had a lower percentage of claims reopened (3.7 percent versus 12 percent). However, TDI does not know to what extent
insurers reopened RCV claims in order to issue "holdback" payments. For replacement cost coverage, insurers initially issue a payment for
the actual cash value portion of the claim. Once the policyholder makes the repairs, the insurer then issues a payment for the depreciation
cost. The depreciation cost payment is commonly called the holdback payment (Page 22).
Hurricane Harvey Data Call TDI Presentation to the Senate Business and Commerce Committee
9
Texas Department of Insurance
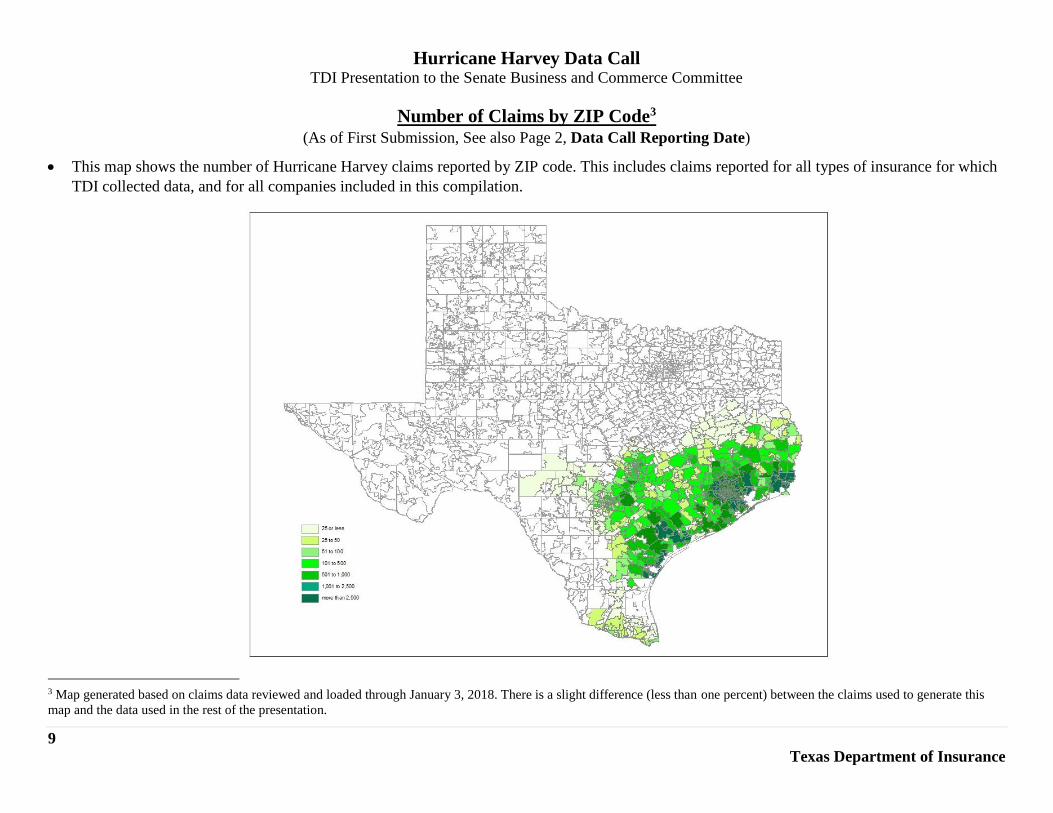
Number of Claims by ZIP Code3 (As of First Submission, See also Page 2, Data Call Reporting Date)
This map shows the number of Hurricane Harvey claims reported by ZIP code. This includes claims reported for all types of insurance for which
TDI collected data, and for all companies included in this compilation.
3 Map generated based on claims data reviewed and loaded through January 3, 2018. There is a slight difference (less than one percent) between the claims used to generate this
map and the data used in the rest of the presentation.
Hurricane Harvey Data Call TDI Presentation to the Senate Business and Commerce Committee
10
Texas Department of Insurance
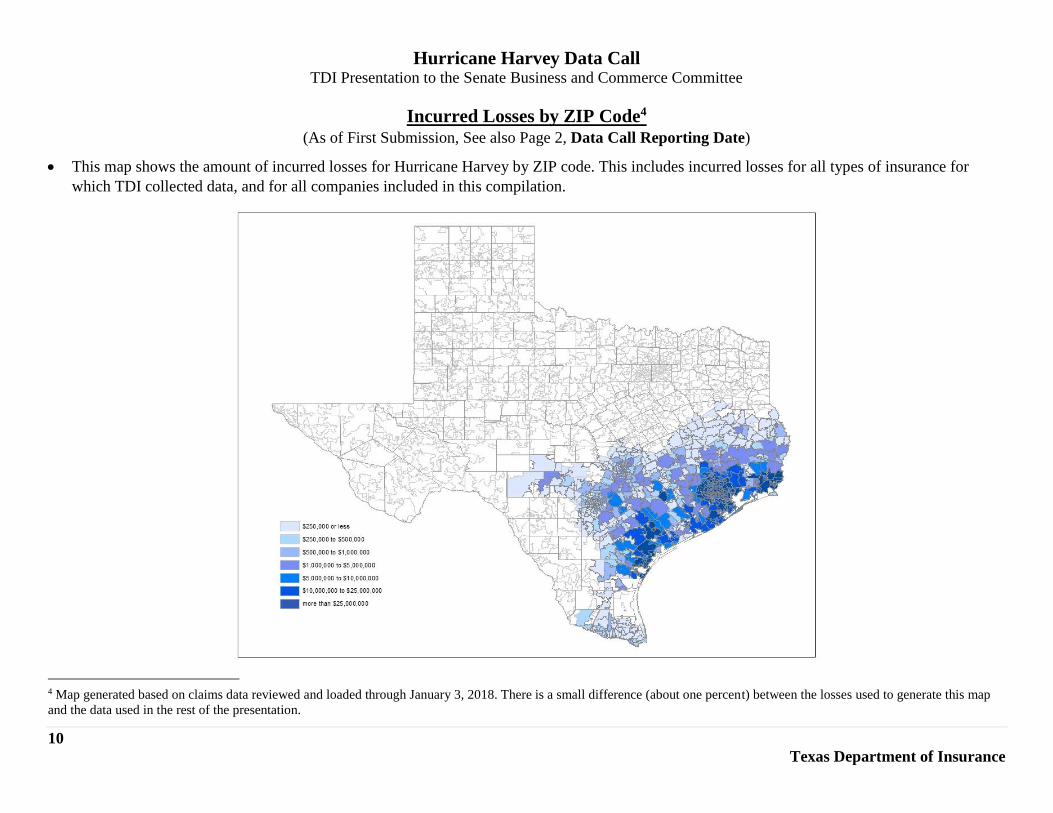
Incurred Losses by ZIP Code4 (As of First Submission, See also Page 2, Data Call Reporting Date)
This map shows the amount of incurred losses for Hurricane Harvey by ZIP code. This includes incurred losses for all types of insurance for
which TDI collected data, and for all companies included in this compilation.
4 Map generated based on claims data reviewed and loaded through January 3, 2018. There is a small difference (about one percent) between the losses used to generate this map
and the data used in the rest of the presentation.
Hurricane Harvey Data Call TDI Presentation to the Senate Business and Commerce Committee
11
Texas Department of Insurance
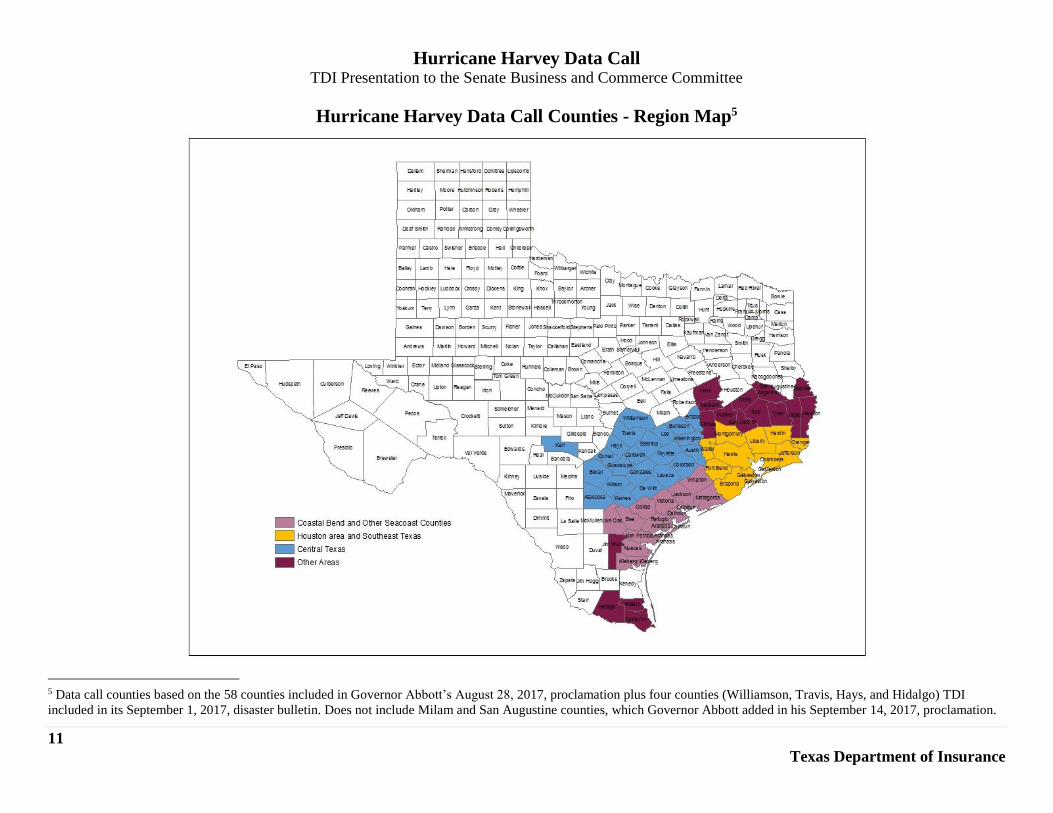
Hurricane Harvey Data Call Counties - Region Map5
5 Data call counties based on the 58 counties included in Governor Abbott’s August 28, 2017, proclamation plus four counties (Williamson, Travis, Hays, and Hidalgo) TDI
included in its September 1, 2017, disaster bulletin. Does not include Milam and San Augustine counties, which Governor Abbott added in his September 14, 2017, proclamation.
Hurricane Harvey Data Call TDI Presentation to the Senate Business and Commerce Committee
12
Texas Department of Insurance
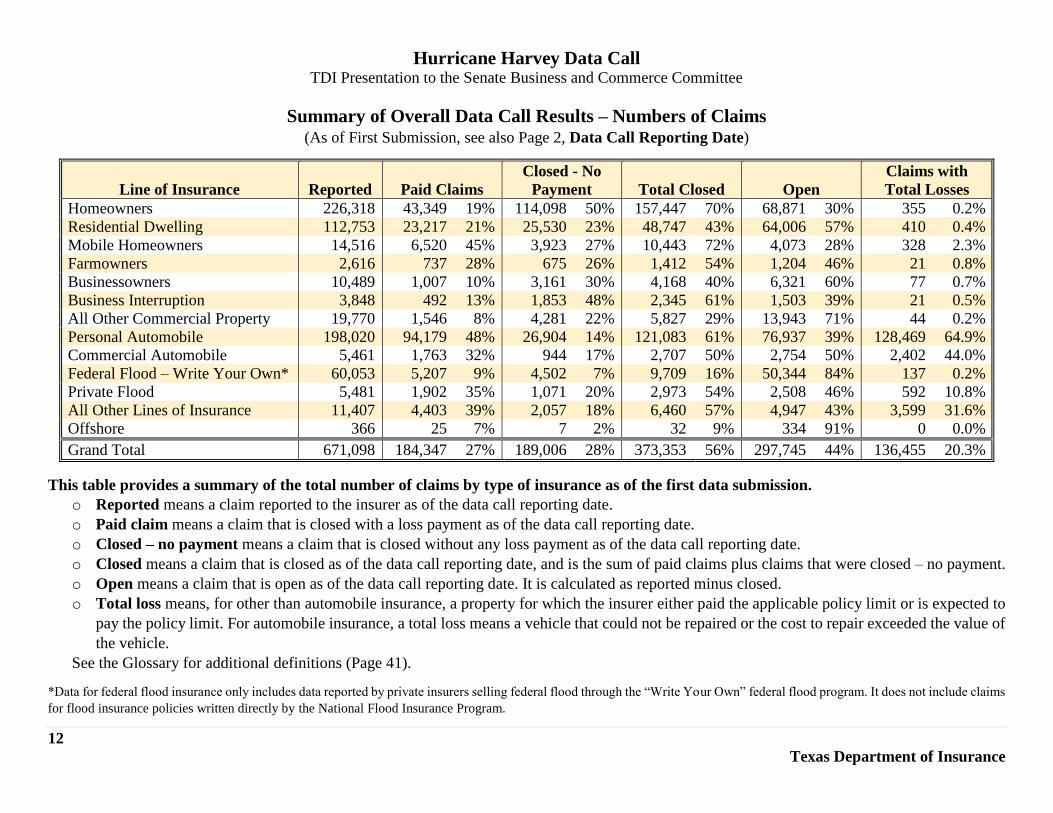
Summary of Overall Data Call Results – Numbers of Claims (As of First Submission, see also Page 2, Data Call Reporting Date)
Line of Insurance Reported Paid Claims
Closed - No
Payment Total Closed Open
Claims with
Total Losses
Homeowners 226,318 43,349 19% 114,098 50% 157,447 70% 68,871 30% 355 0.2%
Residential Dwelling 112,753 23,217 21% 25,530 23% 48,747 43% 64,006 57% 410 0.4%
Mobile Homeowners 14,516 6,520 45% 3,923 27% 10,443 72% 4,073 28% 328 2.3%
Farmowners 2,616 737 28% 675 26% 1,412 54% 1,204 46% 21 0.8%
Businessowners 10,489 1,007 10% 3,161 30% 4,168 40% 6,321 60% 77 0.7%
Business Interruption 3,848 492 13% 1,853 48% 2,345 61% 1,503 39% 21 0.5%
All Other Commercial Property 19,770 1,546 8% 4,281 22% 5,827 29% 13,943 71% 44 0.2%
Personal Automobile 198,020 94,179 48% 26,904 14% 121,083 61% 76,937 39% 128,469 64.9%
Commercial Automobile 5,461 1,763 32% 944 17% 2,707 50% 2,754 50% 2,402 44.0%
Federal Flood – Write Your Own* 60,053 5,207 9% 4,502 7% 9,709 16% 50,344 84% 137 0.2%
Private Flood 5,481 1,902 35% 1,071 20% 2,973 54% 2,508 46% 592 10.8%
All Other Lines of Insurance 11,407 4,403 39% 2,057 18% 6,460 57% 4,947 43% 3,599 31.6%
Offshore 366 25 7% 7 2% 32 9% 334 91% 0 0.0%
Grand Total 671,098 184,347 27% 189,006 28% 373,353 56% 297,745 44% 136,455 20.3%
This table provides a summary of the total number of claims by type of insurance as of the first data submission.
o Reported means a claim reported to the insurer as of the data call reporting date.
o Paid claim means a claim that is closed with a loss payment as of the data call reporting date.
o Closed – no payment means a claim that is closed without any loss payment as of the data call reporting date.
o Closed means a claim that is closed as of the data call reporting date, and is the sum of paid claims plus claims that were closed – no payment.
o Open means a claim that is open as of the data call reporting date. It is calculated as reported minus closed.
o Total loss means, for other than automobile insurance, a property for which the insurer either paid the applicable policy limit or is expected to
pay the policy limit. For automobile insurance, a total loss means a vehicle that could not be repaired or the cost to repair exceeded the value of
the vehicle.
See the Glossary for additional definitions (Page 41).
*Data for federal flood insurance only includes data reported by private insurers selling federal flood through the “Write Your Own” federal flood program. It does not include claims
for flood insurance policies written directly by the National Flood Insurance Program.
Hurricane Harvey Data Call TDI Presentation to the Senate Business and Commerce Committee
13
Texas Department of Insurance
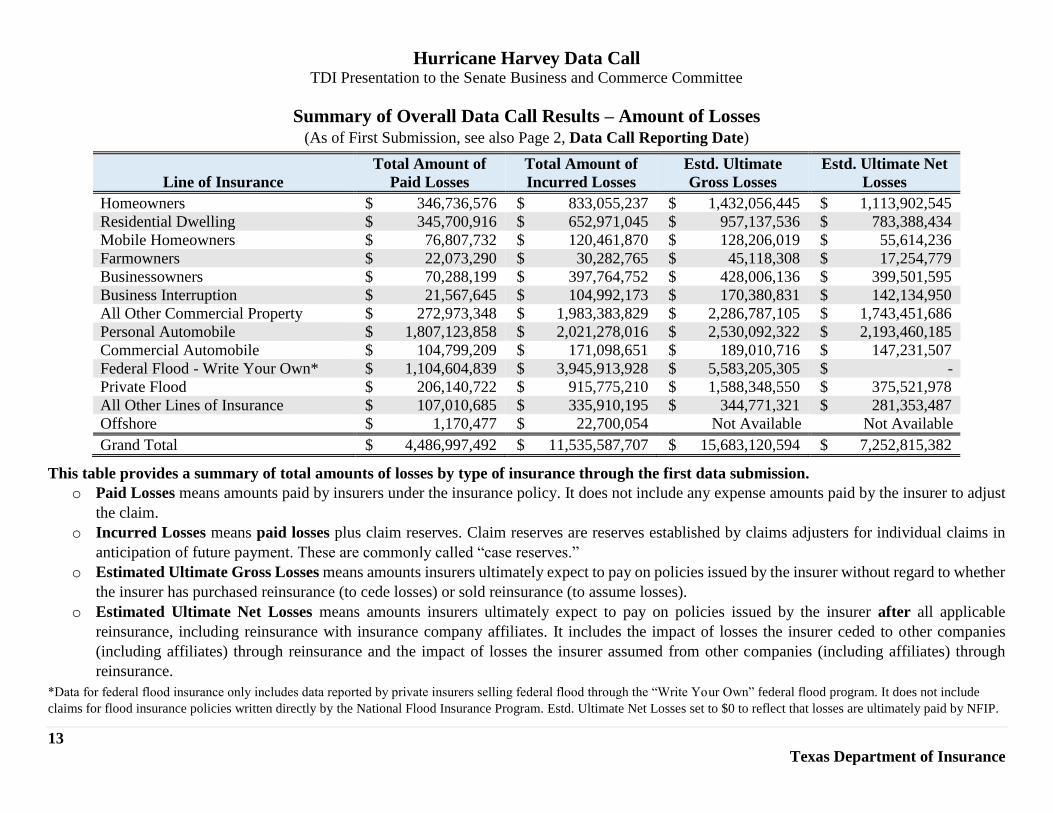
Summary of Overall Data Call Results – Amount of Losses (As of First Submission, see also Page 2, Data Call Reporting Date)
Line of Insurance
Total Amount of
Paid Losses
Total Amount of
Incurred Losses
Estd. Ultimate
Gross Losses
Estd. Ultimate Net
Losses
Homeowners $ 346,736,576 $ 833,055,237 $ 1,432,056,445 $ 1,113,902,545
Residential Dwelling $ 345,700,916 $ 652,971,045 $ 957,137,536 $ 783,388,434
Mobile Homeowners $ 76,807,732 $ 120,461,870 $ 128,206,019 $ 55,614,236
Farmowners $ 22,073,290 $ 30,282,765 $ 45,118,308 $ 17,254,779
Businessowners $ 70,288,199 $ 397,764,752 $ 428,006,136 $ 399,501,595
Business Interruption $ 21,567,645 $ 104,992,173 $ 170,380,831 $ 142,134,950
All Other Commercial Property $ 272,973,348 $ 1,983,383,829 $ 2,286,787,105 $ 1,743,451,686
Personal Automobile $ 1,807,123,858 $ 2,021,278,016 $ 2,530,092,322 $ 2,193,460,185
Commercial Automobile $ 104,799,209 $ 171,098,651 $ 189,010,716 $ 147,231,507
Federal Flood - Write Your Own* $ 1,104,604,839 $ 3,945,913,928 $ 5,583,205,305 $ -
Private Flood $ 206,140,722 $ 915,775,210 $ 1,588,348,550 $ 375,521,978
All Other Lines of Insurance $ 107,010,685 $ 335,910,195 $ 344,771,321 $ 281,353,487
Offshore $ 1,170,477 $ 22,700,054 Not Available Not Available
Grand Total $ 4,486,997,492 $ 11,535,587,707 $ 15,683,120,594 $ 7,252,815,382
This table provides a summary of total amounts of losses by type of insurance through the first data submission.
o Paid Losses means amounts paid by insurers under the insurance policy. It does not include any expense amounts paid by the insurer to adjust
the claim.
o Incurred Losses means paid losses plus claim reserves. Claim reserves are reserves established by claims adjusters for individual claims in
anticipation of future payment. These are commonly called “case reserves.”
o Estimated Ultimate Gross Losses means amounts insurers ultimately expect to pay on policies issued by the insurer without regard to whether
the insurer has purchased reinsurance (to cede losses) or sold reinsurance (to assume losses).
o Estimated Ultimate Net Losses means amounts insurers ultimately expect to pay on policies issued by the insurer after all applicable
reinsurance, including reinsurance with insurance company affiliates. It includes the impact of losses the insurer ceded to other companies
(including affiliates) through reinsurance and the impact of losses the insurer assumed from other companies (including affiliates) through
reinsurance.
*Data for federal flood insurance only includes data reported by private insurers selling federal flood through the “Write Your Own” federal flood program. It does not include
claims for flood insurance policies written directly by the National Flood Insurance Program. Estd. Ultimate Net Losses set to $0 to reflect that losses are ultimately paid by NFIP.
Hurricane Harvey Data Call TDI Presentation to the Senate Business and Commerce Committee
14
Texas Department of Insurance
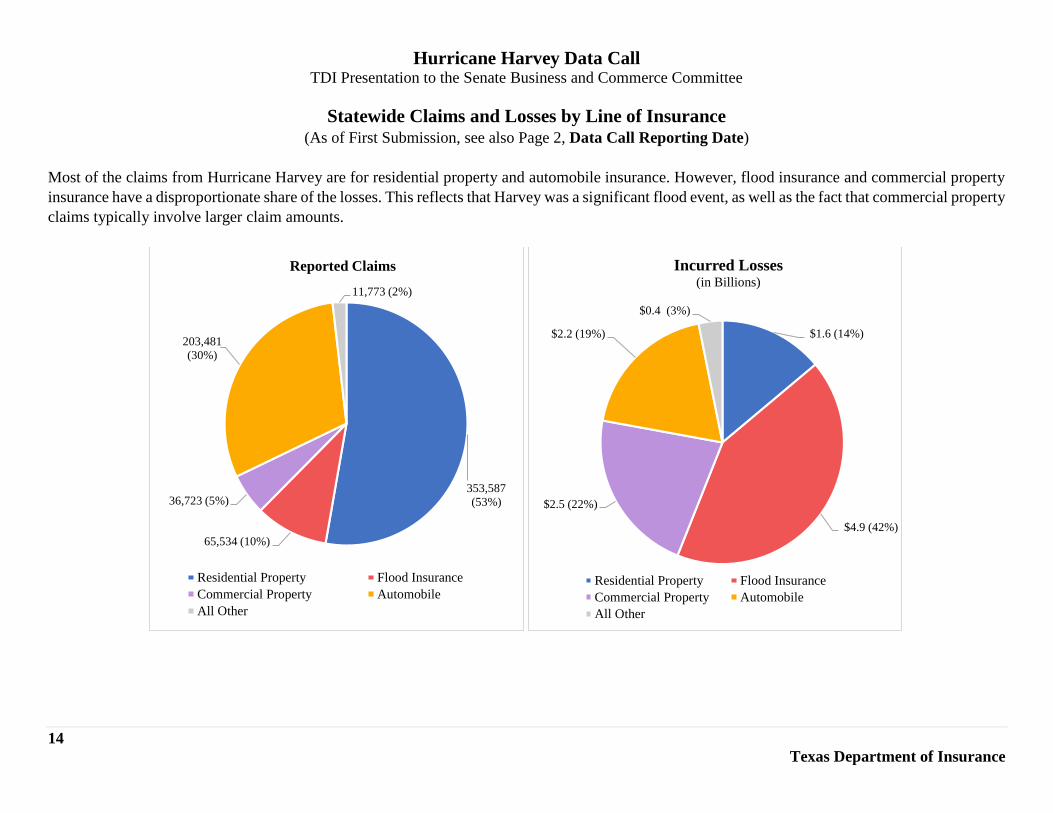
Statewide Claims and Losses by Line of Insurance (As of First Submission, see also Page 2, Data Call Reporting Date)
Most of the claims from Hurricane Harvey are for residential property and automobile insurance. However, flood insurance and commercial property
insurance have a disproportionate share of the losses. This reflects that Harvey was a significant flood event, as well as the fact that commercial property
claims typically involve larger claim amounts.
353,587
(53%)
65,534 (10%)
36,723 (5%)
203,481
(30%)
11,773 (2%)
Reported Claims
Residential Property Flood Insurance
Commercial Property Automobile
All Other
$1.6 (14%)
$4.9 (42%)
$2.5 (22%)
$2.2 (19%)
$0.4 (3%)
Incurred Losses(in Billions)
Residential Property Flood Insurance
Commercial Property Automobile
All Other
Hurricane Harvey Data Call TDI Presentation to the Senate Business and Commerce Committee
15
Texas Department of Insurance
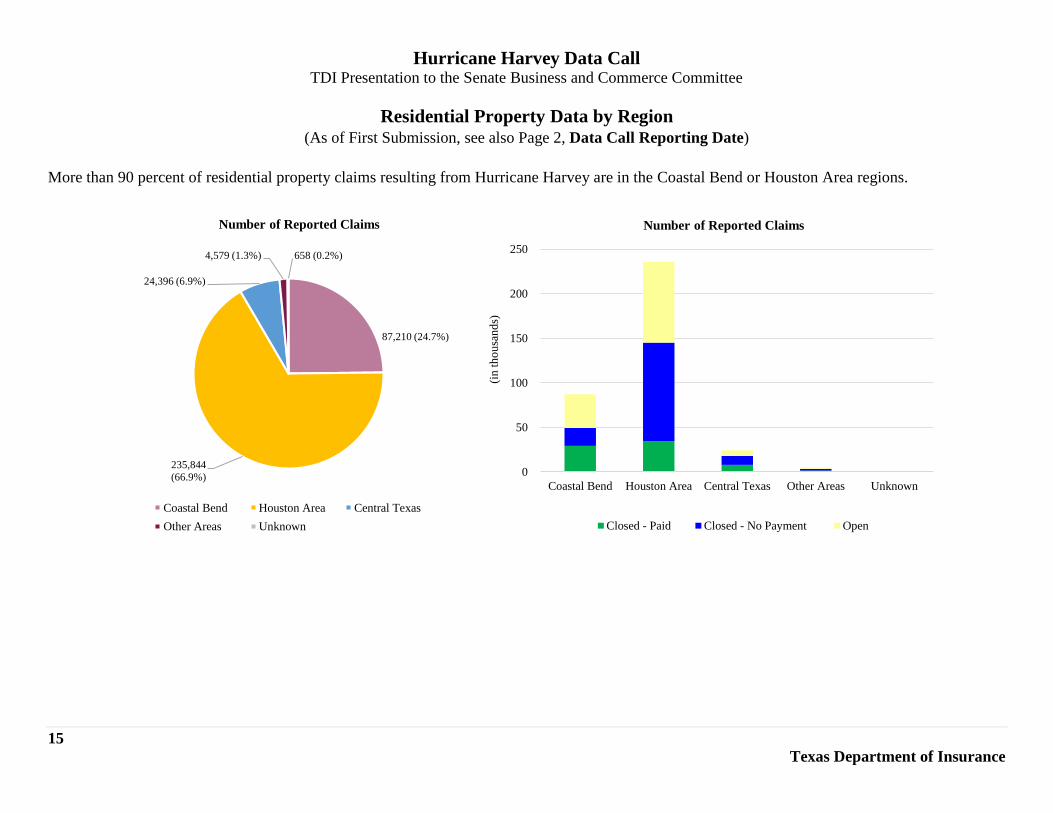
Residential Property Data by Region (As of First Submission, see also Page 2, Data Call Reporting Date)
More than 90 percent of residential property claims resulting from Hurricane Harvey are in the Coastal Bend or Houston Area regions.
87,210 (24.7%)
235,844
(66.9%)
24,396 (6.9%)
4,579 (1.3%) 658 (0.2%)
Number of Reported Claims
Coastal Bend Houston Area Central Texas
Other Areas Unknown
0
50
100
150
200
250
Coastal Bend Houston Area Central Texas Other Areas Unknown(i
n t
ho
usa
nd
s)
Number of Reported Claims
Closed - Paid Closed - No Payment Open
Hurricane Harvey Data Call TDI Presentation to the Senate Business and Commerce Committee
16
Texas Department of Insurance
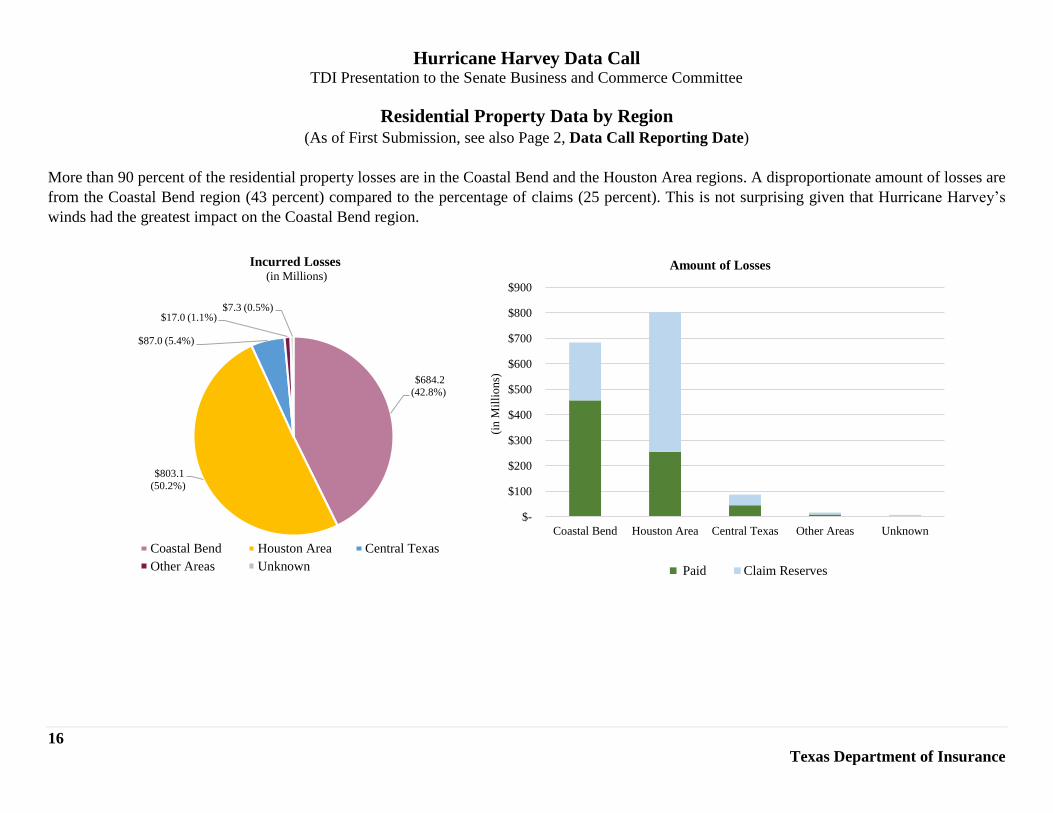
Residential Property Data by Region (As of First Submission, see also Page 2, Data Call Reporting Date)
More than 90 percent of the residential property losses are in the Coastal Bend and the Houston Area regions. A disproportionate amount of losses are
from the Coastal Bend region (43 percent) compared to the percentage of claims (25 percent). This is not surprising given that Hurricane Harvey’s
winds had the greatest impact on the Coastal Bend region.
$684.2
(42.8%)
$803.1
(50.2%)
$87.0 (5.4%)
$17.0 (1.1%)$7.3 (0.5%)
Incurred Losses(in Millions)
Coastal Bend Houston Area Central Texas
Other Areas Unknown
$-
$100
$200
$300
$400
$500
$600
$700
$800
$900
Coastal Bend Houston Area Central Texas Other Areas Unknown
(in
Mil
lio
ns)
Amount of Losses
Paid Claim Reserves
Hurricane Harvey Data Call TDI Presentation to the Senate Business and Commerce Committee
17
Texas Department of Insurance
Residential Property Data by Region (As of First Submission, see also Page 2, Data Call Reporting Date)
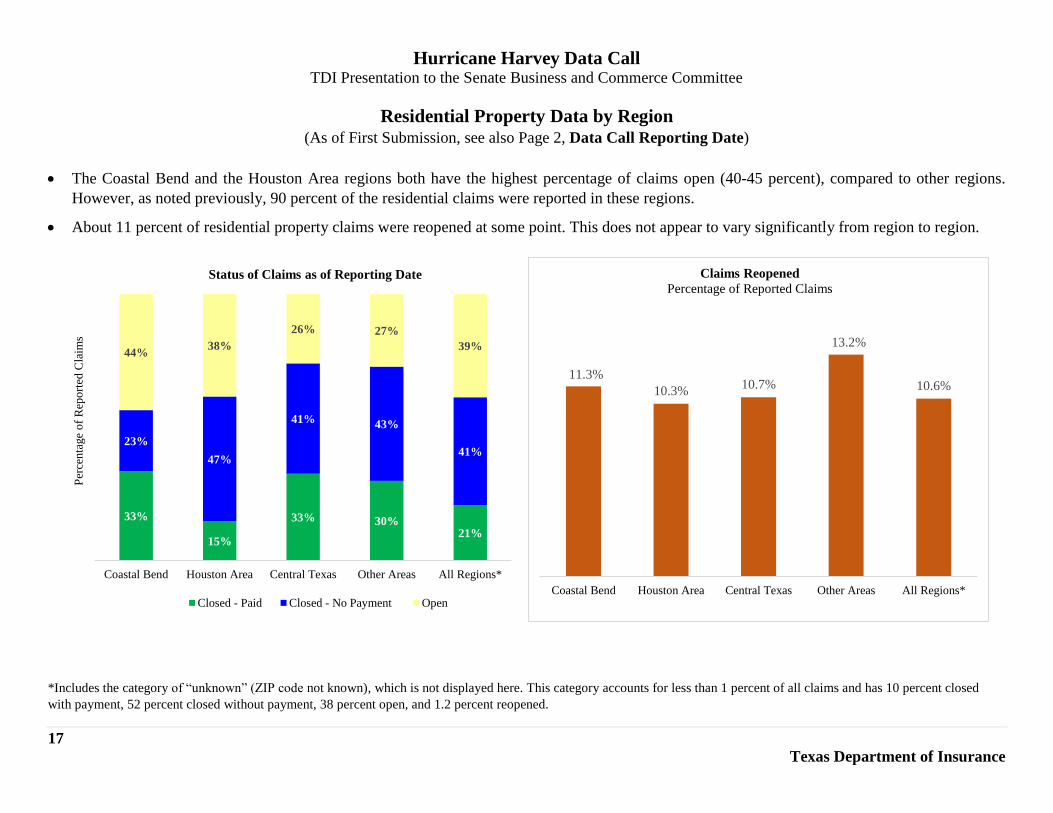
The Coastal Bend and the Houston Area regions both have the highest percentage of claims open (40-45 percent), compared to other regions.
However, as noted previously, 90 percent of the residential claims were reported in these regions.
About 11 percent of residential property claims were reopened at some point. This does not appear to vary significantly from region to region.
*Includes the category of “unknown” (ZIP code not known), which is not displayed here. This category accounts for less than 1 percent of all claims and has 10 percent closed
with payment, 52 percent closed without payment, 38 percent open, and 1.2 percent reopened.
33%
15%
33% 30%21%
23%
47%
41% 43%
41%
44%38%
26% 27%
39%
Coastal Bend Houston Area Central Texas Other Areas All Regions*
Per
cen
tage
of
Rep
ort
ed C
laim
s
Status of Claims as of Reporting Date
Closed - Paid Closed - No Payment Open
11.3%
10.3%10.7%
13.2%
10.6%
Coastal Bend Houston Area Central Texas Other Areas All Regions*
Claims Reopened
Percentage of Reported Claims
Hurricane Harvey Data Call TDI Presentation to the Senate Business and Commerce Committee
18
Texas Department of Insurance
Residential Property Data by Region (As of First Submission, see also Page 2, Data Call Reporting Date)
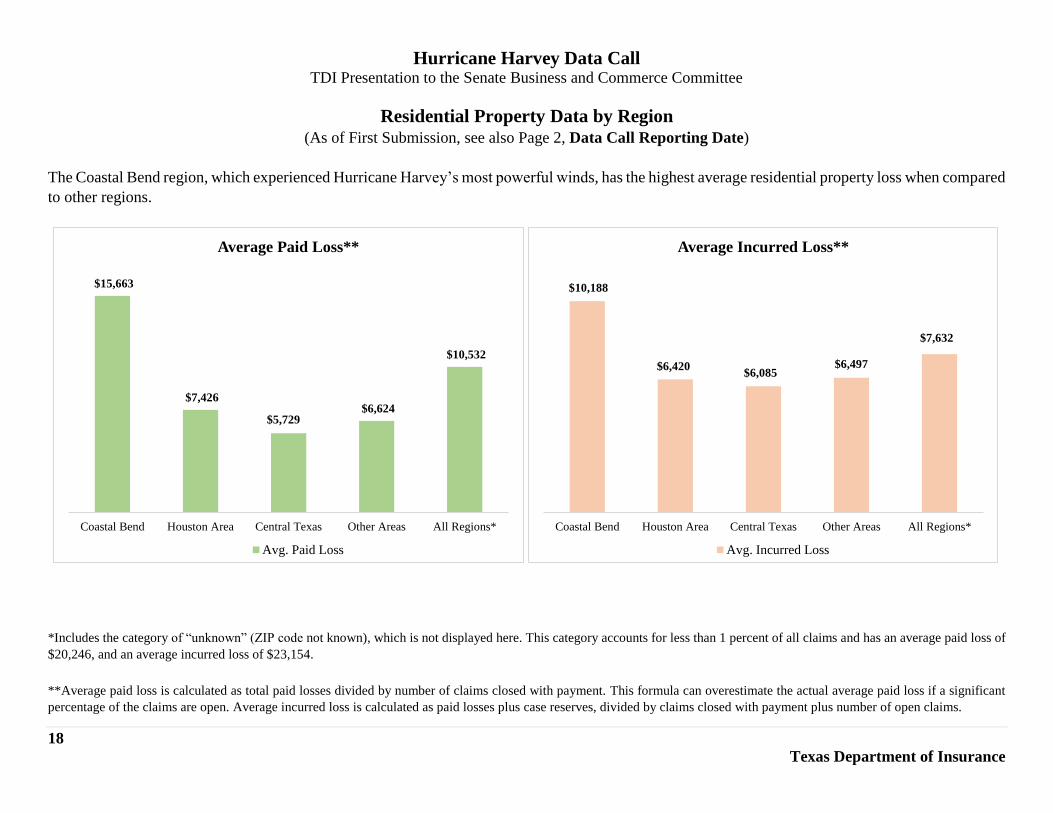
The Coastal Bend region, which experienced Hurricane Harvey’s most powerful winds, has the highest average residential property loss when compared
to other regions.
*Includes the category of “unknown” (ZIP code not known), which is not displayed here. This category accounts for less than 1 percent of all claims and has an average paid loss of
$20,246, and an average incurred loss of $23,154.
**Average paid loss is calculated as total paid losses divided by number of claims closed with payment. This formula can overestimate the actual average paid loss if a significant
percentage of the claims are open. Average incurred loss is calculated as paid losses plus case reserves, divided by claims closed with payment plus number of open claims.
$15,663
$7,426
$5,729 $6,624
$10,532
Coastal Bend Houston Area Central Texas Other Areas All Regions*
Average Paid Loss**
Avg. Paid Loss
$10,188
$6,420 $6,085
$6,497
$7,632
Coastal Bend Houston Area Central Texas Other Areas All Regions*
Average Incurred Loss**
Avg. Incurred Loss
Hurricane Harvey Data Call TDI Presentation to the Senate Business and Commerce Committee
19
Texas Department of Insurance
Residential Property Data by Region (As of First Submission, see also Page 2, Data Call Reporting Date)
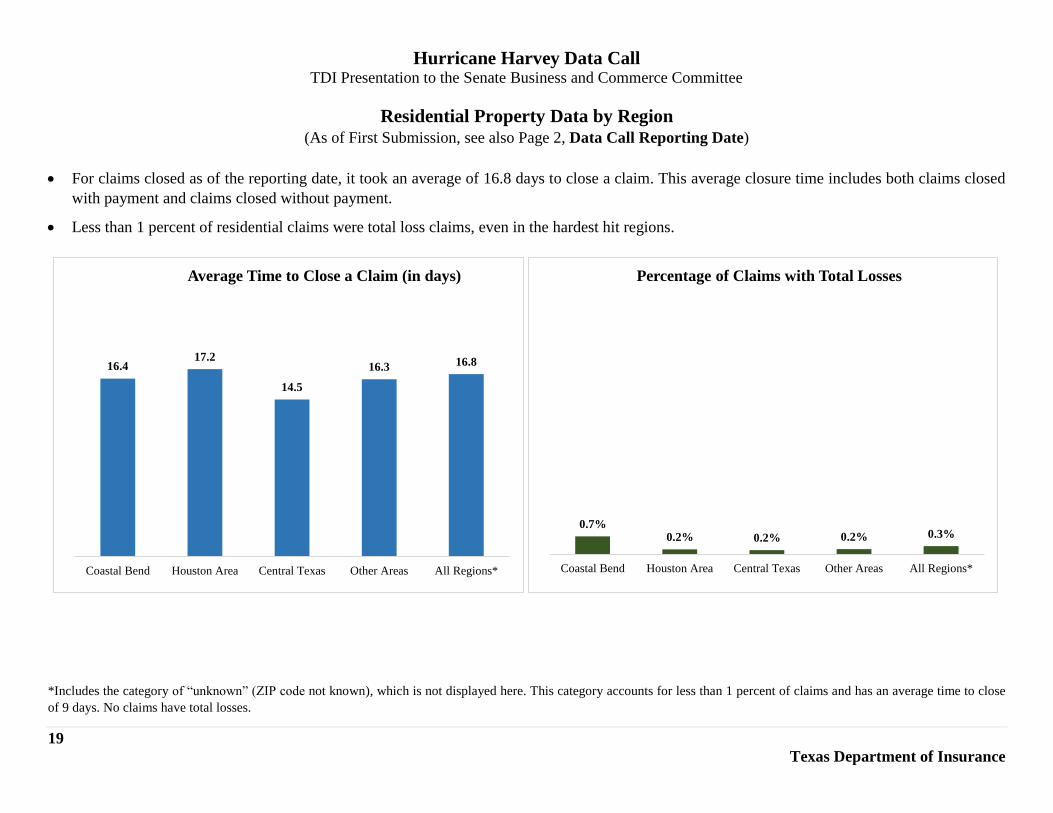
For claims closed as of the reporting date, it took an average of 16.8 days to close a claim. This average closure time includes both claims closed
with payment and claims closed without payment.
Less than 1 percent of residential claims were total loss claims, even in the hardest hit regions.
*Includes the category of “unknown” (ZIP code not known), which is not displayed here. This category accounts for less than 1 percent of claims and has an average time to close
of 9 days. No claims have total losses.
16.4 17.2
14.5
16.3 16.8
Coastal Bend Houston Area Central Texas Other Areas All Regions*
Average Time to Close a Claim (in days)
0.7%0.2% 0.2% 0.2% 0.3%
Coastal Bend Houston Area Central Texas Other Areas All Regions*
Percentage of Claims with Total Losses
Hurricane Harvey Data Call TDI Presentation to the Senate Business and Commerce Committee
20
Texas Department of Insurance
Replacement Cost Value (RCV) Policies vs. Actual Cash Value (ACV) Policies Residential Property (excluding Mobile Homeowners)
(As of First Submission, see also Page 2, Data Call Reporting Date)
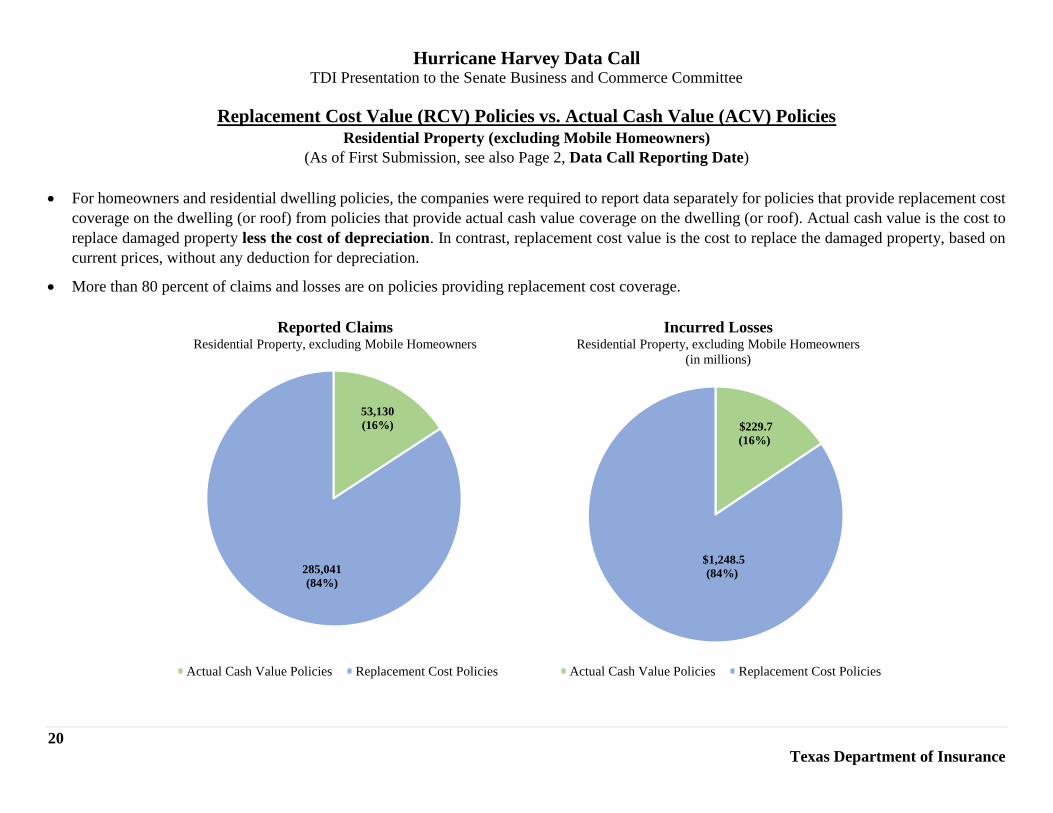
For homeowners and residential dwelling policies, the companies were required to report data separately for policies that provide replacement cost
coverage on the dwelling (or roof) from policies that provide actual cash value coverage on the dwelling (or roof). Actual cash value is the cost to
replace damaged property less the cost of depreciation. In contrast, replacement cost value is the cost to replace the damaged property, based on
current prices, without any deduction for depreciation.
More than 80 percent of claims and losses are on policies providing replacement cost coverage.
53,130
(16%)
285,041
(84%)
Reported ClaimsResidential Property, excluding Mobile Homeowners
Actual Cash Value Policies Replacement Cost Policies
$229.7
(16%)
$1,248.5
(84%)
Incurred LossesResidential Property, excluding Mobile Homeowners
(in millions)
Actual Cash Value Policies Replacement Cost Policies
Hurricane Harvey Data Call TDI Presentation to the Senate Business and Commerce Committee
21
Texas Department of Insurance
Replacement Cost Value (RCV) Policies vs. Actual Cash Value (ACV) Policies
Residential Property (excluding Mobile Homeowners)
(As of First Submission, see also Page 2, Data Call Reporting Date)
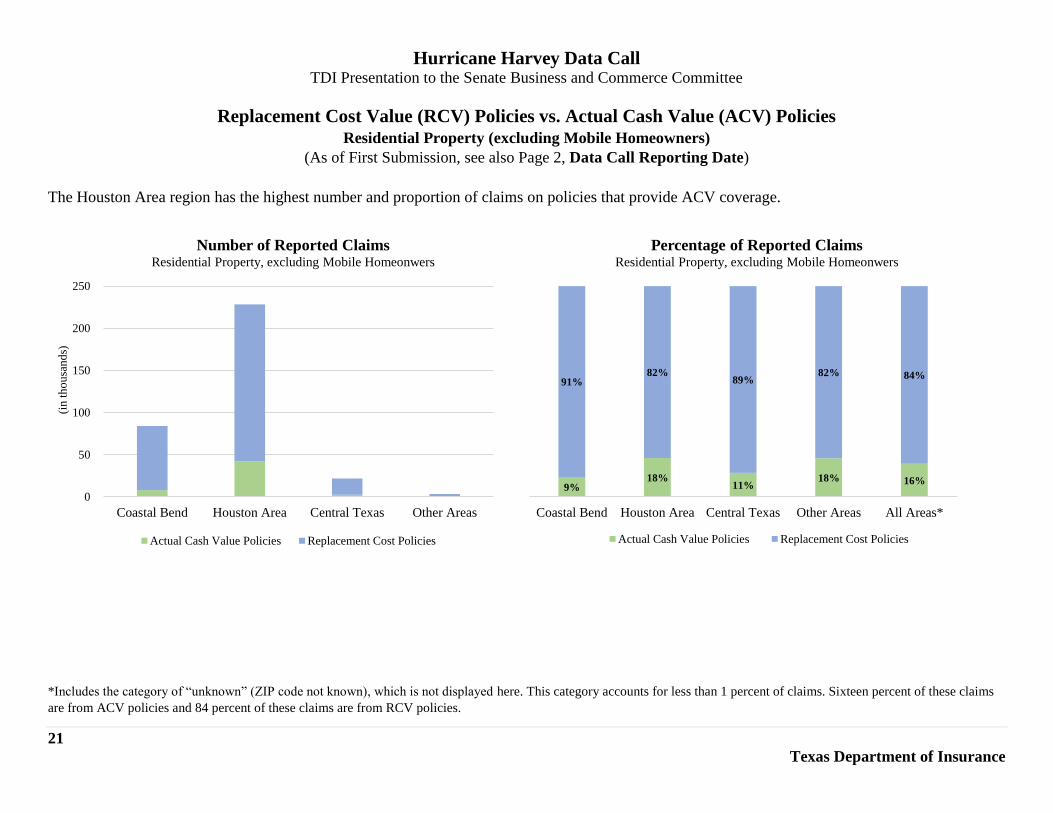
The Houston Area region has the highest number and proportion of claims on policies that provide ACV coverage.
*Includes the category of “unknown” (ZIP code not known), which is not displayed here. This category accounts for less than 1 percent of claims. Sixteen percent of these claims
are from ACV policies and 84 percent of these claims are from RCV policies.
0
50
100
150
200
250
Coastal Bend Houston Area Central Texas Other Areas
(in
th
ou
san
ds)
Number of Reported ClaimsResidential Property, excluding Mobile Homeonwers
Actual Cash Value Policies Replacement Cost Policies
9%18%
11%18% 16%
91%82%
89%82% 84%
Coastal Bend Houston Area Central Texas Other Areas All Areas*
Percentage of Reported ClaimsResidential Property, excluding Mobile Homeonwers
Actual Cash Value Policies Replacement Cost Policies
Hurricane Harvey Data Call TDI Presentation to the Senate Business and Commerce Committee
22
Texas Department of Insurance
Replacement Cost Value (RCV) Policies vs. Actual Cash Value (ACV) Policies
Residential Property (excluding Mobile Homeowners)
(As of First Submission, see also Page 2, Data Call Reporting Date)
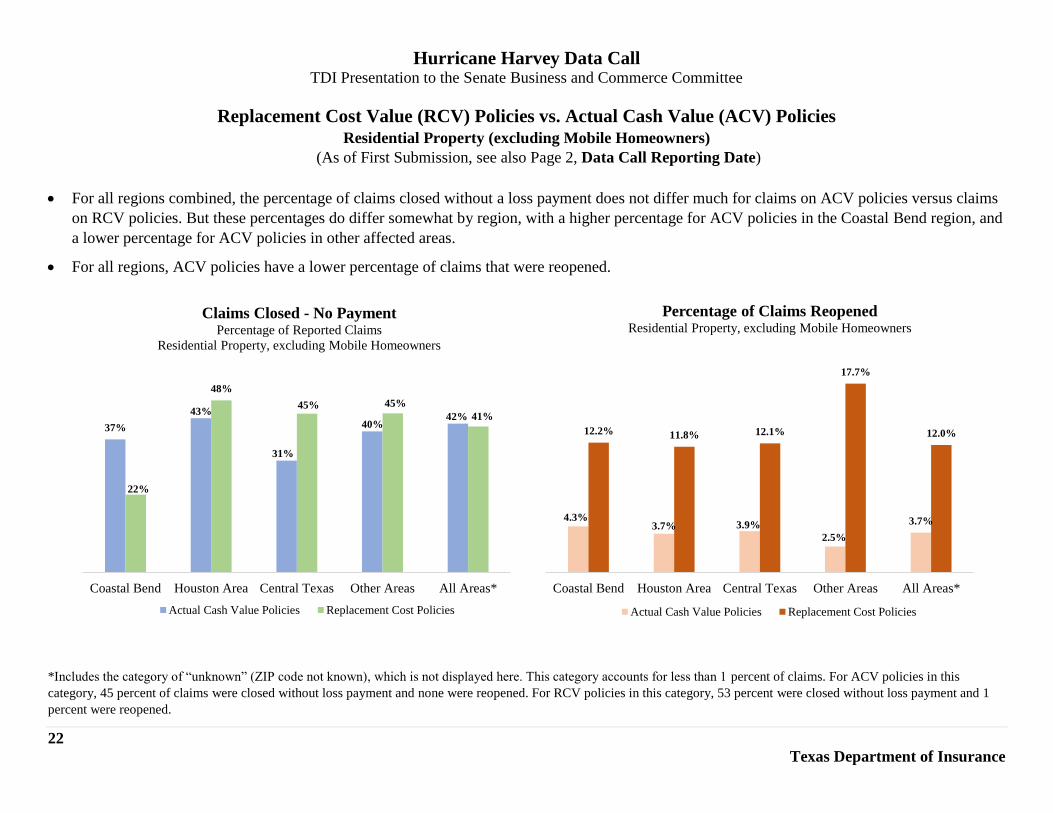
For all regions combined, the percentage of claims closed without a loss payment does not differ much for claims on ACV policies versus claims
on RCV policies. But these percentages do differ somewhat by region, with a higher percentage for ACV policies in the Coastal Bend region, and
a lower percentage for ACV policies in other affected areas.
For all regions, ACV policies have a lower percentage of claims that were reopened.
*Includes the category of “unknown” (ZIP code not known), which is not displayed here. This category accounts for less than 1 percent of claims. For ACV policies in this
category, 45 percent of claims were closed without loss payment and none were reopened. For RCV policies in this category, 53 percent were closed without loss payment and 1
percent were reopened.
37%
43%
31%
40%42%
22%
48%
45% 45%
41%
Coastal Bend Houston Area Central Texas Other Areas All Areas*
Claims Closed - No PaymentPercentage of Reported Claims
Residential Property, excluding Mobile Homeowners
Actual Cash Value Policies Replacement Cost Policies
4.3%3.7% 3.9%
2.5%
3.7%
12.2% 11.8% 12.1%
17.7%
12.0%
Coastal Bend Houston Area Central Texas Other Areas All Areas*
Percentage of Claims Reopened Residential Property, excluding Mobile Homeowners
Actual Cash Value Policies Replacement Cost Policies
Hurricane Harvey Data Call TDI Presentation to the Senate Business and Commerce Committee
23
Texas Department of Insurance
Replacement Cost Value (RCV) Policies vs. Actual Cash Value (ACV) Policies
Residential Property (excluding Mobile Homeowners)
(As of First Submission, see also Page 2, Data Call Reporting Date)
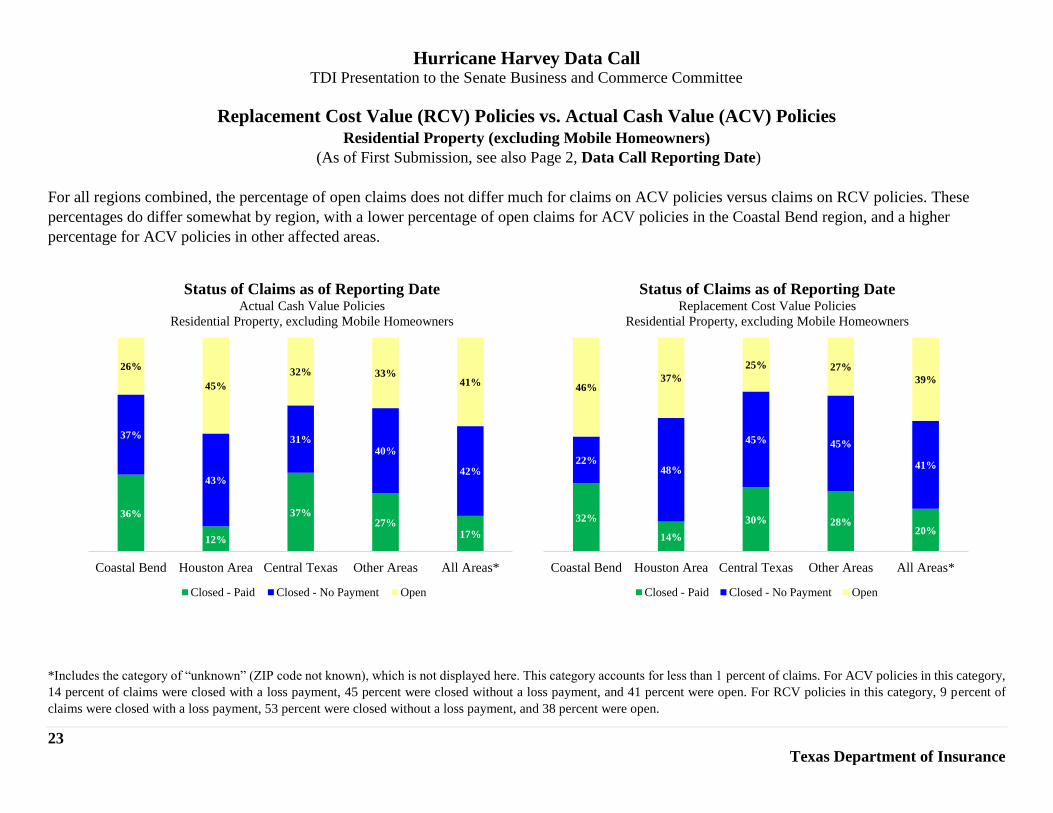
For all regions combined, the percentage of open claims does not differ much for claims on ACV policies versus claims on RCV policies. These
percentages do differ somewhat by region, with a lower percentage of open claims for ACV policies in the Coastal Bend region, and a higher
percentage for ACV policies in other affected areas.
*Includes the category of “unknown” (ZIP code not known), which is not displayed here. This category accounts for less than 1 percent of claims. For ACV policies in this category,
14 percent of claims were closed with a loss payment, 45 percent were closed without a loss payment, and 41 percent were open. For RCV policies in this category, 9 percent of
claims were closed with a loss payment, 53 percent were closed without a loss payment, and 38 percent were open.
36%
12%
37%27%
17%
37%
43%
31%40%
42%
26%
45%
32% 33%41%
Coastal Bend Houston Area Central Texas Other Areas All Areas*
Status of Claims as of Reporting DateActual Cash Value Policies
Residential Property, excluding Mobile Homeowners
Closed - Paid Closed - No Payment Open
32%
14%
30% 28%20%
22%48%
45% 45%
41%
46%37%
25% 27%
39%
Coastal Bend Houston Area Central Texas Other Areas All Areas*
Status of Claims as of Reporting DateReplacement Cost Value Policies
Residential Property, excluding Mobile Homeowners
Closed - Paid Closed - No Payment Open
Hurricane Harvey Data Call TDI Presentation to the Senate Business and Commerce Committee
24
Texas Department of Insurance
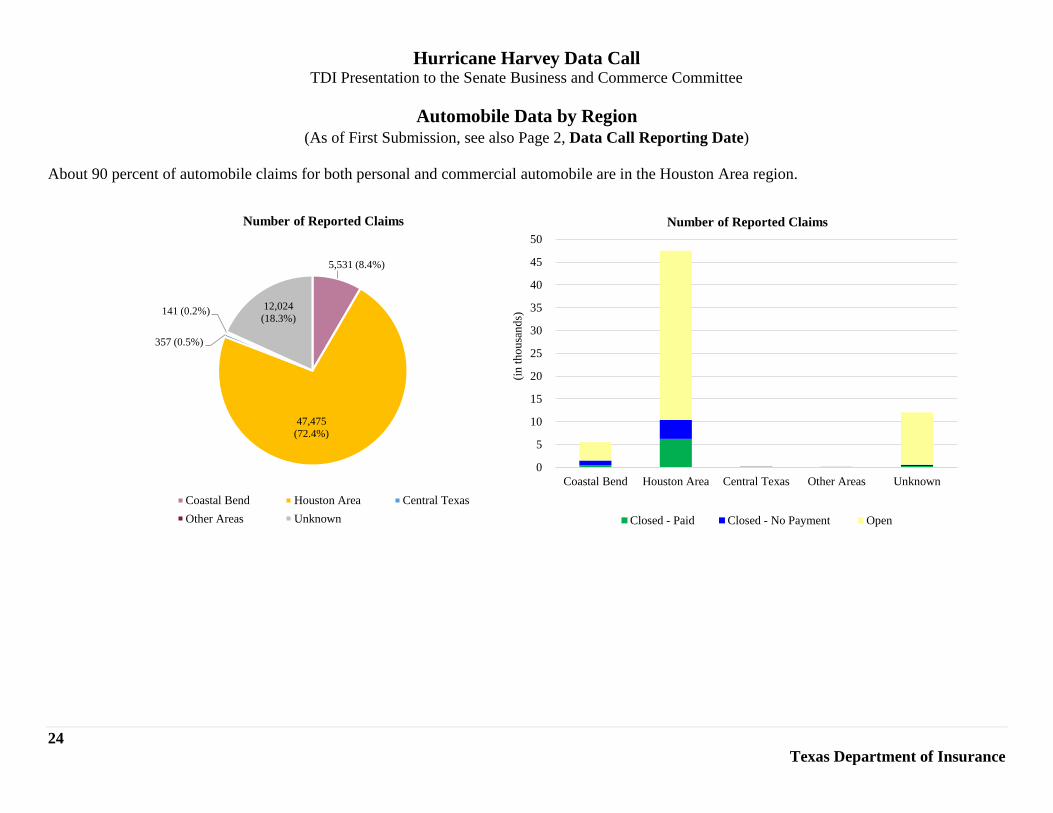
Automobile Data by Region (As of First Submission, see also Page 2, Data Call Reporting Date)
About 90 percent of automobile claims for both personal and commercial automobile are in the Houston Area region.
5,531 (8.4%)
47,475
(72.4%)
357 (0.5%)
141 (0.2%)12,024
(18.3%)
Number of Reported Claims
Coastal Bend Houston Area Central Texas
Other Areas Unknown
0
5
10
15
20
25
30
35
40
45
50
Coastal Bend Houston Area Central Texas Other Areas Unknown
(in
th
ou
san
ds)
Number of Reported Claims
Closed - Paid Closed - No Payment Open
Hurricane Harvey Data Call TDI Presentation to the Senate Business and Commerce Committee
25
Texas Department of Insurance
Automobile Data by Region (As of First Submission, see also Page 2, Data Call Reporting Date)
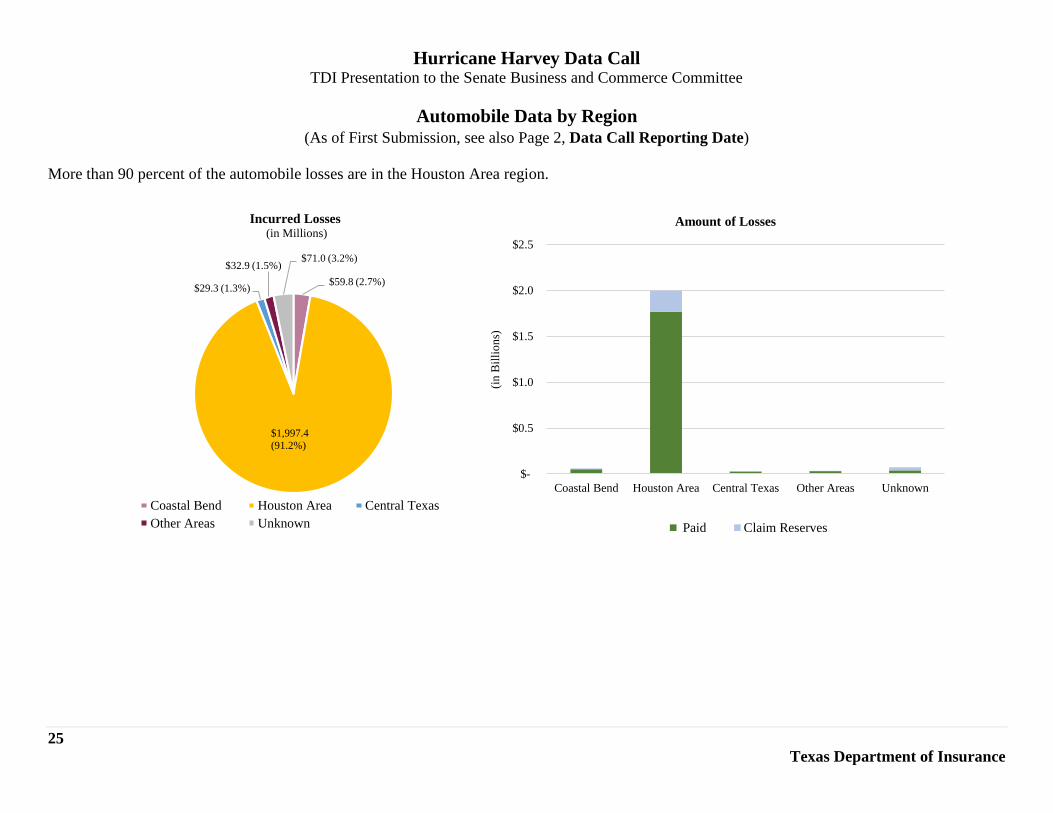
More than 90 percent of the automobile losses are in the Houston Area region.
$59.8 (2.7%)
$1,997.4
(91.2%)
$29.3 (1.3%)
$32.9 (1.5%)$71.0 (3.2%)
Incurred Losses(in Millions)
Coastal Bend Houston Area Central Texas
Other Areas Unknown
$-
$0.5
$1.0
$1.5
$2.0
$2.5
Coastal Bend Houston Area Central Texas Other Areas Unknown(i
n B
illi
on
s)
Amount of Losses
Paid Claim Reserves
Hurricane Harvey Data Call TDI Presentation to the Senate Business and Commerce Committee
26
Texas Department of Insurance
Automobile Data by Region (As of First Submission, see also Page 2, Data Call Reporting Date)
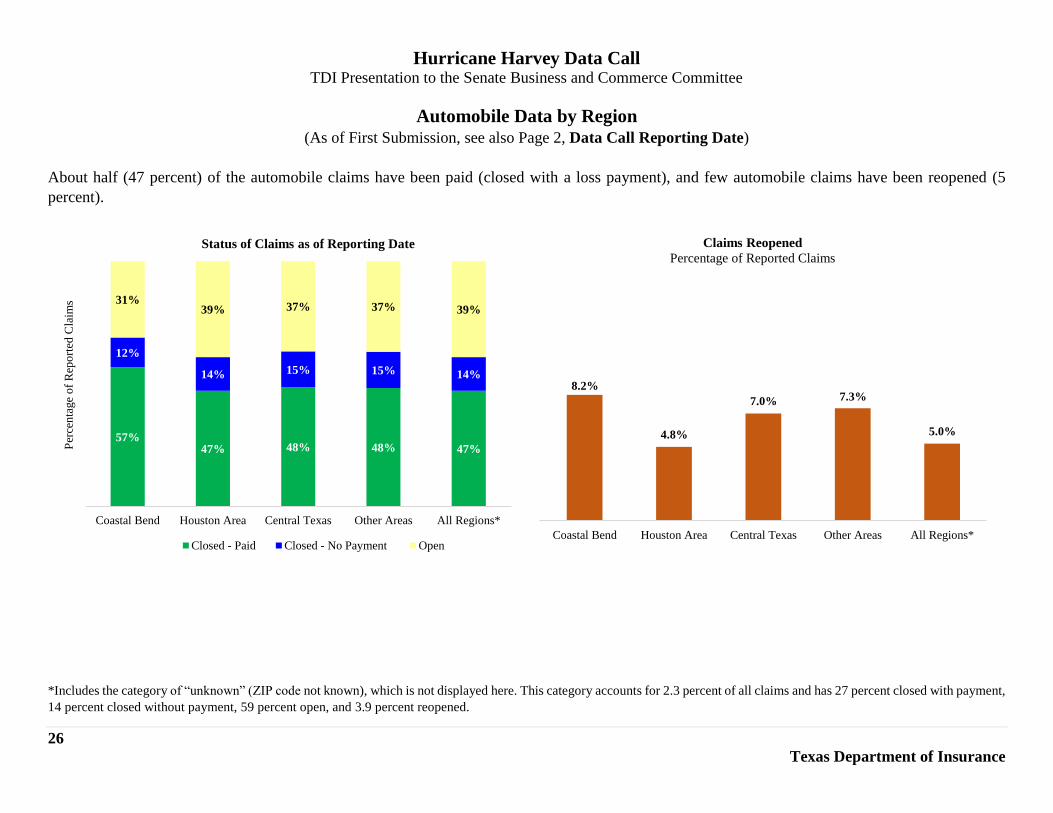
About half (47 percent) of the automobile claims have been paid (closed with a loss payment), and few automobile claims have been reopened (5
percent).
*Includes the category of “unknown” (ZIP code not known), which is not displayed here. This category accounts for 2.3 percent of all claims and has 27 percent closed with payment,
14 percent closed without payment, 59 percent open, and 3.9 percent reopened.
57%47% 48% 48% 47%
12%
14% 15% 15% 14%
31%39% 37% 37% 39%
Coastal Bend Houston Area Central Texas Other Areas All Regions*
Per
cen
tage
of
Rep
ort
ed C
laim
s
Status of Claims as of Reporting Date
Closed - Paid Closed - No Payment Open
8.2%
4.8%
7.0% 7.3%
5.0%
Coastal Bend Houston Area Central Texas Other Areas All Regions*
Claims Reopened
Percentage of Reported Claims
Hurricane Harvey Data Call TDI Presentation to the Senate Business and Commerce Committee
27
Texas Department of Insurance
Automobile Data by Region (As of First Submission, see also Page 2, Data Call Reporting Date)
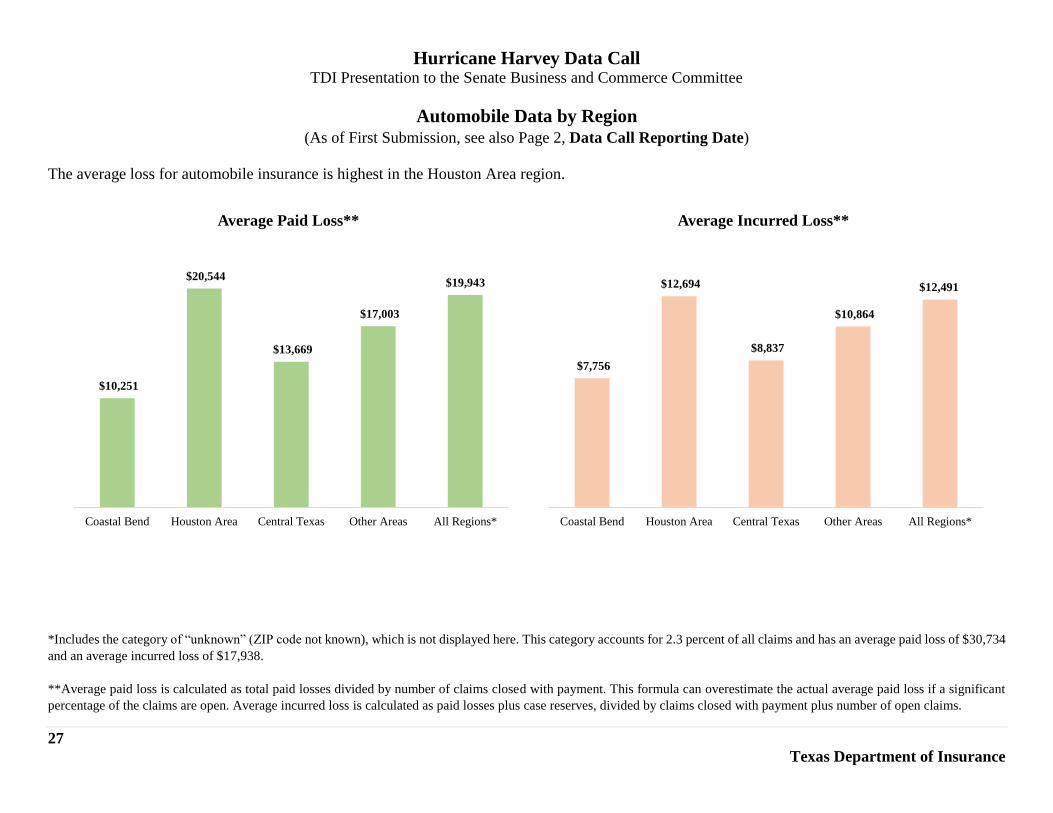
The average loss for automobile insurance is highest in the Houston Area region.
*Includes the category of “unknown” (ZIP code not known), which is not displayed here. This category accounts for 2.3 percent of all claims and has an average paid loss of $30,734
and an average incurred loss of $17,938.
**Average paid loss is calculated as total paid losses divided by number of claims closed with payment. This formula can overestimate the actual average paid loss if a significant
percentage of the claims are open. Average incurred loss is calculated as paid losses plus case reserves, divided by claims closed with payment plus number of open claims.
$10,251
$20,544
$13,669
$17,003
$19,943
Coastal Bend Houston Area Central Texas Other Areas All Regions*
Average Paid Loss**
$7,756
$12,694
$8,837
$10,864
$12,491
Coastal Bend Houston Area Central Texas Other Areas All Regions*
Average Incurred Loss**
Hurricane Harvey Data Call TDI Presentation to the Senate Business and Commerce Committee
28
Texas Department of Insurance
Automobile Data by Region (As of First Submission, see also Page 2, Data Call Reporting Date)
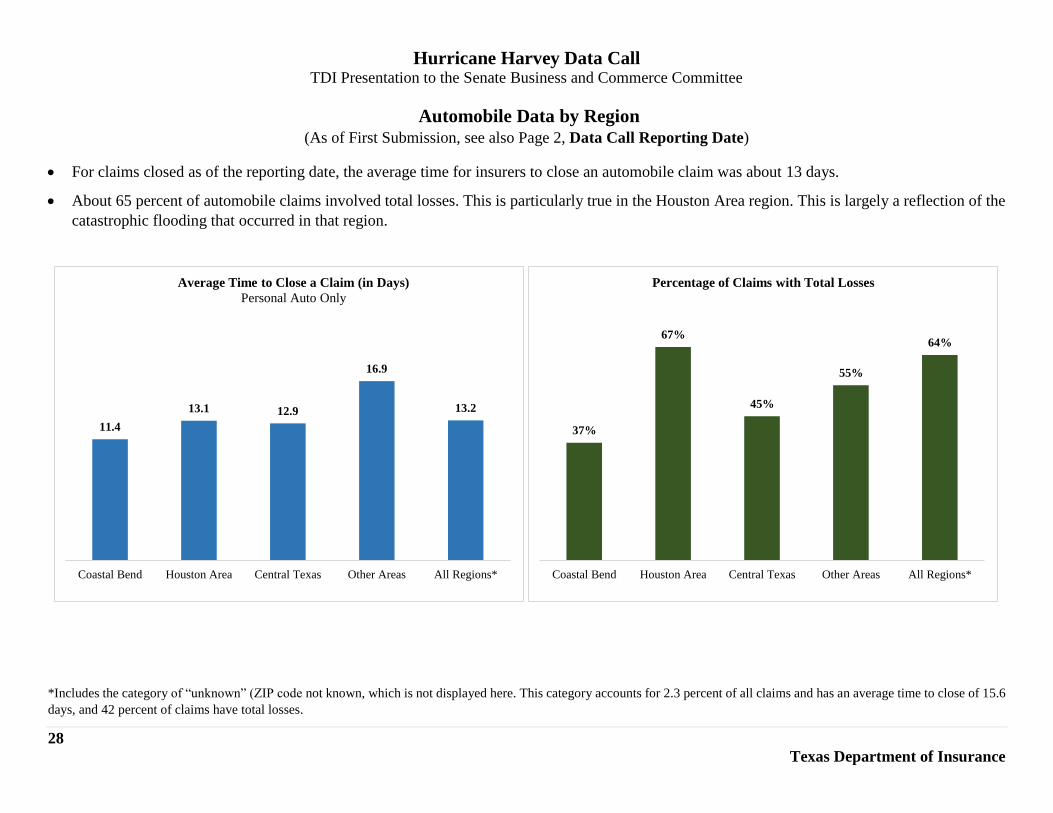
For claims closed as of the reporting date, the average time for insurers to close an automobile claim was about 13 days.
About 65 percent of automobile claims involved total losses. This is particularly true in the Houston Area region. This is largely a reflection of the
catastrophic flooding that occurred in that region.
*Includes the category of “unknown” (ZIP code not known, which is not displayed here. This category accounts for 2.3 percent of all claims and has an average time to close of 15.6
days, and 42 percent of claims have total losses.
11.4
13.1 12.9
16.9
13.2
Coastal Bend Houston Area Central Texas Other Areas All Regions*
Average Time to Close a Claim (in Days)
Personal Auto Only
37%
67%
45%
55%
64%
Coastal Bend Houston Area Central Texas Other Areas All Regions*
Percentage of Claims with Total Losses
Hurricane Harvey Data Call TDI Presentation to the Senate Business and Commerce Committee
29
Texas Department of Insurance
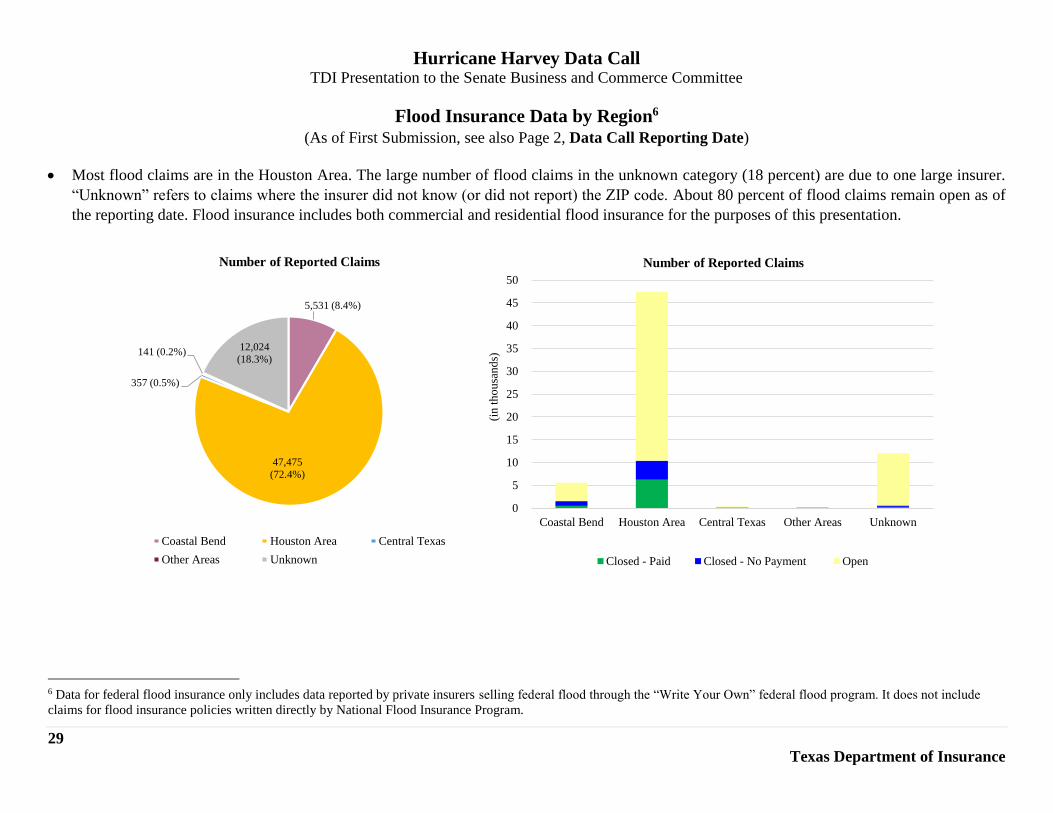
Flood Insurance Data by Region6 (As of First Submission, see also Page 2, Data Call Reporting Date)
Most flood claims are in the Houston Area. The large number of flood claims in the unknown category (18 percent) are due to one large insurer.
“Unknown” refers to claims where the insurer did not know (or did not report) the ZIP code. About 80 percent of flood claims remain open as of
the reporting date. Flood insurance includes both commercial and residential flood insurance for the purposes of this presentation.
6 Data for federal flood insurance only includes data reported by private insurers selling federal flood through the “Write Your Own” federal flood program. It does not include
claims for flood insurance policies written directly by National Flood Insurance Program.
5,531 (8.4%)
47,475
(72.4%)
357 (0.5%)
141 (0.2%)12,024
(18.3%)
Number of Reported Claims
Coastal Bend Houston Area Central Texas
Other Areas Unknown
0
5
10
15
20
25
30
35
40
45
50
Coastal Bend Houston Area Central Texas Other Areas Unknown
(in
th
ou
san
ds)
Number of Reported Claims
Closed - Paid Closed - No Payment Open
Hurricane Harvey Data Call TDI Presentation to the Senate Business and Commerce Committee
30
Texas Department of Insurance
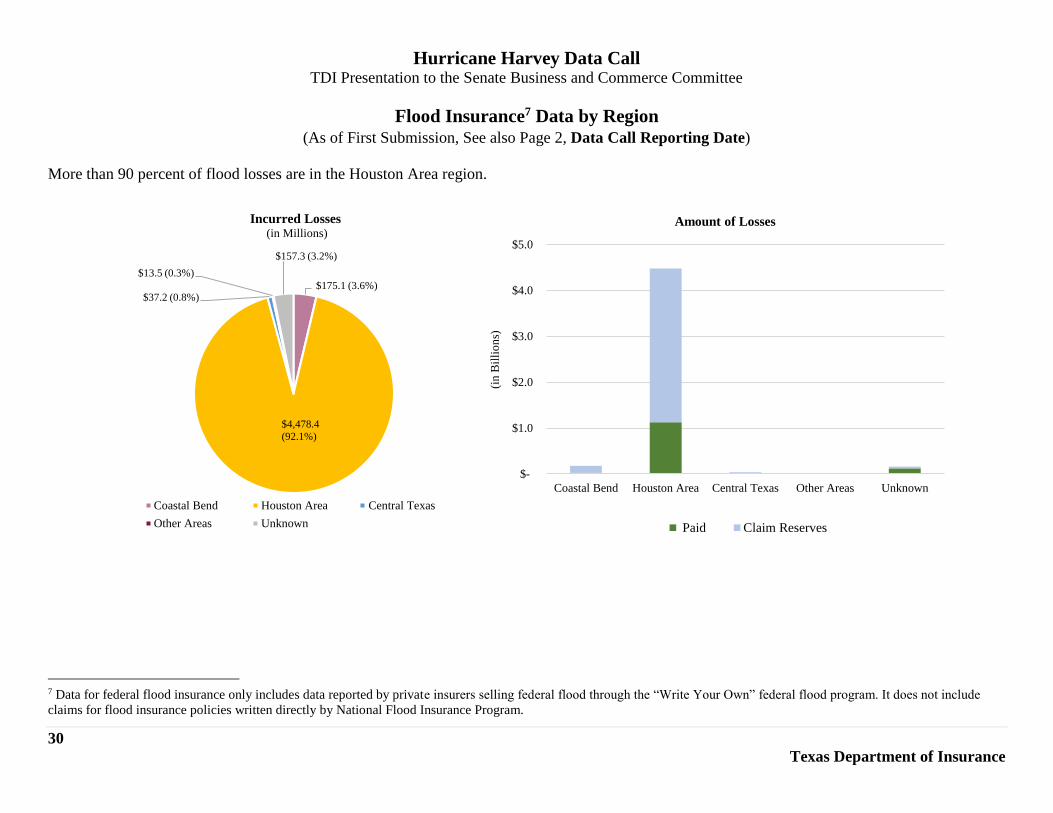
Flood Insurance7 Data by Region (As of First Submission, See also Page 2, Data Call Reporting Date)
More than 90 percent of flood losses are in the Houston Area region.
7 Data for federal flood insurance only includes data reported by private insurers selling federal flood through the “Write Your Own” federal flood program. It does not include
claims for flood insurance policies written directly by National Flood Insurance Program.
$175.1 (3.6%)
$4,478.4
(92.1%)
$37.2 (0.8%)
$13.5 (0.3%)
$157.3 (3.2%)
Incurred Losses(in Millions)
Coastal Bend Houston Area Central Texas
Other Areas Unknown
$-
$1.0
$2.0
$3.0
$4.0
$5.0
Coastal Bend Houston Area Central Texas Other Areas Unknown(i
n B
illi
on
s)
Amount of Losses
Paid Claim Reserves
Hurricane Harvey Data Call TDI Presentation to the Senate Business and Commerce Committee
31
Texas Department of Insurance
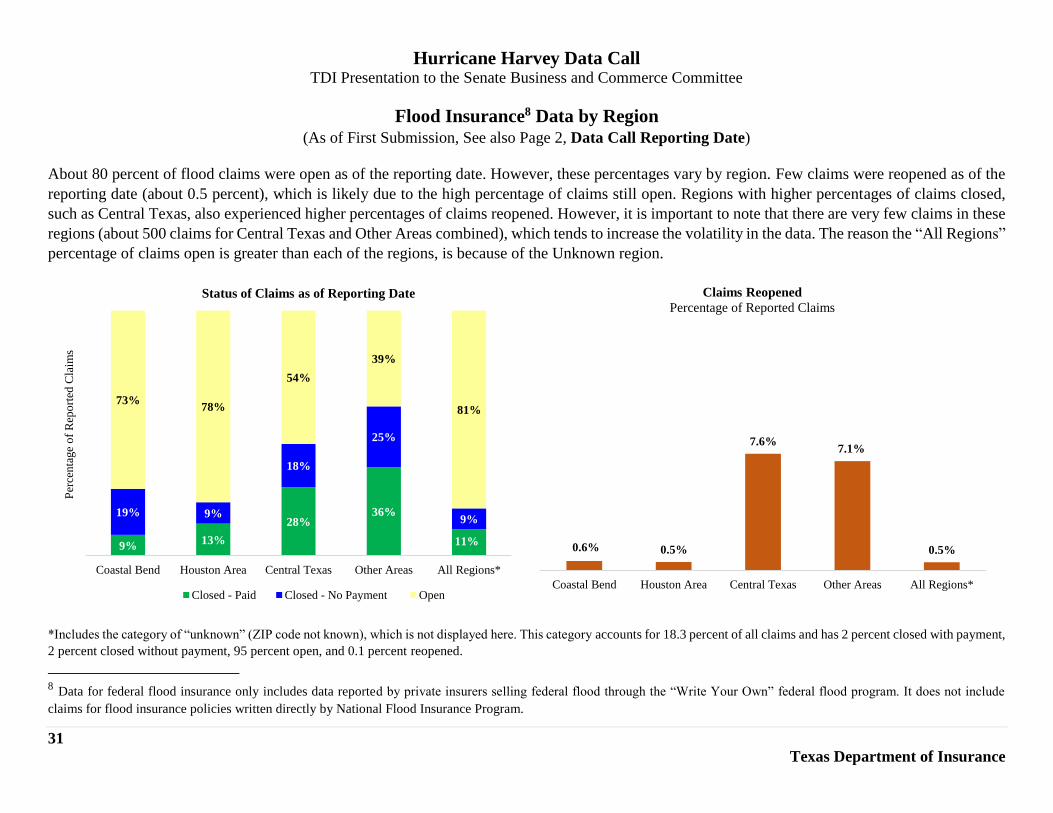
Flood Insurance8 Data by Region (As of First Submission, See also Page 2, Data Call Reporting Date)
About 80 percent of flood claims were open as of the reporting date. However, these percentages vary by region. Few claims were reopened as of the
reporting date (about 0.5 percent), which is likely due to the high percentage of claims still open. Regions with higher percentages of claims closed,
such as Central Texas, also experienced higher percentages of claims reopened. However, it is important to note that there are very few claims in these
regions (about 500 claims for Central Texas and Other Areas combined), which tends to increase the volatility in the data. The reason the “All Regions”
percentage of claims open is greater than each of the regions, is because of the Unknown region.
*Includes the category of “unknown” (ZIP code not known), which is not displayed here. This category accounts for 18.3 percent of all claims and has 2 percent closed with payment,
2 percent closed without payment, 95 percent open, and 0.1 percent reopened.
8 Data for federal flood insurance only includes data reported by private insurers selling federal flood through the “Write Your Own” federal flood program. It does not include
claims for flood insurance policies written directly by National Flood Insurance Program.
9%13%
28%36%
11%
19% 9%
18%
25%
9%
73%78%
54%
39%
81%
Coastal Bend Houston Area Central Texas Other Areas All Regions*
Per
cen
tage
of
Rep
ort
ed C
laim
s
Status of Claims as of Reporting Date
Closed - Paid Closed - No Payment Open
0.6% 0.5%
7.6%7.1%
0.5%
Coastal Bend Houston Area Central Texas Other Areas All Regions*
Claims Reopened
Percentage of Reported Claims
Hurricane Harvey Data Call TDI Presentation to the Senate Business and Commerce Committee
32
Texas Department of Insurance
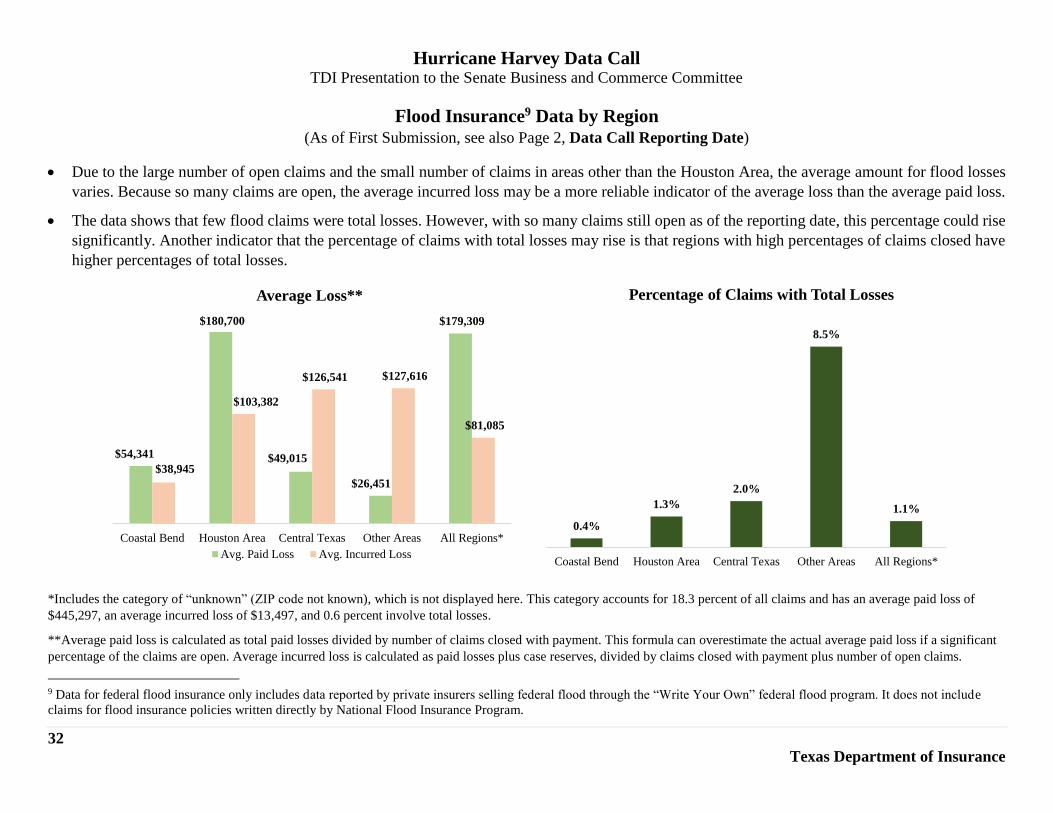
Flood Insurance9 Data by Region (As of First Submission, see also Page 2, Data Call Reporting Date)
Due to the large number of open claims and the small number of claims in areas other than the Houston Area, the average amount for flood losses
varies. Because so many claims are open, the average incurred loss may be a more reliable indicator of the average loss than the average paid loss.
The data shows that few flood claims were total losses. However, with so many claims still open as of the reporting date, this percentage could rise
significantly. Another indicator that the percentage of claims with total losses may rise is that regions with high percentages of claims closed have
higher percentages of total losses.
*Includes the category of “unknown” (ZIP code not known), which is not displayed here. This category accounts for 18.3 percent of all claims and has an average paid loss of
$445,297, an average incurred loss of $13,497, and 0.6 percent involve total losses.
**Average paid loss is calculated as total paid losses divided by number of claims closed with payment. This formula can overestimate the actual average paid loss if a significant
percentage of the claims are open. Average incurred loss is calculated as paid losses plus case reserves, divided by claims closed with payment plus number of open claims.
9 Data for federal flood insurance only includes data reported by private insurers selling federal flood through the “Write Your Own” federal flood program. It does not include
claims for flood insurance policies written directly by National Flood Insurance Program.
$54,341
$180,700
$49,015
$26,451
$179,309
$38,945
$103,382
$126,541 $127,616
$81,085
Coastal Bend Houston Area Central Texas Other Areas All Regions*
Average Loss**
Avg. Paid Loss Avg. Incurred Loss
0.4%
1.3%
2.0%
8.5%
1.1%
Coastal Bend Houston Area Central Texas Other Areas All Regions*
Percentage of Claims with Total Losses
Hurricane Harvey Data Call TDI Presentation to the Senate Business and Commerce Committee
33
Texas Department of Insurance
Commercial Property Data by Region (As of First Submission, see also Page 2, Data Call Reporting Date)
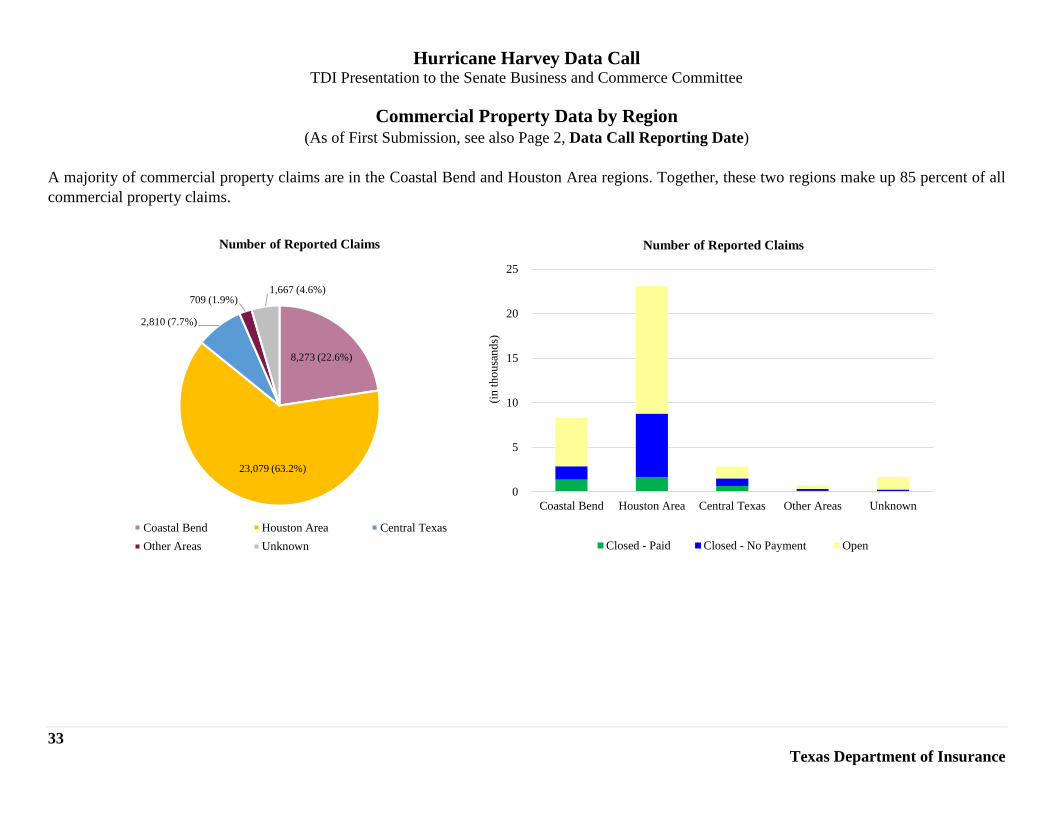
A majority of commercial property claims are in the Coastal Bend and Houston Area regions. Together, these two regions make up 85 percent of all
commercial property claims.
8,273 (22.6%)
23,079 (63.2%)
2,810 (7.7%)
709 (1.9%)1,667 (4.6%)
Number of Reported Claims
Coastal Bend Houston Area Central Texas
Other Areas Unknown
0
5
10
15
20
25
Coastal Bend Houston Area Central Texas Other Areas Unknown(i
n t
ho
usa
nd
s)
Number of Reported Claims
Closed - Paid Closed - No Payment Open
Hurricane Harvey Data Call TDI Presentation to the Senate Business and Commerce Committee
34
Texas Department of Insurance
Commercial Property Data by Region (As of First Submission, see also Page 2, Data Call Reporting Date)
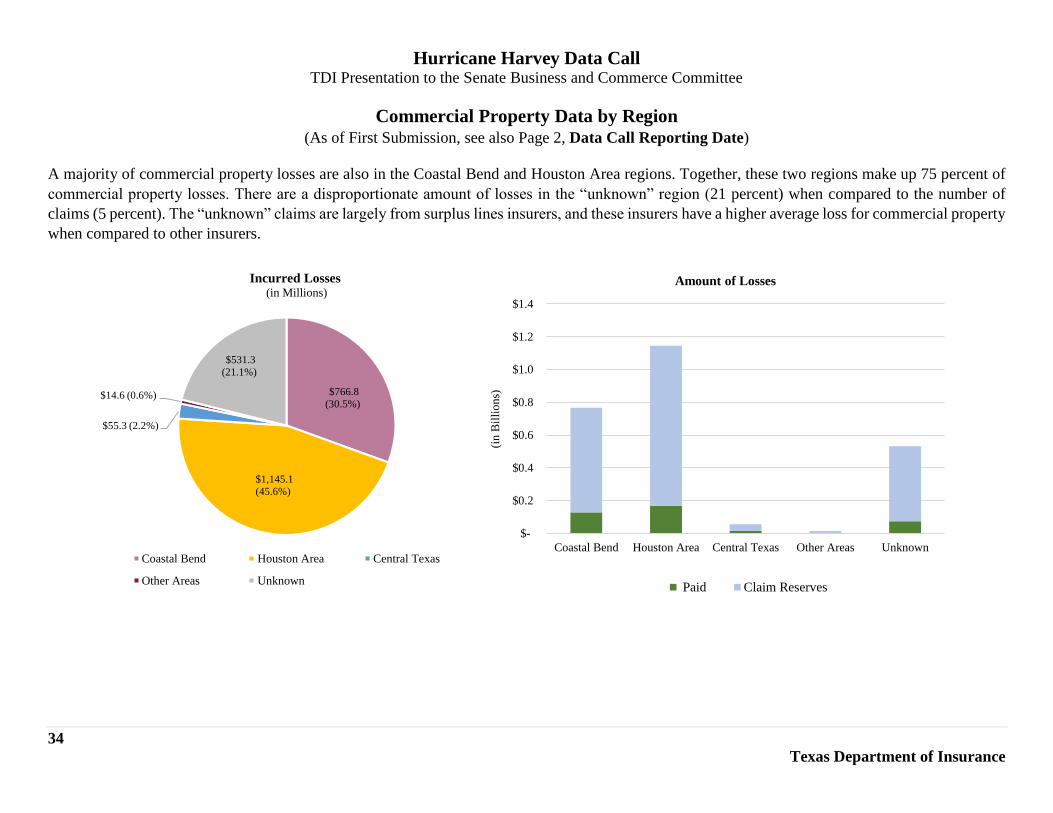
A majority of commercial property losses are also in the Coastal Bend and Houston Area regions. Together, these two regions make up 75 percent of
commercial property losses. There are a disproportionate amount of losses in the “unknown” region (21 percent) when compared to the number of
claims (5 percent). The “unknown” claims are largely from surplus lines insurers, and these insurers have a higher average loss for commercial property
when compared to other insurers.
$766.8
(30.5%)
$1,145.1
(45.6%)
$55.3 (2.2%)
$14.6 (0.6%)
$531.3
(21.1%)
Incurred Losses(in Millions)
Coastal Bend Houston Area Central Texas
Other Areas Unknown
$-
$0.2
$0.4
$0.6
$0.8
$1.0
$1.2
$1.4
Coastal Bend Houston Area Central Texas Other Areas Unknown
(in
Bil
lio
ns)
Amount of Losses
Paid Claim Reserves
Hurricane Harvey Data Call TDI Presentation to the Senate Business and Commerce Committee
35
Texas Department of Insurance
Commercial Property Data by Region (As of First Submission, see also Page 2, Data Call Reporting Date)
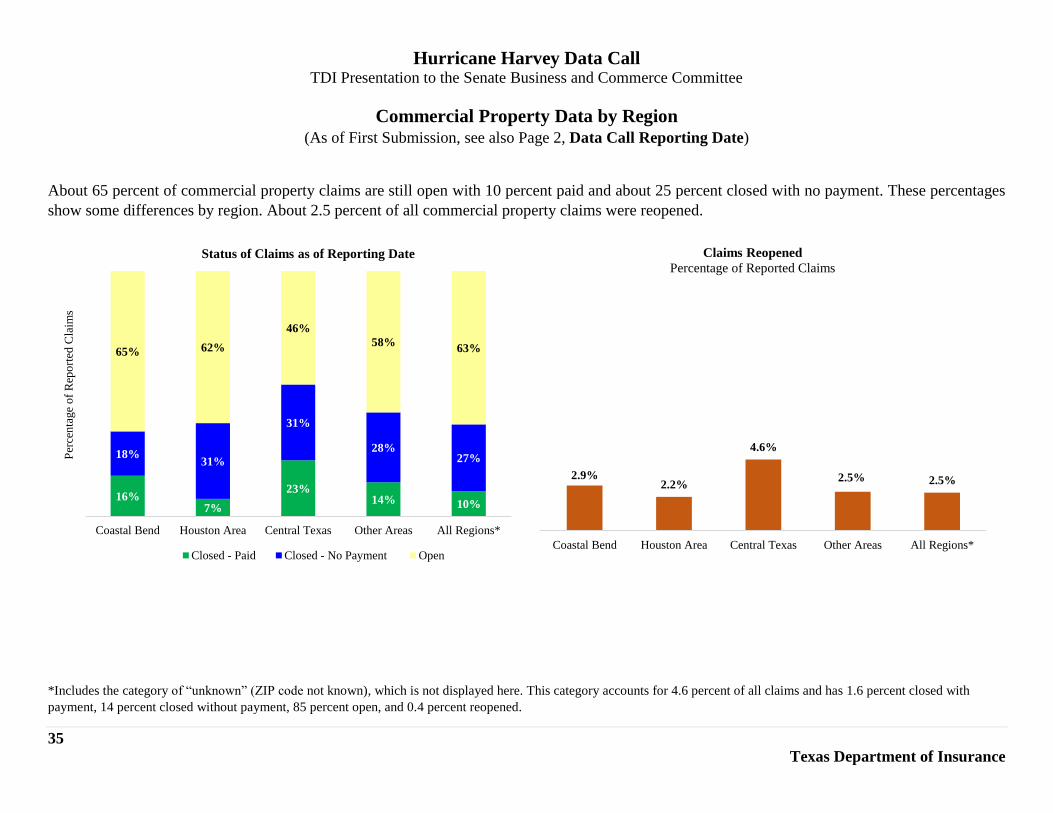
About 65 percent of commercial property claims are still open with 10 percent paid and about 25 percent closed with no payment. These percentages
show some differences by region. About 2.5 percent of all commercial property claims were reopened.
*Includes the category of “unknown” (ZIP code not known), which is not displayed here. This category accounts for 4.6 percent of all claims and has 1.6 percent closed with
payment, 14 percent closed without payment, 85 percent open, and 0.4 percent reopened.
16%7%
23%14% 10%
18%31%
31%
28%27%
65% 62%
46%
58%63%
Coastal Bend Houston Area Central Texas Other Areas All Regions*
Per
cen
tage
of
Rep
ort
ed C
laim
s
Status of Claims as of Reporting Date
Closed - Paid Closed - No Payment Open
2.9%2.2%
4.6%
2.5% 2.5%
Coastal Bend Houston Area Central Texas Other Areas All Regions*
Claims Reopened
Percentage of Reported Claims
Hurricane Harvey Data Call TDI Presentation to the Senate Business and Commerce Committee
36
Texas Department of Insurance
Commercial Property Data by Region (As of First Submission, see also Page 2, Data Call Reporting Date)
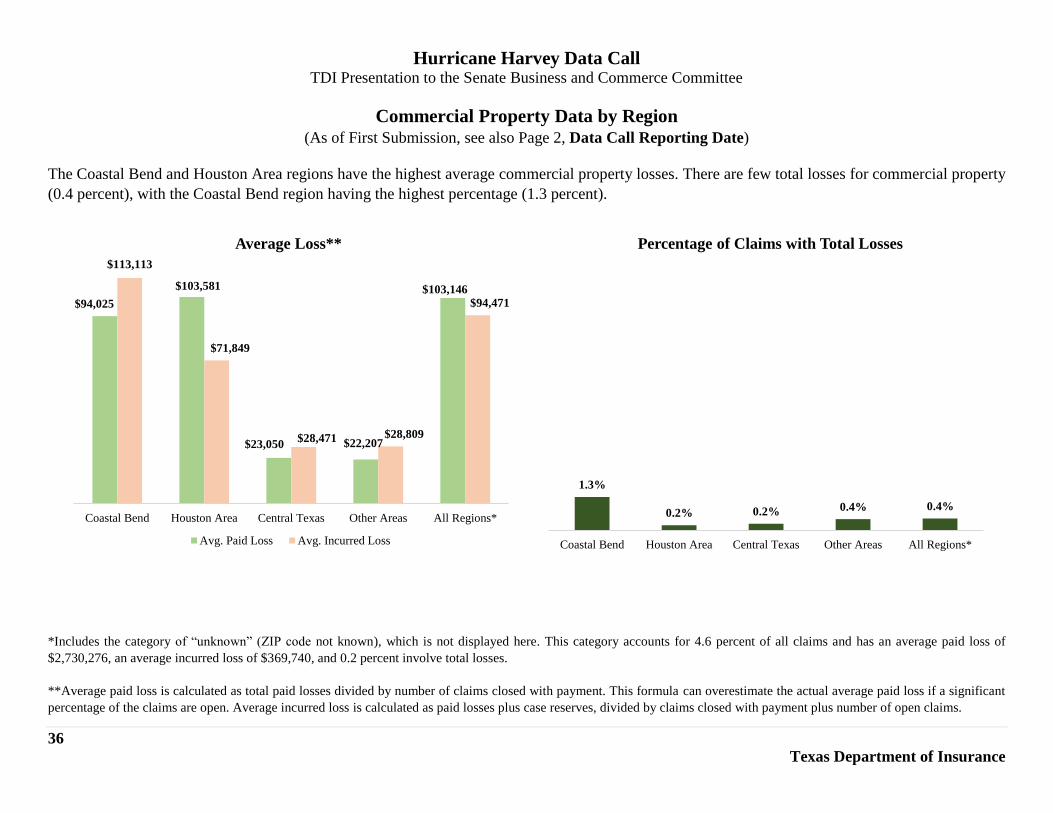
The Coastal Bend and Houston Area regions have the highest average commercial property losses. There are few total losses for commercial property
(0.4 percent), with the Coastal Bend region having the highest percentage (1.3 percent).
*Includes the category of “unknown” (ZIP code not known), which is not displayed here. This category accounts for 4.6 percent of all claims and has an average paid loss of
$2,730,276, an average incurred loss of $369,740, and 0.2 percent involve total losses.
**Average paid loss is calculated as total paid losses divided by number of claims closed with payment. This formula can overestimate the actual average paid loss if a significant
percentage of the claims are open. Average incurred loss is calculated as paid losses plus case reserves, divided by claims closed with payment plus number of open claims.
$94,025
$103,581
$23,050 $22,207
$103,146
$113,113
$71,849
$28,471 $28,809
$94,471
Coastal Bend Houston Area Central Texas Other Areas All Regions*
Average Loss**
Avg. Paid Loss Avg. Incurred Loss
1.3%
0.2% 0.2% 0.4% 0.4%
Coastal Bend Houston Area Central Texas Other Areas All Regions*
Percentage of Claims with Total Losses
Hurricane Harvey Data Call TDI Presentation to the Senate Business and Commerce Committee
37
Texas Department of Insurance
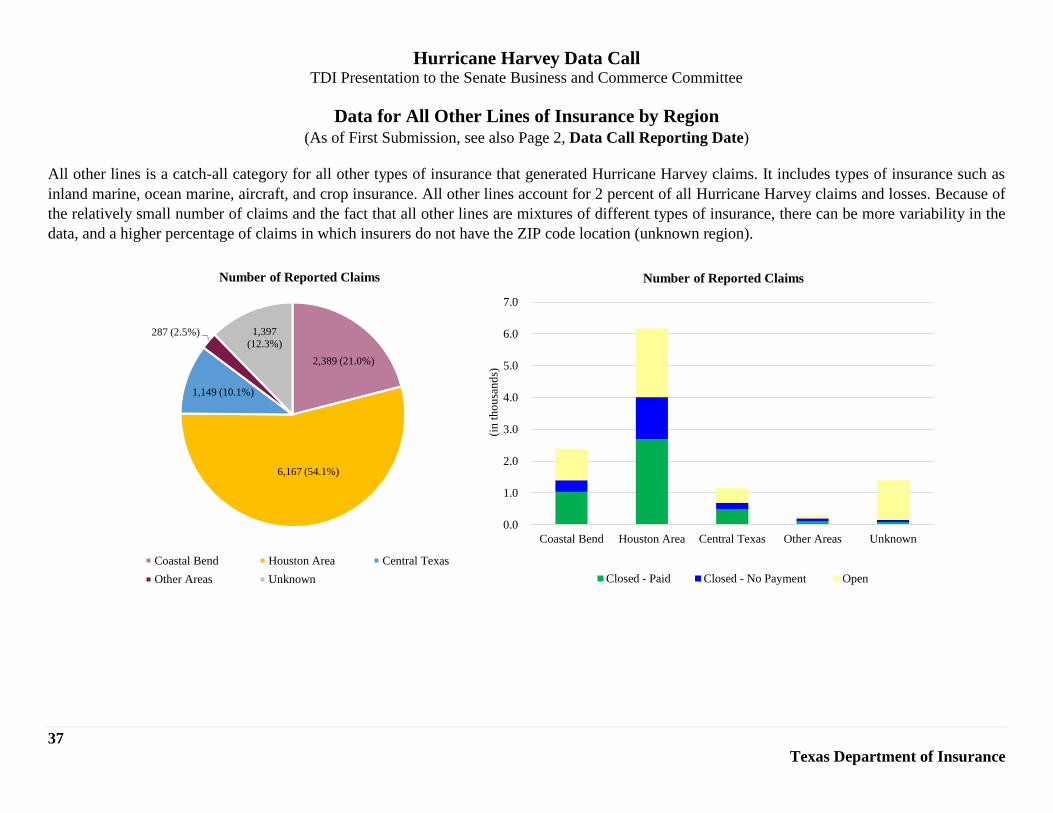
Data for All Other Lines of Insurance by Region (As of First Submission, see also Page 2, Data Call Reporting Date)
All other lines is a catch-all category for all other types of insurance that generated Hurricane Harvey claims. It includes types of insurance such as
inland marine, ocean marine, aircraft, and crop insurance. All other lines account for 2 percent of all Hurricane Harvey claims and losses. Because of
the relatively small number of claims and the fact that all other lines are mixtures of different types of insurance, there can be more variability in the
data, and a higher percentage of claims in which insurers do not have the ZIP code location (unknown region).
2,389 (21.0%)
6,167 (54.1%)
1,149 (10.1%)
287 (2.5%) 1,397
(12.3%)
Number of Reported Claims
Coastal Bend Houston Area Central Texas
Other Areas Unknown
0.0
1.0
2.0
3.0
4.0
5.0
6.0
7.0
Coastal Bend Houston Area Central Texas Other Areas Unknown
(in
th
ou
san
ds)
Number of Reported Claims
Closed - Paid Closed - No Payment Open
Hurricane Harvey Data Call TDI Presentation to the Senate Business and Commerce Committee
38
Texas Department of Insurance
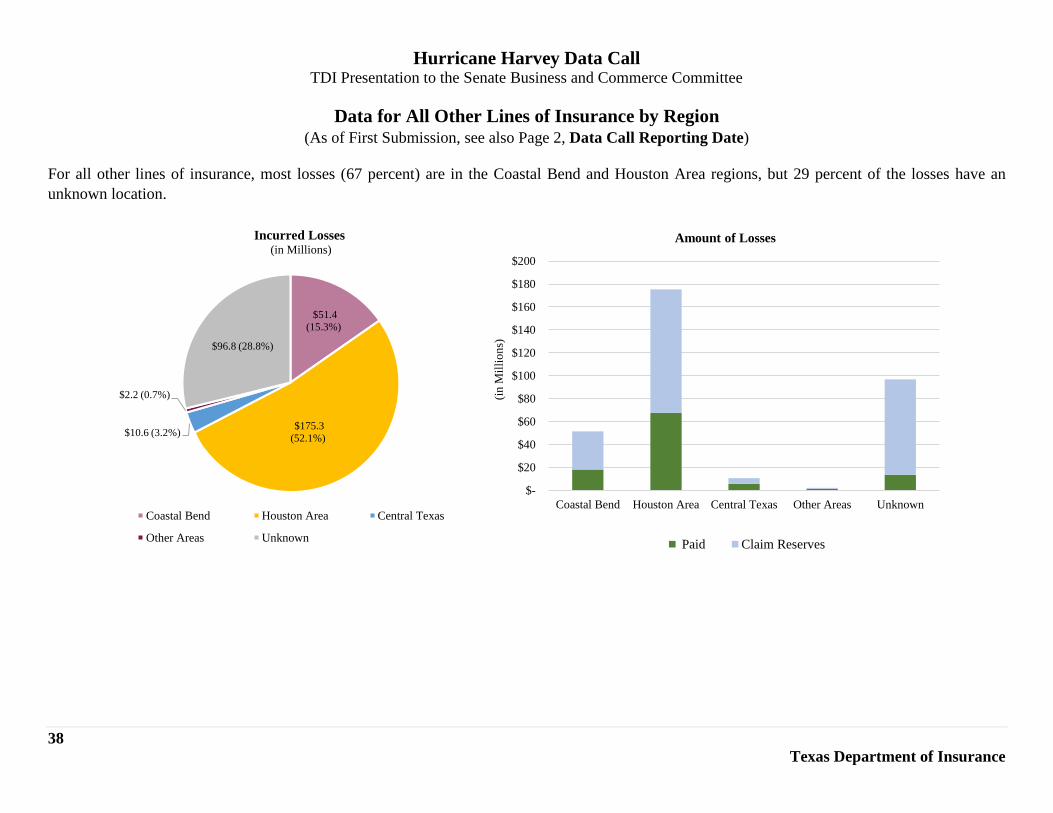
Data for All Other Lines of Insurance by Region (As of First Submission, see also Page 2, Data Call Reporting Date)
For all other lines of insurance, most losses (67 percent) are in the Coastal Bend and Houston Area regions, but 29 percent of the losses have an
unknown location.
$51.4
(15.3%)
$175.3
(52.1%)$10.6 (3.2%)
$2.2 (0.7%)
$96.8 (28.8%)
Incurred Losses(in Millions)
Coastal Bend Houston Area Central Texas
Other Areas Unknown
$-
$20
$40
$60
$80
$100
$120
$140
$160
$180
$200
Coastal Bend Houston Area Central Texas Other Areas Unknown(i
n M
illi
on
s)
Amount of Losses
Paid Claim Reserves
Hurricane Harvey Data Call TDI Presentation to the Senate Business and Commerce Committee
39
Texas Department of Insurance
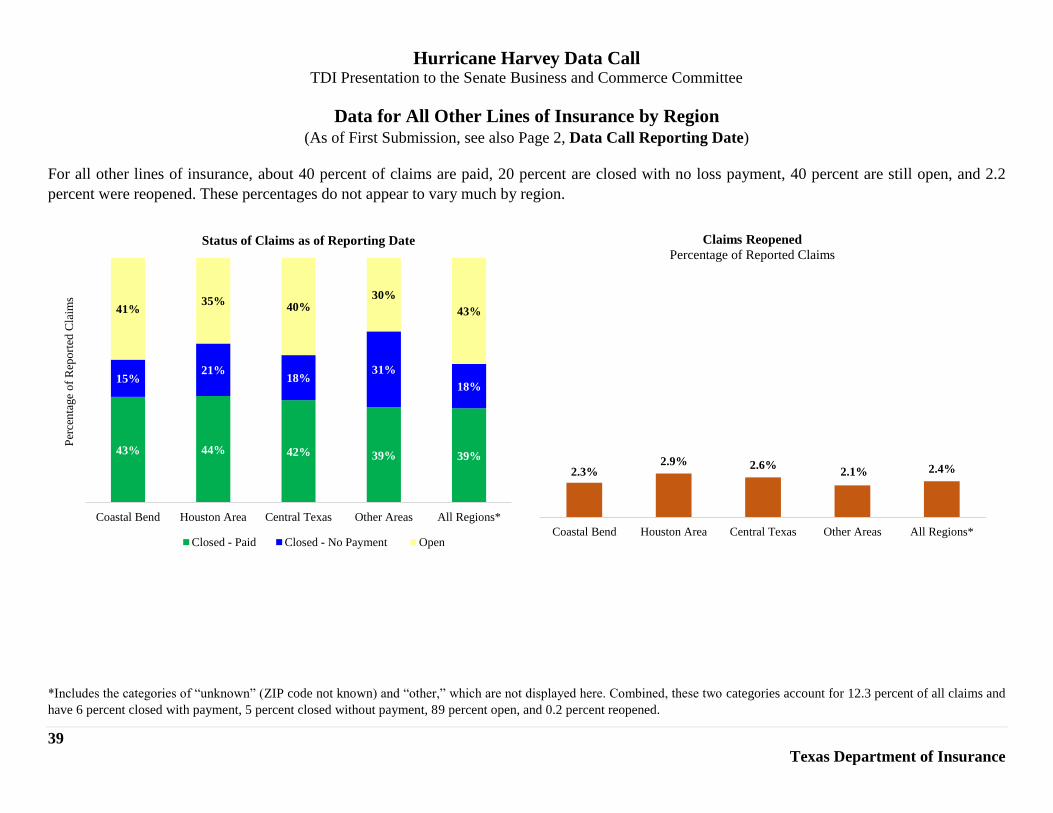
Data for All Other Lines of Insurance by Region (As of First Submission, see also Page 2, Data Call Reporting Date)
For all other lines of insurance, about 40 percent of claims are paid, 20 percent are closed with no loss payment, 40 percent are still open, and 2.2
percent were reopened. These percentages do not appear to vary much by region.
*Includes the categories of “unknown” (ZIP code not known) and “other,” which are not displayed here. Combined, these two categories account for 12.3 percent of all claims and
have 6 percent closed with payment, 5 percent closed without payment, 89 percent open, and 0.2 percent reopened.
43% 44% 42% 39% 39%
15%21%
18%31%
18%
41%35%
40%30%
43%
Coastal Bend Houston Area Central Texas Other Areas All Regions*
Per
cen
tage
of
Rep
ort
ed C
laim
s
Status of Claims as of Reporting Date
Closed - Paid Closed - No Payment Open
2.3%2.9% 2.6%
2.1% 2.4%
Coastal Bend Houston Area Central Texas Other Areas All Regions*
Claims Reopened
Percentage of Reported Claims
Hurricane Harvey Data Call TDI Presentation to the Senate Business and Commerce Committee
40
Texas Department of Insurance
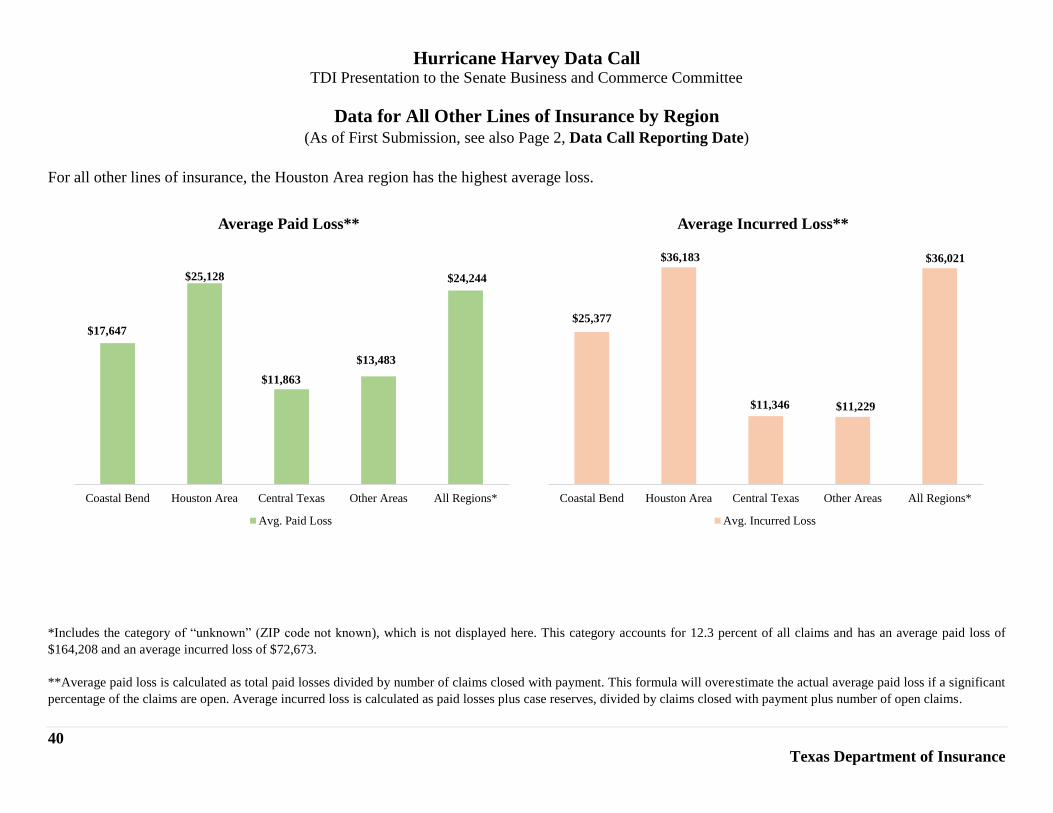
Data for All Other Lines of Insurance by Region (As of First Submission, see also Page 2, Data Call Reporting Date)
For all other lines of insurance, the Houston Area region has the highest average loss.
*Includes the category of “unknown” (ZIP code not known), which is not displayed here. This category accounts for 12.3 percent of all claims and has an average paid loss of
$164,208 and an average incurred loss of $72,673.
**Average paid loss is calculated as total paid losses divided by number of claims closed with payment. This formula will overestimate the actual average paid loss if a significant
percentage of the claims are open. Average incurred loss is calculated as paid losses plus case reserves, divided by claims closed with payment plus number of open claims.
$17,647
$25,128
$11,863
$13,483
$24,244
Coastal Bend Houston Area Central Texas Other Areas All Regions*
Average Paid Loss**
Avg. Paid Loss
$25,377
$36,183
$11,346 $11,229
$36,021
Coastal Bend Houston Area Central Texas Other Areas All Regions*
Average Incurred Loss**
Avg. Incurred Loss
Hurricane Harvey Data Call TDI Presentation to the Senate Business and Commerce Committee
41
Texas Department of Insurance
Appendix I: Glossary of Terms
Data Elements Average incurred loss is a measure of the average amount of loss. It is calculated as the total incurred losses divided by the total number of claims
closed with payment plus the total number of open claims.
Average paid loss is a measure of the average amount paid to claimants, excluding claims closed without payment. It is calculated as the total paid
losses divided by the total number of claims closed with payment. Since insurers tend to make partial payments before closing a claim (for example,
an additional living expense payment), the average paid loss can be unusually high if there are many open claims.
Claims closed means claims that were closed as of the reporting date. It includes both claims closed with payment and claims closed – no payment.
These claims may have been reopened, or may never have been reopened, at some time during the lifetime of the claim.
Claims closed – no payment means claims that were closed as of the reporting date and where the insurer has not made any payment to the claimant.
These claims may have been reopened, or may never have been reopened, at some time during the lifetime of the claim.
Claims closed with payment or paid claims means claims that were closed as of the reporting date and where the insurer has made a payment to the
claimant. These claims may have been reopened, or may never have been reopened, at some time during the lifetime of the claim.
Claim reserves means reserves for individual claims (case reserves) held by the insurer, usually in expectation of future payment.
Estimated ultimate gross loss means estimates of amounts insurers ultimately expect to pay because of Hurricane Harvey for direct business written.
It is calculated as incurred losses plus incurred but not reported (IBNR) reserves for business directly written.
Estimated ultimate net loss means estimates of losses insurers expect to pay because of Hurricane Harvey after ceding losses to other companies
(both affiliated and non-affiliated companies) through reinsurance.
Incurred But Not Reported (or IBNR) Reserves means amounts insurers set aside to pay for claims that have already occurred but have not yet been
reported to the insurance company. IBNR reserves are determined using actuarial methods.
Hurricane Harvey Data Call TDI Presentation to the Senate Business and Commerce Committee
42
Texas Department of Insurance
Incurred losses mean amounts paid by the insurer to the claimant plus any claim reserves (or case reserves) held by the insurer. Incurred losses do
not include reserves for incurred but not reported (IBNR) claims or other actuarially established reserves.
Open claims mean claims that were open as of the reporting date. Insurers may have made payments to the claimant for these claims or the insurers
may have made no payment to the claimant. These claims may have been previously closed (reopened claims) or may have never been closed.
Paid losses mean amounts paid by the insurer to the claimant. Paid losses do not include any expense amounts paid by the insurer to adjust the claim.
Reinsurance is insurance that other insurance companies buy to protect their surplus (or ability to pay future claims). Estimated ultimate net loss
includes the impact of reinsurance purchased from other insurance companies (ceded reinsurance) and, as applicable, reinsurance sold to other insurance
companies (assumed reinsurance).
Reopened claim means a claim that has been reopened at least once during the lifetime of the claim. Reopened claims may be open or closed as of the
reporting date, and may be closed without payment or closed with payment. There are many reasons an insurer may reopen a claim, ranging from
purely administrative reasons (for example, to process a payment to the claims adjuster for adjusting the claim) to a reinvestigation or reinspection of
a claim.
Reported claim means a claim reported to the insurer. For residential property insurance, a claim means a single residence regardless of the number
of coverages under which the insurer makes payment. For personal automobile insurance, a claim means a single vehicle. For other lines of insurance,
insurers use their own definition of what constitutes a single “claim.” In this case, one claim may mean a single policy that generated a claim, a single
piece of property that generated a claim, a single coverage on a policy that generated a claim, or some other definition.
Total loss or claims with total losses means, for other than automobile insurance, a property for which the insurer either paid the applicable policy
limit or is expected to pay the policy limit. For automobile insurance, a total loss means a vehicle the insurer determined could not be repaired or the
cost to repair the vehicle exceeded the value of the vehicle. For other than automobile insurance, a total loss claim may not necessarily mean the
property was destroyed (or nearly destroyed), particularly for commercial property insurance where several insurers may participate in insuring the
building at different layers of loss. Claims with total losses may be open or closed with payment.
Hurricane Harvey Data Call TDI Presentation to the Senate Business and Commerce Committee
43
Texas Department of Insurance
Types of Insurance Actual Cash Value (or ACV) means the cost to repair or replace a piece of property based on current prices, less the cost of depreciation. Depreciation
is the reduction in value of a piece of property over time due to wear and tear, deterioration, or aging.
All other commercial property is commercial property insurance other than businessowners and business interruption. It includes most insurance that
provides coverage to commercial buildings and their contents against fire, windstorm, and other perils. Commercial property insurance may be sold
alone, or packaged with other policies, such as a premises liability or commercial automobile policy. Commercial property policies usually do not
provide coverage for flood or rising waters.
All other lines of insurance is a catch-all for other types of insurance that include ocean marine insurance, inland marine insurance, crop insurance,
and aircraft insurance.
Businessowners insurance provides property and liability insurance for small businesses. It may provide coverage for buildings, contents, or both, as
well as premises liability coverage. It may also provide coverage for business interruption. Generally, businessowners insurance is designed for small
to medium-sized businesses.
Business interruption insurance provides coverage for loss of business income as a result of a covered peril. Business interruption coverage may be
purchased separately, or purchased as part of a commercial property policy. For the purposes of the data call, insurers reported business interruption
coverage separately even if purchased in conjunction with another policy.
Commercial automobile insurance primarily provides liability coverage for automobiles owned, operated, or in the custody of businesses. If “other
than collision” coverage is purchased, commercial automobile insurance may provide coverage for vehicles owned or leased by the business for damage
caused by weather-related perils, including coverage for flood or rising waters.
Farmowners insurance is similar to homeowners insurance, except it is meant to provide coverage for family farms. In addition to coverage provided
for the residence, it provides coverage for farm buildings and farm equipment. For the purposes of the data call, farmowners insurance is included with
commercial property.
Hurricane Harvey Data Call TDI Presentation to the Senate Business and Commerce Committee
44
Texas Department of Insurance
Federal flood insurance provides coverage for flood or rising water for residential and commercial structures. Federal flood insurance is underwritten
by the federal government, even if sold through private insurance companies. Federal flood insurance is the most common type of flood insurance
coverage purchased.
Homeowners insurance is the type of insurance purchased by most homeowners. It provides property coverage to dwelling and contents of an owner-
occupied house. It usually also provides coverage for other structures on the property (such as storage buildings, detached garages, etc.), coverage for
additional living expenses when the home becomes uninhabitable because of a covered cause of loss, and premises liability coverage for the homeowner.
For the purposes of this data call, homeowners insurance also includes condominium unit owners and renters insurance. Renters and condominium unit
owners insurance provide coverage for the contents of renters and condominium owners, as well as premises liability coverage. Homeowners policies
usually exclude coverage for damage caused by a flood or rising water.
Inland marine insurance is a broad category that encompasses several types of insurance. For the most part, inland marine covers property in transit
or property that is generally mobile. It includes both commercial insurance (motor truck cargo insurance, mobile equipment insurance) and personal
insurance that provides coverage for such things as jewelry or art.
Mobile homeowners insurance is homeowners insurance purchased by owner-occupants of mobile homes. Mobile homeowners policies sometimes
provide coverage for damage cause by flood or rising waters.
Ocean marine insurance provides liability and hull coverage for ocean-going vessels.
Offshore is a catch-all category meant to include risks located offshore for which a ZIP code does not apply.
Personal automobile insurance primarily provides liability coverage for individually owned and operated automobiles. If comprehensive coverage is
purchased, personal automobile insurance usually provides coverage for damage caused by weather-related perils, including coverage for flood or
rising waters.
Personal lines means, for this data call, homeowners insurance, residential dwelling insurance, mobile homeowners insurance, and personal automobile
insurance.
Hurricane Harvey Data Call TDI Presentation to the Senate Business and Commerce Committee
45
Texas Department of Insurance
Private flood insurance provides coverage for flood or rising water for residential or commercial structures. Private flood insurance is underwritten by
private insurance companies rather than the government. Most private flood insurance in Texas is written by insurers that primarily insure commercial
structures.
Replacement cost value (or RCV) means the cost to replace a piece of property with a new one at current prices without any deduction for depreciation.
Residential dwelling insurance is similar to homeowners insurance except that it does not provide premises liability coverage, and it may provide
coverage for fewer perils than a homeowners policy. Dwelling policies can cover fire only; fire and extended coverage; or fire, extended coverage, and
other extended coverages.10 Residential dwelling policies usually exclude coverage for damage caused by a flood or rising waters.
Residential property insurance includes homeowners, mobile homeowners, and residential dwelling insurance.
10 Extended coverage includes windstorm, hurricane, hail, and miscellaneous other perils such as explosion, riot and civil commotion, smoke, and damage from aircraft and
vehicles. Other extended coverage includes water damage and other miscellaneous perils, such as collapse.
Hurricane Harvey Data Call TDI Presentation to the Senate Business and Commerce Committee
46
Texas Department of Insurance
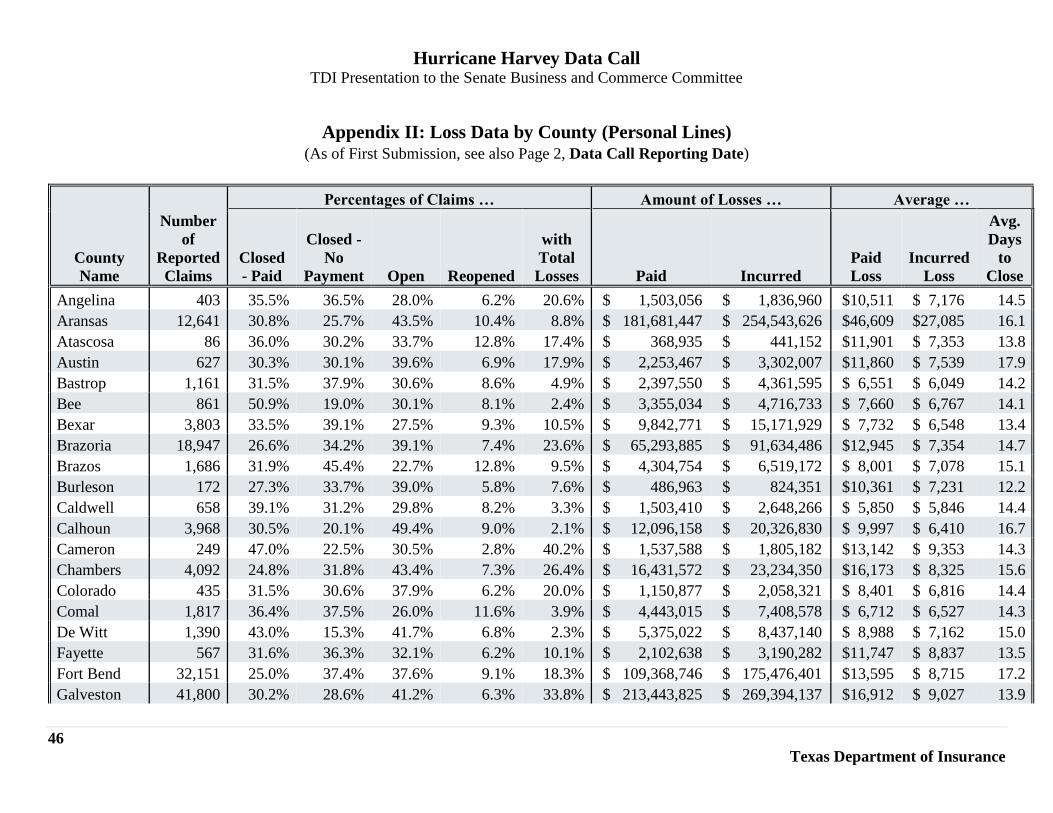
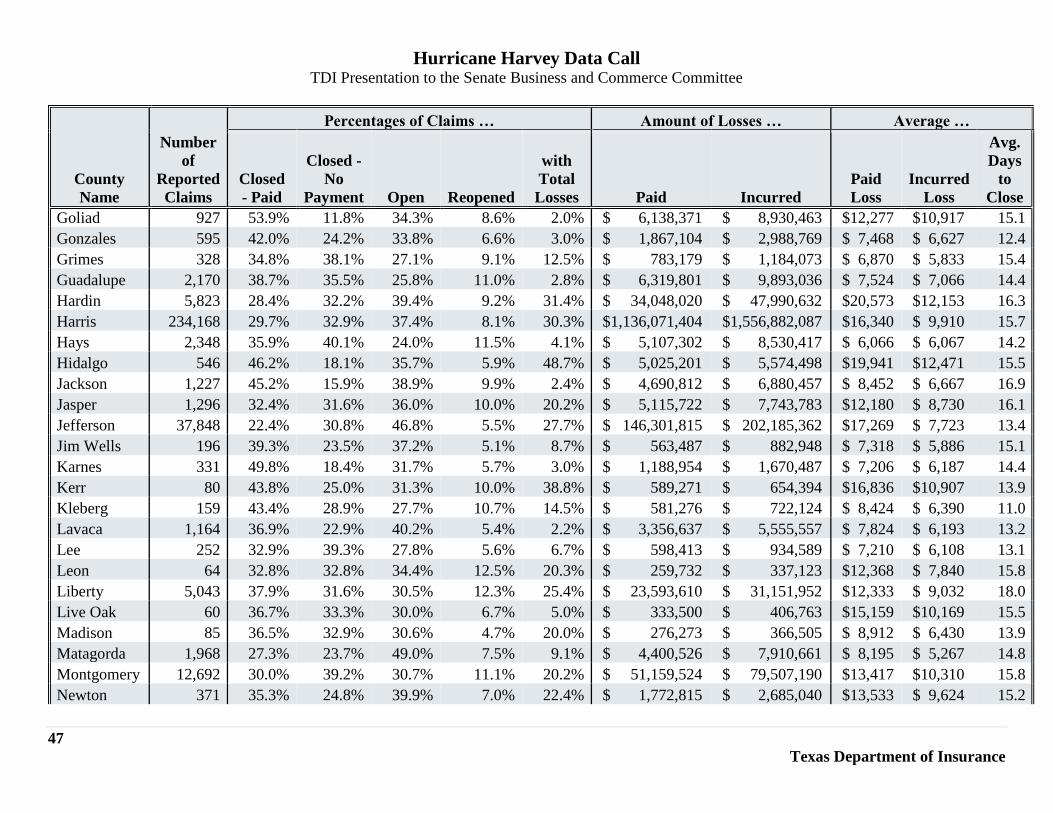
Appendix II: Loss Data by County (Personal Lines) (As of First Submission, see also Page 2, Data Call Reporting Date)
County
Name
Number
of
Reported
Claims
Percentages of Claims … Amount of Losses … Average …
Closed
- Paid
Closed -
No
Payment Open Reopened
with
Total
Losses Paid Incurred
Paid
Loss
Incurred
Loss
Avg.
Days
to
Close
Angelina 403 35.5% 36.5% 28.0% 6.2% 20.6% $ 1,503,056 $ 1,836,960 $10,511 $ 7,176 14.5
Aransas 12,641 30.8% 25.7% 43.5% 10.4% 8.8% $ 181,681,447 $ 254,543,626 $46,609 $27,085 16.1
Atascosa 86 36.0% 30.2% 33.7% 12.8% 17.4% $ 368,935 $ 441,152 $11,901 $ 7,353 13.8
Austin 627 30.3% 30.1% 39.6% 6.9% 17.9% $ 2,253,467 $ 3,302,007 $11,860 $ 7,539 17.9
Bastrop 1,161 31.5% 37.9% 30.6% 8.6% 4.9% $ 2,397,550 $ 4,361,595 $ 6,551 $ 6,049 14.2
Bee 861 50.9% 19.0% 30.1% 8.1% 2.4% $ 3,355,034 $ 4,716,733 $ 7,660 $ 6,767 14.1
Bexar 3,803 33.5% 39.1% 27.5% 9.3% 10.5% $ 9,842,771 $ 15,171,929 $ 7,732 $ 6,548 13.4
Brazoria 18,947 26.6% 34.2% 39.1% 7.4% 23.6% $ 65,293,885 $ 91,634,486 $12,945 $ 7,354 14.7
Brazos 1,686 31.9% 45.4% 22.7% 12.8% 9.5% $ 4,304,754 $ 6,519,172 $ 8,001 $ 7,078 15.1
Burleson 172 27.3% 33.7% 39.0% 5.8% 7.6% $ 486,963 $ 824,351 $10,361 $ 7,231 12.2
Caldwell 658 39.1% 31.2% 29.8% 8.2% 3.3% $ 1,503,410 $ 2,648,266 $ 5,850 $ 5,846 14.4
Calhoun 3,968 30.5% 20.1% 49.4% 9.0% 2.1% $ 12,096,158 $ 20,326,830 $ 9,997 $ 6,410 16.7
Cameron 249 47.0% 22.5% 30.5% 2.8% 40.2% $ 1,537,588 $ 1,805,182 $13,142 $ 9,353 14.3
Chambers 4,092 24.8% 31.8% 43.4% 7.3% 26.4% $ 16,431,572 $ 23,234,350 $16,173 $ 8,325 15.6
Colorado 435 31.5% 30.6% 37.9% 6.2% 20.0% $ 1,150,877 $ 2,058,321 $ 8,401 $ 6,816 14.4
Comal 1,817 36.4% 37.5% 26.0% 11.6% 3.9% $ 4,443,015 $ 7,408,578 $ 6,712 $ 6,527 14.3
De Witt 1,390 43.0% 15.3% 41.7% 6.8% 2.3% $ 5,375,022 $ 8,437,140 $ 8,988 $ 7,162 15.0
Fayette 567 31.6% 36.3% 32.1% 6.2% 10.1% $ 2,102,638 $ 3,190,282 $11,747 $ 8,837 13.5
Fort Bend 32,151 25.0% 37.4% 37.6% 9.1% 18.3% $ 109,368,746 $ 175,476,401 $13,595 $ 8,715 17.2
Galveston 41,800 30.2% 28.6% 41.2% 6.3% 33.8% $ 213,443,825 $ 269,394,137 $16,912 $ 9,027 13.9
Hurricane Harvey Data Call TDI Presentation to the Senate Business and Commerce Committee
47
Texas Department of Insurance
County
Name
Number
of
Reported
Claims
Percentages of Claims … Amount of Losses … Average …
Closed
- Paid
Closed -
No
Payment Open Reopened
with
Total
Losses Paid Incurred
Paid
Loss
Incurred
Loss
Avg.
Days
to
Close
Goliad 927 53.9% 11.8% 34.3% 8.6% 2.0% $ 6,138,371 $ 8,930,463 $12,277 $10,917 15.1
Gonzales 595 42.0% 24.2% 33.8% 6.6% 3.0% $ 1,867,104 $ 2,988,769 $ 7,468 $ 6,627 12.4
Grimes 328 34.8% 38.1% 27.1% 9.1% 12.5% $ 783,179 $ 1,184,073 $ 6,870 $ 5,833 15.4
Guadalupe 2,170 38.7% 35.5% 25.8% 11.0% 2.8% $ 6,319,801 $ 9,893,036 $ 7,524 $ 7,066 14.4
Hardin 5,823 28.4% 32.2% 39.4% 9.2% 31.4% $ 34,048,020 $ 47,990,632 $20,573 $12,153 16.3
Harris 234,168 29.7% 32.9% 37.4% 8.1% 30.3% $1,136,071,404 $1,556,882,087 $16,340 $ 9,910 15.7
Hays 2,348 35.9% 40.1% 24.0% 11.5% 4.1% $ 5,107,302 $ 8,530,417 $ 6,066 $ 6,067 14.2
Hidalgo 546 46.2% 18.1% 35.7% 5.9% 48.7% $ 5,025,201 $ 5,574,498 $19,941 $12,471 15.5
Jackson 1,227 45.2% 15.9% 38.9% 9.9% 2.4% $ 4,690,812 $ 6,880,457 $ 8,452 $ 6,667 16.9
Jasper 1,296 32.4% 31.6% 36.0% 10.0% 20.2% $ 5,115,722 $ 7,743,783 $12,180 $ 8,730 16.1
Jefferson 37,848 22.4% 30.8% 46.8% 5.5% 27.7% $ 146,301,815 $ 202,185,362 $17,269 $ 7,723 13.4
Jim Wells 196 39.3% 23.5% 37.2% 5.1% 8.7% $ 563,487 $ 882,948 $ 7,318 $ 5,886 15.1
Karnes 331 49.8% 18.4% 31.7% 5.7% 3.0% $ 1,188,954 $ 1,670,487 $ 7,206 $ 6,187 14.4
Kerr 80 43.8% 25.0% 31.3% 10.0% 38.8% $ 589,271 $ 654,394 $16,836 $10,907 13.9
Kleberg 159 43.4% 28.9% 27.7% 10.7% 14.5% $ 581,276 $ 722,124 $ 8,424 $ 6,390 11.0
Lavaca 1,164 36.9% 22.9% 40.2% 5.4% 2.2% $ 3,356,637 $ 5,555,557 $ 7,824 $ 6,193 13.2
Lee 252 32.9% 39.3% 27.8% 5.6% 6.7% $ 598,413 $ 934,589 $ 7,210 $ 6,108 13.1
Leon 64 32.8% 32.8% 34.4% 12.5% 20.3% $ 259,732 $ 337,123 $12,368 $ 7,840 15.8
Liberty 5,043 37.9% 31.6% 30.5% 12.3% 25.4% $ 23,593,610 $ 31,151,952 $12,333 $ 9,032 18.0
Live Oak 60 36.7% 33.3% 30.0% 6.7% 5.0% $ 333,500 $ 406,763 $15,159 $10,169 15.5
Madison 85 36.5% 32.9% 30.6% 4.7% 20.0% $ 276,273 $ 366,505 $ 8,912 $ 6,430 13.9
Matagorda 1,968 27.3% 23.7% 49.0% 7.5% 9.1% $ 4,400,526 $ 7,910,661 $ 8,195 $ 5,267 14.8
Montgomery 12,692 30.0% 39.2% 30.7% 11.1% 20.2% $ 51,159,524 $ 79,507,190 $13,417 $10,310 15.8
Newton 371 35.3% 24.8% 39.9% 7.0% 22.4% $ 1,772,815 $ 2,685,040 $13,533 $ 9,624 15.2
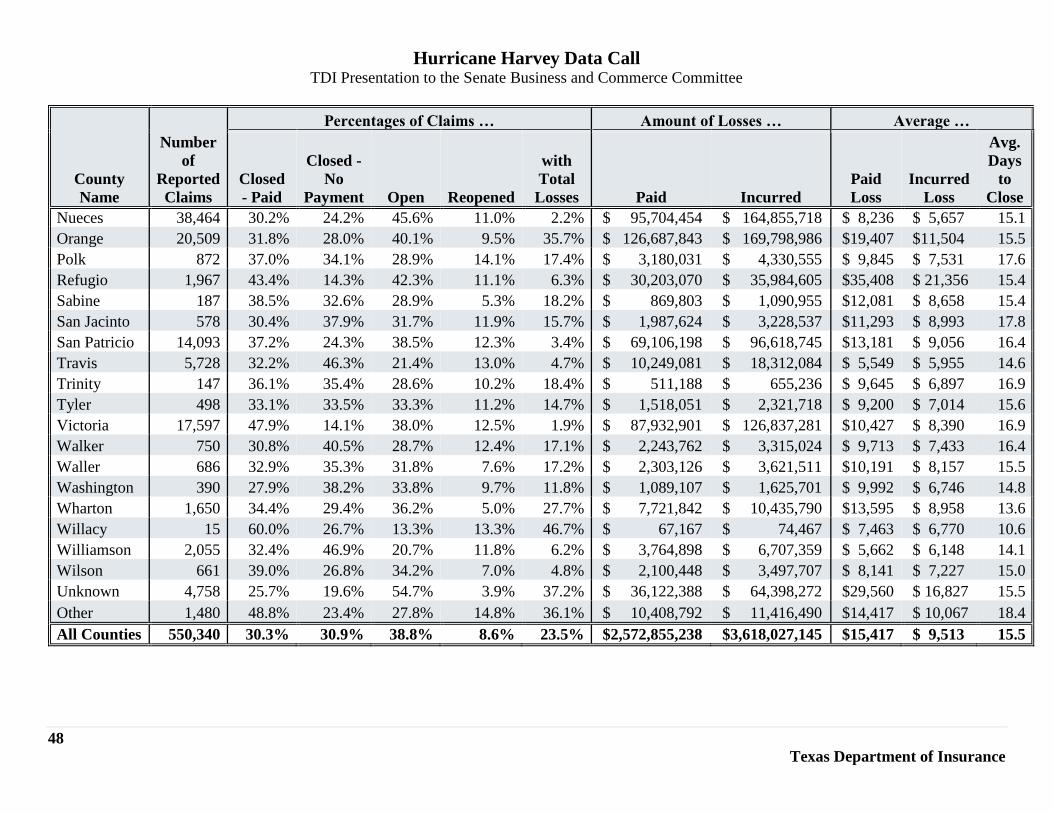
Hurricane Harvey Data Call TDI Presentation to the Senate Business and Commerce Committee
48
Texas Department of Insurance
County
Name
Number
of
Reported
Claims
Percentages of Claims … Amount of Losses … Average …
Closed
- Paid
Closed -
No
Payment Open Reopened
with
Total
Losses Paid Incurred
Paid
Loss
Incurred
Loss
Avg.
Days
to
Close
Nueces 38,464 30.2% 24.2% 45.6% 11.0% 2.2% $ 95,704,454 $ 164,855,718 $ 8,236 $ 5,657 15.1
Orange 20,509 31.8% 28.0% 40.1% 9.5% 35.7% $ 126,687,843 $ 169,798,986 $19,407 $11,504 15.5
Polk 872 37.0% 34.1% 28.9% 14.1% 17.4% $ 3,180,031 $ 4,330,555 $ 9,845 $ 7,531 17.6
Refugio 1,967 43.4% 14.3% 42.3% 11.1% 6.3% $ 30,203,070 $ 35,984,605 $35,408 $ 21,356 15.4
Sabine 187 38.5% 32.6% 28.9% 5.3% 18.2% $ 869,803 $ 1,090,955 $12,081 $ 8,658 15.4
San Jacinto 578 30.4% 37.9% 31.7% 11.9% 15.7% $ 1,987,624 $ 3,228,537 $11,293 $ 8,993 17.8
San Patricio 14,093 37.2% 24.3% 38.5% 12.3% 3.4% $ 69,106,198 $ 96,618,745 $13,181 $ 9,056 16.4
Travis 5,728 32.2% 46.3% 21.4% 13.0% 4.7% $ 10,249,081 $ 18,312,084 $ 5,549 $ 5,955 14.6
Trinity 147 36.1% 35.4% 28.6% 10.2% 18.4% $ 511,188 $ 655,236 $ 9,645 $ 6,897 16.9
Tyler 498 33.1% 33.5% 33.3% 11.2% 14.7% $ 1,518,051 $ 2,321,718 $ 9,200 $ 7,014 15.6
Victoria 17,597 47.9% 14.1% 38.0% 12.5% 1.9% $ 87,932,901 $ 126,837,281 $10,427 $ 8,390 16.9
Walker 750 30.8% 40.5% 28.7% 12.4% 17.1% $ 2,243,762 $ 3,315,024 $ 9,713 $ 7,433 16.4
Waller 686 32.9% 35.3% 31.8% 7.6% 17.2% $ 2,303,126 $ 3,621,511 $10,191 $ 8,157 15.5
Washington 390 27.9% 38.2% 33.8% 9.7% 11.8% $ 1,089,107 $ 1,625,701 $ 9,992 $ 6,746 14.8
Wharton 1,650 34.4% 29.4% 36.2% 5.0% 27.7% $ 7,721,842 $ 10,435,790 $13,595 $ 8,958 13.6
Willacy 15 60.0% 26.7% 13.3% 13.3% 46.7% $ 67,167 $ 74,467 $ 7,463 $ 6,770 10.6
Williamson 2,055 32.4% 46.9% 20.7% 11.8% 6.2% $ 3,764,898 $ 6,707,359 $ 5,662 $ 6,148 14.1
Wilson 661 39.0% 26.8% 34.2% 7.0% 4.8% $ 2,100,448 $ 3,497,707 $ 8,141 $ 7,227 15.0
Unknown 4,758 25.7% 19.6% 54.7% 3.9% 37.2% $ 36,122,388 $ 64,398,272 $29,560 $ 16,827 15.5
Other 1,480 48.8% 23.4% 27.8% 14.8% 36.1% $ 10,408,792 $ 11,416,490 $14,417 $ 10,067 18.4
All Counties 550,340 30.3% 30.9% 38.8% 8.6% 23.5% $2,572,855,238 $3,618,027,145 $15,417 $ 9,513 15.5
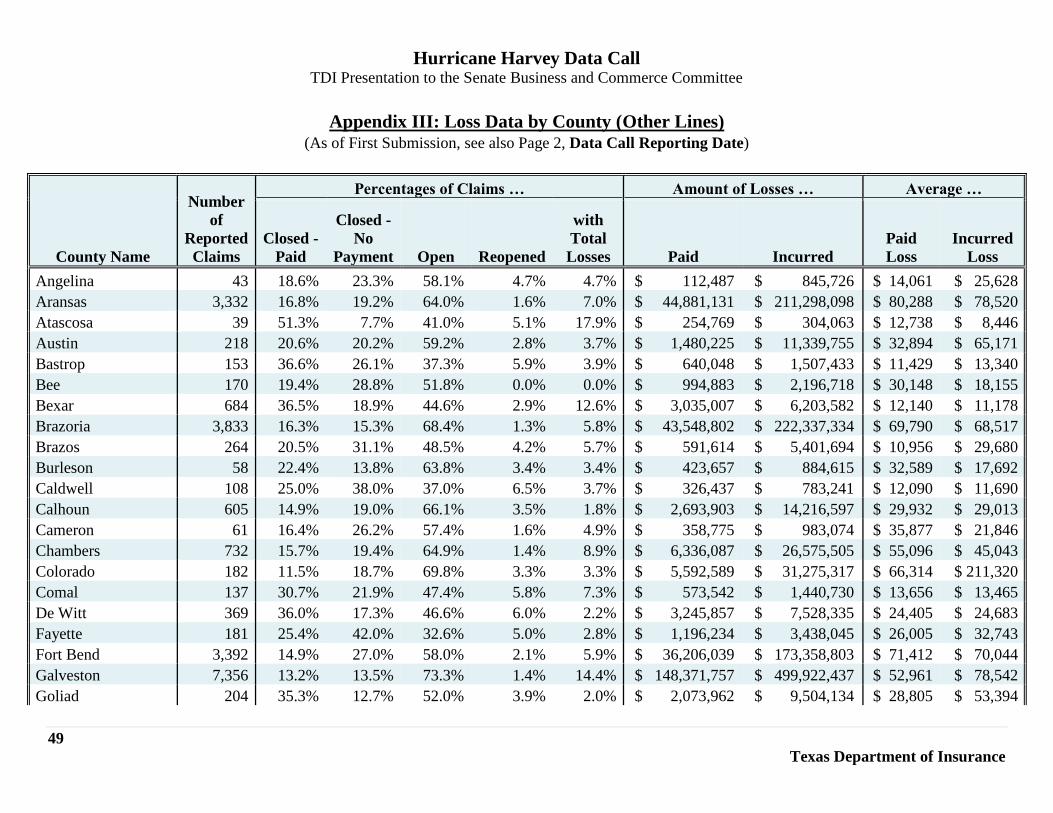
Hurricane Harvey Data Call TDI Presentation to the Senate Business and Commerce Committee
49
Texas Department of Insurance
Appendix III: Loss Data by County (Other Lines) (As of First Submission, see also Page 2, Data Call Reporting Date)
County Name
Number
of
Reported
Claims
Percentages of Claims … Amount of Losses … Average …
Closed -
Paid
Closed -
No
Payment Open Reopened
with
Total
Losses Paid Incurred
Paid
Loss
Incurred
Loss
Angelina 43 18.6% 23.3% 58.1% 4.7% 4.7% $ 112,487 $ 845,726 $ 14,061 $ 25,628
Aransas 3,332 16.8% 19.2% 64.0% 1.6% 7.0% $ 44,881,131 $ 211,298,098 $ 80,288 $ 78,520
Atascosa 39 51.3% 7.7% 41.0% 5.1% 17.9% $ 254,769 $ 304,063 $ 12,738 $ 8,446
Austin 218 20.6% 20.2% 59.2% 2.8% 3.7% $ 1,480,225 $ 11,339,755 $ 32,894 $ 65,171
Bastrop 153 36.6% 26.1% 37.3% 5.9% 3.9% $ 640,048 $ 1,507,433 $ 11,429 $ 13,340
Bee 170 19.4% 28.8% 51.8% 0.0% 0.0% $ 994,883 $ 2,196,718 $ 30,148 $ 18,155
Bexar 684 36.5% 18.9% 44.6% 2.9% 12.6% $ 3,035,007 $ 6,203,582 $ 12,140 $ 11,178
Brazoria 3,833 16.3% 15.3% 68.4% 1.3% 5.8% $ 43,548,802 $ 222,337,334 $ 69,790 $ 68,517
Brazos 264 20.5% 31.1% 48.5% 4.2% 5.7% $ 591,614 $ 5,401,694 $ 10,956 $ 29,680
Burleson 58 22.4% 13.8% 63.8% 3.4% 3.4% $ 423,657 $ 884,615 $ 32,589 $ 17,692
Caldwell 108 25.0% 38.0% 37.0% 6.5% 3.7% $ 326,437 $ 783,241 $ 12,090 $ 11,690
Calhoun 605 14.9% 19.0% 66.1% 3.5% 1.8% $ 2,693,903 $ 14,216,597 $ 29,932 $ 29,013
Cameron 61 16.4% 26.2% 57.4% 1.6% 4.9% $ 358,775 $ 983,074 $ 35,877 $ 21,846
Chambers 732 15.7% 19.4% 64.9% 1.4% 8.9% $ 6,336,087 $ 26,575,505 $ 55,096 $ 45,043
Colorado 182 11.5% 18.7% 69.8% 3.3% 3.3% $ 5,592,589 $ 31,275,317 $ 66,314 $ 211,320
Comal 137 30.7% 21.9% 47.4% 5.8% 7.3% $ 573,542 $ 1,440,730 $ 13,656 $ 13,465
De Witt 369 36.0% 17.3% 46.6% 6.0% 2.2% $ 3,245,857 $ 7,528,335 $ 24,405 $ 24,683
Fayette 181 25.4% 42.0% 32.6% 5.0% 2.8% $ 1,196,234 $ 3,438,045 $ 26,005 $ 32,743
Fort Bend 3,392 14.9% 27.0% 58.0% 2.1% 5.9% $ 36,206,039 $ 173,358,803 $ 71,412 $ 70,044
Galveston 7,356 13.2% 13.5% 73.3% 1.4% 14.4% $ 148,371,757 $ 499,922,437 $ 52,961 $ 78,542
Goliad 204 35.3% 12.7% 52.0% 3.9% 2.0% $ 2,073,962 $ 9,504,134 $ 28,805 $ 53,394
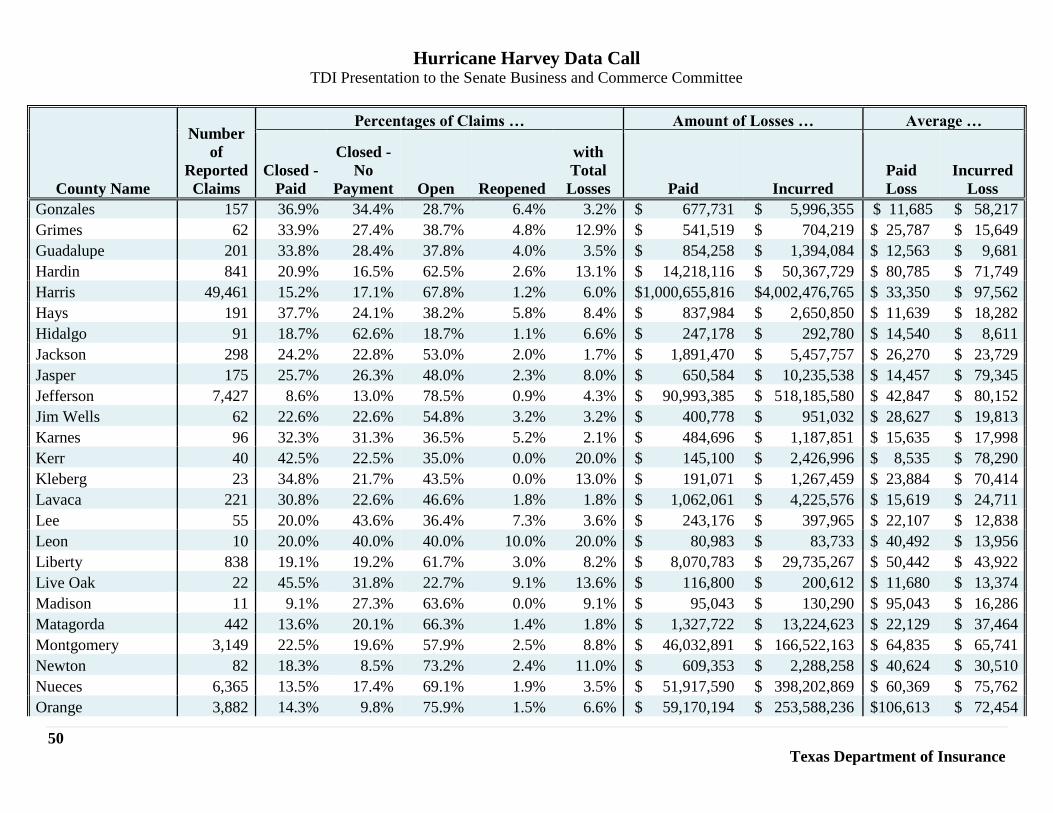
Hurricane Harvey Data Call TDI Presentation to the Senate Business and Commerce Committee
50
Texas Department of Insurance
County Name
Number
of
Reported
Claims
Percentages of Claims … Amount of Losses … Average …
Closed -
Paid
Closed -
No
Payment Open Reopened
with
Total
Losses Paid Incurred
Paid
Loss
Incurred
Loss
Gonzales 157 36.9% 34.4% 28.7% 6.4% 3.2% $ 677,731 $ 5,996,355 $ 11,685 $ 58,217
Grimes 62 33.9% 27.4% 38.7% 4.8% 12.9% $ 541,519 $ 704,219 $ 25,787 $ 15,649
Guadalupe 201 33.8% 28.4% 37.8% 4.0% 3.5% $ 854,258 $ 1,394,084 $ 12,563 $ 9,681
Hardin 841 20.9% 16.5% 62.5% 2.6% 13.1% $ 14,218,116 $ 50,367,729 $ 80,785 $ 71,749
Harris 49,461 15.2% 17.1% 67.8% 1.2% 6.0% $1,000,655,816 $4,002,476,765 $ 33,350 $ 97,562
Hays 191 37.7% 24.1% 38.2% 5.8% 8.4% $ 837,984 $ 2,650,850 $ 11,639 $ 18,282
Hidalgo 91 18.7% 62.6% 18.7% 1.1% 6.6% $ 247,178 $ 292,780 $ 14,540 $ 8,611
Jackson 298 24.2% 22.8% 53.0% 2.0% 1.7% $ 1,891,470 $ 5,457,757 $ 26,270 $ 23,729
Jasper 175 25.7% 26.3% 48.0% 2.3% 8.0% $ 650,584 $ 10,235,538 $ 14,457 $ 79,345
Jefferson 7,427 8.6% 13.0% 78.5% 0.9% 4.3% $ 90,993,385 $ 518,185,580 $ 42,847 $ 80,152
Jim Wells 62 22.6% 22.6% 54.8% 3.2% 3.2% $ 400,778 $ 951,032 $ 28,627 $ 19,813
Karnes 96 32.3% 31.3% 36.5% 5.2% 2.1% $ 484,696 $ 1,187,851 $ 15,635 $ 17,998
Kerr 40 42.5% 22.5% 35.0% 0.0% 20.0% $ 145,100 $ 2,426,996 $ 8,535 $ 78,290
Kleberg 23 34.8% 21.7% 43.5% 0.0% 13.0% $ 191,071 $ 1,267,459 $ 23,884 $ 70,414
Lavaca 221 30.8% 22.6% 46.6% 1.8% 1.8% $ 1,062,061 $ 4,225,576 $ 15,619 $ 24,711
Lee 55 20.0% 43.6% 36.4% 7.3% 3.6% $ 243,176 $ 397,965 $ 22,107 $ 12,838
Leon 10 20.0% 40.0% 40.0% 10.0% 20.0% $ 80,983 $ 83,733 $ 40,492 $ 13,956
Liberty 838 19.1% 19.2% 61.7% 3.0% 8.2% $ 8,070,783 $ 29,735,267 $ 50,442 $ 43,922
Live Oak 22 45.5% 31.8% 22.7% 9.1% 13.6% $ 116,800 $ 200,612 $ 11,680 $ 13,374
Madison 11 9.1% 27.3% 63.6% 0.0% 9.1% $ 95,043 $ 130,290 $ 95,043 $ 16,286
Matagorda 442 13.6% 20.1% 66.3% 1.4% 1.8% $ 1,327,722 $ 13,224,623 $ 22,129 $ 37,464
Montgomery 3,149 22.5% 19.6% 57.9% 2.5% 8.8% $ 46,032,891 $ 166,522,163 $ 64,835 $ 65,741
Newton 82 18.3% 8.5% 73.2% 2.4% 11.0% $ 609,353 $ 2,288,258 $ 40,624 $ 30,510
Nueces 6,365 13.5% 17.4% 69.1% 1.9% 3.5% $ 51,917,590 $ 398,202,869 $ 60,369 $ 75,762
Orange 3,882 14.3% 9.8% 75.9% 1.5% 6.6% $ 59,170,194 $ 253,588,236 $106,613 $ 72,454
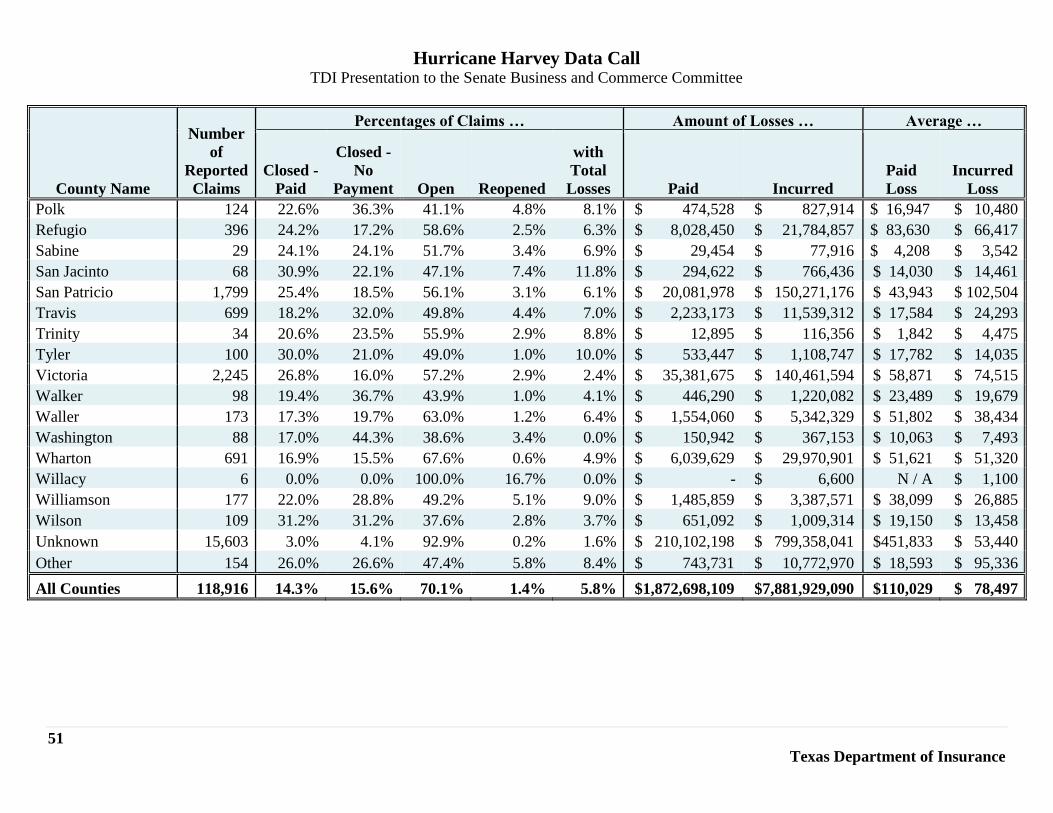
Hurricane Harvey Data Call TDI Presentation to the Senate Business and Commerce Committee
51
Texas Department of Insurance
County Name
Number
of
Reported
Claims
Percentages of Claims … Amount of Losses … Average …
Closed -
Paid
Closed -
No
Payment Open Reopened
with
Total
Losses Paid Incurred
Paid
Loss
Incurred
Loss
Polk 124 22.6% 36.3% 41.1% 4.8% 8.1% $ 474,528 $ 827,914 $ 16,947 $ 10,480
Refugio 396 24.2% 17.2% 58.6% 2.5% 6.3% $ 8,028,450 $ 21,784,857 $ 83,630 $ 66,417
Sabine 29 24.1% 24.1% 51.7% 3.4% 6.9% $ 29,454 $ 77,916 $ 4,208 $ 3,542
San Jacinto 68 30.9% 22.1% 47.1% 7.4% 11.8% $ 294,622 $ 766,436 $ 14,030 $ 14,461
San Patricio 1,799 25.4% 18.5% 56.1% 3.1% 6.1% $ 20,081,978 $ 150,271,176 $ 43,943 $ 102,504
Travis 699 18.2% 32.0% 49.8% 4.4% 7.0% $ 2,233,173 $ 11,539,312 $ 17,584 $ 24,293
Trinity 34 20.6% 23.5% 55.9% 2.9% 8.8% $ 12,895 $ 116,356 $ 1,842 $ 4,475
Tyler 100 30.0% 21.0% 49.0% 1.0% 10.0% $ 533,447 $ 1,108,747 $ 17,782 $ 14,035
Victoria 2,245 26.8% 16.0% 57.2% 2.9% 2.4% $ 35,381,675 $ 140,461,594 $ 58,871 $ 74,515
Walker 98 19.4% 36.7% 43.9% 1.0% 4.1% $ 446,290 $ 1,220,082 $ 23,489 $ 19,679
Waller 173 17.3% 19.7% 63.0% 1.2% 6.4% $ 1,554,060 $ 5,342,329 $ 51,802 $ 38,434
Washington 88 17.0% 44.3% 38.6% 3.4% 0.0% $ 150,942 $ 367,153 $ 10,063 $ 7,493
Wharton 691 16.9% 15.5% 67.6% 0.6% 4.9% $ 6,039,629 $ 29,970,901 $ 51,621 $ 51,320
Willacy 6 0.0% 0.0% 100.0% 16.7% 0.0% $ - $ 6,600 N / A $ 1,100
Williamson 177 22.0% 28.8% 49.2% 5.1% 9.0% $ 1,485,859 $ 3,387,571 $ 38,099 $ 26,885
Wilson 109 31.2% 31.2% 37.6% 2.8% 3.7% $ 651,092 $ 1,009,314 $ 19,150 $ 13,458
Unknown 15,603 3.0% 4.1% 92.9% 0.2% 1.6% $ 210,102,198 $ 799,358,041 $451,833 $ 53,440
Other 154 26.0% 26.6% 47.4% 5.8% 8.4% $ 743,731 $ 10,772,970 $ 18,593 $ 95,336
All Counties 118,916 14.3% 15.6% 70.1% 1.4% 5.8% $1,872,698,109 $7,881,929,090 $110,029 $ 78,497
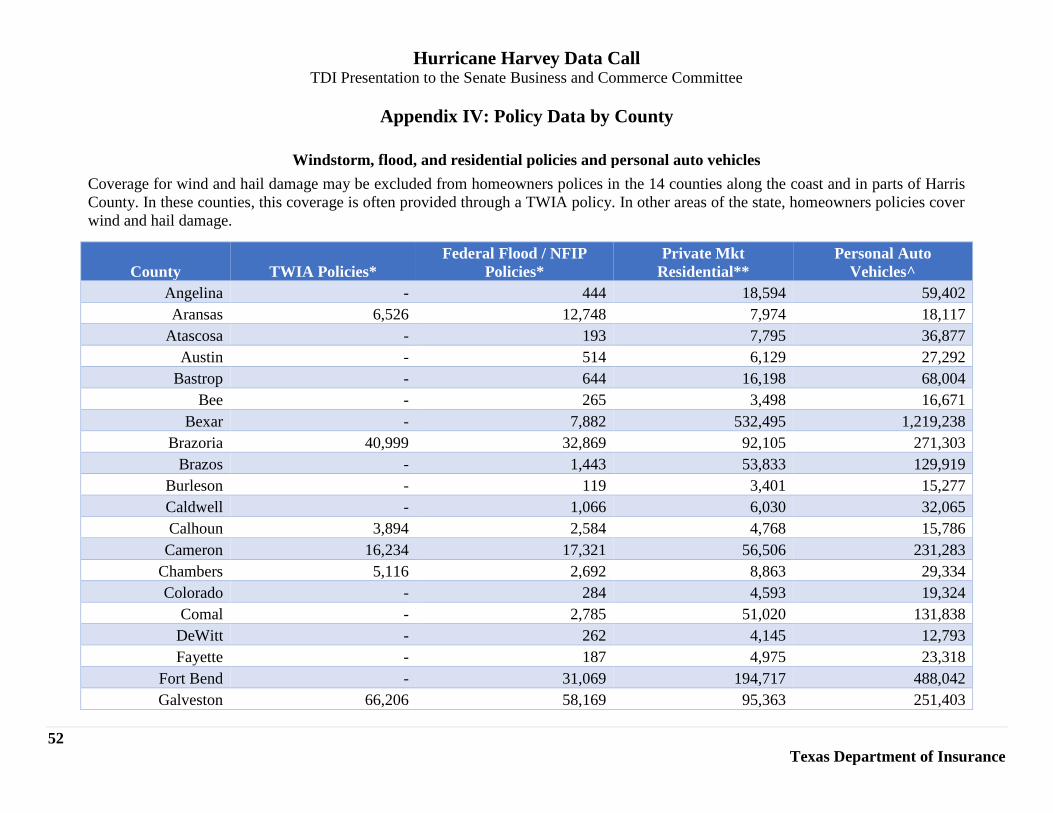
Hurricane Harvey Data Call TDI Presentation to the Senate Business and Commerce Committee
52
Texas Department of Insurance
Appendix IV: Policy Data by County
Windstorm, flood, and residential policies and personal auto vehicles
Coverage for wind and hail damage may be excluded from homeowners polices in the 14 counties along the coast and in parts of Harris
County. In these counties, this coverage is often provided through a TWIA policy. In other areas of the state, homeowners policies cover
wind and hail damage.
County TWIA Policies*
Federal Flood / NFIP
Policies*
Private Mkt
Residential**
Personal Auto
Vehicles^
Angelina - 444 18,594 59,402
Aransas 6,526 12,748 7,974 18,117
Atascosa - 193 7,795 36,877
Austin - 514 6,129 27,292
Bastrop - 644 16,198 68,004
Bee - 265 3,498 16,671
Bexar - 7,882 532,495 1,219,238
Brazoria 40,999 32,869 92,105 271,303
Brazos - 1,443 53,833 129,919
Burleson - 119 3,401 15,277
Caldwell - 1,066 6,030 32,065
Calhoun 3,894 2,584 4,768 15,786
Cameron 16,234 17,321 56,506 231,283
Chambers 5,116 2,692 8,863 29,334
Colorado - 284 4,593 19,324
Comal - 2,785 51,020 131,838
DeWitt - 262 4,145 12,793
Fayette - 187 4,975 23,318
Fort Bend - 31,069 194,717 488,042
Galveston 66,206 58,169 95,363 251,403
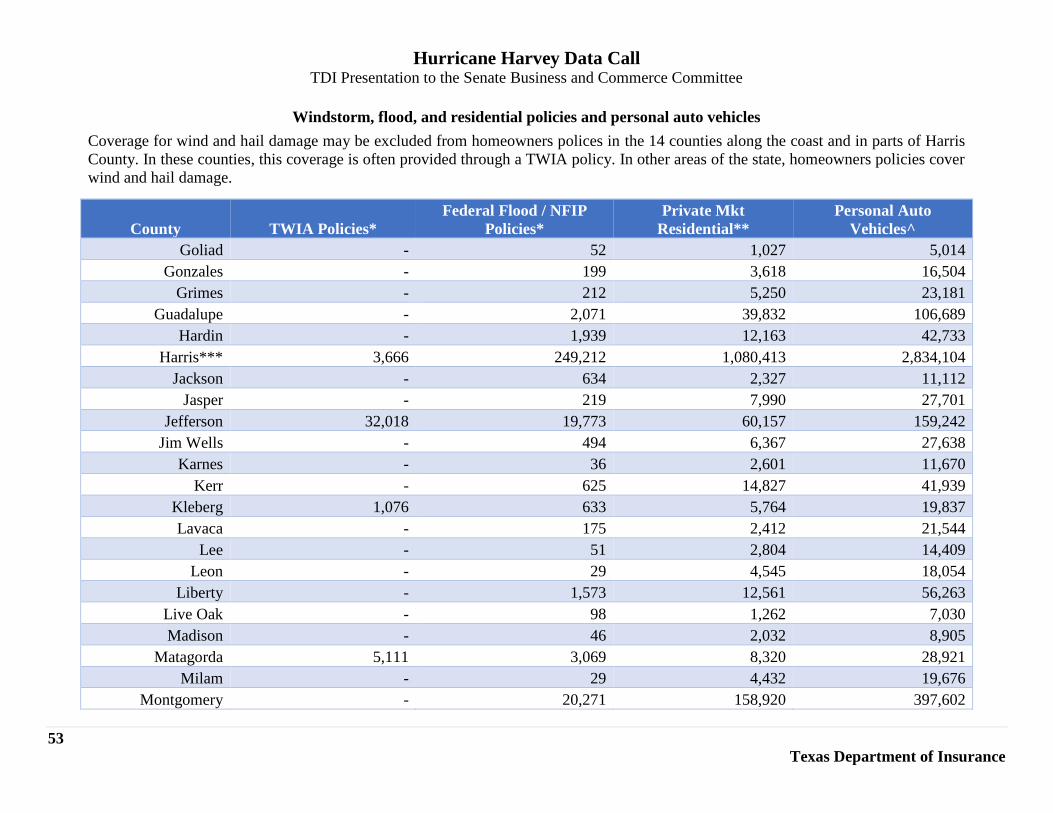
Hurricane Harvey Data Call TDI Presentation to the Senate Business and Commerce Committee
53
Texas Department of Insurance
Windstorm, flood, and residential policies and personal auto vehicles
Coverage for wind and hail damage may be excluded from homeowners polices in the 14 counties along the coast and in parts of Harris
County. In these counties, this coverage is often provided through a TWIA policy. In other areas of the state, homeowners policies cover
wind and hail damage.
County TWIA Policies*
Federal Flood / NFIP
Policies*
Private Mkt
Residential**
Personal Auto
Vehicles^
Goliad - 52 1,027 5,014
Gonzales - 199 3,618 16,504
Grimes - 212 5,250 23,181
Guadalupe - 2,071 39,832 106,689
Hardin - 1,939 12,163 42,733
Harris*** 3,666 249,212 1,080,413 2,834,104
Jackson - 634 2,327 11,112
Jasper - 219 7,990 27,701
Jefferson 32,018 19,773 60,157 159,242
Jim Wells - 494 6,367 27,638
Karnes - 36 2,601 11,670
Kerr - 625 14,827 41,939
Kleberg 1,076 633 5,764 19,837
Lavaca - 175 2,412 21,544
Lee - 51 2,804 14,409
Leon - 29 4,545 18,054
Liberty - 1,573 12,561 56,263
Live Oak - 98 1,262 7,030
Madison - 46 2,032 8,905
Matagorda 5,111 3,069 8,320 28,921
Milam - 29 4,432 19,676
Montgomery - 20,271 158,920 397,602
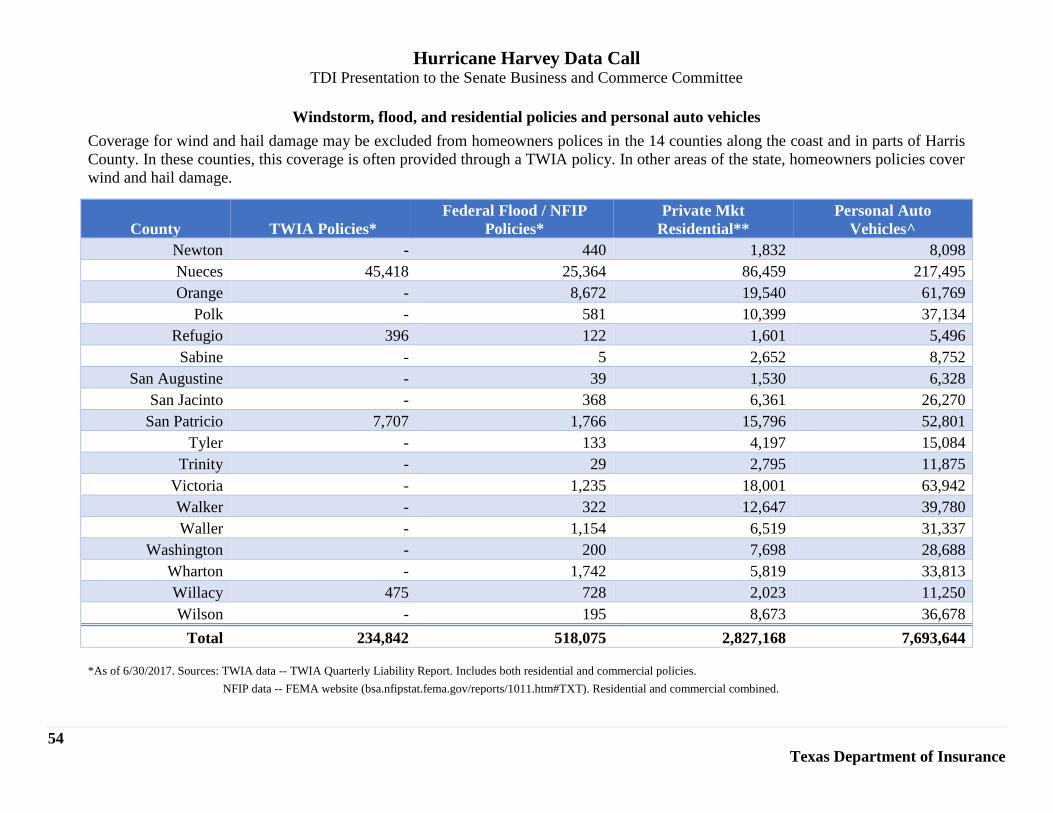
Hurricane Harvey Data Call TDI Presentation to the Senate Business and Commerce Committee
54
Texas Department of Insurance
Windstorm, flood, and residential policies and personal auto vehicles
Coverage for wind and hail damage may be excluded from homeowners polices in the 14 counties along the coast and in parts of Harris
County. In these counties, this coverage is often provided through a TWIA policy. In other areas of the state, homeowners policies cover
wind and hail damage.
County TWIA Policies*
Federal Flood / NFIP
Policies*
Private Mkt
Residential**
Personal Auto
Vehicles^
Newton - 440 1,832 8,098
Nueces 45,418 25,364 86,459 217,495
Orange - 8,672 19,540 61,769
Polk - 581 10,399 37,134
Refugio 396 122 1,601 5,496
Sabine - 5 2,652 8,752
San Augustine - 39 1,530 6,328
San Jacinto - 368 6,361 26,270
San Patricio 7,707 1,766 15,796 52,801
Tyler - 133 4,197 15,084
Trinity - 29 2,795 11,875
Victoria - 1,235 18,001 63,942
Walker - 322 12,647 39,780
Waller - 1,154 6,519 31,337
Washington - 200 7,698 28,688
Wharton - 1,742 5,819 33,813
Willacy 475 728 2,023 11,250
Wilson - 195 8,673 36,678
Total 234,842 518,075 2,827,168 7,693,644
*As of 6/30/2017. Sources: TWIA data -- TWIA Quarterly Liability Report. Includes both residential and commercial policies.
NFIP data -- FEMA website (bsa.nfipstat.fema.gov/reports/1011.htm#TXT). Residential and commercial combined.
Hurricane Harvey Data Call TDI Presentation to the Senate Business and Commerce Committee
55
Texas Department of Insurance
Windstorm, flood, and residential policies and personal auto vehicles
Coverage for wind and hail damage may be excluded from homeowners polices in the 14 counties along the coast and in parts of Harris
County. In these counties, this coverage is often provided through a TWIA policy. In other areas of the state, homeowners policies cover
wind and hail damage.
County TWIA Policies*
Federal Flood / NFIP
Policies*
Private Mkt
Residential**
Personal Auto
Vehicles^ **As of 6/30/2017. Source: TDI Residential Property Statistical Plan Data. Includes homeowners, residential dwelling, renters, condominium unit owners, farm and ranch, and
farmowners policies. Policy counts in the coastal counties of Aransas, Brazoria, Calhoun, Cameron, Chambers, Galveston, Harris, Jefferson, Kleberg, Matagorda, Nueces, Refugio,
San Patricio, and Willacy, include policies where the private market insurers excluded wind coverage. Excludes residential policies issued by farm mutual insurers.
TDI does not collect complete information on the number of commercial property policies and amount of commercial property exposures by county. For this reason, commercial
property policies are not included in the private market totals.
***TWIA policy counts are only for that portion of Harris County within the TWIA coverage area.
^As of 6/30/2017. Source: TDI Private Passenger Automobile Statistical Plan, Quarterly Market Report (QMR). All vehicles in force insured under a personal auto policy, excluding
vehicles insured in the surplus lines market.