Embed Size (px)
Citation preview

The Urban Food System of Kingston, Jamaica
HUNGRY CITIES REPORT NO. 4
HUNGRY CITIES PARTNERSHIP

THE URBAN FOOD SYSTEM OF KINGSTON, JAMAICA
ELIZABETH THOMAS-HOPE, ROBERT KINLOCKE, THERESE FERGUSON, CHARMAINE HESLOP-
THOMAS AND BETH TIMMERS
SERIES EDITOR: PROF. JONATHAN CRUSH
HUNGRY CITIES PARTNERSHIP
HUNGRY CITIES REPORT NO. 4

ACKNOWLEDGEMENTS
The research and publication of this report was funded by the Social Sciences and Humanities Research Council (SSHRC) and the Interna-tional Development Research Centre (IDRC) under the International Partnerships for Sustainable Societies (IPaSS) Program.
© HUNGRY CITIES PARTNERSHIP 2017
Published by the Hungry Cities Partnership African Centre for Cities, University of Cape Town, South Africa, and Wilfrid Laurier University/Balsillie School of International Affairs, Waterloo, Canada hungrycities.net
First published 2017
ISBN 978-1-920597-23-8
Production by Bronwen Dachs Muller, Cape Town
All rights reserved. No part of this publication may be reproduced or transmitted, in any form or by any means, without prior permission from the publishers.

AUTHORS
Elizabeth Thomas-Hope is Professor Emerita, and former Director of the Centre for Environmental Management at the University of the West Indies, Mona, Kingston, Jamaica.
Robert Kinlocke is a lecturer in Geography in the Department of Geography and Geology at the University of the West Indies, Mona, Kingston, Jamaica.
Therese Ferguson is a lecturer in Education for Sustainable Development (ESD) in the School of Education at the University of the West Indies, Mona, Kingston, Jamaica.
Charmaine Heslop-Thomas is Research Manager, Urban Development Cor-poration, Kingston, Jamaica.
Beth Timmers is a doctoral student at the University of Waterloo, Ontario, Canada.
Previous Publications in the Hungry Cities Report Series
No 1 The Urban Food System of Nanjing, China No 2 The Urban Food System of Maputo, Mozambique No 3 The Urban Food System of Cape Town, South Africa

CONTENTS PAGE
1. Background 1
2. Demography 3
2.1 Size and Growth of Kingston 3
2.2 Population Distribution and Density 4
2.3 Age Profile of the KMA 6
3. Geography of the KMA 7
3.1 Socio-Economic Profile and Housing Patterns 7
3.2 Income Distribution 9
4. Formal Economy 10
4.1 Jamaica’s Post-Colonial Economy 10
4.2 Economic Sectors and Activities 12
4.3 Employment and Unemployment 13
5. Informal Economy 15
5.1 Size and Importance 15
5.2 Profile and Characteristics 16
5.3 Spatial Distribution 17
5.4 Policies towards Informal Food Markets and Vendors 18
6. Urban Food System 20
6.1 Sources of Food and Food Flows into the KMA 20
6.2 Typology and Spatial Location of Food Outlets for Households 22
6.3 Changing Food Prices within the KMA 23
6.4 Changing Urban Diets and Consumption Patterns 27
6.5 Food Safety 27
6.6 Types and Impact of Social Protection 29
7. Food Insecurity in the KMA 30
8. Conclusion 30
References 31

LIST OF TABLES
Table 1: Population Growth Rate of Main Towns in Jamaica 1970-2011 3
Table 2: Age Distribution of the Jamaican Population, 2000-2009 6
Table 3: Jamaica – Employed Labour Force by Industry Group 14
Table 4: Jamaica – Annual Averages of Wage Earners in Large 14 Establishments
Table 5: Distribution of Customers by Enterprise Size 17
Table 6: Percentage Price Changes in Agricultural Items in 2010 25
Table 7: Percentage Change in Cost of Agricultural Items in 2015 25
Table 8: Impact of Food Price Crisis on Products in Urban Jamaica 27
LIST OF FIGURES
Figure 1: Location of Kingston, Jamaica 2
Figure 2: Kingston’s Central Business District (Downtown Kingston) 2
Figure 3: Population Density in the KMA 5
Figure 4: Informal Housing in Kingston 5
Figure 5: Gated Community in Kingston 6
Figure 6: Communities of the Kingston Metropolitan Area 7
Figure 7: Residential Differentiation in Barbican, Kingston 9
Figure 8: Poverty Prevalence in the KMA 10
Figure 9: Formal and Informal Labour Force of Jamaica, 2001 13
Figure 10: Increase in Contribution of Informal Economy to GDP Using 16 Different Measures, 1966-2000
Figure 11: Location of Small and Micro-Enterprises in Jamaica 18
Figure 12: Street Vending in Downtown Kingston 19

Figure 13: Higglers in Coronation Market in Kingston 21
Figure 14: Papine Market in Kingston 21
Figure 15: Roadside Vendor in Kingston 21
Figure 16: Supermarket in Kingston 23
Figure 17: Price Changes of Select Food Items between January and 24 December 2010
Figure 18: Price Changes between January and December 2015 26
Figure 19: Summary of Conditions at the Fresh Produce Markets 28
Figure 20: Food Waste and Garbage in Coronation Market, Kingston 28

HUNGRY CITIES REPORT NO. 4 1
1. BACKGROUND
Kingston is a colonial city and, like the country of Jamaica more generally, was the product of early mercantilism moulded by colonialism, sugar plantations and slavery. The town was founded in 1692, superseding Saint Jago (Spanish Town), which was established as the Spanish capital of Jamaica in 1534, and Port Caguay (Port Royal), the first town created during the British colonial period (from 1655). Port Royal was destroyed by an earthquake in 1692 and the survivors sought refuge first on the marshy Liguanea plains, and later to the east of the plains along the coast (Figure 1). Nevertheless, it was only in 1703, when the remains of Port Royal were gutted by fire, that Kingston’s position as the com-mercial centre was confirmed (Clarke 2006). By 1800, Kingston was the major city and port of the largest British colony in the Caribbean. The population increased from 5,000 in 1700 to 30,000 a century later, and in 1812 Kingston had a population of 33,000 including 10,000 whites, 2,500 free coloureds, and 18,000 slaves. The early social and spatial organization of Kingston was com-partmentalized by class, which also reflected race and cultural differences across the city (Clarke 2006). These structures expressed an urban economy based on global aspects of trade; race-class stratification relating to the juxtaposition of the different non-indigenous (immigrant and creole) populations within a planta-tion system of British colonial ownership and administration; and African slave labour (Clarke 2006).
Slaves were emancipated in 1834 (with “full” freedom following the abolition of the apprenticeship system in 1838) and, although some former slaves were in the urban centres, most were on sugar plantations and remained in rural areas, settling in villages in the forested hills. Migratory streams towards urban centres gradually increased in the late 1800s. By the early 1930s, there was embryonic evidence of informal settlements and the type of deprivation that would later characterize settlements in several communities of Kingston, such as Trench Town and Tivoli Gardens on the western fringe of the Central Business District (CBD). Higher-income residents originally settled within and on the outskirts of the urban core but later moved further north, as poor rural migrants occupied vacant lots outside the CBD and eventually replaced middle- and upper-income residents in formal housing.
By the time Jamaica gained independence from Britain in 1962, Kingston had become its primate city and continued to increase in size and function, playing a dominant national role in all aspects of life – economic, administrative and cul-tural. Located along the south coast of Jamaica, the city comprises the parish of Kingston and occupies much of the parish of St Andrew to the north (Figure 1). In the post-colonial period, the geography of the Kingston Metropolitan Area (KMA) progressively changed as global and local forces combined to shape the

2 HUNGRY CITIES PARTNERSHIP
THE URBAN FOOD SYSTEM OF KINGSTON, JAMAICA
urban space in increasingly complex ways (Figure 2). As Jamaica’s capital city, Kingston is an economic and administrative hub with a social geography marked by many of the characteristic fissures of emerging cities in transition econo-mies. These processes do not occur in isolation and strongly reflect the results of national and international politics, increasing globalization and the changing aspirations and lifestyles of urban residents. The social geography of the city is, therefore, best prefaced by understanding the economic and socio-political his-tory that shaped its formation.
FIGURE 1: Location of Kingston, Jamaica
Source: https://goo.gl/images/IxFmVh
FIGURE 2: Kingston’s Central Business District (Downtown Kingston)
Source: http://www.cruisin.me/cruise-port-tracker/caribbean/kingston-jamaica.php

HUNGRY CITIES REPORT NO. 4 3
2. DEMOGRAPHY
2.1 Size and Growth of Kingston
The average annual rate of population growth in the KMA between 1970 and 2011 was 0.51% per year (STATIN 2011) and recent estimates put the population at 662,426 in 2012 and 670,323 in 2015. This population is distributed across an estimated 190,864 households in the city. Most of the city’s rapid growth occurred between 1970 and 1991 (Table 1) and was due to comparatively high rates of rural to urban migration and natural increase (Clarke 2006). Population growth since the 1990s has been relatively slow, with the decade between 1991 and 2001 characterized by negative growth. Although Kingston is unquestion-ably the primate city of Jamaica, it has experienced the slowest growth of all major urban centres in the country over the last 20 years.
TABLE 1: Population Growth Rate of Main Towns in Jamaica 1970-2011Main towns 1970-1982 1982-1991 1991-2001 2001- 2011 1970-2011
KMA 0.85 1.27 -0.15 0.09 0.51
Morant Bay 1.55 0.94 1.17 0.25 1.00
Port Antonio 1.38 0.73 1.05 0.17 0.86
Port Maria 2.72 -0.47 0.33 0.03 0.77
St Ann’s Bay 2.05 2.14 -0.49 0.68 1.11
Falmouth 4.73 1.90 0.29 0.59 2.00
Montego Bay 4.07 1.73 1.64 1.33 2.29
Lucea 3.88 -0.47 1.12 1.34 1.70
Savanna-la-mar 2.11 1.02 1.99 1.30 1.64
Black River 2.43 -0.03 1.32 0.71 7.92
Mandeville 8.01 1.64 1.74 0.46 3.20
May Pen 3.87 1.27 2.25 0.71 2.13
Spanish Town 6.55 2.41 1.77 1.13 3.13
Source: STATIN (2011)
The recent trend of reduced rates of growth in Kingston is expected to continue because of the extensive housing and commercial development in smaller towns such as Portmore (initially a residential centre for commuters to Kingston that was granted municipal status in 2003), Old Harbour and May Pen. These cen-tres on the east-west road axis from Kingston have already begun to counter the earlier migratory magnetism of the larger urban centres. The construction of the South Coast Highway has also enhanced the spatial connectivity between a number of smaller towns and Kingston, with the effect of increasing the distances

4 HUNGRY CITIES PARTNERSHIP
THE URBAN FOOD SYSTEM OF KINGSTON, JAMAICA
from which people commute to work in the capital. This increased accessibility, along with the rising cost of real estate in Kingston, has meant that localities out-side the KMA have become attractive residential alternatives for many people.
Until the 1990s, successive streams of rural migrants to the KMA and limited space for settlement resulted in high population densities. The parish of Kingston has the highest population density of 1,830 persons per square km, followed by St Andrew with 482 per square km. Although these two administrative parishes combined are smaller than any other parish in the country in terms of land area, they house the largest share of the national population (about 27.5%), mostly concentrated in the KMA. People seeking opportunities in the city were largely from poor households and settled on marginal land on the outskirts of the CBD. These areas became the main sites of extensive squatter settlement characterized by urban blight and severe deprivation. The dire need for state intervention and the large number of voters meant that they occupied an increasingly central posi-tion in local politics.
2.2 Population Distribution and Density
The growth of the urban centres outside the KMA accounts for only a minor part of the changes in ecological and administrative boundaries within the KMA itself. Instead of outward urban sprawl, urban growth has been generally char-acterized by increasing density of housing and commercial activities within the city boundaries. There are marked variations in population density within the KMA (Figure 3). The highest densities are located along the coastal belt, which extends from the south-western end of the city and follows the coastline as it turns in an easterly direction. Population densities gradually decrease towards the northern parts of the city, but the continuity of this pattern is interrupt-ed by a few high-density pockets in the northern sections. These include very low-income communities (Figure 4) and high-income neighbourhoods with an increasing number of gated housing developments (Figure 5).

HUNGRY CITIES REPORT NO. 4 5
FIGURE 3: Population Density in the KMA
Source: Compiled from population Census data, STATIN (2011)
FIGURE 4: Informal Housing in Kingston
Source: http://www.poshcorps.com/ragged-edge/2015/6/15/the-entrepreneurs

6 HUNGRY CITIES PARTNERSHIP
THE URBAN FOOD SYSTEM OF KINGSTON, JAMAICA
FIGURE 5: Gated Community in Kingston
Source: Robert Kinlocke
2.3 Age Profile of the KMA
Nearly two-thirds of the population of the KMA (64% in 2009) are in the work-ing age cohort of 15 to 64 years old, compared with 62% for other towns and 55% for rural areas (Table 2). Between 2000 and 2009, the proportion of young people (0-14 years old) in the KMA declined from 30% to 26%, while the pro-portion of those aged 65 and over increased from 7% to 10%.
TABLE 2: Age Distribution of the Jamaican Population, 2000-2009KMA (%) Other towns (%) Rural areas (%)
0-14 15-64 65+ 0-14 15-64 65+ 0-14 15-64 65+
2009 26.4 64.4 9.5 29.5 61.7 8.8 32.4 55.0 9.6
2008 26.0 64.3 9.7 29.5 61.1 9.4 31.7 58.8 9.8
2007 27.3 63.5 9.3 30.2 61.3 8.5 33.6 57.1 9.4
2006 29.8 60.8 9.4 29.5 58.7 11.8 32.6 57.7 9.7
2005 29.6 60.1 10.4 29.7 59.3 11.0 35.0 55.8 9.2
2004 31.3 60.3 8.4 30.6 59.8 9.7 35.0 56.0 9.0
2003 29.1 62.7 8.2 34.7 56.9 8.4 33.9 56.4 9.7
2002 29.5 62.6 7.9 33.6 58.0 8.4 34.2 55.7 10.1
2001 30.2 63.1 6.7 32.0 57.3 10.8 35.0 54.6 10.5
2000 29.8 63.2 7.2 33.4 56.5 10.2 35.4 55.0 9.7
Source: Planning Institute of Jamaica/Statistical Institute of Jamaica, Jamaica Survey of Living Conditions, 2010 (cited in Thomas-Hope et al 2011)
HUNGRY CITIES REPORT NO. 4 7
3. GEOGRAPHY OF THE KMA
3.1 Socio-Economic Profile and Housing Patterns
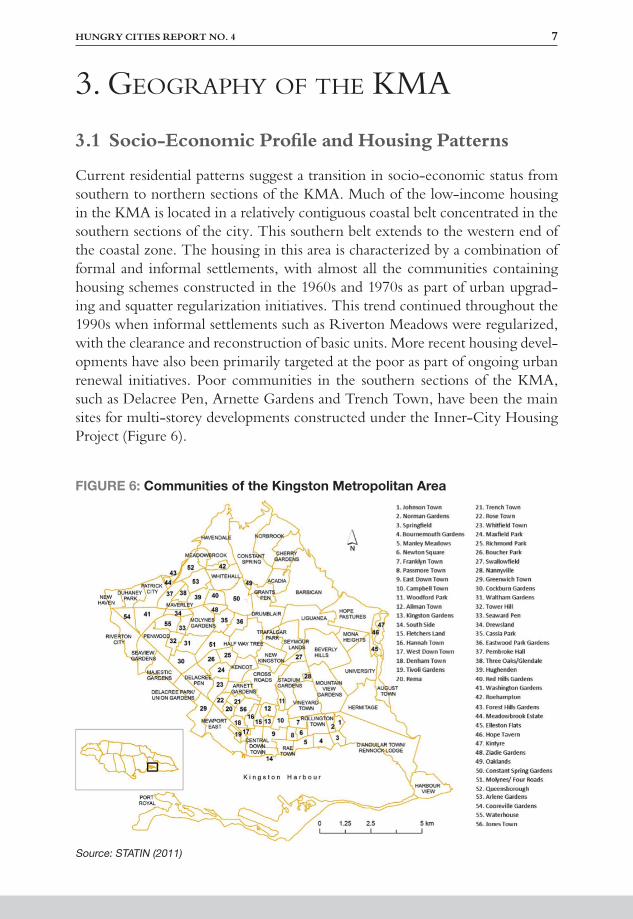
Current residential patterns suggest a transition in socio-economic status from southern to northern sections of the KMA. Much of the low-income housing in the KMA is located in a relatively contiguous coastal belt concentrated in the southern sections of the city. This southern belt extends to the western end of the coastal zone. The housing in this area is characterized by a combination of formal and informal settlements, with almost all the communities containing housing schemes constructed in the 1960s and 1970s as part of urban upgrad-ing and squatter regularization initiatives. This trend continued throughout the 1990s when informal settlements such as Riverton Meadows were regularized, with the clearance and reconstruction of basic units. More recent housing devel-opments have also been primarily targeted at the poor as part of ongoing urban renewal initiatives. Poor communities in the southern sections of the KMA, such as Delacree Pen, Arnette Gardens and Trench Town, have been the main sites for multi-storey developments constructed under the Inner-City Housing Project (Figure 6).
FIGURE 6: Communities of the Kingston Metropolitan Area
Source: STATIN (2011)

8 HUNGRY CITIES PARTNERSHIP
THE URBAN FOOD SYSTEM OF KINGSTON, JAMAICA
A second socio-economic zone extends across the central sections of the city where several government housing schemes were constructed in the 1960s and 1970s. This zone is far from distinct and contains the gamut of socio-economic groupings in the KMA. Lower-middle-income housing dominates the western end of this zone, including communities such as Duhaney Park, Patrick City and Cooreville Gardens.
North of these lower-middle-income residential areas is a zone including Bev-erly Hills and the New Kingston area referred to as the “Golden Triangle” with numerous high-income neighbourhoods characterized by gated residential enclaves (Kinlocke 2004). Also housing the urban elite are areas to the north, such as Norbrook, Cherry Gardens, Jacks Hill and Stony Hill. Single-family villas or double-storey dwellings on large lots dominated these localities, which do not display the symptoms of urban blight that feature extensively in lower-income areas. With such pronounced differences in socio-economic landscape, the social groups of “uptown” and “downtown” Kingston seem to operate in separate worlds. Such social dichotomies are commonly represented in the lit-erature on Kingston, though this may be an oversimplification of the complex and overlapping domains of the city’s social geography (Clarke and Howard 2006, Jaffe 2008). The juxtaposition of diverse communities, and the location of major commercial centres, inevitably counter the level of separation described by simple binary classifications (Kinlocke 2016).
These patterns are neither rigid nor regular, and spatial differentiation has become increasingly obscured with the city’s organic growth. As indicated above, several areas in the city are defined by the juxtaposition of low and high income settle-ment. Communities such as Barbican in the northern region of the city have the mixed socio-economic status that defines much of Kingston (Figure 7). Barbican is home to wealthy elite in gated communities and generous single-family prop-erties, as well as some of the city’s poorest residents. It also includes an extensive, wide-ranging middle class. This relatively large community is an iconic example of how social difference can become spatially compressed. Accordingly, general-ized classifications become less useful when representing areas at detailed spatial scales. In many cases, concrete and formidable divides have been set up to replace physical distance between disparate social groups.

HUNGRY CITIES REPORT NO. 4 9
FIGURE 7: Residential Differentiation in Barbican, Kingston
Source: Kinlocke (2016)
3.2 Income Distribution
Levels of inequality in Kingston increased over time, exacerbating existing social segmentation. Current patterns of differentiation suggest a general income gra-dient characterized by a transition in socio-economic status from southern to northern sections of the KMA. Many of the low-income communities in the KMA are located in a relatively contiguous coastal belt, which is concentrated in the southern sections of the city and extends to the western end of the coastal zone (Figure 8). A second income zone can be identified across the central sec-tions of the city where government housing schemes for lower-middle to middle income groups have been constructed. However, this zone, which includes the Golden Triangle, is far from distinct and contains communities with a range of socio-economic levels. Further north are upper-income communities, reflected in the property values and housing quality. Norbrook, Cherry Gardens, Jacks Hill and Stony Hill are located in these areas. The general income levels repre-sented in these neighbourhoods are in stark contrast to those that dominate the districts of the near coastal south.

10 HUNGRY CITIES PARTNERSHIP
THE URBAN FOOD SYSTEM OF KINGSTON, JAMAICA
FIGURE 8: Poverty Prevalence in the KMA
Source: STATIN (2011)
4. FORMAL ECONOMY
4.1 Jamaica’s Post-Colonial Economy
With globalization, Jamaica’s post-colonial economic transition had mixed out-comes. Indicators of its inability to weather the challenges of exogenous shocks and stressors are clearly inscribed in its landscape. The combined effects of inter-nal and external challenges have placed the country in a precarious position with regard to social and economic conditions and prospects for positive growth tra-jectories. Like many other Caribbean nations, Jamaica experiences the effects of neoliberalism intensely in many sectors that constitute the backbone of the local economy. Revenues from agriculture, mining and manufacturing initially provided the most significant sectorial earnings for the island but have subse-quently been replaced by the service industry, specifically tourism, as the largest contributor to GDP.
In the 1950s and 1960s, agriculture and mining contributed significantly to eco-nomic growth. Annual increases in GDP hovered around 5%-6% and, by 1970, Jamaica was third among Latin American and Caribbean countries with regard to per capita GDP (Duncan 1984). Most workers were employed in the sugar

HUNGRY CITIES REPORT NO. 4 11
industry, and rural livelihoods were primarily built on relatively reliable resourc-es of small-scale agriculture. Primary commodities, such as sugar and bananas, accounted for more than 30% of export earnings during the 1950s. However, this contribution had declined to approximately 9% by 1970, partly as a result of the increase in the relative contribution of bauxite mining and decrease in export-driven agricultural activity through globalization (Duncan 1984). The sector experienced a marginal rebound in the mid-1970s after preferential agree-ments were established with EU markets. These trading preferences were largely derived from agreements such as the Lomé Convention and Cotonou Agree-ment, which provided guaranteed markets to Caribbean farmers and commodity prices higher than the world market. The multiplier effects of a comparatively stable agricultural sector facilitated higher levels of predictability and security among rural households, but did not stem the flow of migrants to urban centres (Clarke 2006, Duncan 1984).
Bauxite exports began in 1952 and, by the early 1970s, Jamaica was the second largest exporter of bauxite and alumina in the world. The economic gains of bauxite mining contributed significantly to the development of some rural com-munities and, by extension, national development. In towns such as Mandeville, Nain and Ewarton, the expansion of the bauxite industry stimulated economic growth. Many people from surrounding communities were employed in the industry and the economies of nearby towns expanded through enhanced com-mercial activity. Employment in the bauxite industry was associated with higher wages, the growth of retail activity, and general expansion of urban infrastruc-ture. But while the bauxite industry facilitated intensive capital injection, it was not sufficiently labour intensive and, along with a challenged agricultural sector, was ineffective in neutralizing the migratory magnetism of Kingston.
Jamaica was increasingly challenged by political mismanagement, neoliberalism, and the oil crisis of the 1970s. These had dire consequences for the state’s post-colonial development, exacerbating structural and administrative maladies and political ferment and uncertainty. The global oil crisis highlighted the country’s dependence on foreign exchange flows (CaPRI 2008). The 1970s marked the start of Jamaica’s far-reaching problems of severe national debt. Shifts in political ideology compounded these issues. When the People’s National Party secured political leadership in 1972, state intervention and ownership increased and many of the “Industrialization by Invitation” initiatives that had fuelled investment in earlier decades were negated by the embrace of democratic socialism (Duncan 1984). The policies of this era coincided with the external economic crisis with severe negative implications for the national economy.
Globalization and neoliberalism consistently stymied the viability of Jamaica’s most important industries. The agricultural sector experienced significant decline when free trade precipitated the dismantling of the preferential relation-

12 HUNGRY CITIES PARTNERSHIP
THE URBAN FOOD SYSTEM OF KINGSTON, JAMAICA
ships with European markets. Although the transition was gradual, local agri-culture was unable to remain viable in the more competitive environment and this heralded a significant decline in both commercial and small-scale agriculture (Beckford and Campbell 2013).
4.2 Economic Sectors and Activities
Jamaica is classified as an upper-middle-income country by the United Nations Development Programme (UNDP). The country has a Human Development Index (HDI) value of 0.715 and was ranked 96 out of 187 countries on the HDI in 2013 (UNDP 2014). The 21st Century national economy is largely dependent on tourism, bauxite mining (refined for the production of alumina) and migrant remittances. Although the economy is highly trade-oriented and, in the case of remittances, externally dependent, there is also a significant informal sector (CIA 2016, WTO 2014).
Since 2005, the national economy has moved away from activities such as agri-culture, mining and manufacturing. The services industry, in particular tour-ism, has become the country’s main economic activity and source of foreign exchange. According to the WTO (2014), the tourism sector accounted for over three-quarters of GDP in 2009 and employed two-thirds of the labour force. The country’s other main sectors include: (a) food producing industries, agri-culture, mining and quarrying, manufacturing, and construction; and (b) service industries including energy, electricity and water, transport, storage and com-munications, finance and insurance services, hotels and restaurants, entertain-ment and sports, and wholesale and retail trade (PIOJ 2014).
Kingston has been described as a “site in which wealth and power are concen-trated, whilst simultaneously exhibiting some of the country’s most profound problems of social exclusion and deprivation” (Dodman 2003: 34). Addition-ally, Dodman (2008) highlighted the role of the country’s Urban Development Corporation (UDC) in development efforts in the city, including the Kings-ton waterfront redevelopment. In 2007, a redevelopment plan for Kingston was launched by the UDC that included proposals for the development of a new market district and transportation hub. The Kingston Restoration Company and UDC have entered into a partnership to revitalize Kingston by developing sites in areas such as downtown Kingston and exploring new industries as potential sites for economic growth and employment (Beirnard et al 2011). These include music, information and communication technology, and natural/agricultural products.

HUNGRY CITIES REPORT NO. 4 13
4.3 Employment and Unemployment
The IADB (Inter-American Development Bank) (2006) calculated that the total employed labour force in Jamaica in 2001 was 940,000, with 47% (443,670) in the formal sector and 53% (496,330) in the informal sector (Figure 9). According to the Statistical Institute of Jamaica (STATIN), the total labour force of Jamaica had grown to 1,305,500 in 2014, with 716,700 men and 588,800 women. A total of 175,100 (13.4%) were unemployed, comprising 72,700 men (5.6%) and 102,400 women (7.8%) (PSOJ 2014: xvi). Table 3 shows employment by differ-ent industry groupings.
FIGURE 9: Formal and Informal Labour Force of Jamaica, 2001
Source: IADB (2006: 21)

14 HUNGRY CITIES PARTNERSHIP
THE URBAN FOOD SYSTEM OF KINGSTON, JAMAICA
TABLE 3: Jamaica – Employed Labour Force by Industry GroupIndustry group No. %
Wholesale and retail; Repair of motor vehicles and equipment 233,200 20.6
Agriculture, hunting, forestry and fishing 207,100 18.3
Construction 81,500 7.2
Hotels and restaurants services 80,700 7.1
Transport, storage and communications 71,800 6.4
Manufacturing 71,700 6.3
Real estate renting and business activities 70,700 6.3
Education 70,000 6.2
Public administration and defence; Compulsory social security 57,200 5.1
Private households with employed persons 55,600 4.9
Other community social and personal service activities 54,200 4.8
Health and social work 32,600 2.9
Financial intermediation 26,200 2.3
Electricity, gas and water supplies 8,000 0.7
Mining and quarrying 6,900 0.6
Industry not specified 3,100 0.3
Source: http://statinja.gov.jm/LabourForce/NewLFS.aspx
Table 4 indicates the annual average wages across sectors and shows that averages were highest in the tourism sector, manufacturing and financial services.
TABLE 4: Jamaica – Annual Averages of Wage Earners in Large EstablishmentsSector Average (JMD)
Trade, hotels and restaurants 53,918
Manufacturing 40,578
Financing, insurance, real estate and business services 33,860
Food, beverages and tobacco 20,568
Transport, storage and communications 16,120
Construction 6,802
Textiles, wearing apparel, leather and footwear 5,447
Chemicals; chemical, rubber and plastic products 4,704
Electricity, gas and water supplies 4,448
Paper and printing 3,966
Basic metal and fabricated metal products, machinery and equipment 2,236
Wood and wood products 2,236
Mining 2,179
Non-metallic mineral products 1,145
Other manufacturing (excluding metal products, machinery and equipment) 277
Source: http://statinja.gov.jm/LabourForce/Newemploymentstats.aspx
HUNGRY CITIES REPORT NO. 4 15
5. INFORMAL ECONOMY
5.1 Size and Importance
Demographic changes and shifts in the structure of production have had sig-nificant effects on the labour markets of the English-speaking countries of the Caribbean in recent decades. The slowing down of Caribbean economic growth, especially following the 2008 financial crisis, has led to a decline in formal sector employment (Franklin 2010). This has stimulated an increase in the number of self-employed and the growth of small and micro enterprises (SMEs), includ-ing in the informal sector. There have been several past studies of the informal economy in Jamaica (Vuletin 2008, Bennett 1995, Witter and Kirton 1990). All reported on the informal sector in the country as a whole and have not referred specifically to the situation in the city of Kingston. However, given the impor-tance of Kingston as the main hub of Jamaica’s population and economic activ-ity, it can safely be assumed that the informal sector of Kingston is a significant part of the findings of these studies.
The literature contains a wide range of perspectives and definitions on what constitutes “informality” in Jamaica. Witter and Kirton (1990) defined informal activities in Jamaica as those that violate any aspect of the socio-legal frame-work of the economy. Tokman and Klein (1993) referred to the informal sec-tor as operating in a grey area between illegality and legality. In a more recent study conducted for the IADB (2006), the informal economy was divided into three categories: (a) activities that evade taxation, (b) activities that are part of the irregular economy, and (c) people engaged in illegal activities. The irregular economy covers the production of legal goods and services in unregistered and, hence, largely untaxed and unrecorded small businesses. Some activities in the informal sector fall within the definition of underground activity. Additionally, there are informal activities that are illegal on account of their non-payment of government taxes and non-observance of other legal regulations (IADB 2006).
There are three generally accepted methods for estimating the size of the Jamai-can informal economy and its contribution to GDP: (a) direct approaches that employ household surveys or audit tax returns to extrapolate data relating to informal sector activities; (b) indirect, or discrepancy, methods that use available economic data to estimate changes in the size of the shadow economy over time; and (c) modelling approaches, which examine the causes and effects of infor-mal activities to estimate the size of the informal sector. Depending on which method is used, the IADB calculated that in 2000-2001, the informal sector contributed between 25% and 40% of Jamaica’s GDP (Figure 10) (IADB 2006: 1). The overall trend showed that the informal sector had become increasingly important over time, rising from 5% of GDP in 1966 to 32% in 2000.

16 HUNGRY CITIES PARTNERSHIP
THE URBAN FOOD SYSTEM OF KINGSTON, JAMAICA
FIGURE 10: Increase in Contribution of Informal Economy to GDP Using Different Measures, 1966-2000
Source: IADB (2006: 14)
5.2 Profile and Characteristics
The informal sector includes a wide range of operations and workers ranging from one-person street traders or peddlers to relatively sophisticated small entre-preneurial activities. In general, the sector includes enterprises concentrated in low-productivity, labour-intensive activities. The IADB (2006: 2) study of Jamaica indicated that the informal sector was characterized by the following:
than workers in the formal sector;
sector was a desire for independence (cited by 38% of entrepreneurs), fol-lowed by the desire for higher earnings than in low-skilled formal activities;
-prises (with only 23% of the operations using account books and only 21% having a business plan);
or agriculture, and a further 9% in the manufacturing sector.

HUNGRY CITIES REPORT NO. 4 17
Of the 496,000 workers in the informal sector in 2001, 226,000 were self-employed and 178,000 were wage workers (Figure 9). The rest were unpaid workers. Women made up a larger proportion of the informal sector (57% compared with 50% in the formal sector) (IADB, 2006). There were impor-tant gender differences across different types of enterprises. In particular, while women made up the majority of own-account workers (58%), they comprised a progressively smaller proportion of larger-firm owners. In the case of small firms, almost 80% of the entrepreneurs were men, though the overall male workforce participation rate was around 50%.
A 2003 survey of 1,226 micro-enterprises found that they were operating in four main sectors: (a) wholesale/retail trade; (b) education, social work and other personal services; (c) hotels and restaurants; and (d) manufacturing. Each sector was dominated by different types and sizes of enterprise. Some 60% of the sole proprietor (own account) enterprises, for example, were in wholesale and retail trade. The average monthly income of each enterprise also varied by size: from JMD18,510 for own account to JMD56,702 for micro-enterprises to JMD894,252 for small enterprises (IADB 2006).
5.3 Spatial Distribution
The 2003 IADB survey showed the concentration of activity in Kingston and neighbouring parishes, and the dominance of micro and small businesses over self-employment in comparison to other parts of the island (Figure 11) (IADB 2006). Irrespective of type and size, most enterprises served a highly localized clientele of low and middle-income households in their neighbourhood (Table 5).
TABLE 5: Distribution of Customers by Enterprise SizeOwn account (1 person) %
Micro (2-4 persons) %
Small (5-20 persons) % Total %
Local individual customers 91.4 90.7 83.5 90.3
Tourists 5.9 0.6 0.4 3.3
Private enterprises 0.6 4.0 8.7 2.8
Wholesalers/retailers 1.5 2.4 5.8 2.3
Public institutions 0.5 1.9 1.5 1.1
Peddlers 0.1 0.4 0.1 0.2
N 638 424 164 1,226
Source: IADB (2006: 34)Note: Enterprises are classified by the number of people working in them

18 HUNGRY CITIES PARTNERSHIP
THE URBAN FOOD SYSTEM OF KINGSTON, JAMAICA
FIGURE 11: Location of Small and Micro-Enterprises in Jamaica
Source: IADB (2006: 25)
5.4 Policies towards Informal Food Markets and Vendors
A recent study of informality in Jamaica argued that enterprises remain infor-mal because of the high cost of doing business as a formal establishment (FOR-LAC/ILO 2014). The World Bank’s Doing Business 2014 ranked Jamaica 94th of 189 countries, with the worst scores for paying taxes (168), providing electric-ity (132) and enforcing contracts (131). The report notes that “negotiating the bureaucracy has long been a complaint of the investor community and one of the challenges governments have accepted in crafting growth strategies. The costs are probably most burdensome on small enterprises that do not have the margin of employee time and resources to spend in compliance, particularly tax pay-ments. Tax avoidance is perhaps the single most common reason” (FORLAC/ILO 2014).
The Kingston and St Andrew Corporation (KSAC) attempted a vendor registra-tion programme over two months in 2015, with the stated intention of “main-taining order” in the market districts within the formal markets and designated vending areas in the greater Kingston area (in the parishes of Kingston and St Andrew). The aim of the vendor registration programme was to ensure that all vendors operating within legal areas were registered. The vending fee for stalls in markets and arcades is JMD3,000 per year (approximately USD25); JMD5,000 (USD42) for an off-street annex and JMD6,000 (USD50) for approved on-street areas (Gleaner 2015).

HUNGRY CITIES REPORT NO. 4 19
The general policy of the KSAC is that vendors should be registered and located in designated places. The corporation’s drive to stop illegal vending on the streets in no-vending zones has led to evictions from several areas. In March 2015, the evictions included locations (such as Orange Street) where vendors had been sell-ing for more than 35 years. The authorities reported that they aimed to clear the streets so that the area could be easily policed to protect shoppers and merchants, as well as the vendors (Alleyne 2015). The police had difficulty controlling pro-testors who marched to the KSAC office in an attempt to speak with the mayor and, when that failed, tried to storm the parliament building, Gordon House. In April 2015, vendors were temporarily allowed to operate in no-vending zones until a suitable area could be found that would meet the specific requirements of the KSAC, or until other arrangements were made in the same area (Jamaica Observer 2015). Vendors were also required to get requisite licences and permits from the KSAC and Food Handlers’ Permits from the Public Health Depart-ment in order to operate. By August 2015, over 200 vendors had registered with the KSAC (Linton, 2015). Videos of vendor protests in 2010 and 2015 can be viewed here: http://bit.ly/2uS09ZX and http://bit.ly/2vyPrJy
FIGURE 12: Street Vending in Downtown Kingston
Source: http://www.traveladventures.org/countries/jamaica/images/kingston-market09.jpg
20 HUNGRY CITIES PARTNERSHIP
THE URBAN FOOD SYSTEM OF KINGSTON, JAMAICA
6. URBAN FOOD SYSTEM
6.1 Sources of Food and Food Flows into the KMA
Kingston’s population is fed by a combination of food imports and domestic production from agricultural areas across the island. Some key food staples are imported, including rice and flour. The parishes contributing most significantly to domestic crop production are St Elizabeth, Trelawny, Manchester, West-moreland and Clarendon. Of these, St Elizabeth is the largest contributor to domestic agricultural production (Ministry of Agriculture 2008). The key trad-ing point for fresh produce flows into Kingston is Coronation Market located in the traditional city centre (referred to as “downtown). Between 60% and 70% of fruit and vegetables arriving at Coronation Market are re-distributed through other wholesale markets in and around Kingston (Seepersad and Ennis 2009).
Domestically produced foods flow into Kingston largely through Jamaica’s hig-gler system (Brown-Glaude 2011). These informal vendors perform many func-tions as market intermediaries, including trade, harvesting, post-harvest process-ing, re-distribution and sales. Seepersad and Ennis (2009) suggest the following typology for higglers:
-ca to wholesalers, supermarkets, hoteliers or processors.
at the same place or at other locations in the city.
purchase produce at night and then sell it during daylight hours, which tends to be safer.
Higglers benefit from large volumes of produce sold at competitive prices and enjoy up to 44% price markups from farm gate to retail (Seepersad and Ennis 2009). More than 90% of higglers are women.

HUNGRY CITIES REPORT NO. 4 21
FIGURE 13: Higglers in Coronation Market in Kingston
Source: Jonathan Crush
FIGURE 14: Papine Market in Kingston
Source: Jonathan Crush
FIGURE 15: Roadside Vendor in Kingston
Source: Jonathan Crush

22 HUNGRY CITIES PARTNERSHIP
THE URBAN FOOD SYSTEM OF KINGSTON, JAMAICA
In Kingston, the informal food sector’s most visible activities are the selling of fresh produce including a wide range of fruit and vegetables from station-ary or itinerant stalls on the side of the road; food production/preparation, sale and catering; and transport associated with the supply side of the informal food sector. Studies have shown that women chiefly own and manage small catering operations and sell street food. They are traditionally skilled in these activities, already have the necessary cooking utensils at home, and the food that they pre-pare also enables them to feed their families at lower cost (FAO 2003).
The spatial distribution of the informal food retail sector in Kingston shows con-centration of activities at the main centres of commercial activity where poten-tial clients require food during the working day. Mobile informal food vendors congregate near transport hubs, as well as locations close to schools and offices to facilitate access to food for consumers, saving them time and transport costs. Additionally, informal food retailers are found in the form of corner shops, which are concentrated at major road intersections and dispersed close to, or within, areas of informal and formal low-income housing.
Informal food retailers operate with low capital investment (FAO 2003). They adjust to the socio-economic circumstances of their clients by selling small units affordable to the poor, and adopt customer-friendly practices to cultivate loyalty by providing extra portions at no charge or providing credit. In periods of eco-nomic crisis, the decline in purchasing power and fall in employment opportuni-ties in the formal sector often spur the development of the informal food sector as this provides employment and income to households in difficulty.
6.2 Typology and Spatial Location of Food Outlets for Households
Food outlets range from large “cash and carry” wholesale membership hyper-markets (which sell a wide range of non-food items as well as frozen and fresh food items), supermarkets that are part of chains (for example, HiLo, SuperPlus and Loshusan at the high end of the range), independent supermarkets, fresh produce markets and roadside stands. Produce markets remain an important intermediary for fruit and vegetables for Kingston. An estimated 80% of fresh produce passed through produce markets in 2008, while only 5% was sold at supermarkets (Seepersad and Ennis 2009). The main produce markets are Coro-nation Market in downtown Kingston, the Agricultural Marketing Corporation on the western periphery of the city (at Three Mile), Constant Spring Market on the northern periphery, and Papine Market in the east. Produce markets are key sites for consumers to purchase fresh fruit and vegetables. In a 2008 study, it was estimated that 57% of consumers purchased produce at these markets, compared to 30% at supermarkets and 10% at roadside stalls (Seepersad and Ennis 2009). Retail vendors tended to buy fresh foods from higglers at Coronation Market to

HUNGRY CITIES REPORT NO. 4 23
sell at other formal markets of the city, or from roadside stands at various sites including major road intersections and nodes of small-scale commercial activity.
FIGURE 16: Supermarket in Kingston
Source: Robert Kinlocke
Supermarkets are supplied by wholesaler marketers who either purchase the fresh items at Coronation Market or directly from farmers. They are increasingly capturing a larger market share for fresh produce that meets food safety standards and is quality-controlled. However, prices are significantly higher, sometimes by as much as two-thirds (Seepersad and Ennis 2009). SuperPlus and HiLo com-mand the greatest market share among supermarkets. Small, independent super-markets are numerous in Kingston. They are chiefly located in low-income areas of the city and sell mainly convenience items, processed foods and small amounts of fresh produce.
Meat tends to be purchased at both supermarkets (53%) and produce markets (10%) (Seepersad and Ennis 2009). Over half (53%) of the consumers preferred domestically produced fruit and vegetables. Data from the Consumer Affairs Commission (2013) showed that, overall, food purchases for household con-sumption were mostly from supermarkets, with markets, local shops and munic-ipal markets being less significant.
6.3 Changing Food Prices within the KMA
Jamaicans spend an average of 43% of their income on food; a figure significantly influenced by price shocks (Ministry of Agriculture 2008). Some of these shocks are the result of severe weather conditions, including cyclones with excessive rains as well as drought. Heslop-Thomas et al (2015) examined changes in food prices following periods of drought. Jamaica is characterized by two short rainy seasons: one in May and the other October to November. Since 2000, there has been a noticeable increase in the number, intensity and duration of droughts

24 HUNGRY CITIES PARTNERSHIP
THE URBAN FOOD SYSTEM OF KINGSTON, JAMAICA
(IPCC, 2014). 2010 and 2015, in particular, were confirmed as drought years by the Meteorological Office of Jamaica (2014). Based on this information, these two years were selected for study with the objective of ascertaining the impact of droughts on the prices and availability of agricultural food items.
The agricultural surveys conducted by the Ministry of Agriculture and Fisheries were used to identify the most popular agricultural items consumed (http://www.moa.gov.jm). Because of the dominant role of supermarkets in the purchase of a range of food items consumed by households in Kingston, food price data were collected from these outlets. Nine commodities were identified as among the most popular for household consumption: tomatoes, cabbage, carrots, red peas, onions, Irish potatoes, yellow yam, ripe plantain and green bananas.
Price data on agricultural items for 2010 showed that five out of the nine items experienced a price increase in this period. These were cabbages, bananas, car-rots, tomatoes and onions. The most significant increases were in excess of 100% for tomatoes and cabbages. Tomatoes increased by 199% from JMD207.43 per kilogram in January 2010 to JMD619.40 per kilogram in December 2010. The price for cabbage increased by 107% over the same time period, from JMD157.45 to JMD325.28 per kg. Items that experienced less significant increases were car-rots, Irish potatoes and onions. Carrots increased by 24% from JMD157.45 to JMD278.88 per kg, Irish potatoes by 22% from JMD224.26 to JMD261.87 per kg; and onions by 21% from JMD162.92 to JMD197.79 per kg (Figure 17).
FIGURE 17: Price Changes of Select Food Items between January and December 2010
Source: Heslop-Thomas et. al. (2015)
The prices of four of the nine selected agricultural items actually decreased over the period January to December 2010 (Table 6), although the decreases were small. For example, there was a marginal reduction of 1% for green bananas from
Bananas (green)
Cab-bage
Agricultural items
Carrot Irish potato
Onion Plantain (ripe)
Red peas
Toma-toes
Yellow yam
-50
0
50
100
150
200
250
Jam
aica
n do
llars

HUNGRY CITIES REPORT NO. 4 25
JMD93.12 per kg in January to JMD92.48 per kg in December 2010. Similarly, a 2% price decrease was observed for ripe plantains. The greatest decrease was for red peas, which dropped 18% from JMD273.75 to JMD224.40 per kg. It is possible that the relatively significant decrease in the cost of red peas was due to falling demand. Throughout the year, red peas are commonly used in some tra-ditional dishes but are usually replaced by gungo peas (pigeon peas) in December.
TABLE 6: Percentage Price Changes in Agricultural Items in 20102010
Agricultural item January (JMD per kg)
December (JMD per kg) % change
Bananas (green) 93.12 92.48 -1
Cabbage 157.45 325.28 107
Carrot 224.26 278.88 24
Irish potato 214.75 261.87 22
Onion 162.92 197.79 21
Plantain (ripe) 201.77 198.09 -2
Red peas 273.75 224.40 -18
Tomatoes 207.43 619.40 199
Yellow yam 200.09 179.43 -10
Source: Heslop-Thomas et. al. (2015)
An analysis of price changes in 2015 showed that the cost of all nine agricul-tural food items increased (Figure 18) (Heslop-Thomas et. al., 2015). Prices of two of the items rose more than 100%: cabbages increased by 128% from JMD162.26 per kg in January to JMD370.40 per kg in December 2015 (Table 7). Carrots increased by 127% from JMD227.01 to JMD516.16 per kg. Yellow yam increased by 48%, tomatoes by 27%, and ripe plantain by 11% (Figure 18). Four agricultural items experienced increases of less than 10%: red peas (8%), Irish potatoes (6%), onions (4%) and green bananas (2%).
TABLE 7: Percentage Change in Cost of Agricultural Items in 20152015
Agricultural items January December % change
Bananas (green) 115.62 118.41 2
Cabbage 162.26 370.40 128
Carrot 227.01 516.16 127
Irish potato 293.55 310.77 6
Onion 243.50 254.30 4
Plantain (ripe) 218.46 241.62 11
Red peas 317.34 342.14 8
Tomatoes 326.48 414.99 27
Yellow yam 260.03 385.60 48
Source: Heslop-Thomas et al (2015)

26 HUNGRY CITIES PARTNERSHIP
THE URBAN FOOD SYSTEM OF KINGSTON, JAMAICA
FIGURE 18: Price Changes between January and December 2015
Source: Heslop-Thomas et al. (2015)
The 2010 and 2015 data shows that when price decreases occur, they are usually marginal (less than 10%). In contrast, most price increases are very large and in some instances well over 100%. Tomatoes and cabbages tend to experience the most exorbitant price increases, probably due to the scarce supply of these crops during droughts because of their high water requirements. While tomatoes and cabbages have short gestation periods of four to five months, they can be grown year round subject to water availability. As small farmers without access to sophisticated irrigation systems constitute the bulk of cabbage and tomato producers in Jamaica, the impact of drought on these crops tends to be severe. Conversely, tree crops fare better under adverse conditions, which explains the decrease or minimal increase in the price of plantains and bananas.
Food prices in Jamaica were also significantly impacted by the 2007-2008 global food price crisis (Table 8). Spikes in prices resulted in a reduction in the quality and diversity of food purchased (IDS, 2009). The food price crisis also caused an increase in informal sector employment in Kingston (IDS 2009). Remittance inflows from outside Jamaica decreased by 10% between January 2008 and 2009, although it is unclear to what extent this can be attributed to the food price crisis or the financial crisis more generally.
Bananas (green)
Cab-bage
Agricultural items
Carrot Irish potato
Onion Plantain (ripe)
Red peas
Toma-toes
Yellow yam
0
20
40
60
80
100
120
140
Jam
aica
n do
llars

HUNGRY CITIES REPORT NO. 4 27
TABLE 8: Impact of Food Price Crisis on Products in Urban JamaicaProduct 2007/2008 (JMD) 2008/2009 (JMD)
Mackerel 40 60
Chicken breast 25 70
Turkey neck 25-30 60
Oxtail 280 300
Chicken neck 15 50
Bread 80 180
Cabbage 35 80
Callalloo 15-20 60
Coco/yam/dasheen 20-50 70-80
Carrots (seasonal) 20 70
Tomatoes (seasonal) 40 150
Rice (large bag) 300 800
Source: IDS (2009)
6.4 Changing Urban Diets and Consumption Patterns
Drivers of demand for fresh produce include quality, price, consistency of sup-ply, and whether or not goods are produced locally. Although there is a strong preference for domestically produced goods, cheaper prices, more attractive packaging, and perceived safety of imports are enticing to consumers (Seepersad and Ennis 2009). Jamaica has also moved increasingly towards a higher fat, more refined diet, resulting in higher rates of obesity and nutrition-related chronic dis-eases (Turner-Pitt and Edwards 2006). One recent study examined the relation-ship between eating unhealthy foods, identification with American values and behaviour, and maternal influences in the home among 330 randomly selected adolescent-mother dyads in Kingston (Ferguson et al 2017). Girls’ Ameri-can identity/behaviour directly predicted their unhealthy eating, whereas girls’ mothers and boys’ American identity/behaviour indirectly predicted unhealthy eating. A comparison of data from the two lifestyle surveys conducted in Jamaica as a whole in 2000/01 and 2007/08 found that there was a statistically significant increase in the prevalence of intermediate CNCD (chronic non-communicable diseases) risk factors such as hypertension (20.9% to 25.2%) and obesity (19.7% to 25.3%) (Ferguson et al 2011).
6.5 Food Safety
Seepersad and Ennis (2009) concluded that food safety was a significant issue in Kingston’s food markets (Figures 19 and 20). They identified a range of prob-lems, including the proliferation of derelict structures, poor drainage, poor gar-bage disposal and illicit dumping, inadequate implementation of sanitary proce-dures, and unavailability of running water. These conditions posed “major food safety risks” to local residents and tourists.

28 HUNGRY CITIES PARTNERSHIP
THE URBAN FOOD SYSTEM OF KINGSTON, JAMAICA
FIGURE 19: Summary of Conditions at the Fresh Produce MarketsExisting Conditions Key Constraints/Challenges/Issues
unavailability of running water
considered as “garbage”
illicit dumping
sanitary operating procedures
and socially volatile area
fresh produce market activities
Effects of poor health conditions at the markets include:
residents
other visitors with negative implications for the premium tourist destination
integrity
substitutes
“informal” security personnel
early mornings. Lighting is inadequate in all markets.
Source: Seepersad and Ennis (2009)
FIGURE 20: Food Waste and Garbage in Coronation Market, Kingston
Source: Elizabeth Thomas-Hope
More detailed information on consumer perceptions is available from a study of food safety awareness in Kingston (Knight et al 2003). The data were col-lected by means of interviews with 110 randomly selected householders in a community representing three distinct socio-economic groups in the KMA in January-March 1999. Respondents were questioned about their awareness of safe food handling, perception of risk, food handling practices, and attitudes to food safety issues. The majority of respondents reported a fairly high knowledge of safe food handling practices (although more than half were unfamiliar with the

HUNGRY CITIES REPORT NO. 4 29
correct procedures for freezing and thawing of foods). Householders were very concerned about the food that they purchased for preparation at home, indicat-ing particular concern about the sanitation of food handling establishments, food handlers’ practices, and the appearance of foods purchased.
Most respondents had never contacted their local health department or the Min-istry of Health regarding their food safety concerns. Diarrhoea, stomach pain, vomiting and nausea were reported as the major symptoms of food-borne illness, and animal foods including dairy, beef, chicken, pork and fish/shellfish were implicated as the main source of illnesses related to food contamination. There were no significant differences by gender and between socio-economic groups in the study, except for concern with the appearance of food (gender) and shopping options (socio-economic groups).
Training in food handling is among the methods used to address the issue of improving food safety and the Government of Jamaica, through the Ministry of Health, carries out these training programmes. Everyone involved in the prepa-ration and sale of cooked food is required by law to hold a food handler’s permit. Checks are periodically made to optimize compliance. Another study exam-ined the effectiveness of the mandatory training programme for food handlers (Thelwell-Reid 2014). A cross-sectional survey with self-administered question-naires was used to assess and compare food safety knowledge and self-reported practices of food handlers trained in two government programmes. Untrained food handlers were used as controls. Descriptive and inferential statistics were used to explore relationships between training and knowledge and practice. According to the findings, trained food handlers had a statistically significant higher mean knowledge score and practice score than untrained food handlers, although both scores of both groups were significantly lower than the minimum acceptable standard.
6.6 Types and Impact of Social Protection
The Jamaica Food Stamp Programme supports nutrition for children, replac-ing the food subsidy programme of the early 1990s (Grosh, 1992; McDonald, 2002). In 2002, the Food Stamp Programme was amalgamated with the broader Programme of Advancement through Health and Education (PATH). PATH involves cash transfers to low-income citizens. PATH’s 2007 evaluation found successful targeting of Jamaica’s poorest citizens, positive impacts on school attendance, and increased use of preventative health care (Levy and Ohls, 2007). In 2014, the Government of Jamaica launched a comprehensive social protection strategy. This initiative addresses issues of poverty and social exclusion, includ-ing food insecurity, through support mechanisms for small farmers and school gardens (PIOJ 2007).

30 HUNGRY CITIES PARTNERSHIP
THE URBAN FOOD SYSTEM OF KINGSTON, JAMAICA
7. FOOD INSECURITY IN THE KMAThe existing literature on food insecurity in Kingston is sparse, but there are two reports on aspects of food insecurity in Jamaica that included the city. One explored the relationship between undernourishment and overweight in the Caribbean Islands of Jamaica and St Lucia (Karfakis et al 2011). The analysis was based on household surveys conducted in late 2006 and early 2007 of 1,009 Jamaican households (and 729 in St Lucia). Using anthropometric data from the participating households, the study confirmed evidence of food insecurity in both countries. An additional food security issue that was observed was the presence of energy-intensive and unbalanced diets leading to overweight and obesity.
The second study provided a gender-based comparative analysis of the associa-tion between household food insecurity and overweight among 1,190 children aged 10 and 11 years old living in the Canadian province of Québec and 1,674 in Jamaica (Dubois et. al., 2011). Analyses were performed using data from the 2008 round of the Québec Longitudinal Study of Child Development and the Jamaica Youth Risk and Resiliency Behaviour Survey of 2007. Body mass index was derived using anthropometric measurements and overweight was defined using Cole’s age- and sex-specific criteria. Questionnaires were used to collect data on food insecurity. The associations between food insecurity and overweight were examined using chi-square tests and multivariate regression models were used to estimate odds ratios and 95% confidence intervals. The prevalence of overweight was 11% in the Jamaican sample. Children who lived in food-insecure house-holds had significantly lower odds of being overweight in comparison to children living in food-secure households. No gender differences were observed in the relationship between food insecurity and overweight/obesity among Jamaican children.
8. CONCLUSION
This audit of the city of Kingston shows that there are significant information gaps in our understanding of the urban food system. As the research programme of the Hungry Cities Partnership progresses, many of these gaps will be filled in subsequent HCP reports on Kingston.
HUNGRY CITIES REPORT NO. 4 31
REFERENCES
1. Alleyne, R. (2015). “KSAC Angers Downtown Kgn Vendors” Jamaica Observer 4 March.
2. Beckford, C. and Campbell, D. (2013). Domestic Food Production and Food Security in the Caribbean: Building Capacity and Strengthening Local Food Produc-tion Systems (New York: Palgrave McMillan).
3. Beirnard, M., Fernandez del Castillo, S., Chaudhary, S., Hasan, S. and Kagarama, D. (2011). “Inclusive Economic Growth in Kingston, Jamaica” Report for Kingston Restoration Company and Urban Development Cor-poration.
4. Brown-Glaude, W. (2011). Higglers in Kingston: Women’s Informal Work in Jamaica (Nashville: Vanderbilt University Press).
5. Erikson, D. and Lawrence, J. (2008). “Beyond Tourism: The Future of the Services Industry in the Caribbean” CIGI and CaPRI Caribbean Paper No. 3, Kingston and Waterloo.
6. CIA (2016). “The World Factbook 2016” At: https://www.cia.gov/library/publications/the-world-factbook/geos/jm.html
7. Chen, M. (2012). “The Informal Economy: Definitions, Theories and Policies” Women in Informal Employment Globalizing and Organizing (WIEGO) Working Paper No 1, Cambridge MA and Manchester UK.
8. Clarke, C. (2006). Kingston, Jamaica: Urban Development and Social Change, 1692-2002 (Kingston: Ian Randle Publishers).
9. Clarke, C. and Howard, D. (2006). “Contradictory Socio-Economic Con-sequences of Structural Adjustment in Kingston, Jamaica” Geographical Jour-nal 172: 106-129.
10. Consumer Affairs Commission. (2013). “Consumer Perception Survey” Unpublished Data.
11. Dodman, D. (2008). “Developers in the Public Interest? The Role of Urban Development Corporations in the Anglophone Caribbean” Geographical Journal 174: 30-44.
12. Dodman, D. 2003. “Nature, Power and Participation: An Exploration of Ecology and Equity in Kingston, Jamaica” PhD Thesis, University of Oxford.
13. Dubois, L., Francis, D., Burnier, D., Tatone-Tokuda, F., Girard, M., Gor-don-Strachan, G., Fox, K. and Wilks, R. (2011). “Household Food Insecu-

32 HUNGRY CITIES PARTNERSHIP
THE URBAN FOOD SYSTEM OF KINGSTON, JAMAICA
rity and Childhood Overweight in Jamaica and Québec: A Gender-Based Analysis” BMC Public Health 11:199.
14. Duncan, W. (1984). “Jamaica: Alternative Approaches” In R. Wesson (ed.), Politics, Policies and Economic Development in Latin America (Kingston: Hoover Institution Press).
15. Ferguson, T., Tulloch-Reid, M., Cunningham-Myrie, C., Davidson-Sadler, T., Copeland, S., Lewis-Fuller, E. and Wilks, R. (2011). “Chronic Disease in the Caribbean: Strategies to Respond to the Public Health Chal-lenge in the Region. What Can We Learn From Jamaica’s Experience?” West Indian Medical Journal 60: 397-411.
16. Ferguson, G., Muzaffar, H., Iturbide, M., Chu, H. and Gardner, J. (2017). “Feel American, Watch American, Eat American? Remote Acculturation, TV and Nutrition Among Adolescent–Mother Dyads in Jamaica” Child Development DOI: 10.1111/cdev.12808 8(2).
17. FAO (2003). “Municipal Support Policies for Operators. A Briefing Guide for Mayors, City Executives and Urban Planners in Developing Countries and Countries in Transition” Food in Cities Collection No. 4. Rome.
18. Franklin, M. (2010). “Facilitating Informal Sector Traders in the Caribbean: The Case of Guyana, Dominica and Jamaica” Presentation to Conference on the Economy. At: https://www.youtube.com/watch?v=IMjnV-0HXRk
19. Freije, S. (2001). “Informal Employment in Latin America and the Carib-bean: Causes, Consequences and Policy Recommendations (English Ver-sion)” Paper for the First Technical Seminar of Regional Consultation on Labour, IADB, Panama City.
20. Grindley, N. (2015). “KSAC Registering Vendors” The Gleaner 22 July.
21. Government of Jamaica. (2006). “National Employment Report, Jamaica” Report prepared by the Planning, Research and Monitoring Unit, Ministry of Labour and Social Security, Kingston.
22. Grosh, M. (1992). “The Jamaican Food Stamps Programme: A Case Study in Targeting” Food Policy 17: 23-40.
23. Heslop-Thomas, C., Fuller, P., Chambers, R., Galbraith, E., Jeffrey-Biggs, T-K., Francis, J., Thomas, A. and Brett, C. (2015). “The Impact of Drought on 2014 Prices of Select Food Items in Jamaica” Paper presented at Confer-ence on Climate Change, Resilience and Food Security, Kingston, Jamaica.
24. Hutchinson, G. and Harris, D. (2012). A Growth-Inducement Strategy for Jamai-ca in the Short and Medium Term (Kingston: Planning Institute of Jamaica).

HUNGRY CITIES REPORT NO. 4 33
25. IDS (2009). Accounts of Crisis: Poor People’s Experiences of the Food, Fuel and Financial Crises in Five Countries. (Brighton: Institute of Development Stud-ies).
26. Jaffe, R. (2008). The Caribbean City (Kingston: Ian Randle Publishers).
27. Jamaica Observer (2015). “KSAC Grants Dislocated Vendors Permission to Continue in ‘No Vending’ Area” At: http://www.jamaicaobserver.com/NEWS/KSAC-grants-dislocated-vendors-permission-to-continue-in--no-vending--area
28. Kinlocke, R. (2004), “Emergent Enclaves: The Growth of Gated Com-munities in the Golden Triangle” BA Thesis, University of West Indies, Kingston.
29. Kinlocke, R. (2016). “Fear, Social Capital and the Construction of Resi-dential Boundaries in the Kingston Metropolitan Area” PhD Thesis, Uni-versity of West Indies, Kingston.
30. Knight, P., Jackson, J., Bain, B. and Eldemire-Shearer, D. (2003). “House-hold food safety awareness of select urban consumers in Jamaica” Interna-tional Journal of Food Sciences and Nutrition 54(4): 309-321.
31. Levy, D. and Ohls. J. (2007). Evaluation of Jamaica’s PATH Program: Final Report. (Washington, DC: Mathematica Policy Research, Inc.).
32. Linden, L. (2015). “226 Vendors Register Under KSAC” Jamaica Information Service 11 August.
33. McDonald, S. (2002). “The Jamaica Food Stamp Programme: The Benefi-ciaries’ Viewpoint” Social and Economic Studies 51:211-241.
34. Ministry of Agriculture (2008). At: http://www.moa.gov.jm.
35. PIOJ (2014). Economic and Social Survey Jamaica 2014 Overview. At: http://www.pioj.gov.jm/Portals/0/Social_Sector/ESSJ%202014%20OVERVIEW.pdf
36. Pachauri, R. and Meyer, L. (eds.). (2014). IPCC, 2014: Climate Change 2014: Synthesis Report. Contribution of Working Groups I, II and III to the Fifth Assessment Report of the Intergovernmental Panel on Climate Change (Geneva: IPCC).
37. Panagiotis, K., Løvendal, C. and Jakobsen, K. (2011). “Biggin’ It Up – Food Security and Obesity in Jamaica and St. Lucia” ESA Working Paper No. 11-15, FAO.
38. PIOJ (2014). Jamaica Social Protection Strategy (Kingston: Planning Institute of Jamaica).

34 HUNGRY CITIES PARTNERSHIP
THE URBAN FOOD SYSTEM OF KINGSTON, JAMAICA
39. Schoburgh, E. (2007). “Informal Economy and Informal Citizenship: Exploring Causation and Connectivity in Socio-Cultural Shifts in Jamaica” Paper presented at Centre for Caribbean Studies, 27 February. At: http://[email protected].
40. STATIN (Statistical Institute of Jamaica ). (2011). Census of Population and Housing. At: http://statinja.gov.jm/Census/PopCensus/Popcensus2011In-dex.aspx
41. STATIN (2014). At: http://statinja.gov.jm/
42. Seepersad, G. and Ennis, G. (2009). “Analysis of the Jamaican Fresh Agri-cultural Produce Industry: Market Analysis Final Report” Jamaica Social Investment Fund, Kingston.
43. Thelwell-Reid, M. (2014). “Food Safety Knowledge and Self-Reported Practices of Food Handlers in Jamaica” Ph.D. Thesis, Walden University, USA.
44. Thomas-Hope, E., Knight, P. and Noel, C. (2011). Jamaica: Migration Profile (Kingston, Jamaica: International Organization for Migration).
45. Tokman, V. and Klein, E. (1993). “Informal Sector and Regulations in Ecuador and Jamaica” Technical Paper No. 86, OECD Development Cen-tre.
46. Torero, M., Robles, M., Hernández, M., de la Roca, J., Webber, M. and Thomas, D. (2006). “The Informal Sector in Jamaica” IADB Economic and Sector Studies.
47. Turner-Pitt, M. and Edwards, S. (2006). Situational Analysis of Food and Nutrition in Jamaica. (Kingston: Ministry of Health).
48. UNDP (2014). Sustaining Human Progress: Reducing Vulnerabilities and Build-ing Resilience (New York: UNDP).
49. Wedderburn, C., Chiang, P. and Rhodd, R. (2012). “The Informal Econ-omy in Jamaica: Is it Feasible to Tax this Sector?” Journal of International Busi-ness and Cultural Studies 6: 1-13.
50. Witter, M. and Kirton, C. (1990). “The Informal Economy in Jamaica: Some Empirical Exercises” Institute of Social and Economic Research, University of the West Indies.
51. WTO (World Trade Organization). (2010). “Trade Policy Review” Report by the Secretariat Jamaica. At: https://www.wto.org/english/tratop_e/tpr_e/s242_sum_e.pdf.

Kingston is a colonial city and, like the country of Jamaica more generally, was the product of early mercantilism moulded by colonialism, sugar plantations and slavery. As Jamaica’s capital, Kingston is an economic and administrative hub with a social geography marked by many of the characteristic fissures of emerging cities in transition economies. Its population is fed by a combination of food imports and domestic produc-tion from agricultural areas across the island. The key trading point for fresh produce flows into Kingston is Coronation Market in the city centre. Between 60% and 70% of fruit and vegetables arriving at Coronation Market are re-distributed through other wholesale markets in and around Kingston. Domestically produced foods flow into Kingston largely through Jamaica’s higgler system. These informal vendors perform many func-tions as market intermediaries, including trade, harvesting, post-harvest processing, re-distribution and sales. Jamaicans spend an average of 43% of their income on food; a figure significantly influenced by price shocks. Some of these shocks are the result of severe weather condi-tions, including cyclones with excessive rains as well as drought. While there is a strong preference for domestically produced goods, cheaper prices and perceived safety of imports entice consumers. Jamaica has also moved increasingly towards a higher fat, more refined diet, resulting in higher rates of obesity and nutrition-related chronic diseases.
HUNGRY CITIES PARTNERSHIP