Embed Size (px)
Citation preview
HUNGER AND FOOD INSECURITY IN HAWAI`I BASELINE ESTIMATES
HAWAI`I HEALTH SURVEY, 1999-2000
Published By
Hawai`i Department of Health Office of Health Status Monitoring
Alvin T. Onaka, State Registrar and Chief
Honolulu, Hawai`i October 2001
HOH
Prepared By
K. Kromer Baker1, J. P. Derrickson2, S. A. K. Derrickson3, F. Reyes-Salvail1, A. T. Onaka1, B. Horiuchi1, M. Q. Yu1, and
J. Dannemiller4
1Department of Health, Office of Health Status Monitoring, 2 Full Plate Inc.,
3 Hawai`i State Office of Planning, Department of Business,
Economic Development and Tourism and 4 SMS Research & Marketing Services, Inc.
FR
Full Citation: Baker Kromer K., Derrickson J.P., Derrickson S.A.K., Reyes-Salvail T., Onaka A.T., Horiuchi B., Yu M.Q., and Dannemiller J. Hunger and Food Insecurity in Hawai`i: Baseline Estimates 1999-2000, Hawai`i Health Survey (HHS). Hawai`i State Department of Health, Office of Health Status Monitoring, Honolulu, Hawai`i, October
unger and Food Insecurity in Hawai`i – HHS 1999-2000 Page ii ffice of Health Status Monitoring October, 2001 awai`i Department of Health
ii
unding provided by the Family Health Services Division, Hawai`i Department of Health and the Institute for esearch on Poverty, University of Wisconsin
Hunger and Food Insecurity in Hawai`i – HHS 1999-2000 Page iii Office of Health Status Monitoring October, 2001 Hawai`i Department of Health
iii
ACKNOWLEDGEMENTS We gratefully acknowledge the following people for their contribution:
Statistical advice and confirmation of results by Professor John S. Grove (Biostatistics, University of Hawai`i at Manoa.)
Comments and suggestions by Betty Wood, PHHSBG Epidemiologist (Hawai`i Department of Health) and Claire K. Hughes, Administrator, Office of Health Parity (Hawai`i Department of Health.)
General comments on food security and relationship with obesity by Mae K. Isonaga (Public Health Nutritionist, Hawai`i Department of Health, Nutrition Branch.)
Editing and placement on the Department of Health Web Site by Caryn Tottori, Research Statistician, Office of Health Status Monitoring (Hawai`i Department of Health.)
Editing of the manuscript by Catherine Giles (Congressional Hunger Fellow, with Full Plate Inc. 2001-2002.)
General comments by Shireen Zaman (Congressional Hunger Fellow, with Full Plate Inc. 2001-2002.)
Hunger and Food Insecurity in Hawai`i – HHS 1999-2000 Page iv Office of Health Status Monitoring October, 2001 Hawai`i Department of Health
iv
TABLE OF CONTENTS ACKNOWLEDGEMENTS ................................................................................................................................iii TABLE OF CONTENTS ...................................................................................................................................iv LIST OF TABLES.............................................................................................................................................v LIST OF FIGURES .........................................................................................................................................vi EXECUTIVE SUMMARY ..................................................................................................................................7 INTRODUCTION ............................................................................................................................................9 METHODS ................................................................................................................................................... 10 RESULTS ..................................................................................................................................................... 17 Question 1. What Is the prevalence of food insecurity in Hawai`i (at risk of hunger or actually experiencing hunger)?..................................................................................................................................................................... 17 Question 2. Where are food insecure households (and household members) geographically located? .................... 18 Question 3. Is food insecurity related to general health status?.......................................................................... 24 Question 4. Are there demographic variables associated with food insecurity?..................................................... 26 Question 5. How prevalent is adult and/or child hunger? ................................................................................... 31 CONCLUSIONS ........................................................................................................................................... 32 APPENDIX .................................................................................................................................................. 33 A-1: Sample, and Weighted and Adjusted Numbers, HHS 1999-2000.................................................................. 33 A-2: Simple Food Security Monitoring Tool (SFSMT).......................................................................................... 34 A-3: Health Related Quality of life Questions (SF-12) HHS, 1999-2000................................................................ 35 A-4: Food Security Questions By Household Food Security Status, HHS 1999-2000 Weighted and Adjusted ........... 36 A-5: Food Security Questions By Household Food Security Status, HHS 1999-2000 Unweighted ............................ 37 A-6: Comparison between the SFSMT Method and the National USDA Method for Coding Food Security Status ...... 38 A-7: Food Security Status for Households and Household members, HHS 1999-2000 ........................................... 41 A-8: Food Security Status By County and Sub-Area, HHS 1999-2000 .................................................................. 42 A-9: Adult Household Members Food Security Status By Selected Health Variables, HHS 1999-2000...................... 43 A-10: Household Food Security Status By Household Type, Size, Income, and Poverty, HHS 1999-2000 ................. 44 A-11 Household Food Security Status By Household Use of Assistance Programs, HHS 1999-2000 ........................ 45 A-12: Household Members Food Security Status By Gender, Age, Ethnicity, and Insurance Status, HHS 1999-2000 46 A-13: Adult Household Members Food Security Status By Marital Status and Education Level, HHS 1999-2000....... 47 REFERENCES .............................................................................................................................................. 48
Hunger and Food Insecurity in Hawai`i – HHS 1999-2000 Page v Office of Health Status Monitoring October, 2001 Hawai`i Department of Health
v
LIST OF TABLES Table 1. Hawai`i Health Survey 1999-2000, Weighted and Adjusted Numbers By Island ...................................... 11 Table 2. Food Security Status for Households and Household Members, HHS 1999-2000...................................... 17 Table 3. Food Insecurity By County and Sub-Area Household Members, HHS 1999-2000...................................... 18 Table 4. Chi-Square (Wald) and Cochran-Mantel-Haenszel Chi-Square Food Insecurity By Selected Health Variables - Adult Population of Hawai`i by Respondent, HHS 1999-2000 .............................................................................. 25 Table 5. Logistic Regression Chi-Square Values (Wald F) for Demographic Variables – Adult Population of Hawai`i by Respondent, HHS 1999-2000 ........................................................................................................................... 29 Table 6. Odds Ratio (significant only) generated from Logistic Regression of Food Insecurity - Adult Population of Hawai`i by respondent, HHS 1999-2000 ........................................................................................................... 30 Table 7. Hunger for Households and Household Members, HHS 1999-2000......................................................... 31 Table 8. Comparison of USDA Method and SFSMT Method for coding Household Food Security Status, HHS 1999-2000.............................................................................................................................................................. 39 Table 9. Comparison of USDA Method and SFSMT Method for coding Household Food Security Status By Household Variables, HHS 1999-2000 ............................................................................................................................... 40
Hunger and Food Insecurity in Hawai`i – HHS 1999-2000 Page vi Office of Health Status Monitoring October, 2001 Hawai`i Department of Health
vi
LIST OF FIGURES
Figure 1. Household Food Security Continuum....................................................................................................9 Figure 2. Coding of Questions – Simple Food Security Monitoring Tool (SFSMT) .................................................. 13 Figure 3. Household Member Food Security Status, HHS 1999-2000 ................................................................... 17 Figure 4. Food Security Status By Island and Sub-Area - Household Members, HHS 1999-2000 ............................ 19 Figure 5. Food Security Status By Sub-Area for the Island of O`ahu (City and County of Honolulu) - Household Members, HHS 1999-2000 ............................................................................................................................... 20 Figure 6. Food Security Status By Sub-Area for the Island and County of Hawai`i – Household Members, HHS 1999-2000.............................................................................................................................................................. 21 Figure 7. Food Security Status By Sub-Area for the Island and County of Kaua`i – Household Members, HHS 1999-2000.............................................................................................................................................................. 22 Figure 8. Food Security Status By Sub-Area for Maui County – Household Members, HHS 1999-2000 .................... 23 Figure 9. Health Variables By Food Insecurity – Adults Household Members, HHS 1999-2000 ............................... 24 Figure 10. Household Characteristics, Income, and Poverty By Food Insecurity – Households, HHS 1999-2000 ...... 26 Figure 11. Household Assistance Variables By Food Insecurity - Households, HHS 1999-2000............................... 27 Figure 12. Gender, Age, Ethnicity, and Insurance Status By Food Insecurity – Household Members, HHS 1999-2000..................................................................................................................................................................... 28 Figure 13. Marital Status and Education Level By Food Insecurity- Adult Household Members, HHS 1999-2000 ...... 29
HOH
EXECUTIVE SUMMARY
Hunger and Food Insecurity in Hawai`i: Baseline Estimates
Hawai`i Health Survey 1999-2000 INTRODUCTION
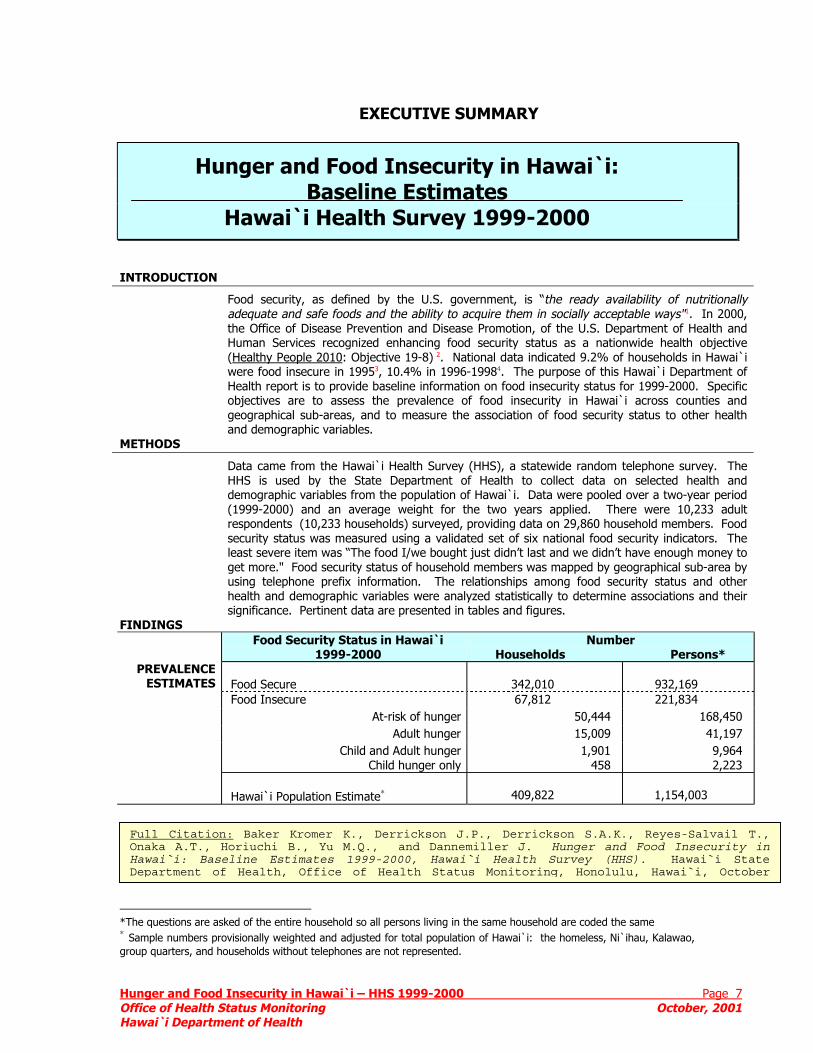
Food security, as defined by the U.S. government, is “the ready availability of nutritionally adequate and safe foods and the ability to acquire them in socially acceptable ways"1. In 2000, the Office of Disease Prevention and Disease Promotion, of the U.S. Department of Health and Human Services recognized enhancing food security status as a nationwide health objective (Healthy People 2010: Objective 19-8) 2. National data indicated 9.2% of households in Hawai`i were food insecure in 19953, 10.4% in 1996-19984. The purpose of this Hawai`i Department of Health report is to provide baseline information on food insecurity status for 1999-2000. Specific objectives are to assess the prevalence of food insecurity in Hawai`i across counties and geographical sub-areas, and to measure the association of food security status to other health and demographic variables.
METHODS Data came from the Hawai`i Health Survey (HHS), a statewide random telephone survey. The
HHS is used by the State Department of Health to collect data on selected health and demographic variables from the population of Hawai`i. Data were pooled over a two-year period (1999-2000) and an average weight for the two years applied. There were 10,233 adult respondents (10,233 households) surveyed, providing data on 29,860 household members. Food security status was measured using a validated set of six national food security indicators. The least severe item was “The food I/we bought just didn’t last and we didn’t have enough money to get more." Food security status of household members was mapped by geographical sub-area by using telephone prefix information. The relationships among food security status and other health and demographic variables were analyzed statistically to determine associations and their significance. Pertinent data are presented in tables and figures.
FINDINGS Food Security Status in Hawai`i
1999-2000 Number
Households Persons* Food Secure
342,010
932,169
Food Insecure 67,812 221,834 At-risk of hunger 50,444 168,450
Adult hunger 15,009 41,197 Child and Adult hunger
Child hunger only 1,901
458 9,964 2,223
PREVALENCE ESTIMATES
Hawai`i Population Estimate∗ 409,822
1,154,003
*∗
g
Full Citation: Baker Kromer K., Derrickson J.P., Derrickson S.A.K., Reyes-Salvail T., Onaka A.T., Horiuchi B., Yu M.Q., and Dannemiller J. Hunger and Food Insecurity in Hawai`i: Baseline Estimates 1999-2000, Hawai`i Health Survey (HHS). Hawai`i State Department of Health, Office of Health Status Monitoring, Honolulu, Hawai`i, October
unger and Food Insecurity in Hawai`i – HHS 1999-2000 Page 7 ffice of Health Status Monitoring October, 2001 awai`i Department of Health
The questions are asked of the entire household so all persons living in the same household are coded the same Sample numbers provisionally weighted and adjusted for total population of Hawai`i: the homeless, Ni`ihau, Kalawao, roup quarters, and households without telephones are not represented.
FINDINGS
HIGH-RISK COMMUNITIES
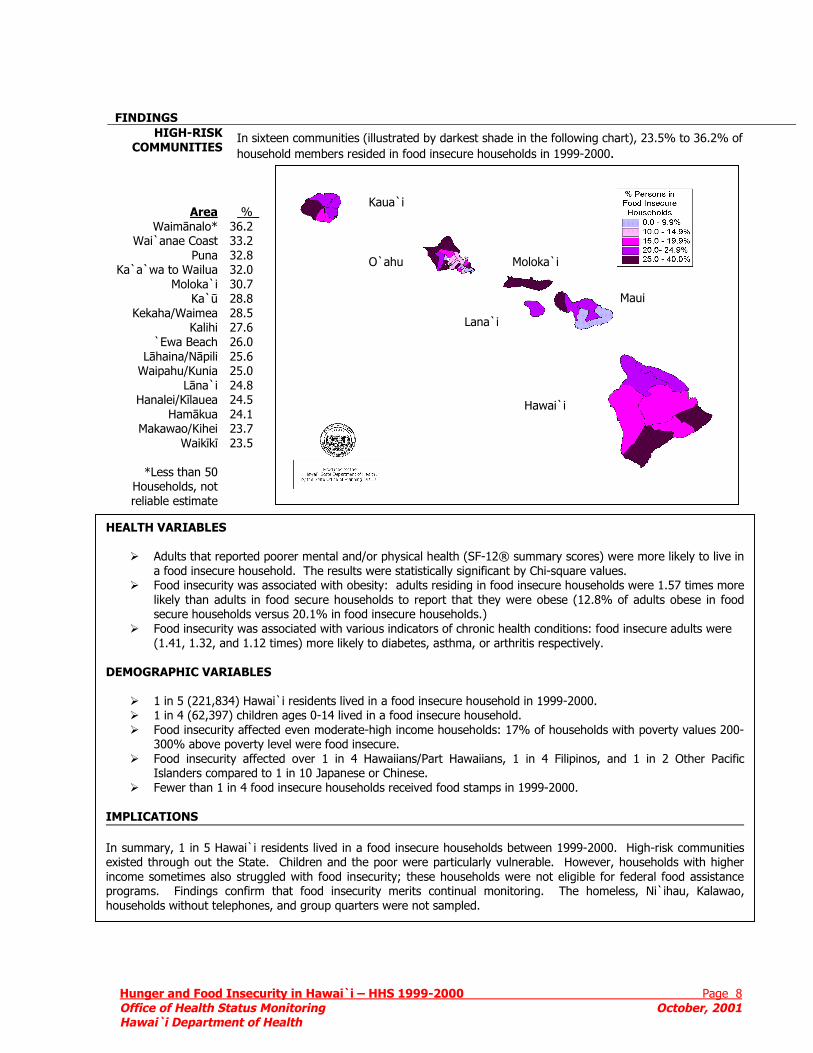
In sixteen communities (illustrated by darkest shade in the following chart), 23.5% to 36.2% of household members resided in food insecure households in 1999-2000.
Area Waimānalo*
Wai`anae Coast Puna
Ka`a`wa to Wailua Moloka`i
Ka`ū Kekaha/Waimea
Kalihi `Ewa Beach
Lāhaina/Nāpili Waipahu/Kunia
Lāna`i Hanalei/Kīlauea
Hamākua Makawao/Kihei
Waikīkī
*Less than 50 Households, not reliable estimate
%_ 36.2 33.2 32.8 32.0 30.7 28.8 28.5 27.6 26.0 25.6 25.0 24.8 24.5 24.1 23.7 23.5
Hawai`i
Maui
Lana`i
Moloka`i O`ahu
Kaua`i
HEALTH VARIABLES
Adults that reported poorer mental and/or physical health (SF-12® summary scores) were more likely to live in a food insecure household. The results were statistically significant by Chi-square values. Food insecurity was associated with obesity: adults residing in food insecure households were 1.57 times morelikely than adults in food secure households to report that they were obese (12.8% of adults obese in food secure households versus 20.1% in food insecure households.) Food insecurity was associated with various indicators of chronic health conditions: food insecure adults were (1.41, 1.32, and 1.12 times) more likely to diabetes, asthma, or arthritis respectively.
DEMOGRAPHIC VARIABLES
1 in 5 (221,834) Hawai`i residents lived in a food insecure household in 1999-2000. 1 in 4 (62,397) children ages 0-14 lived in a food insecure household. Food insecurity affected even moderate-high income households: 17% of households with poverty values 200-300% above poverty level were food insecure. Food insecurity affected over 1 in 4 Hawaiians/Part Hawaiians, 1 in 4 Filipinos, and 1 in 2 Other PacificIslanders compared to 1 in 10 Japanese or Chinese. Fewer than 1 in 4 food insecure households received food stamps in 1999-2000.
IMPLICATIONS In summary, 1 in 5 Hawai`i residents lived in a food insecure households between 1999-2000. High-risk communities existed through out the State. Children and the poor were particularly vulnerable. However, households with higher income sometimes also struggled with food insecurity; these households were not eligible for federal food assistanceprograms. Findings confirm that food insecurity merits continual monitoring. The homeless, Ni`ihau, Kalawao, households without telephones, and group quarters were not sampled.
Hunger and Food Insecurity in Hawai`i – HHS 1999-2000 Page 8 Office of Health Status Monitoring October, 2001 Hawai`i Department of Health
Hunger and Food Insecurity in Hawai`i – HHS 1999-2000 Page 9 Office of Health Status Monitoring October, 2001 Hawai`i Department of Health
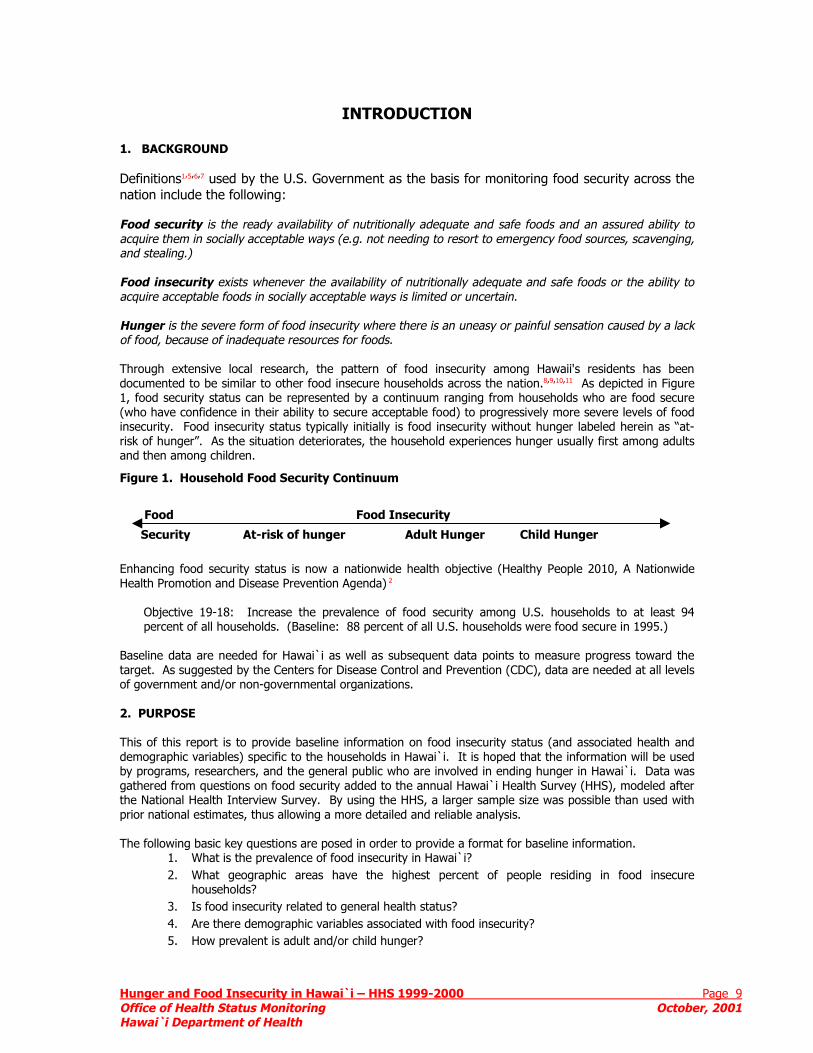
INTRODUCTION 1. BACKGROUND Definitions1,5,6,7 used by the U.S. Government as the basis for monitoring food security across the nation include the following: Food security is the ready availability of nutritionally adequate and safe foods and an assured ability to acquire them in socially acceptable ways (e.g. not needing to resort to emergency food sources, scavenging, and stealing.) Food insecurity exists whenever the availability of nutritionally adequate and safe foods or the ability to acquire acceptable foods in socially acceptable ways is limited or uncertain. Hunger is the severe form of food insecurity where there is an uneasy or painful sensation caused by a lack of food, because of inadequate resources for foods. Through extensive local research, the pattern of food insecurity among Hawaii's residents has been documented to be similar to other food insecure households across the nation.8,9,10,11 As depicted in Figure 1, food security status can be represented by a continuum ranging from households who are food secure (who have confidence in their ability to secure acceptable food) to progressively more severe levels of food insecurity. Food insecurity status typically initially is food insecurity without hunger labeled herein as “at-risk of hunger”. As the situation deteriorates, the household experiences hunger usually first among adults and then among children.
Figure 1. Household Food Security Continuum
Food Food Insecurity
Security At-risk of hunger Adult Hunger Child Hunger
Enhancing food security status is now a nationwide health objective (Healthy People 2010, A Nationwide Health Promotion and Disease Prevention Agenda) 2
Objective 19-18: Increase the prevalence of food security among U.S. households to at least 94 percent of all households. (Baseline: 88 percent of all U.S. households were food secure in 1995.)
Baseline data are needed for Hawai`i as well as subsequent data points to measure progress toward the target. As suggested by the Centers for Disease Control and Prevention (CDC), data are needed at all levels of government and/or non-governmental organizations. 2. PURPOSE This of this report is to provide baseline information on food insecurity status (and associated health and demographic variables) specific to the households in Hawai`i. It is hoped that the information will be used by programs, researchers, and the general public who are involved in ending hunger in Hawai`i. Data was gathered from questions on food security added to the annual Hawai`i Health Survey (HHS), modeled after the National Health Interview Survey. By using the HHS, a larger sample size was possible than used with prior national estimates, thus allowing a more detailed and reliable analysis. The following basic key questions are posed in order to provide a format for baseline information.
1. What is the prevalence of food insecurity in Hawai`i? 2. What geographic areas have the highest percent of people residing in food insecure
households? 3. Is food insecurity related to general health status? 4. Are there demographic variables associated with food insecurity? 5. How prevalent is adult and/or child hunger?
Hunger and Food Insecurity in Hawai`i – HHS 1999-2000 Page 10 Office of Health Status Monitoring October, 2001 Hawai`i Department of Health
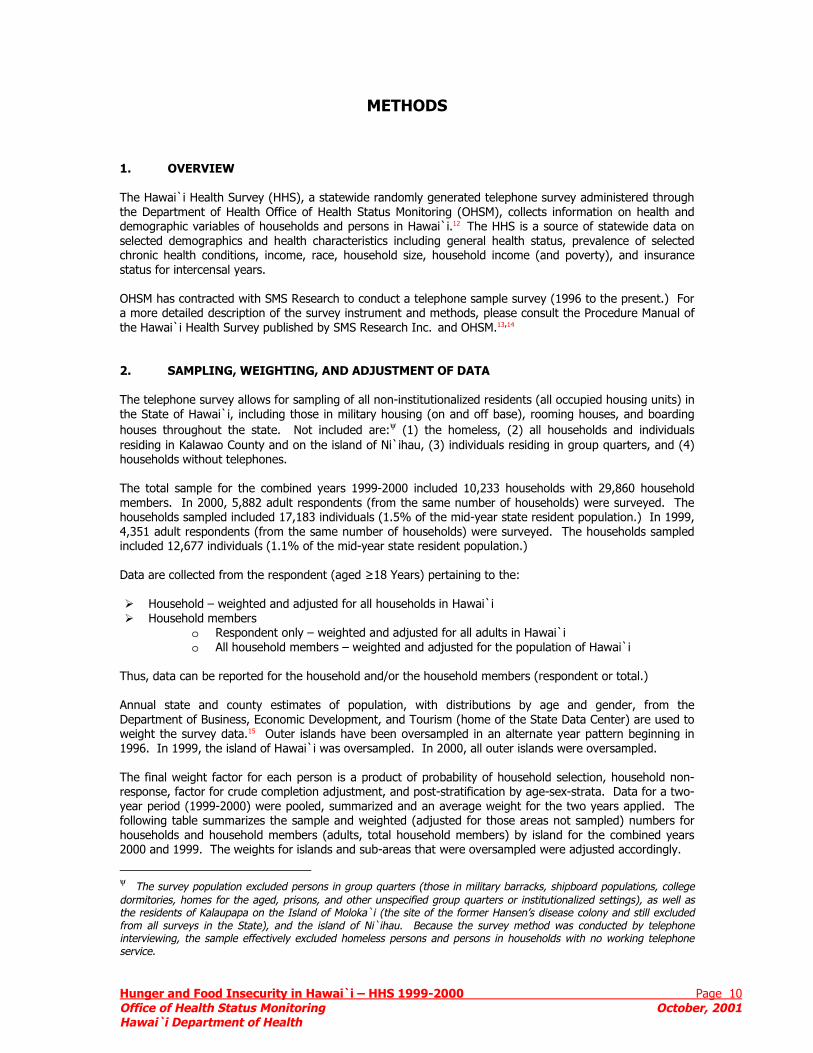
METHODS 1. OVERVIEW The Hawai`i Health Survey (HHS), a statewide randomly generated telephone survey administered through the Department of Health Office of Health Status Monitoring (OHSM), collects information on health and demographic variables of households and persons in Hawai`i.12 The HHS is a source of statewide data on selected demographics and health characteristics including general health status, prevalence of selected chronic health conditions, income, race, household size, household income (and poverty), and insurance status for intercensal years. OHSM has contracted with SMS Research to conduct a telephone sample survey (1996 to the present.) For a more detailed description of the survey instrument and methods, please consult the Procedure Manual of the Hawai`i Health Survey published by SMS Research Inc. and OHSM.13,14 2. SAMPLING, WEIGHTING, AND ADJUSTMENT OF DATA The telephone survey allows for sampling of all non-institutionalized residents (all occupied housing units) in the State of Hawai`i, including those in military housing (on and off base), rooming houses, and boarding houses throughout the state. Not included are:ψ (1) the homeless, (2) all households and individuals residing in Kalawao County and on the island of Ni`ihau, (3) individuals residing in group quarters, and (4) households without telephones. The total sample for the combined years 1999-2000 included 10,233 households with 29,860 household members. In 2000, 5,882 adult respondents (from the same number of households) were surveyed. The households sampled included 17,183 individuals (1.5% of the mid-year state resident population.) In 1999, 4,351 adult respondents (from the same number of households) were surveyed. The households sampled included 12,677 individuals (1.1% of the mid-year state resident population.) Data are collected from the respondent (aged ≥18 Years) pertaining to the:
Household – weighted and adjusted for all households in Hawai`i Household members
o Respondent only – weighted and adjusted for all adults in Hawai`i o All household members – weighted and adjusted for the population of Hawai`i
Thus, data can be reported for the household and/or the household members (respondent or total.) Annual state and county estimates of population, with distributions by age and gender, from the Department of Business, Economic Development, and Tourism (home of the State Data Center) are used to weight the survey data.15 Outer islands have been oversampled in an alternate year pattern beginning in 1996. In 1999, the island of Hawai`i was oversampled. In 2000, all outer islands were oversampled. The final weight factor for each person is a product of probability of household selection, household non-response, factor for crude completion adjustment, and post-stratification by age-sex-strata. Data for a two-year period (1999-2000) were pooled, summarized and an average weight for the two years applied. The following table summarizes the sample and weighted (adjusted for those areas not sampled) numbers for households and household members (adults, total household members) by island for the combined years 2000 and 1999. The weights for islands and sub-areas that were oversampled were adjusted accordingly.
ψ The survey population excluded persons in group quarters (those in military barracks, shipboard populations, college dormitories, homes for the aged, prisons, and other unspecified group quarters or institutionalized settings), as well as the residents of Kalaupapa on the Island of Moloka`i (the site of the former Hansen’s disease colony and still excluded from all surveys in the State), and the island of Ni`ihau. Because the survey method was conducted by telephone interviewing, the sample effectively excluded homeless persons and persons in households with no working telephone service.
HungOfficHaw
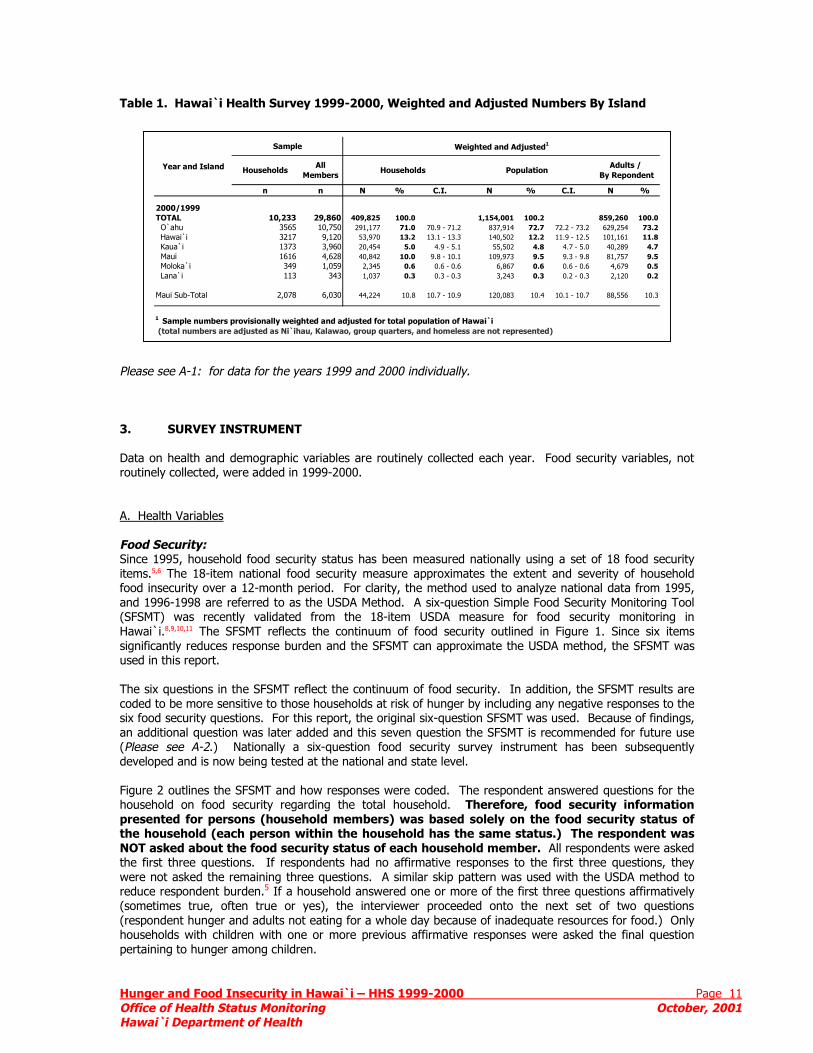
Table 1. Hawai`i Health Survey 1999-2000, Weighted and Adjusted Numbers By Island
Pleas 3. Data routin
A. H FoodSinceitemsfood and 1(SFSMHawasignifused The scodedsix foan ad(Pleadevel Figurhousepresthe hNOTthe fwerereduc(som(resphousperta
Sample Weighted and Adjusted1
er and Food Insecurity in Hawai`i – HHS 1999-2000 Page 11 e of Health Status Monitoring October, 2001 ai`i Department of Health
e see A-1: for data for the years 1999 and 2000 individually.
SURVEY INSTRUMENT
on health and demographic variables are routinely collected each year. Food security variables, not ely collected, were added in 1999-2000.
ealth Variables
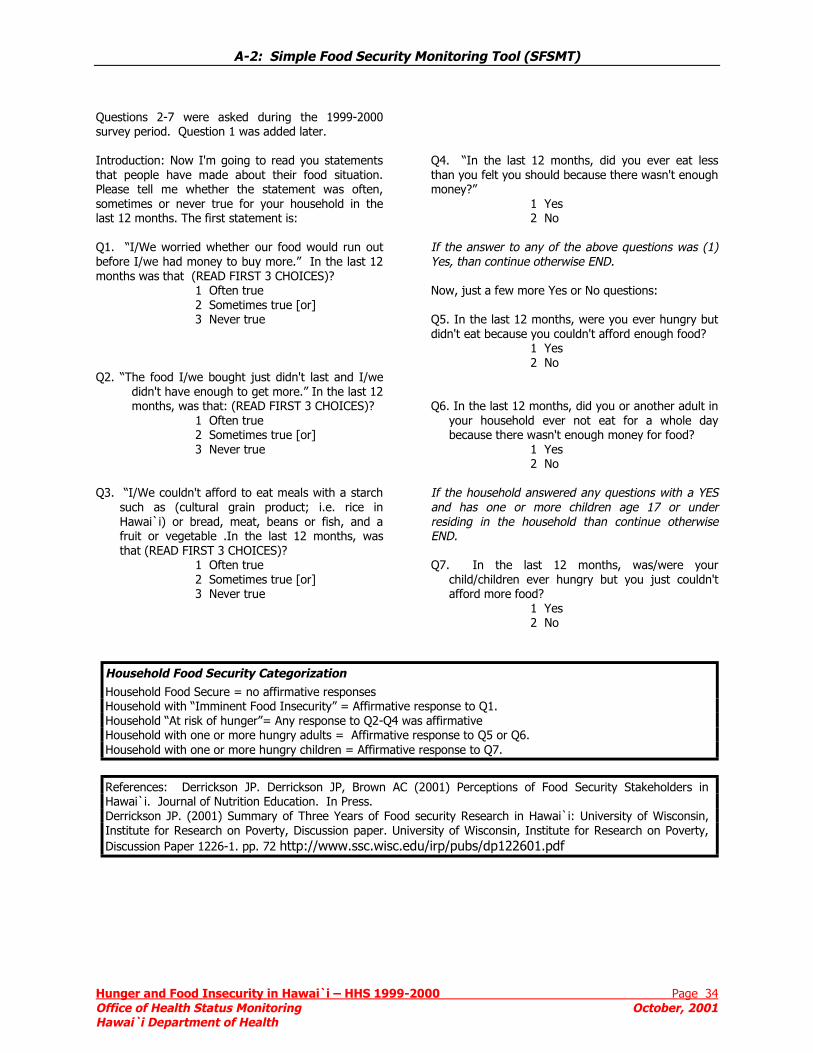
Security: 1995, household food security status has been measured nationally using a set of 18 food security .5,6 The 18-item national food security measure approximates the extent and severity of household insecurity over a 12-month period. For clarity, the method used to analyze national data from 1995, 996-1998 are referred to as the USDA Method. A six-question Simple Food Security Monitoring Tool T) was recently validated from the 18-item USDA measure for food security monitoring in
i`i.8,9,10,11 The SFSMT reflects the continuum of food security outlined in Figure 1. Since six items icantly reduces response burden and the SFSMT can approximate the USDA method, the SFSMT was in this report.
ix questions in the SFSMT reflect the continuum of food security. In addition, the SFSMT results are to be more sensitive to those households at risk of hunger by including any negative responses to the od security questions. For this report, the original six-question SFSMT was used. Because of findings, ditional question was later added and this seven question the SFSMT is recommended for future use
se see A-2.) Nationally a six-question food security survey instrument has been subsequently oped and is now being tested at the national and state level.
e 2 outlines the SFSMT and how responses were coded. The respondent answered questions for the hold on food security regarding the total household. Therefore, food security information
ented for persons (household members) was based solely on the food security status of ousehold (each person within the household has the same status.) The respondent was
asked about the food security status of each household member. All respondents were asked irst three questions. If respondents had no affirmative responses to the first three questions, they not asked the remaining three questions. A similar skip pattern was used with the USDA method to e respondent burden.5 If a household answered one or more of the first three questions affirmatively etimes true, often true or yes), the interviewer proceeded onto the next set of two questions ondent hunger and adults not eating for a whole day because of inadequate resources for food.) Only eholds with children with one or more previous affirmative responses were asked the final question ining to hunger among children.
n n N % C.I. N % C.I. N %
2000/1999TOTAL 10,233 29,860 409,825 100.0 1,154,001 100.2 859,260 100.0 O`ahu 3565 10,750 291,177 71.0 70.9 - 71.2 837,914 72.7 72.2 - 73.2 629,254 73.2 Hawai`i 3217 9,120 53,970 13.2 13.1 - 13.3 140,502 12.2 11.9 - 12.5 101,161 11.8 Kaua`i 1373 3,960 20,454 5.0 4.9 - 5.1 55,502 4.8 4.7 - 5.0 40,289 4.7 Maui 1616 4,628 40,842 10.0 9.8 - 10.1 109,973 9.5 9.3 - 9.8 81,757 9.5 Moloka`i 349 1,059 2,345 0.6 0.6 - 0.6 6,867 0.6 0.6 - 0.6 4,679 0.5 Lana`i 113 343 1,037 0.3 0.3 - 0.3 3,243 0.3 0.2 - 0.3 2,120 0.2
Maui Sub-Total 2,078 6,030 44,224 10.8 10.7 - 10.9 120,083 10.4 10.1 - 10.7 88,556 10.3
1 Sample numbers provisionally weighted and adjusted for total population of Hawai`i (total numbers are adjusted as Ni`ihau, Kalawao, group quarters, and homeless are not represented)
Adults / By RepondentHouseholds PopulationYear and Island Households
All Members
Hunger and Food Insecurity in Hawai`i – HHS 1999-2000 Page 12 Office of Health Status Monitoring October, 2001 Hawai`i Department of Health
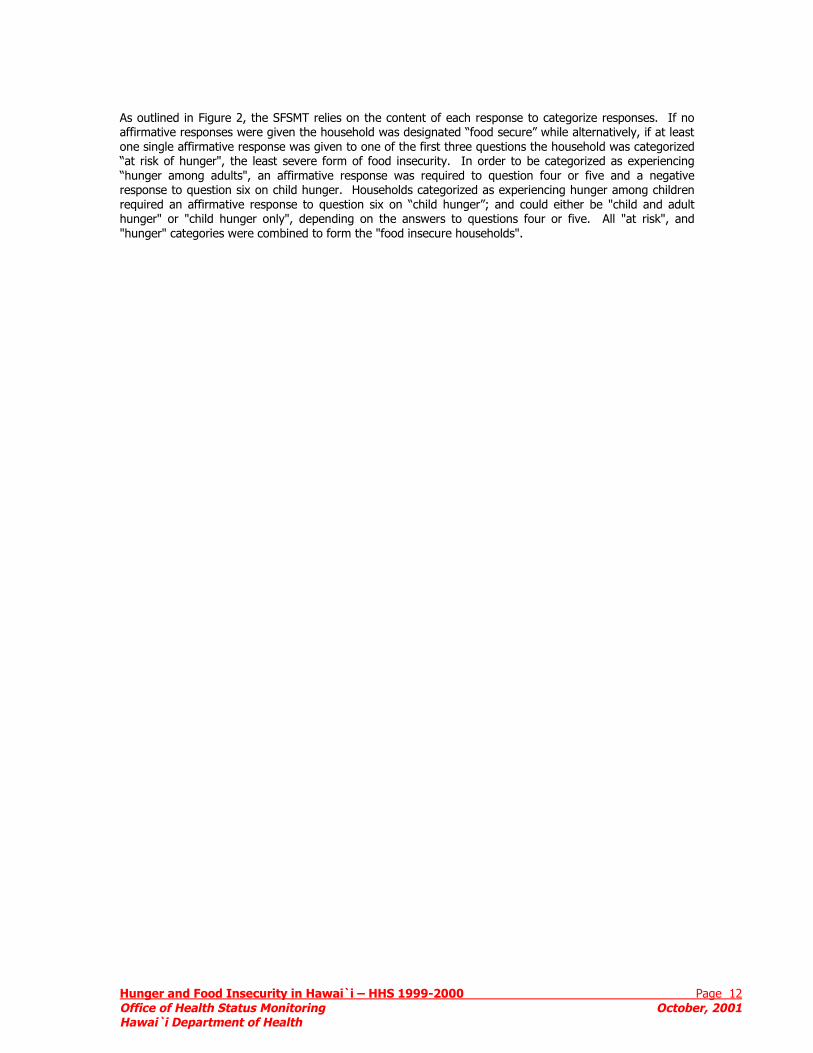
As outlined in Figure 2, the SFSMT relies on the content of each response to categorize responses. If no affirmative responses were given the household was designated “food secure” while alternatively, if at least one single affirmative response was given to one of the first three questions the household was categorized “at risk of hunger", the least severe form of food insecurity. In order to be categorized as experiencing “hunger among adults", an affirmative response was required to question four or five and a negative response to question six on child hunger. Households categorized as experiencing hunger among children required an affirmative response to question six on “child hunger”; and could either be "child and adult hunger" or "child hunger only", depending on the answers to questions four or five. All "at risk", and "hunger" categories were combined to form the "food insecure households".
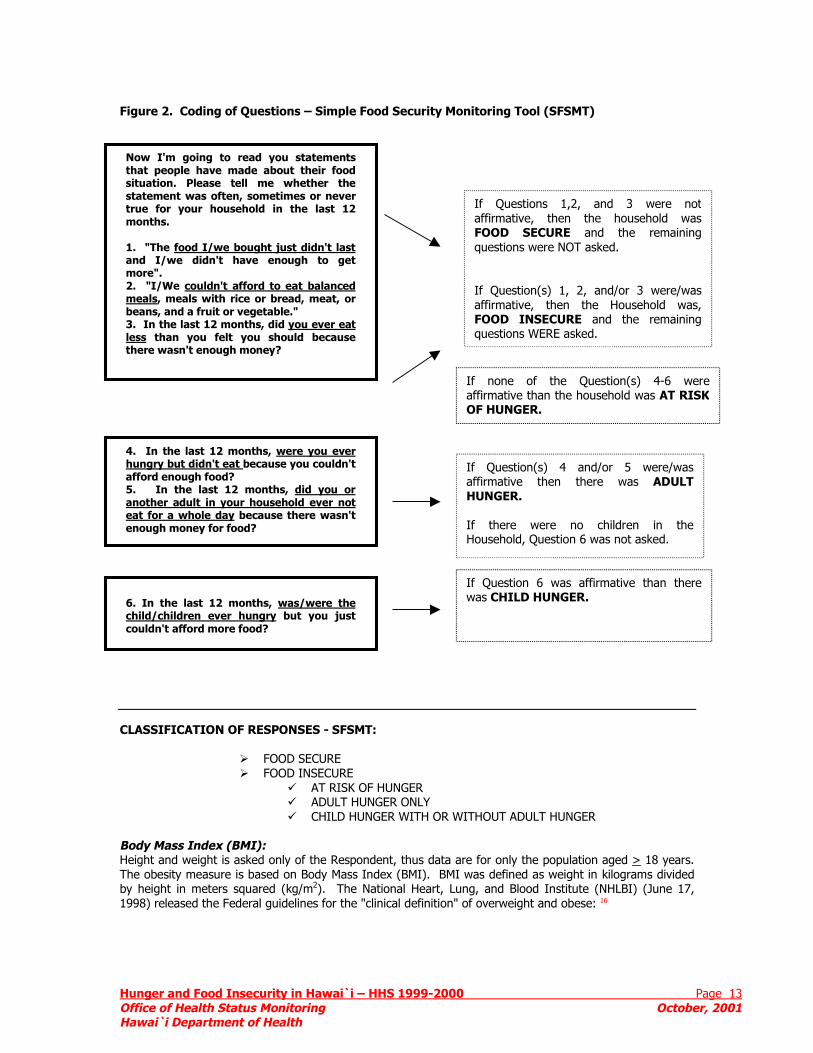
Figure 2. Coding of Questions – Simple Food Security Monitoring Tool (SFSMT)
If Questions 1,2, and 3 were notaffirmative, then the household wasFOOD SECURE and the remainingquestions were NOT asked. If Question(s) 1, 2, and/or 3 were/wasaffirmative, then the Household was,FOOD INSECURE and the remainingquestions WERE asked.
Now I'm going to read you statements that people have made about their food situation. Please tell me whether the statement was often, sometimes or never true for your household in the last 12 months. 1. "The food I/we bought just didn't last and I/we didn't have enough to get more". 2. "I/We couldn't afford to eat balanced meals, meals with rice or bread, meat, or beans, and a fruit or vegetable." 3. In the last 12 months, did you ever eat less than you felt you should because there wasn't enough money?
If Question(s) 4 and/or 5 were/wasaffirmative then there was ADULTHUNGER. If there were no children in the
If none of the Question(s) 4-6 wereaffirmative than the household was AT RISKOF HUNGER.
4. In the last 12 months, were you ever hungry but didn't eat because you couldn't afford enough food? 5. In the last 12 months, did you or another adult in your household ever not eat for a whole day because there wasn't enough money for food?
Household, Question 6 was not asked.
If Question 6 was affirmative than therewas CHILD HUNGER.
6. In the last 12 months, was/were the child/children ever hungry but you just couldn't afford more food?
Hunger and Food Insecurity in Hawai`i – HHS 1999-2000 Page 13 Office of Health Status Monitoring October, 2001 Hawai`i Department of Health
CLASSIFICATION OF RESPONSES - SFSMT:
FOOD SECURE FOOD INSECURE
AT RISK OF HUNGER ADULT HUNGER ONLY CHILD HUNGER WITH OR WITHOUT ADULT HUNGER
Body Mass Index (BMI): Height and weight is asked only of the Respondent, thus data are for only the population aged > 18 years. The obesity measure is based on Body Mass Index (BMI). BMI was defined as weight in kilograms divided by height in meters squared (kg/m2). The National Heart, Lung, and Blood Institute (NHLBI) (June 17, 1998) released the Federal guidelines for the "clinical definition" of overweight and obese: 16
Hunger and Food Insecurity in Hawai`i – HHS 1999-2000 Page 14 Office of Health Status Monitoring October, 2001 Hawai`i Department of Health
BMI Categories:
Underweight <18.5 Normal 18.5-25.0 Overweight 25.0-30.0 Obese I 30.0-35.0 Obese II 35.0-40.0 Obese III >40.0
Chronic Health Conditions: Respondents are asked of each household member: "Has anyone in the household been told by a physician or medical professional that they have arthritis?" The same question is asked on other health conditions including asthma, diabetes, high blood cholesterol, and hypertension. The response was recorded for each household member. However, in the present report for comparability to other variables, estimates are for the adult population based on answers recorded for the respondent. Health Related Quality of Life Questions: SF-12®17 questions (a shortened 12 questionnaire from the SF-36® questionnaire) are related to self reported general health, limitations caused by physical and/or emotional problems, pain limiting activities, limitations to amount and type of work, and limitations in social activities due to health problems (Please see A-3.) Scoring for the summary scales MCS-12 (mental component summary scale) and PCS-12 (physical component summary scale) from the 12 questions on health are as outlined in the SF-12® manual.17 The SF-12® scoring algorithm is a composite score of weighted item responses to 12 questions on self-reported physical and mental health status. The content validity of the SF-12® compares favorably with that of the longer SF-36® Health Survey. A higher summary scale value indicates better health for both the mental and physical summary scale. The scores are standardized so that the mean equals 50 and the standard deviation 10 for the general U.S. population. B. Demographic Variables. Age: Respondents (adults) are age 18 or over. For all household members, respondents are asked the person’s age at last birthday. If, when the data are compiled, a person’s age is missing, it is imputed using a “hot deck” method: a response from another person with similar demographic and economic characteristics is substituted. Children are defined as persons less than 18 years of age. Assistance Variables: The respondent is asked whether any member of the household is presently receiving Food Stamps, AFDC/Welfare benefits, Social Security Income, Disability Benefits, Housing Assistance/Section 8, Free or Reduced Lunch, Head Start benefits, and/or employment benefits. The responses are recorded for the household. Geographic Sub-Area: Geographic residence of household members is based on the household's telephone prefix. Sub-areas are prefixes grouped as defined in the Verizon Hawai`i Telephone directory with additional input from state district health officers. For geographic depiction of food insecurity prevalence, data was generated by sub-area using telephone prefix codes. OHSM collaborated with The State Office of Planning (Department of Business, Economic Development and Tourism) to create maps showing the geographic distribution of food insecurity based on the telephone prefix sub-areas. The State Office of Planning's GIS program digitized telephone prefix boundaries and linked them to the Verizon data and the data provided by OHSM to produce the maps contained in the present report. Education: Education status is recorded for all adult household members. The categories include education through kindergarten, grades 1-8, grades 9-10, grade 12 (or GED), 1-3 years of college, 4 or more years of college, and unknown or refused. However, in this report for the sake of consistency in data presentation estimates are based solely on the respondent’s answers (adult population.)
Hunger and Food Insecurity in Hawai`i – HHS 1999-2000 Page 15 Office of Health Status Monitoring October, 2001 Hawai`i Department of Health
Gender: The Respondent identifies gender for household members, in order of age, including themselves. Household: A household includes all persons who occupy a housing unit (house or apartment), whether they are related to each other or not.18 Household Type: Household status: Household status is classified according to four categories:
1. Single adult with no children 2. Multiple adults with no children 3. Single adult with a child or children 4. Multiple adults with a child or children
Income: The respondent is asked the total household income. Because of a bimodal distribution and occurrence of unknown income (either not knowing the household income or refusing to answer the question), the median (rather than the mean) is used to estimate an average income by food security status. Usually, when the household income is coded as unknown or refused, values are imputed with the use of the "hot deck" method based on income of households with similar demographic characteristics.13,14 However, for the purpose of the present report income that was unknown is not imputed and is recorded as unknown. Insurance Status: Seventeen questions on insurance coverage in the HHS are analyzed to compute a final insurance status based on; insurance status, health plan, drug and dental coverage, type of Medicare coverage, and whether the insurance is provided by the employer. If a household member is uninsured, the respondent is asked the reason and the duration. Insurance questions are asked of the respondent for each household member. Marital Status: In 1999 and 2000, marital status was asked only of the respondent. Thus, the status is reported only for the adult population of Hawai`i. The categories included: married, widowed, divorced, separated, never married, and unknown or refused. Poverty Status: Poverty status is determined by using the "poverty guidelines" and takes into account not only income but also household size supported by the income. Thus, it is a more useful indicator of actual personal income. It is reported for the household and/or the household members. The poverty guidelines are designated for the year in which they are issued and reflect price changes for the prior year. The Hawai`i Health Survey income question is asked also of the prior year. Thus, the 1999 and 2000 Federal Poverty Guidelines were used for 1999 and 2000 respectively in the present report to compute percent poverty levels. Households below 100 percent of the guideline are said to be below the poverty guideline. Individuals in those households are said to be “living below poverty”.19 Poverty levels for persons of unknown income were listed as unknown. Poverty guidelines are updated annually in the Federal Register by the U.S. Department of Health and Human Services.19 The poverty guidelines are used for administrative purposes giving programs such as Head Start, Food Stamp Program, and Children's Health Insurance Program guidelines. Race: The Respondent lists up to four races for both their (and for each household member) mother and their father. The choices were White/Caucasian, Hawaiian, Chinese, Filipino, Japanese, Korean, Samoan/Tongan, Black/African American, Native American/Aleut/Eskimo/Inuit, Vietnamese, Asian Indian, Portuguese, and Guamanian/Chamorro. In addition, the respondent can: specify another race if it is not listed, reply they do not know, or refuse to answer.
Hunger and Food Insecurity in Hawai`i – HHS 1999-2000 Page 16 Office of Health Status Monitoring October, 2001 Hawai`i Department of Health
OHSM codes these eight possible choices for each individual to one race in order to comply with prior Census rules coding race20. Specifically, if Hawaiian is listed for the Mother or Father the person is coded to Hawaiian. Otherwise, the person is coded to the first race listed (other than Caucasian or unknown) for the Father. If the Father's race is Caucasian or unknown then the coding is determined by using the Mother's first race. If the Mother's first race is Caucasian or unknown, the Father's first race is coded. Otherwise, the person is coded to don't know, unsure, or refused. 4. DATA ANALYSIS Data from the 2000 and 1999 data sets were combined (they were collected independently) to provide a larger sample size for more reliable estimates of prevalence by sub-area. OHSM analyses, compiles, and reports information from the HHS. Software programs used by OHSM staff included SAS, SUDAAN, MS Word, MS Excel, and PowerPoint. Estimates of variance, tests of association, 95% confidence limits, and other statistics were completed using SUDAAN software (for the analysis of data from surveys that have a large sample size and a complex survey design.) The alpha value for all statistical tests was set at p ≤ 0.05. The software program SUDAAN was used for statistical tests between food security, and the health and demographic variables for the adult population (by respondents.) SF-12® values were recoded to a score of ≤50 or a score >50, BMI status was coded as underweight/normal or overweight/obese, and poverty was coded below poverty level (≤100) or above poverty level (>100.) In addition, the SUDAAN Cochran-Mantel-Haenszel Chi-Square test was used to test the association of selected variables and food security controlling on poverty levels.
Hunger and FOffice of HeaHawai`i Dep
RESULTS Baseline estimates of food security status are presented in relation to questions posed in the Introduction. Food Insecurity is presented as either at risk of hunger or actually experiencing hunger (adult and/or child hunger.) Question 6 deals with further separating hunger into: adult only, adult and child, and child only.
QUESTION 1. WHAT IS THE PREVALENCE OF FOOD INSECURITY IN HAWAI`I (AT RISK OF HUNGER OR ACTUALLY EXPERIENCING HUNGER)?
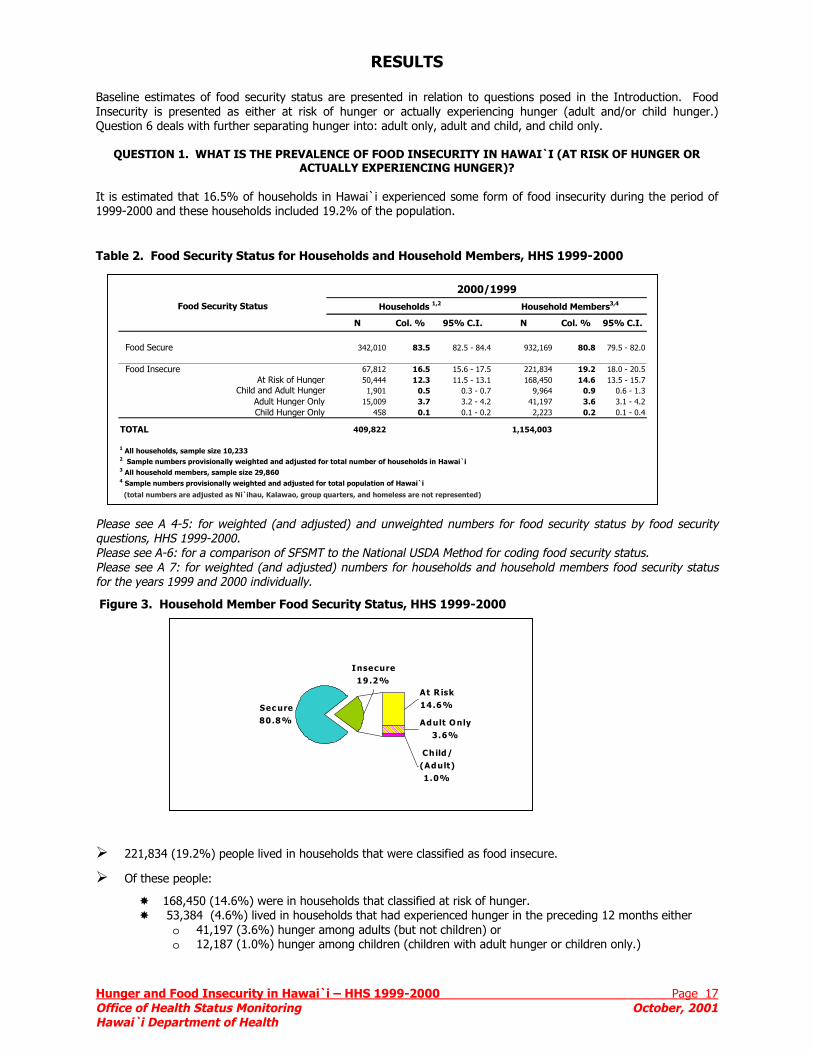
It is estimated that 16.5% of households in Hawai`i experienced some form of food insecurity during the period of 1999-2000 and these households included 19.2% of the population.
Table 2. Food Security Status for Households and Household Members, HHS 1999-2000
Please see A 4-5: for weighted (and adjusted) and unweighted numbers for food security status by food security questions, HHS 1999-2000. Please see A-6: for a comparison of SFSMT to the National USDA Method for coding food security status. Please see A 7: for weighted (and adjusted) numbers for households and household members food security status for the years 1999 and 2000 individually.
Figure 3. Household Member Food Security Status, HHS 1999-2000
221,834
Of these
16 5
N Col. % 95% C.I. N Col. % 95% C.I.
Food Secure 342,010 83.5 82.5 - 84.4 932,169 80.8 79.5 - 82.0
Food Insecure 67,812 16.5 15.6 - 17.5 221,834 19.2 18.0 - 20.5At Risk of Hunger 50,444 12.3 11.5 - 13.1 168,450 14.6 13.5 - 15.7
Child and Adult Hunger 1,901 0.5 0.3 - 0.7 9,964 0.9 0.6 - 1.3Adult Hunger Only 15,009 3.7 3.2 - 4.2 41,197 3.6 3.1 - 4.2Child Hunger Only 458 0.1 0.1 - 0.2 2,223 0.2 0.1 - 0.4
TOTAL 409,822 1,154,003
1 All households, sample size 10,2332 Sample numbers provisionally weighted and adjusted for total number of households in Hawai`i 3 All household members, sample size 29,8604 Sample numbers provisionally weighted and adjusted for total population of Hawai`i
(total numbers are adjusted as Ni`ihau, Kalawao, group quarters, and homeless are not represented)
Food Security Status Households 1,2 Household Members3,4
2000/1999
ood Insecurity in Hawai`i – HHS 1999-2000 Page 17 lth Status Monitoring October, 2001 artment of Health
(19.2%) people lived in households that were classified as food insecure.
people:
8,450 (14.6%) were in households that classified at risk of hunger. 3,384 (4.6%) lived in households that had experienced hunger in the preceding 12 months either o 41,197 (3.6%) hunger among adults (but not children) or o 12,187 (1.0%) hunger among children (children with adult hunger or children only.)
����������������������
Secure80.8%
At R isk14.6%
Child/ (Adult)1.0%
Adult O nly3.6%
Insecure19.2%
HuOfHa
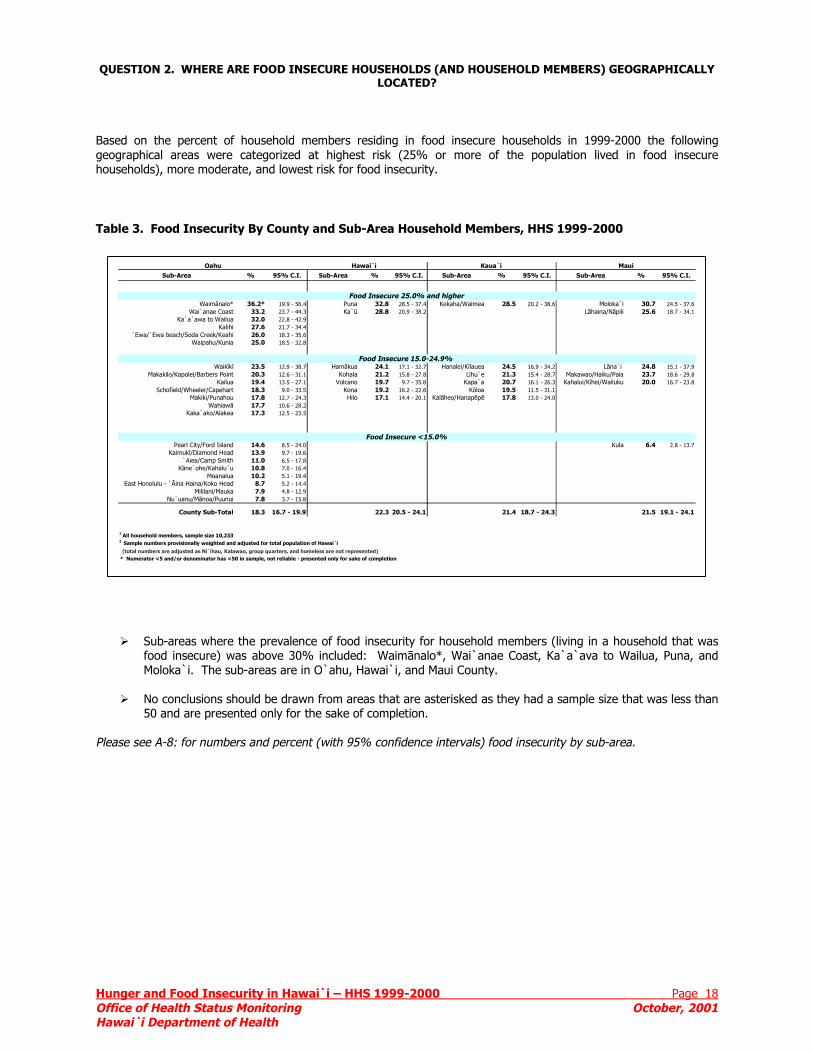
QUESTION 2. WHERE ARE FOOD INSECURE HOUSEHOLDS (AND HOUSEHOLD MEMBERS) GEOGRAPHICALLY
LOCATED? Based on the percent of household members residing in food insecure households in 1999-2000 the following geographical areas were categorized at highest risk (25% or more of the population lived in food insecure households), more moderate, and lowest risk for food insecurity.
Table 3. Food Insecurity By County and Sub-Area Household Members, HHS 1999-2000
Ple
Sub-Area % 95% C.I. Sub-Area % 95% C.I. Sub-Area % 95% C.I. Sub-Area % 95% C.I.MauiKaua`i Hawai`i Oahu
nger and Food Insecurity in Hawai`i – HHS 1999-2000 Page 18 fice of Health Status Monitoring October, 2001 wai`i Department of Health
Sub-areas where the prevalence of food insecurity for household members (living in a household that was food insecure) was above 30% included: Waimānalo*, Wai`anae Coast, Ka`a`ava to Wailua, Puna, and Moloka`i. The sub-areas are in O`ahu, Hawai`i, and Maui County.
No conclusions should be drawn from areas that are asterisked as they had a sample size that was less than 50 and are presented only for the sake of completion.
ase see A-8: for numbers and percent (with 95% confidence intervals) food insecurity by sub-area.
Waimānalo* 36.2* 19.9 - 56.4 Puna 32.8 28.5 - 37.4 Kekaha/Waimea 28.5 20.2 - 38.6 Moloka`i 30.7 24.5 - 37.6Wai`anae Coast 33.2 23.7 - 44.3 Ka`ū 28.8 20.9 - 38.2 Lāhaina/Nāpili 25.6 18.7 - 34.1
Ka`a`awa to Wailua 32.0 22.8 - 42.9Kalihi 27.6 21.7 - 34.4
`Ewa/`Ewa beach/Soda Creek/Keahi 26.0 18.3 - 35.6Waipahu/Kunia 25.0 18.5 - 32.8
Waikīkī 23.5 12.9 - 38.7 Hamākua 24.1 17.1 - 32.7 Hanalei/Kïlauea 24.5 16.9 - 34.2 Lāna`i 24.8 15.1 - 37.9Makakilo/Kapolei/Barbers Point 20.3 12.6 - 31.1 Kohala 21.2 15.8 - 27.8 Līhu`e 21.3 15.4 - 28.7 Makawao/Haiku/Paia 23.7 18.6 - 29.8
Kailua 19.4 13.5 - 27.1 Volcano 19.7 9.7 - 35.8 Kapa`a 20.7 16.1 - 26.3 Kahalui/Kīhei/Wailuku 20.0 16.7 - 23.8Schofield/Wheeler/Capehart 18.3 9.0 - 33.5 Kona 19.2 16.2 - 22.6 Kōloa 19.5 11.5 - 31.1
Makiki/Punahou 17.8 12.7 - 24.3 Hilo 17.1 14.4 - 20.1 Kalāheo/Hanapēpē 17.8 13.0 - 24.0Wahiawā 17.7 10.6 - 28.2
Kaka`ako/Alakea 17.3 12.5 - 23.5
Pearl City/Ford Island 14.6 8.5 - 24.0 Kula 6.4 2.8 - 13.7Kaimukī/Diamond Head 13.9 9.7 - 19.6
`Aiea/Camp Smith 11.0 6.5 - 17.8Kāne`ohe/Kahalu`u 10.8 7.0 - 16.4
Moanalua 10.2 5.1 - 19.4East Honolulu - `Āina Haina/Koko Head 8.7 5.2 - 14.4
Mililani/Mauka 7.9 4.8 - 12.9Nu`uanu/Mānoa/Puunui 7.8 3.7 - 15.8
County Sub-Total 18.3 16.7 - 19.9 22.3 20.5 - 24.1 21.4 18.7 - 24.3 21.5 19.1 - 24.1
1 All household members, sample size 10,2332 Sample numbers provisionally weighted and adjusted for total population of Hawai`i
(total numbers are adjusted as Ni`ihau, Kalawao, group quarters, and homeless are not represented) * Numerator <5 and/or denominator has <50 in sample, not reliable - presented only for sake of completion
Food Insecure 25.0% and higher
Food Insecure <15.0%
Food Insecure 15.0-24.9%
Hunger and Food Insecurity in Hawai`i – HHS 1999-2000 Page 19 Office of Health Status Monitoring October, 2001 Hawai`i Department of Health
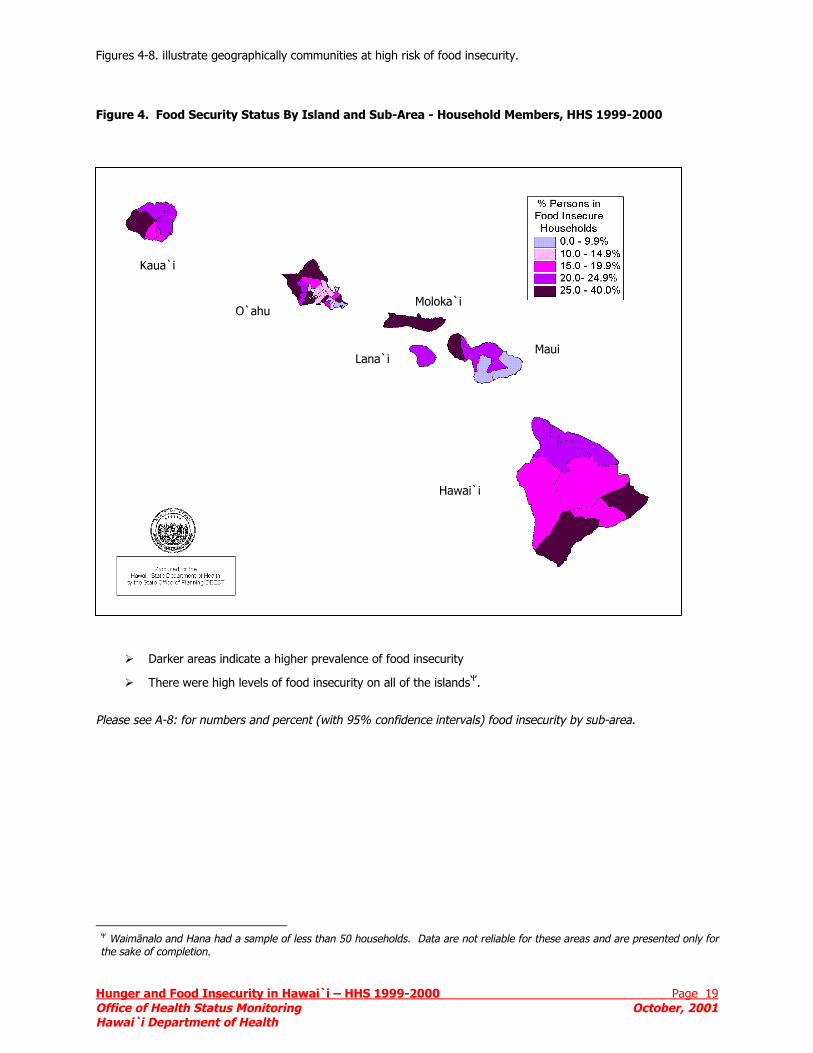
Figures 4-8. illustrate geographically communities at high risk of food insecurity.
Figure 4. Food Security Status By Island and Sub-Area - Household Members, HHS 1999-2000
Darker areas indicate a higher prevalence of food insecurity
There were high levels of food insecurity on all of the islandsΨ.
Please see A-8: for numbers and percent (with 95% confidence intervals) food insecurity by sub-area.
Ψ Waimānalo and Hana had a sample of less than 50 households. Data are not reliable for these areas and are presented only for the sake of completion.
Hawai`i
Maui
O`ahu
Kaua`i
Lana`i
Moloka`i
Hawai`i
Maui
O`ahu
Kaua`i
Lana`i
Moloka`i
Hawai`i
Maui
O`ahu
Kaua`i
Lana`i
Moloka`i
Hunger and Food Insecurity in Hawai`i – HHS 1999-2000 Office of Health Status Monitoring Hawai`i Department of Health
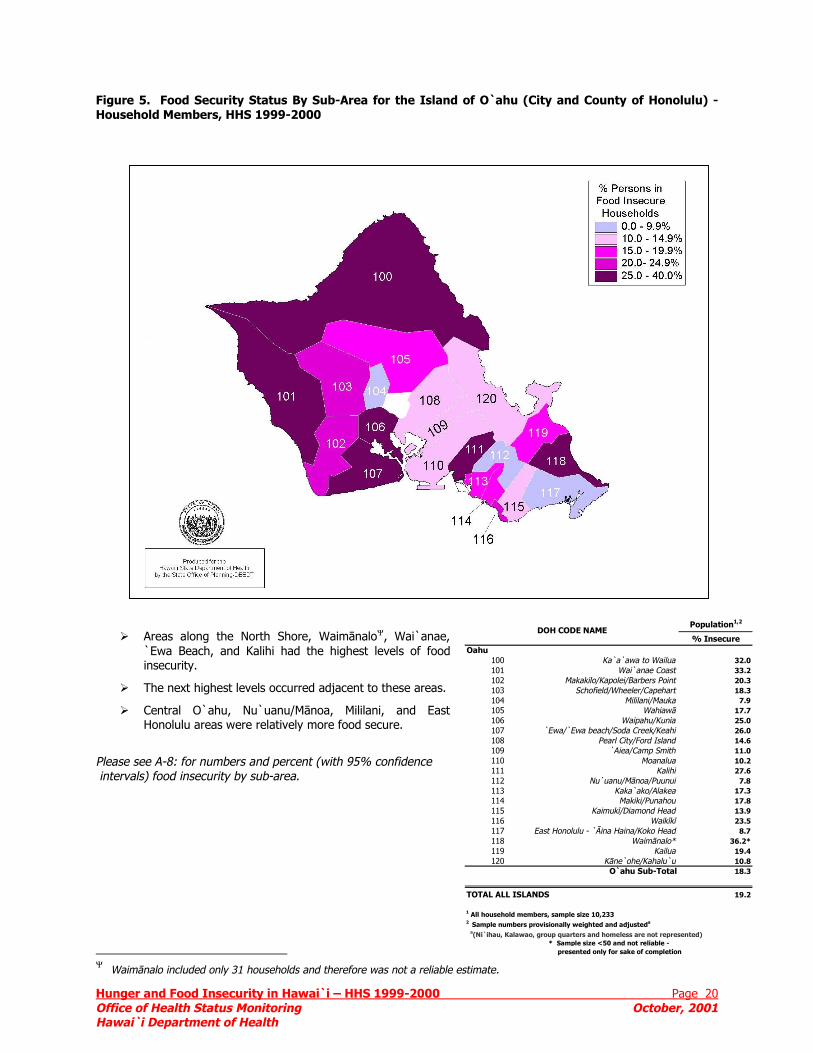
Figure 5. Food Security Status By Sub-Area for the Island of O`ahu (City and County of Honolulu) - Household Members, HHS 1999-2000
Areas along the North Shore, WaimānaloΨ, Wai`anae, `Ewa Beach, and Kalihi had the highest levels of food insecurity.
The next highest levels occurred adjacent to these areas.
Central O`ahu, Nu`uanu/Mānoa, Mililani, and East Honolulu areas were relatively more food secure.
Please see A-8: for numbers and percent (with 95% confidence intervals) food insecurity by sub-area.
Ψ Waimānalo included only 31 households and therefore was not a reliable e
Population1,2
Page 20 October, 2001
stimate.
% InsecureOahu
100 Ka`a`awa to Wailua 32.0101 Wai`anae Coast 33.2102 Makakilo/Kapolei/Barbers Point 20.3103 Schofield/Wheeler/Capehart 18.3104 Mililani/Mauka 7.9105 Wahiawā 17.7106 Waipahu/Kunia 25.0107 `Ewa/`Ewa beach/Soda Creek/Keahi 26.0108 Pearl City/Ford Island 14.6109 `Aiea/Camp Smith 11.0110 Moanalua 10.2111 Kalihi 27.6112 Nu`uanu/Mānoa/Puunui 7.8113 Kaka`ako/Alakea 17.3114 Makiki/Punahou 17.8115 Kaimukī/Diamond Head 13.9116 Waikīkī 23.5117 East Honolulu - `Āina Haina/Koko Head 8.7118 Waimānalo* 36.2*119 Kailua 19.4120 Kāne`ohe/Kahalu`u 10.8
O`ahu Sub-Total 18.3
19.2
1 All household members, sample size 10,2332 Sample numbers provisionally weighted and adjusteda
TOTAL ALL ISLANDS
DOH CODE NAME
* Sample size <50 and not reliable - presented only for sake of completion
a(Ni`ihau, Kalawao, group quarters and homeless are not represented)
Hunger and FoOffice of HealtHawai`i Depar
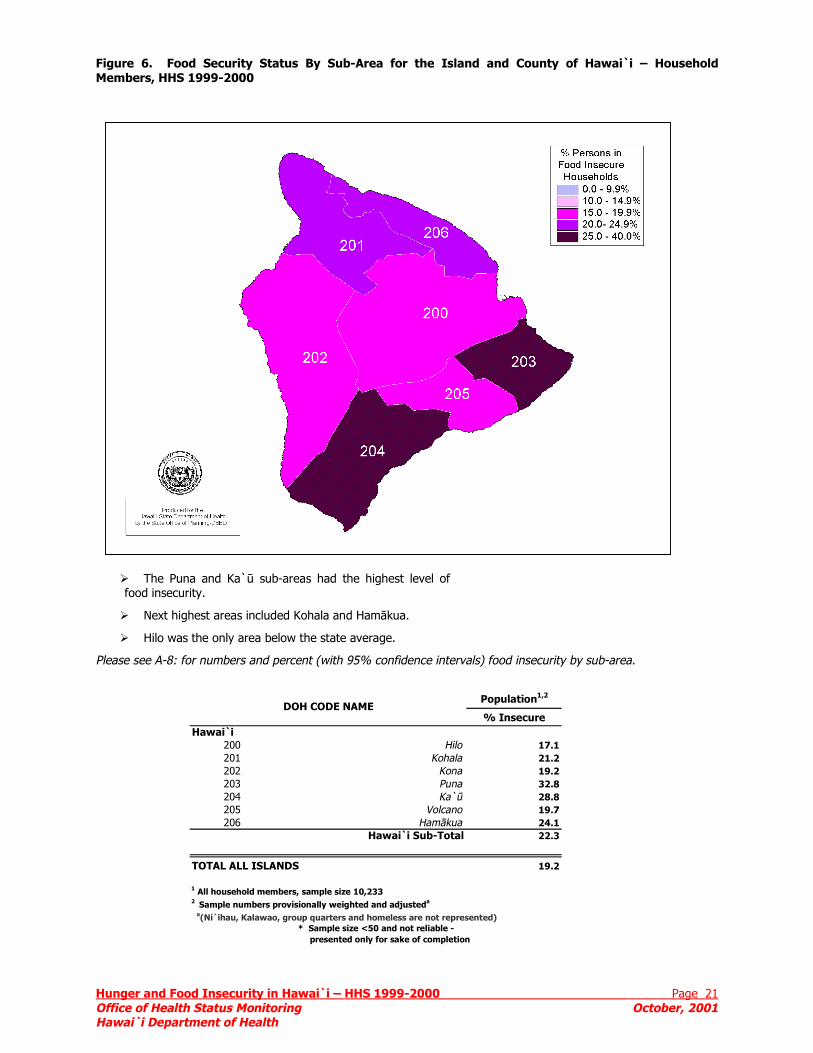
Figure 6. Food Security Status By Sub-Area for the Island and County of Hawai`i – Household Members, HHS 1999-2000
The Puna and Ka`ū sub-areas had the highest level of food insecurity.
Next highest areas included Kohala and Hamākua.
Hilo was the only area below the state average.
Please see A-8: for numbers and percent (with 95% confidence intervals) food insecurity by sub-area.
Population1,2
DOH CODE NAME
od Insecurity in Hawai`i – HHS 1999-2000 Page 21 h Status Monitoring October, 2001 tment of Health
% InsecureHawai`i
200 Hilo 17.1201 Kohala 21.2202 Kona 19.2203 Puna 32.8204 Ka`ū 28.8205 Volcano 19.7206 Hamākua 24.1
Hawai`i Sub-Total 22.3
19.2
1 All household members, sample size 10,2332 Sample numbers provisionally weighted and adjusteda
TOTAL ALL ISLANDS
* Sample size <50 and not reliable - presented only for sake of completion
a(Ni`ihau, Kalawao, group quarters and homeless are not represented)
HOH
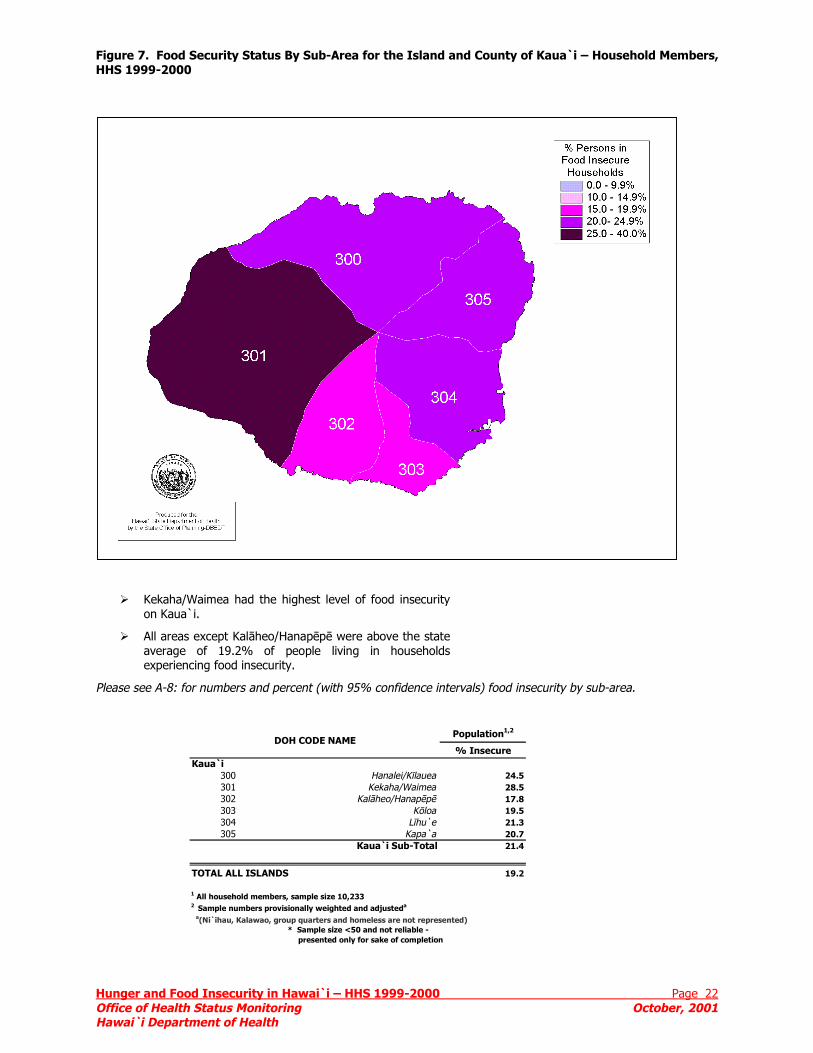
Figure 7. Food Security Status By Sub-Area for the Island and County of Kaua`i – Household Members, HHS 1999-2000
P
unger and Foffice of Healtawai`i Depar
Kekaha/Waimea had the highest level of food insecurity on Kaua`i.
All areas except Kalāheo/Hanapēpē were above the state average of 19.2% of people living in households experiencing food insecurity.
lease see A-8: for numbers and percent (with 95% confidence intervals) food insecurity by sub-area.
Population1,2
DOH CODE NAME
od Insecurity in Hawai`i – HHS 1999-2000 Page 22 h Status Monitoring October, 2001 tment of Health
% InsecureKaua`i
300 Hanalei/Kīlauea 24.5301 Kekaha/Waimea 28.5302 Kalāheo/Hanapēpē 17.8303 Kōloa 19.5304 Līhu`e 21.3305 Kapa`a 20.7
Kaua`i Sub-Total 21.4
19.2
1 All household members, sample size 10,2332 Sample numbers provisionally weighted and adjusteda
TOTAL ALL ISLANDS
* Sample size <50 and not reliable - presented only for sake of completion
a(Ni`ihau, Kalawao, group quarters and homeless are not represented)
HOH
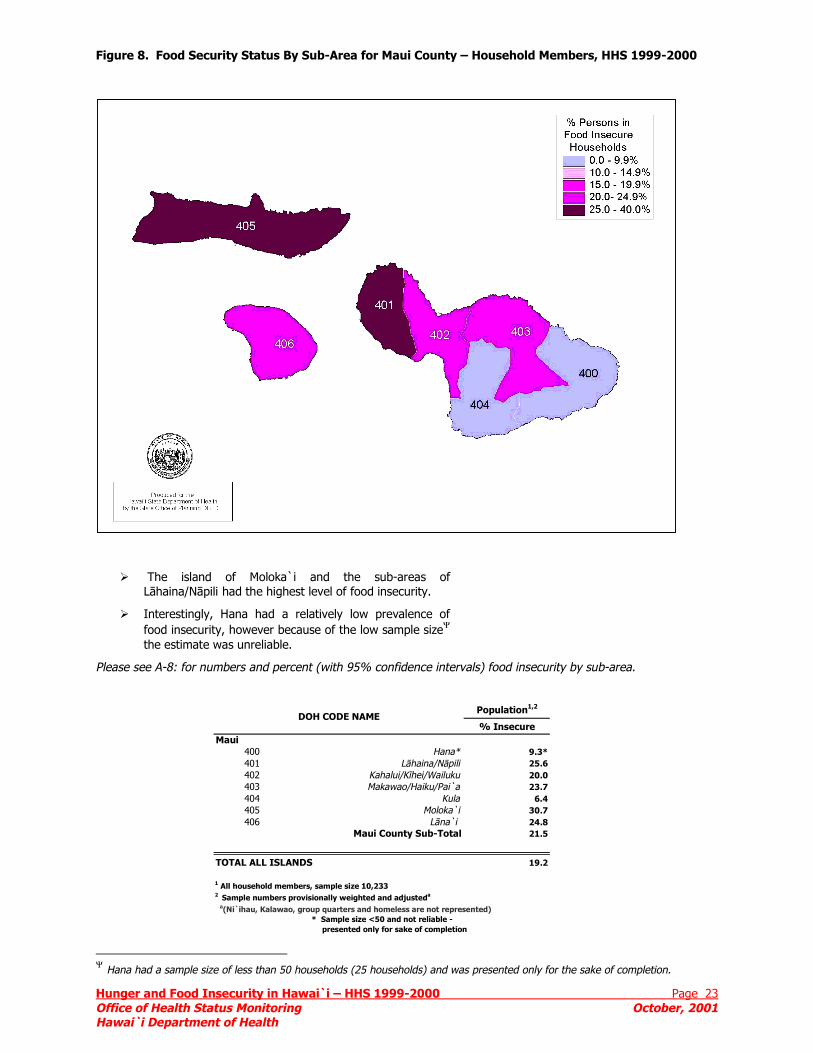
Figure 8. Food Security Status By Sub-Area for Maui County – Household Members, HHS 1999-2000
P
Ψ
unger and Food Insecurity in Hawai`i – HHS 1999-2000 Page 23 ffice of Health Status Monitoring October, 2001 awai`i Department of Health
The island of Moloka`i and the sub-areas of Lāhaina/Nāpili had the highest level of food insecurity.
Interestingly, Hana had a relatively low prevalence of food insecurity, however because of the low sample sizeΨ the estimate was unreliable.
lease see A-8: for numbers and percent (with 95% confidence intervals) food insecurity by sub-area.
Hana had a sample size of less than 50 households (25 households) and was presented only for the sake of completion.
Population1,2
% InsecureMaui
400 Hana* 9.3*401 Lāhaina/Nāpili 25.6402 Kahalui/Kīhei/Wailuku 20.0403 Makawao/Haiku/Pai`a 23.7404 Kula 6.4405 Moloka`i 30.7406 Lāna`i 24.8
Maui County Sub-Total 21.5
19.2
1 All household members, sample size 10,2332 Sample numbers provisionally weighted and adjusteda
TOTAL ALL ISLANDS
DOH CODE NAME
* Sample size <50 and not reliable - presented only for sake of completion
a(Ni`ihau, Kalawao, group quarters and homeless are not represented)
Hunger and Food Insecurity in Hawai`i – HHS 1999-2000 Page 24 Office of Health Status Monitoring October, 2001 Hawai`i Department of Health
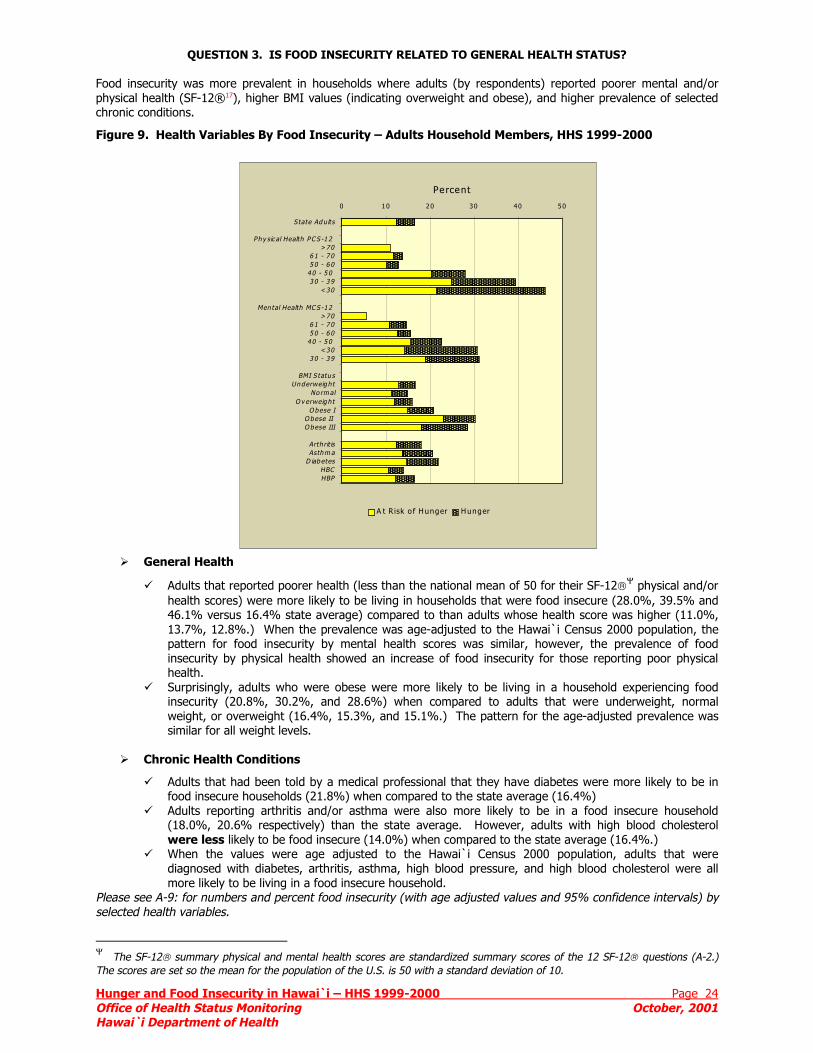
QUESTION 3. IS FOOD INSECURITY RELATED TO GENERAL HEALTH STATUS? Food insecurity was more prevalent in households where adults (by respondents) reported poorer mental and/or physical health (SF-12®17), higher BMI values (indicating overweight and obese), and higher prevalence of selected chronic conditions.
Figure 9. Health Variables By Food Insecurity – Adults Household Members, HHS 1999-2000
General Health
Adults that reported poorer health (less than the national mean of 50 for their SF-12Ψ physical and/or health scores) were more likely to be living in households that were food insecure (28.0%, 39.5% and 46.1% versus 16.4% state average) compared to than adults whose health score was higher (11.0%, 13.7%, 12.8%.) When the prevalence was age-adjusted to the Hawai`i Census 2000 population, the pattern for food insecurity by mental health scores was similar, however, the prevalence of food insecurity by physical health showed an increase of food insecurity for those reporting poor physical health. Surprisingly, adults who were obese were more likely to be living in a household experiencing food insecurity (20.8%, 30.2%, and 28.6%) when compared to adults that were underweight, normal weight, or overweight (16.4%, 15.3%, and 15.1%.) The pattern for the age-adjusted prevalence was similar for all weight levels.
Chronic Health Conditions
Adults that had been told by a medical professional that they have diabetes were more likely to be in food insecure households (21.8%) when compared to the state average (16.4%) Adults reporting arthritis and/or asthma were also more likely to be in a food insecure household (18.0%, 20.6% respectively) than the state average. However, adults with high blood cholesterol were less likely to be food insecure (14.0%) when compared to the state average (16.4%.) When the values were age adjusted to the Hawai`i Census 2000 population, adults that were diagnosed with diabetes, arthritis, asthma, high blood pressure, and high blood cholesterol were all more likely to be living in a food insecure household.
Please see A-9: for numbers and percent food insecurity (with age adjusted values and 95% confidence intervals) by selected health variables.
Ψ The SF-12 summary physical and mental health scores are standardized summary scores of the 12 SF-12 questions (A-2.) The scores are set so the mean for the population of the U.S. is 50 with a standard deviation of 10.
�����������
��������������������� ���������������
����������������������������������������������������������������������������������������
����������������������������������������������������������������������
�������������������������������������������������������
�����������������������������������������������
�������������� �������������������������������������������������������
����������������������������������������������������������������
������������������
0 10 20 30 40 50
State Adu lts
Phy sic al Health PC S -1 2 >70
6 1 - 7 0 5 0 - 6 0
4 0 - 5 0 3 0 - 3 9
<30
Men tal Health MC S -12 >70
6 1 - 7 0 5 0 - 6 0
4 0 - 5 0 <30
3 0 - 3 9
BMI S tatu s Underweight
No rm al O v erweight
O bese I O bese II O bese III
Arth rit isAsthm a
D iabetesHBCHBP
Pe rcent
A t R isk o f Hunger
����Hunger
Hunger and FoodOffice of Health Hawai`i Departm
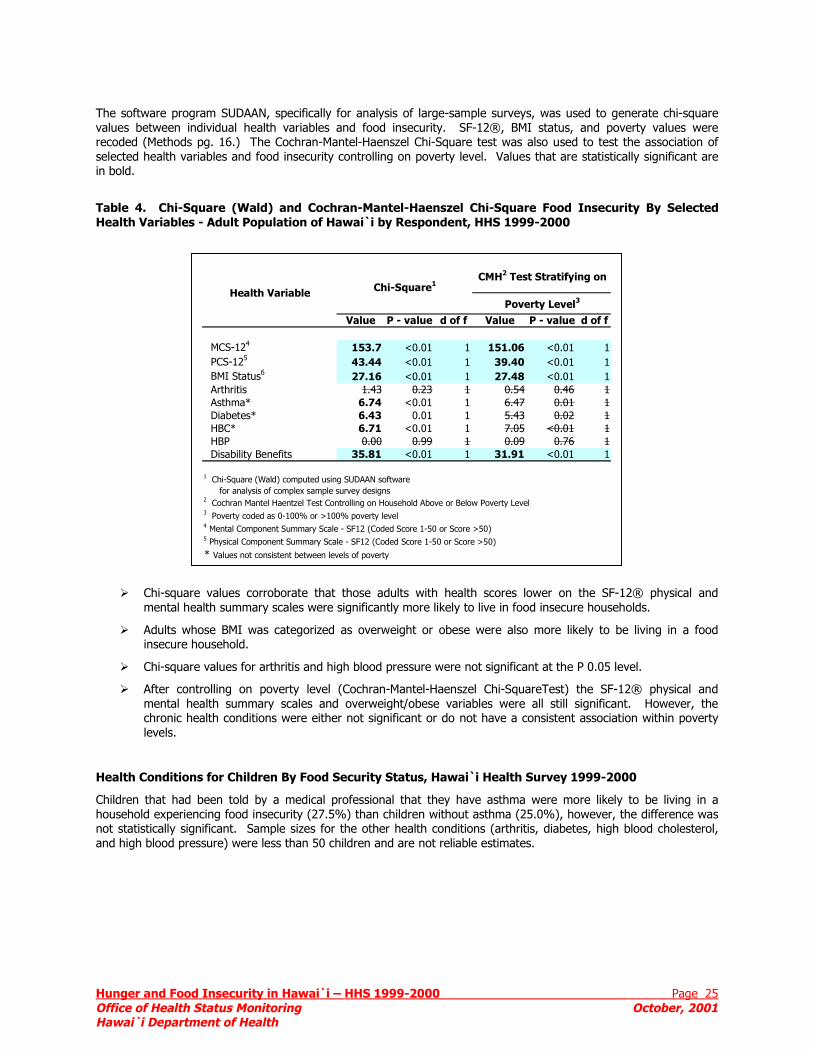
The software program SUDAAN, specifically for analysis of large-sample surveys, was used to generate chi-square values between individual health variables and food insecurity. SF-12®, BMI status, and poverty values were recoded (Methods pg. 16.) The Cochran-Mantel-Haenszel Chi-Square test was also used to test the association of selected health variables and food insecurity controlling on poverty level. Values that are statistically significant are in bold.
Table 4. Chi-Square (Wald) and Cochran-Mantel-Haenszel Chi-Square Food Insecurity By Selected Health Variables - Adult Population of Hawai`i by Respondent, HHS 1999-2000
Chi-squarmental he
Adults whinsecure h
Chi-squar
After conmental hchronic hlevels.
Health Condition
Children that had household experiennot statistically sigand high blood pre
2
Insecurity in Hawai`i – HHS 1999-2000 Page 25 Status Monitoring October, 2001 ent of Health
e values corroborate that those adults with health scores lower on the SF-12® physical and alth summary scales were significantly more likely to live in food insecure households.
ose BMI was categorized as overweight or obese were also more likely to be living in a food ousehold.
e values for arthritis and high blood pressure were not significant at the P 0.05 level.
trolling on poverty level (Cochran-Mantel-Haenszel Chi-SquareTest) the SF-12® physical and ealth summary scales and overweight/obese variables were all still significant. However, the ealth conditions were either not significant or do not have a consistent association within poverty
s for Children By Food Security Status, Hawai`i Health Survey 1999-2000
been told by a medical professional that they have asthma were more likely to be living in a cing food insecurity (27.5%) than children without asthma (25.0%), however, the difference was
nificant. Sample sizes for the other health conditions (arthritis, diabetes, high blood cholesterol, ssure) were less than 50 children and are not reliable estimates.
Value P - value d of f Value P - value d of f
MCS-124 153.7 <0.01 1 151.06 <0.01 1 PCS-125 43.44 <0.01 1 39.40 <0.01 1 BMI Status6 27.16 <0.01 1 27.48 <0.01 1 Arthritis 1.43 0.23 1 0.54 0.46 1 Asthma* 6.74 <0.01 1 6.47 0.01 1 Diabetes* 6.43 0.01 1 5.43 0.02 1 HBC* 6.71 <0.01 1 7.05 <0.01 1 HBP 0.00 0.99 1 0.09 0.76 1 Disability Benefits 35.81 <0.01 1 31.91 <0.01 1
2 Cochran Mantel Haentzel Test Controlling on Household Above or Below Poverty Level3 Poverty coded as 0-100% or >100% poverty level4 Mental Component Summary Scale - SF12 (Coded Score 1-50 or Score >50)5 Physical Component Summary Scale - SF12 (Coded Score 1-50 or Score >50)
* Values not consistent between levels of poverty
1 Chi-Square (Wald) computed using SUDAAN software for analysis of complex sample survey designs
CMH Test Stratifying on Health Variable Chi-Square1
Poverty Level3
Hunger and Food Insecurity in Hawai`i – HHS 1999-2000 Page 26 Office of Health Status Monitoring October, 2001 Hawai`i Department of Health
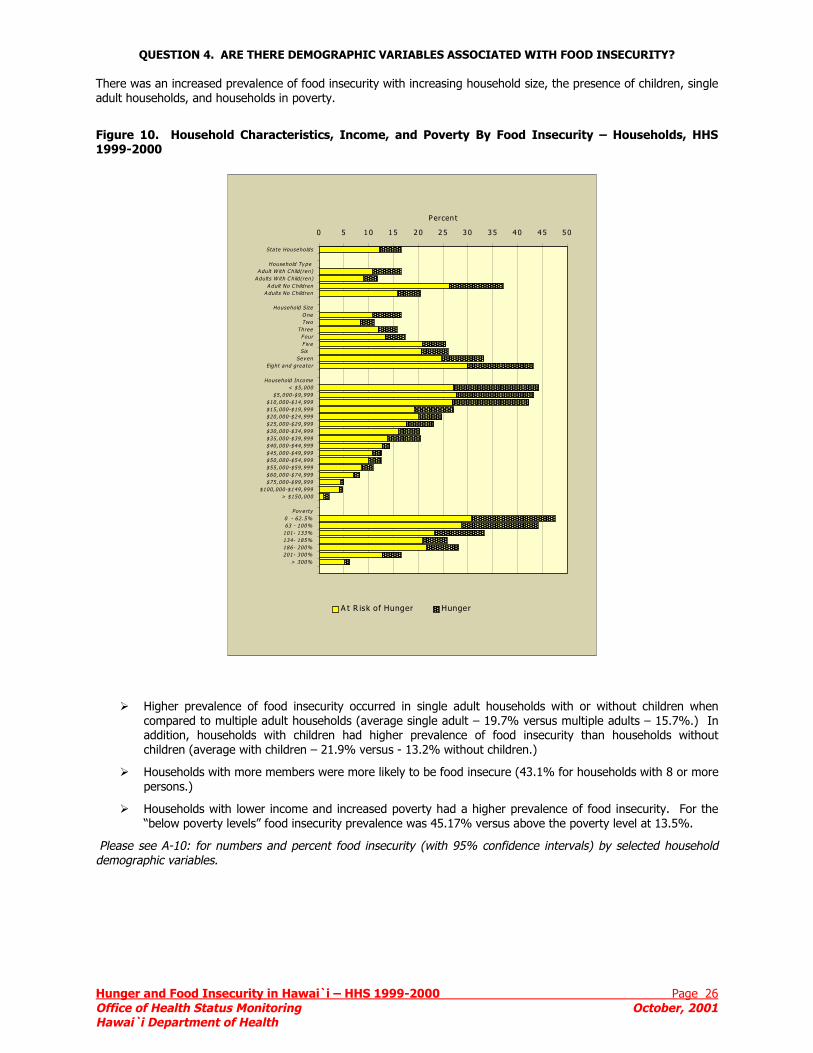
QUESTION 4. ARE THERE DEMOGRAPHIC VARIABLES ASSOCIATED WITH FOOD INSECURITY? There was an increased prevalence of food insecurity with increasing household size, the presence of children, single adult households, and households in poverty.
Figure 10. Household Characteristics, Income, and Poverty By Food Insecurity – Households, HHS 1999-2000
Higher prevalence of food insecurity occurred in single adult households with or without children when compared to multiple adult households (average single adult – 19.7% versus multiple adults – 15.7%.) In addition, households with children had higher prevalence of food insecurity than households without children (average with children – 21.9% versus - 13.2% without children.)
Households with more members were more likely to be food insecure (43.1% for households with 8 or more persons.)
Households with lower income and increased poverty had a higher prevalence of food insecurity. For the “below poverty levels” food insecurity prevalence was 45.17% versus above the poverty level at 13.5%.
Please see A-10: for numbers and percent food insecurity (with 95% confidence intervals) by selected household demographic variables.
���������������������������������������������� ��������������������������
�������������������������������������������������������������������������� ��������
����������� ����������������������������������������������������������������������
��������������������������������������������������������������������������������������������������������������������������������������������������������������������������������������
��������������������������������������������������������������������������������������
�����������������������������������������������
����������������
�������������������������������������������������������������������������������������������������������������������������
���������������������������������������������������������������������������������
�����
0 5 10 15 20 25 30 35 40 45 50
Sta te Households
Household Ty pe A dult W ith Child(ren)
A dults W ith C hild(ren) A dult No C hildren
A dults No Children
Household Size O ne Two
Three Four F iv e Six
Sev en Eight and grea te r
Household Income < $5,000
$5,000-$9,999 $10,000-$14,999 $15,000-$19,999 $20,000-$24,999 $25,000-$29,999 $30,000-$34,999 $35,000-$39,999 $40,000-$44,999 $45,000-$49,999 $50,000-$54,999 $55,000-$59,999 $60,000-$74,999 $75,000-$99,999
$100,000-$149,999 > $150,000
Pov erty 0 - 62.5% 63 - 100%
101- 133% 134- 185% 186- 200% 201- 300%
> 300%
Percen t
A t R isk of Hunger
�������� Hunger
Hunger and Food Insecurity in Hawai`i – HHS 1999-2000 Page 27 Office of Health Status Monitoring October, 2001 Hawai`i Department of Health
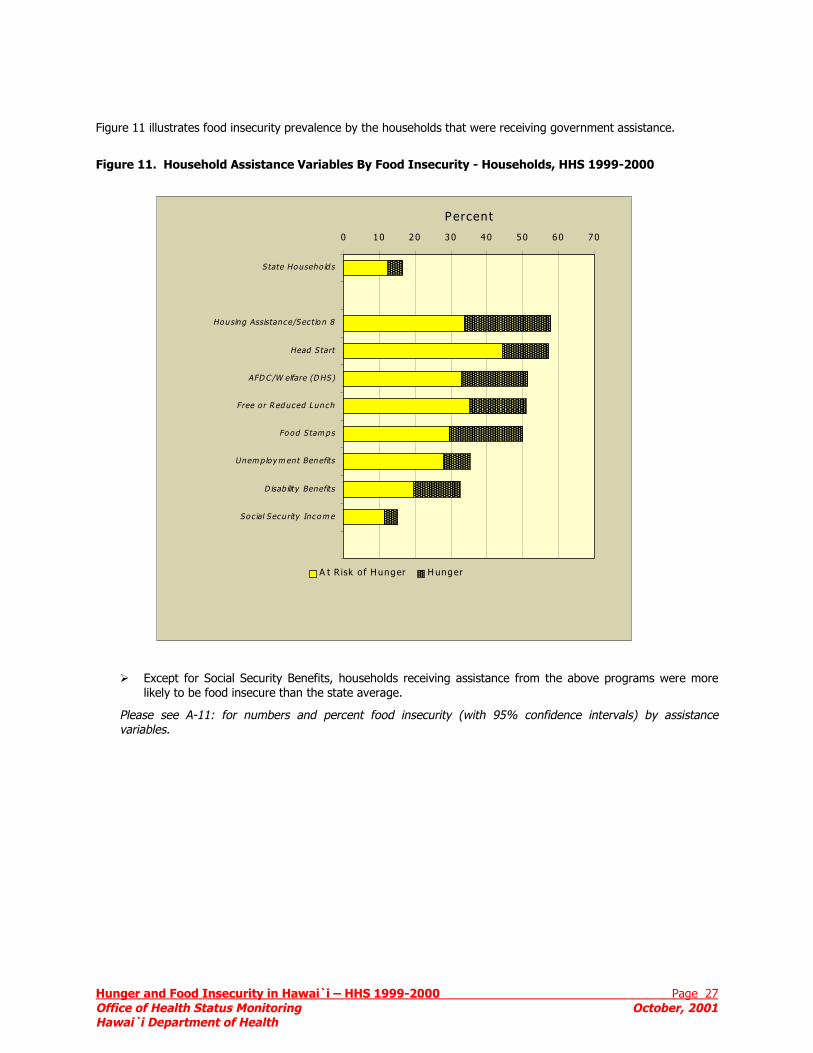
Figure 11 illustrates food insecurity prevalence by the households that were receiving government assistance.
Figure 11. Household Assistance Variables By Food Insecurity - Households, HHS 1999-2000
Except for Social Security Benefits, households receiving assistance from the above programs were more likely to be food insecure than the state average.
Please see A-11: for numbers and percent food insecurity (with 95% confidence intervals) by assistance variables.
��������������������
������������������������������������������������������������������������
��������������������������������������
������������������������������������������������������������������������������������������������������������
��������������������������������������������������������������������������������������������
������������������������������������������
����������������
0 10 20 30 40 50 60 70
S tate Ho useho ld s
Housing Assistance/Sec t io n 8
Head S tart
AFD C /W elfare (D HS)
Free o r R educed Lunch
Fo od S tam ps
Unem p loy m ent Benefits
D isab ility Benefits
Soc ial Secu rity Inco m e
Percent
A t R isk o f Hunger�������
H unger
Hunger and Food Insecurity in Hawai`i – HHS 1999-2000 Page 28 Office of Health Status Monitoring October, 2001 Hawai`i Department of Health
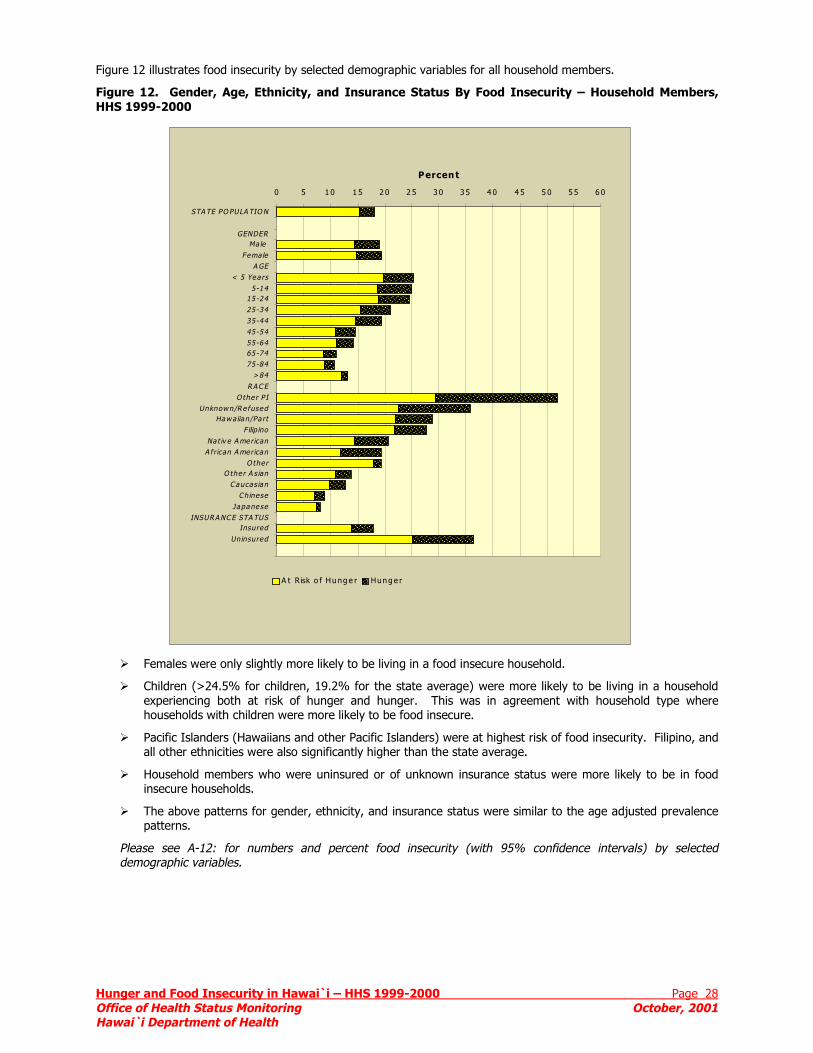
Figure 12 illustrates food insecurity by selected demographic variables for all household members.
Figure 12. Gender, Age, Ethnicity, and Insurance Status By Food Insecurity – Household Members, HHS 1999-2000
Females were only slightly more likely to be living in a food insecure household.
Children (>24.5% for children, 19.2% for the state average) were more likely to be living in a household experiencing both at risk of hunger and hunger. This was in agreement with household type where households with children were more likely to be food insecure.
Pacific Islanders (Hawaiians and other Pacific Islanders) were at highest risk of food insecurity. Filipino, and all other ethnicities were also significantly higher than the state average.
Household members who were uninsured or of unknown insurance status were more likely to be in food insecure households.
The above patterns for gender, ethnicity, and insurance status were similar to the age adjusted prevalence patterns.
Please see A-12: for numbers and percent food insecurity (with 95% confidence intervals) by selected demographic variables.
��������������
������������������������������������������������������
���������������������������������������������������������������
������������������������������������������������������������������
��������������������������������������������� �����
����� �����������������������������������������������������������������������������������������������������������������������������������
��������������������������������������������������������������������������������
���������������������������������������������������������������������
����������������������������������
���������������������������� ��������������������������
0 5 1 0 1 5 2 0 2 5 3 0 3 5 4 0 4 5 5 0 5 5 6 0
STA TE PO PULA TIO N
GENDER Ma le
FemaleA GE
< 5 Yea rs 5-14
15-24 25-34 35-44 45-54 55-64 65-74 75-84
>84R A C E
O the r PI Unknown/R e fused
Hawaiian/Pa rt F ilip ino
Na t iv e A merican A f rican A merican
O the r O the r A s ian
C aucas ian Chinese
JapaneseINSUR ANC E STATUS
Insured Uninsured
Percen t
A t Risk o f Hu ng e r����
Hun g e r
Hunger and FoodOffice of Health Hawai`i Departm
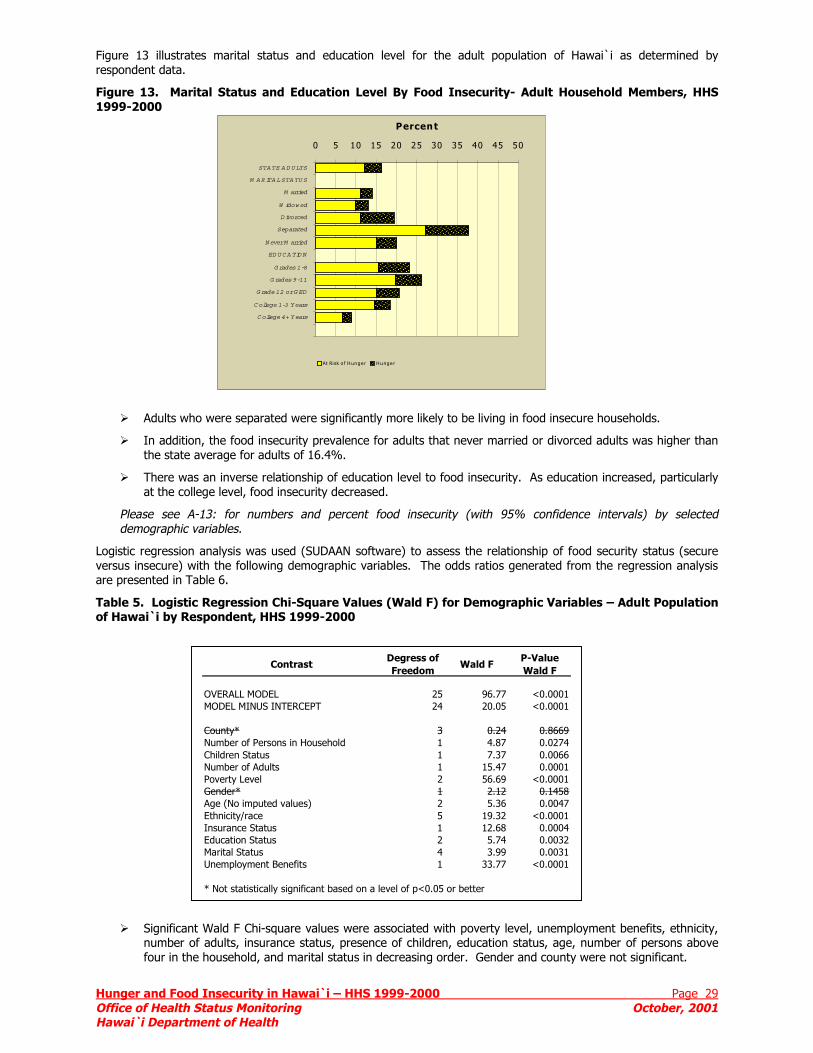
Figure 13 illustrates marital status and education level for the adult population of Hawai`i as determined by respondent data.
Figure 13. Marital Status and Education Level By Food Insecurity- Adult Household Members, HHS 1999-2000
Adults who were separated were significantly more likely to be living in food insecure households.
In addition, the food insecurity prevalence for adults that never married or divorced adults was higher than the state average for adults of 16.4%.
There was an inverse relationship of education level to food insecurity. As education increased, particularly at the college level, food insecurity decreased.
Please see A-13: for numbers and percent food insecurity (with 95% confidence intervals) by selected demographic variables.
Logistic regression analysis was used (SUDAAN software) to assess the relationship of food security status (secure versus insecure) with the following demographic variables. The odds ratios generated from the regression analysis are presented in Table 6.
Table 5. Logistic Regression Chi-Square Values (Wald F) for Demographic Variables – Adult Population of Hawai`i by Respondent, HHS 1999-2000
Significannumber ofour in the
Contrast Degress of
Wald FP-Value
�������������������������������������������������������� ��������������������
��������������������������������������������
����������������������������������������
�������������������������������������
������
0 5 10 15 20 25 30 35 40 45 50
STATE A DU LTS
M AR ITA L STA TU S
M arried
W idowed
D ivorced
Separated
N ever M arried
ED UC A TIO N
G rades 1-8
G rades 9-11
G rade 12 or G ED
C ollege 1-3 Years
C ollege 4+ Years
Percent
At Risk o f H unge r
������H unge r
Insecurity in Hawai`i – HHS 1999-2000 Page 29 Status Monitoring October, 2001 ent of Health
t Wald F Chi-square values were associated with poverty level, unemployment benefits, ethnicity, f adults, insurance status, presence of children, education status, age, number of persons above household, and marital status in decreasing order. Gender and county were not significant.
Freedom Wald F
OVERALL MODEL 25 96.77 <0.0001MODEL MINUS INTERCEPT 24 20.05 <0.0001
County* 3 0.24 0.8669Number of Persons in Household 1 4.87 0.0274Children Status 1 7.37 0.0066Number of Adults 1 15.47 0.0001Poverty Level 2 56.69 <0.0001Gender* 1 2.12 0.1458Age (No imputed values) 2 5.36 0.0047Ethnicity/race 5 19.32 <0.0001Insurance Status 1 12.68 0.0004Education Status 2 5.74 0.0032Marital Status 4 3.99 0.0031Unemployment Benefits 1 33.77 <0.0001
* Not statistically significant based on a level of p<0.05 or better
Hunger and Food InsOffice of Health StatHawai`i Department
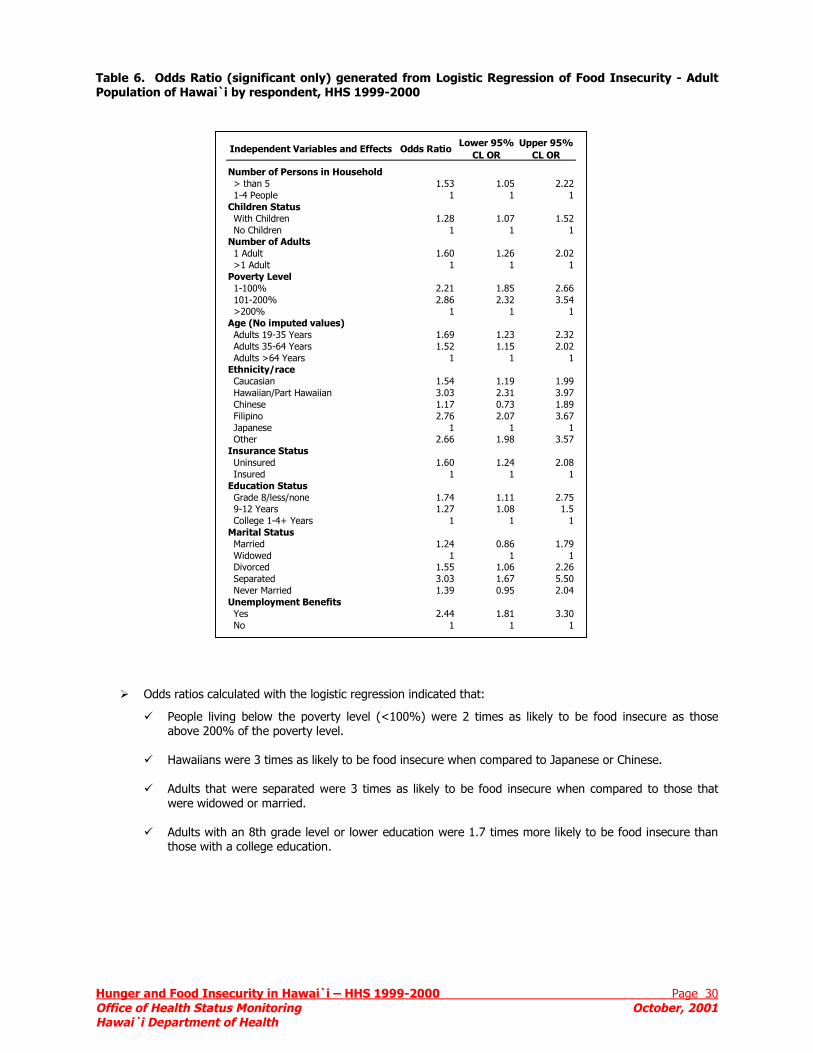
Table 6. Odds Ratio (significant only) generated from Logistic Regression of Food Insecurity - Adult Population of Hawai`i by respondent, HHS 1999-2000
Odds ratios ca
People livabove 200
Hawaiians
Adults thawere wido
Adults witthose with
Independent Variables and Effects Odds RatioLower 95% Upper 95%
ecurity in Hawai`i – HHS 1999-2000 Page 30 us Monitoring October, 2001 of Health
lculated with the logistic regression indicated that:
ing below the poverty level (<100%) were 2 times as likely to be food insecure as those % of the poverty level.
were 3 times as likely to be food insecure when compared to Japanese or Chinese.
t were separated were 3 times as likely to be food insecure when compared to those that wed or married.
h an 8th grade level or lower education were 1.7 times more likely to be food insecure than a college education.
CL OR CL OR
Number of Persons in Household > than 5 1.53 1.05 2.22 1-4 People 1 1 1Children Status With Children 1.28 1.07 1.52 No Children 1 1 1Number of Adults 1 Adult 1.60 1.26 2.02 >1 Adult 1 1 1Poverty Level 1-100% 2.21 1.85 2.66 101-200% 2.86 2.32 3.54 >200% 1 1 1Age (No imputed values) Adults 19-35 Years 1.69 1.23 2.32 Adults 35-64 Years 1.52 1.15 2.02 Adults >64 Years 1 1 1Ethnicity/race Caucasian 1.54 1.19 1.99 Hawaiian/Part Hawaiian 3.03 2.31 3.97 Chinese 1.17 0.73 1.89 Filipino 2.76 2.07 3.67 Japanese 1 1 1 Other 2.66 1.98 3.57Insurance Status Uninsured 1.60 1.24 2.08 Insured 1 1 1Education Status Grade 8/less/none 1.74 1.11 2.75 9-12 Years 1.27 1.08 1.5 College 1-4+ Years 1 1 1Marital Status Married 1.24 0.86 1.79 Widowed 1 1 1 Divorced 1.55 1.06 2.26 Separated 3.03 1.67 5.50 Never Married 1.39 0.95 2.04Unemployment Benefits Yes 2.44 1.81 3.30 No 1 1 1
HOH
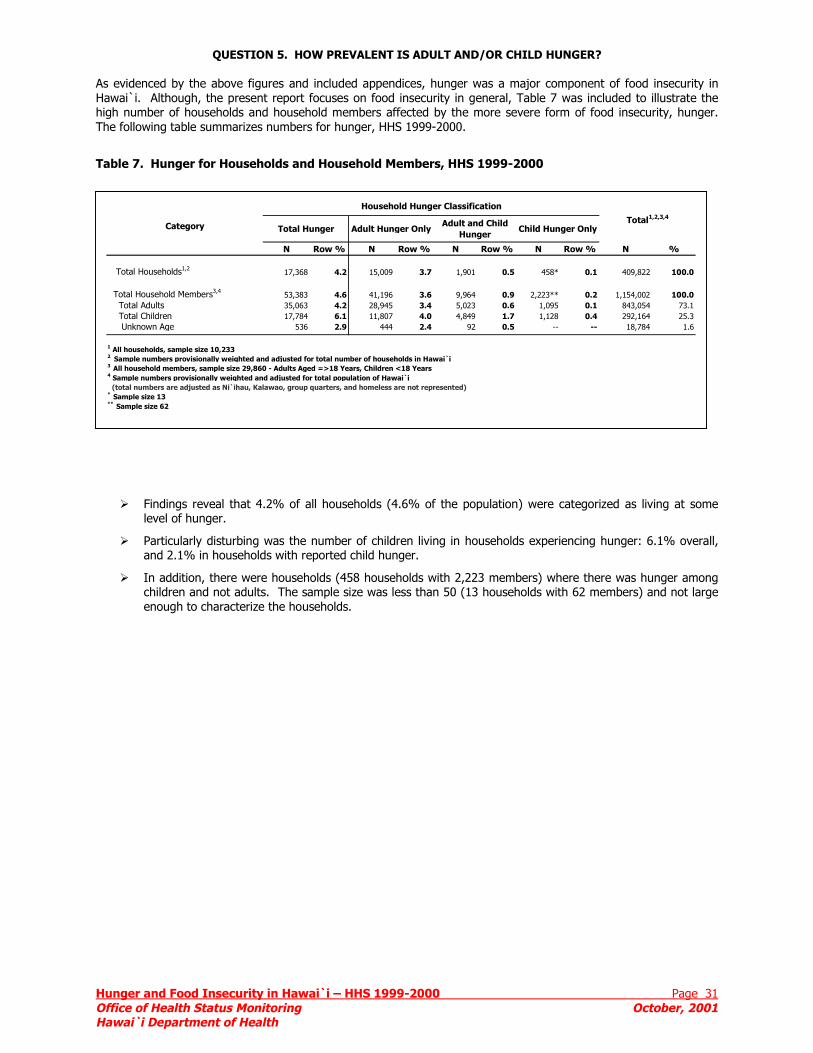
QUESTION 5. HOW PREVALENT IS ADULT AND/OR CHILD HUNGER? As evidenced by the above figures and included appendices, hunger was a major component of food insecurity in Hawai`i. Although, the present report focuses on food insecurity in general, Table 7 was included to illustrate the high number of households and household members affected by the more severe form of food insecurity, hunger. The following table summarizes numbers for hunger, HHS 1999-2000.
Table 7. Hunger for Households and Household Members, HHS 1999-2000
Household Hunger Classification
unger and Food Insecurity in Hawai`i – HHS 1999-2000 Page 31 ffice of Health Status Monitoring October, 2001 awai`i Department of Health
Findings reveal that 4.2% of all households (4.6% of the population) were categorized as living at some level of hunger.
Particularly disturbing was the number of children living in households experiencing hunger: 6.1% overall, and 2.1% in households with reported child hunger.
In addition, there were households (458 households with 2,223 members) where there was hunger among children and not adults. The sample size was less than 50 (13 households with 62 members) and not large enough to characterize the households.
N Row % N Row % N Row % N Row % N %
Total Households1,2 17,368 4.2 15,009 3.7 1,901 0.5 458* 0.1 409,822 100.0
Total Household Members3,4 53,383 4.6 41,196 3.6 9,964 0.9 2,223** 0.2 1,154,002 100.0 Total Adults 35,063 4.2 28,945 3.4 5,023 0.6 1,095 0.1 843,054 73.1 Total Children 17,784 6.1 11,807 4.0 4,849 1.7 1,128 0.4 292,164 25.3 Unknown Age 536 2.9 444 2.4 92 0.5 -- -- 18,784 1.6
1 All households, sample size 10,233 2 Sample numbers provisionally weighted and adjusted for total number of households in Hawai`i 3 All household members, sample size 29,860 - Adults Aged =>18 Years, Children <18 Years4 Sample numbers provisionally weighted and adjusted for total population of Hawai`i (total numbers are adjusted as Ni`ihau, Kalawao, group quarters, and homeless are not represented)* Sample size 13** Sample size 62
Child Hunger OnlyTotal HungerCategoryTotal1,2,3,4
Adult Hunger Only Adult and Child
Hunger
Hunger and Food Insecurity in Hawai`i – HHS 1999-2000 Page 32 Office of Health Status Monitoring October, 2001 Hawai`i Department of Health
CONCLUSIONS SUMMARY Results of this report indicate that food insecurity was prevalent in Hawai`i: one in six (16.4%) households and 1 in 5 (19.2%) individuals experienced either being at risk of hunger or experiencing hunger in 1999-2000. The poor, children, single adult households, and Pacific Islanders were particularly vulnerable. Geographical areas with a high percentage of Hawaiians (Moloka`i, Waimānalo, Wai`anae), recent economic changes (Waimea-Kekaha, Lanai, Hamākua coast, Wailua, `Ewa Beach), close proximity to high-tourist areas (Waikīkī and Kaanapali-Naapili), and high immigrant (Kalihi) or military (Schofield-Wheeler) populations were particularly at high risk of food insecurity. Findings confirm that food insecurity negatively affects health status in Hawai`i. Adults that were food insecure were more likely to suffer from poor mental and physical health, obesity, diabetes, asthma, and arthritis. The paradox that food insecurity increased with increasing levels of obesity has been reported elsewhere21 and is an area that warrants further research. UTILITY OF METHODS The purpose of this study was to provide baseline estimates of household food security status in Hawai`i for 1999-2000. We utilized an alternative method for measuring food security in Hawai`i: called the Simple Food Security Monitoring Tool (SFSMT.) The SFSMT was tested using an existing survey that has excellent procedures and a much large sample size than other methods used today. Our study found that the new measure of food security SFSMT has some very interesting and useful characteristics. 1. The SFSMT made it possible to look at food security in detail in comparison to other measures by measuring food
security at several levels thus, allowing detailed comparisons to important health and demographic variables. 2. As outlined in A-6:, the SFSMT can be coded to replicate the USDA measure and results are similar to the national
values. The SFSMT has only 6 questions when compared to the national 18-question survey. Thus, the SFSMT achieves greater measurement accuracy (more levels of food security) at much lower cost.
3. The SFSMT was realistic and more utilitarian because of the finer distinctions in food security. Estimates of food
insecurity were higher with the SFSMT (16.4% percent of Hawaii's households with 19.2 percent of persons in households) than with the USDA measures of food insecurity of households in Hawai`i (9.2% in 1995;5 10.4% in 1996-1998.) The difference may be due to higher rates of food insecurity as well actual difference in rates of food insecurity.5,9,10,11 The additional richness of the data resulting from SFSMT provides greater opportunity to study the issues and inform policy development.
4. The SFSMT data was clearly related to important person and household characteristics as well as to other health
status indicators. Researchers can use the relationships: to understand issues around food insecurity and hunger, to continually monitor food insecurity, and to probe deeper into policy relevant issues attendant on food insecurity.
We believe the SFSMT is a useful measure of food insecurity in Hawai`i. We are continuing with additional research to measure change in food security status. We believe the SFSMT deserves careful consideration by those who monitor health status, who are interested in providing services to the food insecure, and who investigate the relationships among food security status and other health indicators.
HuOfHa
APPENDIX
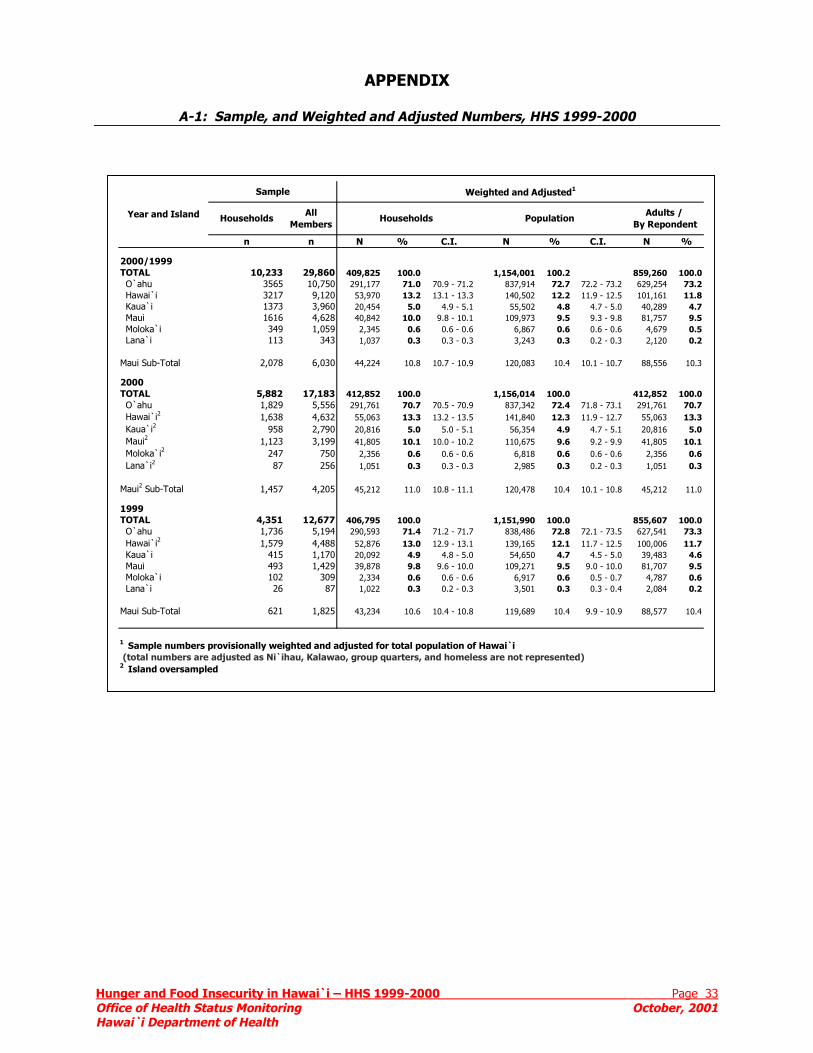
A-1: Sample, and Weighted and Adjusted Numbers, HHS 1999-2000
Sample Weighted and Adjusted1
nger and Food Insecurity in Hawai`i – HHS 1999-2000 Page 33 fice of Health Status Monitoring October, 2001 wai`i Department of Health
n n N % C.I. N % C.I. N %
2000/1999TOTAL 10,233 29,860 409,825 100.0 1,154,001 100.2 859,260 100.0 O`ahu 3565 10,750 291,177 71.0 70.9 - 71.2 837,914 72.7 72.2 - 73.2 629,254 73.2 Hawai`i 3217 9,120 53,970 13.2 13.1 - 13.3 140,502 12.2 11.9 - 12.5 101,161 11.8 Kaua`i 1373 3,960 20,454 5.0 4.9 - 5.1 55,502 4.8 4.7 - 5.0 40,289 4.7 Maui 1616 4,628 40,842 10.0 9.8 - 10.1 109,973 9.5 9.3 - 9.8 81,757 9.5 Moloka`i 349 1,059 2,345 0.6 0.6 - 0.6 6,867 0.6 0.6 - 0.6 4,679 0.5 Lana`i 113 343 1,037 0.3 0.3 - 0.3 3,243 0.3 0.2 - 0.3 2,120 0.2
Maui Sub-Total 2,078 6,030 44,224 10.8 10.7 - 10.9 120,083 10.4 10.1 - 10.7 88,556 10.3
2000TOTAL 5,882 17,183 412,852 100.0 1,156,014 100.0 412,852 100.0 O`ahu 1,829 5,556 291,761 70.7 70.5 - 70.9 837,342 72.4 71.8 - 73.1 291,761 70.7 Hawai`i2 1,638 4,632 55,063 13.3 13.2 - 13.5 141,840 12.3 11.9 - 12.7 55,063 13.3 Kaua`i2 958 2,790 20,816 5.0 5.0 - 5.1 56,354 4.9 4.7 - 5.1 20,816 5.0 Maui2 1,123 3,199 41,805 10.1 10.0 - 10.2 110,675 9.6 9.2 - 9.9 41,805 10.1 Moloka`i2 247 750 2,356 0.6 0.6 - 0.6 6,818 0.6 0.6 - 0.6 2,356 0.6 Lana`i2 87 256 1,051 0.3 0.3 - 0.3 2,985 0.3 0.2 - 0.3 1,051 0.3
Maui2 Sub-Total 1,457 4,205 45,212 11.0 10.8 - 11.1 120,478 10.4 10.1 - 10.8 45,212 11.0
1999TOTAL 4,351 12,677 406,795 100.0 1,151,990 100.0 855,607 100.0 O`ahu 1,736 5,194 290,593 71.4 71.2 - 71.7 838,486 72.8 72.1 - 73.5 627,541 73.3 Hawai`i2 1,579 4,488 52,876 13.0 12.9 - 13.1 139,165 12.1 11.7 - 12.5 100,006 11.7 Kaua`i 415 1,170 20,092 4.9 4.8 - 5.0 54,650 4.7 4.5 - 5.0 39,483 4.6 Maui 493 1,429 39,878 9.8 9.6 - 10.0 109,271 9.5 9.0 - 10.0 81,707 9.5 Moloka`i 102 309 2,334 0.6 0.6 - 0.6 6,917 0.6 0.5 - 0.7 4,787 0.6 Lana`i 26 87 1,022 0.3 0.2 - 0.3 3,501 0.3 0.3 - 0.4 2,084 0.2
Maui Sub-Total 621 1,825 43,234 10.6 10.4 - 10.8 119,689 10.4 9.9 - 10.9 88,577 10.4
1 Sample numbers provisionally weighted and adjusted for total population of Hawai`i (total numbers are adjusted as Ni`ihau, Kalawao, group quarters, and homeless are not represented)2 Island oversampled
Adults / By Repondent
Households PopulationYear and Island Households All Members
HOH
A-2: Simple Food Security Monitoring Tool (SFSMT) Questions 2-7 were asked during the 1999-2000 survey period. Question 1 was added later. Introduction: Now I'm going to read you statements that people have made about their food situation. Please tell me whether the statement was often, sometimes or never true for your household in the last 12 months. The first statement is: Q1. “I/We worried whether our food would run out before I/we had money to buy more.” In the last 12 months was that (READ FIRST 3 CHOICES)? � 1 Often true � 2 Sometimes true [or] � 3 Never true Q2. “The food I/we bought just didn't last and I/we
didn't have enough to get more.” In the last 12 months, was that: (READ FIRST 3 CHOICES)?
� 1 Often true � 2 Sometimes true [or] � 3 Never true Q3. “I/We couldn't afford to eat meals with a starch
such as (cultural grain product; i.e. rice in Hawai`i) or bread, meat, beans or fish, and a fruit or vegetable .In the last 12 months, was that (READ FIRST 3 CHOICES)?
� 1 Often true � 2 Sometimes true [or] � 3 Never true
Q4. “In the last 12 months, did you ever eat less than you felt you should because there wasn't enough money?” � 1 Yes � 2 No If the answer to any of the above questions was (1) Yes, than continue otherwise END. Now, just a few more Yes or No questions: Q5. In the last 12 months, were you ever hungry but didn't eat because you couldn't afford enough food? � 1 Yes � 2 No Q6. In the last 12 months, did you or another adult in
your household ever not eat for a whole day because there wasn't enough money for food?
� 1 Yes � 2 No If the household answered any questions with a YES and has one or more children age 17 or under residing in the household than continue otherwise END. Q7. In the last 12 months, was/were your
child/children ever hungry but you just couldn't afford more food?
� 1 Yes � 2 No
Household Food Security Categorization Household Food Secure = no affirmative responses Household with “Imminent Food Insecurity” = Affirmative response to Q1. Household “At risk of hunger”= Any response to Q2-Q4 was affirmative Household with one or more hungry adults = Affirmative response to Q5 or Q6. Household with one or more hungry children = Affirmative response to Q7.
References: Derrickson JP. Derrickson JP, Brown AC (2001) Perceptions of Food Security Stakeholders in Hawai`i. Journal of Nutrition Education. In Press. Derrickson JP. (2001) Summary of Three Years of Food security Research in Hawai`i: University of Wisconsin, Institute for Research on Poverty, Discussion paper. University of Wisconsin, Institute for Research on Poverty, Discussion Paper 1226-1. pp. 72 http://www.ssc.wisc.edu/irp/pubs/dp122601.pdf
unger and Food Insecurity in Hawai`i – HHS 1999-2000 Page 34 ffice of Health Status Monitoring October, 2001 awai`i Department of Health
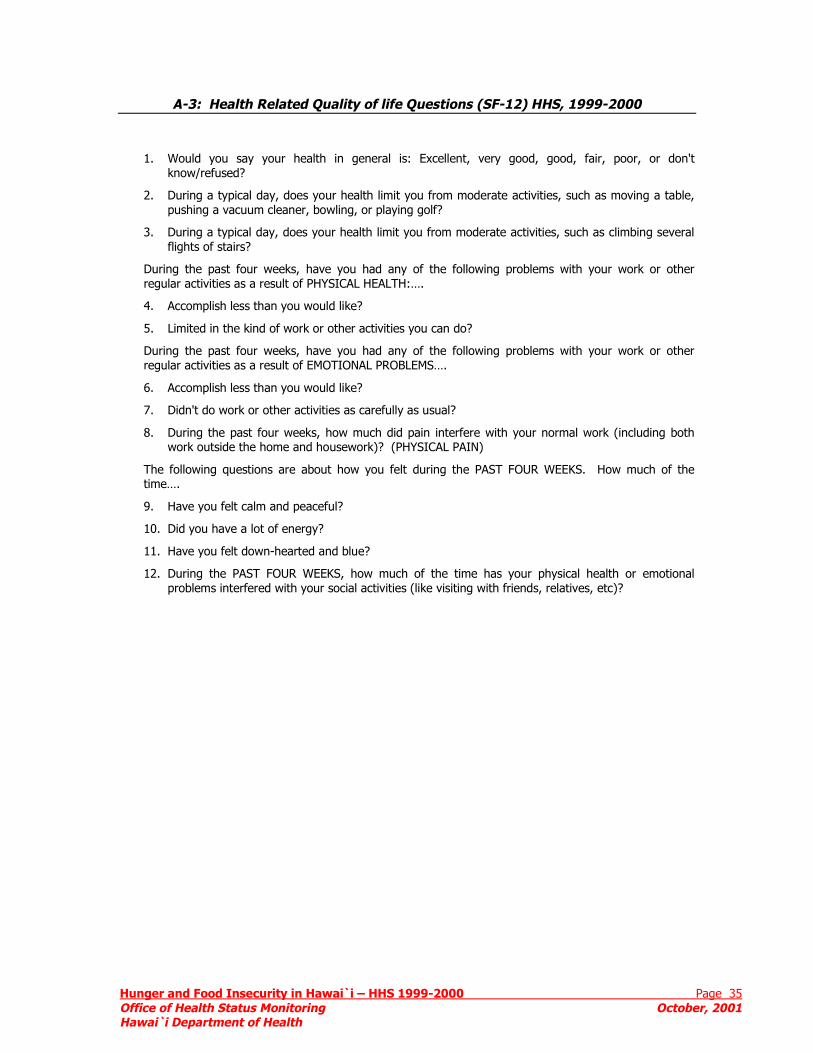
Hunger and Food Insecurity in Hawai`i – HHS 1999-2000 Page 35 Office of Health Status Monitoring October, 2001 Hawai`i Department of Health
A-3: Health Related Quality of life Questions (SF-12) HHS, 1999-2000
1. Would you say your health in general is: Excellent, very good, good, fair, poor, or don't know/refused?
2. During a typical day, does your health limit you from moderate activities, such as moving a table, pushing a vacuum cleaner, bowling, or playing golf?
3. During a typical day, does your health limit you from moderate activities, such as climbing several flights of stairs?
During the past four weeks, have you had any of the following problems with your work or other regular activities as a result of PHYSICAL HEALTH:….
4. Accomplish less than you would like?
5. Limited in the kind of work or other activities you can do?
During the past four weeks, have you had any of the following problems with your work or other regular activities as a result of EMOTIONAL PROBLEMS….
6. Accomplish less than you would like?
7. Didn't do work or other activities as carefully as usual?
8. During the past four weeks, how much did pain interfere with your normal work (including both work outside the home and housework)? (PHYSICAL PAIN)
The following questions are about how you felt during the PAST FOUR WEEKS. How much of the time….
9. Have you felt calm and peaceful?
10. Did you have a lot of energy?
11. Have you felt down-hearted and blue?
12. During the PAST FOUR WEEKS, how much of the time has your physical health or emotional problems interfered with your social activities (like visiting with friends, relatives, etc)?
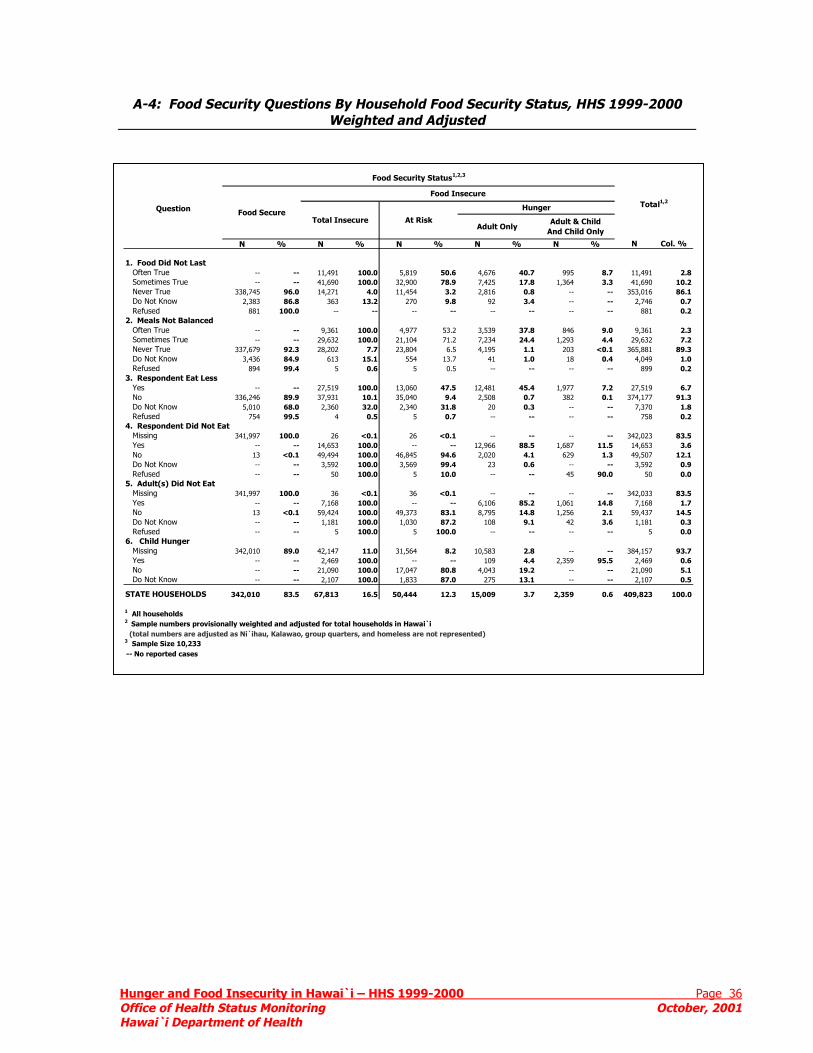
A-4: Food Security Questions By Household Food Security Status, HHS 1999-2000 Weighted and Adjusted
Food Security Status1,2,3
Hunger and Food Insecurity in Hawai`i – HHS 1999-2000 Page 36 Office of Health Status Monitoring October, 2001 Hawai`i Department of Health
N % N % N % N % N % N Col. %
1. Food Did Not Last Often True -- -- 11,491 100.0 5,819 50.6 4,676 40.7 995 8.7 11,491 2.8 Sometimes True -- -- 41,690 100.0 32,900 78.9 7,425 17.8 1,364 3.3 41,690 10.2 Never True 338,745 96.0 14,271 4.0 11,454 3.2 2,816 0.8 -- -- 353,016 86.1 Do Not Know 2,383 86.8 363 13.2 270 9.8 92 3.4 -- -- 2,746 0.7 Refused 881 100.0 -- -- -- -- -- -- -- -- 881 0.22. Meals Not Balanced Often True -- -- 9,361 100.0 4,977 53.2 3,539 37.8 846 9.0 9,361 2.3 Sometimes True -- -- 29,632 100.0 21,104 71.2 7,234 24.4 1,293 4.4 29,632 7.2 Never True 337,679 92.3 28,202 7.7 23,804 6.5 4,195 1.1 203 <0.1 365,881 89.3 Do Not Know 3,436 84.9 613 15.1 554 13.7 41 1.0 18 0.4 4,049 1.0 Refused 894 99.4 5 0.6 5 0.5 -- -- -- -- 899 0.23. Respondent Eat Less Yes -- -- 27,519 100.0 13,060 47.5 12,481 45.4 1,977 7.2 27,519 6.7 No 336,246 89.9 37,931 10.1 35,040 9.4 2,508 0.7 382 0.1 374,177 91.3 Do Not Know 5,010 68.0 2,360 32.0 2,340 31.8 20 0.3 -- -- 7,370 1.8 Refused 754 99.5 4 0.5 5 0.7 -- -- -- -- 758 0.24. Respondent Did Not Eat Missing 341,997 100.0 26 <0.1 26 <0.1 -- -- -- -- 342,023 83.5 Yes -- -- 14,653 100.0 -- -- 12,966 88.5 1,687 11.5 14,653 3.6 No 13 <0.1 49,494 100.0 46,845 94.6 2,020 4.1 629 1.3 49,507 12.1 Do Not Know -- -- 3,592 100.0 3,569 99.4 23 0.6 -- -- 3,592 0.9 Refused -- -- 50 100.0 5 10.0 -- -- 45 90.0 50 0.05. Adult(s) Did Not Eat Missing 341,997 100.0 36 <0.1 36 <0.1 -- -- -- -- 342,033 83.5 Yes -- -- 7,168 100.0 -- -- 6,106 85.2 1,061 14.8 7,168 1.7 No 13 <0.1 59,424 100.0 49,373 83.1 8,795 14.8 1,256 2.1 59,437 14.5 Do Not Know -- -- 1,181 100.0 1,030 87.2 108 9.1 42 3.6 1,181 0.3 Refused -- -- 5 100.0 5 100.0 -- -- -- -- 5 0.06. Child Hunger Missing 342,010 89.0 42,147 11.0 31,564 8.2 10,583 2.8 -- -- 384,157 93.7 Yes -- -- 2,469 100.0 -- -- 109 4.4 2,359 95.5 2,469 0.6 No -- -- 21,090 100.0 17,047 80.8 4,043 19.2 -- -- 21,090 5.1 Do Not Know -- -- 2,107 100.0 1,833 87.0 275 13.1 -- -- 2,107 0.5
STATE HOUSEHOLDS 342,010 83.5 67,813 16.5 50,444 12.3 15,009 3.7 2,359 0.6 409,823 100.0
1 All households2 Sample numbers provisionally weighted and adjusted for total households in Hawai`i (total numbers are adjusted as Ni`ihau, Kalawao, group quarters, and homeless are not represented)3 Sample Size 10,233 -- No reported cases
Question Total1,2
Total Insecure Adult & ChildAnd Child Only
Food Secure
Food Insecure
At Risk
Hunger
Adult Only
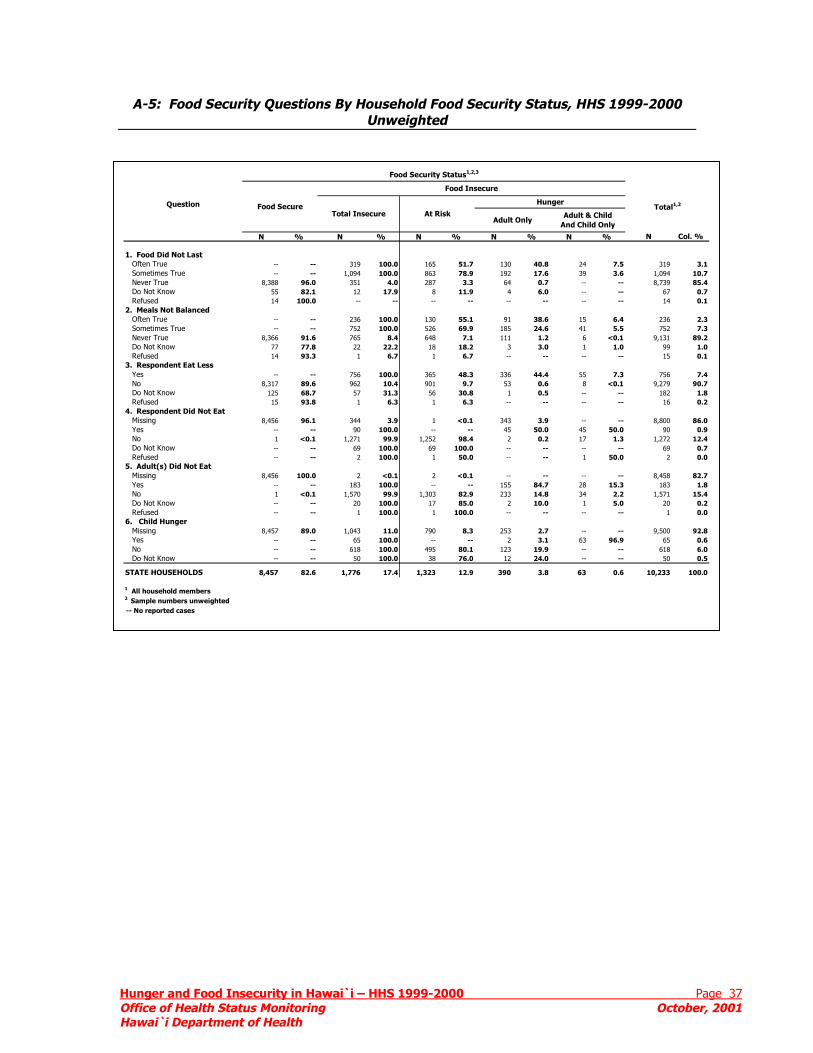
A-5: Food Security Questions By Household Food Security Status, HHS 1999-2000 Unweighted
Food Security Status1,2,3
Hunger and Food Insecurity in Hawai`i – HHS 1999-2000 Page 37 Office of Health Status Monitoring October, 2001 Hawai`i Department of Health
N % N % N % N % N % N Col. %
1. Food Did Not Last Often True -- -- 319 100.0 165 51.7 130 40.8 24 7.5 319 3.1 Sometimes True -- -- 1,094 100.0 863 78.9 192 17.6 39 3.6 1,094 10.7 Never True 8,388 96.0 351 4.0 287 3.3 64 0.7 -- -- 8,739 85.4 Do Not Know 55 82.1 12 17.9 8 11.9 4 6.0 -- -- 67 0.7 Refused 14 100.0 -- -- -- -- -- -- -- -- 14 0.12. Meals Not Balanced Often True -- -- 236 100.0 130 55.1 91 38.6 15 6.4 236 2.3 Sometimes True -- -- 752 100.0 526 69.9 185 24.6 41 5.5 752 7.3 Never True 8,366 91.6 765 8.4 648 7.1 111 1.2 6 <0.1 9,131 89.2 Do Not Know 77 77.8 22 22.2 18 18.2 3 3.0 1 1.0 99 1.0 Refused 14 93.3 1 6.7 1 6.7 -- -- -- -- 15 0.13. Respondent Eat Less Yes -- -- 756 100.0 365 48.3 336 44.4 55 7.3 756 7.4 No 8,317 89.6 962 10.4 901 9.7 53 0.6 8 <0.1 9,279 90.7 Do Not Know 125 68.7 57 31.3 56 30.8 1 0.5 -- -- 182 1.8 Refused 15 93.8 1 6.3 1 6.3 -- -- -- -- 16 0.24. Respondent Did Not Eat Missing 8,456 96.1 344 3.9 1 <0.1 343 3.9 -- -- 8,800 86.0 Yes -- -- 90 100.0 -- -- 45 50.0 45 50.0 90 0.9 No 1 <0.1 1,271 99.9 1,252 98.4 2 0.2 17 1.3 1,272 12.4 Do Not Know -- -- 69 100.0 69 100.0 -- -- -- -- 69 0.7 Refused -- -- 2 100.0 1 50.0 -- -- 1 50.0 2 0.05. Adult(s) Did Not Eat Missing 8,456 100.0 2 <0.1 2 <0.1 -- -- -- -- 8,458 82.7 Yes -- -- 183 100.0 -- -- 155 84.7 28 15.3 183 1.8 No 1 <0.1 1,570 99.9 1,303 82.9 233 14.8 34 2.2 1,571 15.4 Do Not Know -- -- 20 100.0 17 85.0 2 10.0 1 5.0 20 0.2 Refused -- -- 1 100.0 1 100.0 -- -- -- -- 1 0.06. Child Hunger Missing 8,457 89.0 1,043 11.0 790 8.3 253 2.7 -- -- 9,500 92.8 Yes -- -- 65 100.0 -- -- 2 3.1 63 96.9 65 0.6 No -- -- 618 100.0 495 80.1 123 19.9 -- -- 618 6.0 Do Not Know -- -- 50 100.0 38 76.0 12 24.0 -- -- 50 0.5
STATE HOUSEHOLDS 8,457 82.6 1,776 17.4 1,323 12.9 390 3.8 63 0.6 10,233 100.0
1 All household members2 Sample numbers unweighted -- No reported cases
Question Food Secure
Food Insecure
Total1,2
Total Insecure At Risk
Hunger
Adult Only Adult & Child
And Child Only
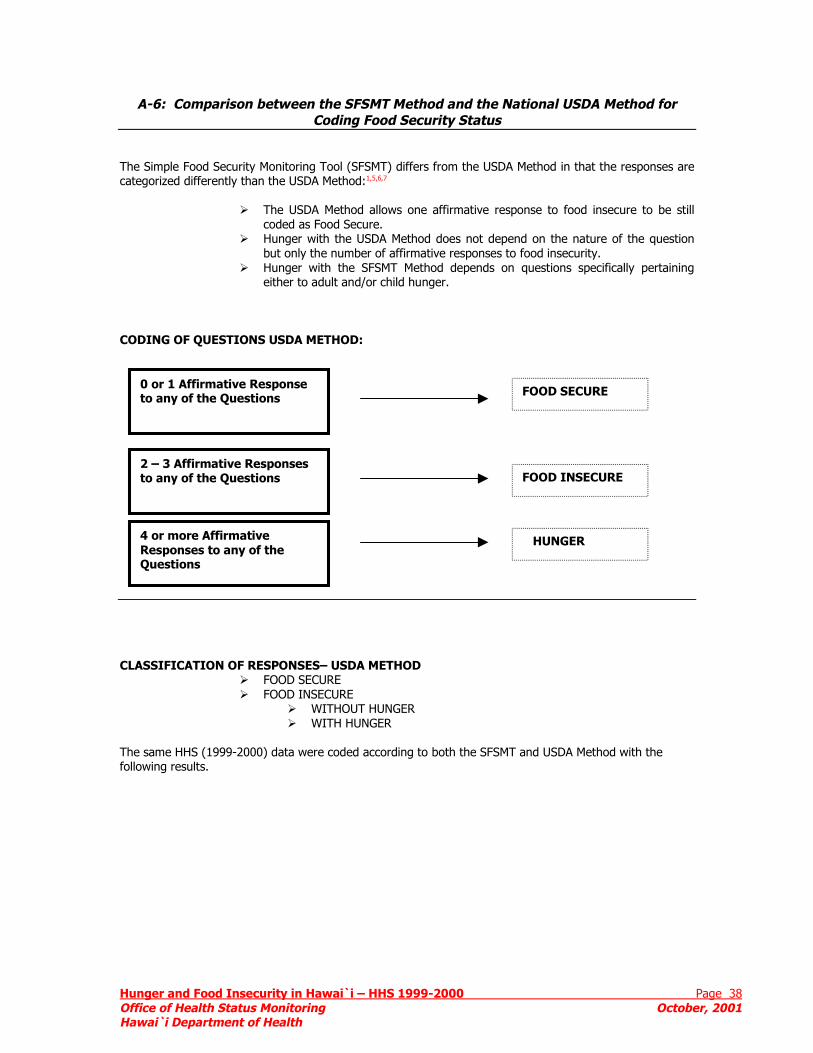
Hunger and Food Insecurity in Hawai`i – HHS 1999-2000 Page 38 Office of Health Status Monitoring October, 2001 Hawai`i Department of Health
A-6: Comparison between the SFSMT Method and the National USDA Method for Coding Food Security Status
The Simple Food Security Monitoring Tool (SFSMT) differs from the USDA Method in that the responses are categorized differently than the USDA Method:1,5,6,7
The USDA Method allows one affirmative response to food insecure to be still coded as Food Secure. Hunger with the USDA Method does not depend on the nature of the question but only the number of affirmative responses to food insecurity. Hunger with the SFSMT Method depends on questions specifically pertaining either to adult and/or child hunger.
CODING OF QUESTIONS USDA METHOD:
CLASSIFICATION OF RESPONSES– USDA METHOD
FOOD SECURE FOOD INSECURE
WITHOUT HUNGER WITH HUNGER
The same HHS (1999-2000) data were coded according to both the SFSMT and USDA Method with the following results.
0 or 1 Affirmative Response to any of the Questions
2 – 3 Affirmative Responses to any of the Questions
4 or more Affirmative Responses to any of the Questions
FOOD SECURE
FOOD INSECURE
HUNGER
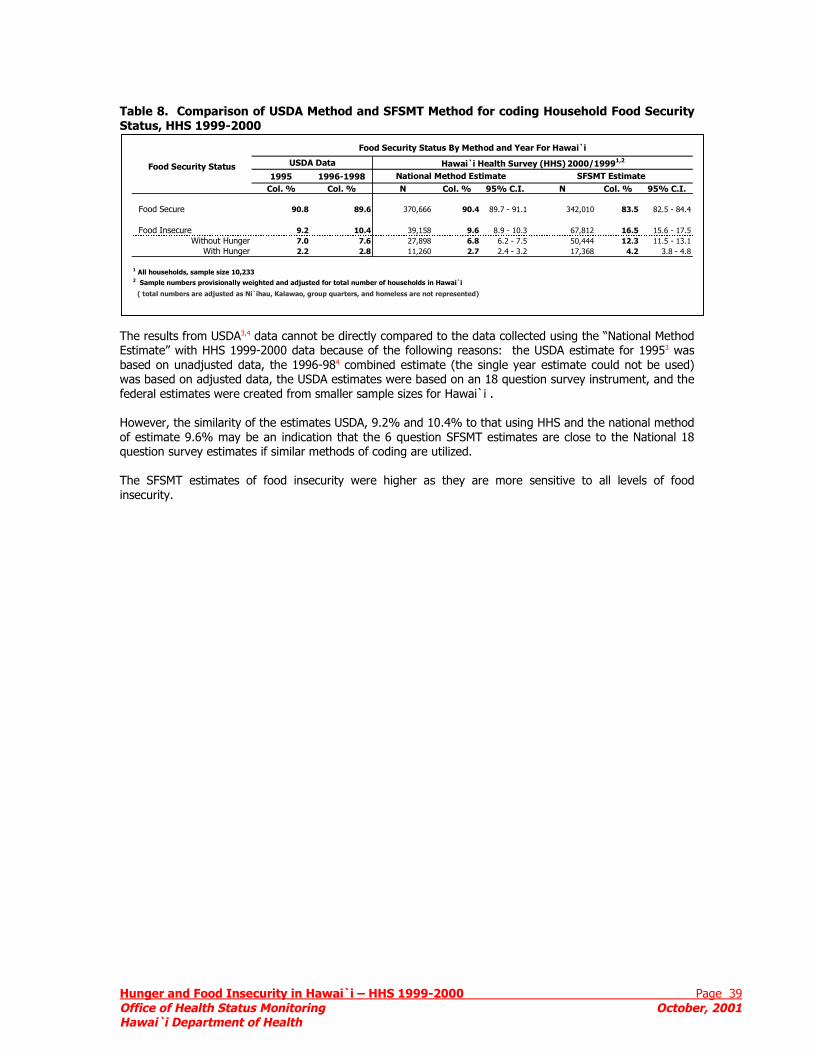
HOH
Table 8. Comparison of USDA Method and SFSMT Method for coding Household Food Security S atus, HHS 1999-2000
TEbwf Hoq Ti
1,2
Food Security Status By Method and Year For Hawai`i
USDA Data
t
unger and Food Insecurity in Hawai`i – HHS 1999-2000 Page 39 ffice of Health Status Monitoring October, 2001 awai`i Department of Health
he results from USDA3,4 data cannot be directly compared to the data collected using the “National Method stimate” with HHS 1999-2000 data because of the following reasons: the USDA estimate for 19953 was ased on unadjusted data, the 1996-984 combined estimate (the single year estimate could not be used) as based on adjusted data, the USDA estimates were based on an 18 question survey instrument, and the
ederal estimates were created from smaller sample sizes for Hawai`i .
owever, the similarity of the estimates USDA, 9.2% and 10.4% to that using HHS and the national method f estimate 9.6% may be an indication that the 6 question SFSMT estimates are close to the National 18 uestion survey estimates if similar methods of coding are utilized.
he SFSMT estimates of food insecurity were higher as they are more sensitive to all levels of food nsecurity.
1995 1996-1998Col. % Col. % N Col. % 95% C.I. N Col. % 95% C.I.
Food Secure 90.8 89.6 370,666 90.4 89.7 - 91.1 342,010 83.5 82.5 - 84.4
Food Insecure 9.2 10.4 39,158 9.6 8.9 - 10.3 67,812 16.5 15.6 - 17.5Without Hunger 7.0 7.6 27,898 6.8 6.2 - 7.5 50,444 12.3 11.5 - 13.1
With Hunger 2.2 2.8 11,260 2.7 2.4 - 3.2 17,368 4.2 3.8 - 4.8
1 All households, sample size 10,2332 Sample numbers provisionally weighted and adjusted for total number of households in Hawai`i
( total numbers are adjusted as Ni`ihau, Kalawao, group quarters, and homeless are not represented)
Hawai`i Health Survey (HHS) 2000/1999Food Security StatusNational Method Estimate SFSMT Estimate
����������������������������������������������������������������������������������������������������������������������������������������������������������������������������������������������������������������������������������
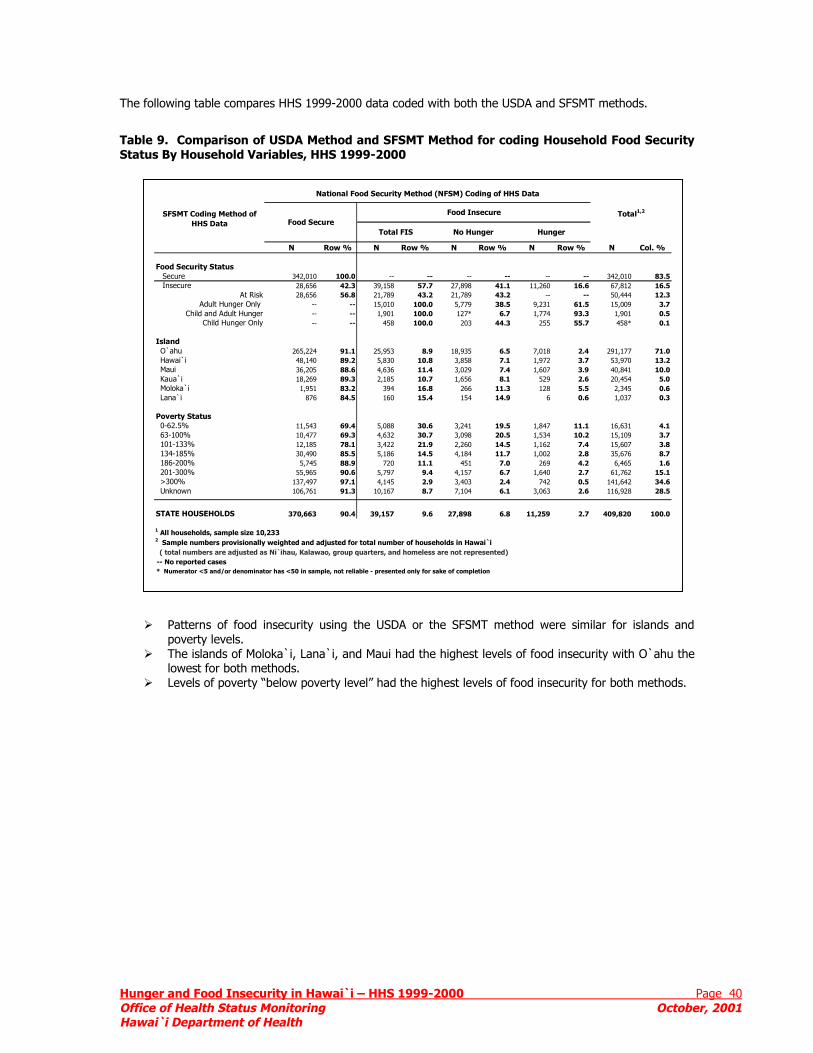
HungOfficHaw
The following table compares HHS 1999-2000 data coded with both the USDA and SFSMT methods.
Table 9. Comparison of USDA Method and SFSMT Method for coding Household Food Security Status By Household Variables, HHS 1999-2000
National Food Security Method (NFSM) Coding of HHS Data
er and Food Insecurity in Hawai`i – HHS 1999-2000 Page 40 e of Health Status Monitoring October, 2001 ai`i Department of Health
Patterns of food insecurity using the USDA or the SFSMT method were similar for islands and poverty levels. The islands of Moloka`i, Lana`i, and Maui had the highest levels of food insecurity with O`ahu the lowest for both methods. Levels of poverty “below poverty level” had the highest levels of food insecurity for both methods.
N Row % N Row % N Row % N Row % N Col. %
Food Security Status Secure 342,010 100.0 -- -- -- -- -- -- 342,010 83.5 Insecure 28,656 42.3 39,158 57.7 27,898 41.1 11,260 16.6 67,812 16.5
At Risk 28,656 56.8 21,789 43.2 21,789 43.2 -- -- 50,444 12.3 Adult Hunger Only -- -- 15,010 100.0 5,779 38.5 9,231 61.5 15,009 3.7
Child and Adult Hunger -- -- 1,901 100.0 127* 6.7 1,774 93.3 1,901 0.5 Child Hunger Only -- -- 458 100.0 203 44.3 255 55.7 458* 0.1
Island O`ahu 265,224 91.1 25,953 8.9 18,935 6.5 7,018 2.4 291,177 71.0 Hawai`i 48,140 89.2 5,830 10.8 3,858 7.1 1,972 3.7 53,970 13.2 Maui 36,205 88.6 4,636 11.4 3,029 7.4 1,607 3.9 40,841 10.0 Kaua`i 18,269 89.3 2,185 10.7 1,656 8.1 529 2.6 20,454 5.0 Moloka`i 1,951 83.2 394 16.8 266 11.3 128 5.5 2,345 0.6 Lana`i 876 84.5 160 15.4 154 14.9 6 0.6 1,037 0.3
Poverty Status 0-62.5% 11,543 69.4 5,088 30.6 3,241 19.5 1,847 11.1 16,631 4.1 63-100% 10,477 69.3 4,632 30.7 3,098 20.5 1,534 10.2 15,109 3.7 101-133% 12,185 78.1 3,422 21.9 2,260 14.5 1,162 7.4 15,607 3.8 134-185% 30,490 85.5 5,186 14.5 4,184 11.7 1,002 2.8 35,676 8.7 186-200% 5,745 88.9 720 11.1 451 7.0 269 4.2 6,465 1.6 201-300% 55,965 90.6 5,797 9.4 4,157 6.7 1,640 2.7 61,762 15.1 >300% 137,497 97.1 4,145 2.9 3,403 2.4 742 0.5 141,642 34.6 Unknown 106,761 91.3 10,167 8.7 7,104 6.1 3,063 2.6 116,928 28.5
STATE HOUSEHOLDS 370,663 90.4 39,157 9.6 27,898 6.8 11,259 2.7 409,820 100.0
1 All households, sample size 10,2332 Sample numbers provisionally weighted and adjusted for total number of households in Hawai`i ( total numbers are adjusted as Ni`ihau, Kalawao, group quarters, and homeless are not represented) -- No reported cases * Numerator <5 and/or denominator has <50 in sample, not reliable - presented only for sake of completion
Food Insecure Total1,2SFSMT Coding Method of HHS Data
HungerNo HungerFood Secure
Total FIS

HungeOfficeHawai
2000/1999
A-7: Food Security Status for Households and Household members, HHS 1999-2000
r and Food Insecurity in Hawai`i – HHS 1999-2000 Page 41 of Health Status Monitoring October, 2001 `i Department of Health
N Col. % 95% C.I. N Col. % 95% C.I.
Food Secure 342,010 83.5 82.5 - 84.4 932,169 80.8 79.5 - 82.0
Food Insecure 67,812 16.5 15.6 - 17.5 221,834 19.2 18.0 - 20.5At Risk of Hunger 50,444 12.3 11.5 - 13.1 168,450 14.6 13.5 - 15.7
Child and Adult Hunger 1,901 0.5 0.3 - 0.7 9,964 0.9 0.6 - 1.3Adult Hunger Only 15,009 3.7 3.2 - 4.2 41,197 3.6 3.1 - 4.2Child Hunger Only 458 0.1 0.1 - 0.2 2,223 0.2 0.1 - 0.4
TOTAL 409,822 1,154,003
Food Secure 350,110 84.8 83.5 - 86.0 952,281 82.4 80.7 - 83.9
Food Insecure 62,741 15.2 14.0 - 16.5 203,732 17.6 16.1 - 19.3At Risk of Hunger 46,535 11.3 10.3 - 12.4 157,586 13.6 12.2 - 15.2
Child and Adult Hunger 1,747 0.4 0.2 - 0.7 9,236 0.8 0.4 - 1.5Adult Hunger Only 14,138 3.4 2.8 - 4.1 35,783 3.1 2.5 - 3.8Child Hunger Only 321 0.1 0.0 - 0.3 1,127 0.1 0.0 - 0.3
Total 412,851 1,156,013
Food Secure 333,909 82.1 80.7 - 83.4 912,057 79.2 77.3 - 80.9
Food Insecure 72,886 17.9 16.6 - 19.3 239,932 20.8 19.1 - 22.7At Risk of Hunger 54,353 13.4 12.2 - 14.6 179,313 15.6 14.0 - 17.3
Child and Adult Hunger 2,056 0.5 0.3 - 0.8 10,691 0.9 0.6 - 1.5Adult Hunger Only 15,881 3.9 3.3 - 4.7 46,610 4.0 3.2 - 5.1Child Hunger Only 596 0.1 0.1 - 0.3 3,318 0.3 0.1 - 0.7
Total 406,795 1,151,989
1 All households, sample size 10,2332 Sample numbers provisionally weighted and adjusted for total number of households in Hawai`i 3 All household members, sample size 29,8604 Sample numbers provisionally weighted and adjusted for total population of Hawai`i
(total numbers are adjusted as Ni`ihau, Kalawao, group quarters, and homeless are not represented)
Food Security Status
1999
Households 1,2 Household Members3,4
2000
��������������������������������������������������������������������������������������������������������������������������������������������������������������������������������������������������������
��������������������������������������������������������������������������������������������������������������������������������������������������������������������������������������������������������
��������������������������������������������������������������������������������������������������������������������������������������������������������������������������������������������������������
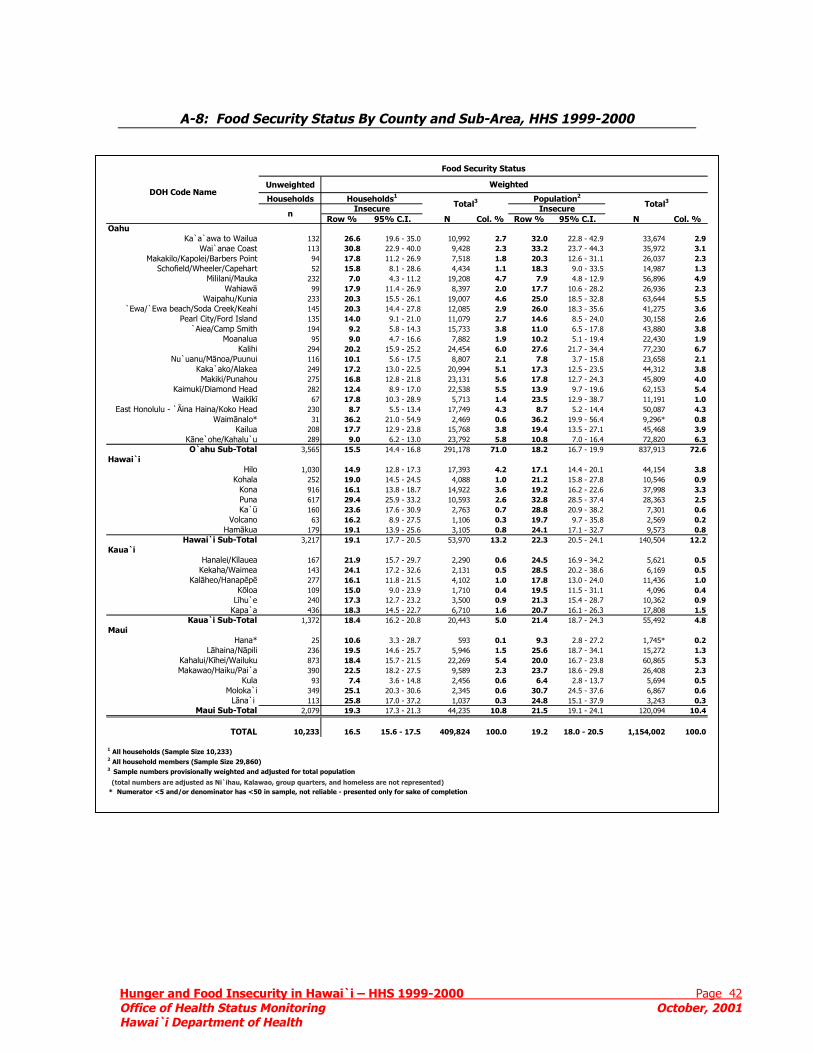
A-8: Food Security Status By County and Sub-Area, HHS 1999-2000
Food Security Status
Hunger and Food Insecurity in Hawai`i – HHS 1999-2000 Page 42 Office of Health Status Monitoring October, 2001 Hawai`i Department of Health
Unweighted
Row % 95% C.I. N Col. % Row % 95% C.I. N Col. %Oahu
Ka`a`awa to Wailua 132 26.6 19.6 - 35.0 10,992 2.7 32.0 22.8 - 42.9 33,674 2.9Wai`anae Coast 113 30.8 22.9 - 40.0 9,428 2.3 33.2 23.7 - 44.3 35,972 3.1
Makakilo/Kapolei/Barbers Point 94 17.8 11.2 - 26.9 7,518 1.8 20.3 12.6 - 31.1 26,037 2.3Schofield/Wheeler/Capehart 52 15.8 8.1 - 28.6 4,434 1.1 18.3 9.0 - 33.5 14,987 1.3
Mililani/Mauka 232 7.0 4.3 - 11.2 19,208 4.7 7.9 4.8 - 12.9 56,896 4.9Wahiawā 99 17.9 11.4 - 26.9 8,397 2.0 17.7 10.6 - 28.2 26,936 2.3
Waipahu/Kunia 233 20.3 15.5 - 26.1 19,007 4.6 25.0 18.5 - 32.8 63,644 5.5`Ewa/`Ewa beach/Soda Creek/Keahi 145 20.3 14.4 - 27.8 12,085 2.9 26.0 18.3 - 35.6 41,275 3.6
Pearl City/Ford Island 135 14.0 9.1 - 21.0 11,079 2.7 14.6 8.5 - 24.0 30,158 2.6`Aiea/Camp Smith 194 9.2 5.8 - 14.3 15,733 3.8 11.0 6.5 - 17.8 43,880 3.8
Moanalua 95 9.0 4.7 - 16.6 7,882 1.9 10.2 5.1 - 19.4 22,430 1.9Kalihi 294 20.2 15.9 - 25.2 24,454 6.0 27.6 21.7 - 34.4 77,230 6.7
Nu`uanu/Mānoa/Puunui 116 10.1 5.6 - 17.5 8,807 2.1 7.8 3.7 - 15.8 23,658 2.1Kaka`ako/Alakea 249 17.2 13.0 - 22.5 20,994 5.1 17.3 12.5 - 23.5 44,312 3.8Makiki/Punahou 275 16.8 12.8 - 21.8 23,131 5.6 17.8 12.7 - 24.3 45,809 4.0
Kaimukī/Diamond Head 282 12.4 8.9 - 17.0 22,538 5.5 13.9 9.7 - 19.6 62,153 5.4Waikīkī 67 17.8 10.3 - 28.9 5,713 1.4 23.5 12.9 - 38.7 11,191 1.0
East Honolulu - `Āina Haina/Koko Head 230 8.7 5.5 - 13.4 17,749 4.3 8.7 5.2 - 14.4 50,087 4.3Waimānalo* 31 36.2 21.0 - 54.9 2,469 0.6 36.2 19.9 - 56.4 9,296* 0.8
Kailua 208 17.7 12.9 - 23.8 15,768 3.8 19.4 13.5 - 27.1 45,468 3.9Kāne`ohe/Kahalu`u 289 9.0 6.2 - 13.0 23,792 5.8 10.8 7.0 - 16.4 72,820 6.3O`ahu Sub-Total 3,565 15.5 14.4 - 16.8 291,178 71.0 18.2 16.7 - 19.9 837,913 72.6
Hawai`i Hilo 1,030 14.9 12.8 - 17.3 17,393 4.2 17.1 14.4 - 20.1 44,154 3.8
Kohala 252 19.0 14.5 - 24.5 4,088 1.0 21.2 15.8 - 27.8 10,546 0.9Kona 916 16.1 13.8 - 18.7 14,922 3.6 19.2 16.2 - 22.6 37,998 3.3Puna 617 29.4 25.9 - 33.2 10,593 2.6 32.8 28.5 - 37.4 28,363 2.5Ka`ū 160 23.6 17.6 - 30.9 2,763 0.7 28.8 20.9 - 38.2 7,301 0.6
Volcano 63 16.2 8.9 - 27.5 1,106 0.3 19.7 9.7 - 35.8 2,569 0.2Hamākua 179 19.1 13.9 - 25.6 3,105 0.8 24.1 17.1 - 32.7 9,573 0.8
Hawai`i Sub-Total 3,217 19.1 17.7 - 20.5 53,970 13.2 22.3 20.5 - 24.1 140,504 12.2Kaua`i
Hanalei/Kīlauea 167 21.9 15.7 - 29.7 2,290 0.6 24.5 16.9 - 34.2 5,621 0.5Kekaha/Waimea 143 24.1 17.2 - 32.6 2,131 0.5 28.5 20.2 - 38.6 6,169 0.5
Kalāheo/Hanapēpē 277 16.1 11.8 - 21.5 4,102 1.0 17.8 13.0 - 24.0 11,436 1.0Kōloa 109 15.0 9.0 - 23.9 1,710 0.4 19.5 11.5 - 31.1 4,096 0.4
Līhu`e 240 17.3 12.7 - 23.2 3,500 0.9 21.3 15.4 - 28.7 10,362 0.9Kapa`a 436 18.3 14.5 - 22.7 6,710 1.6 20.7 16.1 - 26.3 17,808 1.5
Kaua`i Sub-Total 1,372 18.4 16.2 - 20.8 20,443 5.0 21.4 18.7 - 24.3 55,492 4.8Maui
Hana* 25 10.6 3.3 - 28.7 593 0.1 9.3 2.8 - 27.2 1,745* 0.2Lāhaina/Nāpili 236 19.5 14.6 - 25.7 5,946 1.5 25.6 18.7 - 34.1 15,272 1.3
Kahalui/Kīhei/Wailuku 873 18.4 15.7 - 21.5 22,269 5.4 20.0 16.7 - 23.8 60,865 5.3Makawao/Haiku/Pai`a 390 22.5 18.2 - 27.5 9,589 2.3 23.7 18.6 - 29.8 26,408 2.3
Kula 93 7.4 3.6 - 14.8 2,456 0.6 6.4 2.8 - 13.7 5,694 0.5Moloka`i 349 25.1 20.3 - 30.6 2,345 0.6 30.7 24.5 - 37.6 6,867 0.6
Lāna`i 113 25.8 17.0 - 37.2 1,037 0.3 24.8 15.1 - 37.9 3,243 0.3Maui Sub-Total 2,079 19.3 17.3 - 21.3 44,235 10.8 21.5 19.1 - 24.1 120,094 10.4
TOTAL 10,233 16.5 15.6 - 17.5 409,824 100.0 19.2 18.0 - 20.5 1,154,002 100.0
1 All households (Sample Size 10,233)2 All household members (Sample Size 29,860)3 Sample numbers provisionally weighted and adjusted for total population
(total numbers are adjusted as Ni`ihau, Kalawao, group quarters, and homeless are not represented) * Numerator <5 and/or denominator has <50 in sample, not reliable - presented only for sake of completion
Total3Households1
Insecure InsecureHouseholds
DOH Code Name
n
Population2
Total3
Weighted
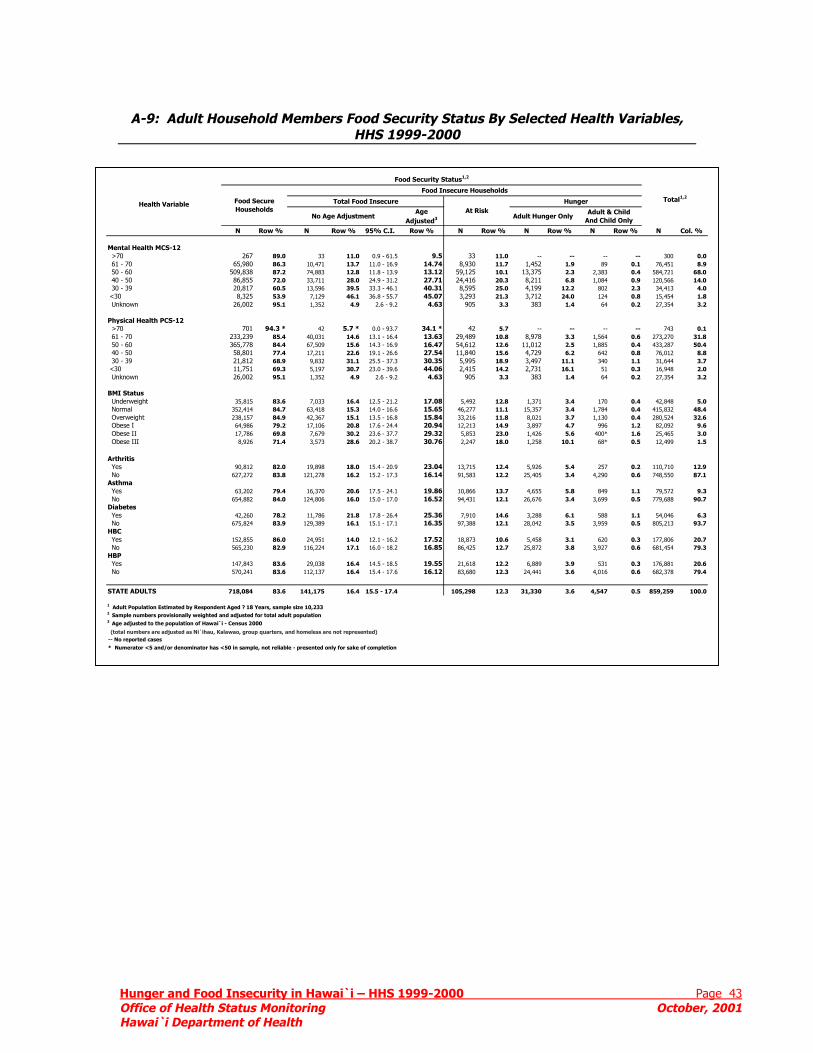
A-9: Adult Household Members Food Security Status By Selected Health Variables,
HHS 1999-2000 Food Security Status1,2
Hunger and Food Insecurity in Hawai`i – HHS 1999-2000 Page 43 Office of Health Status Monitoring October, 2001 Hawai`i Department of Health
N Row % N Row % 95% C.I. Row % N Row % N Row % N Row % N Col. %
Mental Health MCS-12 >70 267 89.0 33 11.0 0.9 - 61.5 9.5 33 11.0 -- -- -- -- 300 0.0 61 - 70 65,980 86.3 10,471 13.7 11.0 - 16.9 14.74 8,930 11.7 1,452 1.9 89 0.1 76,451 8.9 50 - 60 509,838 87.2 74,883 12.8 11.8 - 13.9 13.12 59,125 10.1 13,375 2.3 2,383 0.4 584,721 68.0 40 - 50 86,855 72.0 33,711 28.0 24.9 - 31.2 27.71 24,416 20.3 8,211 6.8 1,084 0.9 120,566 14.0 30 - 39 20,817 60.5 13,596 39.5 33.3 - 46.1 40.31 8,595 25.0 4,199 12.2 802 2.3 34,413 4.0 <30 8,325 53.9 7,129 46.1 36.8 - 55.7 45.07 3,293 21.3 3,712 24.0 124 0.8 15,454 1.8 Unknown 26,002 95.1 1,352 4.9 2.6 - 9.2 4.63 905 3.3 383 1.4 64 0.2 27,354 3.2
Physical Health PCS-12 >70 701 94.3 * 42 5.7 * 0.0 - 93.7 34.1 * 42 5.7 -- -- -- -- 743 0.1 61 - 70 233,239 85.4 40,031 14.6 13.1 - 16.4 13.63 29,489 10.8 8,978 3.3 1,564 0.6 273,270 31.8 50 - 60 365,778 84.4 67,509 15.6 14.3 - 16.9 16.47 54,612 12.6 11,012 2.5 1,885 0.4 433,287 50.4 40 - 50 58,801 77.4 17,211 22.6 19.1 - 26.6 27.54 11,840 15.6 4,729 6.2 642 0.8 76,012 8.8 30 - 39 21,812 68.9 9,832 31.1 25.5 - 37.3 30.35 5,995 18.9 3,497 11.1 340 1.1 31,644 3.7 <30 11,751 69.3 5,197 30.7 23.0 - 39.6 44.06 2,415 14.2 2,731 16.1 51 0.3 16,948 2.0 Unknown 26,002 95.1 1,352 4.9 2.6 - 9.2 4.63 905 3.3 383 1.4 64 0.2 27,354 3.2
BMI Status Underweight 35,815 83.6 7,033 16.4 12.5 - 21.2 17.08 5,492 12.8 1,371 3.4 170 0.4 42,848 5.0 Normal 352,414 84.7 63,418 15.3 14.0 - 16.6 15.65 46,277 11.1 15,357 3.4 1,784 0.4 415,832 48.4 Overweight 238,157 84.9 42,367 15.1 13.5 - 16.8 15.84 33,216 11.8 8,021 3.7 1,130 0.4 280,524 32.6 Obese I 64,986 79.2 17,106 20.8 17.6 - 24.4 20.94 12,213 14.9 3,897 4.7 996 1.2 82,092 9.6 Obese II 17,786 69.8 7,679 30.2 23.6 - 37.7 29.32 5,853 23.0 1,426 5.6 400* 1.6 25,465 3.0 Obese III 8,926 71.4 3,573 28.6 20.2 - 38.7 30.76 2,247 18.0 1,258 10.1 68* 0.5 12,499 1.5
Arthritis Yes 90,812 82.0 19,898 18.0 15.4 - 20.9 23.04 13,715 12.4 5,926 5.4 257 0.2 110,710 12.9 No 627,272 83.8 121,278 16.2 15.2 - 17.3 16.14 91,583 12.2 25,405 3.4 4,290 0.6 748,550 87.1Asthma Yes 63,202 79.4 16,370 20.6 17.5 - 24.1 19.86 10,866 13.7 4,655 5.8 849 1.1 79,572 9.3 No 654,882 84.0 124,806 16.0 15.0 - 17.0 16.52 94,431 12.1 26,676 3.4 3,699 0.5 779,688 90.7Diabetes Yes 42,260 78.2 11,786 21.8 17.8 - 26.4 25.36 7,910 14.6 3,288 6.1 588 1.1 54,046 6.3 No 675,824 83.9 129,389 16.1 15.1 - 17.1 16.35 97,388 12.1 28,042 3.5 3,959 0.5 805,213 93.7HBC Yes 152,855 86.0 24,951 14.0 12.1 - 16.2 17.52 18,873 10.6 5,458 3.1 620 0.3 177,806 20.7 No 565,230 82.9 116,224 17.1 16.0 - 18.2 16.85 86,425 12.7 25,872 3.8 3,927 0.6 681,454 79.3HBP Yes 147,843 83.6 29,038 16.4 14.5 - 18.5 19.55 21,618 12.2 6,889 3.9 531 0.3 176,881 20.6 No 570,241 83.6 112,137 16.4 15.4 - 17.6 16.12 83,680 12.3 24,441 3.6 4,016 0.6 682,378 79.4
STATE ADULTS 718,084 83.6 141,175 16.4 15.5 - 17.4 105,298 12.3 31,330 3.6 4,547 0.5 859,259 100.0
1 Adult Population Estimated by Respondent Aged ? 18 Years, sample size 10,2332 Sample numbers provisionally weighted and adjusted for total adult population3 Age adjusted to the population of Hawai`i - Census 2000
(total numbers are adjusted as Ni`ihau, Kalawao, group quarters, and homeless are not represented) -- No reported cases * Numerator <5 and/or denominator has <50 in sample, not reliable - presented only for sake of completion
Health VariableTotal1,2
Food Secure Households
Food Insecure Households
Total Food Insecure
No Age AdjustmentAge
Adjusted3
At RiskHunger
Adult Hunger Only Adult & ChildAnd Child Only
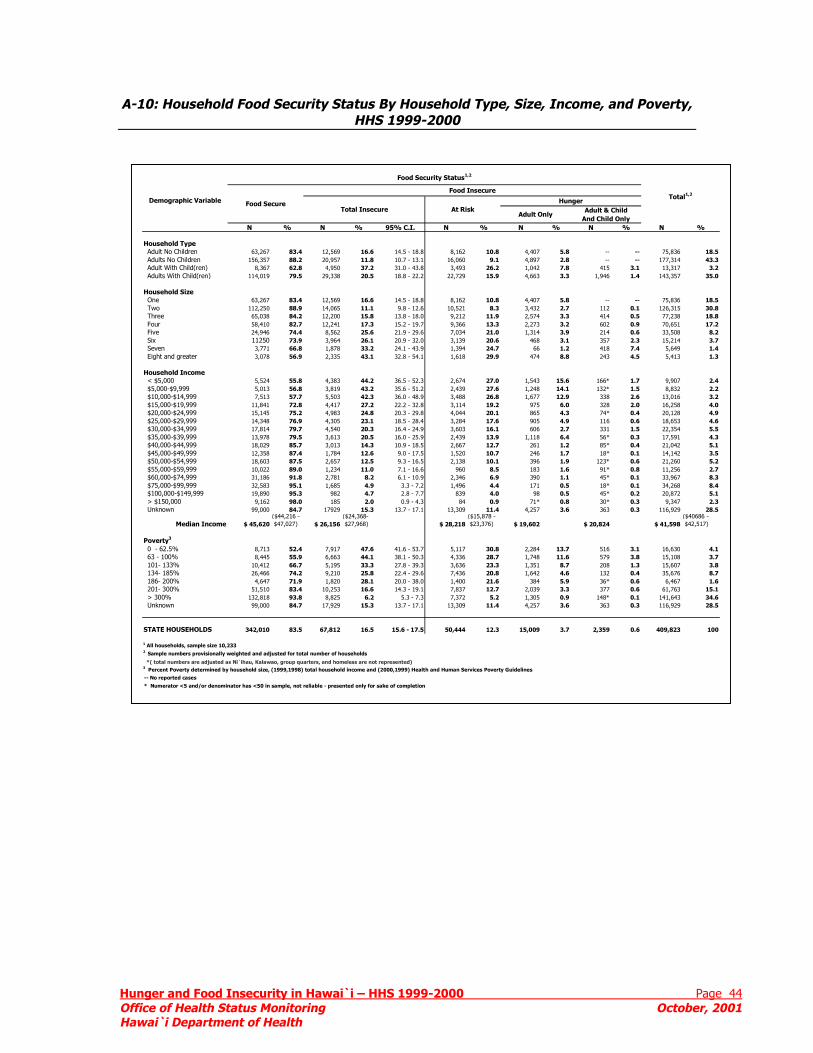
HuOfHa
A-10: Household Food Security Status By Household Type, Size, Income, and Poverty, HHS 1999-2000
Food Security Status1,2
nger and Food Insecurity in Hawai`i – HHS 1999-2000 Page 44 fice of Health Status Monitoring October, 2001 wai`i Department of Health
N % N % 95% C.I. N % N % N % N %
Household Type Adult No Children 63,267 83.4 12,569 16.6 14.5 - 18.8 8,162 10.8 4,407 5.8 -- -- 75,836 18.5 Adults No Children 156,357 88.2 20,957 11.8 10.7 - 13.1 16,060 9.1 4,897 2.8 -- -- 177,314 43.3 Adult With Child(ren) 8,367 62.8 4,950 37.2 31.0 - 43.8 3,493 26.2 1,042 7.8 415 3.1 13,317 3.2 Adults With Child(ren) 114,019 79.5 29,338 20.5 18.8 - 22.2 22,729 15.9 4,663 3.3 1,946 1.4 143,357 35.0
Household Size One 63,267 83.4 12,569 16.6 14.5 - 18.8 8,162 10.8 4,407 5.8 -- -- 75,836 18.5 Two 112,250 88.9 14,065 11.1 9.8 - 12.6 10,521 8.3 3,432 2.7 112 0.1 126,315 30.8 Three 65,038 84.2 12,200 15.8 13.8 - 18.0 9,212 11.9 2,574 3.3 414 0.5 77,238 18.8 Four 58,410 82.7 12,241 17.3 15.2 - 19.7 9,366 13.3 2,273 3.2 602 0.9 70,651 17.2 Five 24,946 74.4 8,562 25.6 21.9 - 29.6 7,034 21.0 1,314 3.9 214 0.6 33,508 8.2 Six 11250 73.9 3,964 26.1 20.9 - 32.0 3,139 20.6 468 3.1 357 2.3 15,214 3.7 Seven 3,771 66.8 1,878 33.2 24.1 - 43.9 1,394 24.7 66 1.2 418 7.4 5,649 1.4 Eight and greater 3,078 56.9 2,335 43.1 32.8 - 54.1 1,618 29.9 474 8.8 243 4.5 5,413 1.3
Household Income < $5,000 5,524 55.8 4,383 44.2 36.5 - 52.3 2,674 27.0 1,543 15.6 166* 1.7 9,907 2.4 $5,000-$9,999 5,013 56.8 3,819 43.2 35.6 - 51.2 2,439 27.6 1,248 14.1 132* 1.5 8,832 2.2 $10,000-$14,999 7,513 57.7 5,503 42.3 36.0 - 48.9 3,488 26.8 1,677 12.9 338 2.6 13,016 3.2 $15,000-$19,999 11,841 72.8 4,417 27.2 22.2 - 32.8 3,114 19.2 975 6.0 328 2.0 16,258 4.0 $20,000-$24,999 15,145 75.2 4,983 24.8 20.3 - 29.8 4,044 20.1 865 4.3 74* 0.4 20,128 4.9 $25,000-$29,999 14,348 76.9 4,305 23.1 18.5 - 28.4 3,284 17.6 905 4.9 116 0.6 18,653 4.6 $30,000-$34,999 17,814 79.7 4,540 20.3 16.4 - 24.9 3,603 16.1 606 2.7 331 1.5 22,354 5.5 $35,000-$39,999 13,978 79.5 3,613 20.5 16.0 - 25.9 2,439 13.9 1,118 6.4 56* 0.3 17,591 4.3 $40,000-$44,999 18,029 85.7 3,013 14.3 10.9 - 18.5 2,667 12.7 261 1.2 85* 0.4 21,042 5.1 $45,000-$49,999 12,358 87.4 1,784 12.6 9.0 - 17.5 1,520 10.7 246 1.7 18* 0.1 14,142 3.5 $50,000-$54,999 18,603 87.5 2,657 12.5 9.3 - 16.5 2,138 10.1 396 1.9 123* 0.6 21,260 5.2 $55,000-$59,999 10,022 89.0 1,234 11.0 7.1 - 16.6 960 8.5 183 1.6 91* 0.8 11,256 2.7 $60,000-$74,999 31,186 91.8 2,781 8.2 6.1 - 10.9 2,346 6.9 390 1.1 45* 0.1 33,967 8.3 $75,000-$99,999 32,583 95.1 1,685 4.9 3.3 - 7.2 1,496 4.4 171 0.5 18* 0.1 34,268 8.4 $100,000-$149,999 19,890 95.3 982 4.7 2.8 - 7.7 839 4.0 98 0.5 45* 0.2 20,872 5.1 > $150,000 9,162 98.0 185 2.0 0.9 - 4.3 84 0.9 71* 0.8 30* 0.3 9,347 2.3 Unknown 99,000 84.7 17929 15.3 13.7 - 17.1 13,309 11.4 4,257 3.6 363 0.3 116,929 28.5
Median Income $ 45,620($44,216 - $47,027) $ 26,156
($24,368- $27,968) $ 28,218
($15,878 - $23,376) $ 19,602 $ 20,824 $ 41,598
($40686 - $42,517)
Poverty3
0 - 62.5% 8,713 52.4 7,917 47.6 41.6 - 53.7 5,117 30.8 2,284 13.7 516 3.1 16,630 4.1 63 - 100% 8,445 55.9 6,663 44.1 38.1 - 50.3 4,336 28.7 1,748 11.6 579 3.8 15,108 3.7 101- 133% 10,412 66.7 5,195 33.3 27.8 - 39.3 3,636 23.3 1,351 8.7 208 1.3 15,607 3.8 134- 185% 26,466 74.2 9,210 25.8 22.4 - 29.6 7,436 20.8 1,642 4.6 132 0.4 35,676 8.7 186- 200% 4,647 71.9 1,820 28.1 20.0 - 38.0 1,400 21.6 384 5.9 36* 0.6 6,467 1.6 201- 300% 51,510 83.4 10,253 16.6 14.3 - 19.1 7,837 12.7 2,039 3.3 377 0.6 61,763 15.1 > 300% 132,818 93.8 8,825 6.2 5.3 - 7.3 7,372 5.2 1,305 0.9 148* 0.1 141,643 34.6 Unknown 99,000 84.7 17,929 15.3 13.7 - 17.1 13,309 11.4 4,257 3.6 363 0.3 116,929 28.5
STATE HOUSEHOLDS 342,010 83.5 67,812 16.5 15.6 - 17.5 50,444 12.3 15,009 3.7 2,359 0.6 409,823 100
1 All households, sample size 10,2332 Sample numbers provisionally weighted and adjusted for total number of households
*( total numbers are adjusted as Ni`ihau, Kalawao, group quarters, and homeless are not represented)3 Percent Poverty determined by household size, (1999,1998) total household income and (2000,1999) Health and Human Services Poverty Guidelines -- No reported cases * Numerator <5 and/or denominator has <50 in sample, not reliable - presented only for sake of completion
Total1,2Food Insecure
Adult Only
Food SecureTotal Insecure At Risk
HungerAdult & Child
And Child Only
Demographic Variable
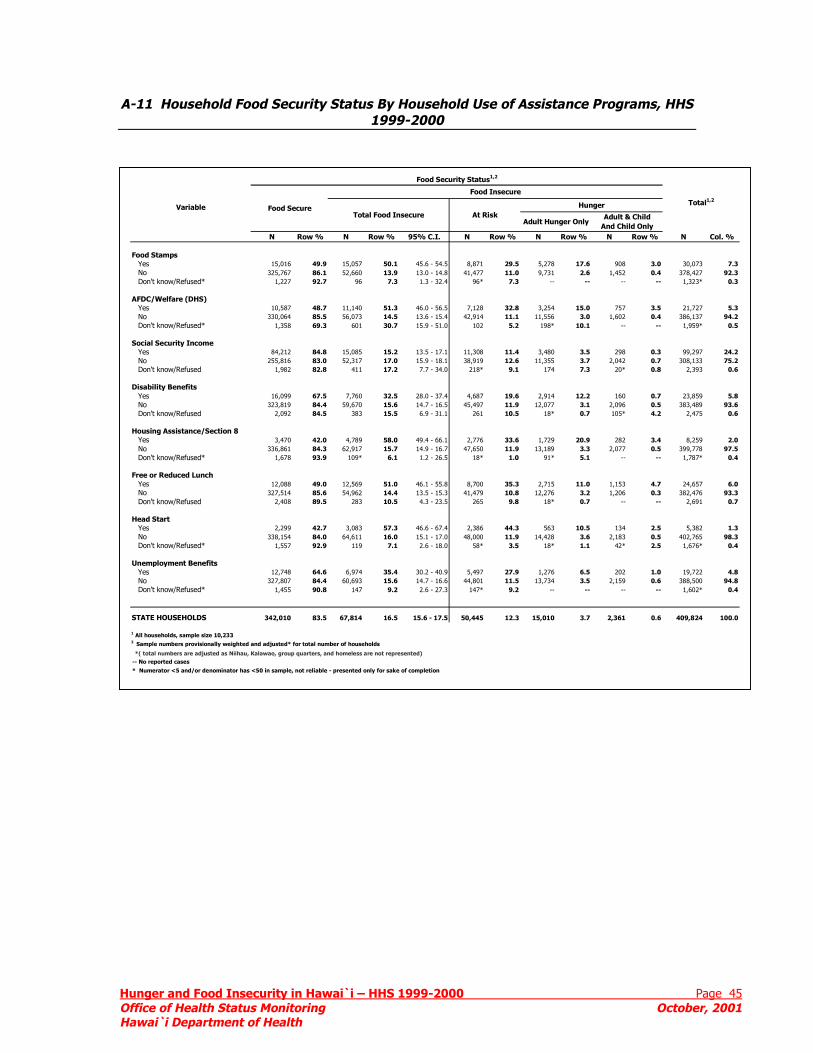
HOH
A-11 Household Food Security Status By Household Use of Assistance Programs, HHS 1999-2000
Food Security Status1,2
unger and Food Insecurity in Hawai`i – HHS 1999-2000 Page 45 ffice of Health Status Monitoring October, 2001 awai`i Department of Health
N Row % N Row % 95% C.I. N Row % N Row % N Row % N Col. %
Food Stamps Yes 15,016 49.9 15,057 50.1 45.6 - 54.5 8,871 29.5 5,278 17.6 908 3.0 30,073 7.3 No 325,767 86.1 52,660 13.9 13.0 - 14.8 41,477 11.0 9,731 2.6 1,452 0.4 378,427 92.3 Don't know/Refused* 1,227 92.7 96 7.3 1.3 - 32.4 96* 7.3 -- -- -- -- 1,323* 0.3
AFDC/Welfare (DHS) Yes 10,587 48.7 11,140 51.3 46.0 - 56.5 7,128 32.8 3,254 15.0 757 3.5 21,727 5.3 No 330,064 85.5 56,073 14.5 13.6 - 15.4 42,914 11.1 11,556 3.0 1,602 0.4 386,137 94.2 Don't know/Refused* 1,358 69.3 601 30.7 15.9 - 51.0 102 5.2 198* 10.1 -- -- 1,959* 0.5
Social Security Income Yes 84,212 84.8 15,085 15.2 13.5 - 17.1 11,308 11.4 3,480 3.5 298 0.3 99,297 24.2 No 255,816 83.0 52,317 17.0 15.9 - 18.1 38,919 12.6 11,355 3.7 2,042 0.7 308,133 75.2 Don't know/Refused 1,982 82.8 411 17.2 7.7 - 34.0 218* 9.1 174 7.3 20* 0.8 2,393 0.6
Disability Benefits Yes 16,099 67.5 7,760 32.5 28.0 - 37.4 4,687 19.6 2,914 12.2 160 0.7 23,859 5.8 No 323,819 84.4 59,670 15.6 14.7 - 16.5 45,497 11.9 12,077 3.1 2,096 0.5 383,489 93.6 Don't know/Refused 2,092 84.5 383 15.5 6.9 - 31.1 261 10.5 18* 0.7 105* 4.2 2,475 0.6
Housing Assistance/Section 8 Yes 3,470 42.0 4,789 58.0 49.4 - 66.1 2,776 33.6 1,729 20.9 282 3.4 8,259 2.0 No 336,861 84.3 62,917 15.7 14.9 - 16.7 47,650 11.9 13,189 3.3 2,077 0.5 399,778 97.5 Don't know/Refused* 1,678 93.9 109* 6.1 1.2 - 26.5 18* 1.0 91* 5.1 -- -- 1,787* 0.4
Free or Reduced Lunch Yes 12,088 49.0 12,569 51.0 46.1 - 55.8 8,700 35.3 2,715 11.0 1,153 4.7 24,657 6.0 No 327,514 85.6 54,962 14.4 13.5 - 15.3 41,479 10.8 12,276 3.2 1,206 0.3 382,476 93.3 Don't know/Refused 2,408 89.5 283 10.5 4.3 - 23.5 265 9.8 18* 0.7 -- -- 2,691 0.7
Head Start Yes 2,299 42.7 3,083 57.3 46.6 - 67.4 2,386 44.3 563 10.5 134 2.5 5,382 1.3 No 338,154 84.0 64,611 16.0 15.1 - 17.0 48,000 11.9 14,428 3.6 2,183 0.5 402,765 98.3 Don't know/Refused* 1,557 92.9 119 7.1 2.6 - 18.0 58* 3.5 18* 1.1 42* 2.5 1,676* 0.4
Unemployment Benefits Yes 12,748 64.6 6,974 35.4 30.2 - 40.9 5,497 27.9 1,276 6.5 202 1.0 19,722 4.8 No 327,807 84.4 60,693 15.6 14.7 - 16.6 44,801 11.5 13,734 3.5 2,159 0.6 388,500 94.8 Don't know/Refused* 1,455 90.8 147 9.2 2.6 - 27.3 147* 9.2 -- -- -- -- 1,602* 0.4
STATE HOUSEHOLDS 342,010 83.5 67,814 16.5 15.6 - 17.5 50,445 12.3 15,010 3.7 2,361 0.6 409,824 100.0
1 All households, sample size 10,2332 Sample numbers provisionally weighted and adjusted* for total number of households
*( total numbers are adjusted as Niihau, Kalawao, group quarters, and homeless are not represented) -- No reported cases * Numerator <5 and/or denominator has <50 in sample, not reliable - presented only for sake of completion
Food Secure
Food Insecure
Adult Hunger OnlyAdult & Child
And Child OnlyTotal Food Insecure At Risk
HungerVariableTotal1,2
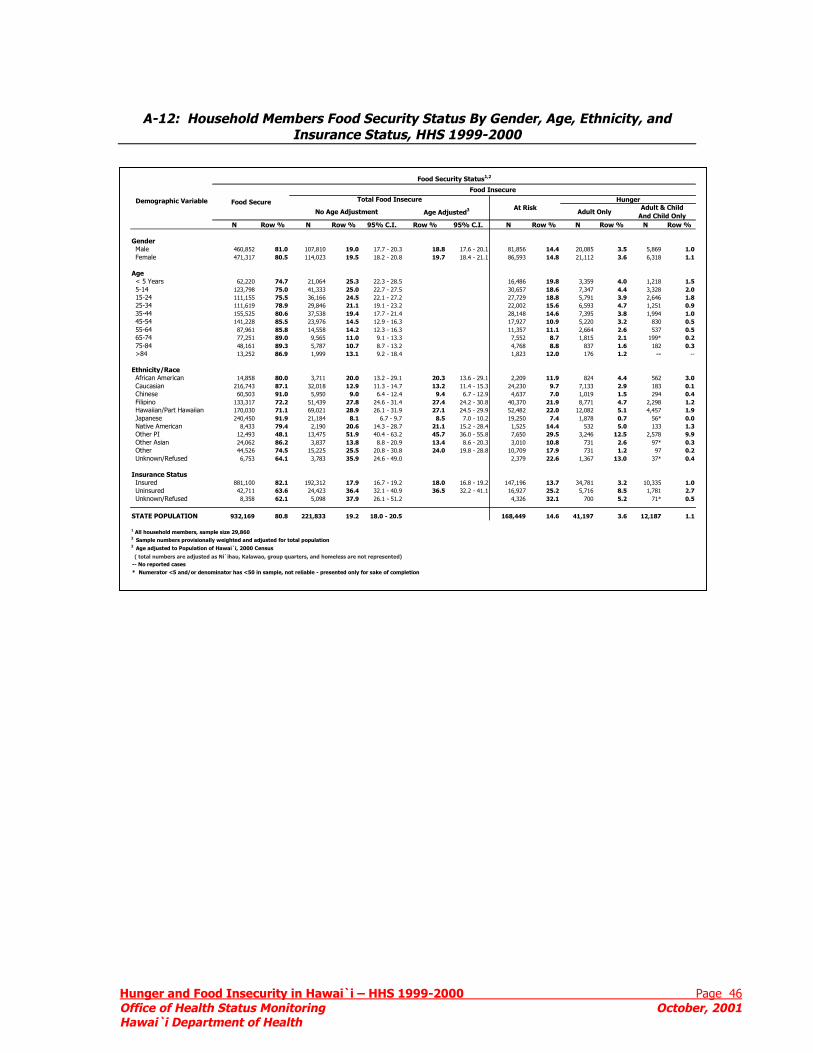
HOH
A-12: Household Members Food Security Status By Gender, Age, Ethnicity, and
Insurance Status, HHS 1999-2000
Food Security Status1,2
unger and Food Insecurity in Hawai`i – HHS 1999-2000 Page 46 ffice of Health Status Monitoring October, 2001 awai`i Department of Health
N Row % N Row % 95% C.I. Row % 95% C.I. N Row % N Row % N Row %
Gender Male 460,852 81.0 107,810 19.0 17.7 - 20.3 18.8 17.6 - 20.1 81,856 14.4 20,085 3.5 5,869 1.0 Female 471,317 80.5 114,023 19.5 18.2 - 20.8 19.7 18.4 - 21.1 86,593 14.8 21,112 3.6 6,318 1.1
Age < 5 Years 62,220 74.7 21,064 25.3 22.3 - 28.5 16,486 19.8 3,359 4.0 1,218 1.5 5-14 123,798 75.0 41,333 25.0 22.7 - 27.5 30,657 18.6 7,347 4.4 3,328 2.0 15-24 111,155 75.5 36,166 24.5 22.1 - 27.2 27,729 18.8 5,791 3.9 2,646 1.8 25-34 111,619 78.9 29,846 21.1 19.1 - 23.2 22,002 15.6 6,593 4.7 1,251 0.9 35-44 155,525 80.6 37,538 19.4 17.7 - 21.4 28,148 14.6 7,395 3.8 1,994 1.0 45-54 141,228 85.5 23,976 14.5 12.9 - 16.3 17,927 10.9 5,220 3.2 830 0.5 55-64 87,961 85.8 14,558 14.2 12.3 - 16.3 11,357 11.1 2,664 2.6 537 0.5 65-74 77,251 89.0 9,565 11.0 9.1 - 13.3 7,552 8.7 1,815 2.1 199* 0.2 75-84 48,161 89.3 5,787 10.7 8.7 - 13.2 4,768 8.8 837 1.6 182 0.3 >84 13,252 86.9 1,999 13.1 9.2 - 18.4 1,823 12.0 176 1.2 -- --
Ethnicity/Race African American 14,858 80.0 3,711 20.0 13.2 - 29.1 20.3 13.6 - 29.1 2,209 11.9 824 4.4 562 3.0 Caucasian 216,743 87.1 32,018 12.9 11.3 - 14.7 13.2 11.4 - 15.3 24,230 9.7 7,133 2.9 183 0.1 Chinese 60,503 91.0 5,950 9.0 6.4 - 12.4 9.4 6.7 - 12.9 4,637 7.0 1,019 1.5 294 0.4 Filipino 133,317 72.2 51,439 27.8 24.6 - 31.4 27.4 24.2 - 30.8 40,370 21.9 8,771 4.7 2,298 1.2 Hawaiian/Part Hawaiian 170,030 71.1 69,021 28.9 26.1 - 31.9 27.1 24.5 - 29.9 52,482 22.0 12,082 5.1 4,457 1.9 Japanese 240,450 91.9 21,184 8.1 6.7 - 9.7 8.5 7.0 - 10.2 19,250 7.4 1,878 0.7 56* 0.0 Native American 8,433 79.4 2,190 20.6 14.3 - 28.7 21.1 15.2 - 28.4 1,525 14.4 532 5.0 133 1.3 Other PI 12,493 48.1 13,475 51.9 40.4 - 63.2 45.7 36.0 - 55.8 7,650 29.5 3,246 12.5 2,578 9.9 Other Asian 24,062 86.2 3,837 13.8 8.8 - 20.9 13.4 8.6 - 20.3 3,010 10.8 731 2.6 97* 0.3 Other 44,526 74.5 15,225 25.5 20.8 - 30.8 24.0 19.8 - 28.8 10,709 17.9 731 1.2 97 0.2 Unknown/Refused 6,753 64.1 3,783 35.9 24.6 - 49.0 2,379 22.6 1,367 13.0 37* 0.4
Insurance Status Insured 881,100 82.1 192,312 17.9 16.7 - 19.2 18.0 16.8 - 19.2 147,196 13.7 34,781 3.2 10,335 1.0 Uninsured 42,711 63.6 24,423 36.4 32.1 - 40.9 36.5 32.2 - 41.1 16,927 25.2 5,716 8.5 1,781 2.7 Unknown/Refused 8,358 62.1 5,098 37.9 26.1 - 51.2 4,326 32.1 700 5.2 71* 0.5
STATE POPULATION 932,169 80.8 221,833 19.2 18.0 - 20.5 168,449 14.6 41,197 3.6 12,187 1.1
1 All household members, sample size 29,8602 Sample numbers provisionally weighted and adjusted for total population2 Age adjusted to Population of Hawai`i, 2000 Census
( total numbers are adjusted as Ni`ihau, Kalawao, group quarters, and homeless are not represented) -- No reported cases * Numerator <5 and/or denominator has <50 in sample, not reliable - presented only for sake of completion
Food SecureDemographic Variable Total Food Insecure
No Age Adjustment Age Adjusted3 Adult & ChildAnd Child Only
HungerFood Insecure
At Risk Adult Only
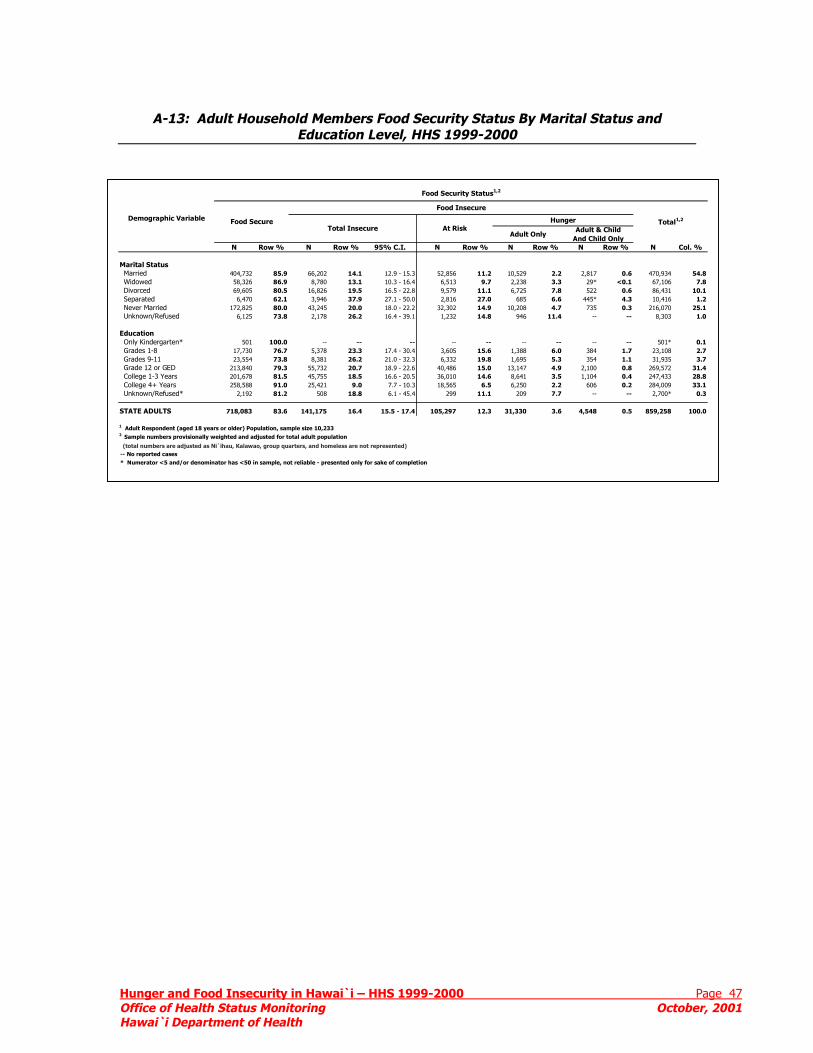
Food Security Status1,2
A-13: Adult Household Members Food Security Status By Marital Status and
Education Level, HHS 1999-2000
Hunger and Food Insecurity in Hawai`i – HHS 1999-2000 Page 47 Office of Health Status Monitoring October, 2001 Hawai`i Department of Health
N Row % N Row % 95% C.I. N Row % N Row % N Row % N Col. %
Marital Status Married 404,732 85.9 66,202 14.1 12.9 - 15.3 52,856 11.2 10,529 2.2 2,817 0.6 470,934 54.8 Widowed 58,326 86.9 8,780 13.1 10.3 - 16.4 6,513 9.7 2,238 3.3 29* <0.1 67,106 7.8 Divorced 69,605 80.5 16,826 19.5 16.5 - 22.8 9,579 11.1 6,725 7.8 522 0.6 86,431 10.1 Separated 6,470 62.1 3,946 37.9 27.1 - 50.0 2,816 27.0 685 6.6 445* 4.3 10,416 1.2 Never Married 172,825 80.0 43,245 20.0 18.0 - 22.2 32,302 14.9 10,208 4.7 735 0.3 216,070 25.1 Unknown/Refused 6,125 73.8 2,178 26.2 16.4 - 39.1 1,232 14.8 946 11.4 -- -- 8,303 1.0
Education Only Kindergarten* 501 100.0 -- -- -- -- -- -- -- -- -- 501* 0.1 Grades 1-8 17,730 76.7 5,378 23.3 17.4 - 30.4 3,605 15.6 1,388 6.0 384 1.7 23,108 2.7 Grades 9-11 23,554 73.8 8,381 26.2 21.0 - 32.3 6,332 19.8 1,695 5.3 354 1.1 31,935 3.7 Grade 12 or GED 213,840 79.3 55,732 20.7 18.9 - 22.6 40,486 15.0 13,147 4.9 2,100 0.8 269,572 31.4 College 1-3 Years 201,678 81.5 45,755 18.5 16.6 - 20.5 36,010 14.6 8,641 3.5 1,104 0.4 247,433 28.8 College 4+ Years 258,588 91.0 25,421 9.0 7.7 - 10.3 18,565 6.5 6,250 2.2 606 0.2 284,009 33.1 Unknown/Refused* 2,192 81.2 508 18.8 6.1 - 45.4 299 11.1 209 7.7 -- -- 2,700* 0.3
STATE ADULTS 718,083 83.6 141,175 16.4 15.5 - 17.4 105,297 12.3 31,330 3.6 4,548 0.5 859,258 100.0
1 Adult Respondent (aged 18 years or older) Population, sample size 10,2332 Sample numbers provisionally weighted and adjusted for total adult population
(total numbers are adjusted as Ni`ihau, Kalawao, group quarters, and homeless are not represented) -- No reported cases * Numerator <5 and/or denominator has <50 in sample, not reliable - presented only for sake of completion
Food SecureAt Risk
Demographic VariableFood Insecure
Total1,2
Adult & ChildAnd Child Only
Total InsecureHunger
Adult Only
Hunger and Food Insecurity in Hawai`i – HHS 1999-2000 Page 48 Office of Health Status Monitoring October, 2001 Hawai`i Department of Health
REFERENCES
1 Anderson, S.A. [Ed.] Life Sciences Research Office, Federation of American Societies for Experimental
Biology. "Core Indicators of Nutritional State for Difficult-to-Sample Populations." Journal of Nutrition. 1990;1557-1600.
2 Office of Disease Prevention and Disease Promotion. U.S. Department of Health and Human Services.
Healthy People 2010. (Goal 19-18). Downloaded November 17, 2000 from. http://www.health.gov/healthypeople/document/html/tracking/od19.htm.
3 Hamilton, W.L., Cook, J.T., Thompson, W.W., Buron, L.F., Frongillo Jr., E.A., Olson, C.M., and Wehler,
C.A. Household Food Security in the United States in 1995: Summary Report of the Food Security Measurement Project. Report prepared for the USDA, Food Consumer Service. Alexandria, VA. 1997.
4 Nord, M., Jemison, K., and Bickel, G. Measuring Food Security in the United States: Prevalence of Food
Insecurity and Hunger, by State, 1996-1998. Food and Rural Economics Division, Economic Research Service, U.S. Department of Agriculture. Food Assistance and Nutrition Research Report No. 2. September 1999.
5 Bickel G., Nord M, Price C, Hamilton W, and Cook J. Guide to measuring household food security, Revised
2000. U.S. Department of Agriculture, Food, and Nutrition Service, Alexandria, VA. March 2000. 6 Radimer, K.L. Understanding hunger and developing indicators to assess it. Doctoral Thesis, Cornell
University, Ithaca, NY. 1990.
7 Carlson, S. J., Andrews, M. S., and Bickel, G. W. Measuring food insecurity and hunger in the United States: development of a national benchmark measure and prevalence estimates. Journal of Nutrition. 1999;129:510S-516S.
8 Derrickson, J.P., Anderson, J. E. Face validity of the core food security module with Asians and Pacific Islanders. Journal of Nutrition Ed. 2000;32:21-30.
9 Derrickson, J.P., Anderson, J.E., Fisher, A.G., and Brown A.C. An assessment of various household food
security measures in Hawai`i has implications for national food security research and monitoring Journal of Nutrition. 2001.
10 Derrickson, J.P. and Brown, A.C. Perceptions of Food security stakeholders in Hawai`i. Journal of Nutrition Education. 2001. In Press.
11 Derrickson JP. Summary of Three Years of Food security Research in Hawai`i: University of Wisconsin,
Institute for Research on Poverty, Discussion paper. University of Wisconsin, Institute for Research on Poverty, Discussion Paper 2001;1226-1. pp. 72. http://www.ssc.wwasc.edu/irp/pubs/dp122601.pdf.
12 Health Surveys and Disease Registry, Office of Health Status Monitoring Department of Health. Hawai`i Health Survey (HHS). http://www.hawaii.gov/health/stats/index.html. 2000.
13 SMS Research & Marketing Services, Ind., and Hawai`i Department of Health, Office of Health Status Monitoring. Hawai`i Health Survey 2000, Procedure Manual. 2001.
14 SMS Research & Marketing Services, Ind., and Hawai`i Department of Health, Office of Health Status Monitoring. Hawai`i Health Survey 1999, Procedure Manual. 2000.
Hunger and Food Insecurity in Hawai`i – HHS 1999-2000 Page 49 Office of Health Status Monitoring October, 2001 Hawai`i Department of Health
15 Department of Business, Economic Development, and Tourism. Annual Report 1999. 2000.
http://www.hawaii.gov/dbedt/99annual/index.html 2000.
16 National Heart, Lung and Blood Institute in cooperation with National Institute of Diabetes and Digestive and Kidney Diseases. On the Identification, Evaluation, and Treatment of Overweight and Obesity in Adults. NIH Publications No. 98-4083. U.S. Department of Health and Human Services. The Evidence Report. 1998.
17 Ware, J.E., Kosinski, M., Keller, S.D. SF-12: How to Score the SF-12 Physical and Mental Health
Summary Scales. Lincoln, RIO: Quality Metric Incorporated, Third Edition, 1998. 18 U.S. Census Bureau, Population Division, Fertility & Family Statistics Branch. Current Population Survey
CPS - Definitions and Explanations. 2000. http://www.census.gov/population/www/cps/cpsdef.html.
19 U.S. Department of Health and Human Services, Office of the Assistant Secretary for Planning and Evaluation. Poverty Guidelines - Research and Measurement. 2000;1-2. http://aspe.hhs.gov/poverty/poverty.htm.
20 Interagency Committee for the Review of Standards for Data on Race and Ethnicity. Tabulation Working
group. Draft Provisional Guidance on the Implementation of the 1997 Standards for Federal Data on Race and Ethnicity. 1999;2-17.
21 Townsend, M.S., Peerson, J., Love, B., Achterberg, C., and Murphy, S.P. Food Insecurity Is Positively
Related to Overweight in Women. Journal of Nutrition. 2001;131:1738-1745.