Embed Size (px)
Citation preview

Earnings SummaryFourth Quarter 2018
Conference CallTuesday, February 12, 2019
10:00 a.m. ET
U.S. Participants: (888) 713 - 4213
International Participants: (617) 213 - 4865
Passcode: 485 932 39#
Webcast: ir.huntsman.com
111
This presentation includes “forward-looking statements” within the meaning of Section 27A of the Securities Act of 1933 and Section 21E of the Securities Exchange Act of 1934. These forward-looking statements include statements concerning our plans, objectives, goals, strategies, future events, future revenue or performance, capital expenditures, financing needs, plans or intentions relating to acquisitions, business trends and other information that is not historical information. When used in thispresentation, the words “estimates,” “expects,” “anticipates,” “projects,” “plans,” “intends,” “believes,” “forecasts,” or future or conditional verbs, such as “will,” “should,” “could” or “may,” and variations of such words or similar expressions are intended to identify forward-looking statements. All forward-looking statements, including, without limitation, management’s examination of historical operating trends and data, are based upon our current expectations and various assumptions. Our expectations, beliefsand projections are expressed in good faith, and we believe there is a reasonable basis for them. However, there can be no assurance that management’s expectations, beliefs and projections will be achieved.
The forward-looking statements in this release are subject to uncertainty and changes in circumstances and involve risks and uncertainties that may affect the company's operations, markets, products, services, prices and other factors as discussed in the Huntsman companies' filings with the U.S. Securities and Exchange Commission. Significant risks and uncertainties may relate to, but are not limited to, volatile global economic conditions, cyclical and volatile product markets, disruptions in production at manufacturing facilities, reorganization or restructuring of Huntsman’s operations, including any delay of, or other negativedevelopments affecting the ability to implement cost reductions and manufacturing optimization improvements in Huntsman businesses and realize anticipated cost savings, and other financial, economic, competitive, environmental, political, legal,regulatory and technological factors. Any forward-looking statement should be considered in light of the risks set forth under the caption “Risk Factors” in our Annual Report on Form 10-K for the year ended December 31, 2018.
All forward-looking statements attributable to us or persons acting on our behalf apply only as of the date made. We undertake no obligation to update or revise forward-looking statements which may be made to reflect events or circumstances that arise after the date made or to reflect the occurrence of unanticipated events.
This presentation contains financial measures that are not in accordance with generally accepted accounting principles in theU.S. ("GAAP"), including EBITDA, adjusted EBITDA, adjusted EBITDA from discontinued operations, adjusted net income (loss), adjusted diluted income (loss) per share, free cash flow and net debt. Reconciliations of non-GAAP measures to GAAP are provided in the financial schedules attached to the earnings news release and available on the Company's website at http://ir.huntsman.com/.
The Company does not provide reconciliations of forward-looking non-GAAP financial measures to the most comparable GAAP financial measures on a forward-looking basis because the Company is unable to provide a meaningful or accurate calculation or estimation of reconciling items and the information is not available without unreasonable effort. This is due to the inherentdifficulty of forecasting the timing and amount of certain items, such as, but not limited to, (a) business acquisition and integration expenses, (b) merger costs, and (c) certain legal and other settlements and related costs. Each of such adjustments has not yet occurred, are out of the Company's control and/or cannot be reasonably predicted. For the same reasons, the Company is unable to address the probable significance of the unavailable information.
General Disclosure
222
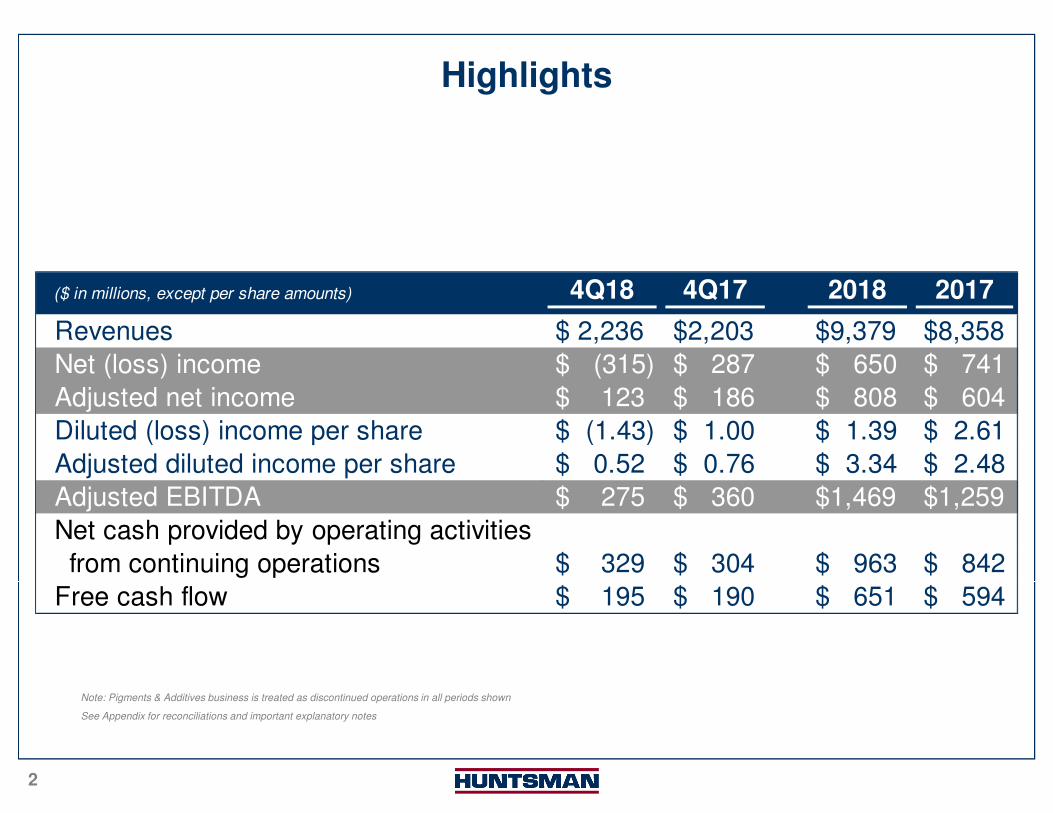
Note: Pigments & Additives business is treated as discontinued operations in all periods shown
See Appendix for reconciliations and important explanatory notes
Highlights
($ in millions, except per share amounts) 4Q18 4Q17 2018 2017
Revenues $ 2,236 $2,203 $9,379 $8,358
Net (loss) income $ (315) $ 287 $ 650 $ 741
Adjusted net income $ 123 $ 186 $ 808 $ 604
Diluted (loss) income per share $ (1.43) $ 1.00 $ 1.39 $ 2.61
Adjusted diluted income per share $ 0.52 $ 0.76 $ 3.34 $ 2.48
Adjusted EBITDA $ 275 $ 360 $1,469 $1,259
Net cash provided by operating activities
from continuing operations $ 329 $ 304 $ 963 $ 842
Free cash flow $ 195 $ 190 $ 651 $ 594

333
$169
$294
$247
14%
24%
18%16%
26%
20%
10%
15%
20%
25%
30%
4Q18 4Q17 3Q18
Y/Y � 43% Q/Q � 32%
PolyurethanesFourth Quarter 2018
Price: Local
(1)Price: FX
(1)Mix & Other
Volume(2)
Y/Y � 7% � 2% --- � 7%
Q/Q � 6% � 1% � 1% � 3%
Q/Q(4) � 6% � 1% --- � 7%
$1,204 $1,227$1,355
4Q18 4Q17 3Q18
MDI Urethanes MTBE
$ in millions $ in millions
Current Quarter+ Total MDI volumes grew 5% Y/Y+ Stable differentiated MDI margins– Destocking resulted in differentiated business down 1% Y/Y– Lower component MDI and MTBE margins
2019 Outlook+ Continued growth and stable margins in differentiated business+ Benefit of new capacity in China+ Continued globalization of recent acquisitions– Lower component MDI and MTBE margins– Some currency headwinds
(1) Excludes sales from tolling, by-products and raw materials.(2) Excludes sales volumes of by-products and raw materials.(3) Excludes MTBE.(4) Pro forma adjusted for the 3Q18 Rotterdam outages onset by 3rd party constraints.
Adjusted EBITDARevenues
Sales Factors Highlights
Y/Y � 2% Q/Q � 11%Adjusted PU EBITDA MarginAdjusted MDI Urethanes EBITDA Margin(3)
MDI Urethanes MTBE

44
6% 6% 6%
3%
16%17%
15%13%
6%
-1%
3Q16 4Q16 1Q17 2Q17 3Q17 4Q17 1Q18 2Q18 3Q18 4Q18
Differentiated
Component
Huntsman MDI Overview
• Current global effective operating rates in mid-80s
• Differentiated margins stable despite destocking
• Exposure to component pricing largely contained to subset of China and Europe
• Component MDI pricing (YoY):
– China declined by ~55%
– Europe declined by ~45%
– US exposure minimal
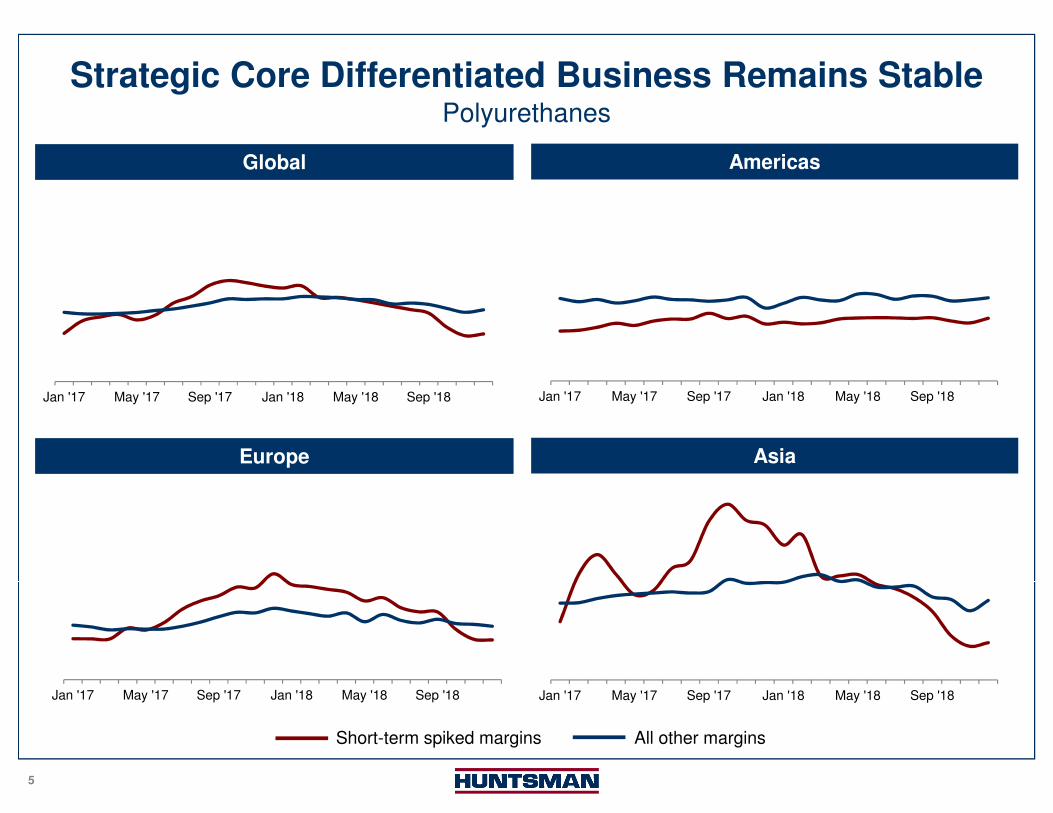
Margin Spike Gone, But Downstream Core StableIndustry Status
Huntsman Q4 Performance by Region (YoY) Focus on Differentiated Volumes
Destocking and lower demand led to 4Q18 decline in differentiated volumes, but margins remained stable
$175
~$85
$175
4Q17 MDIUrethanesEBITDA
Short-termspike
LowerIndustry
Utilization
Fixed Costs,FX & Other
Destocking VolumeGrowth
4Q18 MDIUrethanesEBITDA
China expansion and Demilec acquisition offset soft markets
and destocking
• Americas
– Growth attributable to Demilec acquisition and adhesives and elastomers
– Partially offset by destocking in CWP
• Europe
– Volume declines due to significant destocking and customer order cancelations in certain markets, such as insulation and adhesives
• Asia
– Growth was driven by capacity expansion at our Caojing JV
China expansion
Industry operating rates and polymeric MDI pricing at 2016 levels
555
Strategic Core Differentiated Business Remains Stable
Global Americas
Europe Asia
Polyurethanes
Jan '17 May '17 Sep '17 Jan '18 May '18 Sep '18 Jan '17 May '17 Sep '17 Jan '18 May '18 Sep '18
Jan '17 May '17 Sep '17 Jan '18 May '18 Sep '18Jan '17 May '17 Sep '17 Jan '18 May '18 Sep '18
Short-term spiked margins All other margins
666
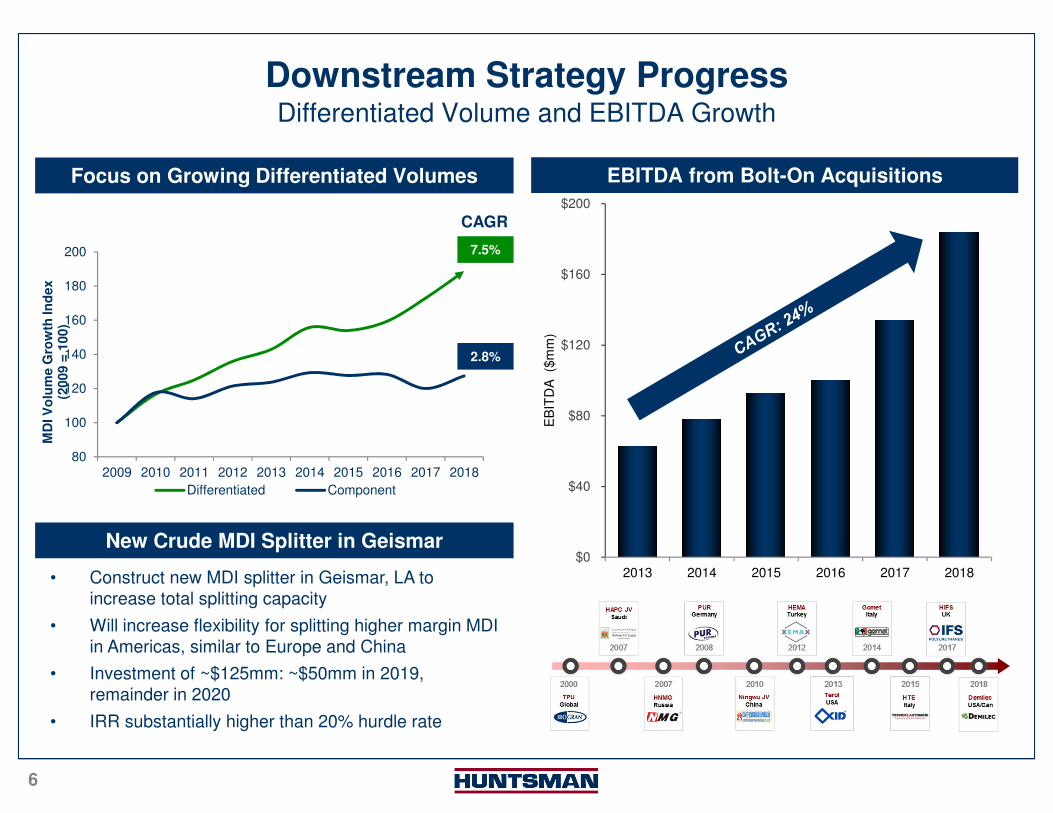
Downstream Strategy Progress
Focus on Growing Differentiated Volumes EBITDA from Bolt-On Acquisitions
Differentiated Volume and EBITDA Growth
$0
$40
$80
$120
$160
$200
2013 2014 2015 2016 2017 2018
EB
ITD
A ($
mm
)
80
100
120
140
160
180
200
2009 2010 2011 2012 2013 2014 2015 2016 2017 2018
MD
I V
olu
me G
row
th In
dex
(2009 =
100)
Differentiated Component
7.5%
2.8%
CAGR
New Crude MDI Splitter in Geismar
• Construct new MDI splitter in Geismar, LA to increase total splitting capacity
• Will increase flexibility for splitting higher margin MDI in Americas, similar to Europe and China
• Investment of ~$125mm: ~$50mm in 2019, remainder in 2020
• IRR substantially higher than 20% hurdle rate

777
$78 $74
$93
14%
9%
16%13%
0%
5%
10%
15%
20%
25%
30%
4Q18 4Q17 3Q18
Derivatives Upstream Intermediates & Other
(3)
$560 $514
$599
4Q18 4Q17 3Q18
Derivatives Upstream Intermediates
Y/Y � 9% Q/Q � 7% Y/Y � 66% Q/Q � 16%
Performance ProductsFourth Quarter 2018
Price: Local
(1)Price: FX
(1)Mix & Other
Volume(2)
Y/Y � 3% � 1% � 8% � 15%
Y/Y(3) � 6% � 1% � 3% � 2%
Q/Q ---- ---- � 2% � 2%
$ in millions$ in millions
Current Quarter+ Solid specialty amines and maleic anhydride margins+ Favorable comparisons versus prior year – Lower amine margins in global wind markets due to competition– Softening ethylene glycol margins
2019 Outlook+ Growth in downstream portfolio of specialty amines and surfactants+ Continued stable margin in derivatives– Lower upstream intermediate margins
Adjusted EBITDARevenues
Sales Factors Highlights
Adjusted EBITDA Margin
(1) Excludes sales from tolling, by-products and raw materials.(2) Excludes sales volumes of by-products and raw materials.(3) Pro forma adjusted to exclude the impact of weather related and other outages in 4Q17.
Pro Forma Adj. EBITDA Margin(3)
$47
Planned T&I, weather related and other outages
888
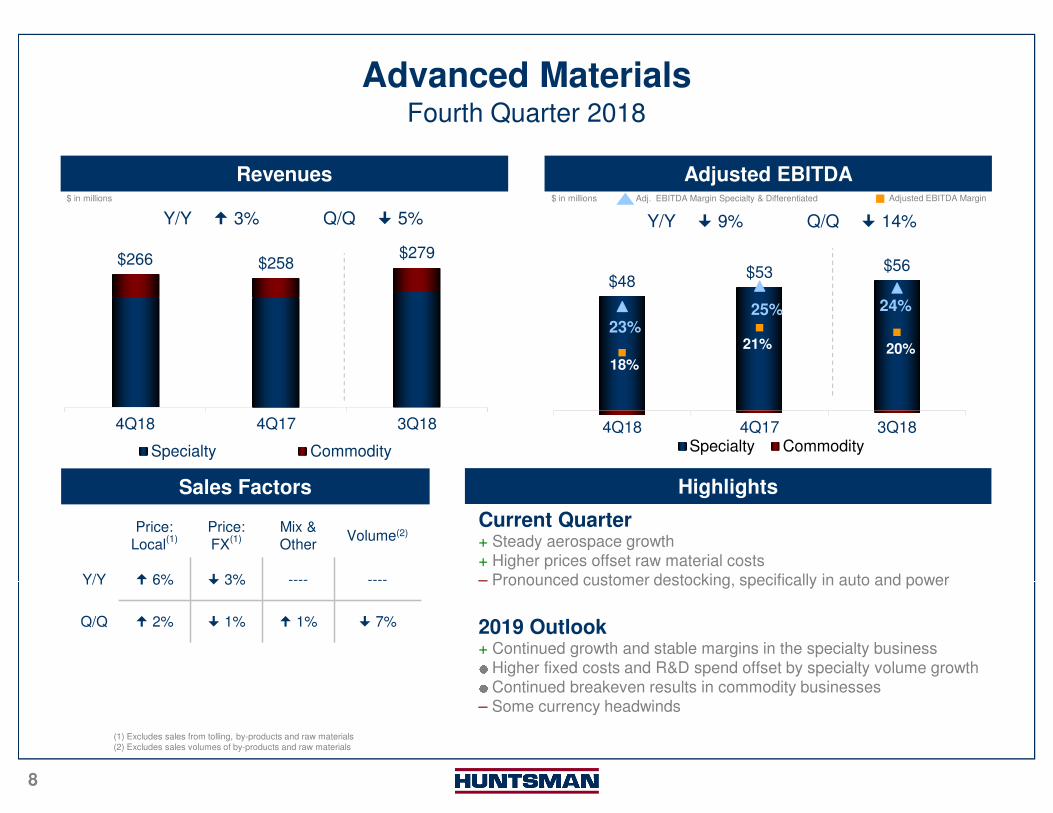
$266 $258$279
4Q18 4Q17 3Q18
Specialty Commodity
$48$53 $56
18%
21% 20%
23%25% 24%
10%
12%
14%
16%
18%
20%
22%
24%
26%
4Q18 4Q17 3Q18Specialty Commodity
Advanced MaterialsFourth Quarter 2018
Price: Local
(1)Price: FX
(1)Mix & Other
Volume(2)
Y/Y � 6% � 3% ---- ----
Q/Q � 2% � 1% � 1% � 7%
$ in millions $ in millions
Current Quarter+ Steady aerospace growth+ Higher prices offset raw material costs– Pronounced customer destocking, specifically in auto and power
2019 Outlook+ Continued growth and stable margins in the specialty business●Higher fixed costs and R&D spend offset by specialty volume growth●Continued breakeven results in commodity businesses– Some currency headwinds
(1) Excludes sales from tolling, by-products and raw materials(2) Excludes sales volumes of by-products and raw materials
Adjusted EBITDARevenues
Sales Factors Highlights
Y/Y � 3% Q/Q � 5% Y/Y � 9% Q/Q � 14%
Adjusted EBITDA MarginAdj. EBITDA Margin Specialty & Differentiated

999
Textile EffectsFourth Quarter 2018
Price: Local
(1)Price: FX
(1)Mix & Other
Volume(2)
Y/Y � 15% � 3% � 4% � 6%
Q/Q � 1% � 1% � 1% � 4%
$21$19
$25
11% 10%12%
4Q18 4Q17 3Q18
$193 $190 $204
4Q18 4Q17 3Q18
$ in millions $ in millions
Current Quarter+ Specialty products up 6% Y/Y + 13 straight quarters YOY EBITDA growth– Destocking and trade uncertainty impacted overall volumes
2019 Outlook+ Continued EBITDA growth+ Sustainable solutions drive specialty and differentiated margins and
volume growth– Higher raw material costs due to continued China regulatory
enforcements on certain dye ranges
(1) Excludes sales from tolling, by-products and raw materials(2) Excludes sales volumes of by-products and raw materials
Adjusted EBITDARevenues
Sales Factors Highlights
Y/Y � 2% Q/Q � 5% Y/Y � 11% Q/Q � 16%
Adjusted EBITDA Margin
1010
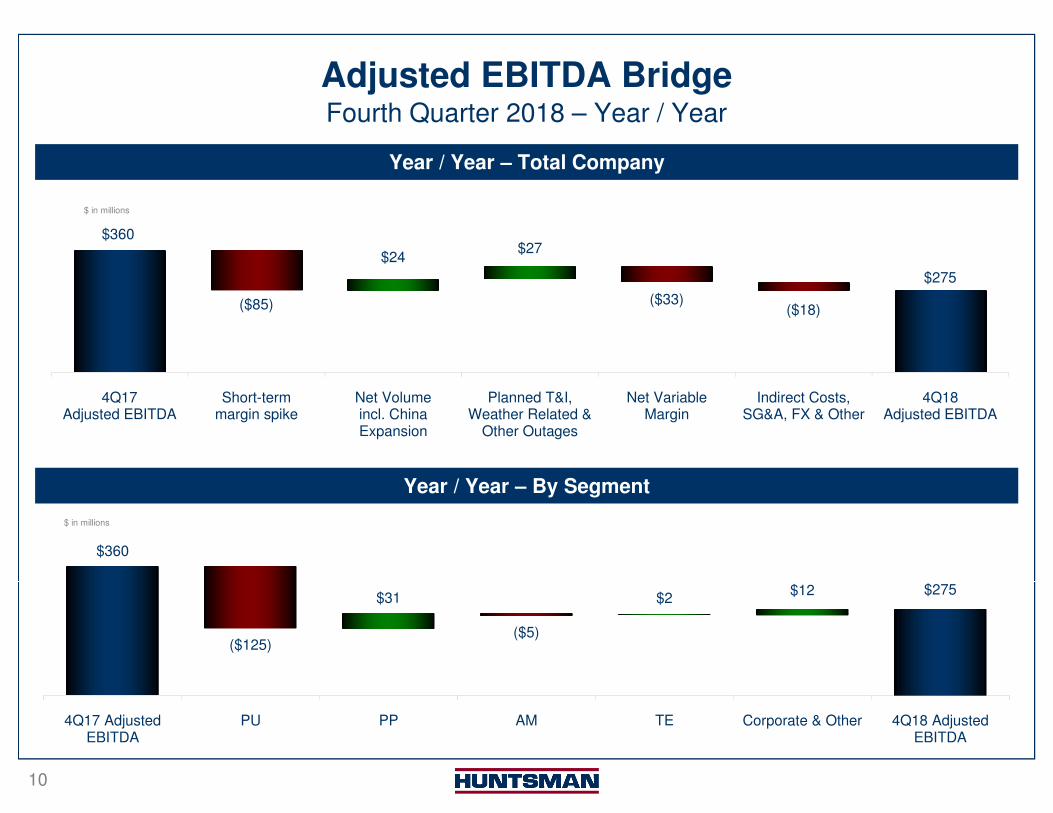
Adjusted EBITDA Bridge
Year / Year – Total Company
Year / Year – By Segment
Fourth Quarter 2018 – Year / Year
$360
$275
($125)($5)
$31 $2 $12
4Q17 AdjustedEBITDA
PU PP AM TE Corporate & Other 4Q18 AdjustedEBITDA
$ in millions
$360
$275
($85) ($33)($18)
$24 $27
4Q17Adjusted EBITDA
Short-termmargin spike
Net Volumeincl. ChinaExpansion
Planned T&I,Weather Related &
Other Outages
Net VariableMargin
Indirect Costs,SG&A, FX & Other
4Q18Adjusted EBITDA
$ in millions

111111
44%40% 40% ~40%
66%
47%44%
2016 2017 2018 Forward Target
Finance and Cash ConsiderationsAnnual Free Cash Flow Conversion Target ~40% Liquidity, Debt & Cash Considerations
Consistent Strong Free Cash Flow Conversion
• Liquidity
– $1,525mm combined cash and available borrowing capacity
– 2019 expected capital expenditures of $390mm incl. $50mm for Geismar splitter
• Taxes
– 2018 Adj. effective tax rate 19%
– Forward rate range 22%-24%
• Other
– 2018 share repurchases of $276mm, or approximately 10.4mm shares under $1bn authorized share repurchase program
– Deconsolidation of Venator and elimination of related noncontrolling interest
Note: All periods exclude Pigments & Additives business
3.8x 3.4x
1.4x 1.3x
0.0x
1.0x
2.0x
3.0x
4.0x
$0.0
$1.0
$2.0
$3.0
$4.0
$5.0
2015 2016 2017 2018Net Debt Net Debt/EBITDA
Investment Grade Metrics Maintained$ in billions
Net Debt / EBITDA
$ in millions 4Q18 4Q17 2018 2017
Adjusted EBITDA 275$ 360$ 1,469$ 1,259$
Capital expenditures, net (129) (121) (305) (279)
Cash interest (44) (47) (117) (169)
Cash income taxes (24) (45) (141) (9)
Primary working capital change 146 38 (91) (133)
Restructuring (4) (10) (11) (36)
Pension (30) (26) (125) (111)
Maintenance & other 5 41 (28) 72
Free Cash Flow 195$ 190$ 651$ 594$
One-time working capital release
One-time tax
refund
One-time China cash
mgmt. improvement

121212
Differentiated Adjusted EBITDA(1)
Annual(1) Fourth Quarter(1)
(1) Excludes MTBE and Olefins
(2) Excludes European surfactants business, which was sold to Innospec on December 30, 2016
Adjusted EBITDA Margin
9%
13%
10%
14%
11%
17%
14%
14%
4Q12⁽²⁾ 4Q13⁽²⁾ 4Q14⁽²⁾ 4Q15⁽²⁾ 4Q16⁽²⁾ 4Q17 4Q18
Margin SpikeDifferentiated Adj. EBITDA excl. Margin Spike Adj. EBITDA Margin Adj. EBITDA Margin excl. Margin Spike
9%
10%
11%
14%14%
16%
17%
15%
16%
2012⁽²⁾ 2013⁽²⁾ 2014⁽²⁾ 2015⁽²⁾ 2016⁽²⁾ 2017 2018
Margin SpikeDifferentiated Adj. EBITDA excl. Margin Spike Adj. EBITDA Margin Adj. EBITDA Margin excl. Margin Spike
1313
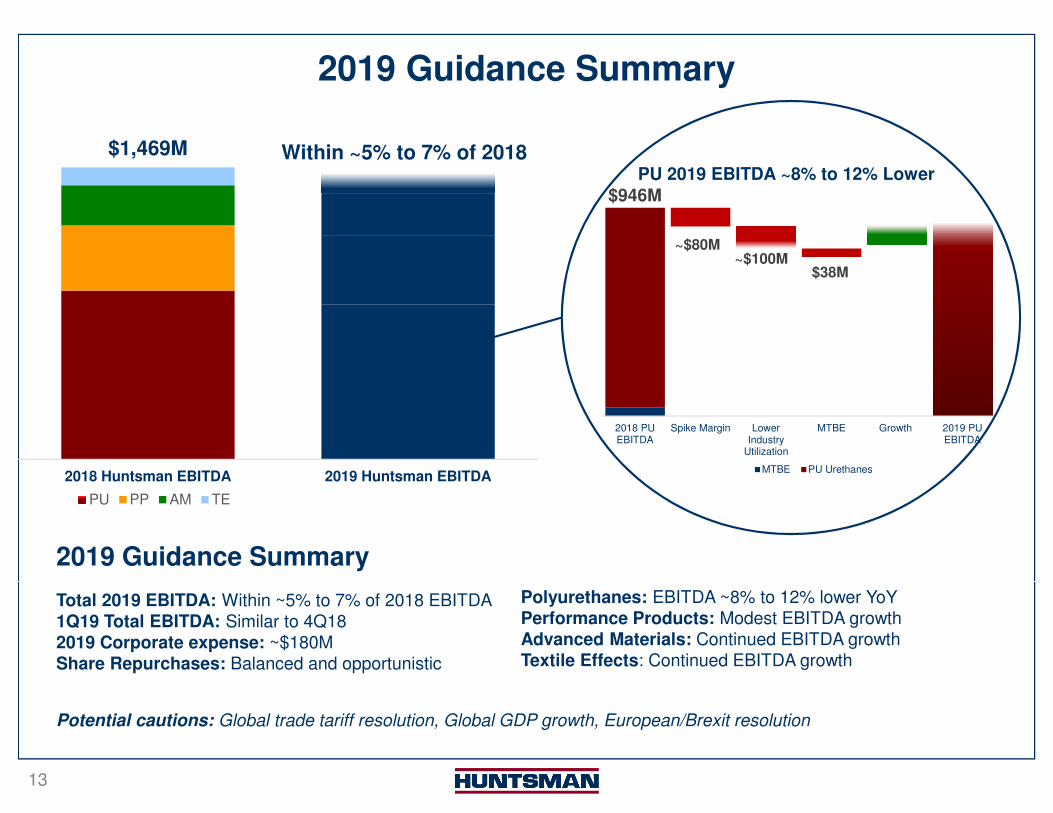
2019 Guidance Summary
2018 Huntsman EBITDA 2019 Huntsman EBITDA
PU PP AM TE
$1,469M Within ~5% to 7% of 2018
$946M
~$80M~$100M
$38M
2018 PUEBITDA
Spike Margin LowerIndustry
Utilization
MTBE Growth 2019 PUEBITDA
PU 2019 EBITDA ~8% to 12% Lower
MTBE PU Urethanes
2019 Guidance Summary
Total 2019 EBITDA: Within ~5% to 7% of 2018 EBITDA1Q19 Total EBITDA: Similar to 4Q182019 Corporate expense: ~$180MShare Repurchases: Balanced and opportunistic
Polyurethanes: EBITDA ~8% to 12% lower YoYPerformance Products: Modest EBITDA growthAdvanced Materials: Continued EBITDA growthTextile Effects: Continued EBITDA growth
Potential cautions: Global trade tariff resolution, Global GDP growth, European/Brexit resolution

Appendix
151515
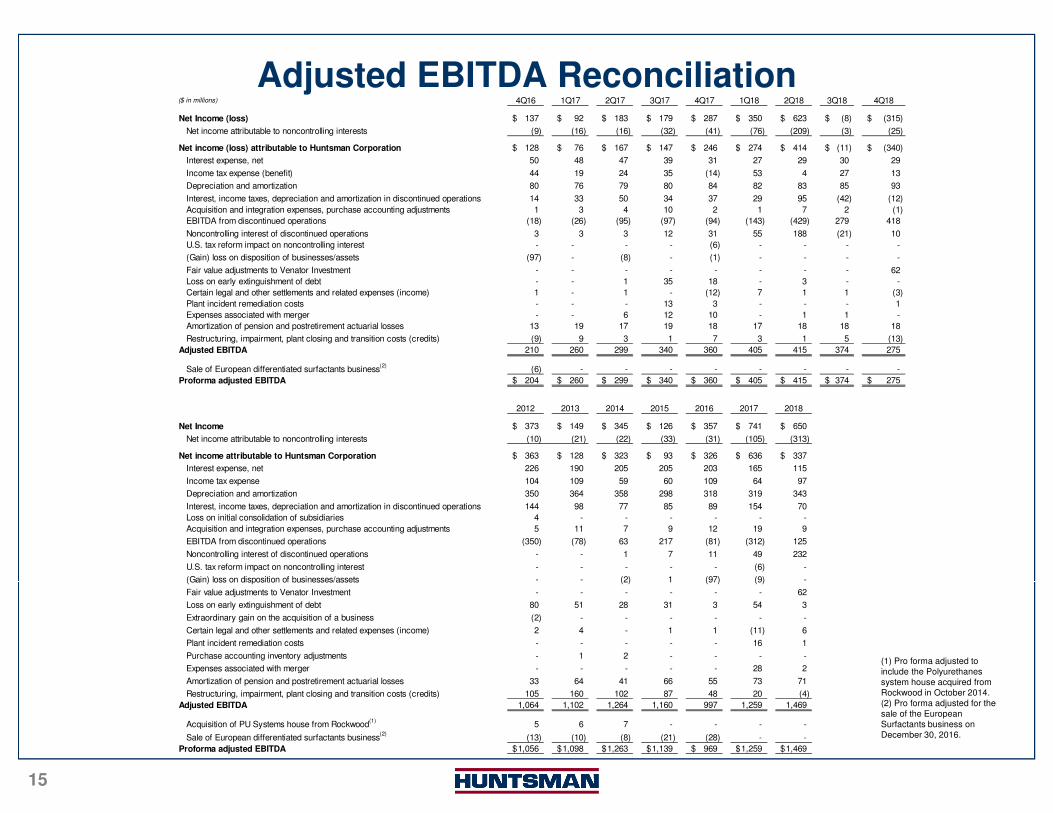
Adjusted EBITDA Reconciliation
(1) Pro forma adjusted to include the Polyurethanes system house acquired from Rockwood in October 2014.(2) Pro forma adjusted for the sale of the European Surfactants business on December 30, 2016.
($ in millions) 4Q16 1Q17 2Q17 3Q17 4Q17 1Q18 2Q18 3Q18 4Q18
Net Income (loss) 137$ 92$ 183$ 179$ 287$ 350$ 623$ (8)$ (315)$
Net income attributable to noncontrolling interests (9) (16) (16) (32) (41) (76) (209) (3) (25)
Net income (loss) attributable to Huntsman Corporation 128$ 76$ 167$ 147$ 246$ 274$ 414$ (11)$ (340)$
Interest expense, net 50 48 47 39 31 27 29 30 29
Income tax expense (benefit) 44 19 24 35 (14) 53 4 27 13
Depreciation and amortization 80 76 79 80 84 82 83 85 93
Interest, income taxes, depreciation and amortization in discontinued operations 14 33 50 34 37 29 95 (42) (12)
Acquisition and integration expenses, purchase accounting adjustments 1 3 4 10 2 1 7 2 (1)
EBITDA from discontinued operations (18) (26) (95) (97) (94) (143) (429) 279 418
Noncontrolling interest of discontinued operations 3 3 3 12 31 55 188 (21) 10
U.S. tax reform impact on noncontrolling interest - - - - (6) - - - -
(Gain) loss on disposition of businesses/assets (97) - (8) - (1) - - - -
Fair value adjustments to Venator Investment - - - - - - - - 62
Loss on early extinguishment of debt - - 1 35 18 - 3 - -
Certain legal and other settlements and related expenses (income) 1 - 1 - (12) 7 1 1 (3)
Plant incident remediation costs - - - 13 3 - - - 1
Expenses associated with merger - - 6 12 10 - 1 1 -
Amortization of pension and postretirement actuarial losses 13 19 17 19 18 17 18 18 18
Restructuring, impairment, plant closing and transition costs (credits) (9) 9 3 1 7 3 1 5 (13)
Adjusted EBITDA 210 260 299 340 360 405 415 374 275
Sale of European differentiated surfactants business(2)
(6) - - - - - - - -
Proforma adjusted EBITDA 204$ 260$ 299$ 340$ 360$ 405$ 415$ 374$ 275$
2012 2013 2014 2015 2016 2017 2018
Net Income 373$ 149$ 345$ 126$ 357$ 741$ 650$
Net income attributable to noncontrolling interests (10) (21) (22) (33) (31) (105) (313)
Net income attributable to Huntsman Corporation 363$ 128$ 323$ 93$ 326$ 636$ 337$
Interest expense, net 226 190 205 205 203 165 115
Income tax expense 104 109 59 60 109 64 97
Depreciation and amortization 350 364 358 298 318 319 343
Interest, income taxes, depreciation and amortization in discontinued operations 144 98 77 85 89 154 70
Loss on initial consolidation of subsidiaries 4 - - - - - -
Acquisition and integration expenses, purchase accounting adjustments 5 11 7 9 12 19 9
EBITDA from discontinued operations (350) (78) 63 217 (81) (312) 125
Noncontrolling interest of discontinued operations - - 1 7 11 49 232
U.S. tax reform impact on noncontrolling interest - - - - - (6) -
(Gain) loss on disposition of businesses/assets - - (2) 1 (97) (9) -
Fair value adjustments to Venator Investment - - - - - - 62
Loss on early extinguishment of debt 80 51 28 31 3 54 3
Extraordinary gain on the acquisition of a business (2) - - - - - -
Certain legal and other settlements and related expenses (income) 2 4 - 1 1 (11) 6
Plant incident remediation costs - - - - - 16 1
Purchase accounting inventory adjustments - 1 2 - - - -
Expenses associated with merger - - - - - 28 2
Amortization of pension and postretirement actuarial losses 33 64 41 66 55 73 71
Restructuring, impairment, plant closing and transition costs (credits) 105 160 102 87 48 20 (4)
Adjusted EBITDA 1,064 1,102 1,264 1,160 997 1,259 1,469
Acquisition of PU Systems house from Rockwood(1)
5 6 7 - - - -
Sale of European differentiated surfactants business(2)
(13) (10) (8) (21) (28) - -
Proforma adjusted EBITDA 1,056$ 1,098$ 1,263$ 1,139$ 969$ 1,259$ 1,469$
161616
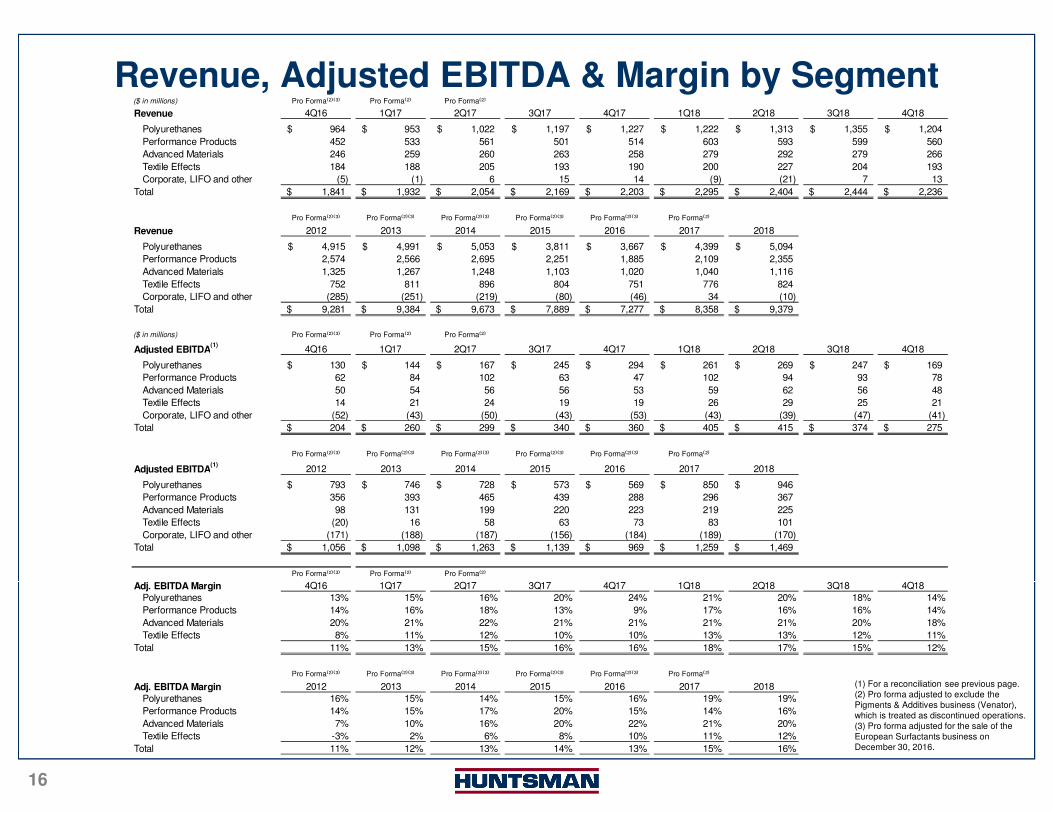
Revenue, Adjusted EBITDA & Margin by Segment
(1) For a reconciliation see previous page.(2) Pro forma adjusted to exclude the Pigments & Additives business (Venator), which is treated as discontinued operations.(3) Pro forma adjusted for the sale of the European Surfactants business on December 30, 2016.
($ in millions) Pro Forma⁽²⁾⁽³⁾ Pro Forma⁽²⁾ Pro Forma⁽²⁾
Revenue 4Q16 1Q17 2Q17 3Q17 4Q17 1Q18 2Q18 3Q18 4Q18
Polyurethanes 964$ 953$ 1,022$ 1,197$ 1,227$ 1,222$ 1,313$ 1,355$ 1,204$
Performance Products 452 533 561 501 514 603 593 599 560
Advanced Materials 246 259 260 263 258 279 292 279 266
Textile Effects 184 188 205 193 190 200 227 204 193
Corporate, LIFO and other (5) (1) 6 15 14 (9) (21) 7 13
Total 1,841$ 1,932$ 2,054$ 2,169$ 2,203$ 2,295$ 2,404$ 2,444$ 2,236$
Pro Forma⁽²⁾⁽³⁾ Pro Forma⁽²⁾⁽³⁾ Pro Forma⁽²⁾⁽³⁾ Pro Forma⁽²⁾⁽³⁾ Pro Forma⁽²⁾⁽³⁾ Pro Forma⁽²⁾
Revenue 2012 2013 2014 2015 2016 2017 2018
Polyurethanes 4,915$ 4,991$ 5,053$ 3,811$ 3,667$ 4,399$ 5,094$
Performance Products 2,574 2,566 2,695 2,251 1,885 2,109 2,355
Advanced Materials 1,325 1,267 1,248 1,103 1,020 1,040 1,116
Textile Effects 752 811 896 804 751 776 824
Corporate, LIFO and other (285) (251) (219) (80) (46) 34 (10)
Total 9,281$ 9,384$ 9,673$ 7,889$ 7,277$ 8,358$ 9,379$
($ in millions) Pro Forma⁽²⁾⁽³⁾ Pro Forma⁽²⁾ Pro Forma⁽²⁾
Adjusted EBITDA(1)
4Q16 1Q17 2Q17 3Q17 4Q17 1Q18 2Q18 3Q18 4Q18
Polyurethanes 130$ 144$ 167$ 245$ 294$ 261$ 269$ 247$ 169$
Performance Products 62 84 102 63 47 102 94 93 78
Advanced Materials 50 54 56 56 53 59 62 56 48
Textile Effects 14 21 24 19 19 26 29 25 21
Corporate, LIFO and other (52) (43) (50) (43) (53) (43) (39) (47) (41)
Total 204$ 260$ 299$ 340$ 360$ 405$ 415$ 374$ 275$
Pro Forma⁽²⁾⁽³⁾ Pro Forma⁽²⁾⁽³⁾ Pro Forma⁽²⁾⁽³⁾ Pro Forma⁽²⁾⁽³⁾ Pro Forma⁽²⁾⁽³⁾ Pro Forma⁽²⁾
Adjusted EBITDA(1)
2012 2013 2014 2015 2016 2017 2018
Polyurethanes 793$ 746$ 728$ 573$ 569$ 850$ 946$
Performance Products 356 393 465 439 288 296 367
Advanced Materials 98 131 199 220 223 219 225
Textile Effects (20) 16 58 63 73 83 101
Corporate, LIFO and other (171) (188) (187) (156) (184) (189) (170)
Total 1,056$ 1,098$ 1,263$ 1,139$ 969$ 1,259$ 1,469$
Pro Forma⁽²⁾⁽³⁾ Pro Forma⁽²⁾ Pro Forma⁽²⁾
Adj. EBITDA Margin 4Q16 1Q17 2Q17 3Q17 4Q17 1Q18 2Q18 3Q18 4Q18
Polyurethanes 13% 15% 16% 20% 24% 21% 20% 18% 14%
Performance Products 14% 16% 18% 13% 9% 17% 16% 16% 14%
Advanced Materials 20% 21% 22% 21% 21% 21% 21% 20% 18%
Textile Effects 8% 11% 12% 10% 10% 13% 13% 12% 11%
Total 11% 13% 15% 16% 16% 18% 17% 15% 12%
Pro Forma⁽²⁾⁽³⁾ Pro Forma⁽²⁾⁽³⁾ Pro Forma⁽²⁾⁽³⁾ Pro Forma⁽²⁾⁽³⁾ Pro Forma⁽²⁾⁽³⁾ Pro Forma⁽²⁾
Adj. EBITDA Margin 2012 2013 2014 2015 2016 2017 2018
Polyurethanes 16% 15% 14% 15% 16% 19% 19%
Performance Products 14% 15% 17% 20% 15% 14% 16%
Advanced Materials 7% 10% 16% 20% 22% 21% 20%
Textile Effects -3% 2% 6% 8% 10% 11% 12%
Total 11% 12% 13% 14% 13% 15% 16%