Embed Size (px)
Citation preview

2013 No. 055
Application of End-of-Course Cut Scores to 2013 End-of-Course (EOC) Student Data
Prepared for: Kentucky Department of Education Capital Plaza Tower, 17th Floor 500 Mero Street Frankfort, KY 40601
Authors: Arthur A. Thacker
Emily R. Dickinson Date: August 21, 2013


2013 No. 055
Application of End-of-Course Cut Scores to 2013 End-of-Course (EOC) Student Data
Prepared for: Kentucky Department of Education Capital Plaza Tower, 17th Floor 500 Mero Street Frankfort, KY 40601
Authors: Arthur A. Thacker
Emily R. Dickinson Date: August 21, 2013


Application of End-of-Course Cut Scores to 2013 End-of-Course (EOC) Student Data
Application of End-of-Course Cut Scores to 2013 End-of-Course (EOC) Student Data
Executive Summary
The Kentucky Department of Education (KDE) asked the Human Resources Research
Organization (HumRRO) to apply cut scores set in 2012 to the 2013 administration of the End-of-Course (EOC) exams. HumRRO applied the cut scores to the student data and compared the resulting distribution to two other distributions: ACT data that was used to help establish the cut scores as well as the 2012 EOC student data.
Based on a comparison of these distributions, HumRRO determined that modifications to the cut scores should not be necessary barring a substantial shift in assessment policy, as the distribution of students among the NAPD categories in 2013 closely mirrored both the original ACT distribution and the distribution of 2012 students. Differences between the distributions were small and not systematic in terms of the direction of the differences. Differences that did stand out were anticipated by content experts in US History and Biology and likely represent a shift in course content to better match current standards.

Application of End-of-Course Cut Scores to 2013 End-of-Course (EOC) Student Data
Application of End-of-Course Cut Scores to 2013 End-of-Course (EOC) Student Data
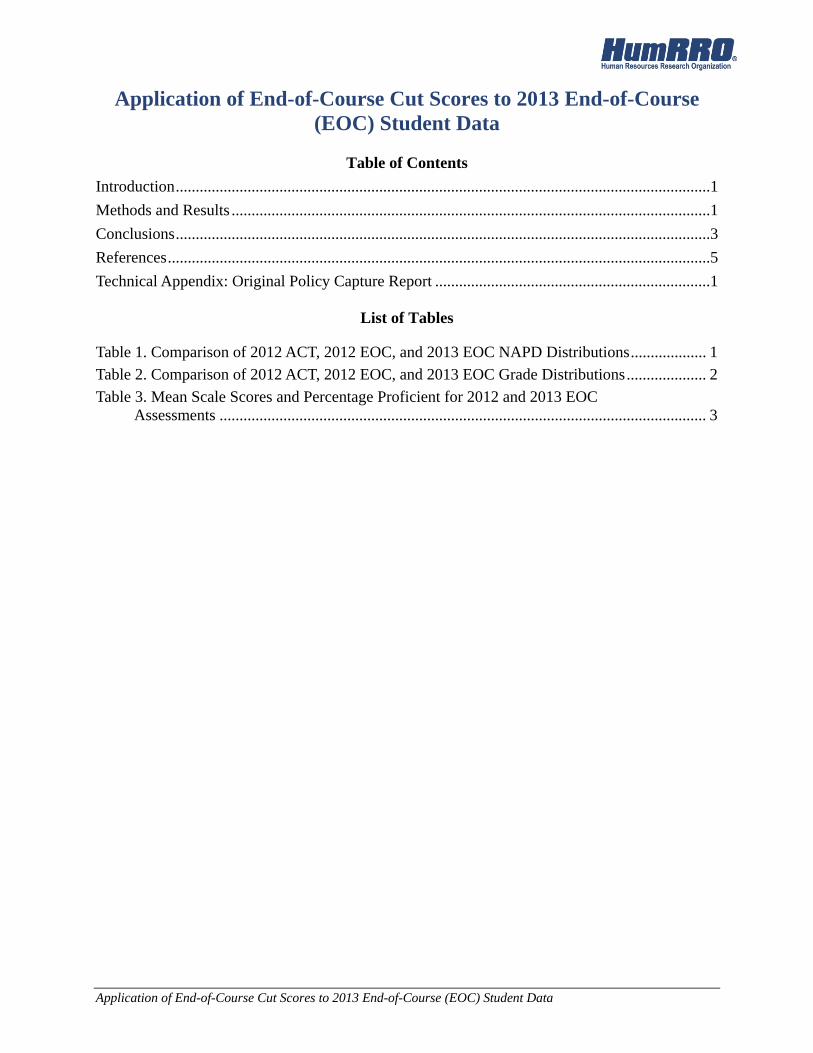
Table of Contents
Introduction ......................................................................................................................................1
Methods and Results ........................................................................................................................1
Conclusions ......................................................................................................................................3
References ........................................................................................................................................5
Technical Appendix: Original Policy Capture Report .....................................................................1
List of Tables
Table 1. Comparison of 2012 ACT, 2012 EOC, and 2013 EOC NAPD Distributions ................... 1
Table 2. Comparison of 2012 ACT, 2012 EOC, and 2013 EOC Grade Distributions .................... 2
Table 3. Mean Scale Scores and Percentage Proficient for 2012 and 2013 EOC Assessments .......................................................................................................................... 3


Application of End-of-Course Cut Scores to 2013 End-of-Course (EOC) Student Data
Introduction
The Kentucky Department of Education (KDE) asked the Human Resources Research Organization (HumRRO) to apply cut scores established in 2012 to the 2013 End-of-Course (EOC) student data. HumRRO applied the cut scores and compared the resulting distribution to two other distributions: the ACT data that was used to establish the cut scores as well as the 2012 EOC student data.
Methods and Results
The first step was to assign students into NAPD categories by applying cut scores derived from the policy capture focus group results to the 2012 and 2013 student data. Next, the percentage of students in each category was calculated. These percentages are presented in Table 1, along with the expected percentages of students based on the ACT results panelists used as a reference during the focus group. The ACT percentages are based on ranges of ACT scores that roughly correspond to the EOC categories of Novice, Apprentice, Proficient, and Distinguished (NAPD) categories. Table 1. Comparison of 2012 ACT, 2012 EOC, and 2013 EOC NAPD Distributions
Subject D P A N English II 162-above 154-161 152-153 151-below
ACT 11.4 40.8 10.7 37.1 2012 12.4 42.1 10.1 35.4 2013 10.6 45.4 9.8 34.2
Algebra II 153-above 148-152 143-147 142-below ACT 7.3 31.3 36.2 25.1 2012 6.8 29.1 36.5 27.7 2013 8.4 27.6 39.1 25.0
Biology 161-above 154-160 146-153 145-below ACT 6.2 23.4 44.5 25.9 2012 6.1 24.1 45.6 24.2 2013 8.0 28.2 43.6 20.2
US History 154-above 147-153 144-146 143-below ACT 12.9 29.0 25.2 32.9 2012 11.3 32.9 22.4 33.4 2013 15.9 35.6 16.6 32.0
As Table 1 shows, percentages in each category were similar across the three
distributions. Differences between the 2012 and 2013 EOC percentages range from absolute values of 0.3 to 5.8. The largest differences were observed in Biology and US History, though this was expected based on comments made by content experts from this panel and a previous examination of EOC content compared to Kentucky standards (see Thacker, Taylor, Koger & Bynum, 2011). Kentucky courses in Biology and US History have traditionally taught somewhat different content than the content tested on the EOC exams. The high school US History course has focused on post-Civil War history, while the students receive instruction on the prior time

2 Policy Capture for Setting End-of-Course and Kentucky Performance Rating for Educational Progress (K-PREP) Cut Scores
periods in Grade 8. It was expected that high school teachers would at least review the prior content once the test was in place. Similarly, the content of the Biology course students took in high school may not have addressed all of the content included on the EOC. For example, the EOC may contain specific questions related to botany or anatomy that Kentucky students would be expected to receive in later courses. The content experts also mentioned that the EOC specifically tests process skills (e.g. data analysis) that might be weak in current courses. Cut scores were also established for identifying course grades associated with EOC assessment scores. Following the procedures described above, percentages of students receiving each course grade were calculated. These results are presented in Table 2. Table 2. Comparison of 2012 ACT, 2012 EOC, and 2013 EOC Grade Distributions
Subject A B C D F
English II 160-above 154-159 152-153 141-151 140-below
ACT 21.7 30.5 10.7 2012 20.4 34.1 10.1 32.3 3.1 2013 19.2 36.9 9.8 30.8 3.3
Algebra II 151-above 148-150 143-147 138-142 137-below
ACT 18.2 20.4 36.2 2012 16.2 19.6 36.5 24.5 3.2 2013 16.3 19.7 39.1 21.4 3.6
Biology 157-above 154-156 146-153 140-145 139-below
ACT 18.1 11.6 44.5 2012 18.0 12.2 45.6 20.9 3.3 2013 22.7 13.5 43.6 17.3 2.9
US History 151-above 147-150 144-146 139-143 138-below
ACT 21.0 20.9 25.2 2012 23.2 21.1 22.4 29.2 4.1 2013 26.9 24.6 16.6 28.7 3.3
Note: Cuts for D and F were a policy decision and not based on the methodology used to set the other cut scores.
Similar to the NAPD distributions, Table 2 shows that the distributions of students by course grades were similar across the subject areas. Again, the largest differences were observed in Biology and US History. Shifts in the percentage of students falling into proficiency categories could cause concerns among stakeholders, who may perceive fewer numbers of students in a higher category as indicative of an overall decrease in student performance. To address overall trends in student performance between 2012 and 2013, the mean EOC scores for each content area were calculated, along with the percent scoring proficient or above each year. Table 3 depicts these results and shows that average student performance across the two years was quite stable. Given the stability of mean scores, changes in proportions of students in each proficiency category may be more indicative of the coarseness of the scale than substantial changes in student performance.

Application of End-of-Course Cut Scores to 2013 End-of-Course (EOC) Student Data
Table 3. Mean Scale Scores and Percentage Proficient for 2012 and 2013 EOC Assessments
2012 2013 Mean SD % Proficient Mean SD % Proficient English II 153.74 6.71 54.5 153.76 6.64 54.2 Algebra II 145.75 4.70 35.8 145.92 4.87 34.8 Biology 150.12 6.29 30.2 151.23 6.42 35.1 US History 146.41 5.48 44.2 147.15 5.64 50.0
Conclusions
Based on these results, HumRRO determined that modifications to the cut scores would not be necessary. Student distributions remained stable and in line with the originally referenced ACT distributions and any differences of note were anticipated by content experts. Barring substantial changes in assessment policy, revisiting the existing cut scores is not necessary. In the next year, when a substantial portion of students taking all of the EOC exams will have ACT scores for comparison, standards will be further validated by examining how well EOC scores predict ACT performance.


Application of End-of-Course Cut Scores to 2013 End-of-Course (EOC) Student Data
References
Thacker, A. A., Taylor, L. R., Koger, L. E. & Bynum B. H. (2011). End of Course Assessment Alignment Study: Vendor U.S. History and Biology Items to Kentucky Core Content Standards for Social Studies and Science, Vendor English 2 and Algebra 2 Items to Common Core Standards in English Language Arts and Mathematics. Alexandria, VA: Human Resources Research Organization.


Application of End-of-Course Cut Scores to 2013 End-of-Course (EOC) Student Data
Technical Appendix: Original Policy Capture Report

2 Application of End-of-Course Cut Scores to 2013 End-of-Course (EOC) Student Data
Introduction
The Kentucky Department of Education (KDE) asked the Human Resources Research Organization (HumRRO) to conduct a policy capture focus group among education stakeholders to recommend cut scores for high school end-of-course (EOC) exams in English II, Algebra II, U.S. History, and Biology. Kentucky uses a modified version of ACT’s Quality Core EOC assessments. ACT’s Quality Core assessments typically consist of either two separate sections of multiple-choice items, or a single section of multiple-choice items plus a section of constructed-response items. Kentucky’s version includes two sections of multiple-choice items plus a section of constructed-response items. This allows Kentucky to report quickly on the multiple-choice items while maintaining their commitment to the inclusion of constructed response items. ACT provides student-level scale scores for the multiple-choice-only items, plus a second “super scale score” on the combined test. The multiple-choice scores are nationally normed, so students receive scale scores and the percentile at which their scores rank compared to the national sample. These scores, however, do not include information for classifying students into Kentucky’s proficiency categories: Novice, Apprentice, Proficient, and Distinguished (NAPD). This study was designed to provide recommendations to KDE regarding the placement of the cut scores used to classify students. This study was informed by a prior report on setting standards for assigning student-level grades for the EOC exams (Thacker 2011). It builds on that prior study and includes modifications for assigning grades to students as well. The reevaluation of grade assignment occurred as a natural outgrowth of assigning NAPD cut scores because of the desire to send a consistent message to students. NAPD cut scores and grade cut scores were intentionally kept consistent for the EOC exams. Kentucky’s system of assessment and accountability is based on ensuring that students leave high school prepared for college or career. This study was also informed by data collected by ACT and the Council on Postsecondary Education (CPE). ACT publishes indicators (or benchmarks) for college readiness based on scores from their college admissions assessment, also called the ACT. These scores represent the prediction for how likely students are to succeed in their early college courses. CPE provides similar indicators to those from ACT, but based on data collected only from Kentucky colleges and universities. The indicators are both based on ACT scores and are very similar, but not exactly the same. The EOC assessment cut scores were intentionally linked to the CPE cut score indicators for college success. The ACT and CPE benchmarks are presented in Table 1. Table 1. Comparison of ACT and CPE Benchmarks for College Readiness EOC Exam Linked ACT Assessment ACT Benchmark CPE Benchmark
English II English 18 18
Algebra II Math 22 19
U.S. History Reading 21 20
Biology Science 24 22

Application of End-of-Course Cut Scores to 2013 End-of-Course (EOC) Student Data
As Table 1 shows, there are no ACT assessments designed to measure exactly the same content as the EOC assessments. ACT links the EOC assessments to the ACT assessments that best represent the content of the EOC in their technical documentation for the EOCs. The same links were used here. Certainly, there is additional science content beyond Biology on the ACT science assessment, but there should be a strong correlation between students’ scores on the Biology EOC and the ACT science assessment. This study, like the linking studies performed by ACT, takes advantage of these relations.
Methodology
Because this study was designed as a policy capture rather than a traditional standards setting, HumRRO began by generating several charts to illustrate the correspondence of the EOC assessments and student performance on the ACT. Because Kentucky tests all high school students on the ACT, these data were comprehensive and representative of the state student population. This information was then given to a stakeholder panel. The 12-person panel represented a wide geographic area and several roles in the education system, including school and district personnel, as well as a CPE representative. Table 2 presents a summary of the panel’s demographic characteristics. The stakeholder group met for two days in HumRRO’s Louisville, KY offices. HumRRO scientists facilitated the meeting and generated comparison or clarifying data at the panelists’ request. Table 2. Panelist Background Information (12 total panelists)
Demographic Characteristic Gender
Female 50 Male 50
Job Title Teacher 33.3
Principal 16.7 Superintendent/
Asst. Superintendent25
Other Administrative 25 Mean Yrs. in Education (SD) 20.3 (10.2) Panelists came to an early conclusion that the score of Proficient should represent college readiness, and chose to link all EOC Proficient cut scores to the ACT scores indicating college success in Kentucky higher education institutions (as calculated by CPE). It should be noted that CPE has not yet released a benchmark for science. The science benchmark reported for this study, and used by panelists, is based on an unpublished study by CPE, with calculations independently verified by HumRRO. The link to ACT was set using an equipercentile process, essentially setting the cut score at the super scale score that resulted in nearly the same proportion of students scoring at or above Proficient as scored at or above the linked ACT benchmark. Once the Proficient cut score was set, the panel used their knowledge of college entrance requirements, requirements for qualifying to take credit-bearing classes, and requirements for scholarships (and the history of students

4 Application of End-of-Course Cut Scores to 2013 End-of-Course (EOC) Student Data
receiving scholarships in their experiences), to set similar links on the ACT scale that would be meaningful to students, parents, teachers, and schools. HumRRO staff members captured the judgments of the panelists and provided impact data (percentages of students in each NAPD category) for each of their suggested options. The groups eventually reached consensus on an ACT score of 27 to indicate Distinguished and an ACT score of 16 to indicate Apprentice across all content assessments. EOC super scale score cut scores were set based on this information. The panel also considered traditional course grades for the EOC assessments. Of course, since the super scale score was not available before students completed their courses, these cut scores were necessarily set on the EOC scale scores (based on only multiple-choice items). Panelists insisted that a letter grade of B should be consistent with an NAPD score of Proficient. They did not feel the same about a letter grade of A. The panelists felt that the Distinguished category indicated even higher performance than the letter grade of A. So, while they linked Distinguished to an ACT score of 27, they linked an A with an ACT score of 24. The panelists settled on linking the C cut score to the same ACT score as the Apprentice cut score of 16. Finally, panelists agreed on linking the D cut score to an ACT score of 13 across all subjects. Lower scores were linked to a letter grade of F. It should be noted, however, that this guidance for assigning letter grades to the EOC exams does not indicate any new stakes for the EOC exams. These recommendations are for assigning letter grades to the test, not the course. It is possible for a student to fail the EOC exams and pass the course. Each school/district decides how to incorporate the EOC exams into students’ final course grades.
EOC Results
Table 3 presents example results for the English II EOC. Similar tables for the remaining EOCs are presented in the Appendix. The final column in the table, as well as the shading, depicts the cut scores and the associated percentage of students within each category. For example, an EOC super scale score of 256 is the last score for which the category of Novice would be applied. Of the sample used in this process, 35.7% would be classified as Novice using this cut score. The score of 260 is presented in bold, indicating that this is the CPE college readiness cut score.

Application of End-of-Course Cut Scores to 2013 End-of-Course (EOC) Student Data
Table 3. Cumulative Distribution of EOC English II Super Scale Scores and NAPD Categories EOC Super Scale Score % of students Cumulative % of students NAPD Category230 .01 .01 N 231 .002 .01 N 232 .01 .02 N 233 .002 .02 N 234 .03 .1 N 235 .02 .1 N 236 .1 .1 N 237 .1 .2 N 238 .2 .3 N 239 .3 .6 N 240 .3 .9 N 241 .7 1.6 N 242 1.1 2.7 N 243 1.2 3.8 N 244 .7 4.5 N 245 1.4 5.9 N 246 1.6 7.6 N 247 1.8 9.4 N 248 2.0 11.3 N 249 2.1 13.4 N 250 2.4 15.9 N 251 2.5 18.4 N 252 2.9 21.2 N 253 3.1 24.3 N 254 3.1 27.5 N 255 3.3 30.8 N 256 4.8 35.7 N 257 3.6 39.3 A 258 3.8 43.1 A 259 3.6 46.7 A 260 4.1 50.8 P 261 4.2 54.9 P 262 4.2 59.1 P 263 4.1 63.2 P 264 4.4 67.6 P 265 4.0 71.6 P 266 4.0 75.6 P 267 3.6 79.2 P 268 3.4 82.5 P (continued)

6 Application of End-of-Course Cut Scores to 2013 End-of-Course (EOC) Student Data
Table 3. Cumulative Distribution of EOC English II Super Scale Scores and NAPD Categories (continued) EOC Super Scale Score % of students Cumulative % of students NAPD Category269 3.2 85.7 P 270 2.6 88.3 P 271 2.4 90.7 D 272 1.9 92.6 D 273 1.7 94.3 D 274 0.7 95.1 D 275 1.1 96.2 D 276 0.9 97.1 D 277 0.4 97.5 D 278 0.6 98.1 D 279 0.2 98.3 D 280 0.3 98.6 D 281 0.1 98.6 D 282 0.2 98.8 D 283 0.1 98.9 D 284 0.1 99.0 D 285 0.1 99.0 D 286 0.0 99.0 D 287 0.0 99.1 D 288 0.0 99.1 D 289 0.0 99.1 D 290 0.0 99.1 D 291 0.0 99.1 D 292 0.0 99.1 D 294 0.0 99.1 D Table 4 summarizes the cut score decisions, resulting percentages of students per NAPD category, and college readiness benchmark scores calculated by CPE. Table 4. Summary of EOC Super Scale Score Ranges by NAPD Category
Subject D P A N CPE-linked College
Readiness Benchmark English II 271-above 260-270 257-259 256-below 260
% in category 10.8 41.6 11.0 36.6 Algebra II 262-above 253-261 249-252 248-below 253
% in category 6.9 33.5 33.1 26.5 Biology 268-above 259-267 251-258 250-below 259
% in category 6.8 23.8 44.6 24.9 US History 264-above 257-263 253-256 252-below 257
% in category 13.1 26.4 22.9 37.6

Application of End-of-Course Cut Scores to 2013 End-of-Course (EOC) Student Data
Table 4 provides the cut scores and percentages of students scoring in each category for the 2011-12 academic year on the super scale score (which includes both multiple-choice sections plus a section of constructed response items). Early in 2012, Kentucky decided to change its policy regarding the scoring of the EOC assessments for state-level accountability to include only the multiple-choice sections of the exams. The constructed response section will continue to be administered, but will be used for local accountability decisions. This will allow for faster reporting and potentially earlier classification of schools. It also means that NAPD cut scores must be set for the multiple-choice-only version of the assessments. Setting cut scores for the multiple-choice-only version of the EOC assessments followed the same procedures as described above. We used the panel’s recommendations to link the NAPD categories to the previously indicated ACT scores. Cut scores for NAPD categories are presented in Table 5. The percentage of students in each NAPD category is somewhat different from the percentages presented in Table 4. This is caused by differences in the scales. Students receive whole number scores, and often many students receive the same score. As seen in Table 3, often 4.0% or more students receive the same score. This means that when we assign the cut scores, we cannot do so more precisely than the precision of the scale allows. Even linking to the same ACT score, the percentages of students in each category will differ somewhat. Table 5. Summary of EOC Scale Score Ranges by NAPD Category
Subject D P A N CPE-linked College
Readiness Benchmark English II 162-above 154-161 152-153 151-below 154
% in category 12.4 42.1 10.1 35.4 Algebra II 153-above 148-152 143-147 142-below 148
% in category 6.8 29.0 36.4 27.8 Biology 161-above 154-160 146-153 145-below 154
% in category 6.1 24.1 45.5 24.4 US History 154-above 147-153 144-146 143-below 147
% in category 11.3 32.9 22.3 33.5 As mentioned earlier, an additional step in the process was to set traditional grade indicators for the EOC assessments. The panelists linked these cut scores to the ACT assessments in the same way as the NAPD cuts. The cut score for B was set the same as Proficient and the cut score for C was set the same as Apprentice. The cut score for A was linked to and ACT score of 24 (where the cut score for Distinguished was linked to a score of 27). Panelists set a cut score for D linked to an ACT score of 13. The results, including percentages of students expected to receive each grade on the EOC assessments, are presented in Table 6. These results will replace the initial guidance provided in an earlier HumRRO report (Thacker, 2011).

8 Application of End-of-Course Cut Scores to 2013 End-of-Course (EOC) Student Data
Table 6. Final EOC Scale Score Cuts for Course Grades
Subject A B C D F CPE-linked College
Readiness Benchmark
English II 160-above 154-159 152-153 141-151 140-below 154
% in category 20.4 34.0 10.1 32.2 3.3
Algebra II 151-above 148-150 143-147 138-142 137-below 148
% in category 16.2 19.6 36.4 24.4 3.4
Biology 157-above 154-156 146-153 140-145 139-below 154
% in category 18.0 12.1 45.5 20.9 3.5
US History 151-above 147-150 144-146 139-143 138-below 147
% in category 23.1 21.1 22.3 29.2 4.3
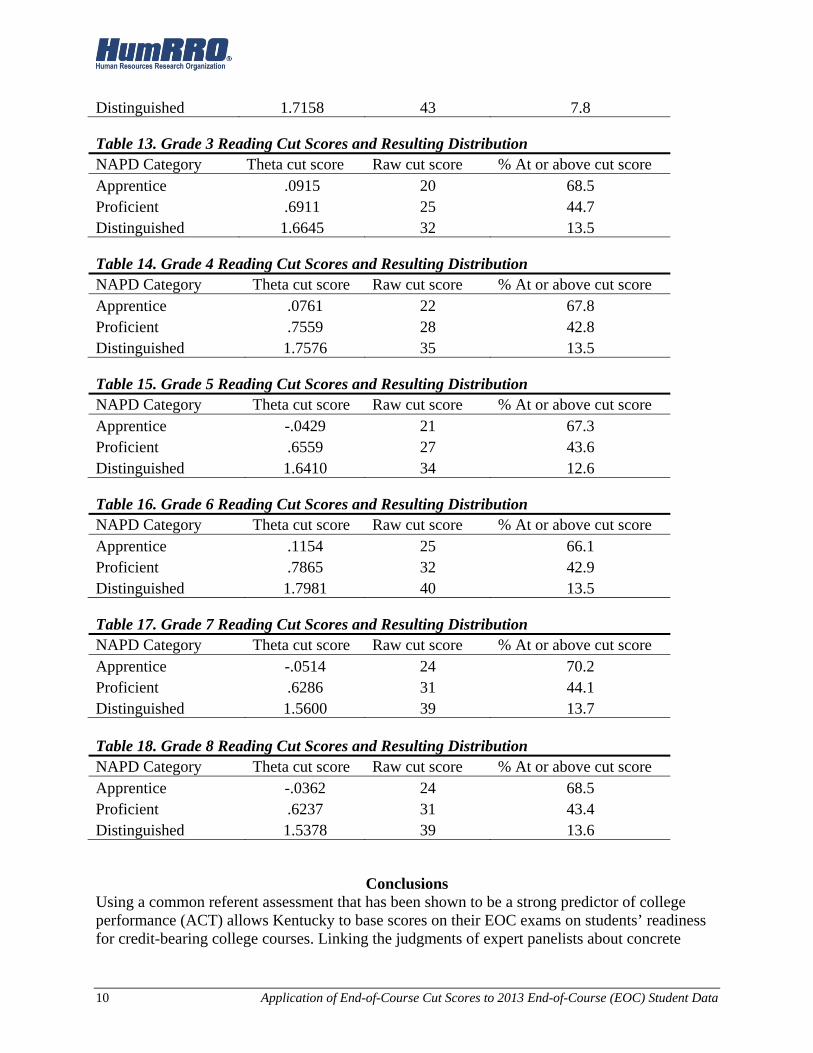
K-PREP Results Because Kentucky has designed their entire system of school accountability and student testing around college and career readiness, cut scores for the K-PREP assessments administered in Grades 3-8 should have some degree of correspondence to the EOC exams. It would not be logical for 50% of Kentucky students to be Proficient in mathematics in Grade 8, but only 20% score Proficient on the Algebra II EOC exam. This is not to say that we don’t expect there to be grade level differences or that we don’t expect growth, but the scores should be relatively consistent from grade to grade at the state level. For this reason, Kentucky chose to link the K-PREP scores for Reading and Math in Grades 3-8 to the same ACT cut scores indicated by the panelists. After investigating a logistic regression model (where the score would be set based on a prediction equation indicating that students had a 50% likelihood of scoring at or above the benchmark score on ACT), Kentucky decided on an equipercentile model. This model is the same as was used for the EOC cut scores and assumes that the same proportion of students should be in each NAPD category as in the referent test (ACT). This method was only used for Reading and Math because the Science and Social Studies assessments and standards were not changed substantially from the prior Kentucky Core Content Tests (KCCT). Kentucky decided that maintaining the trends for these two subjects, until new standards and tests are implemented, provides the most useful information for schools. Tables 7-18 contain the results of applying the equipercentile solution to Grades 3-8 Reading and Math K-PREP assessments. The tables include cut scores on the theta metric, the overall raw score (or number of total points on the assessment), and the percentage of students scoring at or above each cut score. The theta metric is difficult to interpret in isolation. It is a psychometric scale with a mean of approximately 0 and a standard deviation of approximately 1. This scale will not change from year to year as items on the assessments change and the assessments become more or less difficult. The theta scale is used to maintain consistency from year to year and cuts on this scale can be applied on any subsequent administration of K-PREP. The raw score metric will change from year to year (as new items are included and old items eliminated), but is included to indicate the range of raw scores for each category. Finally, the percentages are included to show the statewide distributions of students in each reporting category. Novice is omitted, because all students (100%) score Novice or above on the K-PREP assessments.

Application of End-of-Course Cut Scores to 2013 End-of-Course (EOC) Student Data
Like the previous discussion regarding the EOC scale score compared to the super scale score, there are differences in the precision of each grade level’s K-PREP scale. These differences account for the small percentage differences seen from grade to grade in Tables 7-18. The cut scores were determined by taking the percentage closest to the referent test (ACT) represented by a specific raw score on the K-PREP assessment. That raw score was associated with a specific percentile of students and with a theta estimate. Future K-PREP assessments will be scored based on whether a student’s theta estimate is above or below the indicated theta score. Table 7. Grade 3 Mathematics Cut Scores and Resulting Distribution NAPD Category Theta cut score Raw cut score % At or above cut score Apprentice -.1051 24 74.8 Proficient .9970 34 38.6 Distinguished 2.4321 43 6.0 Table 8. Grade 4 Mathematics Cut Scores and Resulting Distribution NAPD Category Theta cut score Raw cut score % At or above cut score Apprentice -.4514 21 74.8 Proficient .5026 31 36.2 Distinguished 1.6434 42 8.7 Table 9. Grade 5 Mathematics Cut Scores and Resulting Distribution NAPD Category Theta cut score Raw cut score % At or above cut score Apprentice -.6058 19 76.8 Proficient .4755 30 35.6 Distinguished 1.7263 41 7.8 Table 10. Grade 6 Mathematics Cut Scores and Resulting Distribution NAPD Category Theta cut score Raw cut score % At or above cut score Apprentice -.6396 19 77.2 Proficient .4745 31 38.9 Distinguished 1.7376 43 7.9 Table 11. Grade 7 Mathematics Cut Scores and Resulting Distribution NAPD Category Theta cut score Raw cut score % At or above cut score Apprentice -.8555 16 77.6 Proficient .2222 28 36.3 Distinguished 1.5058 42 8.5 Table 12. Grade 8 Mathematics Cut Scores and Resulting Distribution NAPD Category Theta cut score Raw cut score % At or above cut score Apprentice -.6391 18 76.5 Proficient .4255 30 39.1
10 Application of End-of-Course Cut Scores to 2013 End-of-Course (EOC) Student Data
Distinguished 1.7158 43 7.8 Table 13. Grade 3 Reading Cut Scores and Resulting Distribution NAPD Category Theta cut score Raw cut score % At or above cut score Apprentice .0915 20 68.5 Proficient .6911 25 44.7 Distinguished 1.6645 32 13.5 Table 14. Grade 4 Reading Cut Scores and Resulting Distribution NAPD Category Theta cut score Raw cut score % At or above cut score Apprentice .0761 22 67.8 Proficient .7559 28 42.8 Distinguished 1.7576 35 13.5 Table 15. Grade 5 Reading Cut Scores and Resulting Distribution NAPD Category Theta cut score Raw cut score % At or above cut score Apprentice -.0429 21 67.3 Proficient .6559 27 43.6 Distinguished 1.6410 34 12.6 Table 16. Grade 6 Reading Cut Scores and Resulting Distribution NAPD Category Theta cut score Raw cut score % At or above cut score Apprentice .1154 25 66.1 Proficient .7865 32 42.9 Distinguished 1.7981 40 13.5 Table 17. Grade 7 Reading Cut Scores and Resulting Distribution NAPD Category Theta cut score Raw cut score % At or above cut score Apprentice -.0514 24 70.2 Proficient .6286 31 44.1 Distinguished 1.5600 39 13.7 Table 18. Grade 8 Reading Cut Scores and Resulting Distribution NAPD Category Theta cut score Raw cut score % At or above cut score Apprentice -.0362 24 68.5 Proficient .6237 31 43.4 Distinguished 1.5378 39 13.6
Conclusions Using a common referent assessment that has been shown to be a strong predictor of college performance (ACT) allows Kentucky to base scores on their EOC exams on students’ readiness for credit-bearing college courses. Linking the judgments of expert panelists about concrete

Application of End-of-Course Cut Scores to 2013 End-of-Course (EOC) Student Data
college outcomes to NAPD categories gives those categories more meaning. Panelists set cut scores to indicate that a Proficient student was ready for credit bearing college classes. They set the Distinguished cuts scores to indicate that students had some likelihood of qualifying for academic scholarships. They also set the Apprentice cut score to indicate that a student had a reasonable opportunity, perhaps with supports and/or remediation, of college or career success. These represent high standards. The resetting of standards in this manner means that Kentucky’s percentages of students scoring in the Proficient and Distinguished categories from the previous KCCT system will be substantially smaller. This does not mean that students in 2011-12 scored worse than students in 2010-11, but that they, and their schools, are being held to a higher standard. Kentucky then linked these results to the Reading and Math K-PREP assessments to ensure a consistent system from grade to grade. This should allow for more easily interpretable results at the school level, as students progress through the system.

Application of End-of-Course Cut Scores to 2013 End-of-Course (EOC) Student Data
References Thacker, A. A. (2011). Estimation of student quality core end-of-course exam grades
(FR-11-52). Alexandria, VA: Human Resources Research Organization.


Application of End-of-Course Cut Scores to 2013 End-of-Course (EOC) Student Data
Appendix: Additional Tables

16 Application of End-of-Course Cut Scores to 2013 End-of-Course (EOC) Student Data
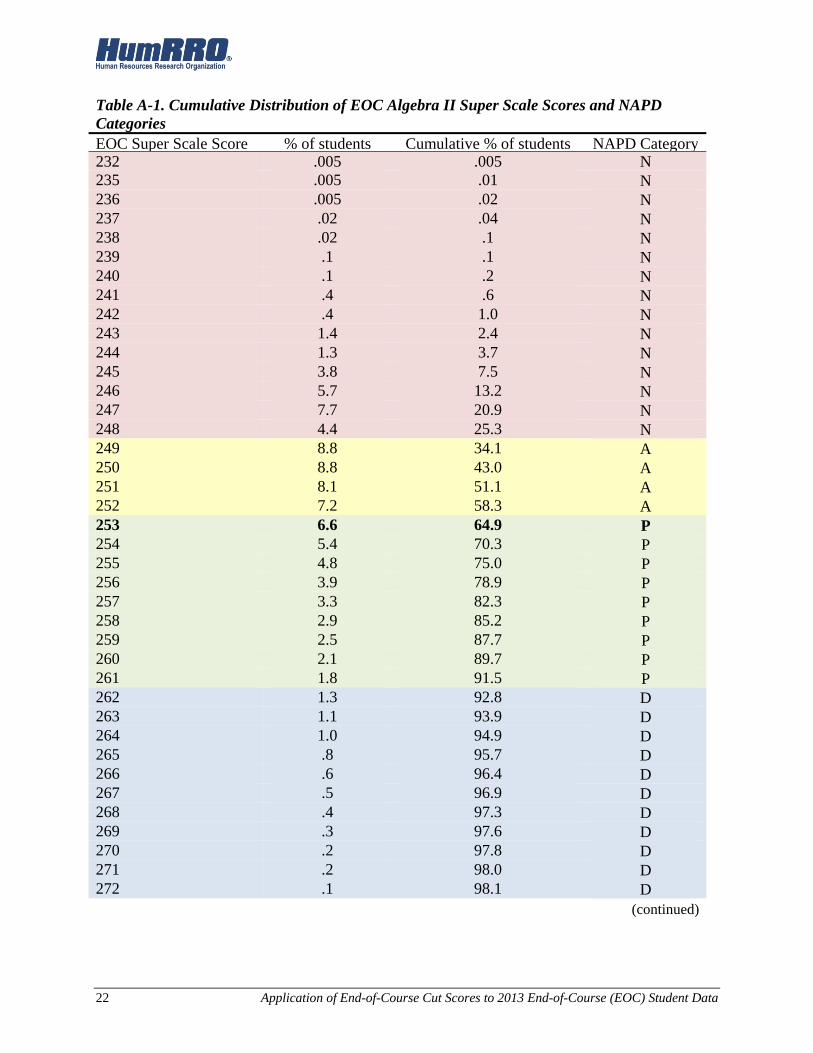
Table A-1. Cumulative Distribution of EOC Algebra II Super Scale Scores and NAPD Categories EOC Super Scale Score % of students Cumulative % of students NAPD Category232 .005 .005 N 235 .005 .01 N 236 .005 .02 N 237 .02 .04 N 238 .02 .1 N 239 .1 .1 N 240 .1 .2 N 241 .4 .6 N 242 .4 1.0 N 243 1.4 2.4 N 244 1.3 3.7 N 245 3.8 7.5 N 246 5.7 13.2 N 247 7.7 20.9 N 248 4.4 25.3 N 249 8.8 34.1 A 250 8.8 43.0 A 251 8.1 51.1 A 252 7.2 58.3 A 253 6.6 64.9 P 254 5.4 70.3 P 255 4.8 75.0 P 256 3.9 78.9 P 257 3.3 82.3 P 258 2.9 85.2 P 259 2.5 87.7 P 260 2.1 89.7 P 261 1.8 91.5 P 262 1.3 92.8 D 263 1.1 93.9 D 264 1.0 94.9 D 265 .8 95.7 D 266 .6 96.4 D 267 .5 96.9 D 268 .4 97.3 D 269 .3 97.6 D 270 .2 97.8 D 271 .2 98.0 D 272 .1 98.1 D (continued)
Application of End-of-Course Cut Scores to 2013 End-of-Course (EOC) Student Data
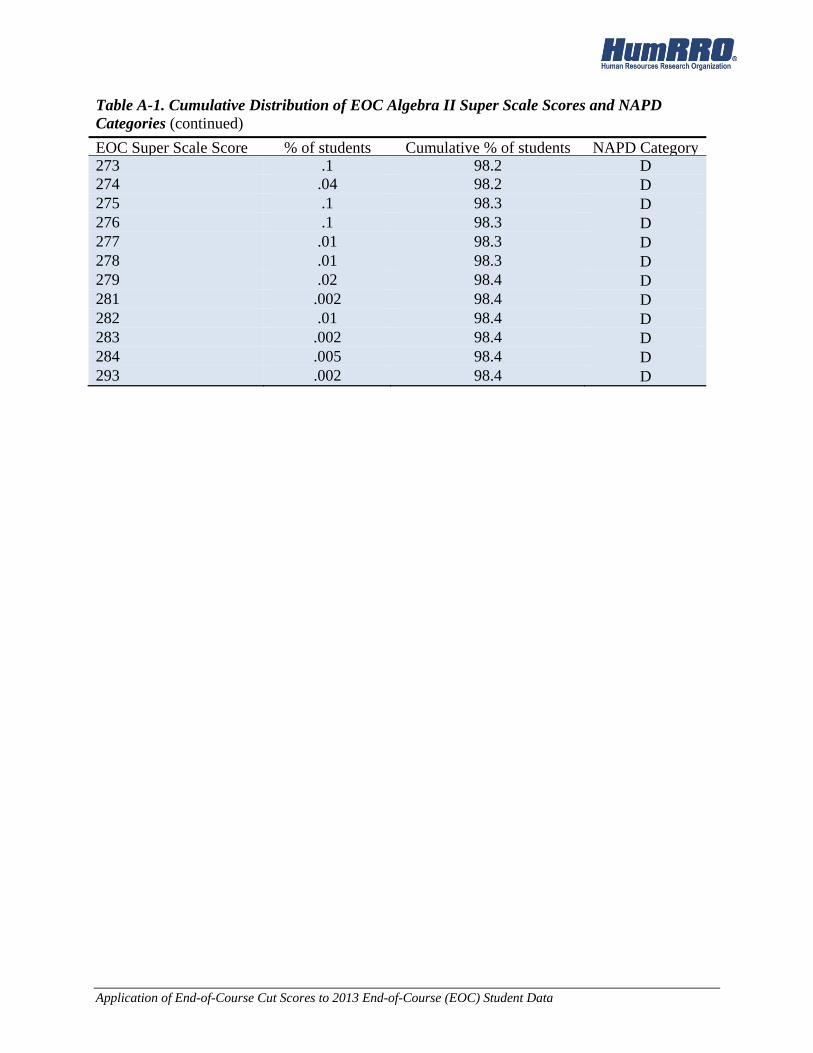
Table A-1. Cumulative Distribution of EOC Algebra II Super Scale Scores and NAPD Categories (continued)
EOC Super Scale Score % of students Cumulative % of students NAPD Category273 .1 98.2 D 274 .04 98.2 D 275 .1 98.3 D 276 .1 98.3 D 277 .01 98.3 D 278 .01 98.3 D 279 .02 98.4 D 281 .002 98.4 D 282 .01 98.4 D 283 .002 98.4 D 284 .005 98.4 D 293 .002 98.4 D
18 Application of End-of-Course Cut Scores to 2013 End-of-Course (EOC) Student Data
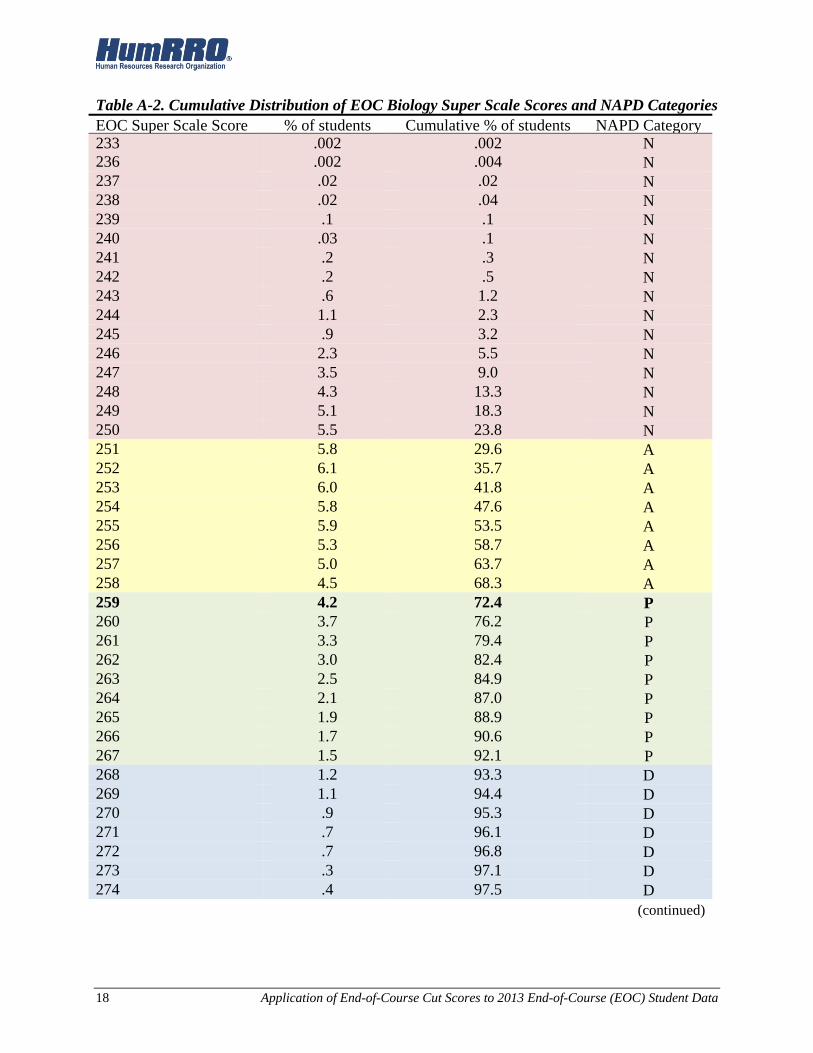
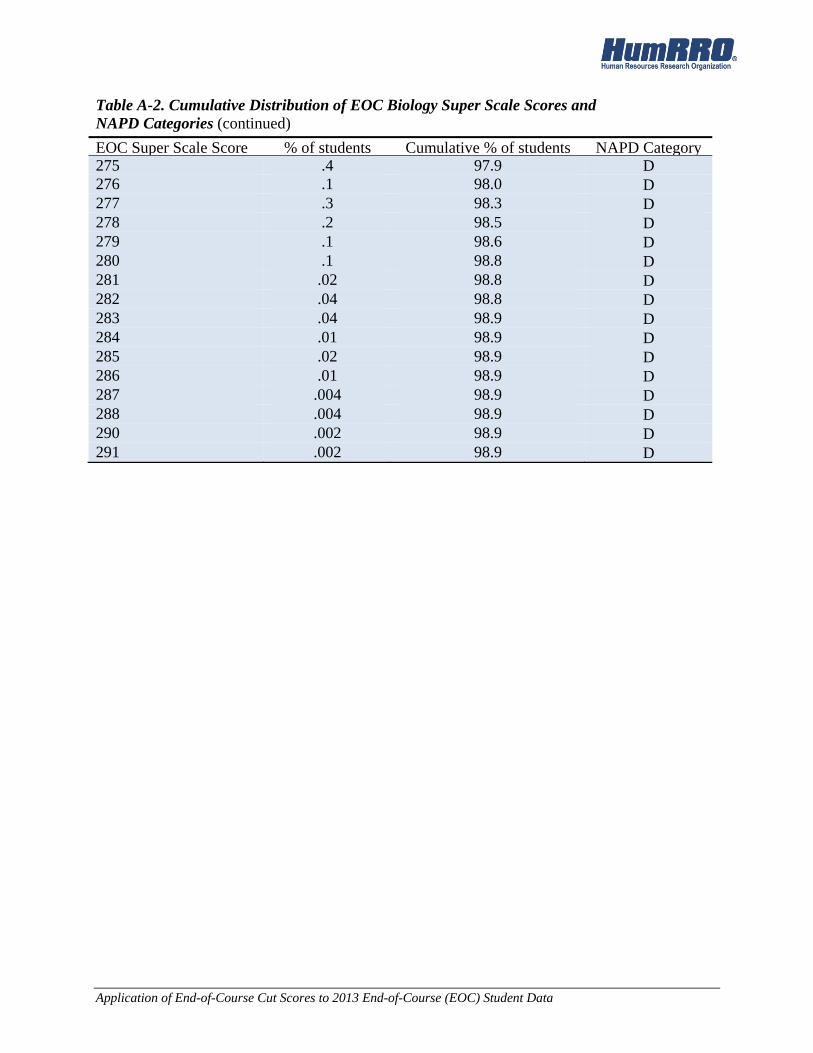
Table A-2. Cumulative Distribution of EOC Biology Super Scale Scores and NAPD Categories EOC Super Scale Score % of students Cumulative % of students NAPD Category233 .002 .002 N 236 .002 .004 N 237 .02 .02 N 238 .02 .04 N 239 .1 .1 N 240 .03 .1 N 241 .2 .3 N 242 .2 .5 N 243 .6 1.2 N 244 1.1 2.3 N 245 .9 3.2 N 246 2.3 5.5 N 247 3.5 9.0 N 248 4.3 13.3 N 249 5.1 18.3 N 250 5.5 23.8 N 251 5.8 29.6 A 252 6.1 35.7 A 253 6.0 41.8 A 254 5.8 47.6 A 255 5.9 53.5 A 256 5.3 58.7 A 257 5.0 63.7 A 258 4.5 68.3 A 259 4.2 72.4 P 260 3.7 76.2 P 261 3.3 79.4 P 262 3.0 82.4 P 263 2.5 84.9 P 264 2.1 87.0 P 265 1.9 88.9 P 266 1.7 90.6 P 267 1.5 92.1 P 268 1.2 93.3 D 269 1.1 94.4 D 270 .9 95.3 D 271 .7 96.1 D 272 .7 96.8 D 273 .3 97.1 D 274 .4 97.5 D (continued)

Application of End-of-Course Cut Scores to 2013 End-of-Course (EOC) Student Data
Table A-2. Cumulative Distribution of EOC Biology Super Scale Scores and NAPD Categories (continued)
EOC Super Scale Score % of students Cumulative % of students NAPD Category275 .4 97.9 D 276 .1 98.0 D 277 .3 98.3 D 278 .2 98.5 D 279 .1 98.6 D 280 .1 98.8 D 281 .02 98.8 D 282 .04 98.8 D 283 .04 98.9 D 284 .01 98.9 D 285 .02 98.9 D 286 .01 98.9 D 287 .004 98.9 D 288 .004 98.9 D 290 .002 98.9 D 291 .002 98.9 D

20 Application of End-of-Course Cut Scores to 2013 End-of-Course (EOC) Student Data
Table A-3. Cumulative Distribution of EOC US History Super Scale Scores and NAPD Categories EOC Super Scale Score % of students Cumulative % of students NAPD Category
236 .002 .002 N 238 .002 .004 N 239 .02 .02 N 240 .01 .03 N 241 .1 .1 N 242 .1 .2 N 243 .3 .5 N 244 .8 1.3 N 245 1.7 3.0 N 246 3.0 6.0 N 247 4.3 10.3 N 248 2.7 13.0 N 249 8.8 21.8 N 250 3.0 24.9 N 251 6.1 30.9 N 252 5.9 36.8 N 253 8.1 44.9 A 254 5.0 49.9 A 255 5.0 54.9 A 256 4.7 59.6 A 257 4.6 64.2 P 258 6.1 70.3 P 259 2.0 72.3 P 260 3.6 75.9 P 261 3.4 79.3 P 262 2.9 82.2 P 263 3.9 86.1 P 264 2.4 88.5 D 265 2.9 91.4 D 266 1.7 93.1 D 267 .7 93.9 D 268 1.4 95.3 D 269 .5 95.8 D 270 .4 96.2 D 271 .4 96.7 D 272 .7 97.3 D 273 .6 97.9 D 274 .5 98.4 D 275 .3 98.7 D
(continued)
Application of End-of-Course Cut Scores to 2013 End-of-Course (EOC) Student Data
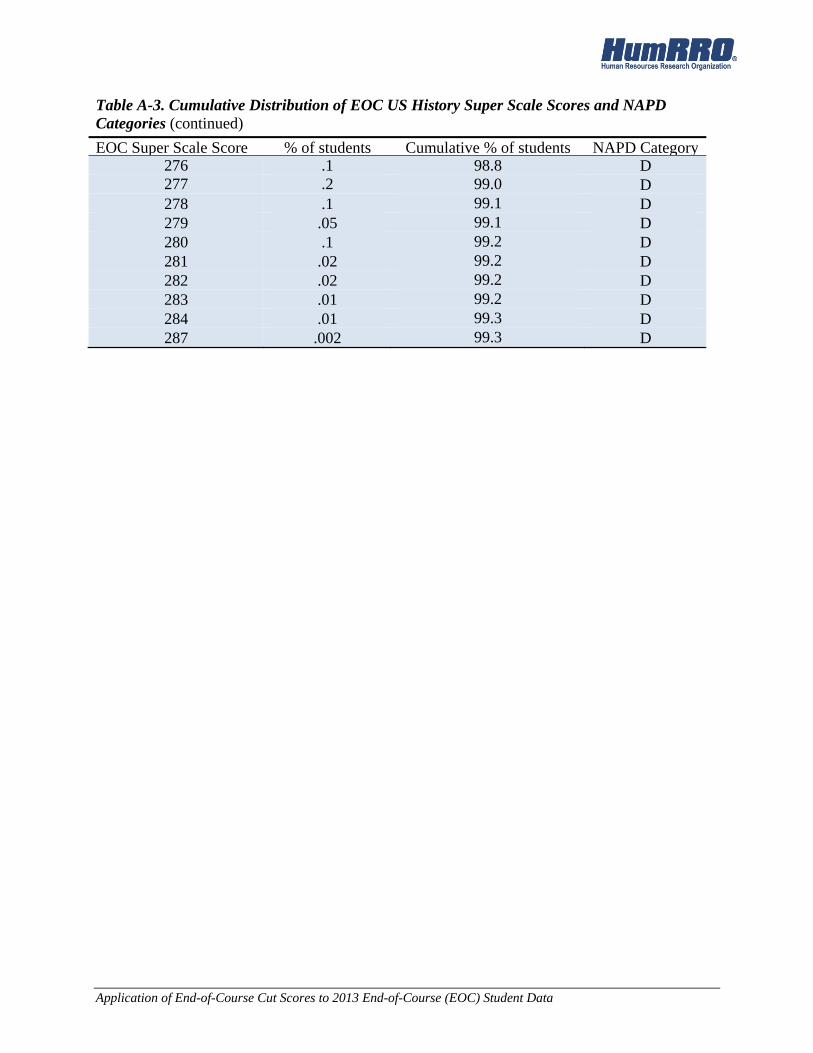
Table A-3. Cumulative Distribution of EOC US History Super Scale Scores and NAPD Categories (continued)
EOC Super Scale Score % of students Cumulative % of students NAPD Category276 .1 98.8 D 277 .2 99.0 D 278 .1 99.1 D 279 .05 99.1 D 280 .1 99.2 D 281 .02 99.2 D 282 .02 99.2 D 283 .01 99.2 D 284 .01 99.3 D 287 .002 99.3 D
22 Application of End-of-Course Cut Scores to 2013 End-of-Course (EOC) Student Data
Table A-1. Cumulative Distribution of EOC Algebra II Super Scale Scores and NAPD Categories EOC Super Scale Score % of students Cumulative % of students NAPD Category232 .005 .005 N 235 .005 .01 N 236 .005 .02 N 237 .02 .04 N 238 .02 .1 N 239 .1 .1 N 240 .1 .2 N 241 .4 .6 N 242 .4 1.0 N 243 1.4 2.4 N 244 1.3 3.7 N 245 3.8 7.5 N 246 5.7 13.2 N 247 7.7 20.9 N 248 4.4 25.3 N 249 8.8 34.1 A 250 8.8 43.0 A 251 8.1 51.1 A 252 7.2 58.3 A 253 6.6 64.9 P 254 5.4 70.3 P 255 4.8 75.0 P 256 3.9 78.9 P 257 3.3 82.3 P 258 2.9 85.2 P 259 2.5 87.7 P 260 2.1 89.7 P 261 1.8 91.5 P 262 1.3 92.8 D 263 1.1 93.9 D 264 1.0 94.9 D 265 .8 95.7 D 266 .6 96.4 D 267 .5 96.9 D 268 .4 97.3 D 269 .3 97.6 D 270 .2 97.8 D 271 .2 98.0 D 272 .1 98.1 D (continued)

Application of End-of-Course Cut Scores to 2013 End-of-Course (EOC) Student Data
Table A-1. Cumulative Distribution of EOC Algebra II Super Scale Scores and NAPD Categories (continued)
EOC Super Scale Score % of students Cumulative % of students NAPD Category273 .1 98.2 D 274 .04 98.2 D 275 .1 98.3 D 276 .1 98.3 D 277 .01 98.3 D 278 .01 98.3 D 279 .02 98.4 D 281 .002 98.4 D 282 .01 98.4 D 283 .002 98.4 D 284 .005 98.4 D 293 .002 98.4 D

24 Application of End-of-Course Cut Scores to 2013 End-of-Course (EOC) Student Data
Table A-2. Cumulative Distribution of EOC Biology Super Scale Scores and NAPD Categories EOC Super Scale Score % of students Cumulative % of students NAPD Category233 .002 .002 N 236 .002 .004 N 237 .02 .02 N 238 .02 .04 N 239 .1 .1 N 240 .03 .1 N 241 .2 .3 N 242 .2 .5 N 243 .6 1.2 N 244 1.1 2.3 N 245 .9 3.2 N 246 2.3 5.5 N 247 3.5 9.0 N 248 4.3 13.3 N 249 5.1 18.3 N 250 5.5 23.8 N 251 5.8 29.6 A 252 6.1 35.7 A 253 6.0 41.8 A 254 5.8 47.6 A 255 5.9 53.5 A 256 5.3 58.7 A 257 5.0 63.7 A 258 4.5 68.3 A 259 4.2 72.4 P 260 3.7 76.2 P 261 3.3 79.4 P 262 3.0 82.4 P 263 2.5 84.9 P 264 2.1 87.0 P 265 1.9 88.9 P 266 1.7 90.6 P 267 1.5 92.1 P 268 1.2 93.3 D 269 1.1 94.4 D 270 .9 95.3 D 271 .7 96.1 D 272 .7 96.8 D 273 .3 97.1 D 274 .4 97.5 D (continued)
Application of End-of-Course Cut Scores to 2013 End-of-Course (EOC) Student Data
Table A-2. Cumulative Distribution of EOC Biology Super Scale Scores and NAPD Categories (continued)
EOC Super Scale Score % of students Cumulative % of students NAPD Category275 .4 97.9 D 276 .1 98.0 D 277 .3 98.3 D 278 .2 98.5 D 279 .1 98.6 D 280 .1 98.8 D 281 .02 98.8 D 282 .04 98.8 D 283 .04 98.9 D 284 .01 98.9 D 285 .02 98.9 D 286 .01 98.9 D 287 .004 98.9 D 288 .004 98.9 D 290 .002 98.9 D 291 .002 98.9 D

26 Application of End-of-Course Cut Scores to 2013 End-of-Course (EOC) Student Data
Table A-3. Cumulative Distribution of EOC US History Super Scale Scores and NAPD Categories EOC Super Scale Score % of students Cumulative % of students NAPD Category
236 .002 .002 N 238 .002 .004 N 239 .02 .02 N 240 .01 .03 N 241 .1 .1 N 242 .1 .2 N 243 .3 .5 N 244 .8 1.3 N 245 1.7 3.0 N 246 3.0 6.0 N 247 4.3 10.3 N 248 2.7 13.0 N 249 8.8 21.8 N 250 3.0 24.9 N 251 6.1 30.9 N 252 5.9 36.8 N 253 8.1 44.9 A 254 5.0 49.9 A 255 5.0 54.9 A 256 4.7 59.6 A 257 4.6 64.2 P 258 6.1 70.3 P 259 2.0 72.3 P 260 3.6 75.9 P 261 3.4 79.3 P 262 2.9 82.2 P 263 3.9 86.1 P 264 2.4 88.5 D 265 2.9 91.4 D 266 1.7 93.1 D 267 .7 93.9 D 268 1.4 95.3 D 269 .5 95.8 D 270 .4 96.2 D 271 .4 96.7 D 272 .7 97.3 D 273 .6 97.9 D 274 .5 98.4 D 275 .3 98.7 D
(continued)

Application of End-of-Course Cut Scores to 2013 End-of-Course (EOC) Student Data
Table A-3. Cumulative Distribution of EOC US History Super Scale Scores and NAPD Categories (continued)
EOC Super Scale Score % of students Cumulative % of students NAPD Category276 .1 98.8 D 277 .2 99.0 D 278 .1 99.1 D 279 .05 99.1 D 280 .1 99.2 D 281 .02 99.2 D 282 .02 99.2 D 283 .01 99.2 D 284 .01 99.3 D 287 .002 99.3 D