Embed Size (px)
Citation preview

applied sciences
Article
Humidity Control for Front Opening Unified Podafter Opening Its Door in a Mini-Environment
Shih-Cheng Hu 1, Zhe-Wei Li 1, Tee Lin 1 and Ben-Ran Fu 2,*1 Department of Energy and Refrigerating Air-conditioning Engineering, National Taipei University of
Technology, Taipei 10608, Taiwan; [email protected] (S.-C.H.); [email protected] (Z.-W.L.);[email protected] (T.L.)
2 Department of Mechanical Engineering, Ming Chi University of Technology, New Taipei City 24301, Taiwan* Correspondence: [email protected] or [email protected]; Tel.: +886-229-089-899
Received: 8 June 2018; Accepted: 10 July 2018; Published: 15 July 2018�����������������
Abstract: Wafers are usually placed in a front opening unified pod (FOUP) while waiting in theline of manufacturing processes; a conventional way for preventing (or removing) contaminationis to purge an FOUP with a gas, so as to maintain the cleanliness level. This study investigatesthe effect of the flow rate of clean dry air (CDA), supplied to the purge system and air curtain,on the moisture prevention performance, while opening the FOUP door in a mini-environment.An initial relative humidity (RH) in the pre-purged FOUP was approximately 0%, whereas an RHin the mini-environment was about 43%. Conventional, diffuser, and panel purge approaches weretested. The results showed that the moisture in the surroundings rapidly entered the FOUP whenthe door was opened, without using either the purge system or air curtain. When the CDA wasthen supplied to both the purge system and the air curtain, the RH values decreased significantly;the drop slope of the RH for the diffuser- and panel-purge processes was much larger than thatof the conventional-purge process. In addition, the moisture prevention performance when thedeveloped panel-purge system was used was slightly lower than when using the diffuser-purgesystem. However, the use of the panel-purge method could sufficiently suppress the vibrationproblem. In the present study, the case with CDA flow rates of 150 L/min to the air curtain and250 L/min to the panel-purge device had the best moisture prevention performance, because of thesmallest values for both the mean and maximum RH values (i.e., 1.3% and 9.5%, respectively) inthe FOUP.
Keywords: moisture prevention; FOUP; air curtain; panel purge; diffuser
1. Introduction
In recent decades, the semiconductor and optoelectronics industries have become importantcontributors to Taiwan’s economic development. For example, the semiconductor industry, especiallythe wafer foundry, is the most competitive Taiwanese industry in the international market. Therefore,developing ways to reduce the manufacturing costs and improve the wafer yield are an importantconcern for the semiconductor manufacturers during the production of highly complex devices, usingadvanced manufacturing processes. The cleanliness of the manufacturing environment influencesthe product yield and the device performance [1–3]. For example, moisture and oxygen willinduce oxidation or a loss of Cu on a wafer during the waiting period [4,5]. In addition, there arethree major factors (materials, contamination prevention or removal, and cleaning methods) thatinfluence the cleanliness level of a storage box (such as a front opening unified pod [FOUP]) [6].Gwon et al. [7] proposed a novel cleaning system of the FOUP for the next generation of manufacturing.Herrán et al. [8] explored the cross-contamination between FOUPs and wafers, and their results
Appl. Sci. 2018, 8, 1149; doi:10.3390/app8071149 www.mdpi.com/journal/applsci
Appl. Sci. 2018, 8, 1149 2 of 13
demonstrated that the contamination concentration was affected by the solubility or diffusivityof the FOUP. They further suggested that the choice of FOUP materials should be based on thefabrication processes of the products. However, the traditional large-space clean room does not meetthe rigorous cleanliness requirements (e.g., a lower particle concentration and lower degree of relativehumidity [RH]) that have resulted from the rapid development of semiconductor technology. Therefore,an ultra-clean environment, which has been called a mini-environment, is generally installed insidea clean room, in order to reduce the possibility of cross-contamination (such as contamination fromworkers) and to maintain a high-cleanliness area for the process tools. The size of this mini-isolationregion is much smaller than that of the external clean room, which can significantly reduce themaintenance (or operating) cost of this high-cleanliness region.
In general, wafers are stored in a FOUP while waiting in the line of the manufacturing processes,and this FOUP will be mounted on the load port unit (LPU) in the mini-environment. Many studieshave focused on the prevention (or removal) of the contamination that occurs while the FOUP door isclosed. Purging a FOUP with a gas (such as nitrogen or clean dry air [CDA]) is an efficient method toprevent (or remove) contamination from the FOUP. The vacuum method is another efficient way tomaintain the cleanliness of a FOUP [9,10]. For example, Hu et al. [11] employed a purge or vacuumapproach to remove the moisture from a FOUP. Their results demonstrated that a higher purging flowrate using CDA provided better moisture removal. In addition, the moisture removal performance wasimproved by introducing flow distributors into the FOUP. They also reported that the RH distributionwas more uniform at different locations in the FOUP when using the vacuum method, compared withthe CDA purge process; and the RH evolutions during the purging and vacuuming processes showedexponential and linear decrease trends, respectively. Their results indicated that the vacuum methodcould successfully meet the rigorous RH limitation and rapidly reach the ultra-low RH level.
For practical fabrication processes, the FOUP door is frequently opened, and during this time,a vertical air flow occurs in the downward direction and over the open cavity. Here, the FOUP isconsidered to be a cavity, and the air flow is provided by fan filter units (FFUs) on the clean roomceiling or on the top of the mini-environment. Kang and Sung [12] reported that the length-to-depthratio of the cavity (L/D) affected the number of vortices generated in the cavity. For example, only onelarge vortex formed in the cavity when L/D = 1, which was very close to the condition of the FOUP,without loading any wafer during the door opening in the mini-environment. When the FOUP wasloaded with several wafers, several vortices could be generated near the front regions of the FOUP.Those vortices would transport the moisture and contamination from the surroundings into the FOUP.In addition, the Reynolds number of the air flow is another important parameter that affects thecharacteristics of the induced vortex [13,14]. Therefore, when a FOUP door is opened, additionalmethods are generally used to prevent outside contamination (such as moisture, oxygen, and particles)from entering the FOUP, for example, Keyhani et al. [15] employed an air curtain to meet this goal.
However, few studies in the available literature have considered the condition where the FOUPdoor was opened. In one example, Wang et al. [16], explored the humidity evolution in the FOUPduring a door-closed process, with an equipment-front-end-module (EFEM) load port unit. They foundthat the outside airflow would cause a vortex near the lower regions of the FOUP, which made itdifficult to decrease the RH to a very-low level. To solve this problem, they further developedflow distributors (i.e., diffusers) for the FOUP, and the results demonstrated that the RH could bereduced to less than 10%. Kim and Schelske [17] reported that the air flow pattern from the EFEMaffected the performance of the diffuser-purge process, especially for a condition where the EFEM’sair flow was much stronger than the purging flow. They further developed and installed an EFEMflow converter above the FOUP opening, which could turn the air flow into a uniform-downwardlaminar flow, and therefore improve the purge performance. Recently, Hu et al. [18] employed twodifferent approaches to study the moisture prevention performance while opening the FOUP door in amini-environment. The results showed that better moisture prevention was obtained near the FOUP’slower regions when using a diffuser purge, whereas better prevention was obtained near the FOUP’s

Appl. Sci. 2018, 8, 1149 3 of 13
upper regions when using the air curtain. They further suggested that the diffuser purge integratedwith air curtain is an appropriate way to prevent moisture in a practical application.
Although the use of diffusers in a FOUP while purging can efficiently prevent or remove thecontamination from the FOUP when its door is opened or closed, a higher purging flow rate wouldinduce particle contamination and vibration problems. In addition, it should be mentioned that, if thevibration of the FOUP or wafers is too strong, wafer breakage could occur, especially for a wafer withalready fabricated patterns. During the practical manufacturing processes, the purging flow rate isgenerally limited to 130 L/min (or even lower), in order to avoid the previously mentioned problems.The present study investigates the effect of the CDA flow rate, supplied to the purge system andair curtain, on the moisture prevention performance while opening the FOUP door. To reduce anypossible vibration, we further developed and tested a prototype for a new panel-purge device in theFOUP, instead of the diffuser or conventional purge, during the FOUP purging with the door openedand the air curtain in use.
2. Experiment and Apparatus
The experiments were carried out in a clean room with ISO Class-6 level (Figure 1a), where amini-environment with ISO Class-2 level was established (Figure 1b). The temperature and RH valuesin the clean room were maintained at 22 ± 0.5 ◦C and 42 ± 2%, respectively. In this clean room,twelve FFUs and three fan dry coil units (FDCUs) were mounted on the ceiling, and four dry coolingcoil (DCC) units were installed on the ceiling near two side-walls (in the pathways for the returnair). In order to establish a higher cleanliness level, three FFUs were also installed on the top of themini-environment. In addition, to ensure improve the uniformity for the air flow provided by theFFUs in the mini-environment, a perforated plate with an opening ratio of 46.5% was used at a location5 cm below the FFUs, and three perforated plates with an opening ratio of 30% were installed on theground level of the mini-environment. The velocities of airflow from the FFUs in the clean room andmini-environment were 0.45 m/s and 0.4 m/s, respectively. An LPU module (model: KWF-12F-M,Hirata, Japan) combined with the purging system (Brillian Network & Automation Integrated System,Miaoli, Taiwan) was employed. It was mounted on the interface of the mini-environment, as shownin Figure 1b. Figure 2 further illustrates the procedures for the LPU when mounting the FOUP onthe interface of the mini-environment. This figure shows that the FOUP door was opened by thefront-opening interface mechanism of the LPU (steps II to IV), after the FOUP was located on the LPU(step I). Step IV illustrates the situation of air flowing downward and over an open cavity (if the FOUPdoes not store any wafer), as previously mentioned.
Appl. Sci. 2018, 8, x FOR PEER REVIEW 3 of 12
when using the air curtain. They further suggested that the diffuser purge integrated with air curtain
is an appropriate way to prevent moisture in a practical application.
Although the use of diffusers in a FOUP while purging can efficiently prevent or remove the
contamination from the FOUP when its door is opened or closed, a higher purging flow rate would
induce particle contamination and vibration problems. In addition, it should be mentioned that, if
the vibration of the FOUP or wafers is too strong, wafer breakage could occur, especially for a wafer
with already fabricated patterns. During the practical manufacturing processes, the purging flow rate
is generally limited to 130 L/min (or even lower), in order to avoid the previously mentioned
problems. The present study investigates the effect of the CDA flow rate, supplied to the purge
system and air curtain, on the moisture prevention performance while opening the FOUP door. To
reduce any possible vibration, we further developed and tested a prototype for a new panel-purge
device in the FOUP, instead of the diffuser or conventional purge, during the FOUP purging with the
door opened and the air curtain in use.
2. Experiment and Apparatus
The experiments were carried out in a clean room with ISO Class-6 level (Figure 1a), where a
mini-environment with ISO Class-2 level was established (Figure 1b). The temperature and RH
values in the clean room were maintained at 22 ± 0.5 °C and 42 ± 2%, respectively. In this clean room,
twelve FFUs and three fan dry coil units (FDCUs) were mounted on the ceiling, and four dry cooling
coil (DCC) units were installed on the ceiling near two side-walls (in the pathways for the return air).
In order to establish a higher cleanliness level, three FFUs were also installed on the top of the mini-
environment. In addition, to ensure improve the uniformity for the air flow provided by the FFUs in
the mini-environment, a perforated plate with an opening ratio of 46.5% was used at a location 5 cm
below the FFUs, and three perforated plates with an opening ratio of 30% were installed on the
ground level of the mini-environment. The velocities of airflow from the FFUs in the clean room and
mini-environment were 0.45 m/s and 0.4 m/s, respectively. An LPU module (model: KWF-12F-M,
Hirata, Japan) combined with the purging system (Brillian Network & Automation Integrated System,
Miaoli, Taiwan) was employed. It was mounted on the interface of the mini-environment, as shown
in Figure 1b. Figure 2 further illustrates the procedures for the LPU when mounting the FOUP on the
interface of the mini-environment. This figure shows that the FOUP door was opened by the front-
opening interface mechanism of the LPU (steps II to IV), after the FOUP was located on the LPU (step
I). Step IV illustrates the situation of air flowing downward and over an open cavity (if the FOUP
does not store any wafer), as previously mentioned.
Figure 1. Testing environment of the present study: (a) ISO Class-6 clean room and (b) ISO Class-2
mini-environment. FFU—fan filter units; DCC—dry cooling coil; FOUP—front opening unified pod;
LPU—load port unit.
clean roommini-environment
FFU DCC
air flow
return-air
(a)
FFU
mini-environment
FOUP
panel-purge
device
LPU
(b)
Figure 1. Testing environment of the present study: (a) ISO Class-6 clean room and (b) ISO Class-2mini-environment. FFU—fan filter units; DCC—dry cooling coil; FOUP—front opening unified pod;LPU—load port unit.

Appl. Sci. 2018, 8, 1149 4 of 13
1
Fig 2
Figure 2. Procedures for LPU with FOUP mounted on the interface of a mini-environment.
This study employed three different purge types for the FOUP, as shown in Figure 3, in order toinvestigate the moisture prevention performance. Figure 3a illustrates the FOUP using the conventionalpurge, which has two inlets (near the back-bottom region, which cannot be observed in the figure)and two outlets (near the front-bottom region of the FOUP) for the purge gas. Figure 3b depicts theFOUP-purge inlets mounted with two diffusers, which are porous tubes with a diameter of 1.3 cmand length of 23.6 cm. These porous tubes were made of ultra-high molecular weight polyethylene(UPE). The FOUP, which can store 25,300 mm wafers and is used for both the conventional-purge anddiffuser-purge experiments, was provided by Entegris (model: A300, Hsinchu, Taiwan). Figure 3cshows the appearance of the FOUP used for the panel-purge experiments, which was developed bythe present research team and fabricated using three-dimensional (3D) printing with polylactic acidpolymer materials. As shown in Figure 3c, three UPE porous boards with a pore size of 0.1 µm wereinstalled in the back region of this homemade FOUP. These UPE boards could serve as ventilationplates (and panel-purge inlets), which improved the flow uniformity while purging with CDA. Figure 4provides a detailed schematic of the developed FOUP with the panel-purge device. Three back-sidecovers were further mounted on the exterior of these boards, and each cover had two inlet holes forthe purging process. In addition, the small regions between the UPE boards and the outer covers couldserve as buffer regions while purging.
Appl. Sci. 2018, 8, x FOR PEER REVIEW 4 of 12
Figure 2. Procedures for LPU with FOUP mounted on the interface of a mini-environment.
This study employed three different purge types for the FOUP, as shown in Figure 3, in order to
investigate the moisture prevention performance. Figure 3a illustrates the FOUP using the
conventional purge, which has two inlets (near the back-bottom region, which cannot be observed in
the figure) and two outlets (near the front-bottom region of the FOUP) for the purge gas. Figure 3b
depicts the FOUP-purge inlets mounted with two diffusers, which are porous tubes with a diameter
of 1.3 cm and length of 23.6 cm. These porous tubes were made of ultra-high molecular weight
polyethylene (UPE). The FOUP, which can store 25,300 mm wafers and is used for both the
conventional-purge and diffuser-purge experiments, was provided by Entegris (model: A300,
Hsinchu, Taiwan). Figure 3c shows the appearance of the FOUP used for the panel-purge
experiments, which was developed by the present research team and fabricated using three-
dimensional (3D) printing with polylactic acid polymer materials. As shown in Figure 3c, three UPE
porous boards with a pore size of 0.1 μm were installed in the back region of this homemade FOUP.
These UPE boards could serve as ventilation plates (and panel-purge inlets), which improved the
flow uniformity while purging with CDA. Figure 4 provides a detailed schematic of the developed
FOUP with the panel-purge device. Three back-side covers were further mounted on the exterior of
these boards, and each cover had two inlet holes for the purging process. In addition, the small
regions between the UPE boards and the outer covers could serve as buffer regions while purging.
Figure 3. Different types of FOUPs employed for (a) conventional-purge, (b) diffuser-purge, and (c)
panel-purge processes.
FFU
LPU
FFU
LPU
FFU
LPU
FFU
LPU
IVIII III
FFUs FFUs FFUs FFUs
LPU LPU LPU LPU
FOUP
front-
opening
interface
mechanism
air flow
I II III IV
FOUP’s door
diffuser-purge
inlets
(b)
panel-purge
inlets
(c)
(a)purge outlets
Figure 3. Different types of FOUPs employed for (a) conventional-purge, (b) diffuser-purge,and (c) panel-purge processes.

Appl. Sci. 2018, 8, 1149 5 of 13Appl. Sci. 2018, 8, x FOR PEER REVIEW 5 of 12
Figure 4. Schematic of a developed FOUP with a panel-purge device. CDA—clean dry air.
We used aluminum alloy #6061 to prepare a dummy wafer that was 1 mm thick (i.e., a
supporting base for mounting the RH sensors) and had a diameter of 302 mm. Most of the surface
area of the dummy wafer was removed, as shown in Figure 5, in order to make the FOUP
environment approximately empty. The surface of this supporting frame was polished and
electroplated in advance, so as to prevent the humidity from being absorbed on it. In addition, Figure
5 depicts the five RH sensors that were embedded on the dummy wafer to measure the RH evolutions
at different FOUP locations. For the present study, five dummy wafers were installed at slots 1 (the
lowest slot in the FOUP), 7, 13, 19, and 25 (the top slot in the FOUP). Therefore, 25 RH sensors were
used in the experiments. The reported RH in the following sections is the mean value from the results
of those 25 RH sensors. The measurement range of the RH sensor (DICKSON, model: TK150, IL, USA)
was from RH = 0% to 95%, with an accuracy of ±3% (for RH >60%) or ±2% (for RH <60%). Accordingly,
the measurement uncertainty of the mean RH in the FOUP was estimated to be only 0.4%.
Figure 5. Dummy wafer embedded with five relative humidity (RH) sensors.
Figure 6 depicts the testing loop of the experiments for the different purge methods in the FOUP.
The purge gas for the FOUP and for the air curtain was the CDA generated from the same system,
which was also employed in the previous study [11]. The use of the air curtain reduced the moisture
entering the purged FOUP (with an initial RH = 0%) when opening its door in the mini-environment,
as reported in our previous study [18]. Here, the air curtain, which had the dimensions of 410 mm
(length) × 60 mm (height) × 60 mm (width), was made of aluminum alloy 7075, and five UPE
ventilation plates were installed inside so as to generate a uniform air flow. For the cases of the
conventional-purge and diffuser-purge experiments, the CDA supplied to the FOUP or air curtain,
FOUP’s main body UPE porous
boards
back-side covers
CDA
inlets
Figure 4. Schematic of a developed FOUP with a panel-purge device. CDA—clean dry air.
We used aluminum alloy #6061 to prepare a dummy wafer that was 1 mm thick (i.e., a supportingbase for mounting the RH sensors) and had a diameter of 302 mm. Most of the surface area ofthe dummy wafer was removed, as shown in Figure 5, in order to make the FOUP environmentapproximately empty. The surface of this supporting frame was polished and electroplated in advance,so as to prevent the humidity from being absorbed on it. In addition, Figure 5 depicts the five RHsensors that were embedded on the dummy wafer to measure the RH evolutions at different FOUPlocations. For the present study, five dummy wafers were installed at slots 1 (the lowest slot inthe FOUP), 7, 13, 19, and 25 (the top slot in the FOUP). Therefore, 25 RH sensors were used in theexperiments. The reported RH in the following sections is the mean value from the results of those25 RH sensors. The measurement range of the RH sensor (DICKSON, model: TK150, IL, USA) wasfrom RH = 0% to 95%, with an accuracy of ±3% (for RH >60%) or ±2% (for RH <60%). Accordingly,the measurement uncertainty of the mean RH in the FOUP was estimated to be only 0.4%.
Appl. Sci. 2018, 8, x FOR PEER REVIEW 5 of 12
Figure 4. Schematic of a developed FOUP with a panel-purge device. CDA—clean dry air.
We used aluminum alloy #6061 to prepare a dummy wafer that was 1 mm thick (i.e., a
supporting base for mounting the RH sensors) and had a diameter of 302 mm. Most of the surface
area of the dummy wafer was removed, as shown in Figure 5, in order to make the FOUP
environment approximately empty. The surface of this supporting frame was polished and
electroplated in advance, so as to prevent the humidity from being absorbed on it. In addition, Figure
5 depicts the five RH sensors that were embedded on the dummy wafer to measure the RH evolutions
at different FOUP locations. For the present study, five dummy wafers were installed at slots 1 (the
lowest slot in the FOUP), 7, 13, 19, and 25 (the top slot in the FOUP). Therefore, 25 RH sensors were
used in the experiments. The reported RH in the following sections is the mean value from the results
of those 25 RH sensors. The measurement range of the RH sensor (DICKSON, model: TK150, IL, USA)
was from RH = 0% to 95%, with an accuracy of ±3% (for RH >60%) or ±2% (for RH <60%). Accordingly,
the measurement uncertainty of the mean RH in the FOUP was estimated to be only 0.4%.
Figure 5. Dummy wafer embedded with five relative humidity (RH) sensors.
Figure 6 depicts the testing loop of the experiments for the different purge methods in the FOUP.
The purge gas for the FOUP and for the air curtain was the CDA generated from the same system,
which was also employed in the previous study [11]. The use of the air curtain reduced the moisture
entering the purged FOUP (with an initial RH = 0%) when opening its door in the mini-environment,
as reported in our previous study [18]. Here, the air curtain, which had the dimensions of 410 mm
(length) × 60 mm (height) × 60 mm (width), was made of aluminum alloy 7075, and five UPE
ventilation plates were installed inside so as to generate a uniform air flow. For the cases of the
conventional-purge and diffuser-purge experiments, the CDA supplied to the FOUP or air curtain,
FOUP’s main body UPE porous
boards
back-side covers
CDA
inlets
Figure 5. Dummy wafer embedded with five relative humidity (RH) sensors.
Figure 6 depicts the testing loop of the experiments for the different purge methods in theFOUP. The purge gas for the FOUP and for the air curtain was the CDA generated from the samesystem, which was also employed in the previous study [11]. The use of the air curtain reducedthe moisture entering the purged FOUP (with an initial RH = 0%) when opening its door in themini-environment, as reported in our previous study [18]. Here, the air curtain, which had thedimensions of 410 mm (length) × 60 mm (height) × 60 mm (width), was made of aluminum alloy

Appl. Sci. 2018, 8, 1149 6 of 13
7075, and five UPE ventilation plates were installed inside so as to generate a uniform air flow. For thecases of the conventional-purge and diffuser-purge experiments, the CDA supplied to the FOUP or aircurtain, respectively, was controlled by a mass flow controller (Fujikin, model: FCST1500FC-8F3-F500L,maximum flow rate of 500 L/min, ±2% accuracy, Tokyo, Japan) or a digital flow meter (SMC, model:PF2A721, maximum flow rate of 210 L/min, ±2% accuracy, Tokyo, Japan), respectively. For thepanel-purge experiments, the CDA supplied to both the purge system and the air curtain was controlledby four digital flow meters. More specifically, in order to stabilize the CDA supplied tank and theairflow uniformity to the FOUP, we used three flow meters to control the CDA supplied to the threeUPE ventilation plates in this particular case.
2
Figure 6. Testing loops for different purge methods in FOUP: (a) conventional purge, (b) diffuser purge,and (c) panel purge.
In the present study, tests were conducted with different CDA flow rates supplied to theFOUP-purge system and air curtain. Table 1 summarizes the details of the experimental conditions.In this table, QA, QC, QD, and QP represent the CDA flow rates supplied to the air curtain,
Appl. Sci. 2018, 8, 1149 7 of 13
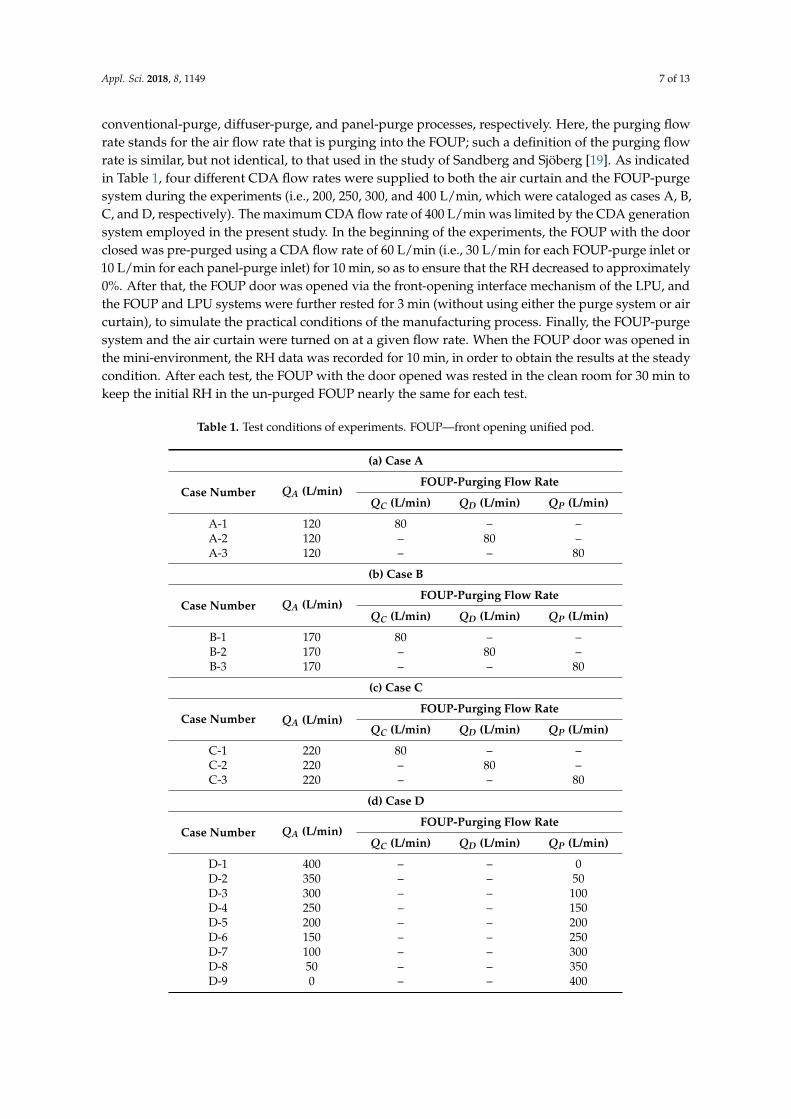
conventional-purge, diffuser-purge, and panel-purge processes, respectively. Here, the purging flowrate stands for the air flow rate that is purging into the FOUP; such a definition of the purging flowrate is similar, but not identical, to that used in the study of Sandberg and Sjöberg [19]. As indicatedin Table 1, four different CDA flow rates were supplied to both the air curtain and the FOUP-purgesystem during the experiments (i.e., 200, 250, 300, and 400 L/min, which were cataloged as cases A, B,C, and D, respectively). The maximum CDA flow rate of 400 L/min was limited by the CDA generationsystem employed in the present study. In the beginning of the experiments, the FOUP with the doorclosed was pre-purged using a CDA flow rate of 60 L/min (i.e., 30 L/min for each FOUP-purge inlet or10 L/min for each panel-purge inlet) for 10 min, so as to ensure that the RH decreased to approximately0%. After that, the FOUP door was opened via the front-opening interface mechanism of the LPU, andthe FOUP and LPU systems were further rested for 3 min (without using either the purge system or aircurtain), to simulate the practical conditions of the manufacturing process. Finally, the FOUP-purgesystem and the air curtain were turned on at a given flow rate. When the FOUP door was opened inthe mini-environment, the RH data was recorded for 10 min, in order to obtain the results at the steadycondition. After each test, the FOUP with the door opened was rested in the clean room for 30 min tokeep the initial RH in the un-purged FOUP nearly the same for each test.
Table 1. Test conditions of experiments. FOUP—front opening unified pod.
(a) Case A
Case Number QA (L/min)FOUP-Purging Flow Rate
QC (L/min) QD (L/min) QP (L/min)
A-1 120 80 – –A-2 120 – 80 –A-3 120 – – 80
(b) Case B
Case Number QA (L/min)FOUP-Purging Flow Rate
QC (L/min) QD (L/min) QP (L/min)
B-1 170 80 – –B-2 170 – 80 –B-3 170 – – 80
(c) Case C
Case Number QA (L/min)FOUP-Purging Flow Rate
QC (L/min) QD (L/min) QP (L/min)
C-1 220 80 – –C-2 220 – 80 –C-3 220 – – 80
(d) Case D
Case Number QA (L/min)FOUP-Purging Flow Rate
QC (L/min) QD (L/min) QP (L/min)
D-1 400 – – 0D-2 350 – – 50D-3 300 – – 100D-4 250 – – 150D-5 200 – – 200D-6 150 – – 250D-7 100 – – 300D-8 50 – – 350D-9 0 – – 400

Appl. Sci. 2018, 8, 1149 8 of 13
3. Results and Discussion
Figure 7 shows an example of the RH evolutions in the FOUP for different purge processes, that is,cases A-1 (conventional-purge), A-2 (diffuser-purge), and A-3 (panel-purge), with CDA flow rates of120 L/min and 80 L/min for the air curtain and the FOUP-purge system, respectively. The air changerate per hour in the FOUP is around 100 for the case with the CDA flow rate of 80 L/min to the purgesystem. During the pre-purged period, Figure 7 demonstrates that the RHs decreased rapidly from theinitial value of approximately 43% to the lower level of less than 10%, within 5 min. It then graduallyapproached the zero level at the end of the pre-purged process. Such RH evolutions when the door wasclosed approximately followed the exponential decay, as generally reported in the literature, such asHu et al. [11]. In addition, the RH decreasing characteristics of case A-3 were somewhat differentfrom those of cases A-1 and A-2 during the pre-purged period. More specifically, the RH of case A-3decreased much more slowly than those of cases A-1 and A-2. This was because the FOUP that wasused in case A-3 was our homemade prototype with the panel-purge device, whereas the FOUP thatwas employed in cases A-1 and A-2 was one that is available commercially. Here, we want to emphasizethat the main focus of this study was to investigate the RH evolution after opening the FOUP door inthe mini-environment. The purpose of the pre-purged process in the FOUP was to ensure the sameinitial RH value, which was approximately 0% before opening the door, as shown in Figure 7. Therefore,the difference between our prototype and the commercial FOUP while purging with the door closed isnot within the scope of the present study, but it might be interesting and needs to be further studied.
Appl. Sci. 2018, 8, x FOR PEER REVIEW 8 of 12
the literature, such as Hu et al. [11]. In addition, the RH decreasing characteristics of case A-3 were
somewhat different from those of cases A-1 and A-2 during the pre-purged period. More specifically,
the RH of case A-3 decreased much more slowly than those of cases A-1 and A-2. This was because
the FOUP that was used in case A-3 was our homemade prototype with the panel-purge device,
whereas the FOUP that was employed in cases A-1 and A-2 was one that is available commercially.
Here, we want to emphasize that the main focus of this study was to investigate the RH evolution
after opening the FOUP door in the mini-environment. The purpose of the pre-purged process in the
FOUP was to ensure the same initial RH value, which was approximately 0% before opening the door,
as shown in Figure 7. Therefore, the difference between our prototype and the commercial FOUP
while purging with the door closed is not within the scope of the present study, but it might be
interesting and needs to be further studied.
Figure 7. RH evolutions for different purge processes with CDA flow rates of 120 L/min to air curtain
and 80 L/min to FOUP-purge system.
After the pre-purged process and opening the FOUP door, the RH values for the three studied
cases, as shown in Figure 7, increased rapidly and reached the maximum value within 4 min (both
the purge system and air curtain were not used for 3 min in the beginning of this period, as previously
mentioned). The maximum RH was between 40% and 42%, which was very close to the RH in the
mini-environment. This result indicated that the moisture in the surroundings rapidly entered the
FOUP when the door was opened in the mini-environment, without using either the purge system
or the air curtain. In addition, it should be mentioned that even for the condition with the door closed,
the moisture would slowly diffuse or penetrate into the purged FOUP, because of the nature of the
mass transfer or leakage of the FOUP. For example, Moon and Extrand [20] reported that the
estimated RH in a purged FOUP (made of polycarbonate) could increase to more than 20% within 2
h after purging. After the previously mentioned procedure, the CDA was supplied to both the purge
system and air curtain at a given flow rate for the present experiments. Therefore, the RH values in
the FOUP decreased again within the following 2 min. In addition, the results showed that the drop
slope of the RH for the diffuser- and panel-purge processes was much larger than that of the
conventional-purge process, indicating that the conventional purge inefficiently removed or
prevented the moisture from entering the FOUP. In the final stage, the RH gradually approached
steady values for the different purge processes. Figure 7 shows that the final RH values for cases A-
1, A-2, and A-3 were approximately 34%, 20%, and 26%, respectively. Here, the final RH level could
be used to evaluate the overall moisture prevention ability of the purge process, where a lower RH
0 300 600 900 1200 15000
10
20
30
40
50
case A-2
case A-3
case A-1
door openeddoor closed
and pre-purged
QA=120 L/min
QC=80 L/min
QD=80 L/min
QP=80 L/min
RH
(%
)
Time (s)
Figure 7. RH evolutions for different purge processes with CDA flow rates of 120 L/min to air curtainand 80 L/min to FOUP-purge system.
After the pre-purged process and opening the FOUP door, the RH values for the three studiedcases, as shown in Figure 7, increased rapidly and reached the maximum value within 4 min (both thepurge system and air curtain were not used for 3 min in the beginning of this period, as previouslymentioned). The maximum RH was between 40% and 42%, which was very close to the RH in themini-environment. This result indicated that the moisture in the surroundings rapidly entered theFOUP when the door was opened in the mini-environment, without using either the purge systemor the air curtain. In addition, it should be mentioned that even for the condition with the doorclosed, the moisture would slowly diffuse or penetrate into the purged FOUP, because of the natureof the mass transfer or leakage of the FOUP. For example, Moon and Extrand [20] reported that theestimated RH in a purged FOUP (made of polycarbonate) could increase to more than 20% within 2 h

Appl. Sci. 2018, 8, 1149 9 of 13
after purging. After the previously mentioned procedure, the CDA was supplied to both the purgesystem and air curtain at a given flow rate for the present experiments. Therefore, the RH valuesin the FOUP decreased again within the following 2 min. In addition, the results showed that thedrop slope of the RH for the diffuser- and panel-purge processes was much larger than that of theconventional-purge process, indicating that the conventional purge inefficiently removed or preventedthe moisture from entering the FOUP. In the final stage, the RH gradually approached steady values forthe different purge processes. Figure 7 shows that the final RH values for cases A-1, A-2, and A-3 wereapproximately 34%, 20%, and 26%, respectively. Here, the final RH level could be used to evaluate theoverall moisture prevention ability of the purge process, where a lower RH value represents a bettermoisture prevention ability when opening the door of the pre-purged FOUP in the mini-environment.Accordingly, the diffuser purge might be the best approach among these three studied cases.
Figure 8 depicts the RH evolutions in the FOUP as a function of the CDA flow rate to the aircurtain, with a given CDA flow rate of 80 L/min to the diffuser-purge system. Again, this figuredemonstrates that the RH decreased rapidly and approached approximately 0% within 5 min, whichwas maintained until the door was opened. When the FOUP door was opened, the RH increaseddramatically from 0% to approximately 40% within 4 min and, then, decreased rapidly again from itsmaximal value to a lower steady RH condition, because of the use of the air curtain and diffuser purgewith CDA. Figure 8 also demonstrates that a higher CDA flow rate (supplied to the air curtain) yieldeda lower RH at the end of the process. Specifically, the final RH values for cases A-2, B-2, and C-2,as shown in Figure 8, were approximately 20%, 13%, and 7%, respectively. Correspondingly, increasingthe CDA flow rate by 42% (i.e., from 120 to 170 L/min) and 83% (i.e., from 120 to 220 L/min) resultedin decreases in the final RH of 35% (i.e., RH = 20% to 13%) and 65% (i.e., RH = 20% to 7%), respectively.The results indicated that the use of the air curtain with the CDA flow rate of 220 L/min, at a givenCDA flow rate of 80 L/min, to the diffuser purge could successfully maintain the mean RH in theFOUP at less than 10% during the FOUP door opening in the mini-environment, which might be asuitable condition for practical application. Consequently, we can conclude that when a small RH inthe FOUP is needed under the condition of an open door, supplying a higher CDA flow rate to the aircurtain would be better than increasing the CDA flow rate supplied to the purge system, which mightcause wafer vibration or induce particle contamination in the FOUP, as previously mentioned.
Appl. Sci. 2018, 8, x FOR PEER REVIEW 9 of 12
value represents a better moisture prevention ability when opening the door of the pre-purged FOUP
in the mini-environment. Accordingly, the diffuser purge might be the best approach among these three
studied cases.
Figure 8 depicts the RH evolutions in the FOUP as a function of the CDA flow rate to the air
curtain, with a given CDA flow rate of 80 L/min to the diffuser-purge system. Again, this figure
demonstrates that the RH decreased rapidly and approached approximately 0% within 5 min, which
was maintained until the door was opened. When the FOUP door was opened, the RH increased
dramatically from 0% to approximately 40% within 4 min and, then, decreased rapidly again from its
maximal value to a lower steady RH condition, because of the use of the air curtain and diffuser
purge with CDA. Figure 8 also demonstrates that a higher CDA flow rate (supplied to the air curtain)
yielded a lower RH at the end of the process. Specifically, the final RH values for cases A-2, B-2, and
C-2, as shown in Figure 8, were approximately 20%, 13%, and 7%, respectively. Correspondingly,
increasing the CDA flow rate by 42% (i.e., from 120 to 170 L/min) and 83% (i.e., from 120 to 220 L/min)
resulted in decreases in the final RH of 35% (i.e., RH = 20% to 13%) and 65% (i.e., RH = 20% to 7%),
respectively. The results indicated that the use of the air curtain with the CDA flow rate of 220 L/min,
at a given CDA flow rate of 80 L/min, to the diffuser purge could successfully maintain the mean RH
in the FOUP at less than 10% during the FOUP door opening in the mini-environment, which might
be a suitable condition for practical application. Consequently, we can conclude that when a small
RH in the FOUP is needed under the condition of an open door, supplying a higher CDA flow rate
to the air curtain would be better than increasing the CDA flow rate supplied to the purge system, which
might cause wafer vibration or induce particle contamination in the FOUP, as previously mentioned.
Figure 8. RH evolutions as function of CDA flow rate to air curtain at given CDA flow rate of 80 L/min
to the diffuser-purge system.
Figure 9 further shows the RH evolutions in the FOUP as a function of the CDA flow rate to the
air curtain at a given CDA flow rate of 80 L/min to the panel-purge system. Overall, it is clear that
the RH evolution in the FOUP for the cases in Figure 9 is similar to that depicted in Figure 8. The
main difference in the RH characteristics among the results presented in Figures 8 and 9 is that the
final RH levels were maintained for the diffuser- and panel-purge approaches. For example, the final
RH values for cases A-3, B-3, and C-3, as shown in Figure 9, were approximately 26%, 18%, and 13%,
respectively. Correspondingly, increasing the CDA flow rate (supplied to the air curtain) by 42% (i.e.,
from 120 to 170 L/min) and 83% (i.e., from 120 to 220 L/min), resulted in decreases in the final RH in
the FOUP of 31% (i.e., RH = 26% to 18%) and 50% (i.e., RH = 26% to 13%), respectively. The present
0 300 600 900 1200 15000
10
20
30
40
50door closed
and pre-purged
door openedQ
D = 80 L/min
QA = 120 L/min
QA = 170 L/min
QA = 220 L/min
RH
(%
)
Time (s)
case A-2
case B-2
case C-2
Figure 8. RH evolutions as function of CDA flow rate to air curtain at given CDA flow rate of 80 L/minto the diffuser-purge system.

Appl. Sci. 2018, 8, 1149 10 of 13
Figure 9 further shows the RH evolutions in the FOUP as a function of the CDA flow rate to theair curtain at a given CDA flow rate of 80 L/min to the panel-purge system. Overall, it is clear that theRH evolution in the FOUP for the cases in Figure 9 is similar to that depicted in Figure 8. The maindifference in the RH characteristics among the results presented in Figures 8 and 9 is that the final RHlevels were maintained for the diffuser- and panel-purge approaches. For example, the final RH valuesfor cases A-3, B-3, and C-3, as shown in Figure 9, were approximately 26%, 18%, and 13%, respectively.Correspondingly, increasing the CDA flow rate (supplied to the air curtain) by 42% (i.e., from 120 to170 L/min) and 83% (i.e., from 120 to 220 L/min), resulted in decreases in the final RH in the FOUP of31% (i.e., RH = 26% to 18%) and 50% (i.e., RH = 26% to 13%), respectively. The present results indicatedthat the moisture prevention performance when the panel-purge system was used was slightly lowerthan that when using the diffuser-purge system.
Appl. Sci. 2018, 8, x FOR PEER REVIEW 10 of 12
results indicated that the moisture prevention performance when the panel-purge system was used
was slightly lower than that when using the diffuser-purge system.
Figure 9. RH evolutions as function of CDA flow rate to air curtain at given CDA flow rate of 80 L/min
to panel-purge system.
However, it should be mentioned that the use of the panel-purge method could sufficiently
suppress the vibration problem, especially under the condition of a higher purging flow rate.
Therefore, we further studied the effects of the flow rates supplied to the air curtain and panel-purge
system on the moisture prevention performance, under the condition of an open door. The total CDA
flow rates supplied to the air curtain and the panel-purge system were controlled at 400 L/min for
this studied case (i.e., case D). Here, cases D-1 and D-9 represent the condition where only the air
curtain or panel-purge system was used, respectively. Table 2 summarizes the RH results of case D.
The mean RH ranged from 1.3% to 9.8%, which indicated that all of the studied conditions of case D
could maintain the mean RH in the FOUP as low as 10% or lower during the FOUP door opening. As
previously mentioned, the mean RH value was calculated using 25 RH sensors in the FOUP.
Therefore, the maximum and standard deviations of the RH were also important parameters and are
listed in Table 2. Although the mean RH values of cases D-1, D-2, D-3, and D-4 were less than 3%, the
maximum RH values were as high as 22.4–30.4%. In addition, the smallest standard deviation of the
RH (i.e., 0.4%) occurred in case D-9, which indicated that the RH uniformity for this case was the best.
Furthermore, Table 2 indicates that case D-6 had the best moisture prevention performance, because
the smallest values for both the mean and maximum RH values (i.e., 1.3% and 9.5%, respectively)
were obtained.
Table 2. Mean and maximum relative humidity (RH) values in FOUP for case D.
Case Number Mean RH (%) Maximum RH (%) Standard Deviation
D-1 2.6 26.9 2.5
D-2 3.0 30.4 2.3
D-3 3.0 28.5 2.3
D-4 1.9 22.4 2.6
D-5 1.4 14.9 2.7
D-6 1.3 9.5 2.2
D-7 2.9 14.3 1.5
D-8 6.5 17.1 0.7
D-9 9.8 15.5 0.4
0 300 600 900 1200 15000
10
20
30
40
50door closed
and pre-purged
door opened
RH
(%
)
Time (s)
QP = 80 L/min
QA = 120 L/min
QA = 170 L/min
QA = 220 L/min
case A-3
case B-3
case C-3
Figure 9. RH evolutions as function of CDA flow rate to air curtain at given CDA flow rate of 80 L/minto panel-purge system.
However, it should be mentioned that the use of the panel-purge method could sufficientlysuppress the vibration problem, especially under the condition of a higher purging flow rate. Therefore,we further studied the effects of the flow rates supplied to the air curtain and panel-purge systemon the moisture prevention performance, under the condition of an open door. The total CDAflow rates supplied to the air curtain and the panel-purge system were controlled at 400 L/min forthis studied case (i.e., case D). Here, cases D-1 and D-9 represent the condition where only the aircurtain or panel-purge system was used, respectively. Table 2 summarizes the RH results of case D.The mean RH ranged from 1.3% to 9.8%, which indicated that all of the studied conditions of case Dcould maintain the mean RH in the FOUP as low as 10% or lower during the FOUP door opening.As previously mentioned, the mean RH value was calculated using 25 RH sensors in the FOUP.Therefore, the maximum and standard deviations of the RH were also important parameters and arelisted in Table 2. Although the mean RH values of cases D-1, D-2, D-3, and D-4 were less than 3%,the maximum RH values were as high as 22.4–30.4%. In addition, the smallest standard deviation of theRH (i.e., 0.4%) occurred in case D-9, which indicated that the RH uniformity for this case was the best.Furthermore, Table 2 indicates that case D-6 had the best moisture prevention performance, becausethe smallest values for both the mean and maximum RH values (i.e., 1.3% and 9.5%, respectively)were obtained.

Appl. Sci. 2018, 8, 1149 11 of 13
Table 2. Mean and maximum relative humidity (RH) values in FOUP for case D.
Case Number Mean RH (%) Maximum RH (%) Standard Deviation
D-1 2.6 26.9 2.5D-2 3.0 30.4 2.3D-3 3.0 28.5 2.3D-4 1.9 22.4 2.6D-5 1.4 14.9 2.7D-6 1.3 9.5 2.2D-7 2.9 14.3 1.5D-8 6.5 17.1 0.7D-9 9.8 15.5 0.4
4. Conclusions
This study investigates the effect of the CDA flow rate, supplied to the purge system and aircurtain, on the moisture prevention when the FOUP door was opened in a mini-environment. To reduceany possible vibration, we further developed and tested a prototype for a new panel-purge device inthe FOUP during the purging with the door opened and the air curtain in use. During the experiments,the RH evolutions were explored. The following conclusions could be drawn from the present study:
(1) During the pre-purged period with the FOUP door closed, the RHs decreased rapidly and thengradually approached the zero level at the end of the pre-purged process. After the pre-purgedprocess and opening the FOUP door, the RH values increased rapidly and reached the maximumvalue, which was very close to the RH in the mini-environment. This result indicated thatthe moisture in the surroundings rapidly entered the FOUP when the door was opened in themini-environment, without using either the purge system or the air curtain.
(2) When the CDA was supplied to both the purge system and the air curtain, the RH valuesdecreased again during the following period. The drop slope of the RH for the diffuser- andpanel-purge processes was much larger than that of the conventional-purge process, indicatingthat the conventional purge inefficiently removed or prevented the moisture from entering theFOUP. In the final stage, the RH gradually approached steady values for the different purgeprocesses. Based on the experimental results, the diffuser purge might be the best approachamong three studied cases (i.e., conventional, diffuser, and panel purge approaches).
(3) The moisture prevention performance when the developed panel-purge system was usedwas slightly lower than that when using the diffuser-purge system. However, the use of thepanel-purge method could sufficiently suppress the vibration problem. To conclude, the casewith CDA flow rates of 150 L/min to the air curtain and 250 L/min to the panel-purge devicehad the best moisture prevention performance, due to the smallest values for both the mean andmaximum RH values in the FOUP.
The FOUP with the panel-purge device is our proposed concept that can significantly prevent themoisture from entering the pre-purged FOUP, while opening the FOUP door in the mini-environment,based on the results of the present study. At the prototype stage, the cost of the use of the presentdevice is hard to evaluate, but we speculate that the increasing cost compared to the conventionalmethod might be quite small.
Author Contributions: S.-C.H. and B.-R.F. interpreted the results and prepared the manuscript and revision.Z.-W.L. conducted experiments. T.L. conducted experiments and prepared the revision.
Funding: This research was supported by the Ministry of Science and Technology, Taiwan (project number: MOST104-2622-E-027-007-CC2).
Conflicts of Interest: The authors declare no conflict of interest.

Appl. Sci. 2018, 8, 1149 12 of 13
References
1. Kwon, S.S.; Hwang, S.M.; Kim, H.R.; Jang, H.C.; Hong, J.H.; Song, G.J.; Park, H.Y.; Kim, M.; Shin, Y.; Kim, J.Y.;et al. Influence of fluoride ions contamination in front opening unified pod (FOUP) generating defectivebonding pad. Aerosol Air Qual. Res. 2017, 17, 936–941. [CrossRef]
2. Song, G.J.; Hwang, S.M.; Koo, S.J.; Kim, H.R.; Jang, H.C.; Hong, J.H.; Park, H.Y.; Choi, E.; Kim, J.Y.; Noh, T.Y.;et al. Evaluation of hindrance to the growth of SiN passivation layer by contamination of fluoride ions infront opening unified pod (FOUP). Aerosol Air Qual. Res. 2015, 15, 2175–2183. [CrossRef]
3. Nguyen, T.Q.; Fontaine, H.; Borde, Y.; Jacob, V. Identification and quantification of FOUP molecularcontaminants inducing defects in integrated circuits manufacturing. Microelectron. Eng. 2013, 105, 124–129.[CrossRef]
4. Kim, B.H.; Park, J.G. Effect of FOUP atmosphere control on process wafer integrity in sub 20 nm devicefabrication. Solid State Phenom. 2015, 219, 256–259. [CrossRef]
5. Kamoshima, T.; Fujii, Y.; Noguchi, T.; Saeki, T.; Takata, Y.; Ochi, H.; Koiwa, A. Controlling ambient gas inslot-to-slot space inside FOUP to suppress Cu-loss after dual damascene patterning. IEEE Trans. Semicond.Manuf. 2008, 21, 573–577. [CrossRef]
6. Case, S.; Waite, S.; Barker, J.; Zhao, W.; Kim, J.S.; Moore, J.; Ramanathan, E. Impact of FOUP environment onproduct yield in advanced technologies. In Proceedings of the 27th Annual SEMI Advanced SemiconductorManufacturing Conference (ASMC), Saratoga Springs, NY, USA, 16–19 May 2016; pp. 168–171.
7. Gwon, S.G.; Lee, K.B.; Lee, B.J.; Choi, G.M. Inline FOUP cleaner—The new type FOUP cleaner for the nextgeneration. Solid State Phenom. 2016, 255, 387–389. [CrossRef]
8. Herrán, F.; González-Aguirre, P.; Beitia, C.; Ohlsen, J.; Lundgren, J.; Fontaine, H. Comparison of HF and HClcross-contamination between different ENTEGRIS FOUP platforms and Cu-coated wafers. Microelectron. Eng.2017, 169, 34–38. [CrossRef]
9. Favre, A.; Bounouar, J.; Rioufrays, S.; Veran, E. Yield enhancement through new solutions for queue timecontainment. In Proceedings of the 2008 International Symposium on Semiconductor Manufacturing (ISSM),Tokyo, Japan, 27–29 October 2008; pp. 255–257.
10. Maquin, P.; Kambara, H. Reduction of airborne molecular contamination on 300 mm front opening unifiedpod (FOUP) and wafers surface by vacuum technology. Solid State Phenom. 2009, 145–146, 139–142. [CrossRef]
11. Hu, S.C.; Huang, Z.Y.; Fu, B.R. Experimental study on the moisture removal of a 450-mm FOUP during thepurge or vacuum process. Appl. Therm. Eng. 2016, 108, 951–957. [CrossRef]
12. Kang, W.; Sung, H.J. Large-scale structures of turbulent flows over an open cavity. J. Fluids Struct. 2009, 25,1318–1333. [CrossRef]
13. Seena, A.; Sung, H.J. Dynamic mode decomposition of turbulent cavity flows for self-sustained oscillations.Int. J. Heat Fluid Flow 2011, 32, 1098–1110. [CrossRef]
14. Yao, H.; Cooper, R.K.; Raghunathan, S. Numerical simulation of incompressible Laminar flow overthree-dimensional rectangular cavities. J. Fluids Eng. Trans. ASME 2004, 126, 919–927. [CrossRef]
15. Keyhani, K.; Abu-Zaid, S.; Zhang, H. Purging FOUPs that open to front-end minienvironments using aninert-gas curtain. Micro 2004, 22, 65–71.
16. Wang, H.P.; Kim, S.C.; Liu, B. Advanced FOUP purge using diffusers for FOUP door-off application.In Proceedings of the 25th Annual SEMI Advanced Semiconductor Manufacturing Conference (ASMC),Saratoga Springs, NY, USA, 19–21 May 2014; pp. 120–124.
17. Kim, S.C.; Schelske, G. FOUP purge performance improvement using EFEM flow converter. In Proceedingsof the 27th Annual SEMI Advanced Semiconductor Manufacturing Conference (ASMC), Saratoga Springs,NY, USA, 16–19 May 2016; pp. 6–11.
18. Hu, S.C.; Lin, T.; Fu, B.R.; Wang, T.Y. Air curtain application in a purged unified pod. Appl. Therm. Eng. 2017,111, 1179–1183. [CrossRef]

Appl. Sci. 2018, 8, 1149 13 of 13
19. Sandberg, M.; Sjöberg, M. The use of moments for assessing air quality in ventilated rooms. Build. Environ.1983, 18, 181–197. [CrossRef]
20. Moon, S.I.; Extrand, C.W. Humidity rise after purge in micro-environments. In Proceedings of the 23rdAnnual SEMI Advanced Semiconductor Manufacturing Conference (ASMC), Saratoga Springs, NY, USA,15–17 May 2012; pp. 308–310.
© 2018 by the authors. Licensee MDPI, Basel, Switzerland. This article is an open accessarticle distributed under the terms and conditions of the Creative Commons Attribution(CC BY) license (http://creativecommons.org/licenses/by/4.0/).