Embed Size (px)
Citation preview
1
Human subjective response to steering wheel vibration caused by diesel engine idle
M. Ajovalasit and J. Giacomin†
Department of Mechanical Engineering, The University of Sheffield, Sheffield, UK
Abstract: This study investigated the human subjective response to steering wheel vibration of the type caused
by a 4-cylinder diesel engine idle in passenger cars. Vibrotactile perception was assessed using sinusoidal
amplitude modulated vibratory stimuli of constant energy level (0.41 r.m.s. m/s2) having a carrier frequency of
26 Hz (i.e. engine firing frequency) and modulation frequency of 6.5 Hz (half engine order). Evaluations of
seven levels of modulation depth parameter m (0.0, 0.1, 0.2, 0.4, 0.6, 0.8, 1.0) were performed in order to define
the growth function of human perceived disturbance as a function of amplitude modulation depth. Two
semantic descriptors were used (unpleasantness and roughness) and two test methods (Thurstone paired
comparison and Borg CR-10 direct evaluation scale) for a total of four tests. Each test was performed using an
independent group of 25 individuals. The results suggest that there is a critical value of modulation depth m =
0.2 below which human subjects do not perceive differences in amplitude modulation and above which the
stimulus-response relationship increases monotonically with a power function. Stevens’ power exponents
suggest that the perceived unpleasantness is nonlinearly dependent on modulation depth m with an exponent
greater than 1 and that the perceived roughness is dependent with an exponent close to unity.
Keywords: vibration, engine, idle, subjective, perception, modulation
* Corresponding author: Department of Mechanical Engineering, The University of Sheffield, Mappin Street, Sheffield S1
3JD, UK. Tel.: 0114-222-7781 Fax : 0114-222-7890 email : [email protected]
2
NOTATION
)(tA instantaneous amplitude of modulated signal [m/s2]
a acceleration value [m/s2]
CR Category-Ratio
cf carrier frequency [Hz]
mf modulation frequency [Hz]
Hi engine harmonic [order]
m modulation depth
m* modulation index equal to m-mth
mth amplitude modulation detection threshold
MTF modulation transfer function
p significance level
PSD power spectral density
RMS root mean square acceleration value [m/s2]
rpm revolution per minute
SD standard deviation
VDV vibration dose value [m/s1.75]
1. INTRODUCTION
Amplitude modulation is a commonly observed phenomenon in the vibro-acoustic signatures of many types of
mechanical systems (1). Amplitude modulation is present in the vibration measured at the steering wheel of
road vehicles at idle due to the rotational irregularity of the engine (2-4). For a 4-cylinder, 4-stroke engine at
3
idle amplitude modulation occurs due to the action of the half order engine harmonic on the second order
engine harmonic (5-7). Comprehensive analytical treatment of the spectral contents of multi-cylinder engines
can be found in reference (7). What follows here is a brief description of the 4-cylinder case.
The half order harmonic of a 4-cylinder, 4-stroke engine is due to there being only a single power stroke
occurring in each cylinder every two crankshaft revolutions. For an automobile engine the crankshaft rotational
speed when at idle is typically in the range from 600-840 rpm, corresponding to linear frequencies of from 10 to
15 Hz. The half order harmonic originating from combustion forces in the cylinder is therefore in the range
from 5 to 7 Hz, as shown by the experimental measurements performed by Dixon et. al. (5).
The second (H2) and the other even order harmonics (H4, H6, etc.) are caused instead by mechanical unbalance
(6-8). The reciprocating motion of the pistons and of the connecting rods, combined with the rotational motion
of the crankshaft, generate inertial forces which act on the engine block. At low engine speeds the combustion
gas forces are greater than the mechanical inertial forces, but at high speeds the opposite is true. In 4-cylinder,
4-stroke engines the first-order inertial forces are normally well balanced since the crankshaft is balanced and
the piston pairs move in opposite directions. Vertically acting second-order forces and their multiples are
produced, however, because the two descending pistons in a four-cylinder engine travel further at a given
crankshaft angle than the two ascending pistons since lateral movement of the connecting rods accelerates the
descending pistons while delaying the ascending pistons. The centre of gravity of the ascending and descending
masses therefore varies, producing a resultant force which varies periodically twice per crankshaft revolution.
Laterally acting second-order forces and their multiples also occur due to the angle between the connecting rod
and the cylinder. Lateral gas and inertial forces vary periodically twice per crankshaft revolution due to the
change in direction of the connecting rod. For an idle speed in the range from 600-840 rpm, the corresponding
linear second order linear frequencies are from 20 to 28 Hz.
Amplitude modulation of the form described above is conveniently and compactly represented by means of the
modulation depth parameter m. This parameter is defined as the amount of change in the amplitude of the
waveform, and which is expressed as a proportion:
4
( ) maxminmax / AAAm −=
(1)
Thus a value of m = 1.0 describes an amplitude variation of the carrier sinusoid from zero to a maximum,
whereas a value of m = 0.0 describes the unmodulated version of the carrier signal (i.e. a pure sine wave). Due
to combustion irregularity an engine tends to run “rough” and stall much more easily at lower idle speeds (4).
Also, anecdotal evidence suggests that even slight fluctuations of engine idle can cause unpleasant vibrations
leading to lower customer satisfaction. Since smooth idle is an important vehicle attribute perceived by
customers (9), identification of an acceptance level of amplitude modulation index m can provide valuable
information to vehicle designers.
For the human hand-arm system considerable psychophysical research has been performed to investigate how
the amplitude and the frequency of a vibrotactile stimulus affects detection threshold (10-11) and difference
threshold (12). Results of vibrotactile discrimination tests performed using two-superimposed sinusoids at low-
frequency (10Hz+30Hz) (13) presented to the fingertip suggest that the tactile system utilises a temporal code
for amplitude discrimination on the basis of uniformity or nonuniformity of the sequences of perceived peaks
within stimulus cycles. Studies of temporal sensitivity in the tactile system performed by Weisemberger (14)
defined a modulation transfer function (MTF) that related modulation depth thresholds to the frequency of
modulation. MTF can be used to predict the depth of modulation necessary to just allow discrimination between
a modulated and an unmodulated waveform. In Weisemberger’s experiments the modulated signal was
frequently reported as feeling “rougher” than the unmodulated signal. Lamoré et al. (15) found that high-
frequency (1000-2000 Hz) sinusoidal vibrations of the skin induced maximum sensitivity when amplitude
modulation is applied at modulation frequencies between 100 and 300 Hz. The use of high-frequency stimuli
makes this an atypical study, being outside the frequency range, up to about 350Hz (10), to which the tactile
system is maximally responsive. No data regarding the human response to amplitude modulated vibration of the
type caused by engine idle is available in the scientific literature.
Psychophysical methods developed for the scaling of sensory attributes such as perceived roughness (16) or
perceived intensity (17) can measure human subjective response to many forms of nonmetric (i.e. stimuli that
5
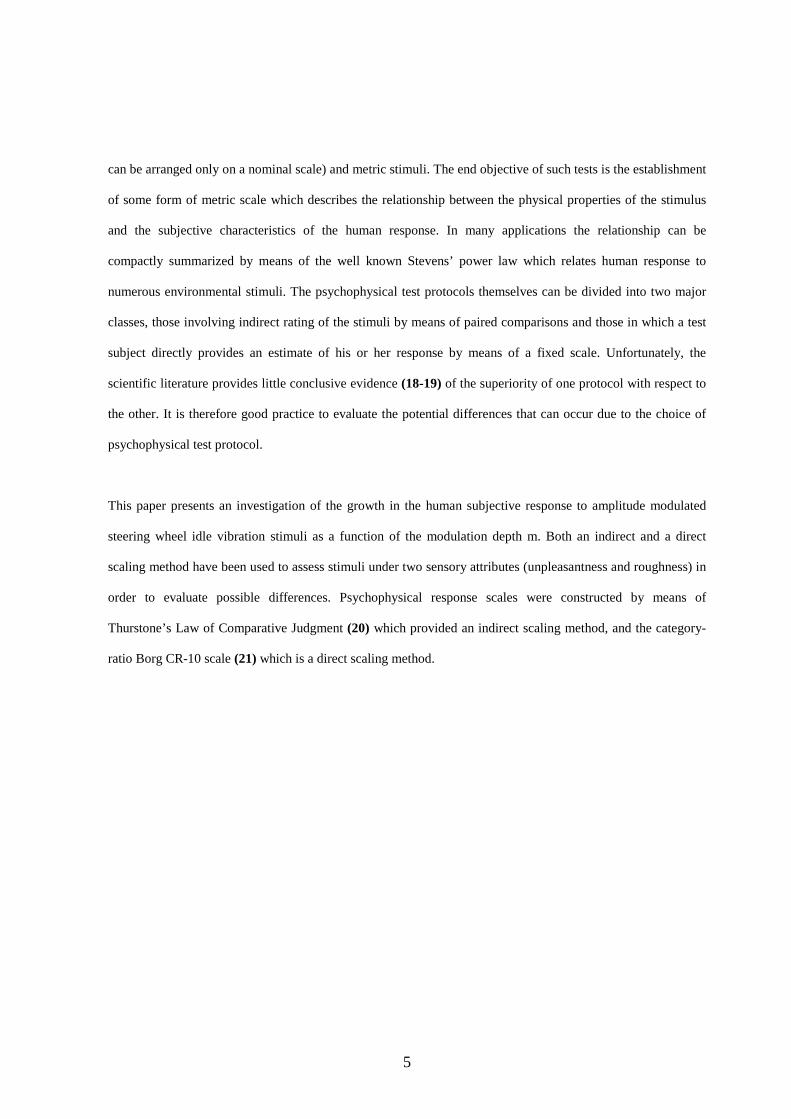
can be arranged only on a nominal scale) and metric stimuli. The end objective of such tests is the establishment
of some form of metric scale which describes the relationship between the physical properties of the stimulus
and the subjective characteristics of the human response. In many applications the relationship can be
compactly summarized by means of the well known Stevens’ power law which relates human response to
numerous environmental stimuli. The psychophysical test protocols themselves can be divided into two major
classes, those involving indirect rating of the stimuli by means of paired comparisons and those in which a test
subject directly provides an estimate of his or her response by means of a fixed scale. Unfortunately, the
scientific literature provides little conclusive evidence (18-19) of the superiority of one protocol with respect to
the other. It is therefore good practice to evaluate the potential differences that can occur due to the choice of
psychophysical test protocol.
This paper presents an investigation of the growth in the human subjective response to amplitude modulated
steering wheel idle vibration stimuli as a function of the modulation depth m. Both an indirect and a direct
scaling method have been used to assess stimuli under two sensory attributes (unpleasantness and roughness) in
order to evaluate possible differences. Psychophysical response scales were constructed by means of
Thurstone’s Law of Comparative Judgment (20) which provided an indirect scaling method, and the category-
ratio Borg CR-10 scale (21) which is a direct scaling method.

6
Fig. 1 - Steering wheel rotational vibration test rig and associated electronics.
Scadas III MSC6 signal conditioning unit
EGAS-FS-25 accelerometer
PA power amplifier
shaker
LMS
2. TESTING OF HUMAN RESPONSE TO AMPLITUDE- MODULATED STEERIN G
WHEEL VIBRATION STIMULI
2.1. Experimental apparatus
A test facility for applying rotational vibration to a seated test subject was used in this study. A schematic
representation of the steering wheel test rig and associated data conditioning and acquisition systems are shown
in Fig.1.
The rotational steering system consists of a 325mm diameter aluminium wheel connected to a steel shaft which
is mounted onto two high precision bearings. The shaft is connected to a G&W V20 electrodynamic shaker and
associated PA 100 power amplifier by means of a steel stinger rod. Bench control and data acquisition were
performed by means of LMS Cada-X 3.5 E software and a 12-channel Difa Systems Scadas III front-end unit.
The acceleration obtained at the steering wheel was measured using an Entran EGAS-FS-25 accelerometer
located on the top left side of the wheel. The acceleration was measured in the tangential direction. The
accelerometer signal was amplified by means of an Entran MSC6 signal-conditioning unit. Table 1 presents the
rig main geometric dimensions, which were chosen based on data from a small European automobile. The seat,
7
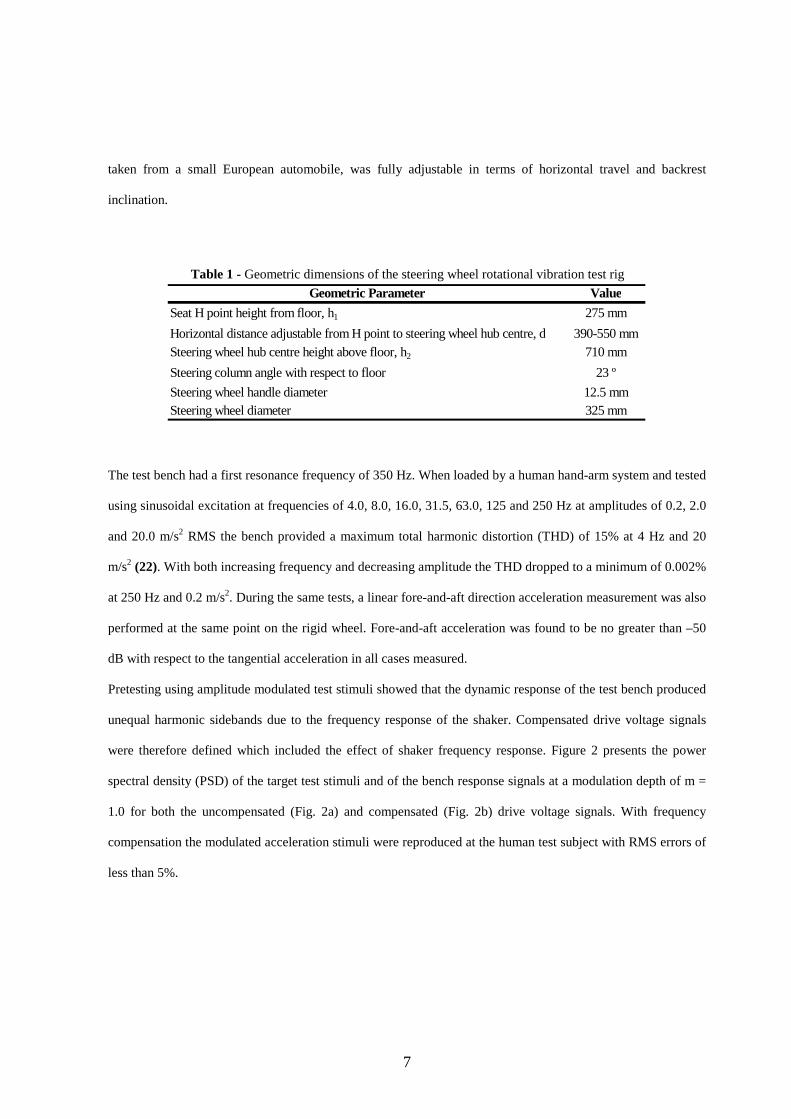
Geometric Parameter Value
Seat H point height from floor, h1 275 mm
Horizontal distance adjustable from H point to steering wheel hub centre, d 390-550 mmSteering wheel hub centre height above floor, h2 710 mm
Steering column angle with respect to floor 23 º
Steering wheel handle diameter 12.5 mmSteering wheel diameter 325 mm
Table 1 - Geometric dimensions of the steering wheel rotational vibration test rig
taken from a small European automobile, was fully adjustable in terms of horizontal travel and backrest
inclination.
The test bench had a first resonance frequency of 350 Hz. When loaded by a human hand-arm system and tested
using sinusoidal excitation at frequencies of 4.0, 8.0, 16.0, 31.5, 63.0, 125 and 250 Hz at amplitudes of 0.2, 2.0
and 20.0 m/s2 RMS the bench provided a maximum total harmonic distortion (THD) of 15% at 4 Hz and 20
m/s2 (22). With both increasing frequency and decreasing amplitude the THD dropped to a minimum of 0.002%
at 250 Hz and 0.2 m/s2. During the same tests, a linear fore-and-aft direction acceleration measurement was also
performed at the same point on the rigid wheel. Fore-and-aft acceleration was found to be no greater than –50
dB with respect to the tangential acceleration in all cases measured.
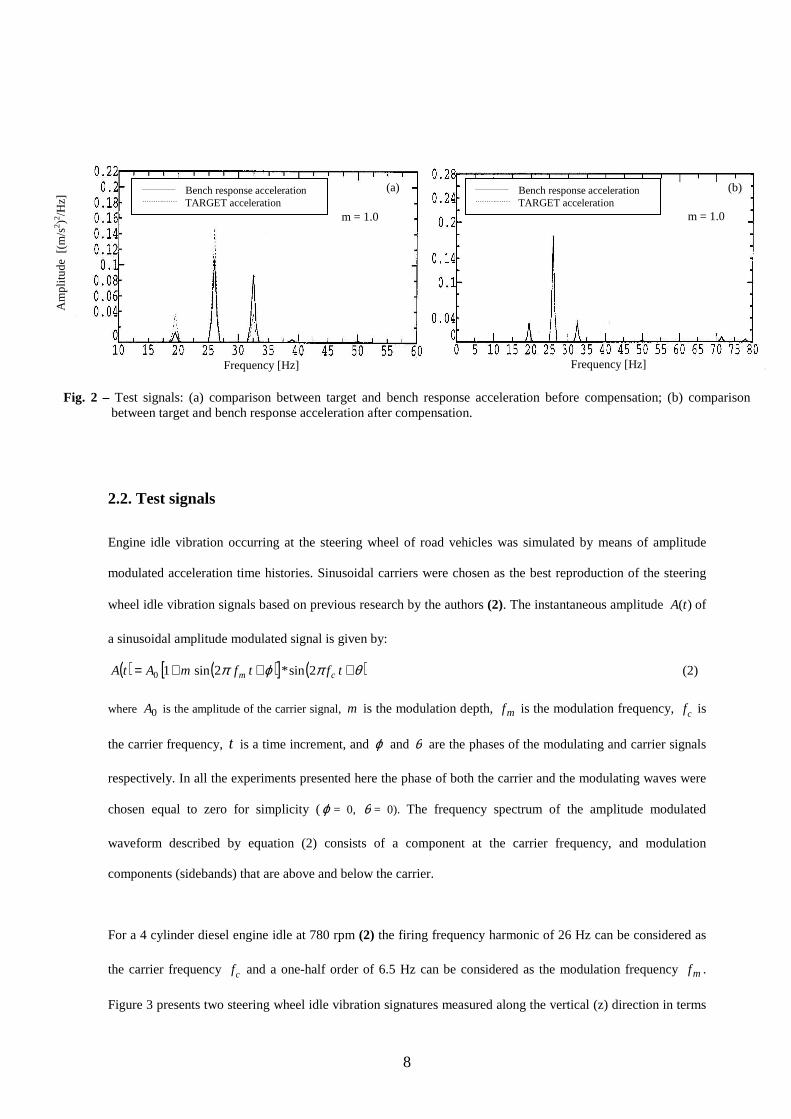
Pretesting using amplitude modulated test stimuli showed that the dynamic response of the test bench produced
unequal harmonic sidebands due to the frequency response of the shaker. Compensated drive voltage signals
were therefore defined which included the effect of shaker frequency response. Figure 2 presents the power
spectral density (PSD) of the target test stimuli and of the bench response signals at a modulation depth of m =
1.0 for both the uncompensated (Fig. 2a) and compensated (Fig. 2b) drive voltage signals. With frequency
compensation the modulated acceleration stimuli were reproduced at the human test subject with RMS errors of
less than 5%.
8
2.2. Test signals
Engine idle vibration occurring at the steering wheel of road vehicles was simulated by means of amplitude
modulated acceleration time histories. Sinusoidal carriers were chosen as the best reproduction of the steering
wheel idle vibration signals based on previous research by the authors (2). The instantaneous amplitude )(tA of
a sinusoidal amplitude modulated signal is given by:
( ) ( )[ ] ( )θπϕπ +++= tftfmAtA cm 2sin*2sin10 (2)
where 0A is the amplitude of the carrier signal, m is the modulation depth, mf is the modulation frequency, cf is
the carrier frequency, t is a time increment, and ϕ and θ are the phases of the modulating and carrier signals
respectively. In all the experiments presented here the phase of both the carrier and the modulating waves were
chosen equal to zero for simplicity (ϕ = 0, θ = 0). The frequency spectrum of the amplitude modulated
waveform described by equation (2) consists of a component at the carrier frequency, and modulation
components (sidebands) that are above and below the carrier.
For a 4 cylinder diesel engine idle at 780 rpm (2) the firing frequency harmonic of 26 Hz can be considered as
the carrier frequency cf and a one-half order of 6.5 Hz can be considered as the modulation frequency mf .
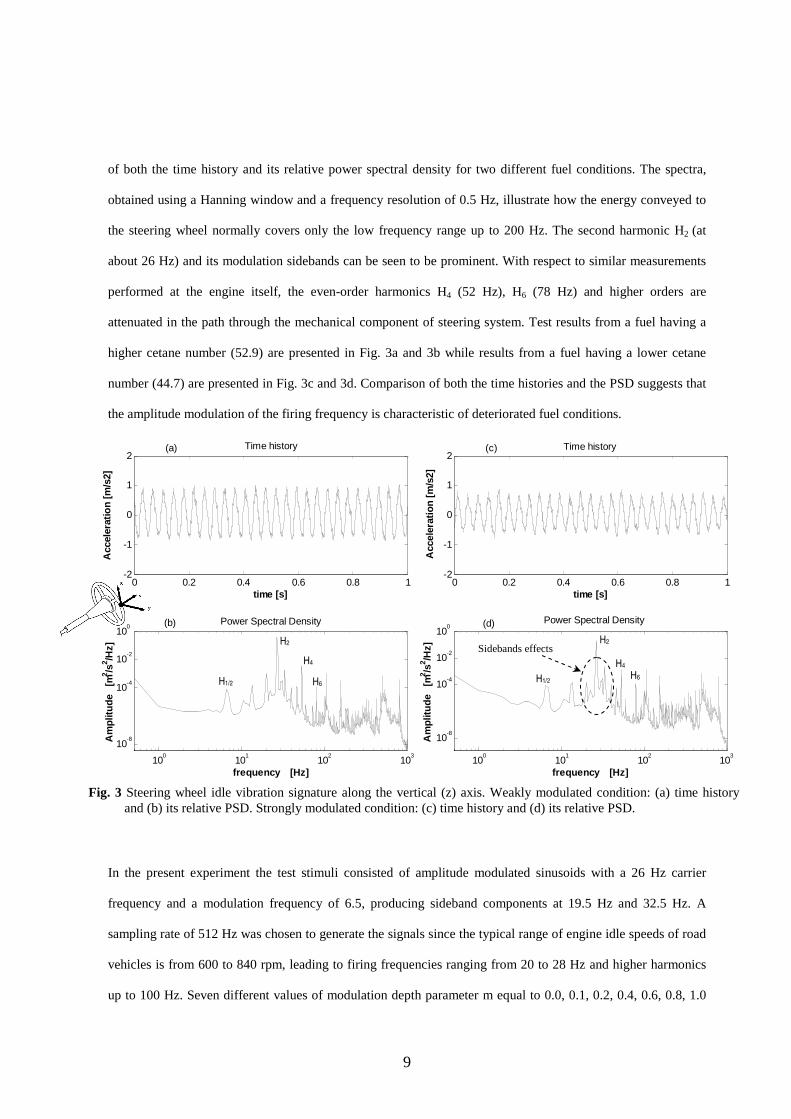
Figure 3 presents two steering wheel idle vibration signatures measured along the vertical (z) direction in terms
Fig. 2 – Test signals: (a) comparison between target and bench response acceleration before compensation; (b) comparison between target and bench response acceleration after compensation.
m = 1.0 m = 1.0
(a) (b)
Am
plit
ud
e [
(m/s2 )2 /H
z] __________ Bench response acceleration
……….…… TARGET acceleration
Frequency [Hz] Frequency [Hz]
__________ Bench response acceleration ……….…… TARGET acceleration
9
of both the time history and its relative power spectral density for two different fuel conditions. The spectra,
obtained using a Hanning window and a frequency resolution of 0.5 Hz, illustrate how the energy conveyed to
the steering wheel normally covers only the low frequency range up to 200 Hz. The second harmonic H2 (at
about 26 Hz) and its modulation sidebands can be seen to be prominent. With respect to similar measurements
performed at the engine itself, the even-order harmonics H4 (52 Hz), H6 (78 Hz) and higher orders are
attenuated in the path through the mechanical component of steering system. Test results from a fuel having a
higher cetane number (52.9) are presented in Fig. 3a and 3b while results from a fuel having a lower cetane
number (44.7) are presented in Fig. 3c and 3d. Comparison of both the time histories and the PSD suggests that
the amplitude modulation of the firing frequency is characteristic of deteriorated fuel conditions.
In the present experiment the test stimuli consisted of amplitude modulated sinusoids with a 26 Hz carrier
frequency and a modulation frequency of 6.5, producing sideband components at 19.5 Hz and 32.5 Hz. A
sampling rate of 512 Hz was chosen to generate the signals since the typical range of engine idle speeds of road
vehicles is from 600 to 840 rpm, leading to firing frequencies ranging from 20 to 28 Hz and higher harmonics
up to 100 Hz. Seven different values of modulation depth parameter m equal to 0.0, 0.1, 0.2, 0.4, 0.6, 0.8, 1.0
0 0.2 0.4 0.6 0.8 1-2
-1
0
1
2
Acc
eler
atio
n [m
/s2]
time [s]
Time history
0 0.2 0.4 0.6 0.8 1-2
-1
0
1
2Time history
Acc
eler
atio
n [m
/s2]
time [s]
100
101
102
103
10-8
10-4
10-2
100
frequency [Hz]
Am
plitu
de
[m2 /s
2 /Hz]
Power Spectral Density
100
101
102
103
10-8
10-4
10-2
100
frequency [Hz]
Am
plitu
de
[m2 /s
2 /Hz]
Power Spectral Density
(a) (c)
(b) (d)
H2
H4
H6
H2
H4
H6
Sidebands effects
H1/2 H1/2
Fig. 3 Steering wheel idle vibration signature along the vertical (z) axis. Weakly modulated condition: (a) time history and (b) its relative PSD. Strongly modulated condition: (c) time history and (d) its relative PSD.
10
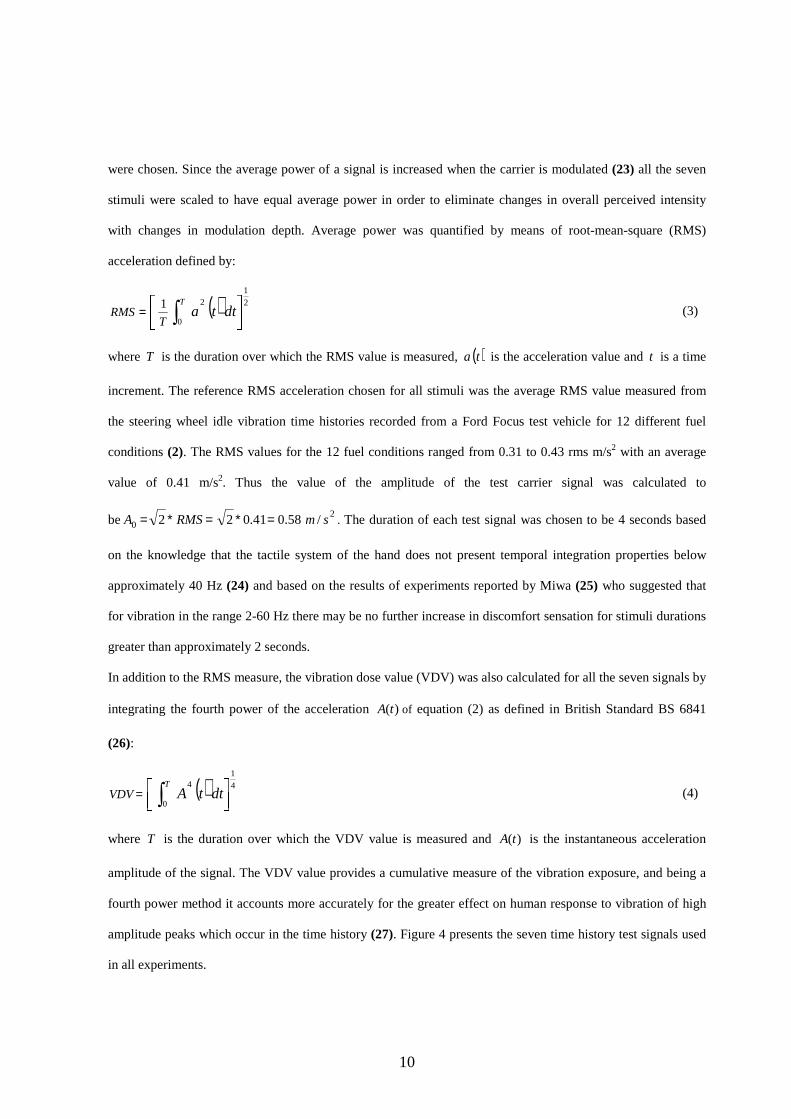
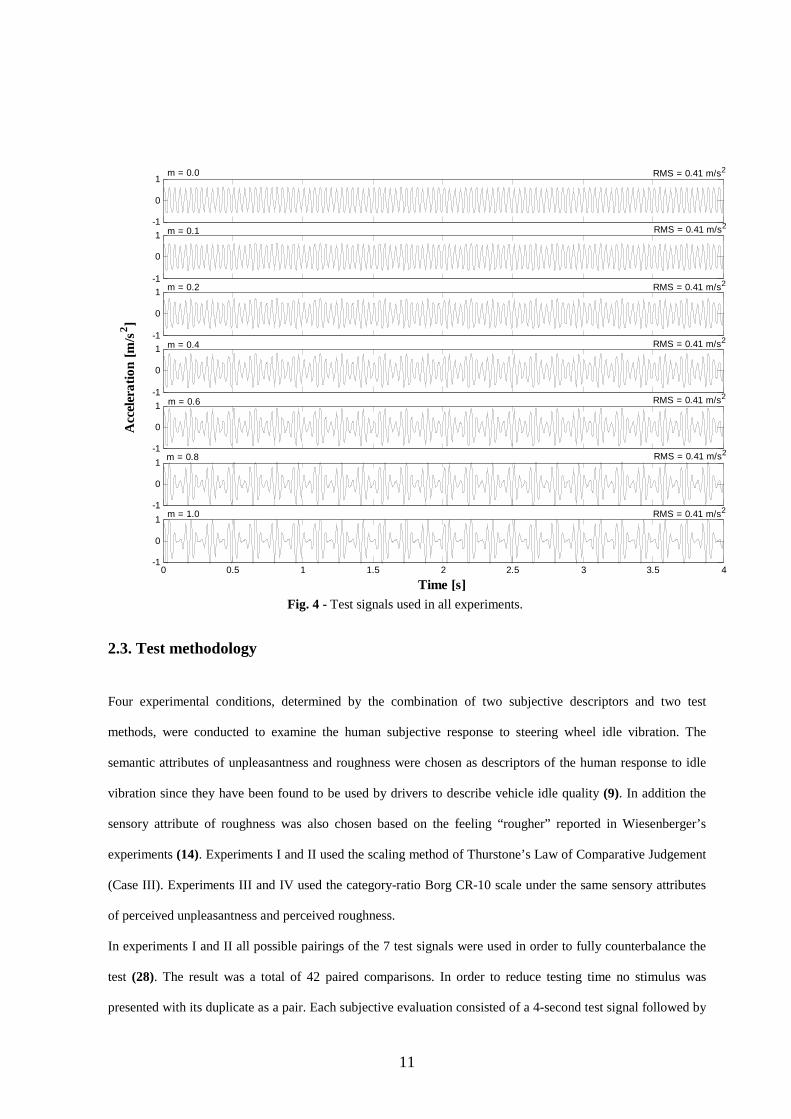
were chosen. Since the average power of a signal is increased when the carrier is modulated (23) all the seven
stimuli were scaled to have equal average power in order to eliminate changes in overall perceived intensity
with changes in modulation depth. Average power was quantified by means of root-mean-square (RMS)
acceleration defined by:
( ) 2
1
0
21 ∫=T
dttaT
RMS (3)
where T is the duration over which the RMS value is measured, ( )ta is the acceleration value and t is a time
increment. The reference RMS acceleration chosen for all stimuli was the average RMS value measured from
the steering wheel idle vibration time histories recorded from a Ford Focus test vehicle for 12 different fuel
conditions (2). The RMS values for the 12 fuel conditions ranged from 0.31 to 0.43 rms m/s2 with an average
value of 0.41 m/s2. Thus the value of the amplitude of the test carrier signal was calculated to
be 20 /58.041.022 smRMSA =∗=∗= . The duration of each test signal was chosen to be 4 seconds based
on the knowledge that the tactile system of the hand does not present temporal integration properties below
approximately 40 Hz (24) and based on the results of experiments reported by Miwa (25) who suggested that
for vibration in the range 2-60 Hz there may be no further increase in discomfort sensation for stimuli durations
greater than approximately 2 seconds.
In addition to the RMS measure, the vibration dose value (VDV) was also calculated for all the seven signals by
integrating the fourth power of the acceleration )(tA of equation (2) as defined in British Standard BS 6841
(26):
( ) 41
0
4 ∫=T
dttAVDV (4)
where T is the duration over which the VDV value is measured and )(tA is the instantaneous acceleration
amplitude of the signal. The VDV value provides a cumulative measure of the vibration exposure, and being a
fourth power method it accounts more accurately for the greater effect on human response to vibration of high
amplitude peaks which occur in the time history (27). Figure 4 presents the seven time history test signals used
in all experiments.
11
2.3. Test methodology
Four experimental conditions, determined by the combination of two subjective descriptors and two test
methods, were conducted to examine the human subjective response to steering wheel idle vibration. The
semantic attributes of unpleasantness and roughness were chosen as descriptors of the human response to idle
vibration since they have been found to be used by drivers to describe vehicle idle quality (9). In addition the
sensory attribute of roughness was also chosen based on the feeling “rougher” reported in Wiesenberger’s
experiments (14). Experiments I and II used the scaling method of Thurstone’s Law of Comparative Judgement
(Case III). Experiments III and IV used the category-ratio Borg CR-10 scale under the same sensory attributes
of perceived unpleasantness and perceived roughness.
In experiments I and II all possible pairings of the 7 test signals were used in order to fully counterbalance the
test (28). The result was a total of 42 paired comparisons. In order to reduce testing time no stimulus was
presented with its duplicate as a pair. Each subjective evaluation consisted of a 4-second test signal followed by
Fig. 4 - Test signals used in all experiments.
-1
0
1
-1
0
1
-1
0
1
-1
0
1
-1
0
1
-1
0
1
0 0.5 1 1.5 2 2.5 3 3.5 4-1
0
1
Time [s]
Acc
eler
atio
n [m
/s2 ]
RMS = 0.41 m/s2
RMS = 0.41 m/s2
RMS = 0.41 m/s2
RMS = 0.41 m/s2
RMS = 0.41 m/s2
RMS = 0.41 m/s2
RMS = 0.41 m/s2
m = 0.0
m = 0.1
m = 0.2
m = 0.4
m = 0.6
m = 0.8
m = 1.0
12
a 2-second gap followed by the other 4-second test signal. Each paired comparison therefore required 10
seconds, a duration which was chosen to keep the stimulus short enough to permit both signals to remain in
human short-term memory for tactile stimuli (29). To reduce learning and fatigue effects the order of
presentation of the 42 comparisons was randomized for each test subject. After presenting each stimuli pair the
test subject was asked to indicate which stimuli they considered to be “more unpleasant” in experiment I or the
“rougher” in experiment II. The complete paired comparison test (all 42 pairs) lasted 16 minutes for each test
subject.
In experiments III and IV perceived unpleasantness and perceived roughness of the vibration were assessed
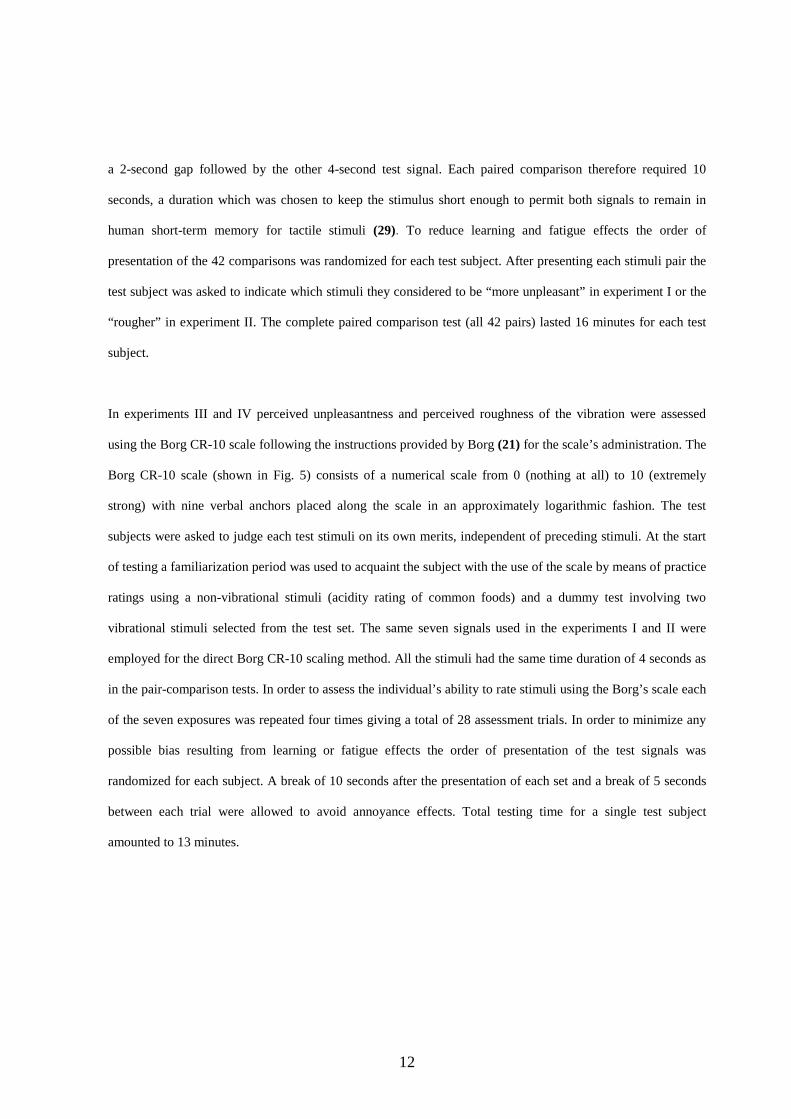
using the Borg CR-10 scale following the instructions provided by Borg (21) for the scale’s administration. The
Borg CR-10 scale (shown in Fig. 5) consists of a numerical scale from 0 (nothing at all) to 10 (extremely
strong) with nine verbal anchors placed along the scale in an approximately logarithmic fashion. The test
subjects were asked to judge each test stimuli on its own merits, independent of preceding stimuli. At the start
of testing a familiarization period was used to acquaint the subject with the use of the scale by means of practice
ratings using a non-vibrational stimuli (acidity rating of common foods) and a dummy test involving two
vibrational stimuli selected from the test set. The same seven signals used in the experiments I and II were
employed for the direct Borg CR-10 scaling method. All the stimuli had the same time duration of 4 seconds as
in the pair-comparison tests. In order to assess the individual’s ability to rate stimuli using the Borg’s scale each
of the seven exposures was repeated four times giving a total of 28 assessment trials. In order to minimize any
possible bias resulting from learning or fatigue effects the order of presentation of the test signals was
randomized for each subject. A break of 10 seconds after the presentation of each set and a break of 5 seconds
between each trial were allowed to avoid annoyance effects. Total testing time for a single test subject
amounted to 13 minutes.
13
2.4. Test subjects and test protocol
An independent group of 25 individuals was tested for each of the four test conditions. Upon arrival in the
laboratory each participant was given an information sheet and a consent form describing the purpose,
procedure, risks and time commitment for the research project. After providing written consent, subjects were
given a verbal description of the experiment and a short questionnaire regarding their physical characteristics,
health, driving experience and history of previous vibration exposure. The test groups consisted of Sheffield
University students and staff, whose age, height and weight characteristics are summarised in Table 2. On
average 88% of the subjects drove 2 to 10 hours daily and all declared that they were in good physical and
mental condition. Before commencing testing each subject was asked to remove any coats, watches or
jewellery, then to adjust the seat position and backrest angle so as to simulate a driving task as realistically as
possible. Subjects were required to maintain a constant palm grip (30) on the steering wheel using both hands,
as when driving on a winding country road. They were asked to wear ear protectors to avoid audio cues. During
the paired comparison experiment they were also asked to wear opaque glasses and to close their eyes to avoid
Fig. 5 - Borg's category ratio CR-10 scale (adapted from Borg (18)).
≈
14
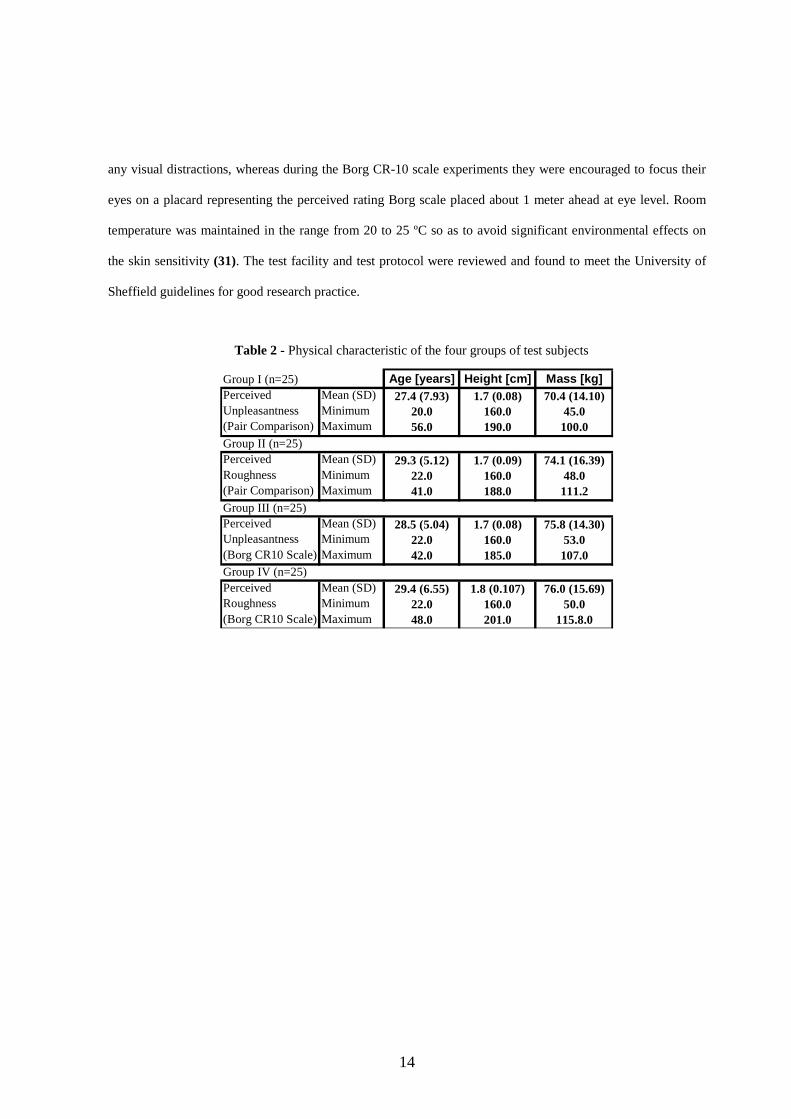
any visual distractions, whereas during the Borg CR-10 scale experiments they were encouraged to focus their
eyes on a placard representing the perceived rating Borg scale placed about 1 meter ahead at eye level. Room
temperature was maintained in the range from 20 to 25 ºC so as to avoid significant environmental effects on
the skin sensitivity (31). The test facility and test protocol were reviewed and found to meet the University of
Sheffield guidelines for good research practice.
Table 2 - Physical characteristic of the four groups of test subjects
Group I (n=25) Age [years] Height [cm] Mass [kg]Perceived Unpleasantness (Pair Comparison)
Mean (SD) Minimum Maximum
27.4 (7.93) 20.0 56.0
1.7 (0.08) 160.0 190.0
70.4 (14.10) 45.0 100.0
Group II (n=25) Perceived Roughness (Pair Comparison)
Mean (SD) Minimum Maximum
29.3 (5.12) 22.0 41.0
1.7 (0.09) 160.0 188.0
74.1 (16.39) 48.0 111.2
Group III (n=25) Perceived Unpleasantness (Borg CR10 Scale)
Mean (SD) Minimum Maximum
28.5 (5.04) 22.0 42.0
1.7 (0.08) 160.0 185.0
75.8 (14.30) 53.0 107.0
Group IV (n=25) Perceived Roughness (Borg CR10 Scale)
Mean (SD) Minimum Maximum
29.4 (6.55) 22.0 48.0
1.8 (0.107) 160.0 201.0
76.0 (15.69) 50.0
115.8.0
15
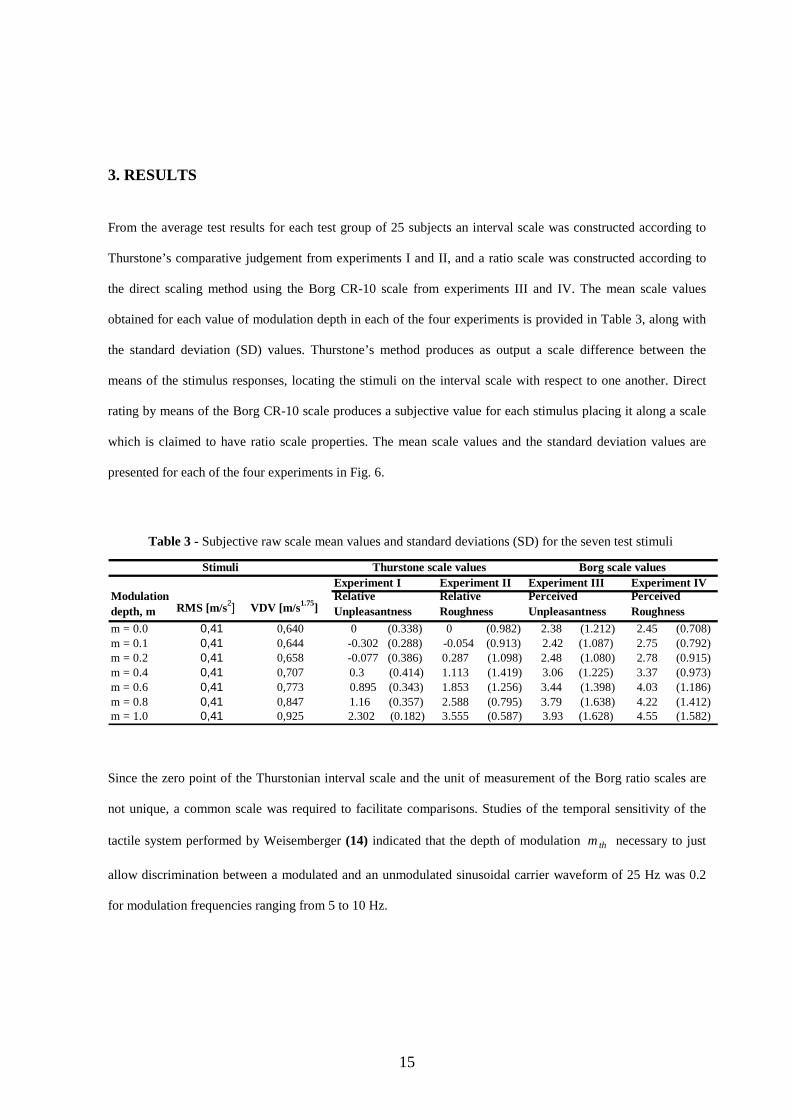
3. RESULTS
From the average test results for each test group of 25 subjects an interval scale was constructed according to
Thurstone’s comparative judgement from experiments I and II, and a ratio scale was constructed according to
the direct scaling method using the Borg CR-10 scale from experiments III and IV. The mean scale values
obtained for each value of modulation depth in each of the four experiments is provided in Table 3, along with
the standard deviation (SD) values. Thurstone’s method produces as output a scale difference between the
means of the stimulus responses, locating the stimuli on the interval scale with respect to one another. Direct
rating by means of the Borg CR-10 scale produces a subjective value for each stimulus placing it along a scale
which is claimed to have ratio scale properties. The mean scale values and the standard deviation values are
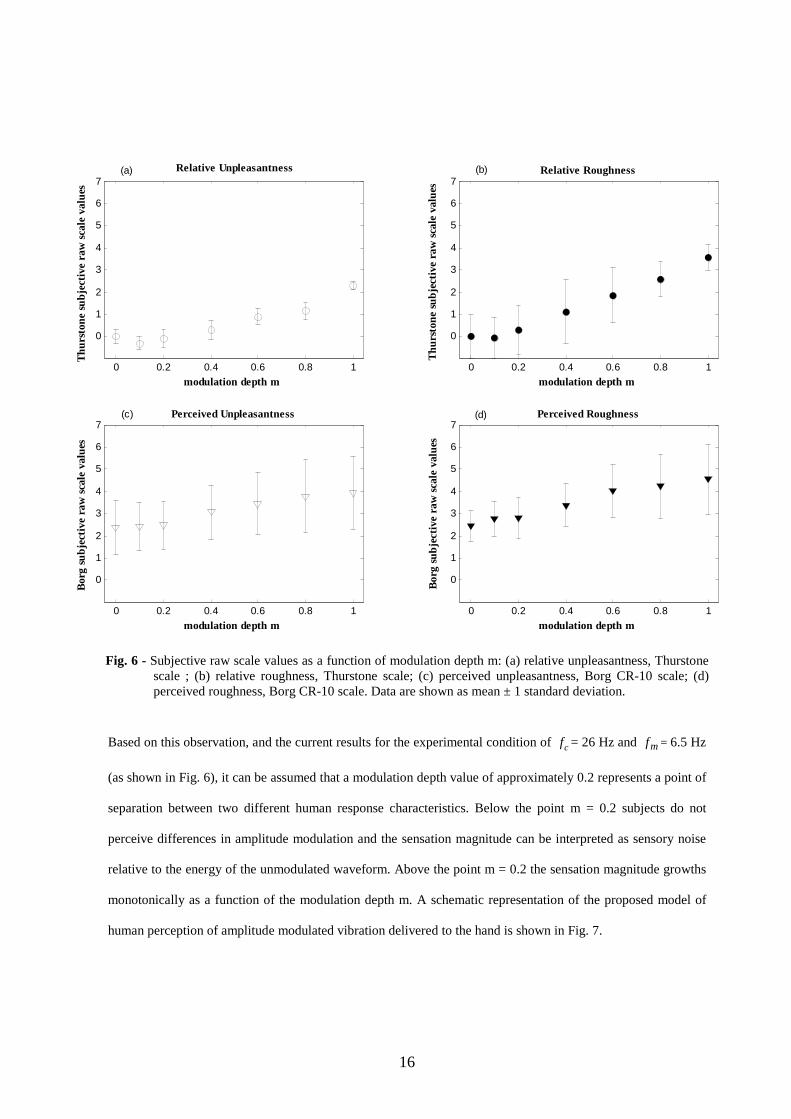
presented for each of the four experiments in Fig. 6.
Since the zero point of the Thurstonian interval scale and the unit of measurement of the Borg ratio scales are
not unique, a common scale was required to facilitate comparisons. Studies of the temporal sensitivity of the
tactile system performed by Weisemberger (14) indicated that the depth of modulation thm necessary to just
allow discrimination between a modulated and an unmodulated sinusoidal carrier waveform of 25 Hz was 0.2
for modulation frequencies ranging from 5 to 10 Hz.
Table 3 - Subjective raw scale mean values and standard deviations (SD) for the seven test stimuli
Experiment I Experiment II Experiment III Experiment IVModulation depth, m RMS [m/s2] VDV [m/s1.75]
Relative Unpleasantness
Relative Roughness
Perceived Unpleasantness
Perceived Roughness
m = 0.0 0,41 0,640 0 (0.338) 0 (0.982) 2.38 (1.212) 2.45 (0.708)m = 0.1 0,41 0,644 -0.302 (0.288) -0.054 (0.913) 2.42 (1.087) 2.75 (0.792)m = 0.2 0,41 0,658 -0.077 (0.386) 0.287 (1.098) 2.48 (1.080) 2.78 (0.915)m = 0.4 0,41 0,707 0.3 (0.414) 1.113 (1.419) 3.06 (1.225) 3.37 (0.973)m = 0.6 0,41 0,773 0.895 (0.343) 1.853 (1.256) 3.44 (1.398) 4.03 (1.186)m = 0.8 0,41 0,847 1.16 (0.357) 2.588 (0.795) 3.79 (1.638) 4.22 (1.412)m = 1.0 0,41 0,925 2.302 (0.182) 3.555 (0.587) 3.93 (1.628) 4.55 (1.582)
Stimuli Thurstone scale values Borg scale values
16
Based on this observation, and the current results for the experimental condition of cf = 26 Hz and mf = 6.5 Hz
(as shown in Fig. 6), it can be assumed that a modulation depth value of approximately 0.2 represents a point of
separation between two different human response characteristics. Below the point m = 0.2 subjects do not
perceive differences in amplitude modulation and the sensation magnitude can be interpreted as sensory noise
relative to the energy of the unmodulated waveform. Above the point m = 0.2 the sensation magnitude growths
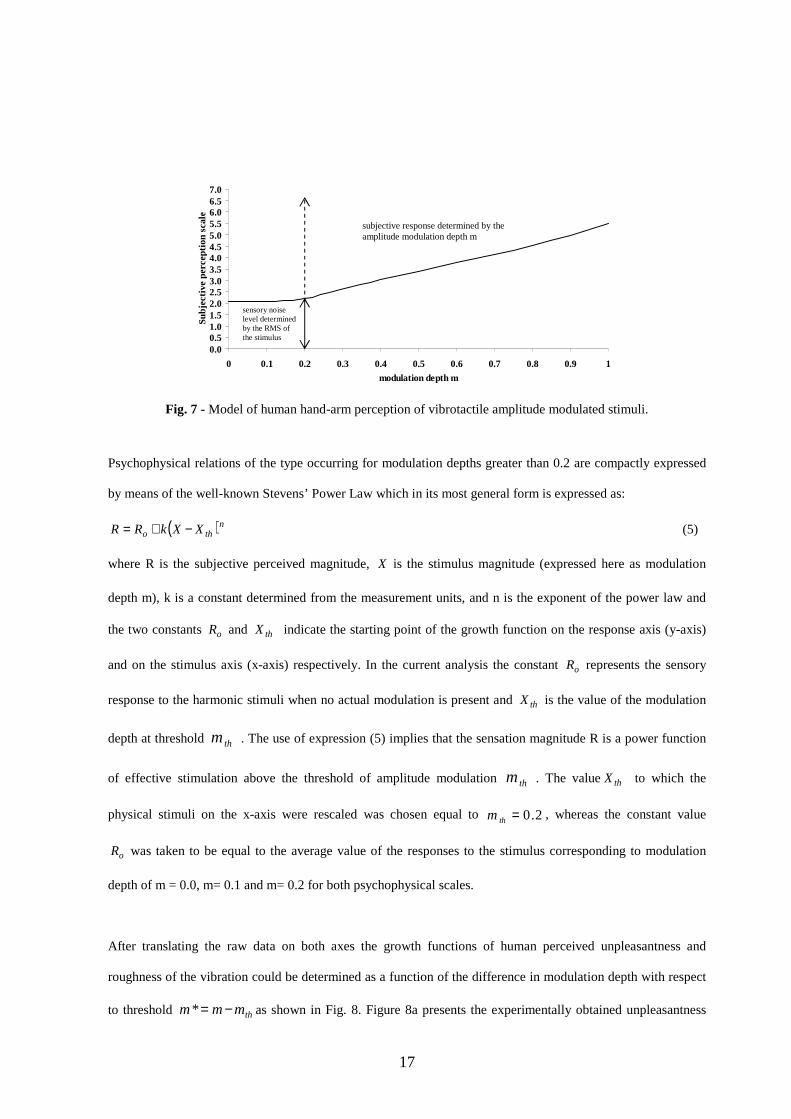
monotonically as a function of the modulation depth m. A schematic representation of the proposed model of
human perception of amplitude modulated vibration delivered to the hand is shown in Fig. 7.
0 0.2 0.4 0.6 0.8 1
0
1
2
3
4
5
6
7
modulation depth m
Thu
rsto
ne s
ubj
ectiv
e ra
w s
cale
val
ues
Relative Unpleasantness
0 0.2 0.4 0.6 0.8 1
0
1
2
3
4
5
6
7
modulation depth m
Thu
rsto
ne s
ubje
ctiv
e ra
w s
cale
val
ues
Relative Roughness
0 0.2 0.4 0.6 0.8 1
0
1
2
3
4
5
6
7
modulation depth m
Bor
g su
bjec
tive
raw
sca
le v
alue
s
Perceived Unpleasantness
0 0.2 0.4 0.6 0.8 1
0
1
2
3
4
5
6
7
modulation depth m
Bor
g su
bje
ctiv
e ra
w s
cale
val
ues
Perceived Roughness
(a) (b)
(c) (d)
Fig. 6 - Subjective raw scale values as a function of modulation depth m: (a) relative unpleasantness, Thurstone scale ; (b) relative roughness, Thurstone scale; (c) perceived unpleasantness, Borg CR-10 scale; (d) perceived roughness, Borg CR-10 scale. Data are shown as mean ± 1 standard deviation.
17
Psychophysical relations of the type occurring for modulation depths greater than 0.2 are compactly expressed
by means of the well-known Stevens’ Power Law which in its most general form is expressed as:
( )ntho XXkRR −+= (5)
where R is the subjective perceived magnitude, X is the stimulus magnitude (expressed here as modulation
depth m), k is a constant determined from the measurement units, and n is the exponent of the power law and
the two constants oR and thX indicate the starting point of the growth function on the response axis (y-axis)
and on the stimulus axis (x-axis) respectively. In the current analysis the constant oR represents the sensory
response to the harmonic stimuli when no actual modulation is present and thX is the value of the modulation
depth at threshold thm . The use of expression (5) implies that the sensation magnitude R is a power function
of effective stimulation above the threshold of amplitude modulation thm . The value thX to which the
physical stimuli on the x-axis were rescaled was chosen equal to 2.0=thm , whereas the constant value
oR was taken to be equal to the average value of the responses to the stimulus corresponding to modulation
depth of m = 0.0, m= 0.1 and m= 0.2 for both psychophysical scales.
After translating the raw data on both axes the growth functions of human perceived unpleasantness and
roughness of the vibration could be determined as a function of the difference in modulation depth with respect
to threshold thmmm −=* as shown in Fig. 8. Figure 8a presents the experimentally obtained unpleasantness
Fig. 7 - Model of human hand-arm perception of vibrotactile amplitude modulated stimuli.
0.00.51.01.52.02.53.03.54.04.55.05.56.06.57.0
0 0.1 0.2 0.3 0.4 0.5 0.6 0.7 0.8 0.9 1
modulation depth m
Sub
ject
ive
perc
eptio
n sc
ale
subjective response determined by the amplitude modulation depth m
sensory noise level determined by the RMS of the stimulus
18
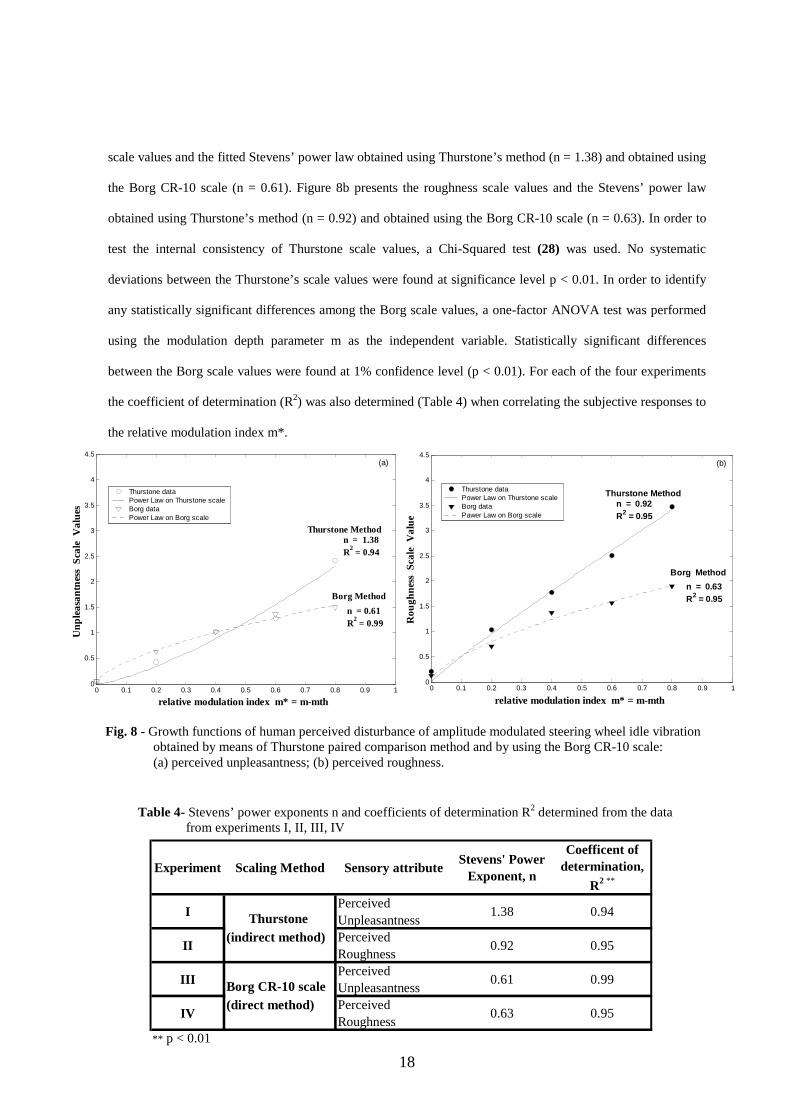
scale values and the fitted Stevens’ power law obtained using Thurstone’s method (n = 1.38) and obtained using
the Borg CR-10 scale (n = 0.61). Figure 8b presents the roughness scale values and the Stevens’ power law
obtained using Thurstone’s method (n = 0.92) and obtained using the Borg CR-10 scale (n = 0.63). In order to
test the internal consistency of Thurstone scale values, a Chi-Squared test (28) was used. No systematic
deviations between the Thurstone’s scale values were found at significance level p < 0.01. In order to identify
any statistically significant differences among the Borg scale values, a one-factor ANOVA test was performed
using the modulation depth parameter m as the independent variable. Statistically significant differences
between the Borg scale values were found at 1% confidence level (p < 0.01). For each of the four experiments
the coefficient of determination (R2) was also determined (Table 4) when correlating the subjective responses to
the relative modulation index m*.
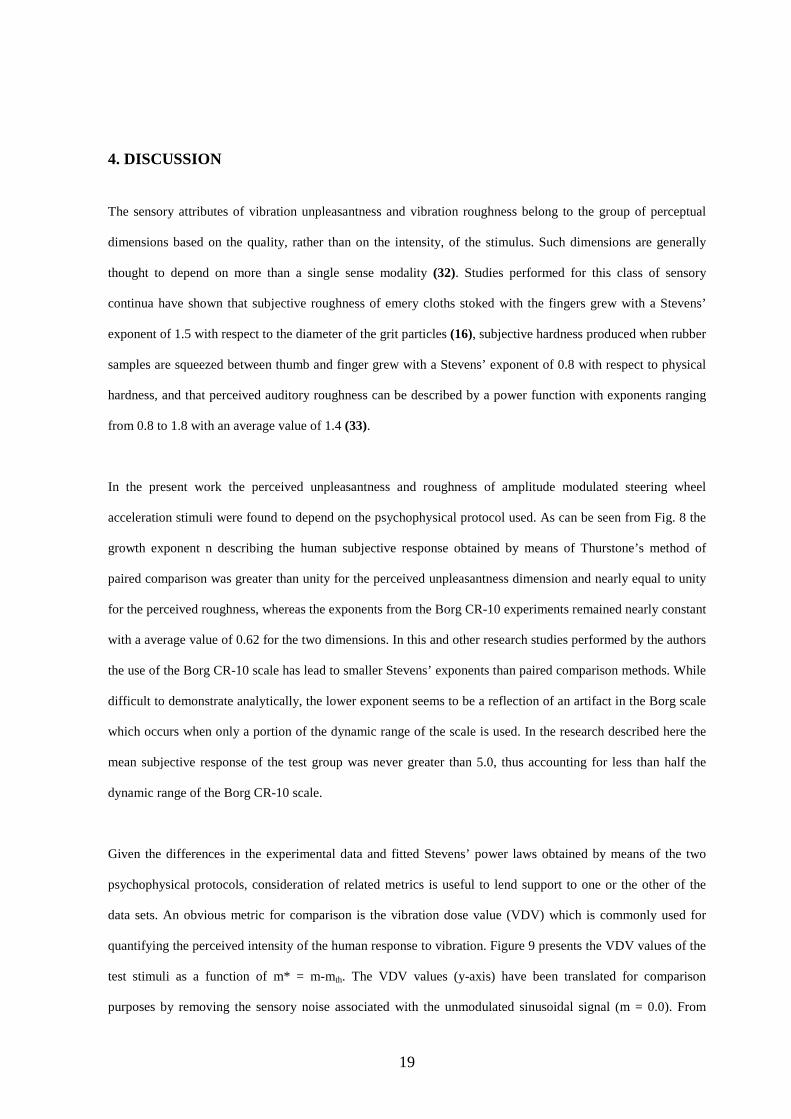
Table 4- Stevens’ power exponents n and coefficients of determination R2 determined from the data from experiments I, II, III, IV
Experiment Scaling Method Sensory attributeStevens' Power
Exponent, n
Coefficent of determination,
R2 **
I Thurstone Perceived Unpleasantness
1.38 0.94
II(indirect method) Perceived
Roughness0.92 0.95
III Borg CR-10 scalePerceived Unpleasantness
0.61 0.99
IV(direct method) Perceived
Roughness0.63 0.95
** p < 0.01
Fig. 8 - Growth functions of human perceived disturbance of amplitude modulated steering wheel idle vibration obtained by means of Thurstone paired comparison method and by using the Borg CR-10 scale: (a) perceived unpleasantness; (b) perceived roughness.
0 0.1 0.2 0.3 0.4 0.5 0.6 0.7 0.8 0.9 10
0.5
1
1.5
2
2.5
3
3.5
4
4.5
relative modulation index m* = m-mth
Unp
lea
sant
nes
s S
cale
V
alu
es
Thurstone dataPower Law on Thurstone scaleBorg dataPower Law on Borg scale
n = 1.38R2 = 0.94
Thurstone Method
Borg Method
n = 0.61 R2 = 0.99
(a)
0 0.1 0.2 0.3 0.4 0.5 0.6 0.7 0.8 0.9 10
0.5
1
1.5
2
2.5
3
3.5
4
4.5
relative modulation index m* = m-mth
Ro
ug
hnes
s S
cale
V
alu
e
Thurstone dataPower Law on Thurstone scaleBorg dataPawer Law on Borg scale
Thurstone Method
Borg Method
n = 0.63R2 = 0.95
n = 0.92R2 = 0.95
(b)
19
4. DISCUSSION
The sensory attributes of vibration unpleasantness and vibration roughness belong to the group of perceptual
dimensions based on the quality, rather than on the intensity, of the stimulus. Such dimensions are generally
thought to depend on more than a single sense modality (32). Studies performed for this class of sensory
continua have shown that subjective roughness of emery cloths stoked with the fingers grew with a Stevens’
exponent of 1.5 with respect to the diameter of the grit particles (16), subjective hardness produced when rubber
samples are squeezed between thumb and finger grew with a Stevens’ exponent of 0.8 with respect to physical
hardness, and that perceived auditory roughness can be described by a power function with exponents ranging
from 0.8 to 1.8 with an average value of 1.4 (33).
In the present work the perceived unpleasantness and roughness of amplitude modulated steering wheel
acceleration stimuli were found to depend on the psychophysical protocol used. As can be seen from Fig. 8 the
growth exponent n describing the human subjective response obtained by means of Thurstone’s method of
paired comparison was greater than unity for the perceived unpleasantness dimension and nearly equal to unity
for the perceived roughness, whereas the exponents from the Borg CR-10 experiments remained nearly constant
with a average value of 0.62 for the two dimensions. In this and other research studies performed by the authors
the use of the Borg CR-10 scale has lead to smaller Stevens’ exponents than paired comparison methods. While
difficult to demonstrate analytically, the lower exponent seems to be a reflection of an artifact in the Borg scale
which occurs when only a portion of the dynamic range of the scale is used. In the research described here the
mean subjective response of the test group was never greater than 5.0, thus accounting for less than half the
dynamic range of the Borg CR-10 scale.
Given the differences in the experimental data and fitted Stevens’ power laws obtained by means of the two
psychophysical protocols, consideration of related metrics is useful to lend support to one or the other of the
data sets. An obvious metric for comparison is the vibration dose value (VDV) which is commonly used for
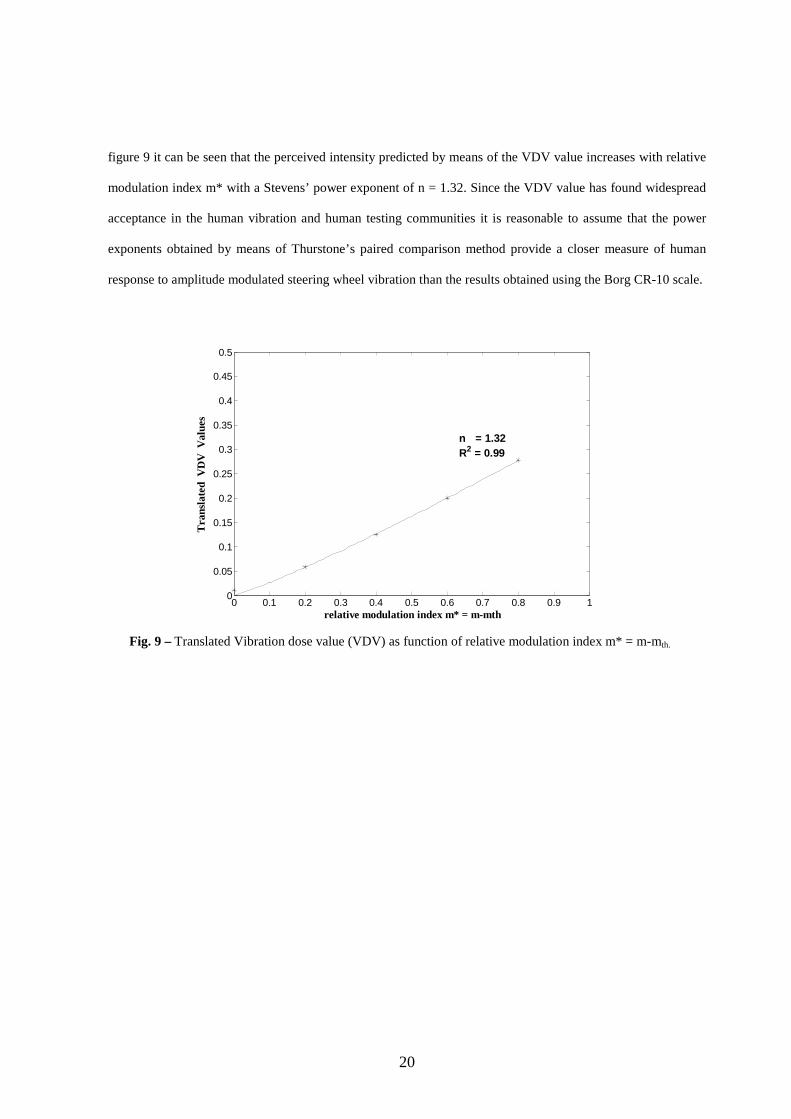
quantifying the perceived intensity of the human response to vibration. Figure 9 presents the VDV values of the
test stimuli as a function of m* = m-mth. The VDV values (y-axis) have been translated for comparison
purposes by removing the sensory noise associated with the unmodulated sinusoidal signal (m = 0.0). From
20
figure 9 it can be seen that the perceived intensity predicted by means of the VDV value increases with relative
modulation index m* with a Stevens’ power exponent of n = 1.32. Since the VDV value has found widespread
acceptance in the human vibration and human testing communities it is reasonable to assume that the power
exponents obtained by means of Thurstone’s paired comparison method provide a closer measure of human
response to amplitude modulated steering wheel vibration than the results obtained using the Borg CR-10 scale.
Fig. 9 – Translated Vibration dose value (VDV) as function of relative modulation index m* = m-mth.
0 0.1 0.2 0.3 0.4 0.5 0.6 0.7 0.8 0.9 10
0.05
0.1
0.15
0.2
0.25
0.3
0.35
0.4
0.45
0.5
relative modulation index m* = m-mth
Tra
nsla
ted
VD
V V
alue
s
n = 1.32 R2 = 0.99
21
5. CONCLUSIONS
The purpose of this study was to quantify the human subjective response to steering wheel vibration caused by
diesel engine idle. Based on the results of previous investigations by the authors diesel engine idle vibration
stimuli occurring at the steering wheel of automobiles was modeled as an amplitude modulated harmonic signal
having a carrier frequency of 26 Hz, a modulation frequency of 6.5 Hz and a RMS energy level of 0.41 m/s2.
Evaluations of seven levels of modulation depth parameter m (0.0, 0.1, 0.2, 0.4, 0.6, 0.8, 1.0) were performed in
order to define the growth function of the human perceived disturbance. Two semantic descriptors of the human
response and two psychophysical test protocols were used. The semantic attributes of unpleasantness and
roughness were chosen as descriptors of the human response to idle vibration exposure, and the human
subjective evaluations were performed by means of Thurstone’s method of paired comparison (Case III) and by
means of the category-ratio Borg CR-10 scale. The results suggest that there is a critical value of modulation
depth m = 0.2 below which human subjects cannot perceive differences in amplitude modulation and above
which the stimulus-response relationship increases monotonically with a power function. Thurstone’s paired
comparison indirect scaling method appears to be more effective in assessing amplitude modulated steering
wheel vibration than direct evaluation using the Borg CR-10 scale. Stevens’ power exponents suggest that the
perceived unpleasantness is nonlinearly dependent on modulation depth m with an exponent greater than 1 and
that the perceived roughness is dependent with an exponent close to unity.
6. ACKNOWLEDGEMENTS
The authors would like to express their gratitude to Dr. Gautam Kalghatgi and to Shell Global Solutions UK for
their sponsorship and support.
22
7. REFERENCES
1. Dalpiaz, G., Rivola, A. and Rubini, R., Effectiveness and sensitivity of vibration processing techniques for local fault detection in gears. Mechanical System and Signal Processing, 2000. 14(3): p. 387-412.
2. Ajovalasit, M. and Giacomin, J., Analysis of variations in diesel engine idle vibration. Proc. Instn. Mech. Engrs Part D, 2003. 217: p. 921-933.
3. Demers, M.A., Steering wheel vibration diagnosis. SAE paper 011607, 2001.
4. Hinze, P.C. and Cheng, W.K., Assessing the factors affecting SI engine cycle-to-cycle variations at idle. 27th Symposium (International) on Combustion / The Combustion Institute, 1998. 1-2: p. 2119-2125.
5. Dixon, J., Rhodes, D.M. and Phillips, A.V., The generation of engine half orders by structural deformation. Proceedings of IMechE Conference on Vehicle NVH and Refinement, paper C487/032/94, 1994: p. 9-17.
6. Lichty, L.C. , Combustion engine processes. 1967, Nw York: McGraw-Hill Book Company.
7. Rahnejat, H., Multi-body Dynamics: Vehicles, Machines and mechanisms. 1998, Bury St Edmunds, UK: Professional Engineering Publishing Limited.
8. Priede, T., Noise and Vibration Control of the Internal Combustion Reciprocating Engine, in Noise and Vibration Control Engineering: Principles and Applications, L.L.a.V. Bernarek, I.L., Editor. 1992, John Wiley & Sons, Inc.: New York. p. 665-707.
9. Hoard, J. and Rehagen, L., Relating subjective idle quality to engine combustion. SAE paper 970035, 1997: p. 1-5.
10. Verrilo, R.T. , Psychophysics of vibrotactile stimulation. J. Acoust. Soc. Am, 1985. 77(1): p. 225-232.
11. Morioka, M. Effect of contact location on vibration perception threshold in the glabrous skin of the human hand. in 34th United Kingdom Group Meeting on Human Responses to Vibration. 1999. Ford Motor Company, Dunton, Essex, England, 22-24 September.
12. Gescheider, G.A., Bolanowski Jr, S.J., Verrillo, R.T., Arpajian, D.J. and Ryan, T.F., Vibrotactile intensity discrimination measured by three methods. J. Acoust. Soc. Am, 1990. 87(1): p. 330-338.
13. Bensmaïa, S.J. and Hollins, M., Complex tactile waveform discrimination. J. Acoust. Soc. Am, 2000. 108(3): p. 1236-1245.
14. Weisenberger, J.M., Sensitivity to amplitude-modulated vibrotactile signals. J. Acoust. Soc. Am, 1986. 80(6): p. 1707-1715.
15. Lamoré, P.J.J., Envelope detection of amplitude-modulated high-frequency sinusoidal signals by skin mechanoreceptors. J. Acoust. Soc. Am, 1986. 79(4): p. 1082-1085.
16. Stevens, S.S. and Harris, J.R., The scaling of subjective roughness and smoothness. Journal of Experimental Psychology, 1962. 64(5): p. 489-494.
17. Franzén, O., The dependence of vibrotactile threshold and magnitude functions on stimulation frequency and signal level. Scand. J. Psychol., 1969. 10: p. 289-297.
23
18. Stevens, S.S., A metric for the social consensus. Science, 1966. 151: p. 530-541.
19. Ekman, G. and Kûnnapas, T., A further study of direct and indirect scaling methods. Scand. J. Psychol., 1963. 4: p. 77-80.
20. Burros, R.H., A solution for case III of the law of comparative judgment. Psychometrika, 1954. 19(1): p. 57-64.
21. Borg, G., Borg's perceived exertion and pain scales. 1998, Champaign, IL: Human Kinetics.
22. Giacomin, J., Shayaa, M.S., Dormegnie, E. and Richard, L. , A frequency weighting for the evaluation of steering wheel rotational vibration. Accepted for publication by the Internal Journal of Industrial Ergonomics.
23. Viemeister, N.F., Temporal modulation transfer functions based upon modulation thresholds. J. Acoust. Soc. Am, 1979. 66(5): p. 1364-1380.
24. Gescheider, G.A., Hoffman, K.E., Harrison, M.A., Travis, M.L. and Bolanowski, S.J., The effects of masking on vibrotactile temporal summation in the detection of sinusoidal and noise signals. J. Acoust. Soc. Am, 1994. 95(2): p. 1006-1016.
25. Miwa, T. , Evaluation methods for vibration effect. Part 7. The vibration greatness of the pulses. Industrial Health, 1968. 7: p. 143-164.
26. British Standards Institution. Guide to measurement and evaluation of human exposure to whole-body mechanical vibration and shock. 1987, British Standards Institution: London.BS 6841
27. Griffin, M.J. , Handbook of Human Vibration. 1990, London: Academic Press.
28. Torgerson, W.S., Theory and method of scaling. 1958, New York: John Wiley & Sons, Inc.
29. Gilson, E.Q. and Baddeley, A.D., Tactile short-term memory. Quartely Journal of Experimental Psychology, 1969. 21: p. 180-184.
30. Reynolds, D.D. and Keith, R.H., Hand-arm vibration, Part 1: Analytical model of the vibration response characteristics of the hand. journal of Sound and Vibration, 1977. 51(2): p. 237-253.
31. Mechanical Vibration - Vibrotactile perception thresholds for the assessment of nerve dysfunction, Part 1: Methods of measurement at the fingertips. 2001, International Organization for Standardization.ISO 13091-1
32. Stevens, S.S., Psychophysics: introduction to its perceptual , neural and social prospects, ed. G. Stevens. 1986, New Brunswick, U.S.A.: Transaction Books.
33. Guirao, M. and Garavilla, J.M., Perceived roughness of amplitude-modulated tones and noise. J. Acoust. Soc. Am, 1976. 60(6): p. 1335-1338.