Embed Size (px)
Citation preview

1
Human Resources Capacity
Benchmarking
A Preliminary Toolkit for Planning and
Management in Africa

i
© Cities Alliance, 2017 Rue Royale 94 1000 Brussels Belgium
http://www.citiesalliance.org
The material in this publication is copyrighted. Requests for
permission to reproduce whole or portions of it should be
directed to the Cities Alliance Secretariat at the email address
above. Cities Alliance encourages active dissemination of
its work. Permission to reproduce will normally be given and
- when the reproduction is for non-commercial purposes –
without requesting a fee.
Cover photos:
Cities Alliance
Author:
Richard Slater

ii
Contents
LIST OF KEY ABBREVIATIONS AND TERMS ........................................................................................................................... iii
1. ABOUT THE TOOLKIT .................................................................................................................................................... 4
WHY A TOOLKIT ON STAFFING?................................................................................................................................... 4
AIM OF THE TOOLKIT .................................................................................................................................................... 5
HOW TO USE THE TOOLKIT? ........................................................................................................................................ 5
2. UNDERSTANDING THE ‘GAP ANALYSIS MODEL’ ............................................................................................................ 7
WHAT DOES THE MODEL DO, AND HOW? .................................................................................................................. 7
METHODOLOGY AND CHOICE OF VARIABLES ............................................................................................................. 7
STAFFING REVIEW ...................................................................................................................................................... 10
KEY VARIABLES ............................................................................................................................................................ 11
MODEL ADJUSTMENTS ............................................................................................................................................... 11
LIMITATIONS OF THE MODEL .................................................................................................................................... 11
3. KEY FINDINGS ............................................................................................................................................................. 12
GAPS BY GEOGRAPHY ................................................................................................................................................. 12
GAP BY FUNCTION ...................................................................................................................................................... 13
GAP BY QUALIFICATIONS ........................................................................................................................................... 14
GAPS IN PAY PARITY ................................................................................................................................................... 14
GAPS IN SPAN OF CONTROL....................................................................................................................................... 16
GAPS AT THE CITY LEVEL: CASE ANALYSIS OF DIRE DAWA, ETHIOPIA ..................................................................... 17
4. WAY FORWARD .......................................................................................................................................................... 19
ANNEX I: PARAMETERS FOR ADJUSTING BENCHMARKS ..................................................................................................... 20
ANNEX 2: LITERATURE REFERENCES FOR REFINING METHODOLOGY ................................................................................. 25

iii
LIST OF KEY ABBREVIATIONS AND TERMS
PWD Public Works Department
SWM Solid Waste Management
TPD Tons per day
PSO Principal Sanitation Officer
O&M Operations and Maintenance
GIS Geographical Information System
ULB Urban Local Bodies

4
1. ABOUT THE TOOLKIT
WHY A TOOLKIT ON STAFFING?
Cities and towns in Sub-Saharan Africa are
experiencing a crisis in capacity that is insufficiently
recognised and poorly understood. The Future Cities
Africa Project has initiated work to understand the
depth and breadth of this crisis. This work has
analysed existing staff capacity in critical frontline
services and key support functions in 16 cities of
varying sizes across four countries.
The capacity of a city is one of the most critical
determinants of inclusive, resilient urban
development. Cities across Africa are faced with
mounting challenges of near-explosive levels of
urbanisation, growing informalisation, and
deteriorating services. These conditions have
prevented cities from transforming into engines of
inclusive growth.
The capacity trap
While municipalities are responsible for addressing
these challenges, they are often the weakest link in
government. Understaffed by under-qualified, poorly
paid and under-motivated employees, it is no surprise
that cities struggle to assume the multiple and
increasingly complex roles expected of them. The
Future Cities Africa Project has examined the capacity
trap that engulfs cities in Africa, undermining
infrastructure provision and service delivery.
Government size is an important policy issue. While
public employment is part of the service-producing
sector – one of the largest, fastest growing sectors in
the world – it imposes significant fiscal burdens. The
issue of optimal staffing looms large for government
and donor agendas; so much so that during the advent
of liberalisation in developing countries in the late 80s
and 90s, donors pushed for downsizing as a way to
enact administrative reforms and correct government
excesses.
Studies show that despite growing numbers of state
employees, developing countries continue to be
seriously short-staffed in many key functions1. The
problem is especially acute at sub-national levels in
developing countries that are grappling with weak
decentralization frameworks. This has been
exacerbated by a lack of overall funding to local
governments, competing fiscal needs for substantial
capital investment, and the need for major
rehabilitation to offset a legacy of neglect. As a result,
when it comes to staffing and resources, sub-national
governments are incapacitated both functionally and
physically.
To put this into perspective for Sub-Saharan Africa,
developed countries on average deploy 36 civil
servants per 1,000 people. The number for a large
developing country such as India with a population of
1.25 billion is 8 per 1,000. Our sample data from urban
local governments shows that even the most well-
staffed country in our sample has a mere 1.4 staff
members per 1,000 people. This high variation in
staffing at comparable governance levels runs parallel
to both intra-country and intra-institutional
differences. Little research, however, has focused on
the absence of internal staffing parity and how it
affects last-mile service delivery.
The public sector is at a further disadvantage, since as
it competes with the private sector for qualified staff
and lags in recruiting and staffing processes. This is
mainly because of differing compensation scales and
because the private sector dedicates more resources
to understanding gaps in human resource
management and how they impact efficiency.
Despite the situation, little has been done to empower
local governments to understand their staffing gaps
and address them accordingly.
1 See, World Bank (2005) East Asia Decentralizeises: Making Local Government Work; Indira Rajaraman (2008), ‘An empirical approach to the optimal size of the civil service’, Public Administration and Development 28(3):223 – 233; Government of India (2008)
‘Refurbishing of Personnel Administration - Scaling New Heights’, Tenth Administrative Reforms Commission Report.
THE KEY ISSUE
If local governments are resource-constrained, then it becomes imperative for them to understand how well they
are staffed, where the gaps are, and what trade-offs to make to achieve optimal service delivery.

5
AIM OF THE TOOLKIT
This toolkit provides a novel intervention in
understanding urban service delivery gaps. It takes
staffing as a key driver and an entry point to achieving
desired service-level standards and benchmarks.
• A model framework. The toolkit is a first attempt
to develop an analytical device that provides a
systematic, rational model for towns and cities in
Africa to conveniently and rapidly assess their
extant levels of staffing against a model
framework.
• Benchmarks for staffing levels. Careful
assessment and estimation of optimal staffing
levels required to perform key roles and tasks in
an efficient, effective manner were undertaken in
each of the following areas: municipal finance,
revenue, planning, engineering and public works,
and environmental health and solid waste
management. These benchmarks may be used to
examine current levels and norms and the
prevailing degree of under- or over-staffing.
• Better direction of resources. The toolkit
demonstrates differentiated gaps against a
benchmark, allowing urban local government to
see where best to direct resources and what
levels of recruitment, capacity development, and
training may be required, and at what cost.
• The data can be extrapolated to a wider
geographic area. A composite picture of the 16
sampled towns and cities in the four countries
may be used to approximate averages for a wider
geographical territory in Sub-Saharan Africa. This
data should prove useful in guiding policy
dialogues with ministries.
• Resource optimisation. This toolkit opens much
larger policy questions around the most efficient
way to ensure improved service delivery –
questions that are not being systematically
addressed in the current debate around the urban
transition in Africa. It can facilitate governments
at the national or local level to test alternate
staffing models to optimise resources available for
urban service delivery.
HOW TO USE THE TOOLKIT?
The toolkit is designed as a handy practitioners’ guide
to understanding staffing efficiency in urban local
government in Africa. It provides insights into:
1. Variations in urban local government features (population, area, finance, and service levels) for different categories of town.
2. Variations in municipal staffing numbers and patterns across categories of towns.
3. Staffing averages for each category.
4. Adjusted averages based on (population, area, finance, and service levels as relevant).
5. Variations as compared to the Model Benchmarks.
6. Variations in pay scales across public and private sectors.
7. Variations in staff qualifications.
While the current model has been designed for African
cities, it is adaptable to other continents and
expandable to other sectors of government – making
it an important tool for decision makers.

6
FIGURE 1: OPTIMUM MANPOWER DEVELOPMENT THROUGH THE MODEL FRAMEWORK
Gap analysis model Mapping target city on model
Result analysis Identifying gaps
Alternative models for service delivery
Prioritising gaps & cost-benefit analysis for bridging them
USING THE MODEL
STEP 1: REFER TO THE MODEL FRAMEWORK
A model staffing framework has been developed and detailed in this toolkit. It provides an optimal number of
staff and posts for efficient service delivery in select urban services including: environmental health and solid
waste management, public works, roads and street lighting, as well as administrative services including planning,
finance and revenue. These estimates are then adjusted according to key urban service variables such as
geographic area, population, density, number of properties, and total revenue (including transfer).
The model has been designed so that any end user may easily input the requisite date for a specific town to
generate a staffing gap analysis.
STEP 2: UNDERSTAND THE GAPS FOR YOUR TOWN/CITY
Mapping actual staffing data against the Model Framework will help identify the status of a city in terms of
staffing number, posts and capacity in relation to service standards in comparison with the Model Framework,
after adjusting for local variations. This analysis may be used to assess the degree of staffing undersupply or
oversupply, and the extent of correlation between staffing and current service levels (coverage and/ or quality).
STEP 3: GAP FILLING STRATEGIES
After completing steps 1, and 2, the user will have an approximate status of staffing levels and gaps for key
municipal service delivery functions. Equipped with this information, the user may then identify areas for more
detailed analysis, and explore various strategies/ models for address staffing gaps which may include staff
recruitment, training, deployment of new operating systems, work processes, technology, and equipment.

7
2. UNDERSTANDING THE ‘GAP
ANALYSIS MODEL’
The staffing gap analysis is a hybrid model that draws
from a variety of sources. It is customised to an
African urban context in terms of the implications of
population density, geographic area and prevailing
levels of networked infrastructure for effective service
delivery, operations, and maintenance. The model
utilises different municipal staffing assessment
methods in developing countries, including time and
motion studies across various municipal departments,
model staffing norm assessments2, and national and
state level municipal cadre reforms initiatives3.
Assumptions from these studies have been modified
and improved upon by introducing a more
comprehensive set of variables to reflect the socio-
economic and geographical realities of sampled
African cities. The model relies on findings from 16
cities in four countries and the three geographic
regions of West, East and South East Africa, ranging in
population size from 40,000 to two million.
WHAT DOES THE MODEL DO, AND HOW?
The model analyses staffing data for all managerial
and technical grades across six key functions and sub
functions: Municipal Finance and Accounts; Revenue;
Planning; Engineering, Public Works and Street
Lighting; and Environmental Health and Solid Waste
Management.
It captures the number of staff required as well as the
corresponding qualifications and skills deemed
optimal for different categories of city to provide
services to adequate standards across the respective
service areas.
For each sector, and each position under the sector,
the model derives a benchmark based on basic
essential criteria, allowing the user to identify deficits
and/or surplus across function, qualification and
sector.
While the benchmarks are developed based on key
variables, these can be further adjusted according to a
range of additional parameters listed in Annex 1 that
2 Local Government Service Secretariat, Staffing Norms, Government of Ghana.
will help to indicate the likely need for more or less
staff in each functional area. These parameters may
be incorporated into a more advanced version of the
model after further testing.
METHODOLOGY AND CHOICE OF VARIABLES
The benchmarks on which the model is built represent
an ideal staffing range that a city should have in terms
of tasks required to perform the respective functions
in a reasonably effective manner. The benchmarks are
worked out based on functional tasks and quantum of
work in relation to population, geographic area,
service network and municipal revenue, for the main
categories of managerial, technical and support staff,
considering effective spans of control for supervisory
grades.
The model uses several layers of information on
municipal staffing to derive benchmarks that reflect
the number of staff required to perform the main
tasks in each functional area to a reasonable standard
of service. This has included drawing from the
following layers and sources:
1. Layer one
a. Comparative literature on municipal staffing
that has contributed to the analysis of
staffing capacity includes over 50 studies,
reports and published works (articles,
chapters, books) on public service staffing
and capacity at central, regional and local
government levels, primarily related to
developing countries in Asia and Africa. This
review provided information, insights and
data for Layer 1.
(See Annex 1 for a full listing of literature
references that have informed the
methodology and choice of variables.)
b. Detailed municipal cadre reviews from
developing countries that have notified
staffing recommendations (Ghana and India)
and staffing gap assessments based on the
following reviews:
3 Cadre Reform Study, Urban Administration and Development Department, Government of Madhya Pradesh; Cadre Reform Assessment, Ministry of Urban Development, Government of India.

8
i. http://www.tmepma.cgg.gov.in/files
/155.pdf
ii. http://pearl.niua.org/sites/default/fi
les/Final-Report-30-09-2014-
submitted-M%20Cadre.pdf
iii. http://icrier.org/pdf/FinalReport-
hpec.pdf (IF FOUND RELEVANT)
iv. http://planningcommission.gov.in/a
boutus/committee/wrkgrp12/hud/w
g_capacity_%20building.pdf (Gives
some guiding principles)
v. http://www.odisha.gov.in/revenue/
HRM/OAS/restructuring/5719_28_2
_09.pdf
c. This layer draws from and captures detailed
analysis of municipal staffing gaps and
benchmarks from cadre review studies
undertaken across three states and more
than 50 reference cities and towns in India
with populations ranging from 50,000 to
three million. The findings from the reference
cities and towns were applied to over 100
cities and towns to estimate capacity gaps
and propose responses.
2. Layer two
This layer was informed by the literature, cadre
reviews and assessments in Layer 1, as well as a
secondary technical review of functions and tasks
to deliver reasonably effective service levels in
each of the municipal departments under
assessment. The review provided further insights
for the modelling of a Human Resources/staffing
requirement for respective functions based on the
service delivery structures, systems and
technology prevalent across the range of
municipalities. See Figure 2 for a detailed
understanding of the variables used to create the
city-wide benchmarks.
BOX 1: LIST OF SAMPLE TOWNS
Ethiopia Dire Dawa and Mekelle Mozambique Tete, Nacala and Nampula
Uganda Entebbe, Fort Portal, Tororo, Jinja, Gulu, Arua and Hoima
Ghana Kumasi, Tamale, Bolga and Sunyani
FIGURE 2: BENCHMARKS
Sectors Position Benchmark (x) Variable Linked to Benchmark
Planning Chief Physical Planner 1 1 if 2 or more Physical Planners
Physical Planner/Urban Designer
3 1 for every x Assistant Physical Planner
Assistant Physical Planner/Building Officer
15,000 1 for x number of population
Auto CAD/Data Operators 2 1 for every x Assistant Physical Planner
9
Sectors Position Benchmark (x) Variable Linked to Benchmark
Revenue Deputy Commissioner/Chief Revenue officer
- 1 in case Revenue Officers are more than 1
Revenue Officer 2 1 for every x Assistant Revenue Officers
Assistant Revenue Officer 2 1 for every x Revenue Inspectors
Revenue Inspector 5 1 for x number of Tax Collectors
Tax Collector/Assistant 1,000 1 for x number of households (average household size of 5)
Data Operators/ Operational Staff
2,000 1 for x number of households (average household size of 5)
Public Works Department (PWD)
Chief Engineer 50,000 1 if population is > x
Superintending Engineer 2 1 per x Executive Engineer, minimum of 1
Executive Engineer 2 1 per x Assistant Engineer, minimum of 1
Assistant Engineer 2 1 per x Sub-Engineer
Sub-Engineer 15,000 1 per x, minimum of 2
Sub-Professional Staff 10,000 1 per x, minimum of 2
Operational Staff 20,000 6 for every x population
Street Lighting Executive Engineer - 1 in case Assistant Engineers are more than 1
Assistant Engineer 2 1 per x Sub-Engineer
Sub Engineer 6 1 for every x Operational Staff, minimum of 1
Operational Staff 20,000 1 set of 3 for every x population, minimum of 3
Solid Waste Management (SWM)
Waste Generation, tons per day (TPD)
600 Considering x gallons per capita per day
Superintending/Principal Public Health Engineer
- 1 when Executive Engineers are more than 1
Executive Engineer/Senior Public Health Engineer
2 1 for every x Assistant Engineers
Assistant Engineer/Public Health Engineer
2 1 for every x Sub-Engineers
Sub-Engineer/Assistant Public Health Engineer
2 2 till 100 TPD and 2 for every additional 50 TPD
Operational Staff - Total
Collection 2 x per vehicle (helper and driver). Density @600 kg/m3; trips per vehicle per day 2; capacity of collection vehicle - 2.5 cu m
Transportation 3 x (driver & helper) per vehicle. Density @900 kg/m3; trips per vehicle per day 2; capacity of collection vehicle - 10 cu m;
Landfill Site & Transfer Stations
15 x till 300 TPD and 5 for every additional 100 TPD
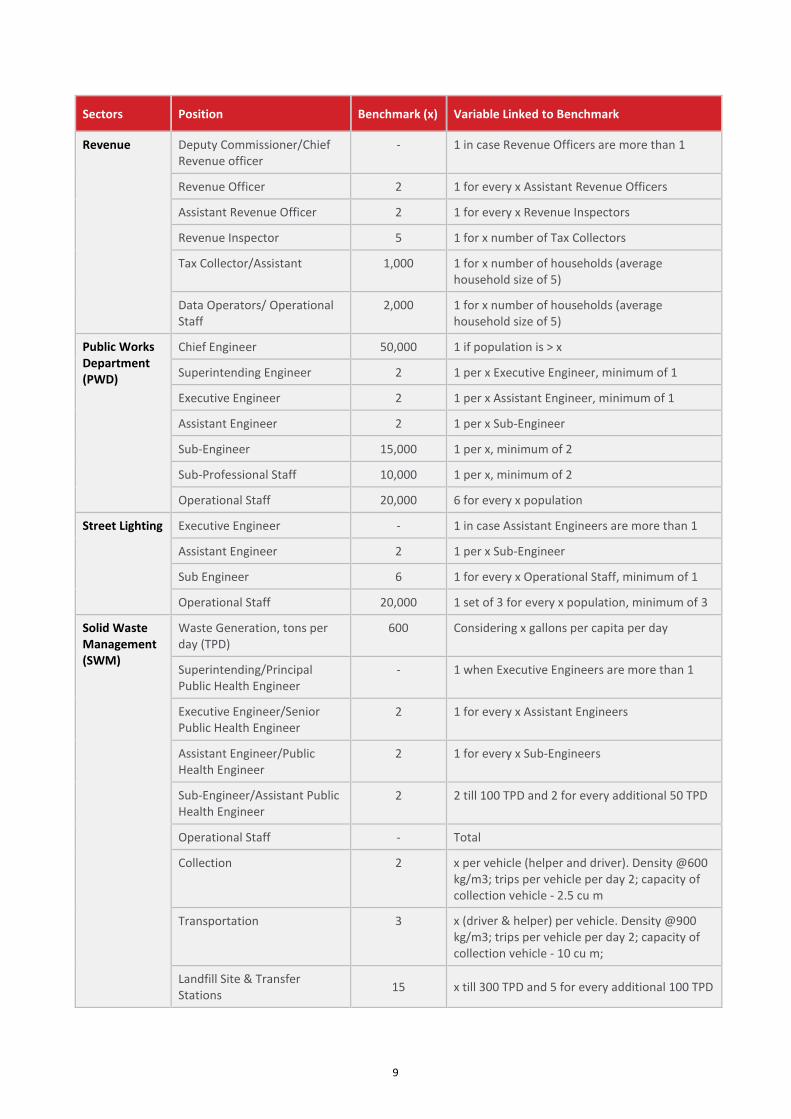
10
Sectors Position Benchmark (x) Variable Linked to Benchmark
Sanitation Area (SqKm)/Effective Area* - As per the data given
Chief Sanitation Officer - 1 if PSO >1
Principal Sanitation Officer (PSO)
2 x per Sanitation Officers, minimum 1
Sanitation Officer 2 x per Sanitation Inspectors
Sanitation Inspector 8 x per Sanitation Supervisors
Sanitation Supervisor 8 x per Sanitation Workers
Sanitation Workers - 1 if Population Density < 700 1.5 if 700 < Population Density < 1000 2.5 if 1000 < Population Density < 3000 3 if 3000 < Population Density < 5000 4 if Population Density > 5000
Finance Budget (million USD) - AS per data given or per capita of ~70 USD (same as Gulu's per capita)
Finance Controller 30 1 if budget is > x million USD
Chief Finance and Accounts Officer
15 1 if budget is > x million USD
Senior Account Officer 0.5 x times Accountants
Accountant 0.5 x times Junior Auditors
Junior Accountant 2 X times Internal Auditors
Principal Budget Analyst 2 1 for x Budget Analyst
Budget Analyst - Same as procurement
Principal/Chief Internal Auditor
2 1 for x Senior Internal Auditors
Senior Internal Auditor 2 1 for x Internal Auditors
Internal Auditor 1 1 for every x million USD of budget, minimum 1
Procurement Specialist 7.5 1 for every x million USD of budget, minimum 1
STAFFING REVIEW
This review comprised an in-depth assessment of the
roles and functions of staff in different categories of
town and in different municipal environments
(population, geographic area, density, budget etc.).
The assessment was also supported by sample time
and motion studies in complex functions, such as solid
waste management, to derive benchmarks for
different managerial and technical posts within each
department.
Once the number of core staff had been determined,
the model applied a composite formula for
determining the more senior supervisory grades based
on level of authority, function and task, and control
span. The secondary technical review was undertaken
through detailed studies that examined the following:
• Function, tasks and business processes within the target departments.
• Staff and skills required to undertake respective functions and tasks.

11
• Estimated volume of work and tasks performed per person per day.
• Number of staff required to undertake functions and tasks for existing levels of service coverage (pop/ area/ households).
• Number of staff required to undertake functions and tasks for existing levels of service coverage and levels of non-coverage (pop/ area/ household).
• Number of staff required to undertake functions and tasks for future levels of service coverage (population/area/household).
KEY VARIABLES
The various elements of the model included
determining the key impacting/ driving variable in
each functional area. This included an assessment of
variables such as population, municipal area, size of
municipal budget, number of households/ properties,
volume of service (e.g. solid waste per capita per day),
and number of properties.
Key criteria for each sector
1. Planning: Population.
2. Revenue: Number of households.
3. Public Works Department (PWD): Population.
4. Street Lighting: Population.
5. Solid Waste Management: Waste generation at
600 gallons per capita per day.
6. Sanitation: Municipal area covered.
7. Finance: Total municipal revenue.
MODEL ADJUSTMENTS
Adjustments were made to account for likely impact of
future growth. In some cases, where data on a
variable was not available or appeared inaccurate, the
data was normalised by cross-referencing other cities
in the same country where such data was available,
and then adjusting for other variables. For instance, in
the Planning function, the model draws from
international norms that range from 1: 6,000 in denser
urban environments (United Kingdom) to 1: 12,000 in
less dense areas (United States of America) and then
further adapts these to an African context based on 1:
15,000. Similar adjustments have been made across
other functions.
The main adaptations applied for the Africa context
included:
• Larger physical areas covered within the municipal boundary/service areas and lower population densities of core and peripheral areas within the physical boundary.
• Fewer km of tarmac road length.
• Fewer individual properties/dwelling units per population.
• Higher volumes of per capita solid waste generation.
• Higher rate of demographic growth.
The model was further adjusted for other factors such
as the number and capacity of vehicles used in a
service fleet, collection time, and area that can be
serviced by a given unit (staff or fleet) based on the
population density in each city (See Annex 1 for a
detailed set of parameters that may impact the
benchmarks for a city depending upon the specific
service delivery context).
LIMITATIONS OF THE MODEL
• All data for developing the benchmarks was
collected from municipalities in Sub-Saharan
Africa which are often subject to certain data-
related constraints, including the reliability of data
collected from municipal officers.
• A cross-section of towns from countries and
geographical areas of Sub-Saharan Africa were
selected to offset bias. Two of the four countries
represent Anglophone systems (Ghana and
Uganda), and Ethiopia and Mozambique were
deliberately chosen to help offset any bias. The
selection of towns was determined based on the
easy availability of relatively accurate data.
• Salary comparisons were available for only some
tiers of staff. Thus, the focus of the analysis is
based on two departments in two countries
(Ghana and Uganda) and is indicative rather than
comprehensive.
• For city-specific micro analysis, staffing
calculations include private concessionaires who
provide solid waste services if the relevant data is
available. If the data is not available, the analysis
is based on the number and effective area served
by municipal staff. The macro analysis of gaps is
confined to managerial and technical staff;
operational staff are not considered part of the
analysis.

12
3. KEY FINDINGS
The model reveals a significant shortfall in municipal
staffing against benchmarks. Findings from 16 cities
reveal that cities are trying to function with as little
as 27% to 29% of ideal capacity (when analysed using
a weighted average), after adjusting for population,
size, density, number of properties, revenue receipts
and type of infrastructure network (Figure 3 and
Table 1).
While the model provides rich analysis that can be
assessed at the city level, the toolkit underscores
some common and overarching findings and themes
across five different types of staffing gaps:
geography, function, qualifications, pay scales, and
span of control.
GAPS BY GEOGRAPHY
• Sampled African cities are functioning at much
less than half the required capacity.
• Of the four countries, Mozambique is the worst
staffed with only (20%) of required capacity,
followed by Uganda (22%), Ghana (25%), and
Ethiopia (55%).
FIGURE 3:TOTAL STAFFING GAP BY CITY*
767 720
360442
1075
135 106 87162
274126
223
2840
358279 278266
545
59 86232
15 33 39 55 26 1658
489
22865
157
0
500
1000
1500
2000
2500
3000
Dir
e D
awa
Mek
elle
Tete
Nac
ala
Nam
pu
la
Ente
bb
e
Fort
Po
rta
Toro
ro
Jin
ja
Gu
lu
Aru
a
Ho
ima
Ku
mas
i
Tam
ale
Bo
lga
Sun
yan
i
Ethiopia Mozambique Uganda Ghana
Total Model Manpower Total Current Manpower
*The analysis shown in Figure 3 does not include support staff/operational or contracted staff in Solid Waste Management (SWM) & Sanitation.

13
TABLE 1: STAFFING SHORTFALL (%)
Country Cities Current personnel as % of required personnel
Ethiopia Dire Dawa 34.7
Mekelle 75.7
Mozambique Tete 16.4
Nacala 19.5
Nampula 21.6
Uganda Entebbe 11.1
Fort Porta 31.1
Tororo 44.8
Jinja 34.0
Gulu 9.5
Arua 12.7
Hoima 26.0
Ghana Kumasi 17.2
Tamale 63.7
Bolga 23.3
Sunyani 56.5
GAP BY FUNCTION
• Across the countries, there are serious staffing
gaps in various departments resulting in sub-par
service delivery (Table 2 and Figure 4).
• Street lighting, finance, and planning are the most
poorly staffed.
• Mozambique and Ghana have no dedicated staff
deployed for street lighting.
• Ethiopia employs more staff in the revenue
function than would appear optimal. This requires
further investigation.
TABLE 2: STAFFING GAPS BY FUNCTION*
Country Finance Planning Public Works Department
Revenue
Solid Waste Management
(SWM) & Sanitation
Street Lighting
Total
Ethiopia 534 118 50 -139 17 96 676
Mozambique 363 140 388 315 106 188 1500
Uganda 210 128 115 199 131 88 871
Ghana 50 538 857 748 126 497 2816
*a negative number implies a staffing excess.

14
FIGURE 4: STAFFING GAPS BY FUNCTION
GAP BY QUALIFICATIONS
Only a small percentage of the staff across the target
cities has advanced degrees and diplomas, although
most staff have certificates of attendance on a variety
of professional training courses, or compensate for the
lack of degrees through years of experience (Figure 5).
GAPS IN PAY PARITY
Analysis of pay parity is based on remuneration data
from the planning and engineering departments in
Ghana and Uganda, comparing salaries for managerial
and technical staff with local governments, local
private sector, international NGOs, and multi-national
corporations (Figure 6 and 7).
FIGURE 5: QUALIFICATIONS GAP*
Shortfall Excess
-500 0 500 1000 1500 2000 2500 3000
Ethiopia
Mozambique
Uganda
Ghana
Finance Planning Public Works Department Revenue SWM & Sanitation Street Lighting
2816
871
1500
676
*This analysis only includes managerial and technical staff and not support/ operational staff.

15
FIGURE 6: ANNUAL SALARY COMPARISON – GHANA
FIGURE 7: ANNUAL SALARY COMPARISON - UGANDA
$0
$2,000
$4,000
$6,000
$8,000
Municipal Engineer Senior Engineer Principal ExecutiveEngineer
Chief Finance Officer Municipal Planner
Local Government Staff Private Sector Staff
KEY FINDINGS
• Pay differentials between local government staff and private sector staff in equivalent posts are greatest for
senior managerial and technical staff. In almost all instances, local government salaries are no more than 15-
20% of the salary for their Multi-National Corporations counterpart.
• Such drastic pay gap differentials are likely to contribute to rent-seeking, corruption, and the strengthening of
entrenched interests in local governments.
• This differential becomes smaller toward the junior technical posts.

16
GAPS IN SPAN OF CONTROL
Ethiopia has the highest ratio of managerial and
technical staff to population in target cities, with a
ratio of 1.4 per 1,000 people (Figure 8 and 9). Despite
being the highest in our sample, this ratio is still
poorer than that of other rapidly developing countries,
such as India, where civil servants and senior
managerial staff are pegged at 8 per 1,000 people, and
much further behind that of developed countries that
enjoy a ratio of 30 per 1,000 people4.
While this ratio pertains to higher echelons of
governance, given the comparative underfunding of
sub-national governments, we can conclude that not
only is there significant understaffing in African cities,
but that there are significant differences between
countries and between cities as well.
Generally, it seems clear that African local
governments are much worse off in terms of senior
managerial staff than their respective national
governments. Local governments are being asked to
perform their functions without the necessary skills
and capacity. This has implications for relations
between centre and sub-national governments and
the latter’s ability to be administratively self-sufficient.
The other three sampled countries in descending
order of performance are Uganda, Mozambique and
Ghana. Mozambique has the highest shortfall (80%),
Uganda (78%), Ghana (75%) and Ethiopia (45%).
While these figures provide an overall picture of the
supply of managerial and tech staff, a closer
examination of city-level differences would be able to
show how the span of control is affected by these
shortages – i.e., how the performance of junior and
support staff is impacted by the absence of adequate
managerial and supervisory guidance.
FIGURE 8: MANAGERIAL AND TECHNICAL STAFF STATUS
4 See, Indira Rajaraman (2008), ‘An empirical approach to the optimal size of the civil service’, Public Administration and Development 28(3):223 – 233.
17
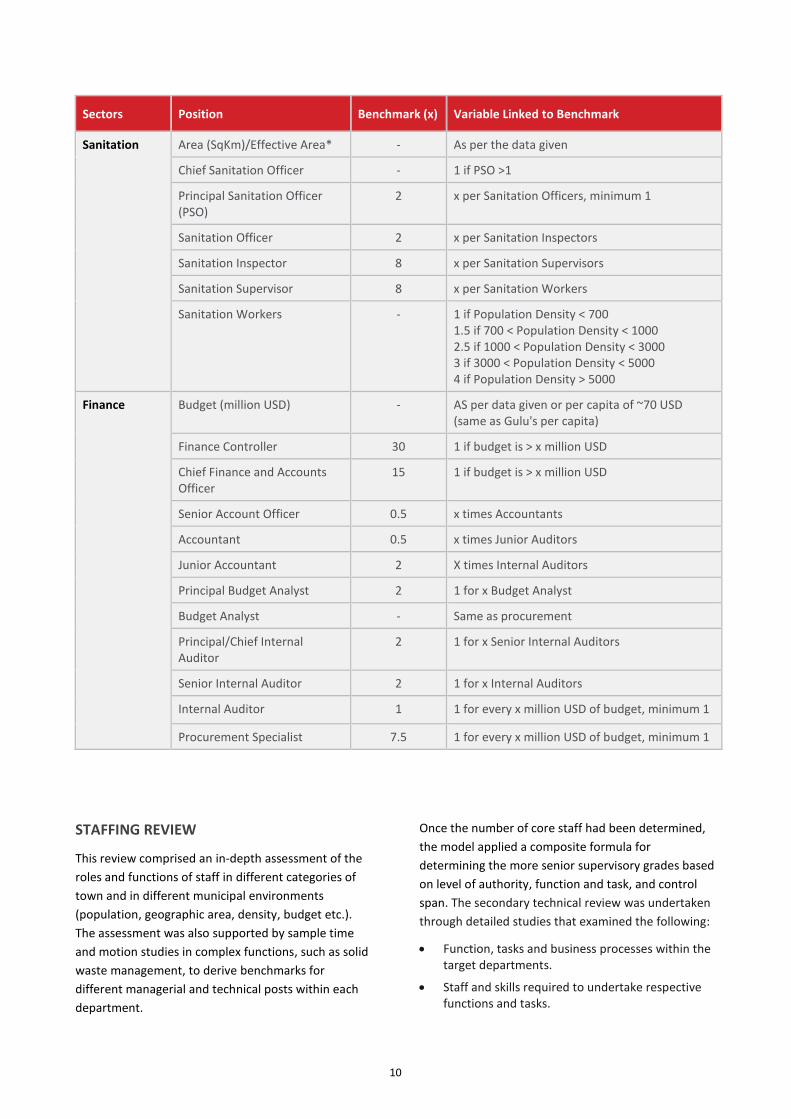
FIGURE 9: BENCHMARK
GAPS AT THE CITY LEVEL: CASE ANALYSIS OF
DIRE DAWA, ETHIOPIA
Dire Dawa is an average-sized African town with a
population of 277,000, and a population density of
9,473 people per sq km spread over an area of 29.24
sq km. It is the second largest town in Ethiopia after
Addis Ababa and an important regional
administration.
An analysis of Dire Dawa’s staffing gaps reveals that:
• The city’s current staffing levels are more than
adequate for performing its revenue-related
function.
• The city exceeds stipulated benchmarks quite
significantly in Solid Waste Management (SWM)
and sanitation (taken together as one function
here). The manpower deployed by the
concessionaire for SWM and Sanitation is
included in the current manpower and considered
to be support staff.
• In all other functions, current levels fall short of
benchmarks. For instance, the city has only 11% of
the required personnel for planning, and 13% for
finance. These continued gaps could impact
service delivery and reforms.
• Qualitatively, only 7% of the staff hold degrees or
diplomas; the majority (92%) hold certificates.
• Due to high levels of overstaffing in SWM and
Sanitation, Dire Dawa has a cumulatively higher
number of support staff, in excess of required
benchmarks.
• The city’s support staff are poorly monitored, as
evident from the broad base of the manpower
pyramid and the disproportionately tapering
pinnacle. This implies that lines of supervision and
control are poorly implemented in the city. This
analysis is true for many other cities in the
sample.

18
FIGURE 10: STAFFING GAPS IN DIRE DAWA, ETHIOPIA
FIGURE 11:HIERARCHY GAPS IN DIRE-DAWA
11%
101%
13%
61%
14%
313%
0%
50%
100%
150%
200%
250%
300%
350%
0
100
200
300
400
500
600
700
800
900
1000
Planning Revenue Finance Public WorksDepartment
Street Lighting Solid WasteManagement
(SWM) &Sanitation
Current Manpower Model Manpower Current Manpower as Percentage of Model Manpower
Current Manpower Model Manpower
Hie
rarchy
Nu
mb
er
of
Emp
loye
es

19
4. WAY FORWARD
This model is a preliminary analysis of staffing gaps
based on data from 16 towns and cities in Sub-
Saharan Africa. It is flexible and immensely adaptable
to other contexts.
The preliminary analysis of four countries provides
compelling evidence that this is a broad area requiring
urgent attention in the context of Africa’s urban
transition. As such, it needs to become a core
component of Cities Alliance’s work programme in
Africa. Specifically, we need better data and analysis
and – above all – the sustained attention of national
governments and their development partners.
The next steps that the Cities Alliance will undertake
include:
1. Validation of model and results through
stakeholder consultations and site visits in select
target cities.
2. Consolidation and expansion through the addition
of more towns and cities in Africa to check for
anomalies and to make the model more robust.
3. The expansion of the model to include
francophone countries and North Africa.
4. Detailed city level analysis:
4.1. Differentials from benchmark standards
4.2. Impacts of technology/design and service
delivery parameters on staffing
5. Impacts of alternate service delivery models such
as outsourcing, management contracts, and
concessions.
6. Comparative benchmarking with the UK, France,
South Africa, and some advanced Indian cities.
6.1. Recruitment options, implications and
affordability
6.2. Training options, implications and costs
6.3. Real remuneration incentives and gaps
7. Conceptualising model concession agreements for
services.
8. The model can be expanded to incorporate costs
on staffing for each city, then show changes in
fiscal pressures with change in ratios.

20
ANNEX I: PARAMETERS FOR ADJUSTING BENCHMARKS
A. SOLID WASTE MANAGEMENT
S.no. PARAMETERS DESCRIPTION
A1 City size & Characteristics
1. Area of the City Area is an important variable, especially when combined with density below
2. Population A critical driver
3. Population density Direct bearing on staff requirements
4. Urban Population growth rate If the population growth rate is high, future increase in personnel will need to be factored in.
A2 Other factors
1. Mode of execution If a city is operating the service it will be necessary to calculate waste collectors, drivers, operators and helpers. However, if the operations have been contracted out, the requirement of operating staff will be minimal.
2. Technology to be used The number of operating personnel at the facility will depend on the technology being used for waste processing and the size of landfill.
3. Quantity of waste Although quantity of waste is directly proportionate to population, bulk generation of waste is not.
4. Type of roads Existing nature of constructed roads can have a bearing on staff required to maintain different surfaces.
B. PUBLIC WORKS
S.no. PARAMETERS DESCRIPTION
1. Area of the City The larger the area, the more staff required.
2. Population Will be a consideration in deciding the number of staff, as no. of projects will depend on the population.
3. Nature of Projects Nature of the projects will influence the number of staff.
4. Numbers of the Projects Number of the projects undertaken will be a critical factor in determining staff.
5. Financial Strength of the Local Body If the city budget is in surplus, it is likely there will be a larger staff requirement from a larger capital and O&M spend.
C.ROAD WORKS
S.no. PARAMETERS DESCRIPTION
1. Area of the City This will influence the number and density of urban roads.
2. Length of the Roads The greater the length, the greater the maintenance requirement.
3. Type of Roads This will impact on O&M intensity.
4. Budget This will influence the number of projects.

21
D. URBAN PLANNING
S.no. PARAMETERS DESCRIPTION
D1 City Size and Characteristics
1. Population A larger city will have more intensive urban interactions and hence need more staff for
planning, implementing controls, and implementing regulations
2. Area of City Depending upon city size, multiple physical sub units/areas may be needed, which will
require more planning input.
3. Population density Denser population will create multiple interactions in urban space and stress on
infrastructure needs, which will require more staff. Uneven densities across the city will
require more inputs on redensification schemes to achieve optimal urban form.
4. Urban Population Growth
Rate
Faster urban growth will continuously stress physical space and will require more inputs on
expansions, dealing need with migrant population, revising density norms, redensification,
etc.
5. Urban Sprawl Larger urban sprawl will mean quicker spread of urban fabric, amalgamation of hinterlands,
and complex regional interactions. All this will require intensive planning input.
6. Level of decentralisation
(City, Neighbourhood,
Ward, Sub Ward etc.)
The higher the level of decentralisation, the greater the requirements of planning staff to
plan, execute and regulate at each level with specialisation.
7. Planning regions or Units
or Divisions
Planning regions or divisions are created to decentralise functions and enable participation
in planning and implementation. They also impact staffing.
D2 Development Interventions and Investments
1. Housing Needs Overall housing gaps will require more schemes for addressing residential layouts and will
impact urban planning staff.
2. Urban Poor Urban populations that are below the poverty line and reside in informal
settlements/engage in informal jobs require specific planning inputs that will influence
planning staff.
3. Local Government Capital
Expenditure
Implementation of development projects through local government is an important variable
that will influence planning inputs.
4. Investments by Private
sector
Apart from local governments, private sector investment in real estate, jobs, and industry
will impact requirements for urban planning.
5. Income range of
Municipality
Cities with higher income will generate higher demand for high-quality projects and
visionary planning.

22
S.no. PARAMETERS DESCRIPTION
D3 Existing legislations pertaining to Area Development Plans and Land Use Permissions
1. Development Plans
/Town Planning Schemes
Existing legislation in Urban Acts relating to planning schemes will directly impact planning
staffing.
2. Procedures for
development Permissions
Existing legislation in Urban Acts relating to development permission (for town planning
schemes, land use conversion, preparation of local area plans, valuations etc.) will directly
impact planning staffing.
3. Implementation of
Development
Programmes/ Projects
Municipalities are also expected to implement central development projects that will
influence staff requirements.
4. Vacant land within the
jurisdiction
The amount of vacant land earmarked for development projects will influence urban
planning staff.
D4 Existing legislations pertaining to Building Controls and Permissions
1. Systems for Building
Control
The provisions for building control (FAR, Setbacks, facade control etc.) in local municipal
acts will directly impact urban planning staff.
2. Number of Properties Number of properties registered with the municipality will directly impact urban planning
staff.
3. Building permissions/
permits granted (rate of
building construction)
The rate of building permissions granted by the municipality will impact urban planning
staff.
4. Encroachments within
city
The larger probability of encroachments on public properties and roads and tapping into
municipal services (water, electricity) will impact staff.
5. Approvals of plans
(residential/ commercial/
institutional)
Approvals of plans (residential/commercial/institutional) are usually covered under the
planning division. The rate of approvals put up each day will impact staffing
D5 Information systems
1. GIS-based property
information system
GIS-based property records and land use information system are effective ways to reduce
staffing requirements and avoid ambiguity in permissions, land use planning, etc.
2. GIS-based permission for
Town Planning Schemes/
Building Construction
GIS-based permission systems and computerisation reduces manual labour and is an
effective way to reduce staffing requirements.
D6 Others
1. Road network Road network availability and quality impact transportation requirements, which will
influence planning inputs and staff.
2. Public Transportation
network
Availability and quality of public transport and projections for the future will impact specific
inputs on transportation planning.

23
3. Urban design norms,
Heritage structures/
Conservation norms
Guidelines on design, preservation of urban form, physical controls, norms related to
heritage buildings, and conservation structures will call for specialised inputs in urban
design, conservation and heritage planning (usually considered as part of overall planning
activity).
4. Environment Quality of environment, existing practices related to conservation, and regulations on air,
land and water pollution will impact specific inputs for environmental planning.
E. FINANCE AND AUDIT
S.no. PARAMETERS DESCRIPTION
1. Budget size Increase in budget size may require additional staff, subject to other parameters.
2. Number of activities/
programmes
Number of activities and programmes run by a city will have an impact on the size of the
staff.
3. Volume of Accounting
Transactions
Large number of small value transactions would require more staff.
4. Level of E-Governance
initiatives
Higher level of computerisation and integration of various modules with the finance module
will reduce the number of staff for routine operations and reconciliations.
5. Internal Control System As the budget size increases, internal control systems need to be updated, which in turn
would increase the staff requirement unless automated systems are in place.
6. Level of Regulatory and
Reporting environment
Requirement of accounting classification, aggregation, cost allocation etc., depends on the
level of regulatory and reporting requirements, and will impact staff.
7. Pre or Post audit Pre-audit/concurrent audit will require more staff for Audit than in case of post audit.
F. REVENUE
Sr. No PARAMETERS DESCRIPTION
1. Size of ULB area and
number of assesses
Requirement for revenue collectors will depend on size of geographical area, number of
assesses and population density.
2. Revenue streams Higher revenue streams/ taxes will require more staff for collection and assessments.
3. Assessment process Self-assessment of taxes by assesses will reduce the number of staff required
4. GIS/E-Gov-based
monitoring system GIS-based automated system for tax collection and monitoring will require less staff.
5. Outsourcing of
collection
If the collection of revenue is outsourced or is through automated payment gateways, less
staff is required.

24
G. HIERARCHY Decision on number of persons reporting to a higher level
1. Span of control Ideal span for direct monitoring is about 6, i.e. one person can effectively supervise the work
of 6 subordinates. It will also depend on other factors.
2. Difference in Salary of
superior level
The greater the gap in salary between staff, the more spans of control are required.
3. Nature of
activity/functions and
Monitoring requirement
Functions requiring close monitoring or detailed checking of work done by subordinates will
reduce the span of control.
4. Management approach Management by direct control will require a shorter span of control; in case of management
by exception, span of control may be higher.
25
ANNEX 2: LITERATURE REFERENCES FOR REFINING METHODOLOGY
AfDB, 2011. Africa in 50 Years’ Time: The Road towards Inclusive Development, Tunisia: African Development Bank.
Available at:
http://www.afdb.org/fileadmin/uploads/afdb/Documents/Publications/Africa%20in%2050%20Years%20Time.pdf.
Ajakaiye, O., Drazen, A. & Karugia, J., 2008. Political Economy and Economic Development in Africa: An Overview.
Journal of African Economies, 17(suppl 1), pp.3–17.
Ammons, D.N., 2008. Tools for Decision Making: A Practical Guide for Local Government: A Practical Guide for Local
Government, SAGE.
Aucoin, P., 1990. Administrative Reform in Public Management: Paradigms, Principles, Paradoxes and Pendulums.
Governance, 3(2), pp.115–137.
Bahl, R.W. & Linn, J.F., 1992. Urban Public Finance in Developing Countries, Oxford University Press.
Bechet, T., Jensen, M. & Bauer, K., 1999. Strategic Staffing Guidebook, Available at:
http://www.beta.mmb.state.mn.us/doc/wfp/stratstf.pdf.
Booth, D. & Therkildsen, O., 2012. The political economy of development in Africa: A joint statement from five research
programmes, Africa Power and Politics Programme, Developmental Leadership Programme, Elites, Production and
Poverty: A Comparative Analysis, Political Economy of Agricultural Policy in Africa, Tracking Development.
Brown, M., Sturman, M. & Simmering, M., 2002. The Benefits of Staffing and Paying More: The Effects of Staffing
Levels and Wage Practices for Registered Nurses on Hospitals’ Average Length of Stay. Cornell University School of
Hotel Administration.
Cheung, A. & Scott, I. eds., 2015. Governance and Public Sector Reform in Asia: Paradigm Shift or Business as Usual?,
S.l.: Routledge.
Comfort, L. et al., 2015. Network Theory and Practice in Public Administration: Designing Resilience for Metropolitan
Regions. In D. C. Menzel & J. D. White, eds. The State of Public Administration: Issues, Challenges and Opportunities.
New York: Routledge, pp. 257–271.
Council of Europe, 1995. The Size of Municipalities, Efficiency and Citizen Participation, Bruxelles: Council of Europe.
Craythorne, D.L., 2006. Municipal Administration: The Handbook, Juta and Company Ltd.
Davidson, G., Lepeak, S. & Newman, E., 2007. Recruiting and Staffing in the Public Sector: Results from the IPMA-HR
Research Series, International Public Management Association for Human Resources.
DESA, 2013. World Economic and Social Survey 2013: Sustainable Development Challenges.
DoPSA, 2007. IMPROVING THE PERFORMANCE OF THE PUBLIC SERVICE: Lessons of the Transformation Process,
Department of Public Service and Administration, Government of South Africa.
Eminsang, F., 2011. Managing Growth in Ghanaian Cities -The Role of Peripheral District Centres, Kwame Nkrumah
University of Science and Technology.
Ewing, C., 2015. Developing a Staffing Model for Service Delivery: Kaiser Permanente Northern California Clinical
Technology. Journal of Clinical Engineering, 40(1), pp.25–34.

26
Fatile, J.O. & Adejuwon, K.D., 2010. Public Sector Reform in Africa: Issues, Lessons and Future Directions. Journal of
Sustainable Development in Africa, 12(8), pp.145–157.
Government of India, 2008. Refurbishing of Personnel Administration - Scaling New Heights. Tenth Report, Second
Administrative Reforms Commission.
Graham, N., 2016. Presentation on Functional institutions; Functional cities at Workshop on Urban Infrastructure in
Sub Saharan Africa: harnessing land values, housing and transport, South Africa.
Green, A., 2005. Managing Human Resources in a Decentralised Context. In East Asia Decentralises: Making Local
Government Work. Washington DC: World Bank. Available at:
http://siteresources.worldbank.org/INTEAPDECEN/Resources/Chapter-7.pdf.
IMF, 2012. Ghana: Poverty Reduction Strategy Paper.
Kiragu, K. & Mukandala, R.S., 2005. Politics and Tactics in Public Sector Reforms: The Dynamics of Public Service Pay in
Africa, Dar es Salaam: Dar es Salaam University Press.
Lehmann, U., Dieleman, M. & Martineau, T., 2008. Staffing remote rural areas in middle- and low-income countries: A
literature review of attraction and retention. BMC Health Services Research, 8, p.19.
Lufunyo, H., 2013. Impact of public sector reforms on service delivery in Tanzania. Journal of Public Administration and
Policy Research, 5(2), pp.26–49.
McAllister, A.B., 1979. An Approach to Manpower Planning and Management Development in Canadian Municipal
Government, Institute of Public Administration of Canada.
McCourt, W., 1998. Civil Service Reform Equals Retrenchment? The Experience of ‘Right-sizing’ and Retrenchment in
Ghana, Uganda and the UK. In M. Minogue, C. Polidano, & D. Hulme, eds. Beyond the New Public Management:
Changing Ideas and Practices in Governance. Cheltenham, Edward Elgar, pp. 172–87.
McLaughlin, K., Ferlie, E. & P, S.O., 2005. New Public Management: Current Trends and Future Prospects, Routledge.
Mongkol, K., 2011. The Critical Review of New Public Management Model and its Criticisms. Research Journal of
Business Management, 5(1), pp.35–43.
Mutahaba, G. & Kiragu, K., 2002. Lessons of International and African Perspective on Public Service Reform: Example
from Five African Countries. African Development, 27(3&4), pp.48–75.
Olagboye, A.A., 2005. Inside the Nigerian Civil Service, Daily Graphics Ltd.
Olowu, D., 2009. BACKGROUND PAPER: STRATEGIC PERFORMANCE MANAGEMENT IN THE PUBLIC SECTOR, London:
Commonwealth Secretariat.
Olowu, D., 2010. Civil service pay reforms in Africa. International Review of Administrative Sciences, 76(4), pp.632–
652.
Olowu, D., 2010. State Capacity, Improved Governance and Development: Resolving the Human Resource
Management Dilemmas Confronting African Public Service, Indiana University.
OPPAGA, 1998. How Florida Compares: An Approach for Analysing Government Staffing Levels, The Office of
Programme Policy Analysis & Government Accountability. Available at:
http://www.oppaga.state.fl.us/reports/pdf/9813rpt.pdf.
Peters, B.G., 1996. The Future of Governing: Four Emerging Models, Lawrence: Univ Pr of Kansas.

27
Pillay, S., 2008. A cultural ecology of New Public Management. International Review of Administrative Sciences, 74(3),
pp.373–394.
Polidano, C., 1999. The new public management in developing countries, IDPM Public Policy and Management
Working Paper no. 13 (Institute for Development Policy and Management).
Riccucci, N., 2015. Human Resource Management: Current and Future Challenges. In D. C. Menzel & J. D. White, eds.
The State of Public Administration: Issues, Challenges and Opportunities. Routledge, pp. 127–141.
Sako, S. & Ogiogio, G., 2002. AFRICA: MAJOR DEVELOPMENT CHALLENGES & THEIR CAPACITY BUILDING DIMENSIONS,
Zimbabwe: The African Capacity Building Foundation. Available at:
http://elibrary.acbfpact.org/acbf/collect/acbf/index/assoc/HASH1fa6.dir/file%20020.pdf.
Scott, Z. & Alam, M., 2011. Resource Guide on Decentralisation and Local Government, Commonwealth Secretariat.
Singh, S. et al. eds., 2003. Public Administration in the New Millennium: Challenges and Prospects, New Delhi: Anamika
Pub & Distributors.
Stenberg, C.W., 2007. Managing Local Government Services: A Practical Guide, ICMA Press.
UNDESA, 2005. Human Resources for Effective Public Administration in a Globalised World, New York: United Nations
Department of Economic and Social Affairs, Division for Public Administration and Development Management.
Available at: https://publicadministration.un.org/publications/content/PDFs/E-
Library%20Archives/2005%20Human%20Resources%20for%20Effective%20Public%20Administration%20in%20a%20G
lobalized%20World.pdf.
UN-HABITAT, 2002. Local Democracy and Decentralisation in East and Southern Africa: Experiences from Uganda,
Kenya, Botswana, Tanzania, and Ethiopia, Nairobi, Kenya: UN-HABITAT.
United Cities and Local Governments, 2010. Local Government Finance: The Challenges of the 21st Century. Second
Global Report on Decentralisation and Local Democracy, GOLD 2010. Available at: http://www.urb-
al3.eu/uploads/documentos/GOLD_II_ang.pdf.
United Nations, 2014. World Urbanisation Prospects: The 2014 Revision, Highlights (ST/ESA/SER.A/352)., UN
Department of Economic and Social Affairs.
Walker, J.W. & Bechet, T.P., 1991. Defining Effectiveness and Efficiency Measures in the Context of Human Resource
Strategy. In R. J. Niehaus & K. F. Price, eds. Bottom Line Results from Strategic Human Resource Planning. Springer US,
pp. 235–245. Available at: http://link.springer.com/chapter/10.1007/978-1-4757-9539-4_18 [Accessed April 11, 2016].
World Bank, 2012. World Development Report 2013: Jobs, World Bank Publications.