Embed Size (px)
Citation preview

0
HUMAN RESOURCE MANAGEMENT AND PRODUCTIVITY
Nicholas Blooma and John Van Reenenb
November 3rd 2009
Very Preliminary – Do Not cite
Abstract
In this chapter we examine the relationship between Human Resource Management (HRM) and productivity. HRM includes incentive pay (individual and group) as well as many non-pay aspects of the employment relationship such as matching (hiring and firing) and work organization (e.g. teams, autonomy). We place HRM more generally within the literature on management practices and productivity. We start with some facts on levels and trends of both HRM and productivity and the main economic theories of HRM. We look at some of the determinants of HRM – risk, competition, ownership and regulation. The largest section analyses the impact of HRM on productivity emphasizing issues of methodology, data and results (from micro-econometric studies). We conclude briefly with suggestions of avenues for future frontier work and policy implications. JEL No. L2, M2, O32, O33.
Keywords: human resource management, productivity, personnel economics
Acknowledgements: We would like to thank the Economic and Social Research Council for their financial support through the Center for Economic Performance. This survey draws substantially on joint work with Daron Acemoglu, Philippe Aghion, Eve Caroli, Luis Garicano, Christos Genakos, Claire Lelarge, Ralf Martin, Raffaella Sadun and Fabrizio Zilibotti. We would like to thank Edward Lazear, Paul Oyer, John Roberts and Kathy Shaw for discussions. a Stanford, Centre for Economic Performance and NBER, [email protected] b Corresponding Author: London School of Economics, Centre for Economic Performance, NBER and CEPR, [email protected]
1
1. INTRODUCTION
Traditionally, labor economics focused on the labor market rather than looking inside the “black box”
of firms. Industrial sociologists and psychologists made the running in Human Resource Management
(HRM). This has changed dramatically in last two decades. Human Resource Management (HRM) is
now a major field in labor economics (where it is more commonly known as Personnel Economics,
M5 in the Journal of Economic Literature). The mark of this work is to use standard economic tools
applied to the special circumstances of managing labour within companies. HRM economics has a
major practical effect on the world being taught in business schools and used in many organizations in
the private and public sector.
HRM covers a wide range of activities. The main area of study we will focus on will be incentives,
matching and work organization. Incentives include remuneration systems (e.g. individuals or group
incentive/contingent pay) and also the system of appraisal, promotion and career advancement.
Matching would include practices over hiring and firing. By work organization we mean the
distribution of decision rights (autonomy/decentralization) between managers and workers, job design
(e.g. flexibility of working, job rotation), team-working (e.g. who works with whom) and information
provision. Table 2.6 (discussed below) lists out some of these with some indication of how frequently
the practices are used.
To be upfront on what we do not cover, perhaps the biggest lacuna is skill development/training which
is another major part of HRM, which is a victim of space limitations. Second, we will only devote a
small amount of space to employee representation; in particular labor unions which are a well-studied
element of HRM. Third, we should also mention that we focus on empirical work rather than theory
(for excellent recent surveys see Gibbons and Roberts, 2008, and in particular Lazear and Oyer, 2008)
and micro-econometric work rather than macro or qualitative studies. Fourth, we focus on HRM over
employees rather than CEOs, which is the subject of a vast literature (see Murphy, 1999, or Edmans,
Gabaix, Landier, 2008, for surveys).
Where we depart from several of the existing surveys in the field is to put HRM more broadly in the
context of the economics of management. To do this we also look in detail at the literature on
productivity dispersion.

2
The structure of the chapter is as follows. In Section 2 we detail some facts about HRM and
productivity both in the cross sectional and time series dimension. In Section 3 we discuss some
theoretical perspectives, contrasting the usual “design” approach to our concept of HRM as one
example of “management as a technology”. In Section 4 we discuss some of the factors determining
HRM, focusing on risk, competition, ownership, trade and regulation. In Section 5 we look at the
impact of HRM on productivity with an emphasis on methodologies and the mechanisms. Section 6
concludes.
2 SOME FACTS ABOUT HUMAN RESOURCE MANAGEMENT AND
PRODUCTIVITY
2.1 DESCRIPTIVE STATISTICS ON HRM PRACTICES
In the 1970s the assumption was the incentive pay such as piece rates would continue to decline in
importance. In fact, there is some evidence that contingent pay has actually become more prevalent
since 1980. The assumption of decline was based on the fact that traditional unskilled jobs (e.g. in
agriculture) were declining and white collar jobs were based on stable base salaries. The fact is that
more skilled jobs are increasingly rewarded through a mixture of incentives both through base and
contingent pay.
There are two broad methods of assessing the importance of incentive pay: Indirect and Direct
methods. Direct methods use data on the incidence of HRM, often drawn from specialist surveys.
Indirect methods use various forms of statistical inference, ideally from matched worker-firm data, to
assess the extent to which pay is contingent on performance.
2.1.1 Direct Methods
Incentive Pay
LEVELS OF INCENTIVE PAY
3
Individual incentive pay information is available from a variety of sources. Brown (1990) used the
BLS industry wage survey. The most recent reports of this suggest that in the late 1990s only 7% of
US workers had incentive pay, about half of these being in service occupations [Pierce, 2001].
Lemieux, McCleod and Parent (2008) obtain about twice as high a number using the PSID (around
14%) in 1998, which may be due to their focus on male workers (see Figure 2.1). They define a worker
as covered by performance pay if any part of compensation includes bonus, commission or piece rate1.
Stock options and shares are not included. A performance pay job is one where the worker ever
receives some performance pay over the life of the job-match. They also find a much higher number of
performance pay jobs, on average 37% between 1976-1998, defined as a job where a worker ever
received some kind of performance pay2. The authors also look at the NLSY which shows coverage of
performance pay jobs for men of 26% in 1988/1990 and 30%.
Some authors have been able to focus on group Incentive Pay (called “Shared Capitalist” schemes by
Freeman, Blasi and Kruse, 2009) can be defined to include employee ownership of stock, profit
sharing or gain sharing (where payments are based on the performance of a work site rather than the
enterprise as a whole). Stock ownership in a worker’s firm can either be individual when the worker
gets a vote (e.g. in a 401k plan) or collective (where the shares are held in a group trust like US
ESOPs). Typically the level does not give workers control of the firm as would be the case with a
worker co-operative. Stock options are a particular form of this: the employee has the right (but not
obligation) to purchase the company’s shares on a given date at a certain price.
From a special module in the US General Social Survey Kruse, Blasi and Park (2009) estimate that in
2006 47% of American workers were covered by some group incentive scheme and this had risen from
43% in 2002. In 2006 38% of employees were covered by profit sharing, 27% by gain-sharing, 18% by
stock ownership ( 9% by stock options) and 4.6% by all three types.
Other surveys have focused on larger firms. Lawler et al (2003) have been surveying Fortune 1000
corporations between 1987 and 2002 asking detailed questions on HRM3. Their data is in bands (e.g. 0
1 Overtime is removed, but the question is imperfect pre-1993 which could lead to undercounting performance pay. 2 The difference is somewhat surprising as it suggests that performance pay jobs only pay out infrequently, which doesn’t comply with casual observation (e.g. piece rates will almost always pay something). 3 The problem with the Lawler surveys is that the sampling frame is only larger companies compared to the more representative individual level PSID. Furthermore, the response rate to the survey has declined rapidly from over 50% in 1987 to only 15% by 1999. This poses a serious concern that the time series trends are not representative even of larger firms.
4
to 9 percent, 10 to 19 percent, etc.). Using midpoints, Lemieux et al (2008) calculate that 44% of
workers were covered by incentive pay in 2002.
TRENDS OF INCENTIVE PAY
It is surprisingly difficult to get representative data here, but our sense is that over the last 25 years
1. Incidence of incentive pay has probably increased
2. This increase looks stronger in the US than in Europe
3. Group based pay has increased by more than individual based pay
4. Team-based HRM and some other forms of “worker involvement” have increased over time
US Evidence
Lemieux, McCleod and Parent (2008) find that that performance pay rose from c.11% in 1976 to
c.15% in 1998. Using the wider definition that tries to estimate if the worker was eligible (rather than
received) any performance related pay, the incidence rises from c.33% in 1976 to c.40% in 1998.
Lawler et al (2003) also find that incentive pay has risen substantially in larger firms since 1999. Using
the midpoints Lemieux et al (2008) calculate an increase from 21% (1987) to 27% (1990) to 35%
(1996) to 45% (2002). Lazear and Shaw (2008) show some breakdowns reproduced in Figure 2.2
Panel A. This shows that the proportion of firms where more than 20% of workers were covered by
individual incentives rose from 38% in 1987 to 67% in 1999. The equivalent numbers for gain-sharing
rose from 7% to 24%.
European Evidence
Probably the best source in Europe (and perhaps the world) for looking at the trends in contingent pay
using the British Workplace Employment Relations Surveys (WERS). These are representative cross
5
sections of all establishments with 25 or more employees in the UK (over 2,000 in each year). There
are consistent questions on incentive pay in 1984, 1990 and 2004 so it is possible to see some longer
run trends using this data. The consistent question relates to the incidence of any form of contingent
pay for workers: Individual, Collective (e.g. team bonuses, Profit-related pay or Employee Share
Ownership Schemes). The data relates to the incidence of incentive pay by establishment (we do not
know neither what proportion of workers is covered nor what proportion of their pay is contingent on
performance)4.
With these caveats in mind, it is interesting that contingent pay does appear to be more important at the
end of the sample period relative to the beginning. Looking at Figure 2.3 we see that only 41% of
establishments had contingent pay in 1984, this had risen to 55% twenty years later. Two other points
are noteworthy. First, this time series change is driven by the private sector: not only was the incidence
of incentive pay very low in the public sector 10% or less), it actually fell over time. Second, the
growth of incentive pay is in the 1980s. After 1990, it remained essentially unchanged, actually falling
slightly from 56% to 55%.
Figure 2.4 disaggregates the overall incidence into the four types of contingent pay. An interesting
pattern emerges. The incidence of collective payment by results (Panel A) and profit-related pay
(Panel B), the two main form of group incentive pay schemes, has risen in a reasonably secular fashion
in the private sector, even in the 1990s and 2000s. By contrast the incidence of individual payment by
results (Panel C) and employee share ownership (Panel D) drives the aggregate picture of an increase
in 1984-1990, but a fall in the 1990-2004 period. The employee share ownership changes may be due
to various changes in tax incentives for such schemes, but the fall in individual incentive pay post 1990
is perhaps more surprising.
4 An additional issue is that this was asked in relation to the largest occupational group in the establishment, so some of the other workers (in other occupational groups) could have been covered.
6
The European Working Conditions Survey (EWCS) has asked a variety of HRM questions to random
samples of individuals in EU countries since 1995. One question relates to whether an individual
answered that his or her pay was “partially determined by piece rates or productivity related
payments”. Table 2.5 presents some data for the core 15 Member States of the European Union broken
down by broad occupational code. In contrast to the US, there appears to have been broad stability
over time with if anything a fall in the proportion of individuals having incentive pay (down from
12.8% in 1995 to 10.6% in 2005). The lower level and apparent stability of the EU countries may be a
true reflection of labor marker differences, but the question is also worded somewhat differently than
say the PSID, so caution needs to be taken
[We will do this for private sector males to be comparable with Lemieux et al.
We will add in new evidence from UK PRP in different data sources e.g. BHPS, ASHE].
Other HRM Practices
Turning to more general forms of HRM than pay; it becomes rather harder to summarize the existing
information. In levels there are a number of surveys with different sampling bases, response rates and
questions making them hard to compare.
Figure 2.6 illustrates some of the HRM questions that have been asked by different researchers.
Perhaps the most representative example for the US is Black and Lynch (2001, 2004) who collected
information from a survey backed by the US Department of Labor (used also by Cappelli and
Neumark, 2001). We present some means of variables: for example, in 1996 about 17% of US
establishments had self-managed teams, 49% in formal meetings and 25% in job rotation.
Lawler’s data of larger firms unsurprisingly shows a greater incidence of “innovative” HRM practices
(see Panel B of Figure 2.1). In their data for 1996, 78% of firms had self-managed teams and this
covered at least 20% of the workforce for just under a third of all corporations.
Bryson and Wood (2009) present an analysis of “high involvement” HRM using the UK WERS data
(see Figure 2.7). About half of all UK establishments had “team-working” in 1998. More interestingly,
the WERS data allows an analysis of changes over time. The incidence of teamwork (as indicated by

7
“team briefings” has grown from 31% in 1984 to 70% in 2004 and “suggestion schemes” has grown
from 22% in 1984 to 36% 20 years later. Disclosure of Information regarding investment plans has
risen from 32% to 46% over the same period. Most other forms of innovative HRM look remarkably
stable, however, with the exception of incentive pay that has already been discussed.
Cross Country Comparisons
The main source of information we use here is the Bloom-Van Reenen (2007) surveys on general
management practices which has some specific questions on HRM or “people management”. Since we
will refer to this work at several points we describe the methodology in a little detail as it is somewhat
different than the standard HRM surveys described above. The essential method was to start with a
grid of “best practices” in HR and non-HR management and then score firms along each of the
eighteen dimensions of this grid following an in-depth telephone interview with the plant manager.
These eighteen dimensions covered three broad areas, monitoring, target setting and people
management (see Appendix Table A1 for details). The people section covers a range of HR practices
including whether companies are promoting and rewarding employees based on ability and effort,
systematically trying to hire and keep their best employees, and dealing with underperformers through
retraining and where necessary sanctions? For example, are employees that perform well, work hard
and display high ability promoted faster than employees who under-perform and/or appear
incompetent.
To obtain accurate responses from firms they interview production plant managers using a ‘double-
blind’ technique. One part of this double-blind technique is that managers are not told they are being
scored or shown the scoring grid. They are only told they are being “interviewed about management
practices for a research project”. To run this blind scoring open questions were used since these do not
tend to lead respondents to a particular answer. For example, the first people question starts by asking
“tell me how does your promotion system work” rather than a closed question such as “do you
promote on ability (yes/no)”. Interviewers also probed for examples to support assertions, for example
8
asking “tell me about your most recent promotion round”. The other side of the double-blind technique
is interviewers are not told in advance anything about the firm’s performance to avoid prejuduice.
They are only provided with the company name, telephone number and industry. Since the survey
covers medium-sized firms (defined as those employing between 100 and 10,000 workers) these would
not be usually known ex ante by the interviewers. The survey was targeted at plant managers, who are
senior enough to have an overview of management practices but not so senior as to be detached from
day-to-day operations. The sample response rate was 45% and this was uncorrelated with measures of
firm performance.
These management practices were strongly correlated with firm performance (total factor productivity,
profitability, growth rates, and Tobin’s Q and survival rates) as well as firm size. These data were
taken from independently collected company accounts and imply that the managers’ responses
contained real information. These correlations are not causal but do suggest that HR practices that
reward effort and performance are associated with better firm performance. Other research shows that
these practices are also associated with better patient outcomes in hospitals (Bloom, Propper, Seiler
and Van Reenen, 2009) and improved work-life balance indicators (Bloom, Kretschmer and Van
Reenen, 2009).
Figure 2.8 shows the distribution of these people management practices across countries. The US
clearly has the highest average scores for people management. As Bloom, Sadun and Van Reenen
(2009) discuss this appears to be due to a combination of the US being absolutely good at managing
firms across all 18 questions on average and also having a particular advantage in people (HR)
management. Other countries with light labor regulation like Canada, Great Britain and Northern
Ireland also display relatively strong HR management practices. Interestingly Germany and Japan also
fare well, in large part reflecting the fact that these countries have generally well managed
manufacturing firms.
Figure 2.9 breaks out the people management score into three of the key areas in the overall people
management score, which are promotions, fixing/firing and rewards. What is clear is that US firms
have the globally highest scored practices across all three dimensions, but are particularly strong on
“fixing/firing” practices. That is, in the US employees who underperform are most likely to be rapidly
9
“fixed” (dealt with through re-training or rotated to another part of the firm where they can succeed),
or if this fails “fired” (moved out of the firm). In contrast in countries like Greece and Brazil
underperforming employees are typically left in post for several months or even years before any
action is taken to address them. In our interviews we frequently heard stories of employees being left
in post for years even though they were unable to do their jobs – for example, one manager in France
was drunk of the job but was allowed to remain in his post indefinitely because the firm did not have a
system for exiting underperforming employees. In sub-section 4.1 we discuss reasons for these
patterns. Broadly speaking, the high levels of competition and low incidence of family firms are the
main contributing factors to the leading position of the US in overall management. On top of this, high
levels of education and weaker labor regulations give American firms a particular advantage in the HR
aspect of management.
Figure 2.10 shows the firm level distributions within each country for these management practices,
showing there is a wide dispersion of practices within every country. The US average score is the
highest because it has almost no firms with weak HR management practices, while Brazil and Greece
has a large tail of firms with poor HR management practices. This wide variation within each country
is what most of the prior micro literature has focused on, with Figure 2.10 showing this variation is
common across every country we have investigated.
2.1.2 Indirect Methods
The indirect method has been more common in economics due to data constraints. Essentially this
method examines the correlation of workers’ remuneration with firm-specific characteristics that
should be important if pay is contingent such as profitability, market value, etc. For example, if there is
profit-related pay schemes, increases in firm profits should cause increase in worker pay. If pay was
set solely on the external labour market, it should be unrelated to idiosyncratic changes in the firm’s
position. An advantage of this approach over the direct approach is that many of the incentive schemes
may not be explicitly written down as contracts. A disadvantage is that the correlations we observe
may not be related to incentive schemes at all (e.g. a firm’s profitability may increase if it hires a larger
number of high quality workers who will be more highly paid). Further, to the extent we do credibly
indentify a causal effect of firm performance on worker pay we cannot discern easily whether this is
due to explicit contracts, implicit contracts, union bargaining, etc.
10
Having said this, there is substantial evidence that firm performance does matter a lot for worker
remuneration.
- Abowd et al; ECHD, matched worker-firm data
- Firm-level evidence: survey in LNJ; Abowd and Lemieux, QJE; Van Reenen 1996; Bertrand;
Blanchflower, Oswald and Sanfrey (1996); Abowd AER;
2.2 DESCRIPTIVE STATISTICS ON PRODUCTIVITY DISPERSION
Research on firm heterogeneity has a long history in social science. Systematic empirical analysis first
focused on the firm size distribution measured by employment, sales or assets. Most famously, Gibrat
(1931), characterized the size distribution as approximately log normal and sought to explain this with
reference to simple statistical models of growth (i.e. Gibrat’s Law that firm growth is independent of
size). In the 1970s as data became available by firm and line of business, attention focused on
profitability as an indicator of performance (e.g. Kwoka and Ravenscraft, 1986). Accounting
profitability can differ substantially from economic profitability, however, and may rise due to market
power rather than efficiency.
In recent decades the development of larger databases has enabled researchers to look more directly at
productivity. The growing availability of plant-level data from the Census Bureau in the US and other
nations combined with rapid increases in computer power has facilitated this development.
Bartelsman, Haltiwanger and Scarpetta (2008) offer many examples of the cross country micro-
datasets now being used for productivity analysis.
One of the robust facts emerging from these analyses is the very high degree of heterogeneity between
business units (see Bartelsman and Doms, 2000). For example, Syverson (2004a) analyzes labor
productivity (output per worker) in US manufacturing establishments in the 1997 Economic Census
and shows that on average, a plant at the 90th percentile of the productivity distribution is over four
times as productive as a plant at the 10th percentile in the same four digit sector. Similarly, Criscuolo,
Haskel and Martin (2003) show that in the UK in 2000 there is a fivefold difference in productivity
between these deciles.
11
Analysis of aggregate productivity growth has shown that a substantial fraction of the change in
industry productivity (e.g. about half in Baily, Hulten and Campbell, 1992) is due to reallocation of
output from lower productivity plants to those with higher productivity - i.e. it is not simply incumbent
plants becoming more productive. This reallocation effect is partly due to the shift in market share
between incumbents and partly due to the effects of exit and entry. Bartelsman, Haltiwanger and
Scarpetta (2008) show that the speed of reallocation is much stronger in some countries (like the US)
than others. There is also significant sectoral variation. For example, Foster, Krizan and Haltiwanger,
2006, show that reallocation between stores accounts for almost all aggregate productivity growth in
the US retail sector.
What could explain these differences in productivity, and how can they persist in a competitive
industry? One explanation is that if we accounted properly for the different inputs in the production
function there would be little residual productivity differences5. It is certainly true that moving from
labor productivity to total factor productivity (TFP) reduces the scale of the difference (e.g. in the
Syverson, 2004a, study the difference falls from 4.1 to 1.9), but it does not disappear.
These differences show up clearly even for quite homogeneous goods. An early example is Salter
(1960) who studied the British pig iron industry between 1911-1926. He showed that the best practice
factory produced nearly twice as many tons per hour as the average factory. More recently, Syverson
(2004b) shows TFP (and size) is very dispersed in the US ready mix concrete industry. Interestingly,
the mean level of productivity was higher in more competitive markets (as indicated by a measure of
spatial demand density) and this seemed to be mainly due to a lower mass in the left tail in the more
competitive sector. Studies of large changes in product market competition such as trade liberalization
(e.g. Pavcnik, 2002) or deregulation (e.g. Olley and Pakes, 1996) suggest that the subsequent increase
in aggregate productivity has a substantial reallocation element6.
A major problem in measuring productivity is the fact that researchers rarely observe plant level prices
so an industry price deflator is usually used. Consequently, measured TFP typically includes an
element of the firm-specific price-cost margin (e.g. Klette and Griliches, 1994). Foster, Haltiwanger
5 This is analogous to the historical debate in the macro time series of productivity between Solow, who claimed that TFP was a large component of aggregate growth and Jorgenson who claimed that there was little role for TFP when all inputs were properly measured (see Griliches, 1996). A similar debate is active in “levels accounting” of cross-country TFP (e.g. Caselli, 2005). 6 There is also a significant effect of such policy changes on the productivity of incumbent firms. Modelling the changing incentives to invest in productivity enhancing activities, such as R&D, is more difficult in heterogeneous firm models, but some recent progress has been made (e.g. Aw, Roberts and Xu, 2008).
12
and Syverson (2009) study 11 seven-digit homogeneous goods (including block ice, white pan bread,
cardboard boxes and carbon black) where they have access to plant specific output (and input) prices.
They find that conventionally measured revenue based TFP (“TFPR”) numbers actually understate the
degree of true productivity dispersion (“TFPQ”) especially for newer firms as the more productive
firms typically have lower prices and are relatively larger7.
Higher TFP is positively related to firm size, growth and survival probabilities. Bartelsman and
Dhrymes (1998, Table A.7) show that over a five year period around one third of plants stay in their
productivity quintile. This suggests that productivity differences are not purely transitory, but partially
persist.
In summary, there is a substantial body if evidence of persistent firm-level heterogeneity in firm
productivity (and other dimensions of performance) in narrow industries in many countries and time
periods. What could account for this?
7 Foster et al (2009) show that measured revenue TFP will in general be correlated with true TFP but also with the firm specific price shocks. Hsieh and Klenow (2007) detail a model where heterogeneous TFPQ produces no difference in TFPR because the more productive firms grow larger and have lower prices, thus equalizing TFPR. In their model intra-industry variation in TFPR is due to distortions as firms face different input prices.
13
3. THEORETICAL PERSPECTIVES 3.1. INTRODUCTION: TWO PERSPECTIVES ON HRM This chapter is focused more on empirical evidence and strategies than theory as there have been many
excellent review of the economy theory of HRM. Classic reviews of the literature are Gibbons and
Waldman (1999), Malcomson (1999), Prendergast (1999), Lazear (1999). A recent review is Lazear
and Oyer (2009) which updates much of the theory and some more recent empirical evidence. We
draw on this excellent survey extensively and readers are referred to this piece for much more detail
than we offer here.
A contrast can be drawn between two approaches. The first, which is the now classic approach of
Personnel Economics we label the “design” approach. Germane to the design approach is that the
HRM practices we observe are chosen by a profit maximising firm: they are explicit strategic choices
of the firm. The interactions between employees and shareholders and modeled explicitly (whereas
some areas of labor economics would abstract from this).
A second approach is becoming more common, but has not been closely linked to labor economics.
We label this the “managerial technology” approach because of the stress in recent branches of
economic (discussed in Section 2), such as trade, public and macro, but above all I.O. that there are
large and persistent differences in firm productivity. In this view some aspects of HRM could be
considered as a technology or “best practice” in the jargon. Adopting these forms of HRM would
improve productivity the typical firm (in a given place and time). This leads on naturally to the
question of why, if this is the case, all firms have not adopted such practices. We discuss this, but one
explanation is that all technologies have a diffusion curve and one explanation for slow diffusion is
that information is not acquired by all firms immediately on the existence and best way to implement
the new technology. For example, it took American car manufacturers decades to accept and then
implement Japanese style “lean manufacturing” techniques pioneered by Toyota. Informational
constraints (and other factors we discuss below) could be an explanation for slow diffusion of a major
innovation.
The firm heterogeneity inherent in the managerial technology perspective mirrors the traditional labor
economist’s emphasis on heterogeneity amongst workers. Many recent contributions have found that
14
fundamental features of the labor market, such as wage distributions cannot be easily understood
without appealing to firm heterogeneity (e.g. Postel-Vinay and Robin, 2002; Cahuc, Postel-Vinay and
Robin, 2006).
The Design and managerial technology perspectives are not mutually exclusive, of course. As
economists, we believe that there is always some element of maximisation. The managerial technology
perspective highlights, however, that some firms are constrained by being less productive than others.
We believe that this is an important empirical phenomenon which can explain many puzzling facts and
requires integration into the dominant design paradigm.
3.2 THE DESIGN PERSPECTIVE
The economics of contracts (see Bolton and Dewatripont, 2005, for an overview) and the economics of
organization (see Gibbons and Roberts, 2009) have made huge strides in recent decades. HRM or
Personnel economics is a sub-class of this broader field with a focus on explaining the type of
institutions we observe in real employment contracts and organization.
Prior to the emergence of Personnel economics, the study of HRM was dominated by industrial
psychologists and sociologists who emphasised institutions and culture as determining the internal
organization of firms. Generalizations were eschewed. Traditionally labor economists focused on labor
demand and supply, unemployment and investment in education, issues that saw the firm as a single
unit rather than a complex organization and so had little to directly say on the structure of pay,
promotions and design of work within firms. This started changing in the 1970s partly as new
techniques of agency and contract theory allowed a more systematic treatment of activity inside
companies.
The design perspective borrows three key principles from economics. First, firms and workers are
rational maximizing agents (profits and utility). Secondly, it is assumed that labor and product markets
must reach some sort of price-quantity equilibrium, which provides some discipline for the models.
Finally, the stress is very much on efficiency with an emphasis on why practices which look to be
perplexing and inefficient (e.g. mandatory retirement and huge pay disparities for CEOs) may actually
be (at least privately) optimal. We shall see in the next section that there is more of an emphasis on
why some firms may be inefficient in the “management as technology” approach.
15
Lazear and Oyer (2008) stress five key aspects of personnel economics: Incentives, Matching firms
with workers, Compensation, Skill development and Work organization. Incentives have been a key
focus with much work on high powered pay incentive schemes as a mechanism to elicit greater effort,
but at the cost of worse insurance and distortionary behavior from “gaming”. We will discuss this in
detail in sub-section 4.1. Incentives can also come from tying pay to objective measured of
performance, subjective measures of performance or through tournaments. Alternatives to incentive
schemes include paying efficiency wages or through intrinsic motivation.
Matching focuses on how there are idiosyncratic productivity benefits from matching (i) certain
workers matching with certain firms, (ii) within firms assigning certain workers to certain jobs. This
process is not trivial as both workers and firms may be uncertain of the match quality and only learn
about this over time. Matching is an alternative way of rationalising the upwards sloping tenure-wage
profile to specific human capital. In asymmetric information models, there will generally be wasteful
investments in signals of quality (Spence, 1973). Compensation includes the mix of pay and non-pay
job characteristics, as in Rosen’s (1974) theory of compensating differentials, learning about ability
and payment in equity. Skill development relates to human capital acquisition building on Becker’s
(1964) work on general and specific human capital. Much recent work has focused on why firms
sometimes pay for general human capital and workers for specific human capital (e.g. Acemoglu and
Pischke, 1998, 1999). Finally, work organization looks at job design, teams and hierarchies.
We will be focusing on incentives, compensation and work organization in this review for space
reasons. The key feature of the design approach is that the HRM practices we observe are chosen by
firms to maximize profits in an environment that departs from perfectly competitive spot markets.
Unlike the standard Personnel Management texts, Personnel Economics leads to sharper predictions
and generalizations: it is not the case that “every workplace is fundamentally different”. However, the
design approach puts the reason for heterogeneity in the adoption of different practices as mainly due
to the different environments firms face – say in the industry’s technology, rather than inefficiencies.
The managerial technology view, described next, sees a large role for inefficiencies8.
3.3 THE MANAGERIAL TECHNOLOGY PERSPECTIVE 8 The difference should not be exaggerated. The introduction to Lazear (1995)’s textbook on Personnel Economics stresses the role of the sub-field as normative helping managers to improve efficiency. He stresses that there can be large gains in GDP to small improvements in firm’s adoptions of economically rational HRM practices.
16
3.3.1 What is HRM “best practice”? The large dispersion in firm productivity discussed in sub-section 2.2 motivates an alternative
perspective that some types of HRM (or bundles of HRM practices) are better than others for firms in
the same environment. There are three types of these best practices. First, there are some practices that
have always been better throughout time and space (e.g. not promoting gross incompetents to senior
positions) or collecting some information before making decisions. Second, there may be genuine
managerial innovations (Taylor’s Scientific Management; Toyota’s Lean Manufacturing System;
Denning’s Quality movement, etc.) in the same way there are technological innovations. There are
likely to be arguments over the extent to which an innovation is real technical progress or just a fad or
fashion. It is good to recall that this debate occurs both for “hard” technological innovations, such as
the Internet once did, as well as “softer” managerial innovations. Thirdly, many practices may have
become optimal due to changes in the economic environment over time, as the design perspective
highlights. Incentive pay may be an example of this: piece rates declined dramatically in the late 19th
Century, but incentive pay appears to be making somewhat of a comeback (see sub-section 2.1).
Lemieux et al (2008) suggest that this may be due to advances in ICT – companies like SAP make it
much easier to measure output in a timely and robust fashion, making effective incentive pay schemes
easier to design. In these circumstances, some firms may be much better than others at realizing things
have changed and switching to the new best practice. The differential speed of adjustment to the new
equilibrium can be due to information differences, complementarities (see XX below) and agency
issues.
Notice that there is nothing in what we have said which is specifically tied to HR in this description. If
productivity dispersion is due (at least in part) to differential managerial quality then this applies both
to the HR and non-HR parts. The empirical issue is whether there is aspect of management, HRM or
otherwise, that can be characterized as best practice or not. We turn to this issue in Section 4. We next
examine some of the theories of management that could help account for productivity dispersion (of
which HRM is a subset).
3.3.2 Theories of management quality
The large-scale productivity dispersion described in Section II poses serious challenges to the
representative firm approach. This has lead to a wholesale re-evaluation of theoretical approaches in
17
several fields. For example, in international trade the dominant paradigm has already started to shift
towards heterogeneous firm models (e.g. Melitz, 2003).
Imperfect competition is one obvious ingredient for these models. With imperfect competition firms
can have differential efficiency and still survive in equilibrium. With perfect competition inefficient
firms should be rapidly driven out of the market as the more efficient firms undercut them on price.
Another important element is “frictions”. Melitz (2003) follows Hopenhayn (1992) in assuming that
firms do not know their productivity ex ante, but when they enter they receive a draw from a known
distribution. Productivity does not change over time. It can be thought of as entrepreneurs founding
firms with a distinct managerial culture which is imprinted on them until they exit, so some firms are
permanently “better” or “worse” managed. Over time, the low productivity firms are selected out and
the better ones survive and prosper. There is some stochastic element to this, however, so in the steady
state there will always be some dispersion of productivity.
Identifying this permanent productivity advantage as “managerial quality” is consistent with the
tradition in the panel data econometric literature. Indeed, Mundlak’s (1961) fixed effects panel data
model was designed to control for this unmeasured managerial ability. More recent attempts have tried
to measure management directly rather than indirectly.
Modeling the TFP advantage as a fixed factor is a convenient way of introducing frictions in the
model. The managerial factor is “trapped” as there is no direct market for it as it cannot be transferred
between firms. When the firm exits, so does the productivity advantage – entrepreneurs take a new
draw if they enter again. In reality, adjustment costs can take more general forms and are likely to be
important as organizational forms take time to adjust (e.g. to move from centralization to
decentralization). Measured TFP will diverge from real TFP if some firms are further away from their
long-run equilibrium than others.
The management quality measures in Bloom and Van Reenen (2007) can be interpreted as the
permanent draw from the productivity distribution when firms are born. Alternatively, it may reflect
that some individuals have superior managerial skill and can maintain a larger span of control as in
Lucas (1978). More generally, management quality could evolve over time due to investments in
training, consultancy, etc.
18
A common feature of these models is that management is partially like a technology, so there are
distinctly good (and bad) practices that would raise (or lower) productivity. We believe that this is an
important element in management quality, and the traditional models that seek to understand
technological diffusion are relevant for understanding the spread of managerial techniques (e.g. Hall,
2003).
An alternative theoretical to the view that management has a technological aspect is the perspective
that all management is contingent, so no practice can ever be considered on average to be better or
worse. In these models, firms at every point are choosing their optimal set of management practices
and no firm is more efficient than another based on these. In management science, “contingency
theory” (e.g. Woodward, 1958) is akin to this. Any coherent theory of management has firms choosing
different practices in different environments, so there will always be some element of contingency. For
example, Bloom and Van Reenen (2007) show that firms appear to specialize more in investing in
“people management” (practices over promotion, rewards, hiring and firing) when they are in a more
skill-intensive industry. If we examine the relative scores by country for monitoring and target setting
practices compared to people management, the US, India and China have the largest relative advantage
in people management, and Japan, Sweden and Germany the largest relative advantage in monitoring
and target setting management. The systematic difference in the relative scores of different types of
management across countries also suggests that there may be some specialization in areas of
comparative advantage, perhaps due to labor market regulation.
The interesting question is whether there really are any “universals”, i.e. some practices that would be
unambiguously better for the majority of firms? If this is so, why are they not adopting them? The
answer to this question is identical to that of the adoption of any new technology – there are costs to
adoption in the form of information, incentives, regulatory constraints, externalities, etc. These will
vary somewhat by time and place and we turn to some of these factors next.
4. SOME DETERMINANTS OF HRM PRACTICES
4.1 Introduction
19
The large span of theories, empirical work and studies makes it impossible to discuss all areas of the
determinants of HRM. Consequently we have chosen to be selective and focus on some key themes of
the literature.
4.1 CONTINGENT PAY AND OTHER HRM PRACTICES
4.1.2 Risk/uncertainty and incentive pay
One of the most basic features of performance pay is the incentive vs. insurance trade-off. A first best
contract could be written on effort. But the essence of the principal agent problem is that the agent’s
effort is not perfectly observable. An obvious way to solve the principal agent problem is for the
principal to sell the firm to the agent whose incentives would then be aligned with value maximization.
This does sometimes happen in market stalls and some other contexts, but it is exceptional.
A fundamental reason for this is that individuals are more risk averse than firms. Consider a contract
that is partially base salary and partially tied to a measure of worker output (a signal). The measure of
worker output is a function of effort and stochastic factors: these might be measurement error in the
signal or truly exogenous shocks to the signal. The greater the variance of the noise relative to the
signal, the risk the worker is forced to bear. Thus, in order to attract the worker to supply his labor to
the firm (the participation constraint), the lower will be the weight attached to the worker’s measured
output in the optimal contract. There is a trade-off between risks and incentives.
Prendergast (1999) analyzed this in detail and lamented that the evidence here was very mixed. For
example, Garen (1994) examines the degree to which CEO compensation is linked to performance (the
“β” in a linear contract). The relationship between β and the noisiness of performance measures
should be negative, but appears to be zero in his data. Brown (1990) examining a wider range of
occupations also finds little relationship. Prendergast (2000, 2002a, 2002b) looks at this evidence in
more detail and offers several possible explanations. In Prendergast (2002a) risky environments will be
ones were the manager’s private information is more valuable. This is because the uncertainty in this
environment will make it much more likely that the agent knows what the right thing is to do rather
than the principle. In such circumstances delegating decisions to the agent become more attractive. In
other words, the increased cost of incentive pay in a risky environment to a manager may be
overwhelmed by the increased benefits for the principal. Because the degree of delegation is hard to
20
control for at the same time as environmental uncertainty, this is why existing empirical evidence is
weak.
Prendergast’s point is a specific example of a more general principle in terms of the incentives to
decentralize when it is hard for the principal to learn about the “right action” in a noisy environment.
We describe this model in more detail in sub-section 4.2.3 below and show that there is string
empirical evidence that more uncertain/heterogeneous environments do cause greater decentralization
as Prendergast suggests (Acemoglu et al, 2007). Whether this resolves the empirical paradox is still
unclear, however9.
4.1.3 Product Market Competition
Adam Smith wrote that “Monopoly...is a great enemy to good management.”10
The increase in incentive pay and some other forms of HRM discussed in Section 2 could arise from
many factors. One possibility is that the increase in product market competition caused by
deregulation, globalization and technological change could be an important factor. Theoretically, the
effects of competition on the form of incentive pay is ambiguous from the design perspective. The
analysis in Vives (2008) is very useful as he shows that higher powered incentives can be considerd in
some respects as an investment in non-tournament R&D. The firm invests in something which
increases fixed costs but lowers marginal costs.
Consider an increase in consumer price sensitivity as an index of product market competition. The
“stakes” are higher: if a firm can reduce marginal costs this will have a larger effect on relative market
share or profitability than when competition is lower. On the other hand, the higher competition means
that profits are lower in the industry, so any given performance contract will generate lower expected
benefits for standard “Schumpeterian reason. There are other forces at play – firms may be larger in
equilibrium as the mor eintense competition induces exit, and the laregr firms will have a graeter
incentive to introduce perofrmnace pay as rhey can spread their fixed costs over a large sales base. 9 There have been attempts to combine information on delegation and incentive pay (e.g. Adams, 2005 and DeVaro and Kurtulus, 2007), but both incentive pay and delegation are exogenous variables so some additional exogenous variation is needed to be conclusive. 10 The Wealth of Nations, Book I Chapter XI Part I p148
21
Endogenising entry will tend to strengthen the positive effect of competition, as firms will in
equilibrium be larger so have higher sales to spread fixed costs.
From the “management technology” perspective, it is clearer why competition has a positive effect on
best practice HRM. Even in the absence of any endogenous responses in changing incentive pay or
other HRM practicess, tougher competition will mean that firms who have inefficient pratices will
shrink and exit, thus raising overall managerial quality in the industry. The evidence from Figure 2.9
suggested that management practices were better in the US where such selection effects where likely
to be very strong. More formally, we can look at the conditional correlation between the management
score and competitive intensity. Whether measured by trade oppenness, the industry inverse Lerner
Index or simply the number of perceived rivals competition is robustly and positively associated with
higher management practice scores (see Bloom, Genakos, Sadun and Van Reenen, 2009). Note that the
obvious endogeneity bias here is to underestimate the importance of competition as better managed
firms are likely to have higher profit margins, lower import penetration ratios and drive out their
rivals11.
Consistent with these general results on the positive effect of competition on explict measures of
management, Guadalupe and Cunat (2009a) show that the pay-performance sensitivity for US CEOs is
stronger when import competition is stronger (as measured by tariffs). In Guadalupe and Cunat
(2009b) they show a similar result using US banking deregulation as an exogenous shift to
competition. And in Guadalupe and Cunat (2005) they also find that the correlation between pay for
UK workers and exectutives and firm performance strengthens with competition using the exchange
rate appreciation in 1996 which differentially affected traded and non-traded sectors. These papers all
use a quasi-experimental approach to obtain causal effects of competition.
4.1.4 Family Firms
There has been a lively debate on the relative merits of family firms (e.g. Bertrand and Schoar, 2006).
Firms which are both owned and run by a family member are very common, especially in developing
countries. Figure 4.1 plots a firm-level histogram of the management scores by ownership category.
The bars display the distribution of management practices within ownership group. The dotted line is
the kernel density for dispersed shareholders – which is the most common ownership category in the
US - for comparison. Firms that are family owned and family managed (“Family, family CEO”) have a
11 There is a literature examining how incentive pay contracts can be used as commitment devices to tougher competition (e.g. Aggarwal and Samwick, 1999)
22
large tail of badly managed firms, while the family owned but externally managed (“Family, external
CEO”) look very similar to dispersed shareholders. Government firms are clearly badly managed,
while firms owned by Private Equity appear well managed.
This finding is robust to more systematic controls for other covariates (see Bloom and Van Reenen,
2007). Family ownership per se is not correlated with worse management practices, it is when family
ownership is combined with the CEO being chosen as the eldest son (Primogeniture) that the quality of
management appears to be very poor. This is consistent with the idea that limiting the talent pool to a
single individual is not the optimal form of CEO selection. It is also consistent with Perez-Gonzalez
(2006) and Bennesden, Nielson, Perez-Gonzales and Wolfenzon (2007) who find that inherited family
control appears to cause worse performance (a result that is strengthened by using the gender of the
eldest child as an instrumental variable for family management as families usually only bring in
external managers following a crisis).
4.1.5 Globally engaged firms
Consistent with Helpman, Melitz and Yeaple (2004) there is a pecking order in management scores
with purely domestic firms at the bottom, firms that export but do not produce overseas next and
multinational firms at the top. In fact, multinational subsidiaries tend to be better managed in every
country (see Figure 4.2), consistent with the idea that they can “transplant” some of their practices
overseas. This is important as it suggests that a mechanism for good management practices to diffuse
internationally is through the investments of overseas firms.
Some direct evidence on the importance of this mechanism is presented in Bloom, Sadun and Van
Reenen (2007). They investigate the puzzle of why productivity growth in the US was so much faster
after 1995 in the US than Europe, the opposite trend from the previous 50 years of catch-up. Part of the
story is that US firms appear to be much more effective in using IT to improve their productivity, and
this in turn is related to US firm’s greater use of modern HRM practices (incentive pay, careful hiring,
rigorous appraisals and promotions, etc.). They show that the subsidiaries of US multinationals in
Europe have higher IT productivity than comparable multinationals, use more of these HRM practices
and have higher productivity, primarily from their superior use of IT.
4.1.6 Labor market regulation
23
The cross country differences in people management are related to the degree of labor market
regulation (lightly regulated countries such as the US and Canada do better than heavily regulated
countries such as France, Brazil and Greece). This is consistent with heavily regulation of labor
markets directly restricting managerial practices around hiring, firing, pay and promotions (see Figure
4.3).
4.1.7 Summary on determinants of HRM
Although causality is hard to prove, our reading of the evidence is that weak product market
competition, family-run firms and heavier labor regulation leads to less incentive pay and “modern”
people management practices.
4.2 WORK ORGANIZATION: THE EXAMPLE OF DECENTRALIZATION
An important aspect of HRM is work design – how are roles ascribed to different jobs? In this sub-
section we focus on one aspect of design which we label “decentralization”. This is how much real
authority is delegated to a particular job? This is perhaps the most widely studies theoretical aspect of
the workplace after pay incentives and there is a smaller, but growing empirical literature.
Note that decentralization is distinct from managerial spans of control. These are distinct concepts as
the span and depth (number of levels) of a hierarchy are compatible with different power relationships
between the levels. Nevertheless there is some evidence that the move towards delayering over the last
twenty years has been associated with decentralization (see Rajan and Wulf, 2006), and we will touch
on this below.
4.2.1 Measurement of decentralization
A key factor in any organization is who makes the decisions? A centralized firm is one were these are
all taken at the top of the hierarchy and a decentralized firm is where decision-making is more evenly
dispersed throughout the hierarchy. An extreme case of decentralized organization is a market
economy where atomistic individuals make all the decisions and spot contract with each other. The
origin of many of the debates on decentralization has their origins in the 1930s over the relative merits
of a market economy relative to a centrally planned one.
24
How can this concept be operationalized empirically? One way is to look at the organization charts of
firms (“organogram”) as graphical representations of the formal authority structure. One of the best
studies in this area is Rajan and Wulf (2006) who use the charts of over 300 large US corporations
1987-1998 to examine the evolution of organizations (e.g. how many people directly report to the CEO
as a measure of the span of control). Unfortunately, as Max Weber and (more recently) Aghion and
Tirole (1997) stressed, formal authority is not the same as real authority as the organogram may not
reflect where real power lies.
Observing whether a firm is decentralized into profit centers is useful, as this is a formal delegation of
power - the head of such a business unit will be performance managed on profitability. If the firm is
composed of cost (or revenue) centers this indicates less decentralization. If the firm does not even
delegate responsibility at all, this is more centralized. Acemoglu, Aghion, Lelarge, Van Reenen and
Zilibotti (2007, henceforth AALVZ) use this distinction.
Still, just using profit centers as an indicator is rather crude and a better way is directly survey the
firms themselves. Bloom, Sadun and Van Reenen (2009a) measure decentralization between the
central headquarters (CHQ) and the plant manager (see Table A2). They asked plant managers about
their decisions over investment (maximum capital investment that could be made without explicit sign
off from central headquarters), hiring, marketing and product introduction (the latter three on a scale of
1 to 5).
As a summary empirical measure consider the combination of these four measures into a single index
of decentralization by z-scoring each individual indicator and z-scoring the average. As with the index
of management quality in Bloom and Van Reenen (2007) decentralization displays considerable
variation across firms. There is also a large difference across countries as shown in Figure 4.4.
Interestingly, the US, UK and Northern European countries are the most decentralized and the Asian
countries the most centralized.
Decentralization extends beyond just plant managers and the CHQ of course. At a minimum there is
the autonomy of the workers from the plant manager. Bresnahan, Brynjolfsson and Hitt (2002) focused
on this aspect. Proxies for this include questions over worker control over the pace of work and the
allocation of tasks (see Table A2).
4.2.2 Theories of decentralization
25
The basic trade off in the decentralization decisions is between the efficient use of local information
(see Radner, 1993) favoring delegation and the principal-agent problem where the agent has weaker
incentives to maximize the value of the firm than the principal (on the trade-off see Aghion and Tirole,
1997 and Prendergast, 2002).
The benefits from decentralization arise from at least three sources. First, decentralizing decision-
making reduces the costs of information transfer and communication. In a hierarchical organization,
information that has been processed at lower levels of the hierarchy has to be transferred upstream.
This induces a cost due to the need that information be codified and then received and analyzed at
various levels (Bolton and Dewatripont, 1994). When decision-making is decentralized, information is
processed at the level where it is used so that the cost of communication is lower. Second,
decentralization increases firms’ speed of response to market changes (Thesmar and Thoenig, 1999).
One reason for this is that hierarchical organizations are characterized by a high degree of
specialization of workers. Any response to market changes involves the coordination of a great number
of activities so that overall firm's reaction speed is low. When responsibility is transferred downstream,
it is most often delegated to teams of workers, generally involved in multi-tasking. This allows a
quicker reaction to market changes given that coordination involves a limited number of multi-skilled
workers. Finally, decentralization of decision-making may increase productivity through rising job
satisfaction. Delegation of responsibility goes along with more employee involvement, greater
information sharing and a greater participation of lower level staff.
Turning to the costs of decentralization, we highlight four of them. First, costs arise from the risk of
duplication of information in the absence of centralized management. Workers are now in charge of
analyzing new pieces of information. With decentralization the risk of replication in information
processing increases, both across individuals and across teams. A related risk is that of an increase in
the occurrence of “mistakes” as there is less co-ordination (e.g. plants producing substitutable products
will tend to price too low) - see Alonso, Dessein and Matouschek (2008) for a general discussion. A
third cost is that decentralization makes it more difficult to exploit returns to scale (Thesmar and
Thoenig, 2000). The reason for this is that as multi-tasking develops returns to specialization decreases
so that large-scale production becomes less beneficial. Finally, decentralization may reduce workers'
efficiency if the increase in responsibility that it implies induces rising stress (Askenazy, 2001). In this
case, productivity may be directly affected and/or reduced through lower job satisfaction.
4.2.3 Some factors determining decentralization
26
We divide our analysis into the examination of three groups of factors that influence decentralization:
technological, economic and cultural.
Technological Factors
Firm Size and Scope
Some basic factors determine decentralization. All else equal a larger firm will require more
decentralization than a small firm. A sole entrepreneur does not need to delegate because he is his own
boss, but as more workers are added, doing everything himself is no longer feasible. Penrose (1959)
and Chandler (1962) stressed that decentralization was a necessary feature of larger firms, because
CEOs do not have the time to take every decision in large firms. Similarly as firms expand in their
scope both geographically and in product space, local information will become more costly to transmit
so this will also favor decentralization
Table 4.5 illustrates these factors at work from Bloom, Sadun and Van Reenen (2009a) who regress
plant manager autonomy on a number of factors. Column (1) shows that doubling firm size increases
the decentralization in index by 0.05 of a standard deviation and doubling of plant size increases
decentralization by 0.09. Plant managers in subsidiaries of foreign multinationals have 0.16 of a
standard deviation more autonomy than similar plants that are domestic non-multinationals12.
Static Problem Solving: Information and Communication Technologies (ICT)
Garicano (2000) formalizes the idea of the firm as a cognitive hierarchy. There are a number of
problems to be solved and the task is how to solve them in the most efficient manner. The simplest
tasks are performed by those at the lowest level of the hierarchy and the “exceptional” problems are
passed upwards to an expert. The cost of passing problems upwards is that communication is non-
trivial. The benefit of passing the problem upwards is that it economizes on the cognitive burden of
lower level employees.
This framework was designed to address the impacts of ICT. Interestingly, information technologies
have different implications for decentralization than communication technologies. Consider again the
decentralization decision between the CHQ and plant manager. When communication costs fall
through (for example) the introduction of company intranets, it is cheaper for the plant manager to
refer more decisions to the corporate officers. So communication technologies should cause
12 Colombo and Delmastro (2004) also find that complexity related variables are associated with decentralization in their Italian firms.
27
centralization. By contrast, technologies that make it easier for the plant manager to acquire
information (e.g. Enterprise Resource Planning software, ERP like SAP) means that decentralization
should increase. An example in law firms would be Lexus Nexus that enables junior lawyers to
quickly find relevant cases without consulting a more senior associate or partner.
Bloom, Garicano, Sadun and Van Reenen (2009) test this theory and find considerable empirical
support. Computer networks (reducing communication costs) significantly decrease decentralization to
plant managers whereas tools to help managers access more information (like ERP) significantly
increase decentralization. The magnitude of the effect is substantial. An increase in ERP usage by 60%
(the average difference in ICT between Europe and the US) increases plant manager’s autonomy by
0.025 which is equivalent to a large increase in the supply of human capital (roughly the same as the
increase in US college graduates between 1990 and 2000).
Dynamic Learning: Age, innovation and heterogeneity
AALVZ present a model of decentralization that stresses the need to learn about the best way to use a
new technology. This is a special case of the general problem that an organization faces in deciding
whether to do a new thing without knowing for sure what the benefits (and perhaps costs) will be. The
set-up is of a principal (CHQ) deciding whether or not to delegate to a local agent (plant manager) who
is better informed. As usual the trade-off is between better local information, and worse incentives due
to the agency problem.
The natural way to model this is of the firm attempting to learn from other implementations of the
technology. AALVZ consider first the problem of learning from other firms in the industry. The
profitability of each previous implementation of the technology is a (noisy) signal of the profitability
of the firm implementing the technology itself. Firms act as Bayesians updating their priors based on
the public history of other firms. As we know more and more about the success of the new technology
there is increasingly less need to delegate to the better informed local agent. This immediately
generates two results. First, the greater the heterogeneity of the industry, the less valuable will be the
experience of other firms in predicting the outcome for the firm itself. Thus greater heterogeneity (as
indicated by say, the variance of productivity) will be associated with more decentralization. Second,
the more recent the technology the less will be known, so the more likely the firm is to decentralize to
the plant manager. An extension to the model considers learning from oneself rather than from others.
In this case older firms who have had more time to learn about themselves should be more centralized
than younger firms.
28
AALVZ measure decentralization in several ways using both formal measures of whether firms are
organized into profit centers (in French data) and “real” survey measures of the power managers have
over hiring decisions (in British data). In both samples they find econometric evidence consistent with
their three theoretical predictions: decentralization is more likely in industries that are more
heterogeneous, and for firms that are younger or closer to the technological frontier. These results are
illustrated in Figures 4.6 where average decentralization is plotted by decile for the raw data. In Panel
A, there is a reasonably clear upward slope after the second decile between decentralization and
heterogeneity13. In Panel B, decentralization appears to be higher among firms closer to the
technological frontier (as measured by productivity) and in Panel C older firms appear more
centralized than younger firms.
Economic Factors
Skills
Many models would predict that human capital should be associated with decentralization. For
example, more skilled workers will have greater ability to take on more responsibility. When the
environment changes due to new technologies and organizational change is required, skilled workers
may be better at learning how to cope with the new organizational structures.
There is generally a robust and positive association of decentralization and skills. Column (1) of Table
4.5 measures skills by the proportion of people who hold a college degree and find this to be
significantly correlated with decentralization. Caroli and Van Reenen (2001) examine the relationship
between skills and organization in some detail, arguing in favor of “skill biased organizational
change”. To tackle the endogeneity problem they use information on the differential price of skilled vs.
unskilled labor in the local market (as indicated by the wage differential between college educated
workers and other individuals). They argue that this skill premium is partially driven by exogenous
shifts in labor supply of unskilled workers. For their sample of UK and French firms they find that
regions where skill prices are higher have a lower probability of decentralization/delayering.
Product Market Competition
Some authors such as AALVZ argue that a cause of the move to more decentralized and delayered
organizations is rapid technological change (in IT for example). An alternative explanation is that
13 The authors show that the anomalous first decile is due to the disproportionate number of older and less productive firms in this decile (this is controlled for in the regressions).
29
globalization and deregulation (and perhaps technical change itself) has increased the degree of
product market competition has stimulated organizational change.
Theory is ambiguous here. If competition has made swift decisions more important than this will have
increased the salience of local knowledge, leading to greater decentralization under the framework
discussed above (e.g. Aghion and Tirole, 1997). Similarly if competition aligns the incentives of
agents more with the principal than the costs of decentralization may also have fallen. There are
countervailing forces however. For example, a larger number of firms in an industry aid yardstick
competition, but it may also help learning in the AALVZ framework which will reduce the need to
decentralize.
The empirical evidence is clearer cut. Bloom, Sadun and Van Reenen (2009a) find a robust positive
association between competition and decentralization using industry import competition (column (2) in
Table 4.6), the inverse industry Lerner index (column (3)) or simply the number of perceived
competitors (column (4)). A similar positive correlation was reported in AALVZ and Marin and
Verdier (2008). Both of these are cross sectional studies and the positive coefficient on competition
could simply reflect unobserved variables. Guadalupe and Wulf (2009) try to tackle this using the
Rajan and Wulf (2006) panel data on the changing organizational structure of firms over time. They
argue that the Canadian-US Free Trade Agreement (FTA) in 1989 constitutes an exogenous increase in
competition for US firms in the industries where tariffs were removed. Exploiting this policy
experiment they find that competition is associated with delayering (increasing span for CEO) and that
this is likely to also reflect increased delegation (using wage data).
Cultural and Legal Factors
In recent years, economists have started to take cultural factors more seriously in determining
economic outcomes (Guiso, Sapienza and Zingales, 2006; Grief, 1994). Part of this is due to the
influence of Putnam (1993) on the importance of social capital and the finding that trust is important in
a number of economic dimensions (e.g. see Knack and Keefer, 1997, on growth or Guiso, Sapienza
and Zingales, 2009, on foreign trade).
Trust is an obvious candidate from improving delegation incentives as it will relieve the agency
problem that the delegated agent will steal from the principal. It could also be a mechanism to enforce
long term contracts in repeated interaction (e.g. Baker, Gibbons and Murphy, 1999). If contracts can be
well enforced this should enable decentralization to take place and we do observe more delegation in

30
countries where rule of law is strong (see column (5) in Table 4.5).14 However, contracts are never
perfectly enforceable and this leaves a role for trust to help generate more delegation.
Bloom, Sadun and Van Reenen (2009a) examine the importance of culture. Column (1) of Table 4.5
shows that a higher level of trust in the region where a plant is located is associated with a significantly
greater degree of decentralization. Trust is measured using the standard indicators in the World Values
Survey. The magnitude of this effect is non-trivial. Moving from the region with the lowest level of
trust (Assam in India) to the highest trust region (Norrland in Sweden) is associated with an increase of
0.45 of a standard deviation in the decentralization index.
Bloom, Sadun and Van Reenen (2009a) also exploit the fact that they have many subsidiaries of
multinational firms so they can construct measures of trust in the country of origin (the multinational’s
headquarters) and location (country were affiliate is set up). Both of these seem to matter for
decentralization, but the most powerful factor is the bilateral trust between country pairs, i.e. the
degree to which people from the subsidiary’s parent country trust people in the country where the plant
is located. Multinationals locating in countries that are seen to be relatively highly trusted (after
country location and origin dummies are removed) is more likely to decentralize. This suggests that
trust can affect the internal structures of global firms and that some aspects of organization are
transplanted abroad as suggested by recent theories of international trade (e.g. Helpman Melitz and
Yeaple, 2004).
“Hierarchical” religions could have an indirect effect on trust as they tend to be associated with lower
levels of the generalized trust measure that we use here. On the other hand they could have a direct
effect on trust if members of these religions have a lower taste for autonomy. They test this by
including an indicator for the proportion of individuals in a region who profess themselves to be
Catholic, Muslim or Eastern Orthodox in the decentralization regressions. Columns (5) and (6) shows
that regions that have more hierarchical religion are less likely to have decentralized firms even
conditional on trust and Rule of Law.
Summary on decentralization
14 Laevan and Woodruff (2007) looked at the impact of rule of law on firm size across regions within one country, Mexico. They find larger firms in the states where rule of law is better enforced, consistent with our argument that strong rule of law facilitate decentralization, which in enables larger firms to operate efficiently.
31
Like good management, larger, global firms that are closer to the technology frontier and located in
more heterogeneous and competitive industries will on average, become more decentralized.
Improvements in information technology increase decentralization, but improvements in
communication technology reduce decentralization. Finally, cultural and legal factors such as lower
trust increase decentralization.
5. THE EFFECTS OF HRM ON PRODUCTIVITY
In this section we address the issue that most people first ask: does HRM matter for productivity (and
to a lesser extent measures like profitability and stock market performance). We find that the answer is
“probably, yes”. So the immediate follow-up questions are: are why and for whom? In the empirical
section we focus on productivity as the key outcome. Many studies look at other outcomes such as
worker turnover, absenteeism, worker perceptions, etc. These are somewhat interesting, but if they
have no effect on productivity then second order – generally studies use them because they have no
direct evidence on productivity (e.g. Blasi et al, 2009:4). We do not include other outcomes such as
worker wellbeing (e.g. wages, job satisfaction) or inequality. On inequality Lazear and Shaw (2008)
suggest that some of the dramatic increase in wage inequality in the US, UK and other country since
the late 1970s is due to HRM practices. Lemieux et al (2008) and Guadalupe and Cunat (2009a) also
take this position, although the current state of the evidence is still meager.
These are more interesting outcomes in their own right, and may also feed through into productivity,
but we are space constrained and refer the reader to the wider literature were relevant.
[To include (?):
(i) Issues in the estimation of production functions. econometric problems in estimating the
coefficients on the production function so that we have a consistent measure of total factor
productivity (see Ackerberg, Benkard, Berry and Pakes, 2007, for a discussion of recent
contributions here).
(ii) Specifically papers on looking at productivity effects of human capital – i.e. Hellerstein &
Troske; Moretti; Dearden et al; Klette; Fox & Smeets, etc. ]
32
5.1 WHAT IS THE QUESTION WE ARE ASKING?
A major topic of recent research has been to identify the effects of different forms of HRM on firm
productivity. Before discussing issues of identification and the results from these studies, it is worth
asking some basic questions: (a) why is this an interesting empirical question? (b) why would we
expect to see any positive average effect of HRM practices on productivity? Note that the answer to
this question is not specific to human resources, but any endogenously chosen organizational design of
the firm.
One response is that we should not expect to see any effects. From the design perspective discussed in
Section 3, if all firms are in static equilibrium and optimizing then they are (subject to the
environment) adopting the optimal organizational form weighing up the costs and benefits. Externally
manipulating the firm to “force” it to do something sub-optimal (e.g. adopt incentive pay schemes) can
only harm the firm’s performance. By contrast, using actual changes in the firm’s choices of HRM
(such as Lazear’s classic Safelite Glass paper discussed below) will on average show that firms
improve productivity as they will be optimizing so we expect any change to produce a positive
outcome.
An important rejoinder to this is that firms maximise profits, not productivity. It may increase
productivity to introduce a given HRM practice, but this may still reduce profits, which is why firms
have chosen not to adopt (an example is Freeman and Kleiner, 2005, who found that the abolition of
piece rates reduced productivity but increased profits). This is analogous to any factor input such as
capital – increasing capital per hour will increase output per hour, but the firm already takes this into
account in its maximization program. Thus, just as we are interested in estimating the parameters of a
conventional production function for capital and labor, we may be interested in the parameters
associated with an HRM augmented production function.
Second, unlike a conventional productive factor like capital, there may be such distortions associated
with some forms of incentive pay that it reduces productivity. Of course, we would expect that
incentive pay would increase productivity on average – Prendergast (1999) argued that this was a
necessary condition for the study of incentive pay being interesting. If it does not, then organizations
may well be making mistakes -which economists find unsurprising for government agencies, but a bit
33
more surprising in competitive industries. So in some sense, looking for HRM productivity effects are
more interesting than conventional inputs.
Thirdly, if we do see some positive effect, we are interested in the mechanisms through which this
effect is working. For example, we expect the introduction of incentive pay to affect the type of
workers who want to join and leave the firm. How important is this selection effect relatively to the
pure incentive effect?
Fourth, even if we expect a positive effect, we may not be so interested in the average effect but rather
how this varies with observable characteristics of sub-groups of workers, or of the firm or of its
environment. Theory suggests that changing HRM will have heterogeneous effects in this way, so this
places some more testable restrictions on the data? Other theories emphasis that we may expect to see
extensive complementarities between different forms of HRM and between HRM and other factors –
we discuss this in subsections ***** below.
Finally, we have argued that the design perspective has limitations. If we regard some innovative
HRM as a new technology, then the investigation of the productivity effects is the same as examining
what are the productivity effects of any new technology. With a new technology we expect to see slow
diffusion. Some of this is firms optimizing given heterogeneous costs and benefits in a full information
world. But slow diffusion may also be due to the slow arrival rate of information to different firms and
this is partly related to simply higher or lower managerial quality across firms. More subtly, the
optimal HRM type may have changed over time. For example, contingent pay may now be optimal in
many sectors where previously it was inefficient due to rapid falls in the cost of Electronic Resource
Planning systems to monitor worker output (but not effort), such as SAP. Thus, we would expect to
see positive productivity effects from the adoption of these new HRM.
An environment where non-optimizing behavior is particular important is the public sector, so
investigation of the role of HRM in such places has unsurprisingly attracted a lot of attention.
5.2 CORRELATIONS OF PRODUCTIVITY AND HRM: THE BASIC IDENTIFICATION
PROBLEM
34
[Something more here on Shaw, 2009, Insider Econometrics points about relationship to treatment
effects literature. Note most of the single firm studies have no obvious control group. ]
How can researchers identify the causal effects of organizational practices in general (in particular
management practices and decentralization) on firm performance?
Consider the basic productivity equation as: '
it it it ity m x uβ α= + +
Where y is a measure of productivity, m is a HRM practice in the firm u an unobserved error in firm i
at time t. OLS estimation of (1) will generally be biased as 0)( ≠ititumE .
The traditional strategy is to assume that m is a fixed effect. So one approach is simply to recover TFP
and project it on m. This will indicate whether there is an association between the two measures, but
the relationship is by no means causal. For example, Bloom and Van Reenen (2007) show that there is
a robust relationship between TFP and their measure of HRM but they interpret this as an “external
validity” test of the quality of the management data rather than any causal relationship.
An analogous strategy if there are time varying measures of organization is to treat all the correlated
unobservables as fixed, i.e. itiitu εη += with 0)( ≠iitmE η but ( ) 0, 1it it sE m sε − = ≤ . Thus the fixed
effect model estimated in (say) differences would be 'it it it ity m xβ α εΔ = Δ + Δ + Δ which can be
consistently estimated by OLS.
The problem with the fixed effect strategy is that the correlated unobservables may vary over time and
be correlated with changes in HRM in the time series dimension. A substantial part of the literature has
sought to deal with this by examining changes in HRM in a single firm (or small number of firms in a
narrowly defined industry or occupational group). The correlated unobservables in itε are therefore
hopefully controlled for by removing most of the heterogeneity in cross firm studies. Although this
comes at the cost of generalizability, these “insider econometric” approaches are more likely to
identify causal effects. This still will not remove all bias, however, and what is ideally needed is some
exogenous variation in the introduction/removal of HRM which is uncorrelated with the unobserved
35
productivity shock. Rarely do studies have some random assignment across individuals (an important
exception is Shearer (2004) who we discuss below.
5.3 EMPIRICAL STUDIES
[Do we also include work on (e.g.) inequality here. If we only have productivity & nothing on
inequality no need to make this a sub-sub section]
There are a huge number of studies here, so here is our four point summary:
1. High quality studies generally show that there is a positive effect on productivity of incentive
pay, both individual bonuses and (more surprisingly) group bonuses
2. This is true across many sectors, including the public sector (e.g. Prentice et al, 2007 survey)
3. There is generally an important selection effect causing the increase in productivity –
productivity increases because high ability workers are attracted to organizations offering
higher powered incentives
4. The introduction of new forms of incentive pay is generally more effective when combined
with other “complementary” HRM practices (e.g. team work), although the exact “bundle” of
relevant practices is unclear.
5.3.1. The Effect of HRM on Productivity
We briefly summarize some of the empirical studies in Table 5.1. We divide this sub-section into
individual incentive pay, group incentive pay and more general forms of HRM.
GENERAL HRM STUDIES
There are a huge number of studies that have correlated various aspects of the firm’s performance on
various aspects of its HRM (recall Figure 2.6 for some of the measures used). There is generally a
strong and positive correlation between HRM and productivity. For example, Figure 5.2 uses the
Bloom-Van Reenen data to show that firms with higher levels of HR management scores tend to have
higher productivity. A significant correlation is also apparent when other controls are added (columns
(1) through (3) of Figure 5.3) or alternative measures of performance are used (profitability in column
(4), sales growth in column (5) and survival in column (6). But what is one to make of such
36
correlations? Bloom and Van Reenen (2007) do not interpret them causally, but rather as a sense check
of the data: their measures are meant to represent best practice so a zero or negative correlation would
be suspicious. Other papers, however, want to push for a more causal interpretation of the cross
sectional correlations, which is more problematic.
The better studies use micro data and pay careful attention to the measurement issues and need to
control for many covariates. Black and Lynch (2001) examine various aspects of “high performance”
workplaces including profit related pay but also TQM, benchmarking, self managed teams, recruitment
strategies, etc. This was from a survey that they designed (the EQW-NES) that could be matched to
plant-level panel data from the Census. They found relatively few practices mattered (profit sharing for
non-managers and benchmarking were two of the stronger ones). In Black and Lynch (2004) the
authors performed a second wave of their study so they could examine changes between 1996 and
1993. Again, some practices (such as profit related pay) showed up as informative in the cross section,
but HR practices not informative after controlling for fixed effects (only “re-engineering was
significant).
Since many of these practices appear to be highly correlated some researchers have aggregated them
into a smaller number of summary measures. Huselid (1995) and Huselid and Becker (1996) did this in
combining questions of his survey of HR managers into two principal components – “employee skills
and organization” and “employee motivation”. They found that in the cross section one or other of
these factors was positively and significantly related to productivity (as in Figure 5.2 and 5.3),
profitability and Tobin’s Q. However, like Black and Lynch (2004), once fixed effects were removed
these variables were not significant.
The disappointing results for the absence of any “effect” in the time series dimension could be due to
the fact that there is actually no relationship of HRM with productivity and the cross sectional results
are due to a spurious correlation with a time-invariant unobservable. An alternative explanation is that
classical measurement error causes attenuation bias towards zero on these HRM practices which do not
change over time (see Griliches and Mairesse, 1998, for similar arguments for the capital coefficient in
the production function. Thirdly, it may be that there is a downward endogeneity bias because, for
example, because negative productivity shocks are positively correlated with the introduction of new
practices. Nickell, Nicolistsas and Patterson (2001) argue that firms organizationally innovate when
they are doing badly and this would cause such a downward bias.
37
The main response to these problems has been to attempt an “insider econometrics” approach (see
Ichniowski and Shaw, 2009). This essentially involves focusing on one firm (or a small number of
firms in a narrowly defined industry) and examining what happens to productivity before and after a
change in HRM practices. The focus has been on incentive pay, although as we will discuss in sub-
section 5.3.2. on complementarities below, this is frequently part of a wider package of changes.
INDIVIDUAL INCENTIVE PAY
Single Firm Studies – average effects of individual incentive pay schemes
A pioneering study is Lazear (2000) who looked at the replacement of a flat rate hourly pay system by
a piece rate pay system for windshield installers in the Safelite Glass Company. In this firm each
employee has a truck and drives to the homes of people who have broken car windshields and installs a
new one. Looking 19 months before and after the introduction of the incentive pay plan, Lazear found
that productivity increased by around 44% after the policy change, with about half of this due to
selection effects and half from the same individuals changing their behavior. The selection effects are
because less productive workers left the company and more productive workers joined, presumably
attracted by the higher powered incentives.
More recently, Bandiera, Barankay and Rasul (2007) engineered a change in the incentive pay system
for managers in a UK fruit farm. All the workers (fruit pickers) were on piece rate pay, but prior to the
policy change the managers were paid a flat rate, whereas afterwards there was a strong element of pay
tied to the performance of the workers they managed. The average picker’s productivity rose by 21%
after the introduction of performance related pay and at least half of this was due to improved
selection. The remainder of the effect is due to managers focusing their efforts more on the workers
were it had the greatest marginal effect. Examining the mechanism through which this happened,
Bandiera et al (2009a, July Econometrica) gathered information on social connections from their
survey. They found that prior to the introduction of incentive pay managers favored workers to whom
they were socially connected irrespective of the workers’ ability. After the introduction of performance
bonuses they targeted their efforts towards high ability workers regardless of whether they were
socially connected or not.
38
Freeman and Kleiner (2005) examine the elimination of piece rates for a US shoe manufacturer. They
focused on two plants of the same firm who switched at different times and focused on what happened
to productivity (monthly shoes produced) and profits before and after the change in the pay scheme.
Consistent with the other “insider” studies, productivity fell after the workers were put on a flat hourly
rate. Interestingly, the authors show that profits rose after the change which they attribute to a variety
of other managerial changes that were complementary to flat rate pay.
A criticism of these studies is that the workers who are treated are not random. The firm who
introduced the policy presumably believed there would be some benefits from doing so, thus it is hard
to rule out the idea that there may have been some other contemporaneous change that affects worker
productivity. Shearer (2004) addresses this problem in his study of tree planters in British Columbia.
He worked with the company employing the planters and designed an experiment where some workers
were randomly assigned to the incentive pay group and others were kept in a control group. He cannot
look at selection effects, but found that the pure incentive effect was to increase productivity by around
22%, very similar to Lazear (2000).
In summary, these [four] major within firm studies do suggest that individual incentive pay increases
productivity. Other studies also show evidence that incentives affect employee behavior, but the
precise “incentive effect” is not so easy to interpret15.
Distortions due to individual incentive pay?
The studies in the previous sub-sections suggested that individuals do strongly respond to pay
incentives and generally in a way that increases productivity. The theoretical literature has emphasised
many ways in which incentive pay can cause distortions which could reduce productivity. First,
employees are more risk averse than firms and we have discussed the insurance-incentive trade off in
Section 3 already. Second, firms cannot always credibly commit to reward performance ex post. For
example, Gibbons (1987) details a model where only the worker knows the difficulty of job and the
true action. He shows how this generates a “ratchet effect” were workers will restrict output unless the
employer can commit not to use the information it obtains from learning the difficulty of the task.
Third, measures of the worker’s productivity are imperfectly related to inputs (worker effort). Baker
(1992) shows how incentive pay tied to a measureable output will cause workers to increase effort to
15 For example see Gaynor, Rebitzer and Taylor (2004); Groves, Hong, McMillan and Naughton (1994) and Fernie and Metcalf (1999).
39
improve the measured output and reduce effort on the unmeasured output (e.g. quantity instead of
quality in Lazear, 1986, Journal of Business)16.
Given the difficulty with tying incentives to objective measures what about the common practice of
using supervisors’ subjective measures of performance? Several papers have modeled the optimal mix
of incentives based on imperfect objective measures and perfect (but unverifiable) subjective
measures17. The problem with subjective measures is that although they provide stronger incentives
workers have to trust that the firm does not renege ex post, which is a particular danger with
unverifiable information. Furthermore, there will still be the problem of the gap between actual and
measured effort. This can mean (i) employees engage in “influence activity” to alter supervisors’
decisions in their favor (e.g. Milgrom and Roberts, 1988)18; (ii) there may be favoritism on the behalf
of supervisors for particular workers (Prendergast and Topel, 1996)19; (iii) the supervisor and
employee may hold different opinions about employee’s performance (MacLeod, 2003).
Empirical work has tended to focus on the potential distortions in explicit incentive schemes. A key
distortion that occurs is the measurement period. Asch (1990) examines US Navy recruiters who were
incentivized based on their ability to enlist sailors (partly through measurement and some also through
payment). This was based on annual quotas, so only affected those who were close to missing their
quota. In addition, the effect was extremely strong near year end, but weak afterwards, causing
inconsistent efforts. Courty and Marshke (2004) analyze managers of job training centers and show
that managers work very hard at the end of the measurement period, but generated some costs in the
form of lower training quality. Oyer (1998) shows that firms build incentives around fiscal years.
Firms sell more (At at lower margins) near the end of the fiscal year compared to the middle of the
year, Larkin (2007) looks at a large software company and shows that salesmen incentives to shift
effort towards the end of their measurement period. Compared to the counterfactual of no incentive
contracts it is unclear whether these imperfect incentive contracts reduce overall productivity (although
16 Holmstrom and Milgrom (1991) have a similar finding in the context of a multi-tasking model where incentive contracts can cause agents to under or over invest sub-optimally in different tasks. This could explain the well-known phenomenon of “teaching to the test”. 17 For example: Baker, Gibbons and Murphy (1994), Bull (1987) and MacLeod and Malcomson (1989). 18 This may be a reason why some firms commit to promoting based on seniority rather than subjective assessments of performance. 19 MacLeod (2003) shows how this will act as a multiplier effect on discrimination, making the discriminated group suffer further from lower effort.
40
Larkin does claim that there is a 6-8% cost in potential revenue)20. But it is surprising that firms
cannot improve the design of contracts to alleviate these measurement distortions.
A more subtle form of distortion can occur between types of individual incentive pay systems when
workers have social preferences. Many economists (e.g. Lazaer, 1989) have puzzled over why relative
performance benchmarks are not used more commonly in pay systems given their desirable properties
(i.e. common time specific shocks outside the employees’ control are removed). Bandiera, Barankay
and Rasul (2005) examined a change of incentive pay among workers on their famous UK fruit farm
from a system based on relative performance to piece rates (absolute performance). They found that
productivity increased by 50% as a result of the experiment and attributed this to the fact that workers
have social preferences (using their measures of friendship networks). Under a relative performance
system a worker who increases his effort puts a negative externality on other workers under a relative
system, but has no such affect under a piece rate system.
GROUP INCENTIVE PAY
In Section 2 we saw that collective payment by results (such as team bonuses) has become much more
important over the last 20 years or so. In the US almost half of employees participate in such schemes
(see Section 2). There has been a recent review of the effects of such schemes in Blasi, Freeman,
Mackin and Kruse (2009: 1) who consider over 100 studies. In general a positive association is
revealed between group incentive schemes and company performance, but with substantial diversity in
results. The average estimated increase in productivity associated with employee ownership and profit
sharing is 4.5%21. A survey of UK schemes by the UK Treasury (Oxera, 2007) found a mean effect
across studies of 2.5% and larger effects for share ownership schemes22. Combinations of such
schemes with other HRM practices were found to be particularly effective – e.g. employee
involvement in teams.
A recent example of this literature would be Bryson and Freeman (2009) who use the 2004 UK WERS
survey discussed in Section 2 to relate various measures of company performance to the presence of
incentive pay. They find that employee share ownership schemes are associated with 3.3% high value
20 Chevalier and Ellison (1997) show that calendar year non-linearities lead to persistent distortions for mutual fund managers risk profiles. These are not chosen by the firm, however. 21 On employee ownership see Kruse and Blasi (1997) or Freeman (2007). On profit-sharing and gain-sharing see Weitzman and Kruse (1990) or OECD (1995. 22 10 of the 13 studies of profit related pay were positive and 7 out of the 10 studies of share ownership.
41
added per worker compared to no other form of incentive pay, but other forms of group incentive pay
are insignificant. As with most of the other studies, the clear problem is that there are many omitted
variables that are not controlled for, so we are concerned whether this is a causal effect or simply an
association with an unobservable23. Jones and Kato (1995) go one step further as they have panel data
on ESOPs and bonuses in Japanese firms. Switches to ESOPS were associated with 4-5% higher
productivity after 3-4 years. Although panel data is an improvement, there is still the problem that the
adopting firms are non-random.
Boning, Ichinowski and Shaw (2007) examine the introduction of team-based systems (including
group incentive pay) in a distinct product line across 36 mini-mills. These mini-mills take scrap metal
and recycle it into steel bars used, for example, in freeways. They find team-based work is associated
with on average 6% higher productivity, especially in more complex products (which indicates the
importance of the “fit” between HRM and the wider strategy of the firm).
Hamilton, Nickerson and Owan (2003) study the shift by a US garments manufacturer from individual
pay towards group pay (“gain-sharing”). This coincided with a more general change in the firm’s
production strategy to produce smaller more custom-made batches (reflecting demand from their major
customer – retail clothing stores). This “modular” approach required more team work so group
bonuses were more appropriate incentives. Productivity rose by about 18% and this increase was
stronger for more heterogeneous teams. The authors suggest that this came from exploiting unused
collaborative skills of workers. Surprisingly given the free rider problem, the more productive workers
were earlier to switch. This suggests some non-pecuniary benefits and also positive peer effects (see
below)24.
Boning et al (2007) and Hamilton et al (2003) have the advantage that some of the unobservable
shocks are controlled for by focusing on a narrower group of individuals (working in a single industry
or a single firm). Although they still face the issue of endogeneity as there is no random assignment
(like Shearer, 2003), their intimate knowledge of the change enables them to examine the mechanisms
through which group pay influences productivity in a richer manner. Burgess et al (2007) obtain
something that is closer to random assignment by examining the introduction of a group incentive
23 The study does not control for capital inputs or fixed effects, although some of the other studies do. 24 Knez and Simester (2001) also found productivity increases following the promise of a company-wide bonus for improvements in on-time takeoffs in Continental Airways.
42
system in the UK tax collection agency. The preliminary results from this work suggest that group
bonuses were effective in significantly raising productivity.
UNIONS
A related literature is on the productivity impact of labor unions, an important human resource policy
choice (see Freeman and Medoff, 1984). Exactly the same set of issues arises. One recent attempt at an
identification strategy here is DiNardo and Lee (2004) who exploit a regression discontinuity design.
In the US a unions must win a National Labor Relations Board election to obtain representation, so one
can compare plants just above the 50% cut-off to plants just below the 50% cut-off to identify the
causal effects of unions. In contrast to the rest of the literature, DiNardo and Lee (2007) find no effect
of unions on productivity, wages and most other outcomes. The problem, of course, is that union
effects may only “bite” when the union has more solid support from the workforce.
PEER EFFECTS
[To finish]
Bandiera et al (2009b) combine their piece rate pay experiment on a UK farm with information on the
friendship networks of workers. They find that there appears to be peer group effects of workers
friends. When a high ability worker (as identified by prior productivity) works with more low ability
friends he reduced his effort. The opposite happens when a low ability worker is near a higher ability
friend. Overall Bandiera et al (2009a) found that social connectedness reduced aggregate productivity.
Mas and Moretti (2008), Ichino and Maggi, Falk and Ichino
5.3.2 Complementarities
[Include: links to team theory; Note the problems with other ways of doing this by looking at
correlation of practices – Athey Stern et al; Complementarities or a single factor model? How to
statistically distinguish – Arora paper?]
One of the key reasons why firms may find it difficult to adjust their organizational form is that there
are important complementarities between sets of organizational practices. Milgrom and Roberts (1990)
43
build a theoretical structure where such complementarities (or more precisely, super-additivities) mean
that firms optimally choose clusters of practices that “fit together”. When the environment change so
that an entrant firm would use this group of optimal practices, incumbent firms will find it harder –
they will either switch a large number together or none at all.
This has important implications for productivity analysis. The effects of introducing a single practice
will be heterogeneous between firms and depend on what practices they currently use. This implies
linear regressions of the form of equation (2) may be misleading. To see this consider there are two
practices, m1 and m2 and their relationship with productivity is such that TFP increases only when both
are used together. ' 1 2 1 2
1 2 12 ( * )it it it it it it ity x m m m m uα β β β= + + + + (4)
One version of the complementary hypothesis is 0,0,0 1221 ><< βββ , i.e. the disruption caused by
just using one practice actually reduced productivity. A regression which omits the interaction term
may find only a zero coefficient on the linear terms.
The case study literature emphasizes the importance of complementarities. Testing for their existence
poses some challenges, however, as pointed out most clearly by Athey and Stern (1998). A common
approach is a regression of practice 1 on practice 2 (and more) with a positive covariance (conditional
on other factors) indicating complementarity. It is true that complements will tend to covary positively,
but this is a very weak test. There could be many other unobservables causing the two practices to
move together. We need an instrumental variable for one of the practices (e.g. Van Biesebroeck,
2007), but this is hard to obtain as it is unclear what such an instrument would be - how could it be
legitimately excluded from the second stage equation? In classical factor demand analysis we would
examine the cross price effects to gauge the existence of complements versus substitutes, i.e. does
demand for practice 1 fall when the price of practice 2 rises (all else equal). There still remains the
concern that the price shocks could be correlated with the productivity shocks, but such an assumption
is weaker than assuming unobserved shocks to the firm’s choice of practices are uncorrelated.
Unfortunately, such tests are particularly hard to implement because there are generally not market
prices for the organizational factors we are considering.
An alternative strategy is to work straight from the production function (or performance equation more
generally). Consider the productivity equation after substituting in multiple practices:
44
' 1 2 1 2
1 2 12 ( * )it it it it it it ity x m m m m uα β β β= + + + + (5)
In an influential paper Ichinowski, Prennushi and Shaw (1997) estimate a version of equation (5) using
very disaggregate panel data on finishing lines in integrated US steel mills using eleven human
resource practices (including incentive pay, recruitment, teamwork, job flexibility and rotation). Their
measure of productivity is based on downtime - the less productive lines were idle for longer. They
find that introducing one or two practices has no effect on productivity, but introducing a large number
together significantly raises productivity. Although the endogeneity problem is not eliminated, the
controls for fixed effects, looking within one firm and using performance data helps reduce some of
the more obvious sources of bias. Gant, Ichinowski and Shaw (2002) show that the productivity
benefits of team working in steel plants appear to be due to faster problem solving because of tighter
horizontal interactions and networks between workers. They use detailed surveys of who is talking to
whom to show that plants involved with innovative HRM systems have this feature.
5.3.3. Role of ICT
One of the key productivity puzzles of recent years has been why the returns to the use of information
and communication technologies appear to be so high and so heterogeneous between firms and
between countries. For example, Brynjolffson and Hitt (2003) find that the elasticity of output with
respect to ICT capital is far higher than its share in gross output (see also Stiroh, 2004). One
explanation for this is that effective use of ICT also requires significant changes in firm organization.
Changing the notation of (5) slightly we could write
' ( * )it it c it it cm it ity x c m c m uα β β β= + + + +
With the hypothesis that cmβ >0. This is broadly the position of papers in macro literature in explaining
the faster productivity growth of the US than Europe after 1995 (e.g. Jorgenson, Ho, and Stiroh, 2008).
Bresnahan, Brynjolfsson and Hitt (2002) try to test this directly by surveying the organizations of large
US firms on decentralization and team work (for a cross section) and combining this with data on ICT
(from a private company Harte-Hanks) and productivity from Compustat. They find evidence that
cmβ >0. Bloom, Sadun and Van Reenen (2007) broaden the sample to cover both the US and firms in
45
seven European countries and find evidence of complementarity of ICT with people management.
They also show that their results are robust to controlling for firm fixed effects. Careful econometric
case studies (e.g. Baker and Hubbard, 2004; Bartel, Ichinowski and Shaw, 2007) also identify
differential productivity effects of ICT depending on organization form.
5.3.4 The role of human capital
One of the reasons for the renewed interest in organizational change by labor economists was the
attempt to understand why technology seemed to increase the demand for human capital, and thus
contribute to the rise in wage inequality experiences by the US, UK and other countries since the late
1970s. Many theories have been proposed (see Autor, Levy and Murnane, 2003, for a review), but one
hypothesis is that lower IT prices increased decentralization incentives for the reasons outlined in
Garicano (2000) and in sub-section IV.3. Further, decentralization is complementary with skills for at
least three reasons. First, skilled workers are more able to analyze and synthesize new pieces of
knowledge so that the benefits of the local processing of information are enhanced. Additionally,
skilled workers are better at communicating which reduces the risk of duplication of information.
Second, the cost of training them for multi-tasking is lower and they are more autonomous and less
likely to make mistakes. Finally, workers who are better educated may be more likely to enjoy job
enrichment, partly because they expect more from their job in terms of satisfaction.
This has three main implications:
(i) Decentralization leads to skill upgrading within firms. This is due to the fact that the
return to new work practices is greater when the skill level of the workforce is higher.
(ii) A lower price of skilled labor will accelerate the introduction of organizational changes.
(iii) Skill intensive firms will experience greater productivity growth when decentralizing.
Caroli and Van Reenen (2001) find support for all three predictions. They estimate production
functions (with the relevant interactions), skill share equations and organizational design equations. A
novel feature of this approach is that because labor is traded in a market, it is possible to use local skill
price variation to examine the complementarity issues. They find that higher skill prices make
decentralization less likely, consistent with “skill biased organizational change”.

46
6. CONCLUSIONS: FUTURE WORK, POLICY IMPLICATIONS
1. Poor quality of data on HRM over time, especially for the non-pay components. Too much is
on one-off samples or on very specific unrepresentative samples. WERS data a good model as
is Bloom-Van Reenen
2. HRM needs to be understood in the context of management more generally. Not simply a
“design”, but also an element of best practice
3. HRM important link to productivity. Micro work shows this. But also important in macro
context – e.g. ADIB results
4. Need for more randomized control trials
5. Single firm “insider studies” extremely valuable and much better than mid 1990s cross firm
low response questionnaires. But also limitations in generalizability so need for cross firm and
cross country work
6. Links to theory need to be stronger
47
BIBLIOGRAPHY [To be completed] Abowd, John M., 1989. ‘The Effect of Wage Bargains on the Stock Market Value of the Firm’,
American Economic Review, 79(4), 774-800. CHECK Abowd, John M., and Thomas Lemieux, 1993. ‘The Effects of Product Market Competition on
Collective Bargaining Agreements: The Case of Foreign Competition in Canada’, Quarterly Journal of Economics 108(4), 983-1014. CHECK
Acemoglu, Daron, Philippe Aghion, Claire Lelarge, John Van Reenen and Fabrizio Zilibotti, 2007.
‘Technology, Information and the Decentralization of the Firm’, Quarterly Journal of Economics, 122(4), 1759–1799.
Ackerberg, Daniel, Lanier Benkard, Steven Berry and Ariel Pakes, 2007. ‘Econometric Tools for
Analyzing Market Outcomes’, in Handbook of Econometrics Volume 6A, eds. James Heckman and Edward Leamer. Amsterdam: North-Holland.
Adams, Christopher, 2005. ‘Agent Discretion, Adverse Selection and the Risk-Incentive Trade-Off’,
Working Paper, Federal Trade Commission. Aggarwal, Rajesh K. and Andrew A. Samwick, 1999. ‘The Other Side of the Trade-off: The Impact of
Risk on Executive Compensation’, Journal of Political Economy, 107(1), 65-105. Aggarwal, Rajesh K. and Andrew A. Samwick, 1999. ‘Executive Compensation, Strategic
Competition, and Relative Performance Evaluation: Theory and Evidence’, Journal of Finance, 54(6), 1999-2043.
Aghion, Philippe, and Jean Tirole, 1997. ‘Formal and Real Authority in Organizations’, Journal of
Political Economy, 105(1), 1-29. Aghion, Philippe, Eve Caroli and Cecilia Garcia-Penalosa, 1999. ‘Inequality and Economic
Growth: The Perspective of the New Growth Theories’, Journal of Economic Literature, 37(4), 1615-1660.
Alonso, Ricardo, Wouter Dessein and Niko Matouschek, 2008. ‘When Does Coordination Require
Centralization?’, American Economic Review, 98(1), 145-179. Asch, Beth, 1990. ‘Do Incentives Matter?: The Case of Navy Recruiters’, Industrial and Labor
Relations Review, 43(3), 89-107. Askenazy, Philippe, 2001. ‘Innovative Workplace Practices and Occupational Injuries and Illnesses in
the United States’, Economic and Industrial Democracy 22(4), 485-516. Athey, Susan and Scott Stern, 1998. ‘An Empirical Framework for Testing Theories About
Complementarity in Organizational Design’, NBER Working Paper 6600. Atkeson, Andrew and Patrick J. Kehoe, 2005. ‘Modeling and Measuring Organization Capital’,
Journal of Political Economy, 113(5), 1026-1053.
48
Autor, David, Frank Levy and Richard Murnane, 2003. ‘The Skill Content of Recent Technological Change: An Empirical Exploration’, Quarterly Journal of Economics, 118(4), 1279-1334.
Aw, Bee Yan, Mark J. Roberts and Daniel Xu, 2008. ‘R&D Investments, Exporting, and the Evolution
of Firm Productivity’, American Economic Review, 98(2), 451-456. Azoulay, Pierre and Joshua Graff Zivin, ‘Peer Effects in the Workplace: Evidence from Star
Extinction’. Baily, Martin, Charles Hulten and David Campbell, 1992. ‘Productivity Dynamics in Manufacturing
Plants’, Brookings Papers on Economic Activity, Microeconomics, 187-249. Baiker, Katherine and Mireille Jacobson 2007. ‘Finders Keepers: Forfeiture Laws, Policing, and Local
Budgets’, Journal of Public Economics, 91(11-12), 2113-2136. Baker, George, 1992. ‘Incentive Measures and Performance Measurement’, Journal of Political
Economy, 100, 598-614. Baker, George, Robert Gibbons and Kevin Murphy, 1994. ‘Subjective Performance Measures in
Optimal Incentive Contracts’, Quarterly Journal of Economics, 109, 1125-1156. Baker, George, Robert Gibbons and Kevin Murphy, 1999. ‘Informal Authority in Organizations’,
Journal of Law, Economics, and Organization, 15(1), 56-73. Baker, George and Thomas Hubbard, 2004. ‘Contractibility and Asset Ownership: On Board
Computers and Governance in US Trucking’, Quarterly Journal of Economics, 119(4), 1443-1479.
Bandiera, Oriana, Iwan Barankay and Imran Rasul, 2005. ‘Social Preferences and the Response to
Incentives: Evidence from Personnel Data’, Quarterly Journal of Economics, 120(3), 917‐962. CHECK
Bandiera, Oriana, Iwan Barankay, and Imran Rasul, 2007. ‘Incentives for Managers and Inequality
Among Workers: Evidence from a Firm-Level Experiment,” Quarterly Journal of Economics Bandiera, Oriana, Iwan Barankay, and Imran Rasul, 2009a. ‘Social Connections and Incentives in the
Workplace: Evidence from Personnel Data’, forthcoming in Econometrica. Bandiera, Oriana, Iwan Barankay, and Imran Rasul, 2009b. ‘Team Incentives: Evidence from a Field
Experiement’, mimeo. Bartel, Ann, Casey Ichniowski and Kathryn Shaw, 2007. ‘How Does Information Technology Really
Affect Productivity? Plant-Level Comparisons of Product Innovation, Process Improvement and Worker Skills’, Quarterly Journal of Economics, 122(4), 1721-1758.
Bartelsman, Eric and Phoebus Dhrymes, 1998. ‘Productivity Dynamics U.S. Manufacturing Plants
1972-1986’, Journal of Productivity Analysis, 9(1), 5-33. Bartelsman, Eric and Mark Doms, 2000. ‘Understanding Productivity: Lessons from Longitudinal
Microdata’, Journal of Economic Literature, 38(3), 569-594.
49
Bartelsman, Eric, John Haltiwanger and Stefano Scarpetta, 2008. ‘Cross Country Differences in
Productivity: The Role of Allocative Efficiency’, University of Maryland mimeo. Bennesden, Morten, Kasper Nielsen, Francisco Pérez-Gonzáles and Daniel Wolfenzon, 2007. ‘Inside
the Family Firm: The Role of Families in Succession Decisions and Performance’, Quarterly Journal of Economics, 122(2), 647-691.
Bertrand, Marianne and Antoinette Schoar, 2006. ‘The Role of Family in Family Firms’, Journal of
Economic Perspectives 20(2), 73-96. Black, Sandra and Lisa Lynch. 2004. ‘What's Driving the New Economy? The Benefits of Workplace
Innovation’, Economic Journal, 114(493), 97-116. CHECK Black, Sandra and Lisa Lynch, 2001. ‘How to Compete: The Impact of Workplace Practices and
Information Technology on Productivity’, The Review of Economics and Statistics, 83(3), 434–445.
Blasi, Joseph, Richard Freeman, Christopher Mackin and Douglas Kruse ,2009. ‘Creating a Bigger
Pie? The Effects of Employee Ownership, Profit Sharing, and Stock Options on Workplace Performance, in Shared Capitalism at Work: Employee Ownership, Profit and Gain Sharing, and Broad-based Stock Options, eds. Douglas Kruse, Joseph Blasi and Richard Freeman. University of Chicago Press. CHECK.
Bloom N, Eifert, B, Mahajan, A, McKenzie, D and Roberts, J. 2009 Management as a
Technology: Evidence from India. Stanford mimeo. Bloom, Nick and John Van Reenen, 2007. ‘Measuring and Explaining Management Practices Across
Firms and Countries’, Quarterly Journal of Economics, 122(4), 1341-1408. Bloom, Nick, Christos Genakos, Ralf Martin and Raffaella Sadun, 2008. ‘Modern Management: Good
for the Environment or Just Hot Air’, NBER Working Paper 14394. Bloom, Nick, Christos Genakos, Raffaella Sadun and John Van Reenen, 2009. ‘Management Matters’,
LSE/Stanford mimeo. Bloom, Nick, Tobias Kretschmer and John Van Reenen, 2009. ‘Work-life Balance, Management
Practices and Productivity’, in International Differences in the Business Practice and Productivity of Firms, eds Richard Freeman and Kathy Shaw. Chicago: University of Chicago Press.
Bloom, Nick, Raffaella Sadun and John Van Reenen, 2007. ‘Americans do IT Better: American
Multinationals and the Productivity Miracle’, NBER Working Paper 13085. Bloom, Nick, Raffaella Sadun and John Van Reenen, 2009. ‘The Organization of Firms Across
Countries’, Centre for Economic Performance Discussion Paper No 937. CHECK - DATE IN TEXT IS 2009a.
50
Bloom, Nick, Luis Garicano, Raffaella Sadun and John Van Reenen, 2009. ‘The Distinct Effects of Information Technology and Communication Technology on Firm Organization’, Centre for Economic Performance Discussion Paper No. 927.
Bloom, Nick, Carol Propper, Stephan Seiler and John Van Reenen, 2009. ‘Management Practices in
Healthcare’, Stanford/LSE mimeo. Bolton, Patrick and Mathias Dewatripont, 1994. ‘The Firm as a Communication Network’, Quarterly
Journal of Economics, 109(4), 809-839. Bolton, Patrick and Mathias Dewatripont, 2005. Contract Theory. Cambridge: MIT Press. Boning, Brent, Casey Ichniowski, and Kathryn Shaw, 2007. ‘Opportunity Counts: Teams and the
Effectiveness of Production Incentives’, Journal of Labor Economics, 25(4), 613-650. Bresnahan, Timothy, Erik Brynjolfsson and Lorin Hitt, 2002. ‘Information Technology, Workplace
Organization and the Demand for Skilled Labor: Firm-level Evidence’, Quarterly Journal of Economics, 117(1), 339-376.
Brown, Charles, 1990. ‘Firms’ Choice of Method of Pay’, Industrial and Labor Relations Review, 43,
165-182.CHECK Brynjolfson, Erik and Lorin Hitt, 2003. ‘Computing Productivity: Firm-Level Evidence’, Review of
Economics and Statistics, 85(4), 793–808. Bryson, Alex and Richard Freeman 2009. ‘Work and Wellbeing’, National Institute Economic Review,
209, 70-71. Bryson, Alex and Stephen Wood 2009. ‘High Involvement Management’, in The Evolution of the
Modern Workplace, eds. W. Brown, Alex Bryson, John Forth, and K. Whitfield. Cambridge: Cambridge University Press.
Bull, Clive, 1987. ‘The Existence of Self-Enforcing Implicit Contracts’, Quarterly Journal of
Economics, 102(1), 147-159. Burgess, Simon, Carol Propper, Marisa Ratto, Vanessa von Hinke Kessler Scholder and Emma
Tominey, 2007. ‘Smarter Task Assignment or Greater Effort: The Impact of Incentives on Team Performance’, Economic Journal. CHECK.
Capelli, Peter and David Neumark, 2001. ‘Do ‘High-Performance’ Work Practices Improve
Establishment-Level Outcomes?’, Industrial and Labor Relations Review, 54(4), 737-775. Caroli Eve and John Van Reenen, 2001. ‘Skill Biased Organizational Change’, Quarterly Journal of
Economics, 116(4), 1449-1492. Caselli, Francesco, 2005. ‘Accounting for Cross Country Income Differences’ in Handbook of
Economic Growth, eds Philppe Aghion and Durlauf, S. North-Holland: Elsevier. Cahuc, Pierre, Postel-Vinay, Fabienne, and Robin, Jean-Marc (2006) “Wage Bargaining and On-The-
Job Search” Econometrica, 323-364
51
Chandler, Alfred, 1962. Strategy and Structure: Chapters in the History of the Industrial Enterprise.
Cambridge: MIT Press. Chevalier, Judith and Ellison, Glenn, 1997. ‘Risk Taking by Mutual Funds as a Response to
Incentives’, Journal of Political Economy, 105(6), 1167-1200. OR Chevalier, Judith and Glenn Ellison, 2007. ‘Career Concerns of Mutual Fund Managers’, The
Quarterly Journal of Economics, 114(2), 389-432. Colombo, Massimo and Marco Delmastro, 2004. ‘Delegation of Authority in Business Organizations:
An Empirical Test’, Journal of Industrial Economics, 52(1), 53-80. Cooke, William, 1994. ‘Employee Participation Programs, Group-based Incentives, and Company
Performance: A Union-nonunion Comparison’, Industrial and Labor Relations Review, 47(4), 594-609. – CHECK
Corrado, C, Hulten, C and Sichel, D (2006) “Intangible Capital and Economic Growth” NBER
Working Paper No. 11948 Courty, Pascal and Gerald Marshke, 2004. ‘An Empirical Investigation of Gaming Responses to
Performance Incentives’, Journal of Labor Economics, 22(1), 23-56. Criscuolo, Chiara, Jonathan Haskel and Ralf Martin, 2003. ‘Building the Evidence Base for
Productivity Policy Using Business Data Linking’, Economic Trends, 600, 39-51. Cristini et al 2001 – CHECK DeVaro, Jed and Fidan A. Kurtulus, 2007. ‘An Empirical Analysis of Risk, Incentives, and the
Delegation of Worker Authority’, Working Paper, University of Massachusetts at Amherst. DiNardo, John and David Lee, 2004. ‘Economic Impacts of New Unionization on Private Sector
Employers: 1984–2001’, Quarterly Journal of Economics 119: 1383–1441. DiNardo, John and David Lee, 2007 - CHECK Easton, George and Sherry Jarrell, 1998. ‘The Effects of Total Quality Management on Corporate
Performance: An Empirical Investigation’, Journal of Business 71(2), 253–307. Edmans, Alex, Xavier Gabaix and Augustin Landier, 2008. ‘A Multiplicative Model of Optimal CEO
Incentives in Market Equilibrium’, Review of Financial Studies. Falk, Armin and Andrea Ichino, 2006. ‘Clean Evidence on Peer Effects’, Journal of Labor Economics,
24(1), 39-57. Fernie, Sue and David Metcalf, 1999. ‘It's Not What You Pay it's the Way that You Pay it and that's
What Gets Results: Jockeys' Pay and Performance’, Review of Labour Economics and Industrial Relations, 13(2), 385-411.
52
Foster, Lucia, C.J. Krizan, and John Haltiwanger, 2006. ‘Market Selection, Reallocation and Restructuring in the U.S. Retail Trade Sector in the 1990s’, Review of Economics and Statistics, 88(4), 748-758.
Foster, Lucia, John Haltiwanger and Chad Syverson, 2009. ‘Reallocation, Firm Turnover and
Efficiency: Selection on Productivity or Profitability’, American Economic Review, 98(1), 394-425.
Foster, Andrew and Mark Rosenzweig, 1996. ‘Comparative Advantage, Information and the
Allocation of Workers to Tasks: Evidence from an Agricultural Labor Market’, Review of Economic Studies 63(3), 347-374. - CHECK
Freeman 2007 - CHECK Freeman, Richard and Morris Kleiner, 2005. ‘The Last American Shoe Manufacturers: Decreasing
Productivity and Increasing Profits in the Shift from Piece Rates to Continuous Flow Production’, Journal of Industrial Relations 44(2), 307-330.
Freeman, Richard and James Medoff, 1984. What Do Unions Do? New York: Basic Books. Freeman, Richard, Joseph Blasi and Douglas Kruse, 2009. ‘Shared Capitalism at Work: Employee
Ownership, Profit and Gain Sharing, and Broad-based Stock Options’, in Shared Capitalism at Work: Employee Ownership, Profit and Gain Sharing, and Broad-based Stock Options, eds Douglas Kruse, Joseph Blasi and Richard Freeman. University of Chicago Press.
Gant, Jon, Casey Ichniowski and Kathryn Shaw, 2002. ‘Social Capital and Organizational Change in
High-Involvement and Traditional Work Organizations’, Journal of Economics & Management Strategy, 11(2), 289-328.
Garicano, Luis, 2000. ‘Hierarchies and the Organization of Knowledge in Production’, Journal of
Political Economy, 108(5), 874-904. Gibbons, Robert. 1987. ‘Piece-Rate Incentive Schemes’, Journal of Labor Economics, 5(4), 413-29. Gibbons, Robert and J. Roberts, 2008. The Handbook of Organizational Economics. Princeton:
Princeton University Press. Gibbons, Robert, and Michael Waldman, 1999. ‘Careers in Organizations: Theory and Evidence’ in
Handbook of Labor Economics, Vol. III, eds. Orley C. Ashenfelter and David Card. Amsterdam: North Holland.
Gibrat, Robert, 1931. Les Inegalites Economiques, Sirey, Paris. Garen, John, 1994. ‘Executive Compensation and Principal-Agent Theory’, Journal of Political
Economy, 102(6), 1175-1199. – CHECK Gaynor, Martin, James Rebitzer and Lowell Taylor, 2004. ‘Physician Incentives in Health
Maintenance Organizations’, Journal of Political Economy, 112, 915-931.
53
Greif, Avner, 1994. ‘Cultural Beliefs and the Organization of Society: A Historical and Theoretical Reflection on Collectivist and Individualistic Societies’, Journal of Political Economy, 102(5), 912-50.
Griffith, Rachel and Andrew Neely, 2009. ‘Incentives and Managerial Experience in Multi-task
Teams: Evidence from Within a Firm’, Journal of Labor Economics, 27(1), 49-82. Griliches, Zvi, 1996. ‘The Discovery of the Residual: A Historical Note’, Journal of Economic
Literature, 34(3), 1324-1330. Griliches, Zvi and Jacques Mairesse, 1998. CHECK Groves, Theodore, Yongmiao Hong, John McMillan and Barry Naughton, 1994. ‘Autonomy and
Incentives in Chinese State Enterprises’, Quarterly Journal of Economics, 109, 183-209. Guadalupe, Maria and Vicente Cunat, 2005. ‘How Does Product Market Competition Shape Incentive
Contracts?’, Journal of the European Economic Association MIT Press, 3(5), 1058-1082. Guadalupe, Maria and Vicente Cunat, 2009a. ‘Globalization and the Provision of Incentives Inside the
Firm, Journal of Labor Economics (forthcoming). CHECK Guadalupe, Maria and Vicente Cunat, 2009b. ‘Executive Compensation and Competition in the
Banking and Financial Sectors’, Journal of Banking and Finance, 33, 439-474. CHECK Guadalupe, Maria and Julie Wulf, 2007. ‘The Flattening Firm and Product Market Competition: The
Effects of Trade Costs and Liberalization’, Columbia University mimeo. Guadalupe, Maria and Julie Wulf, 2009. CHECK - IS THIS MEANT TO BE 2007 Guiso, Luigi, Paola Sapienza and Luigi Zingales, 2006. ‘Does Culture Affect Economic Outcomes?’,
The Journal of Economic Perspectives, 20(2), 23-48. Guiso Luigi, Paola Sapienza and Luigi Zingales, 2009. ‘Cultural Biases in Economic Exchange’,
forthcoming in Quarterly Journal of Economics. Hall, Bronwyn, 2003. ‘Innovation and Diffusion’, in Handbook of Innovation, eds. Jan Fagerberg,
Davis Mowery and Richard Nelson. Oxford: Oxford University Press. Hamilton, Barton H., Jack A. Nickerson, and Hideo Owan, 2003. ‘Team Incentives and Worker
Heterogeneity: An Empirical Analysis of the Impact of Teams on Productivity and Participation’, Journal of Political Economy, 111(3), 465-497.
Heckman, James and Jeffrey Smith, 2004. ‘The Determinants of Participation in a Social Program:
Evidence from a Prototypical Job Training Program’, Journal of Labor Economics, 22(2), 243. CHECK
Helpman Elhanhan, Marc Melitz and Stephen Yeaple, 2004. ‘Export Versus FDI with Heterogeneous
Firms’, American Economic Review, 94(1), 300-316.
54
Holmstrom, Bengt and Paul Milgrom, 1991. ‘Multitask Principal-Agent Analyses: Incentive Contracts, Asset Ownership, and Job Design’, Journal of Law, Economics, and Organization, 7, 24-52.
Hopenhayn, Hugo, 1992. ‘Entry, Exit, and Firm Dynamics in Long Run Equilibrium’, Econometrica,
60,1127–1150. Hsieh Chang-Tai and Peter Klenow, 2007. ‘Misallocation and Manufacturing TFP in China and India’,
NBER Working Paper 13290. Huselid, Mark, 1995. ‘The Impact of Human Resource Management Practices on Turnover,
Productivity and Corporate Financial Performance’, Academy of Management Journal, 38, 635-672.
Huselid, Mark and Brian Becker, 1996. ‘Methodological Issues in Cross-sectional and Panel Estimates
of the Human Resource-firm Performance link’, Industrial Relations, 35, 400-422. CHECK Ichino, Andrea, and Giovanni Maggi, 2000. ‘Work Environment and Individual Background:
Explaining Regional Differentials in a Large Italian Firm’, Quarterly Journal of Economics, 115(3), 1057-1090.
Ichniowski, Casey, 1990. ‘Human Resource Management Systems and the Performance of U.S.
Manufacturing Businesses’, NBER Working Paper 3449. CHECK Ichniowski, Casey and Kathryn Shaw, 2009. CHECK Ichniowski, Casey, Kathryn Shaw, and Giovanna Prennushi, 1997. ‘The Effects of Human Resource
Management Practices on Productivity: A Study of Steel Finishing Lines’, American Economic Review, 87(3), 291-313.
Jones, Derek and Takao Kato, 1995. ‘The Productivity Effects of Employee Stock Ownership Plans
and Bonuses: Evidence from Japanese Panel Data’, American Economic Review, 85(3), 391-414.
Jorgenson, Dale, Mun Ho and Kevin Stiroh, 2008. ‘A Retrospective Look at the US Productivity
Growth Resurgence’, Journal of Economic Perspectives, 22(1), 3-24. Kaldor N 1934 The Equilibrium of the Firm, Economic Journal, 44 (173) 60-76 Kato, Takao and Motohiro Morishima - CHECK Khan, Charles, Emilson Silva and James Ziliak, 2004. ‘Performance-based Wages in Tax Collection:
The Brazilian Tax Collection Reform and its Effects, Economic Journal 111(468), 188–205. CHECK DATE JOURNAL HAS 2001 NOT 2004.
King Jr., Ralph T., 1998. ‘Levi’s Factory Workers are Assigned to Teams, and Morale Takes a Hit’,
Wall Street Journal, May 20. Klette, Tor and Zvi Griliches, 1994. CHECK IS THIS SUPPOSED TO BE 1996
55
Klette, Tor and Zvi Griliches, 1996. ‘The Inconsistency of Common Scale Estimators When Output Prices are Unobserved and Endogenous’, Journal of Applied Econometrics, 11, 343-361.
Knack Stephen and Philip Keefer, 1997. ‘Does Social Capital have an Economy Payoff? A Cross-
country Investigation’, Quarterly Journal of Economics 12(4), 1251-1288. Knez, Marc and Duncan Simester 2001. ‘Firm-Wide Incentives and Mutual Monitoring at Continental
Airlines’, Journal of Labor Economics, 19(4), 743-72. Kruse, Douglas and Joseph Blasi, 1997. ‘Employee Ownership, Employee Attitudes, and Firm
Performance’, in Handbook of Resource Management, eds. Mitchell, Daniel J.B., David Lewin and Mahumdad Zaidi. Greenwich, CT: JAI.
Kruse, Douglas, Joseph Blasi and Rhokuen Park, 2009. ‘Shared Capitalism in the US Economy:
Prevalence, Characteristics, and Employee Views of Financial Participation in Enterprises’, in Shared Capitalism at Work: Employee Ownership, Profit and Gain Sharing, and Broad-based Stock Options, eds. Douglas Kruse, Joseph Blasi and Richard Freeman. University of Chicago Press.
Kwoka, John and David Ravenscroft, 1986. ‘Cooperation Versus Rivalry: Price-Cost Margins by Line
of Business’, Economica, 53, 351-64. La Porta R, Lopez-de-Silanes, F, Shleifer, A and Vishny, R. 1997 Trust in Large Organizations.
American Economic Review, 87(2): 333-338. Laeven, Luc and Christopher Woodruff, 2007. ‘The Quality of the Legal System, Firm Ownership, and
Firm Size’, Review of Economics and Statistics, 89(4), 601-614. Larkin, Ian, 2007. ‘The Cost of High-Powered Incentives: Employee Gaming in Enterprise Software
Sales’, Working Paper, Harvard University. Lawler, Edward, 1986. High Involvement Management. San Francisco: Josey-Bass. Lawler, Edward, Susan Mohrman and Gerald E. Ledford Jr. 1995. Creating High Performance
Organizations: Practices and Results of Employee Involvement and TQM in Fortune 1000 Companies. San Francisco: Jossey-Bass.
Lawler, Edward, Susan Mohrman, and George Benson, 2001. Organizing for High Performance:
Employee Involvement, TQM, Reengineering, and Knowledge Management in the Fortune 1000. San Francisco: Jossey-Bass.
Lawler, Edward and Susan Mohrman, 2003. Creating a Strategic Human Resources Organization: An
Assessment of Trends and New Directions. Stanford University Press. CHECK Lazear, E, 1986. ‘Salaries and Piece Rates’, Journal of Business, 9(3), 405-431. Lazear, Edward, 1989. ‘Pay Equality and Industrial Politics’, Journal of Political Economy, 97, 561–
80. Lazear, Edward, 1995. Personnel Economics, Cambridge: MIT Press
56
Lazear, Edward, 1999. ‘Personnel Economics: Past Lessons and Future Directions’, Journal of Labor
Economics, 17(2), 199-236. Lazear, Edward, 2000. ‘Performance Pay and Productivity’, American Economic Review 90(5), 1346-
1361. Lazear, Edward and Paul Oyer, 2009. ‘Personnel Economics’, in Handbook of Organizational
Economics, eds. Gibbons, E and Roberts, D J. Princeton: Princeton University Press. Lazear, Edward, and Kathryn Shaw, 2008. ‘Wage Structure, Wages, and Mobility’, in An International
Comparison of the Structure of Wages, eds. Edward Lazear and Kathryn Shaw. University of Chicago.
Lemieux, Thomas, W. Bentley MacLeod and Daniel Parent, 2009. ‘Performance Pay and Wage
Inequality-super’, Quarterly Journal of Economics, 124(1), 1-49. Lo, Desmond, Mrinal Ghosh and Francine Lafontaine, 2006. ‘The Role of Risk, Incentives, and
Selection in Salesforce Compensation Contracts’, unpublished paper, Ross School of Business, University of Michigan.
Lucas, Robert, 1978. ‘On the Size Distribution of Business Firms’, Bell Journal of Economics, 9, 508-523. Malcomson, James, 1999. ‘Individual Employment Contracts’, in Handbook of Labor Economics, Vol.
III, eds. Orley C. Ashenfelter and David Card. Amsterdam: North Holland. MacLeod, W. Bentley, 2003. ‘On Optimal Contracting with Subjective Evaluation’, American
Economic Review, 93(1), 216-240. MacLeod, W. Bentley and James M. Malcomson, 1989. ‘Implicit Contracts, Inventive Compatibility,
and Involuntary Unemployment’, Econometrica, 57(2), 447-480. Marin, Dalia and Thierry Verdier, 2008. ‘Corporate Hierarchies and the Size of Nations: Theory and
Evidence’, Paris School of Economics mimeo. Mas, Alexandre and Enrico Moretti, 2008. ‘Peers at Work’, American Economic Review, 99(1), 112-
145. MacDuffie, John, 1995. ‘Human Resource Bundles and Manufacturing Performance: Organizational
Logic and Flexible Production Systems in the World Auto Industry’, Industrial and LaborRelations Review, 48(2), 197-221.
Melitz, Mark, 2003. ‘The Impact of Trade on Intra-Industry Reallocations and Aggregate Industry
Productivity’, Econometrica, 71(6), 1695-1725. Milgrom, Paul and John Roberts, 1988. ‘An Economic Approach to Influence Activities in
Organizations’, American Journal of Sociology, 94(supplement), S154-S179.
57
Milgrom, Paul and John Roberts, 1990. ‘The Economics of Modern Manufacturing: Technology, Strategy, and Organization’, American Economic Review, 80(3), 511–28.
Mookherjee D. 2006 Decentralization, Hierarchies and Incentives: A Mechanism Design
Approach. Journal of Economic Literature, 44(2): 367-390. Mundlak, Yair, 1961. ‘Empirical Production Function Free of Management Bias’, Journal of Farm
Economics, 43, 44–56. Murphy, Kevin, 1999. ‘Executive Compensation’, in Handbook of Labor Economics, Vol. III, eds.
Orley C. Ashenfelter and David Card. Amsterdam: North Holland. Nickell, Steve, Nicolistsas, D and Patterson, M, 2001. ‘Does Doing Badly Encourage Innovation?’,
Oxford Bulletin of Economics and Statistics, 63(1), 5-28. Olley, Steven and Ariel Pakes, 1996. ‘The Dynamics of Productivity in the Telecommunications
Equipment Industry’, Econometrica 64(6), 1263–1298. Olson, Trond and Gaute Torsvik, 2000. ‘Discretion and Incentives in Organizations’, Journal of Labor
Economics, 18(3), 377-404. Osterman, Paul, 1994. ‘How Common Is Workplace Transformation and Who Adopts It?’, Industrial and Labor Relations Review, 47(2), 173-188 . CHECK Oxera, 2007. ‘Tax-advantaged Employee Share Schemes: Analysis of Productivity Effects’, HM
Revenue and Customs Research Report No. 33. Oyer, Paul, 1998, ‘Fiscal Year Ends and Nonlinear Incentive Contracts: The Effect on Business
Seasonality’, Quarterly Journal of Economics, 113(1): 149-185. Pavcnik, Nina, 2002. ‘Trade Liberalization, Exit, and Productivity Improvement: Evidence From
Chilean Plants’, Review of Economic Studies, 69,245–276. Pendleton, Andrew, Keith Whitfield and Alex Bryson, 2009, ‘The Changing Use of Contingent Pay in
the Modern British Workplace’, in The Evolution of the Modern Workplace, eds. William Brown, Alex Bryson, John Forth and Keith Whitfield. Cambridge University Press.
Penrose, Edith, 1959. Theory of the Growth of the Firm. New York: J. Wiley & Sons. Pérez-Gonzáles, Francisco, 2006. ‘Inherited Control and Firm Performance’, American Economic
Review, 96(5), 1559–1588. Pierce, Brooks, 2001. ‘Compensation Inequality’, Quarterly Journal of Economics, 116, 4, 1493-1525.
CHECK Postel-Vinay, Fabienne and Robin, Jean-Marc (2002) “Equilibrium Search with Heterogeneous
Workers and Firms” Econometrica, 70, 1295-1350
58
Prendergast, Canice, 1999. ‘What Happens Within Firms? A Survey of Empirical Evidence on Compensation Policies’, Journal of Economic Literature, 37, 7-63. CHECK
Prendergast, Canice, 2000. ‘What Trade-Off of Risk and Incentives?’, American Economic Review,
90(2), 421-425. Prendergast, Canice, 2002a. ‘The Tenuous Trade-Off between Risk and Incentives’, Journal of
Political Economy, 110(5), 1071-102. Prendergast, Canice, 2002b. ‘Uncertainty and Incentives’, Journal of Labor Economics, 20(2), S115-
S137. Prendergast, Canice and Robert Topel, 1996. ‘Favoritism in Organizations’, Journal of Political
Economy, 104(5): 958–78. Prentice, Graham, Simon Burgess and Carol Propper, 2007. ‘Performance-pay in the Public Sector: A
Review of the Issues and Evidence’, Office of Manpower Economics. Prescott, Edward and Michael Visscher, 1980. ‘Organization Capital’, Journal of Political Economy,
88(3), 446-461. Putnam, Robert, 1993. Making Democracy Work: Civic Traditions in Modern Italy. Princeton NJ:
Princeton University Press. Radner, Roy, 1993. ‘The Organization of Decentralized Information Processing’, Econometrica, 61(5),
1109-1146. Rajan R and Zingales, L. 2001 The Firm as a Dedicated Hierarchy: A Theory of the Origin and
Growth of Firms. Quarterly Journal of Economics, 116(3): 805-851. Rajan, Raghuram and Julie Wulf, 2006. ‘The Flattening Firm: Evidence from Panel Data on the
Changing Nature of Corporate Hierarchies’, Review of Economics and Statistics, 88(4), 759-773.
Rajiv et al 1996. CHECK Salter, W G., 1960. Productivity and Technical Change. Cambridge: Cambridge University Press. Shearer, Bruce, 2003 – CHECK – SHOULD THIS BE 2004 Shearer, Bruce, 2004. ‘Piece Rates, Fixed Wages and Incentives: Evidence from a Field Experiment’,
Review of Economic Studies, 71(2), 513-534. Solow – CHECK Stiroh, Kevin, 2004. ‘Reassessing the Role of IT in the Production Function: A Meta Analysis’,
Federal Reserve Bank of New York mimeo. Syverson, Chad, 2004a. ‘Product Substitutability and Productivity Dispersion’, Review of Economics
and Statistics 86(2), 534-550.
59
Syverson, Chad, 2004b. ‘Market Structure and Productivity: A concrete Example’, Journal of Political
Economy, 112(6),1181-1222. Taber 2004. CHECK IS HE PART OF HECKMAN AND SMITH REFERENCE Thesmar, David and Mathias Thoenig, 1999. ‘From Flexibility to Insecurity: How Vertical Separation
Amplifies Firm-level Uncertainty’, Journal of the European Economic Association 5(6), 1161-1202.
Thesmar, David and Mathias Thoenig, 2000. ‘Creative Destruction and Organization Change’, The
Quarterly Journal of Economics, 115(4), 1201-1237. Van Biesebroeck, Johannes, 2007. ‘Complementarities in Automobile Production’, Journal of Applied
Econometrics, 22, 1315-1345. Van Reenen, John, 1996. ‘The Creation and Capture of Economic Rents: Wages and Innovation in a
Panel of UK Companies’, Quarterly Journal of Economics, CXI, 443, 195-226. CHECK Vives, Xavier, 2008. ‘Strategic Supply Function Competition with Private Information’, CESifo
Working Paper Series. CHECK Walton, Richard, 1984. CHECK Weber, Max. CHECK Weitzman, Martin, Douglas Kruse, 1990. ‘Profit Sharing and Productivity", in Paying for
Productivity: A look at the Evidence, ed. Blinder, A. The Brookings Institution, Washington, DC. CHECK
Woodward J. 1958 Management and Technology, Cambridge: Cambridge University Press. Zabojnik, Jan, 2002. ‘Pay-Performance Sensitivity and Production Uncertainty’, Journal of Labor
Economics, 20(1), 1-22.
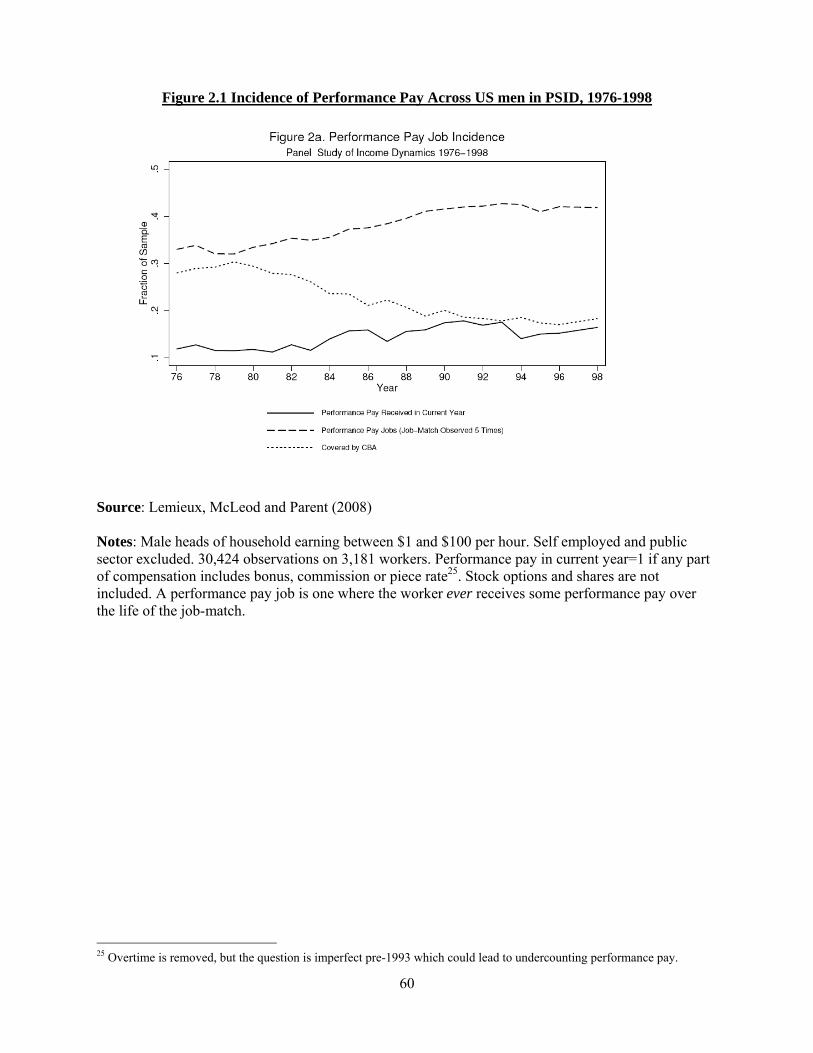
60
Figure 2.1 Incidence of Performance Pay Across US men in PSID, 1976-1998
Source: Lemieux, McLeod and Parent (2008) Notes: Male heads of household earning between $1 and $100 per hour. Self employed and public sector excluded. 30,424 observations on 3,181 workers. Performance pay in current year=1 if any part of compensation includes bonus, commission or piece rate25. Stock options and shares are not included. A performance pay job is one where the worker ever receives some performance pay over the life of the job-match.
25 Overtime is removed, but the question is imperfect pre-1993 which could lead to undercounting performance pay.
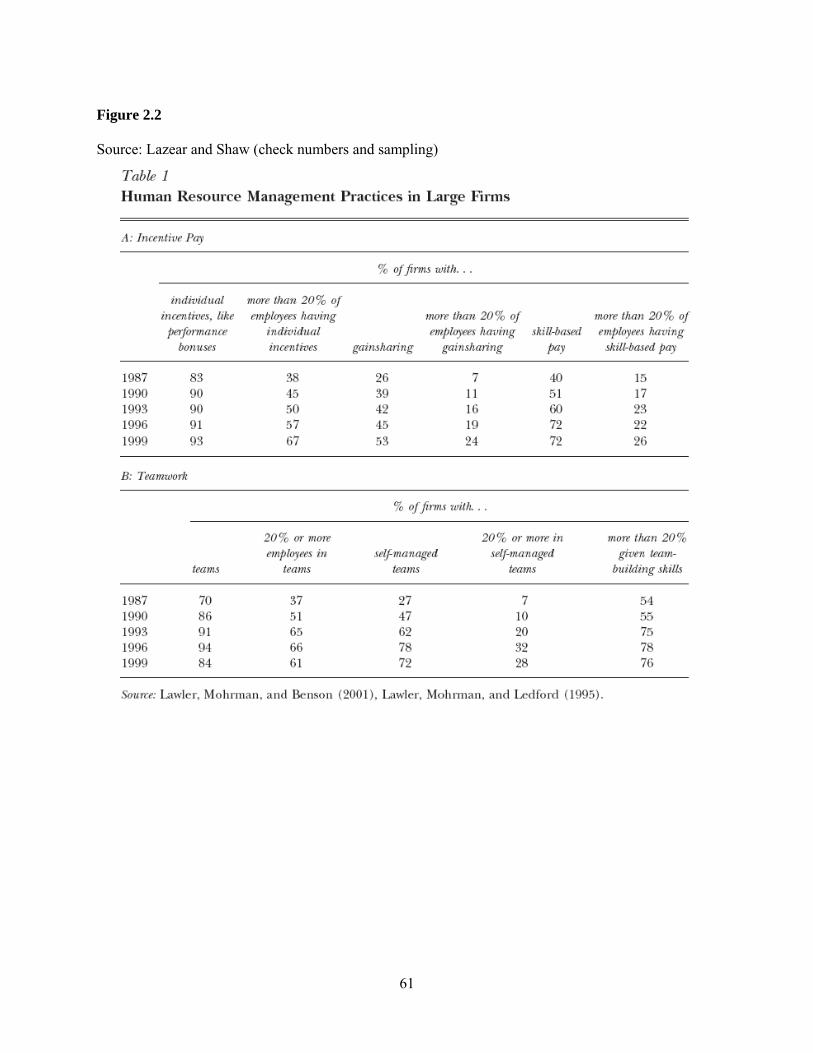
61
Figure 2.2 Source: Lazear and Shaw (check numbers and sampling)
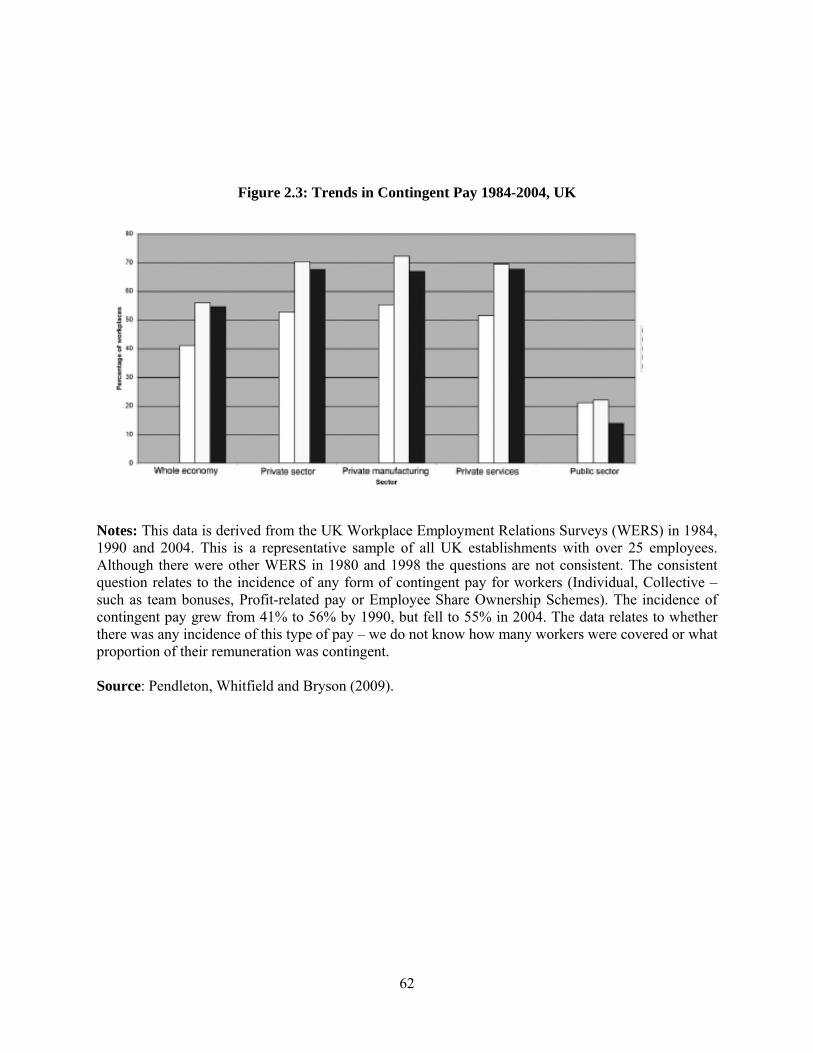
62
Figure 2.3: Trends in Contingent Pay 1984-2004, UK
Notes: This data is derived from the UK Workplace Employment Relations Surveys (WERS) in 1984, 1990 and 2004. This is a representative sample of all UK establishments with over 25 employees. Although there were other WERS in 1980 and 1998 the questions are not consistent. The consistent question relates to the incidence of any form of contingent pay for workers (Individual, Collective – such as team bonuses, Profit-related pay or Employee Share Ownership Schemes). The incidence of contingent pay grew from 41% to 56% by 1990, but fell to 55% in 2004. The data relates to whether there was any incidence of this type of pay – we do not know how many workers were covered or what proportion of their remuneration was contingent. Source: Pendleton, Whitfield and Bryson (2009).
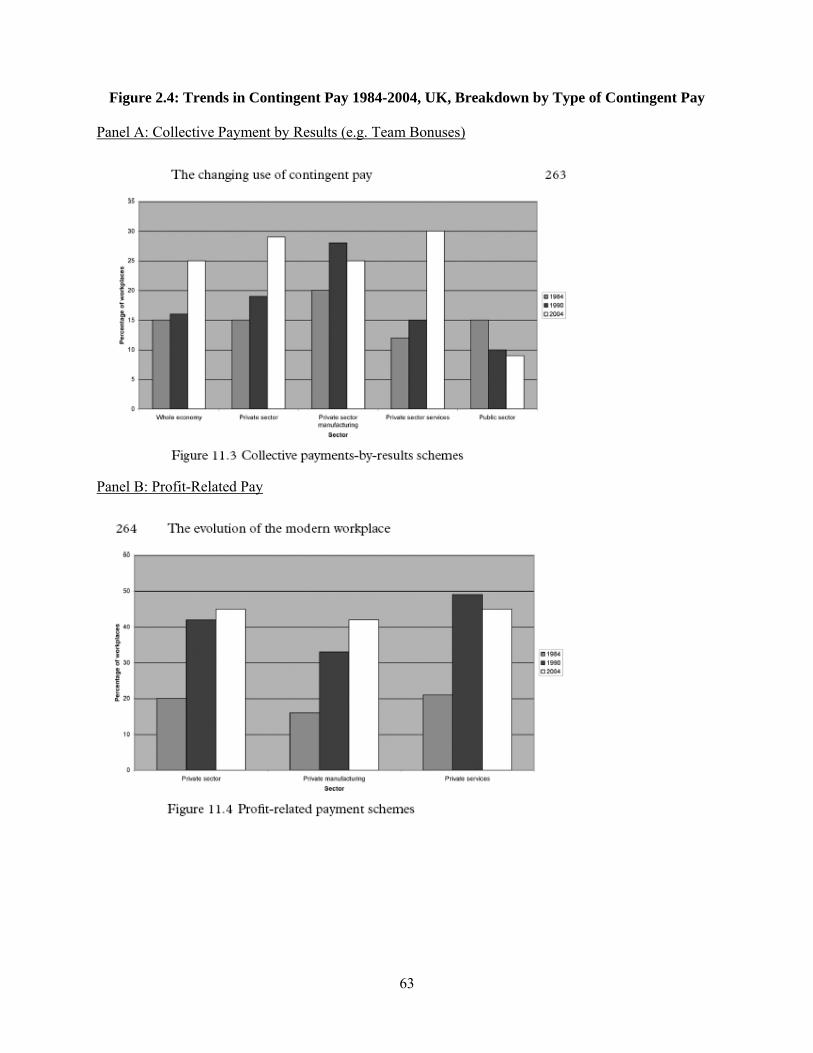
63
Figure 2.4: Trends in Contingent Pay 1984-2004, UK, Breakdown by Type of Contingent Pay
Panel A: Collective Payment by Results (e.g. Team Bonuses)
Panel B: Profit-Related Pay
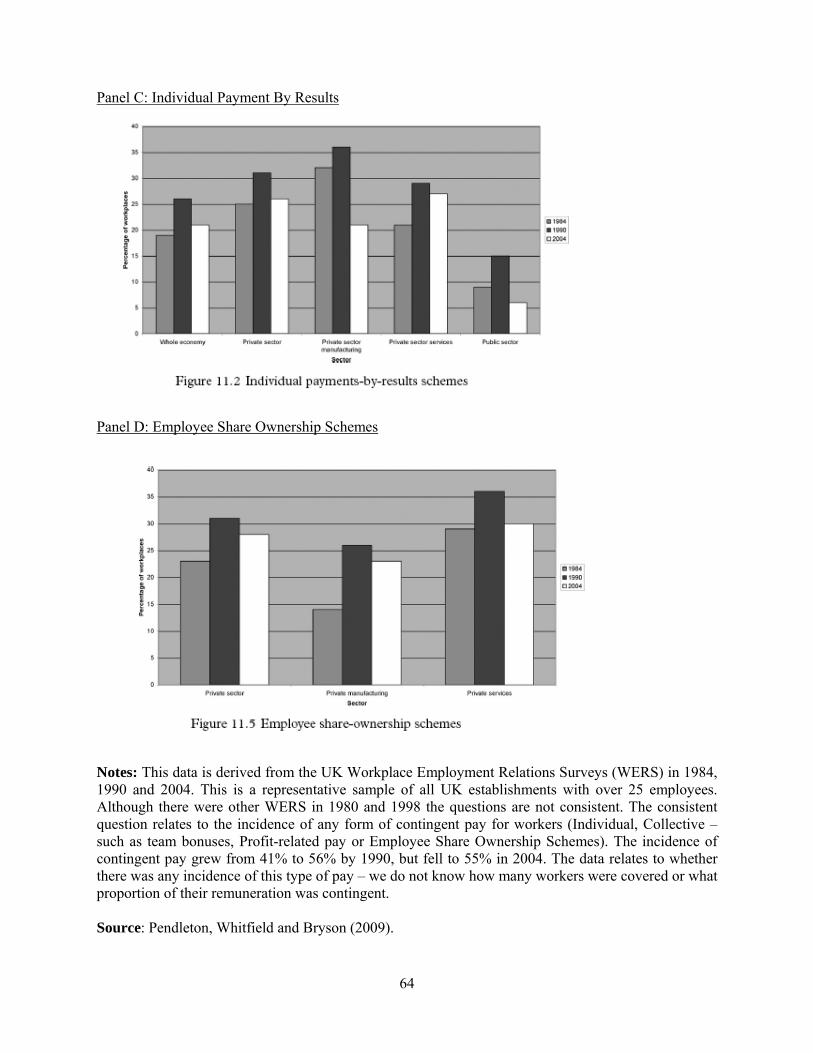
64
Panel C: Individual Payment By Results
Panel D: Employee Share Ownership Schemes
Notes: This data is derived from the UK Workplace Employment Relations Surveys (WERS) in 1984, 1990 and 2004. This is a representative sample of all UK establishments with over 25 employees. Although there were other WERS in 1980 and 1998 the questions are not consistent. The consistent question relates to the incidence of any form of contingent pay for workers (Individual, Collective – such as team bonuses, Profit-related pay or Employee Share Ownership Schemes). The incidence of contingent pay grew from 41% to 56% by 1990, but fell to 55% in 2004. The data relates to whether there was any incidence of this type of pay – we do not know how many workers were covered or what proportion of their remuneration was contingent. Source: Pendleton, Whitfield and Bryson (2009).
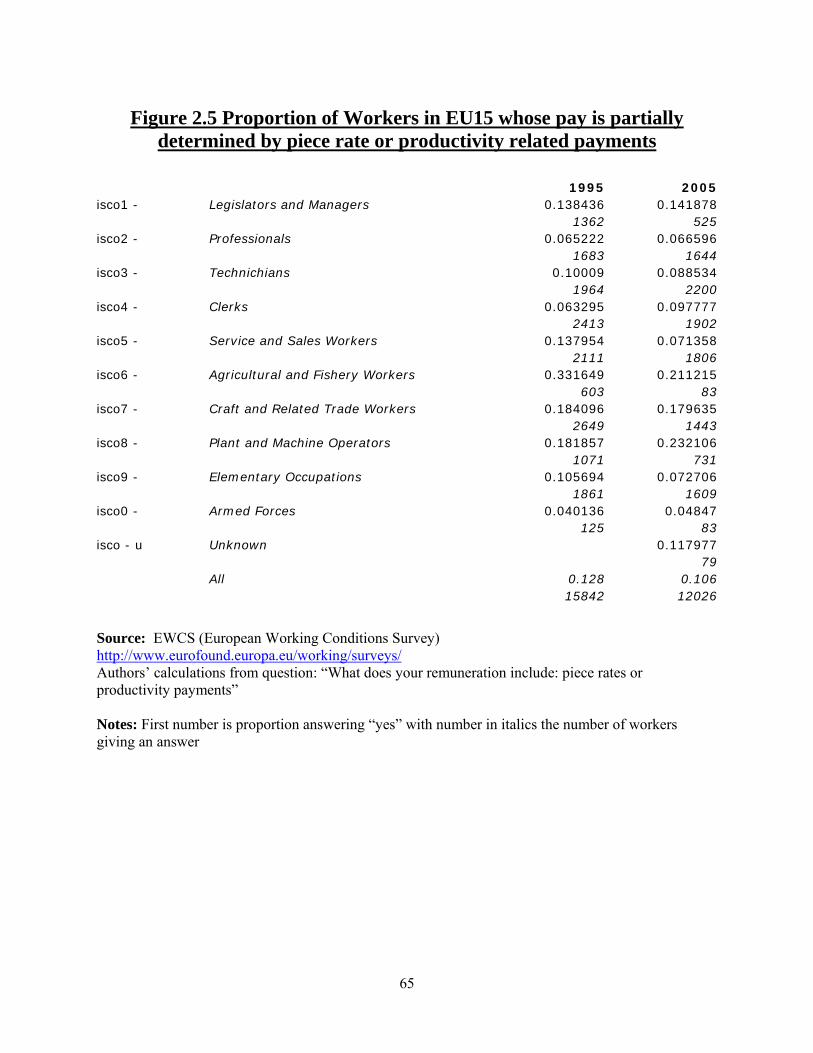
65
Figure 2.5 Proportion of Workers in EU15 whose pay is partially
determined by piece rate or productivity related payments
1995 2005 isco1 - Legislators and Managers 0.138436 0.141878 1362 525 isco2 - Professionals 0.065222 0.066596 1683 1644 isco3 - Technichians 0.10009 0.088534 1964 2200 isco4 - Clerks 0.063295 0.097777 2413 1902 isco5 - Service and Sales Workers 0.137954 0.071358 2111 1806 isco6 - Agricultural and Fishery Workers 0.331649 0.211215 603 83 isco7 - Craft and Related Trade Workers 0.184096 0.179635 2649 1443 isco8 - Plant and Machine Operators 0.181857 0.232106 1071 731 isco9 - Elementary Occupations 0.105694 0.072706 1861 1609 isco0 - Armed Forces 0.040136 0.04847 125 83 isco - u Unknown 0.117977 79 All 0.128 0.106 15842 12026
Source: EWCS (European Working Conditions Survey) http://www.eurofound.europa.eu/working/surveys/ Authors’ calculations from question: “What does your remuneration include: piece rates or productivity payments” Notes: First number is proportion answering “yes” with number in italics the number of workers giving an answer
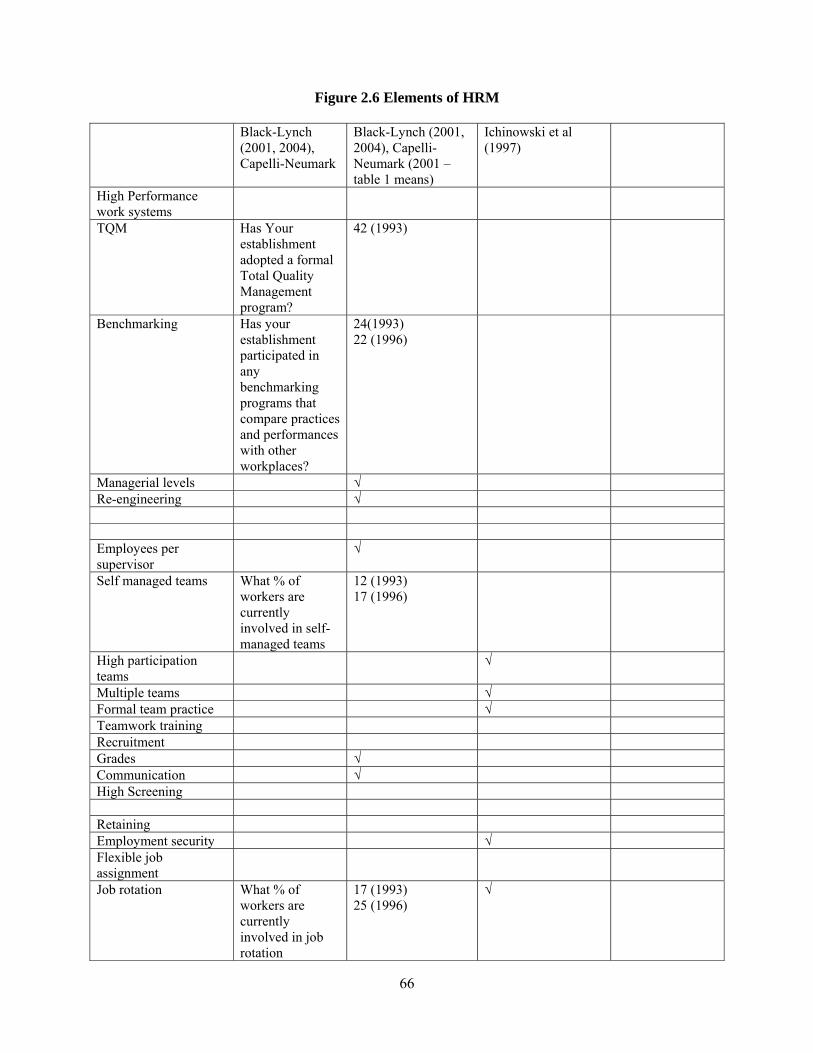
66
Figure 2.6 Elements of HRM Black-Lynch
(2001, 2004), Capelli-Neumark
Black-Lynch (2001, 2004), Capelli-Neumark (2001 – table 1 means)
Ichinowski et al (1997)
High Performance work systems
TQM Has Your establishment adopted a formal Total Quality Management program?
42 (1993)
Benchmarking Has your establishment participated in any benchmarking programs that compare practices and performances with other workplaces?
24(1993) 22 (1996)
Managerial levels √ Re-engineering √ Employees per supervisor
√
Self managed teams What % of workers are currently involved in self-managed teams
12 (1993) 17 (1996)
High participation teams
√
Multiple teams √ Formal team practice √ Teamwork training Recruitment Grades √ Communication √ High Screening Retaining Employment security √ Flexible job assignment
Job rotation What % of workers are currently involved in job rotation
17 (1993) 25 (1996)
√

67
Communication Information Sharing √ Meetings What % of
workers26 are involved in regular scheduled meetings to discuss work-related problems
40.22 (1993) √
Pay Profit sharing √ √ Line incentives √ Unions √ √ Meet in groups √
26 “Workers” was defined as “non-managerial and non-supervisory workers”
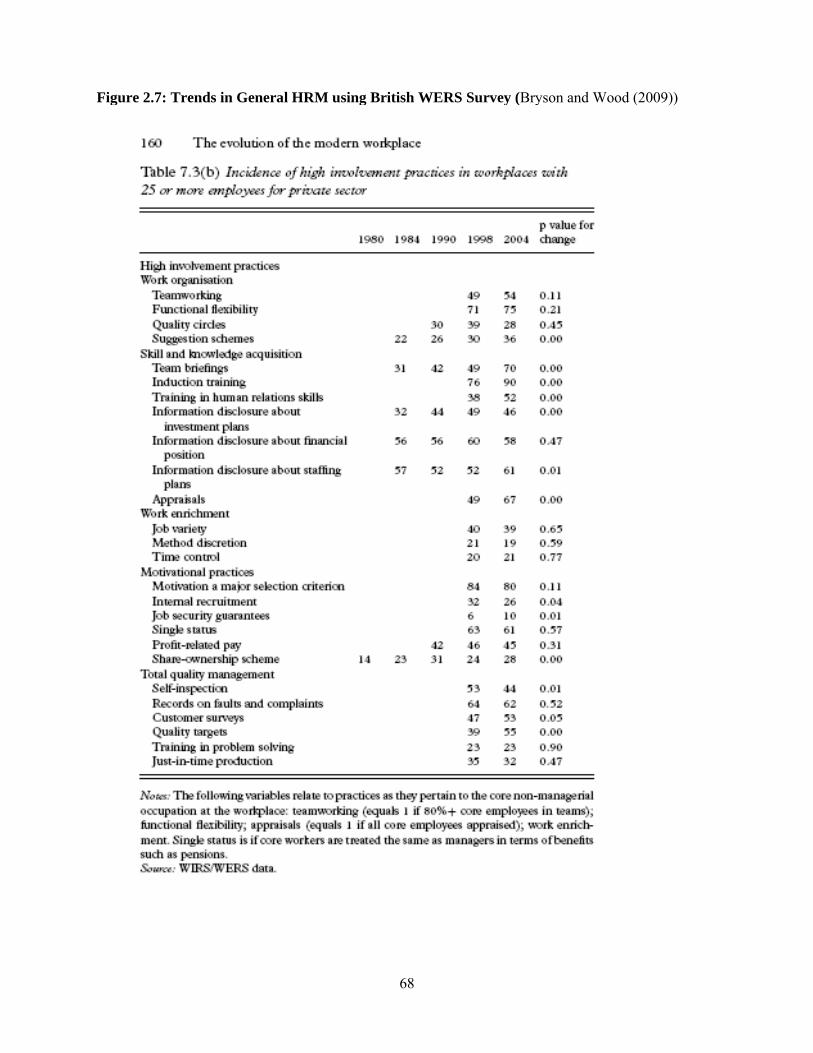
68
Figure 2.7: Trends in General HRM using British WERS Survey (Bryson and Wood (2009))
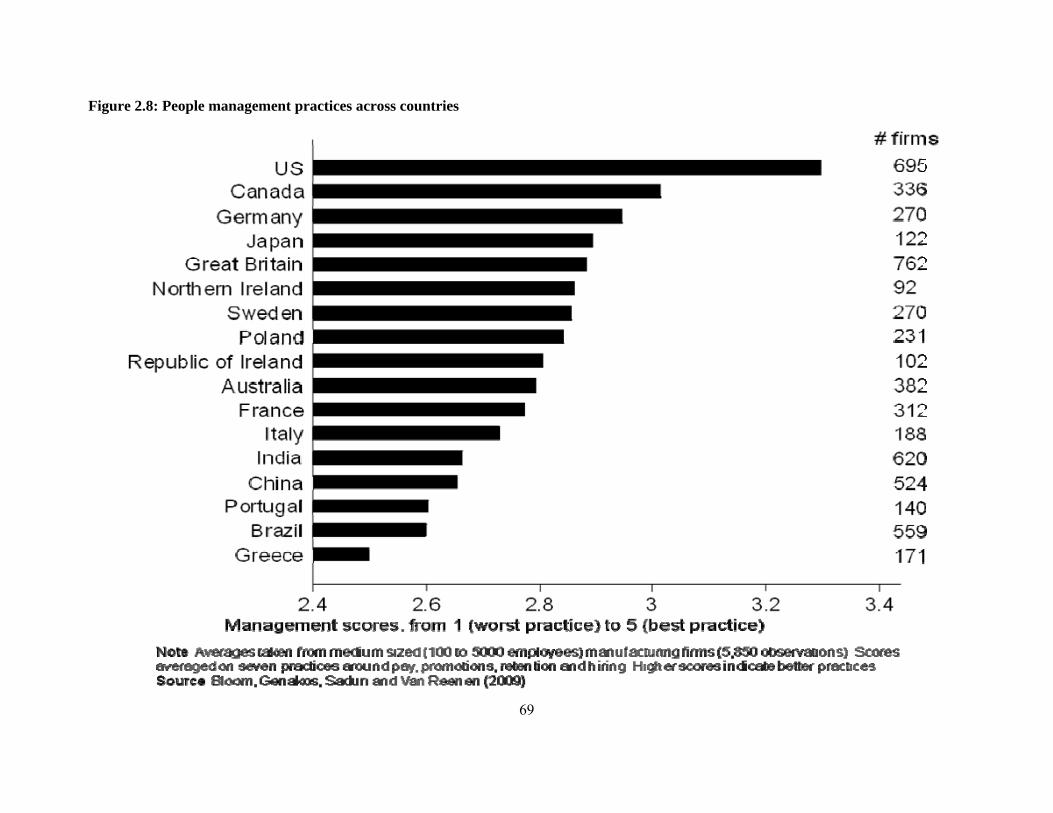
69
Figure 2.8: People management practices across countries
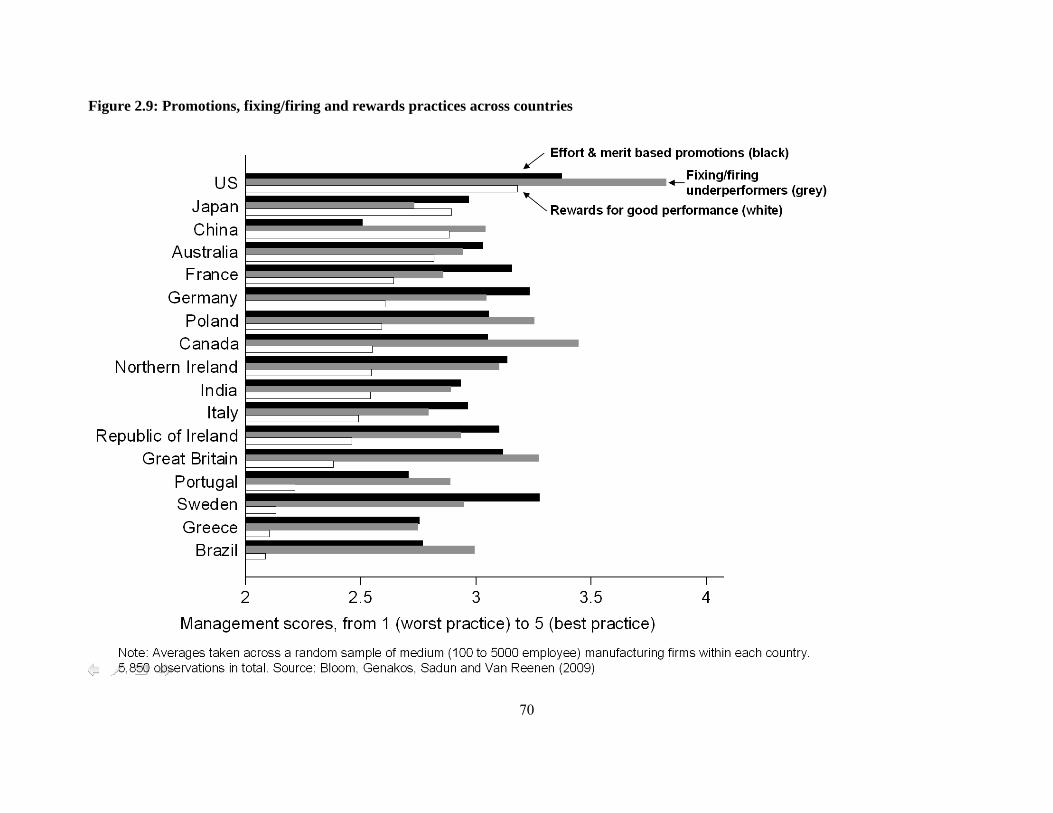
70
Figure 2.9: Promotions, fixing/firing and rewards practices across countries
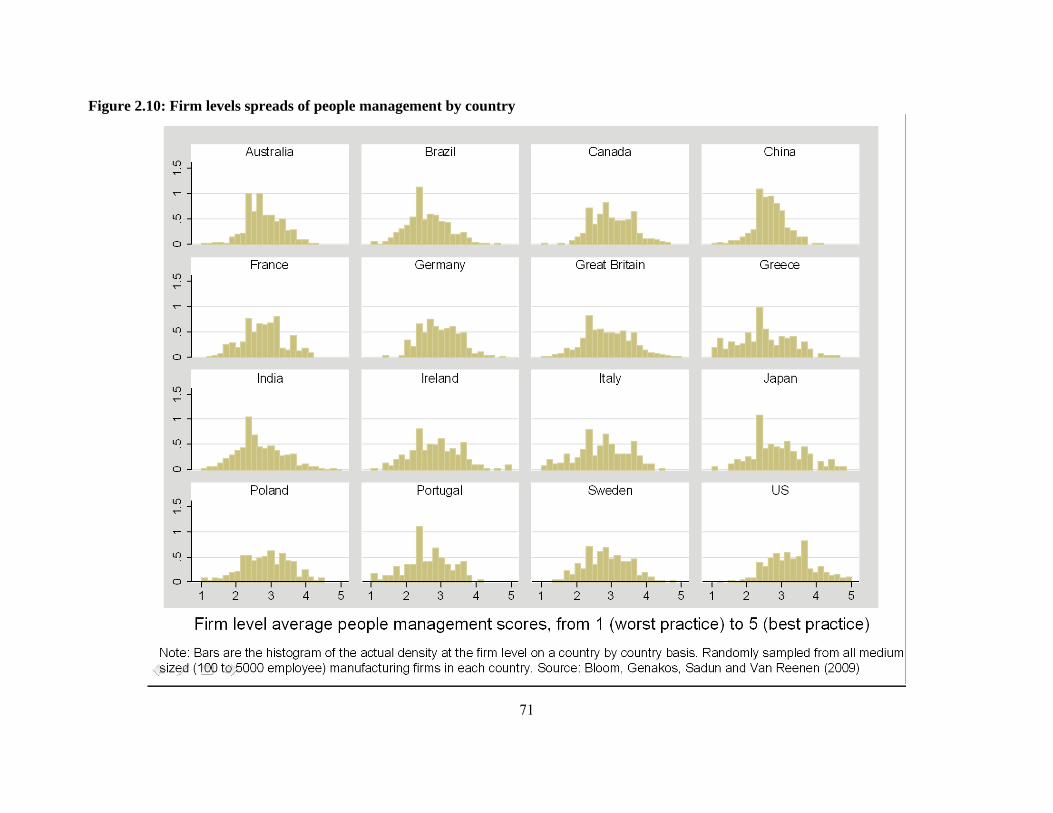
71
Figure 2.10: Firm levels spreads of people management by country
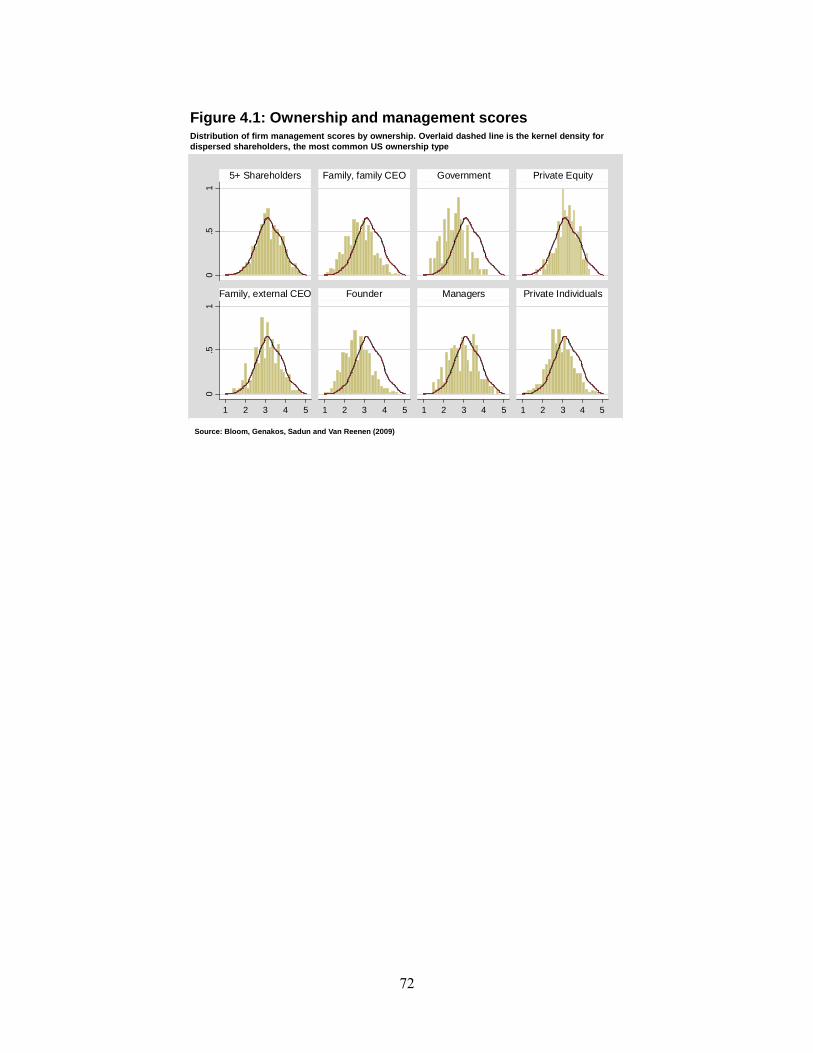
72
Figure 4.1: Ownership and management scoresDistribution of firm management scores by ownership. Overlaid dashed line is the kernel density for dispersed shareholders, the most common US ownership type
Source: Bloom, Genakos, Sadun and Van Reenen (2009)
0.5
10
.51
1 2 3 4 5 1 2 3 4 5 1 2 3 4 5 1 2 3 4 5
5+ Shareholders
Family, external CEO
Family, family CEO
Founder
Government
Managers
Private Equity
Private Individuals
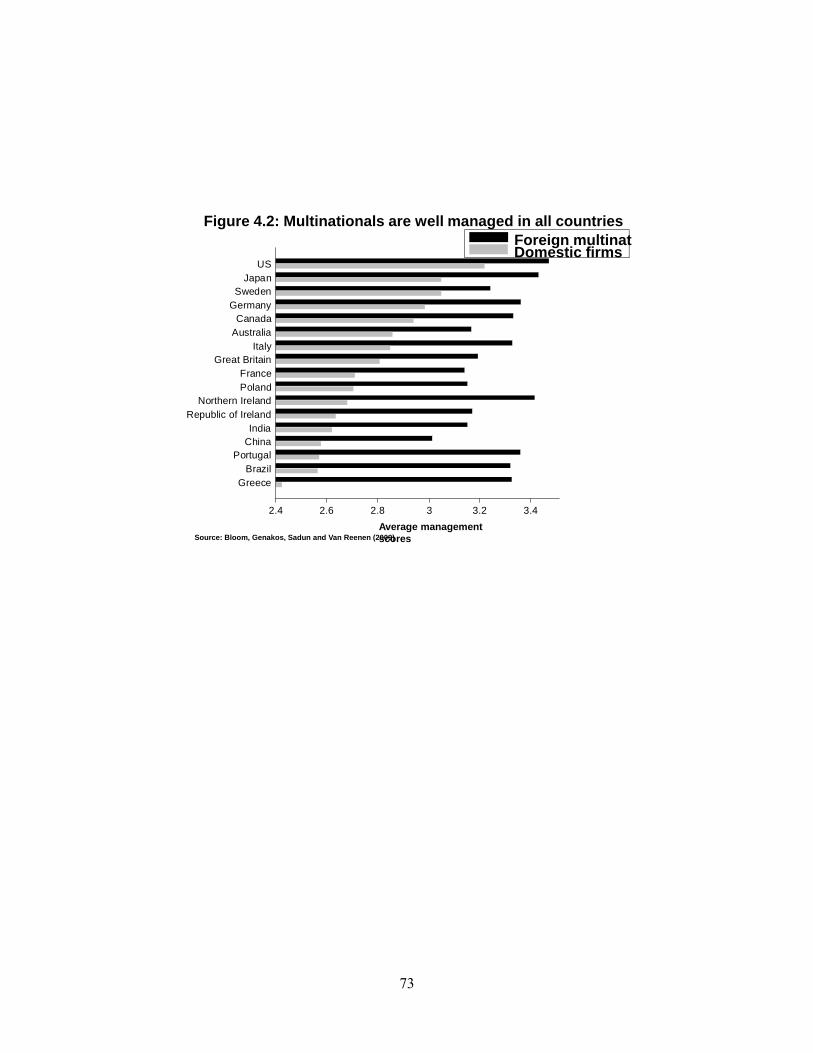
73
2.4 2.6 2.8 3 3.2 3.4
USJapan
SwedenGermany
CanadaAustralia
ItalyGreat Britain
FrancePoland
Northern IrelandRepublic of Ireland
IndiaChina
PortugalBrazil
Greece
Foreign multinatDomestic firms
Figure 4.2: Multinationals are well managed in all countries
Average management scoresSource: Bloom, Genakos, Sadun and Van Reenen (2009)
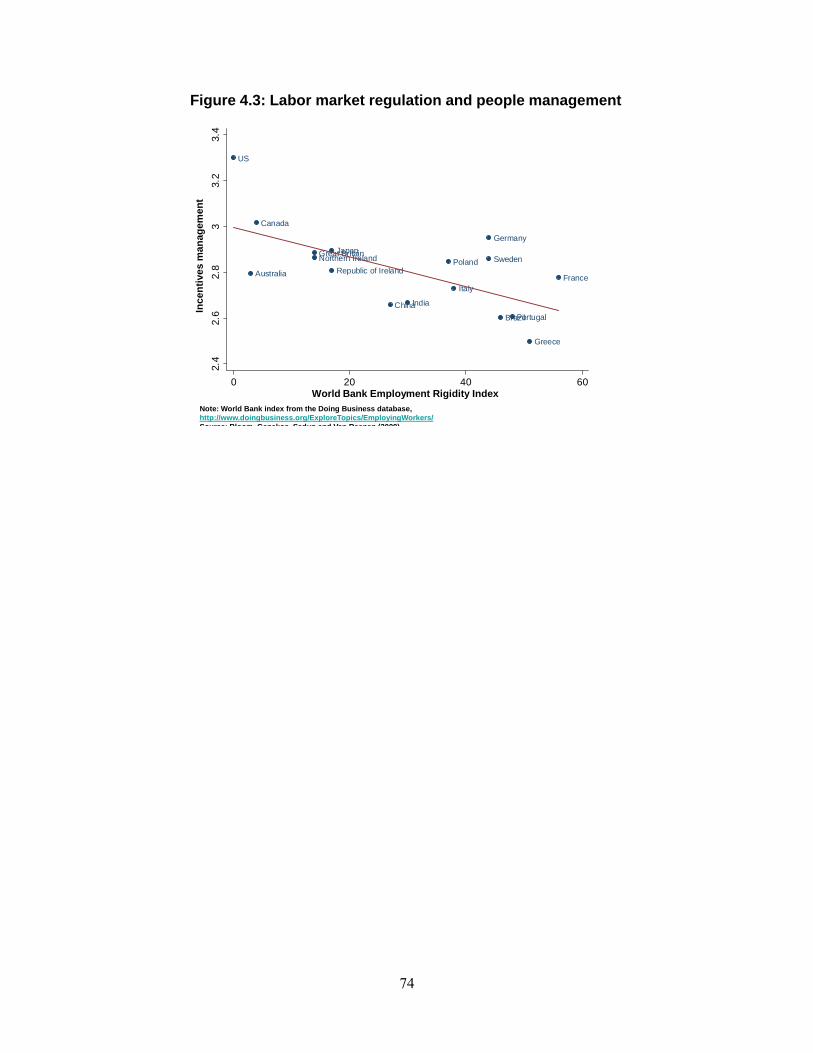
74
Australia
Brazil
Canada
China
France
Great Britain
Germany
Greece
India
Republic of Ireland
Italy
JapanNorthern Ireland Poland
Portugal
Sweden
US
2.4
2.6
2.8
33.
23.
4
0 20 40 60
Figure 4.3: Labor market regulation and people management
World Bank Employment Rigidity Index
Ince
ntiv
es m
anag
emen
t
Note: World Bank index from the Doing Business database, http://www.doingbusiness.org/ExploreTopics/EmployingWorkers/Source: Bloom Genakos Sadun and Van Reenen (2009)
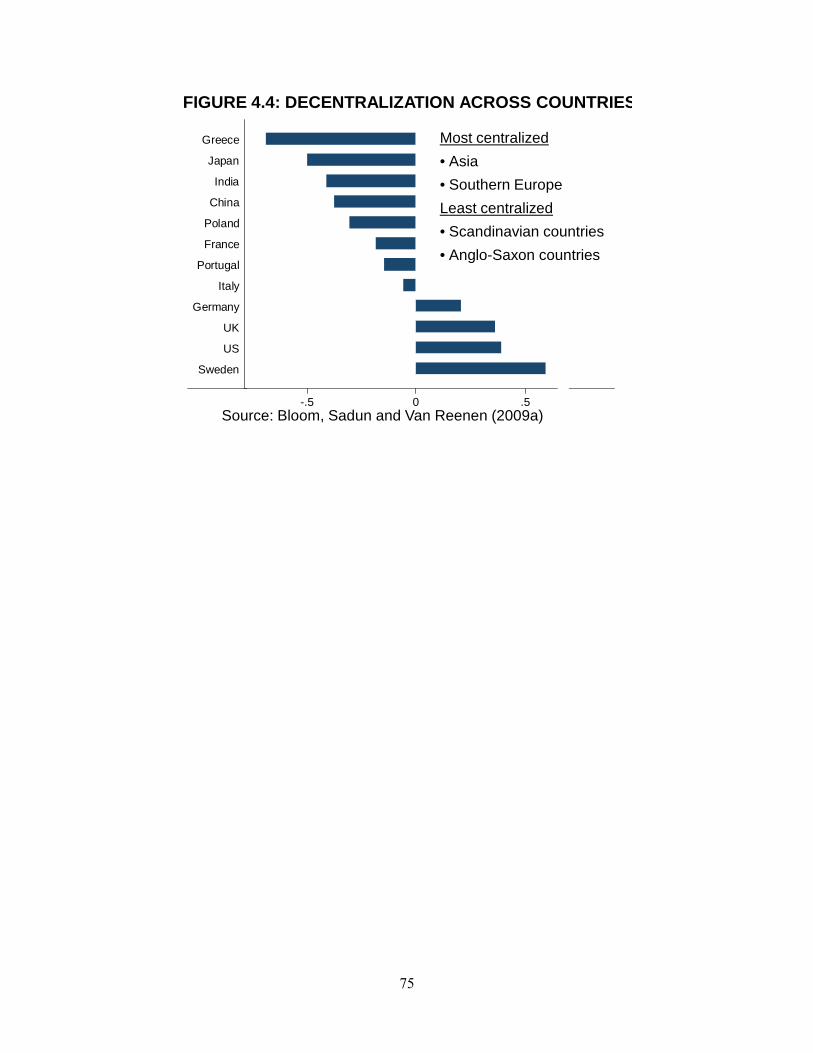
75
Sweden
US
UK
Germany
Italy
Portugal
France
Poland
China
India
Japan
Greece
-.5 0 .5
FIGURE 4.4: DECENTRALIZATION ACROSS COUNTRIES
Most centralized• Asia• Southern EuropeLeast centralized• Scandinavian countries • Anglo-Saxon countries
Source: Bloom, Sadun and Van Reenen (2009a)
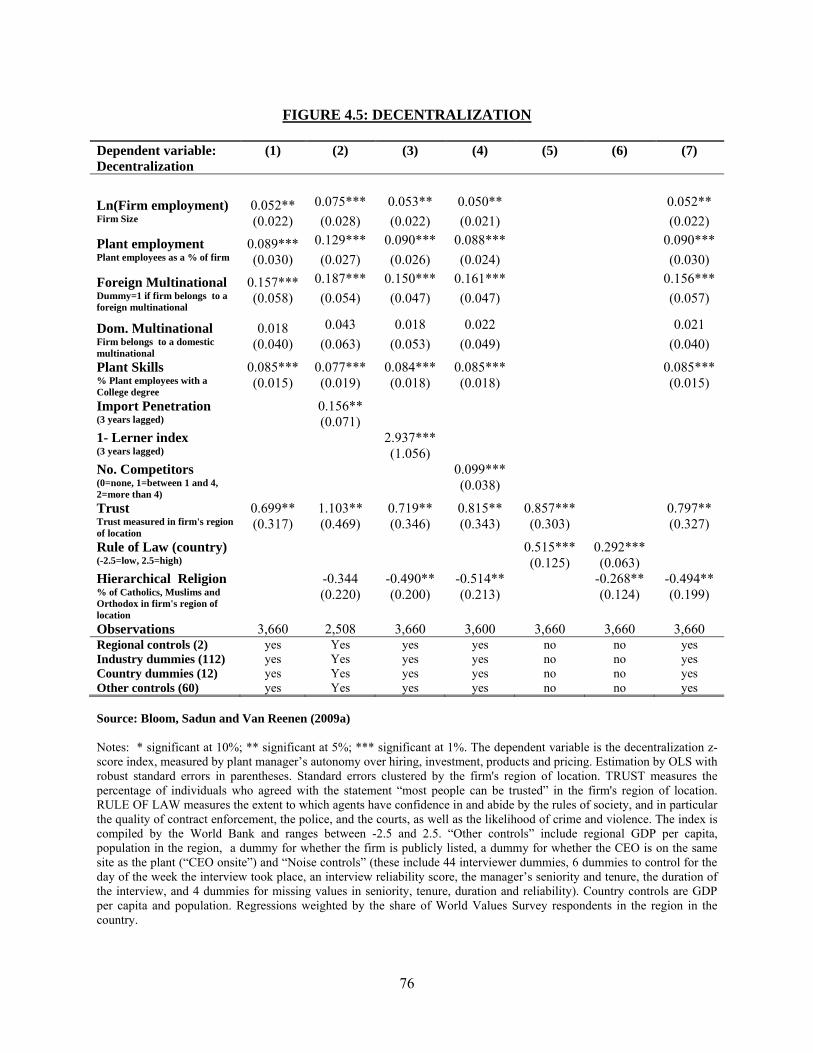
76
FIGURE 4.5: DECENTRALIZATION
Dependent variable: Decentralization
(1) (2) (3) (4) (5) (6) (7)
Ln(Firm employment) 0.052** 0.075*** 0.053** 0.050** 0.052** Firm Size (0.022) (0.028) (0.022) (0.021) (0.022)
Plant employment 0.089*** 0.129*** 0.090*** 0.088*** 0.090*** Plant employees as a % of firm (0.030) (0.027) (0.026) (0.024) (0.030)
Foreign Multinational 0.157*** 0.187*** 0.150*** 0.161*** 0.156*** Dummy=1 if firm belongs to a foreign multinational
(0.058) (0.054) (0.047) (0.047) (0.057)
Dom. Multinational 0.018 0.043 0.018 0.022 0.021 Firm belongs to a domestic multinational
(0.040) (0.063) (0.053) (0.049) (0.040)
Plant Skills 0.085*** 0.077*** 0.084*** 0.085*** 0.085*** % Plant employees with a College degree
(0.015) (0.019) (0.018) (0.018) (0.015)
Import Penetration 0.156** (3 years lagged) (0.071) 1- Lerner index 2.937*** (3 years lagged) (1.056) No. Competitors 0.099*** (0=none, 1=between 1 and 4, 2=more than 4)
(0.038)
Trust 0.699** 1.103** 0.719** 0.815** 0.857*** 0.797** Trust measured in firm's region of location
(0.317) (0.469) (0.346) (0.343) (0.303) (0.327)
Rule of Law (country) 0.515*** 0.292*** (-2.5=low, 2.5=high) (0.125) (0.063) Hierarchical Religion -0.344 -0.490** -0.514** -0.268** -0.494** % of Catholics, Muslims and Orthodox in firm's region of location
(0.220) (0.200) (0.213) (0.124) (0.199)
Observations 3,660 2,508 3,660 3,600 3,660 3,660 3,660 Regional controls (2) yes Yes yes yes no no yes Industry dummies (112) yes Yes yes yes no no yes Country dummies (12) yes Yes yes yes no no yes Other controls (60) yes Yes yes yes no no yes Source: Bloom, Sadun and Van Reenen (2009a) Notes: * significant at 10%; ** significant at 5%; *** significant at 1%. The dependent variable is the decentralization z-score index, measured by plant manager’s autonomy over hiring, investment, products and pricing. Estimation by OLS with robust standard errors in parentheses. Standard errors clustered by the firm's region of location. TRUST measures the percentage of individuals who agreed with the statement “most people can be trusted” in the firm's region of location. RULE OF LAW measures the extent to which agents have confidence in and abide by the rules of society, and in particular the quality of contract enforcement, the police, and the courts, as well as the likelihood of crime and violence. The index is compiled by the World Bank and ranges between -2.5 and 2.5. “Other controls” include regional GDP per capita, population in the region, a dummy for whether the firm is publicly listed, a dummy for whether the CEO is on the same site as the plant (“CEO onsite”) and “Noise controls” (these include 44 interviewer dummies, 6 dummies to control for the day of the week the interview took place, an interview reliability score, the manager’s seniority and tenure, the duration of the interview, and 4 dummies for missing values in seniority, tenure, duration and reliability). Country controls are GDP per capita and population. Regressions weighted by the share of World Values Survey respondents in the region in the country.
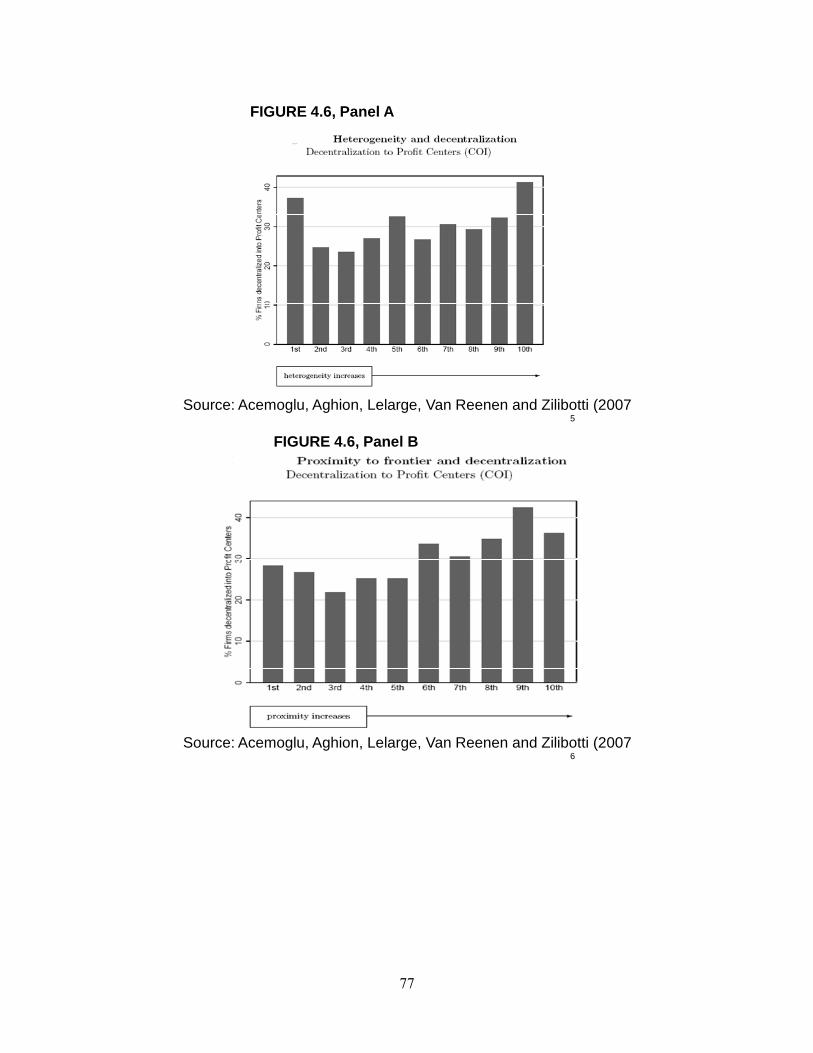
77
5
FIGURE 4.6, Panel A
Source: Acemoglu, Aghion, Lelarge, Van Reenen and Zilibotti (2007
6
FIGURE 4.6, Panel B
Source: Acemoglu, Aghion, Lelarge, Van Reenen and Zilibotti (2007
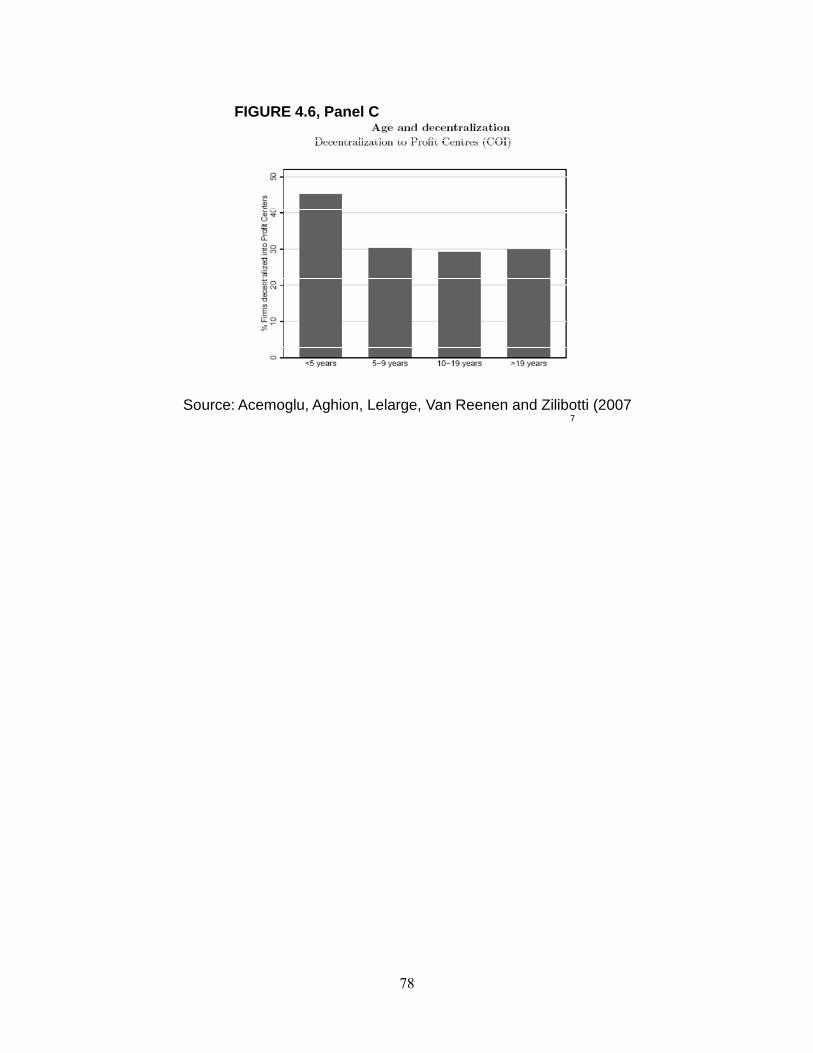
78
7
FIGURE 4.6, Panel C
Source: Acemoglu, Aghion, Lelarge, Van Reenen and Zilibotti (2007
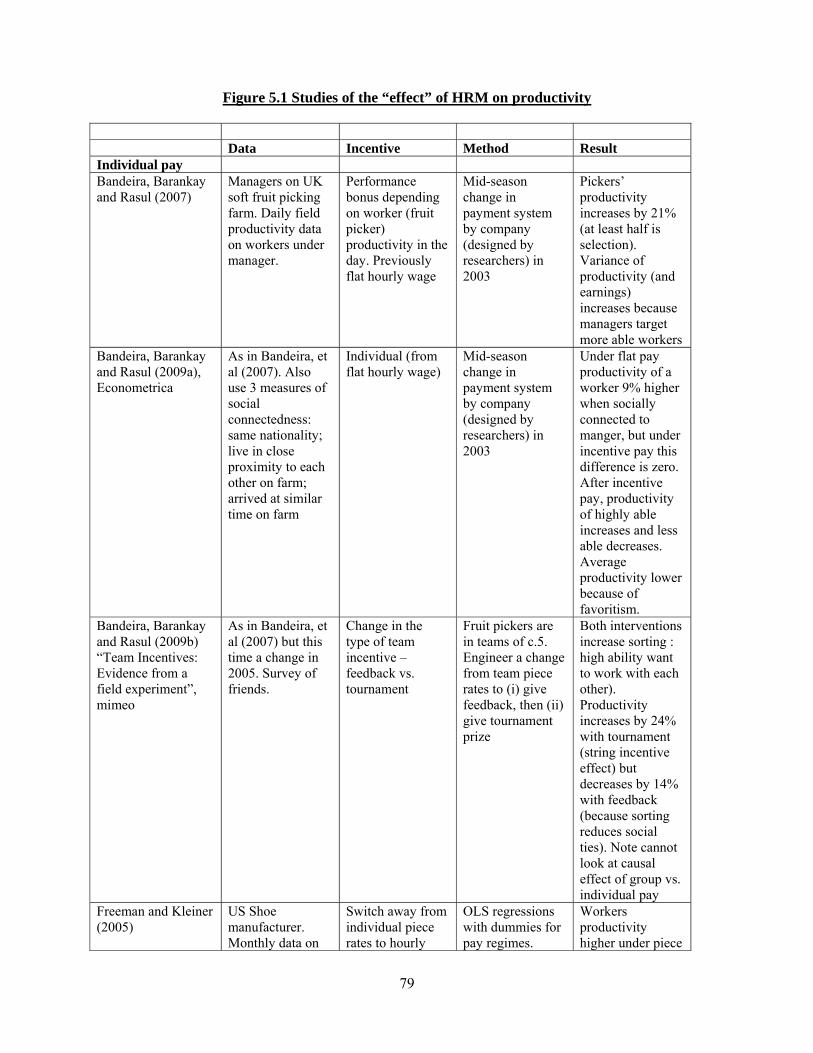
79
Figure 5.1 Studies of the “effect” of HRM on productivity Data Incentive Method Result Individual pay Bandeira, Barankay and Rasul (2007)
Managers on UK soft fruit picking farm. Daily field productivity data on workers under manager.
Performance bonus depending on worker (fruit picker) productivity in the day. Previously flat hourly wage
Mid-season change in payment system by company (designed by researchers) in 2003
Pickers’ productivity increases by 21% (at least half is selection). Variance of productivity (and earnings) increases because managers target more able workers
Bandeira, Barankay and Rasul (2009a), Econometrica
As in Bandeira, et al (2007). Also use 3 measures of social connectedness: same nationality; live in close proximity to each other on farm; arrived at similar time on farm
Individual (from flat hourly wage)
Mid-season change in payment system by company (designed by researchers) in 2003
Under flat pay productivity of a worker 9% higher when socially connected to manger, but under incentive pay this difference is zero. After incentive pay, productivity of highly able increases and less able decreases. Average productivity lower because of favoritism.
Bandeira, Barankay and Rasul (2009b) “Team Incentives: Evidence from a field experiment”, mimeo
As in Bandeira, et al (2007) but this time a change in 2005. Survey of friends.
Change in the type of team incentive – feedback vs. tournament
Fruit pickers are in teams of c.5. Engineer a change from team piece rates to (i) give feedback, then (ii) give tournament prize
Both interventions increase sorting : high ability want to work with each other). Productivity increases by 24% with tournament (string incentive effect) but decreases by 14% with feedback (because sorting reduces social ties). Note cannot look at causal effect of group vs. individual pay
Freeman and Kleiner (2005)
US Shoe manufacturer. Monthly data on
Switch away from individual piece rates to hourly
OLS regressions with dummies for pay regimes.
Workers productivity higher under piece
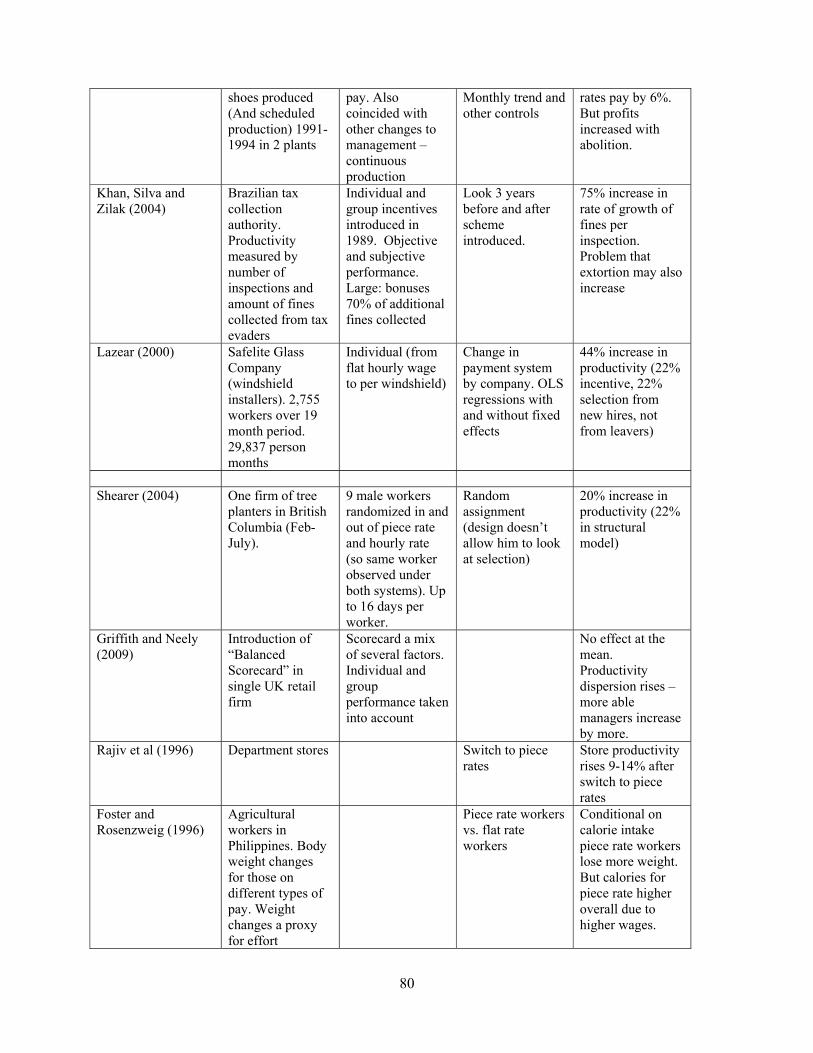
80
shoes produced (And scheduled production) 1991-1994 in 2 plants
pay. Also coincided with other changes to management – continuous production
Monthly trend and other controls
rates pay by 6%. But profits increased with abolition.
Khan, Silva and Zilak (2004)
Brazilian tax collection authority. Productivity measured by number of inspections and amount of fines collected from tax evaders
Individual and group incentives introduced in 1989. Objective and subjective performance. Large: bonuses 70% of additional fines collected
Look 3 years before and after scheme introduced.
75% increase in rate of growth of fines per inspection. Problem that extortion may also increase
Lazear (2000) Safelite Glass Company (windshield installers). 2,755 workers over 19 month period. 29,837 person months
Individual (from flat hourly wage to per windshield)
Change in payment system by company. OLS regressions with and without fixed effects
44% increase in productivity (22% incentive, 22% selection from new hires, not from leavers)
Shearer (2004) One firm of tree
planters in British Columbia (Feb-July).
9 male workers randomized in and out of piece rate and hourly rate (so same worker observed under both systems). Up to 16 days per worker.
Random assignment (design doesn’t allow him to look at selection)
20% increase in productivity (22% in structural model)
Griffith and Neely (2009)
Introduction of “Balanced Scorecard” in single UK retail firm
Scorecard a mix of several factors. Individual and group performance taken into account
No effect at the mean. Productivity dispersion rises – more able managers increase by more.
Rajiv et al (1996) Department stores Switch to piece rates
Store productivity rises 9-14% after switch to piece rates
Foster and Rosenzweig (1996)
Agricultural workers in Philippines. Body weight changes for those on different types of pay. Weight changes a proxy for effort
Piece rate workers vs. flat rate workers
Conditional on calorie intake piece rate workers lose more weight. But calories for piece rate higher overall due to higher wages.
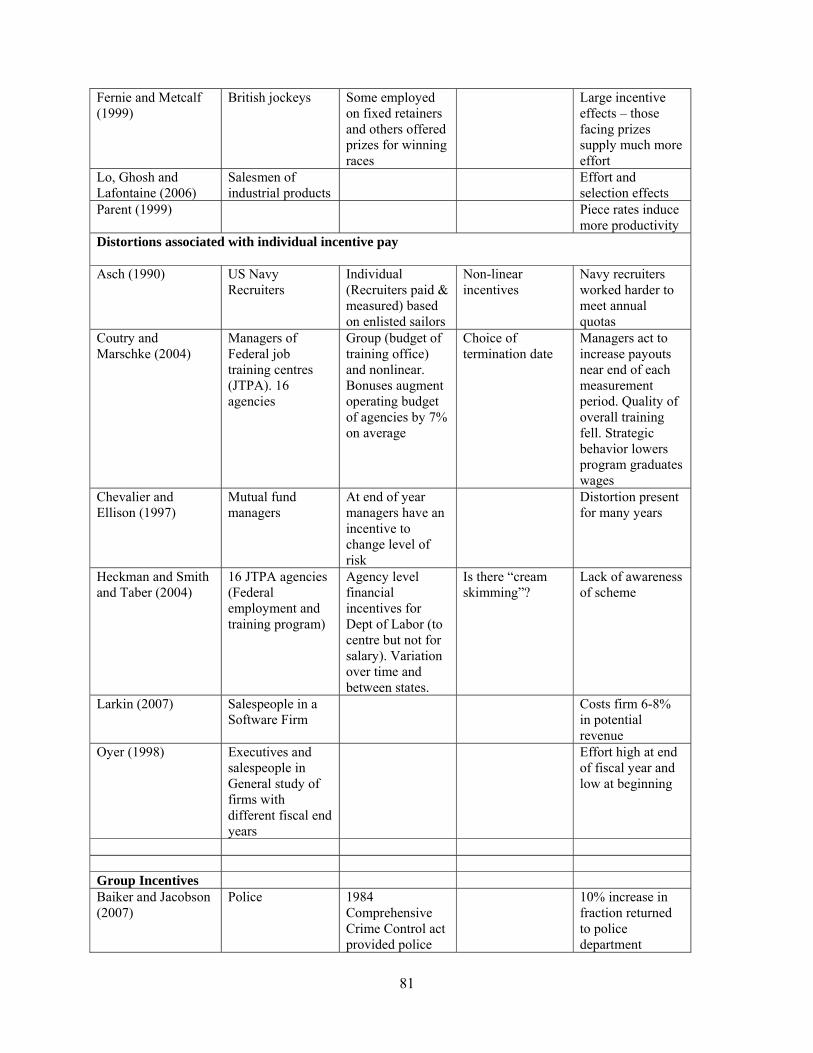
81
Fernie and Metcalf (1999)
British jockeys Some employed on fixed retainers and others offered prizes for winning races
Large incentive effects – those facing prizes supply much more effort
Lo, Ghosh and Lafontaine (2006)
Salesmen of industrial products
Effort and selection effects
Parent (1999) Piece rates induce more productivity
Distortions associated with individual incentive pay Asch (1990) US Navy
Recruiters Individual (Recruiters paid & measured) based on enlisted sailors
Non-linear incentives
Navy recruiters worked harder to meet annual quotas
Coutry and Marschke (2004)
Managers of Federal job training centres (JTPA). 16 agencies
Group (budget of training office) and nonlinear. Bonuses augment operating budget of agencies by 7% on average
Choice of termination date
Managers act to increase payouts near end of each measurement period. Quality of overall training fell. Strategic behavior lowers program graduates wages
Chevalier and Ellison (1997)
Mutual fund managers
At end of year managers have an incentive to change level of risk
Distortion present for many years
Heckman and Smith and Taber (2004)
16 JTPA agencies (Federal employment and training program)
Agency level financial incentives for Dept of Labor (to centre but not for salary). Variation over time and between states.
Is there “cream skimming”?
Lack of awareness of scheme
Larkin (2007) Salespeople in a Software Firm
Costs firm 6-8% in potential revenue
Oyer (1998) Executives and salespeople in General study of firms with different fiscal end years
Effort high at end of fiscal year and low at beginning
Group Incentives Baiker and Jacobson (2007)
Police 1984 Comprehensive Crime Control act provided police
10% increase in fraction returned to police department
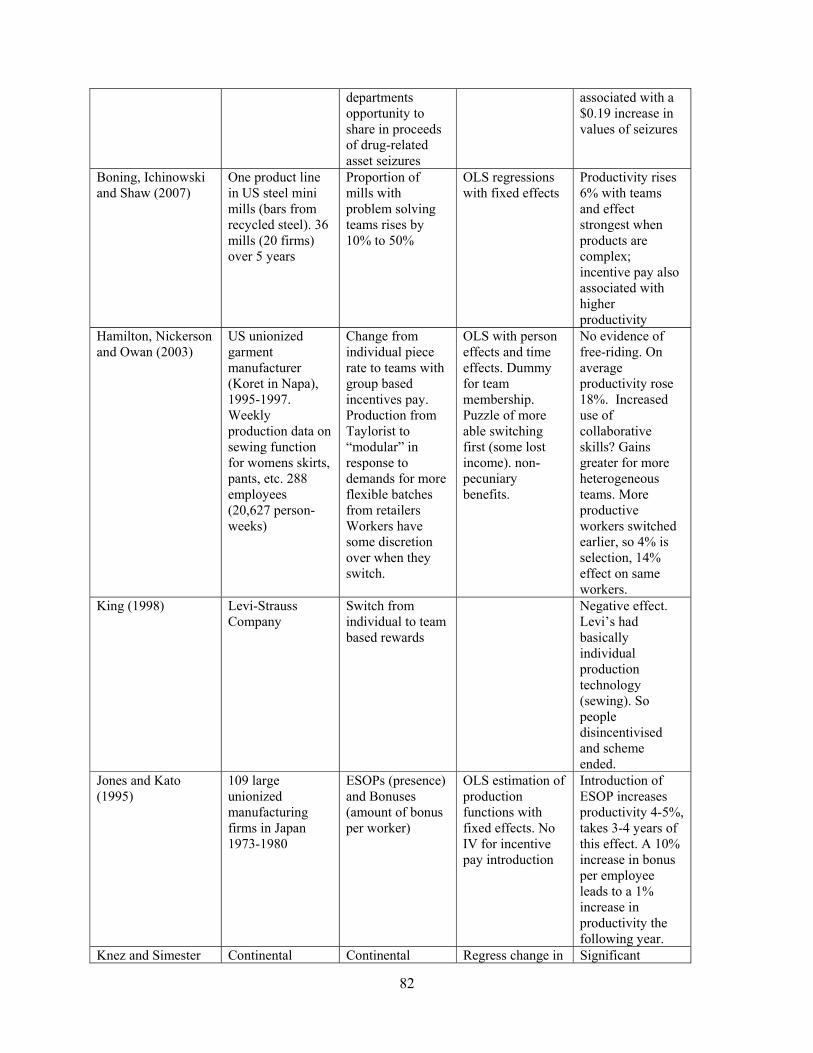
82
departments opportunity to share in proceeds of drug-related asset seizures
associated with a $0.19 increase in values of seizures
Boning, Ichinowski and Shaw (2007)
One product line in US steel mini mills (bars from recycled steel). 36 mills (20 firms) over 5 years
Proportion of mills with problem solving teams rises by 10% to 50%
OLS regressions with fixed effects
Productivity rises 6% with teams and effect strongest when products are complex; incentive pay also associated with higher productivity
Hamilton, Nickerson and Owan (2003)
US unionized garment manufacturer (Koret in Napa), 1995-1997. Weekly production data on sewing function for womens skirts, pants, etc. 288 employees (20,627 person-weeks)
Change from individual piece rate to teams with group based incentives pay. Production from Taylorist to “modular” in response to demands for more flexible batches from retailers Workers have some discretion over when they switch.
OLS with person effects and time effects. Dummy for team membership. Puzzle of more able switching first (some lost income). non-pecuniary benefits.
No evidence of free-riding. On average productivity rose 18%. Increased use of collaborative skills? Gains greater for more heterogeneous teams. More productive workers switched earlier, so 4% is selection, 14% effect on same workers.
King (1998) Levi-Strauss Company
Switch from individual to team based rewards
Negative effect. Levi’s had basically individual production technology (sewing). So people disincentivised and scheme ended.
Jones and Kato (1995)
109 large unionized manufacturing firms in Japan 1973-1980
ESOPs (presence) and Bonuses (amount of bonus per worker)
OLS estimation of production functions with fixed effects. No IV for incentive pay introduction
Introduction of ESOP increases productivity 4-5%, takes 3-4 years of this effect. A 10% increase in bonus per employee leads to a 1% increase in productivity the following year.
Knez and Simester Continental Continental Regress change in Significant
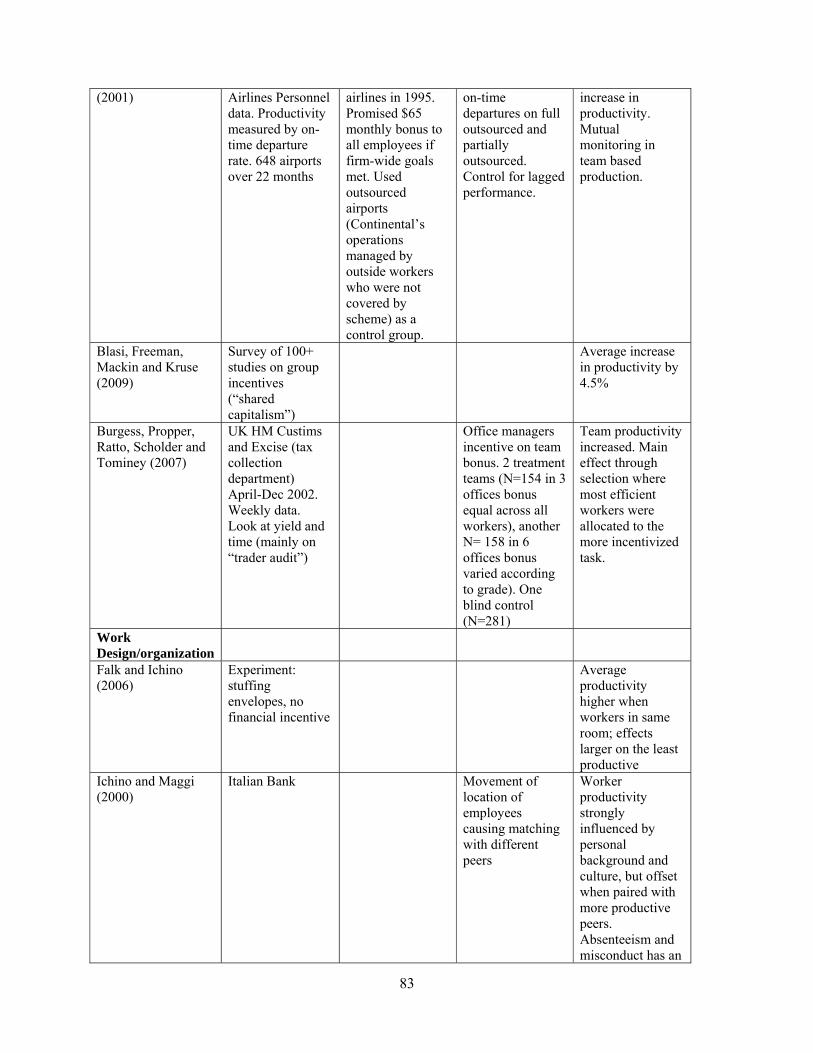
83
(2001) Airlines Personnel data. Productivity measured by on-time departure rate. 648 airports over 22 months
airlines in 1995. Promised $65 monthly bonus to all employees if firm-wide goals met. Used outsourced airports (Continental’s operations managed by outside workers who were not covered by scheme) as a control group.
on-time departures on full outsourced and partially outsourced. Control for lagged performance.
increase in productivity. Mutual monitoring in team based production.
Blasi, Freeman, Mackin and Kruse (2009)
Survey of 100+ studies on group incentives (“shared capitalism”)
Average increase in productivity by 4.5%
Burgess, Propper, Ratto, Scholder and Tominey (2007)
UK HM Custims and Excise (tax collection department) April-Dec 2002. Weekly data. Look at yield and time (mainly on “trader audit”)
Office managers incentive on team bonus. 2 treatment teams (N=154 in 3 offices bonus equal across all workers), another N= 158 in 6 offices bonus varied according to grade). One blind control (N=281)
Team productivity increased. Main effect through selection where most efficient workers were allocated to the more incentivized task.
Work Design/organization
Falk and Ichino (2006)
Experiment: stuffing envelopes, no financial incentive
Average productivity higher when workers in same room; effects larger on the least productive
Ichino and Maggi (2000)
Italian Bank Movement of location of employees causing matching with different peers
Worker productivity strongly influenced by personal background and culture, but offset when paired with more productive peers. Absenteeism and misconduct has an
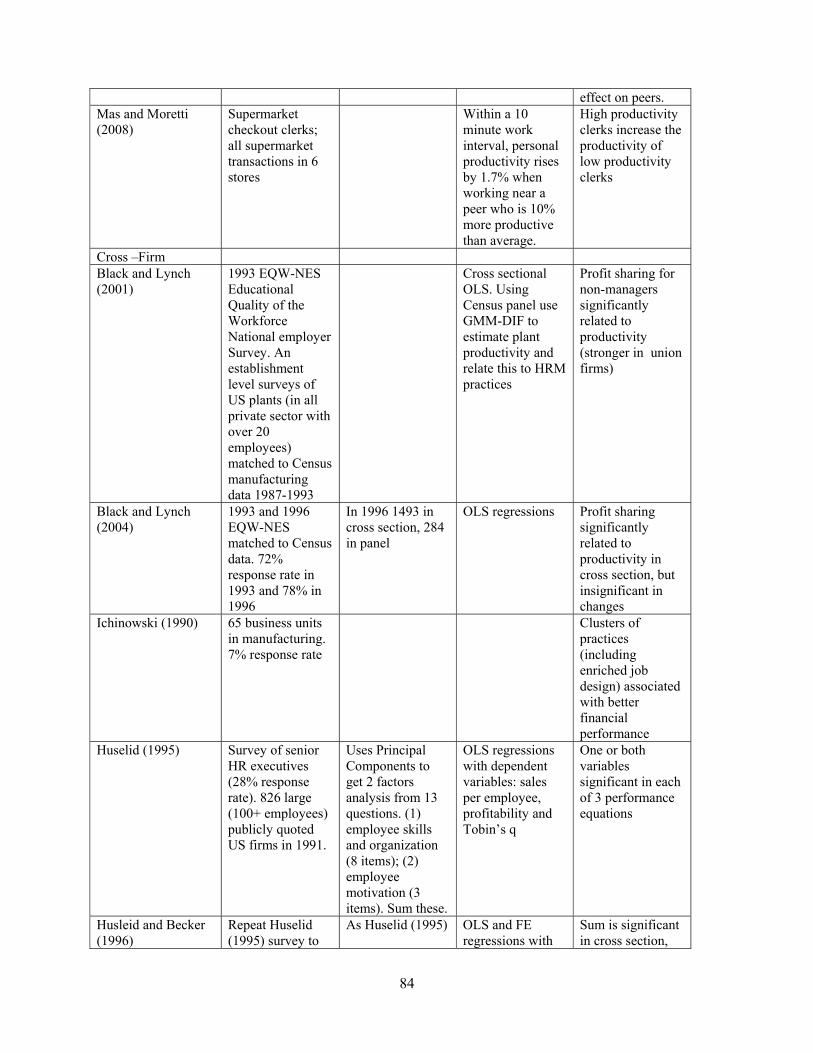
84
effect on peers. Mas and Moretti (2008)
Supermarket checkout clerks; all supermarket transactions in 6 stores
Within a 10 minute work interval, personal productivity rises by 1.7% when working near a peer who is 10% more productive than average.
High productivity clerks increase the productivity of low productivity clerks
Cross –Firm Black and Lynch (2001)
1993 EQW-NES Educational Quality of the Workforce National employer Survey. An establishment level surveys of US plants (in all private sector with over 20 employees) matched to Census manufacturing data 1987-1993
Cross sectional OLS. Using Census panel use GMM-DIF to estimate plant productivity and relate this to HRM practices
Profit sharing for non-managers significantly related to productivity (stronger in union firms)
Black and Lynch (2004)
1993 and 1996 EQW-NES matched to Census data. 72% response rate in 1993 and 78% in 1996
In 1996 1493 in cross section, 284 in panel
OLS regressions Profit sharing significantly related to productivity in cross section, but insignificant in changes
Ichinowski (1990) 65 business units in manufacturing. 7% response rate
Clusters of practices (including enriched job design) associated with better financial performance
Huselid (1995) Survey of senior HR executives (28% response rate). 826 large (100+ employees) publicly quoted US firms in 1991.
Uses Principal Components to get 2 factors analysis from 13 questions. (1) employee skills and organization (8 items); (2) employee motivation (3 items). Sum these.
OLS regressions with dependent variables: sales per employee, profitability and Tobin’s q
One or both variables significant in each of 3 performance equations
Husleid and Becker (1996)
Repeat Huselid (1995) survey to
As Huselid (1995) OLS and FE regressions with
Sum is significant in cross section,
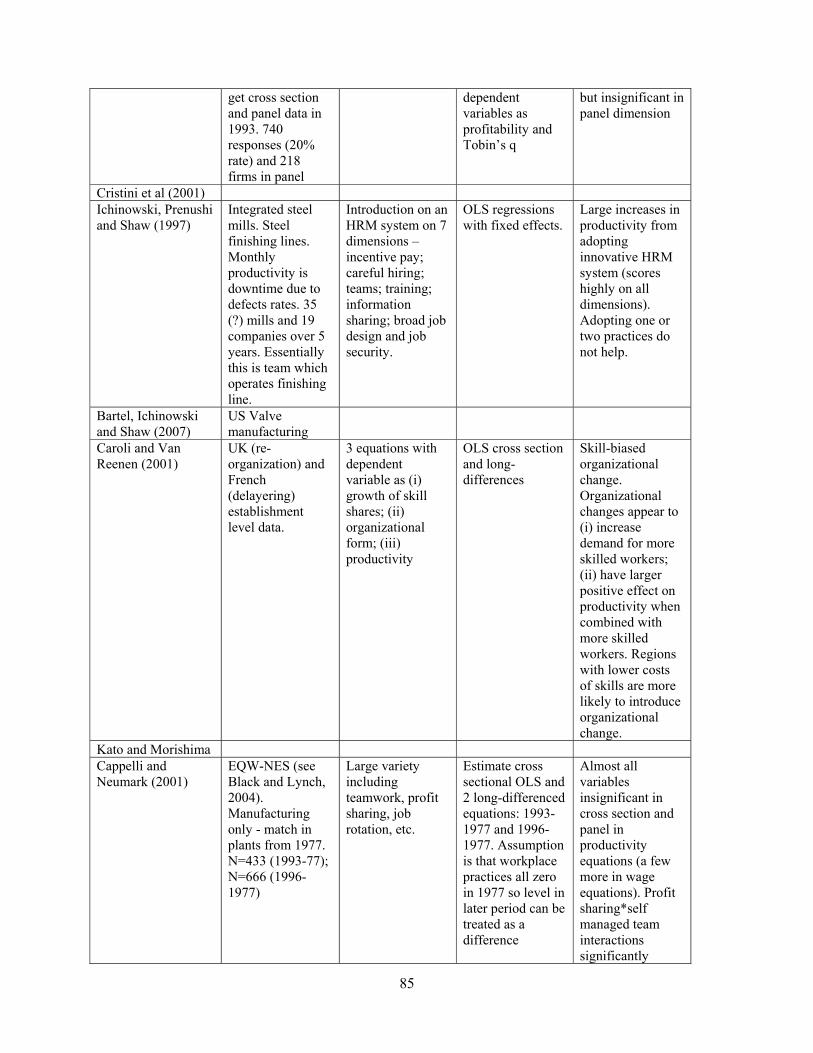
85
get cross section and panel data in 1993. 740 responses (20% rate) and 218 firms in panel
dependent variables as profitability and Tobin’s q
but insignificant in panel dimension
Cristini et al (2001) Ichinowski, Prenushi and Shaw (1997)
Integrated steel mills. Steel finishing lines. Monthly productivity is downtime due to defects rates. 35 (?) mills and 19 companies over 5 years. Essentially this is team which operates finishing line.
Introduction on an HRM system on 7 dimensions – incentive pay; careful hiring; teams; training; information sharing; broad job design and job security.
OLS regressions with fixed effects.
Large increases in productivity from adopting innovative HRM system (scores highly on all dimensions). Adopting one or two practices do not help.
Bartel, Ichinowski and Shaw (2007)
US Valve manufacturing
Caroli and Van Reenen (2001)
UK (re-organization) and French (delayering) establishment level data.
3 equations with dependent variable as (i) growth of skill shares; (ii) organizational form; (iii) productivity
OLS cross section and long-differences
Skill-biased organizational change. Organizational changes appear to (i) increase demand for more skilled workers; (ii) have larger positive effect on productivity when combined with more skilled workers. Regions with lower costs of skills are more likely to introduce organizational change.
Kato and Morishima Cappelli and Neumark (2001)
EQW-NES (see Black and Lynch, 2004). Manufacturing only - match in plants from 1977. N=433 (1993-77); N=666 (1996-1977)
Large variety including teamwork, profit sharing, job rotation, etc.
Estimate cross sectional OLS and 2 long-differenced equations: 1993-1977 and 1996-1977. Assumption is that workplace practices all zero in 1977 so level in later period can be treated as a difference
Almost all variables insignificant in cross section and panel in productivity equations (a few more in wage equations). Profit sharing*self managed team interactions significantly
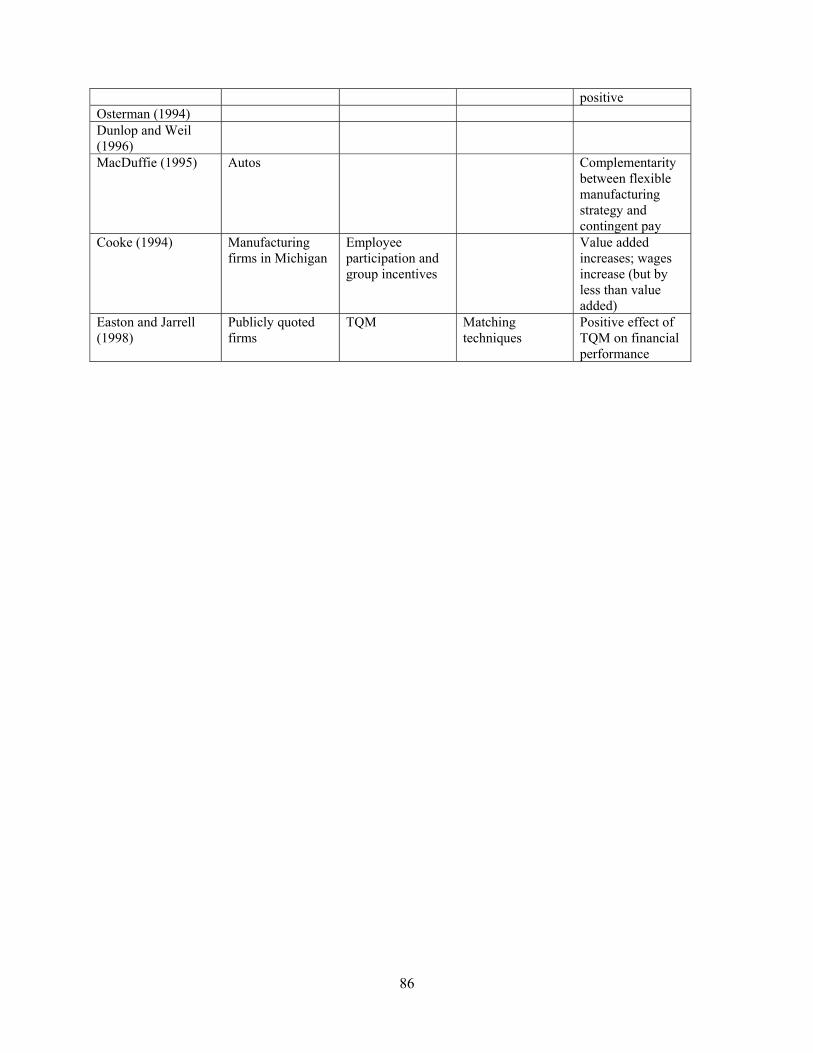
86
positive Osterman (1994) Dunlop and Weil (1996)
MacDuffie (1995) Autos Complementarity between flexible manufacturing strategy and contingent pay
Cooke (1994) Manufacturing firms in Michigan
Employee participation and group incentives
Value added increases; wages increase (but by less than value added)
Easton and Jarrell (1998)
Publicly quoted firms
TQM Matching techniques
Positive effect of TQM on financial performance
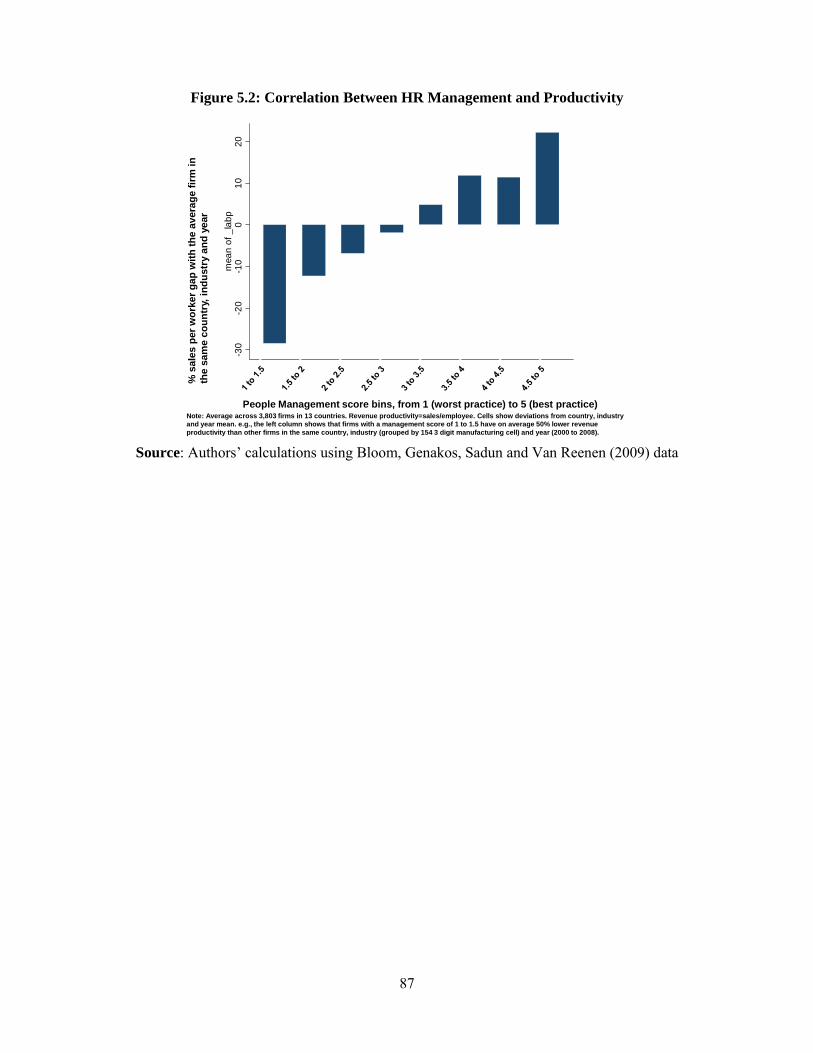
87
Figure 5.2: Correlation Between HR Management and Productivity
-30
-20
-10
010
20m
ean
of _
labp
People Management score bins, from 1 (worst practice) to 5 (best practice)Note: Average across 3,803 firms in 13 countries. Revenue productivity=sales/employee. Cells show deviations from country, industry and year mean. e.g., the left column shows that firms with a management score of 1 to 1.5 have on average 50% lower revenue productivity than other firms in the same country, industry (grouped by 154 3 digit manufacturing cell) and year (2000 to 2008).
% s
ales
per
wor
ker g
ap w
ith th
e av
erag
e fir
m in
th
e sa
me
coun
try,
indu
stry
and
yea
r
Source: Authors’ calculations using Bloom, Genakos, Sadun and Van Reenen (2009) data
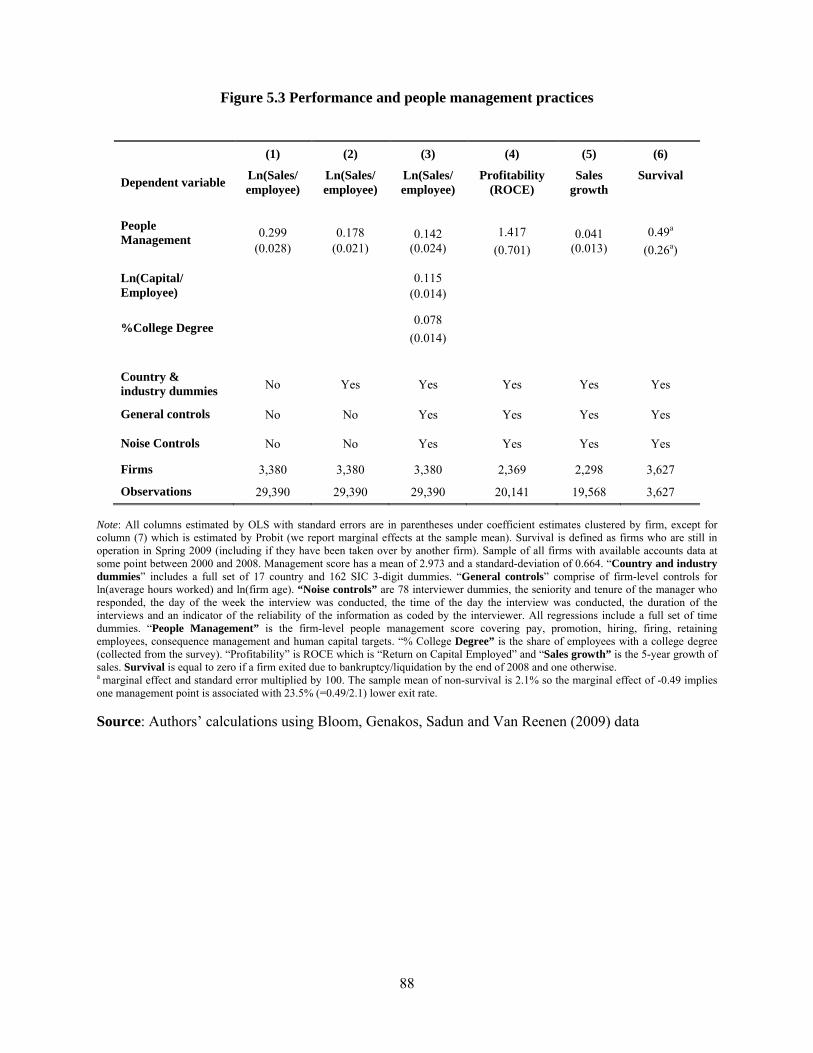
88
Figure 5.3 Performance and people management practices
(1) (2) (3) (4) (5) (6)
Dependent variable Ln(Sales/ employee)
Ln(Sales/ employee)
Ln(Sales/ employee)
Profitability (ROCE)
Sales growth
Survival
People Management
0.299 (0.028)
0.178 (0.021)
0.142 (0.024)
1.417 (0.701)
0.041 (0.013)
0.49a (0.26a)
Ln(Capital/ Employee) 0.115
(0.014)
%College Degree 0.078
(0.014)
Country & industry dummies No Yes Yes Yes Yes Yes
General controls No No Yes Yes Yes Yes
Noise Controls No No Yes Yes Yes Yes
Firms 3,380 3,380 3,380 2,369 2,298 3,627
Observations 29,390 29,390 29,390 20,141 19,568 3,627 Note: All columns estimated by OLS with standard errors are in parentheses under coefficient estimates clustered by firm, except for column (7) which is estimated by Probit (we report marginal effects at the sample mean). Survival is defined as firms who are still in operation in Spring 2009 (including if they have been taken over by another firm). Sample of all firms with available accounts data at some point between 2000 and 2008. Management score has a mean of 2.973 and a standard-deviation of 0.664. “Country and industry dummies” includes a full set of 17 country and 162 SIC 3-digit dummies. “General controls” comprise of firm-level controls for ln(average hours worked) and ln(firm age). “Noise controls” are 78 interviewer dummies, the seniority and tenure of the manager who responded, the day of the week the interview was conducted, the time of the day the interview was conducted, the duration of the interviews and an indicator of the reliability of the information as coded by the interviewer. All regressions include a full set of time dummies. “People Management” is the firm-level people management score covering pay, promotion, hiring, firing, retaining employees, consequence management and human capital targets. “% College Degree” is the share of employees with a college degree (collected from the survey). “Profitability” is ROCE which is “Return on Capital Employed” and “Sales growth” is the 5-year growth of sales. Survival is equal to zero if a firm exited due to bankruptcy/liquidation by the end of 2008 and one otherwise. a marginal effect and standard error multiplied by 100. The sample mean of non-survival is 2.1% so the marginal effect of -0.49 implies one management point is associated with 23.5% (=0.49/2.1) lower exit rate. Source: Authors’ calculations using Bloom, Genakos, Sadun and Van Reenen (2009) data

1
TABLE A1: MANAGEMENT PRACTICE INTERVIEW GUIDE AND EXAMPLE RESPONSES Any score from 1 to 5 can be given, but the scoring guide and examples are only provided for scores of 1, 3 and 5. Multiple questions are used for each dimension to improve scoring accuracy.
(1) Modern manufacturing, introduction a) Can you describe the production process for me?
b) What kinds of lean (modern) manufacturing processes have you introduced? Can you give me specific examples? c) How do you manage inventory levels? What is done to balance the line?
Score 1 Score 3 Score 5 Scoring grid: Other than Just-In-Time (JIT) delivery from
suppliers few modern manufacturing techniques have been introduced, (or have been introduced in an ad-hoc manner)
Some aspects of modern manufacturing techniques have been introduced, through informal/isolated change programs
All major aspects of modern manufacturing have been introduced (Just-In-Time, autonomation, flexible manpower, support systems, attitudes and behaviour) in a formal way
Examples: A UK firm orders in bulk and stores the material on average 6 months before use. The business focuses on quality and not reduction of lead-time or costs. Absolutely no modern manufacturing techniques had been introduced.
A supplier to the army is undergoing a full lean transformation. For 20 years, the company was a specialty supplier to the army, but now they have had to identify other competencies forcing them to compete with lean manufacturers. They have begun adopting specific lean techniques and plan to use full lean by the end of next year.
A US firm has formally introduced all major elements of modern production. It reconfigured the factory floor based on value stream mapping and 5-S principles, broke production into cells, eliminated stockrooms, implemented Kanban, and adopted Takt time analyses to organize workflow [these are all forms of lean/modern manufacturing techniques].
(2) Modern manufacturing, rationale a) Can you take through the rationale to introduce these processes?
b) What factors led to the adoption of these lean (modern) management practices?
Score 1 Score 3 Score 5 Scoring grid: Modern manufacturing techniques were
introduced because others were using them. Modern manufacturing techniques were introduced to reduce costs
Modern manufacturing techniques were introduced to enable us to meet our business objectives (including costs)
Examples: A German firm introduced modern techniques because all its competitors were using these techniques. The business decision had been taken to imitate the competition.
A French firm introduced modern manufacturing methods primarily to reduce costs.
A US firm implemented lean techniques because the COO had worked with them before and knew that they would enable the business to reduce costs, competing with cheaper imports through improved quality, flexible production, greater innovation and JIT delivery.
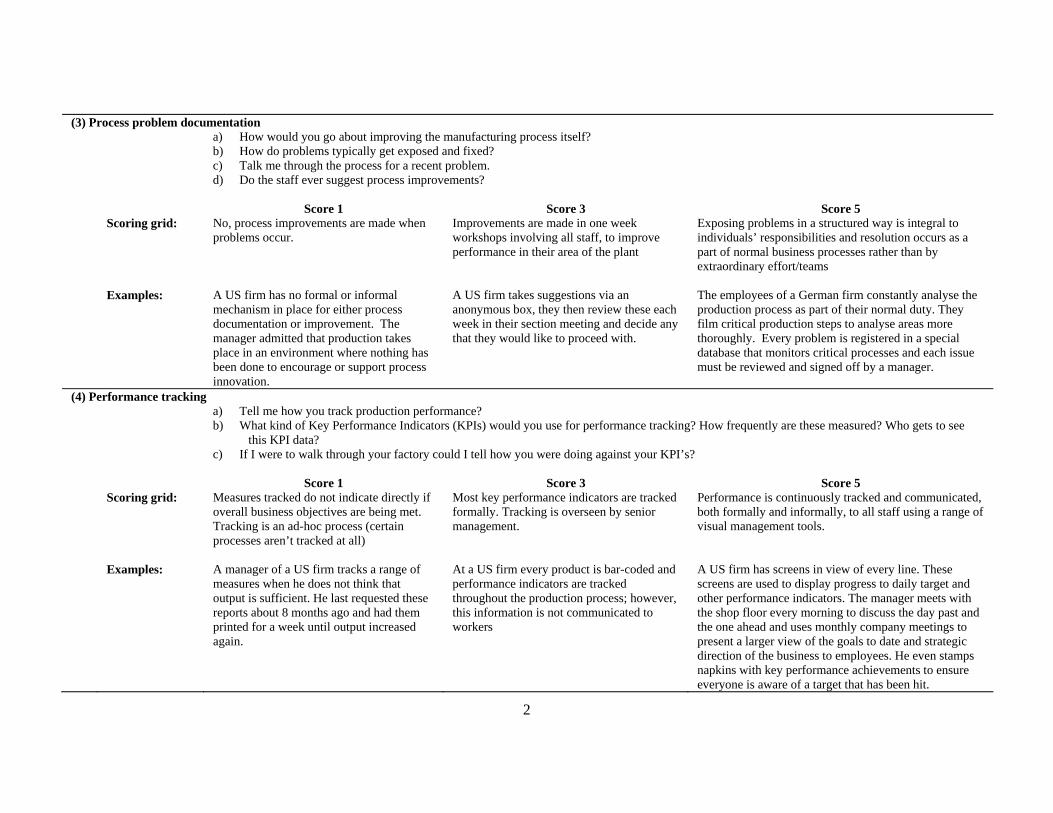
2
(3) Process problem documentation
a) How would you go about improving the manufacturing process itself? b) How do problems typically get exposed and fixed? c) Talk me through the process for a recent problem. d) Do the staff ever suggest process improvements?
Score 1 Score 3 Score 5 Scoring grid: No, process improvements are made when
problems occur. Improvements are made in one week workshops involving all staff, to improve performance in their area of the plant
Exposing problems in a structured way is integral to individuals’ responsibilities and resolution occurs as a part of normal business processes rather than by extraordinary effort/teams
Examples: A US firm has no formal or informal mechanism in place for either process documentation or improvement. The manager admitted that production takes place in an environment where nothing has been done to encourage or support process innovation.
A US firm takes suggestions via an anonymous box, they then review these each week in their section meeting and decide any that they would like to proceed with.
The employees of a German firm constantly analyse the production process as part of their normal duty. They film critical production steps to analyse areas more thoroughly. Every problem is registered in a special database that monitors critical processes and each issue must be reviewed and signed off by a manager.
(4) Performance tracking a) Tell me how you track production performance?
b) What kind of Key Performance Indicators (KPIs) would you use for performance tracking? How frequently are these measured? Who gets to see this KPI data?
c) If I were to walk through your factory could I tell how you were doing against your KPI’s?
Score 1 Score 3 Score 5 Scoring grid: Measures tracked do not indicate directly if
overall business objectives are being met. Tracking is an ad-hoc process (certain processes aren’t tracked at all)
Most key performance indicators are tracked formally. Tracking is overseen by senior management.
Performance is continuously tracked and communicated, both formally and informally, to all staff using a range of visual management tools.
Examples: A manager of a US firm tracks a range of measures when he does not think that output is sufficient. He last requested these reports about 8 months ago and had them printed for a week until output increased again.
At a US firm every product is bar-coded and performance indicators are tracked throughout the production process; however, this information is not communicated to workers
A US firm has screens in view of every line. These screens are used to display progress to daily target and other performance indicators. The manager meets with the shop floor every morning to discuss the day past and the one ahead and uses monthly company meetings to present a larger view of the goals to date and strategic direction of the business to employees. He even stamps napkins with key performance achievements to ensure everyone is aware of a target that has been hit.
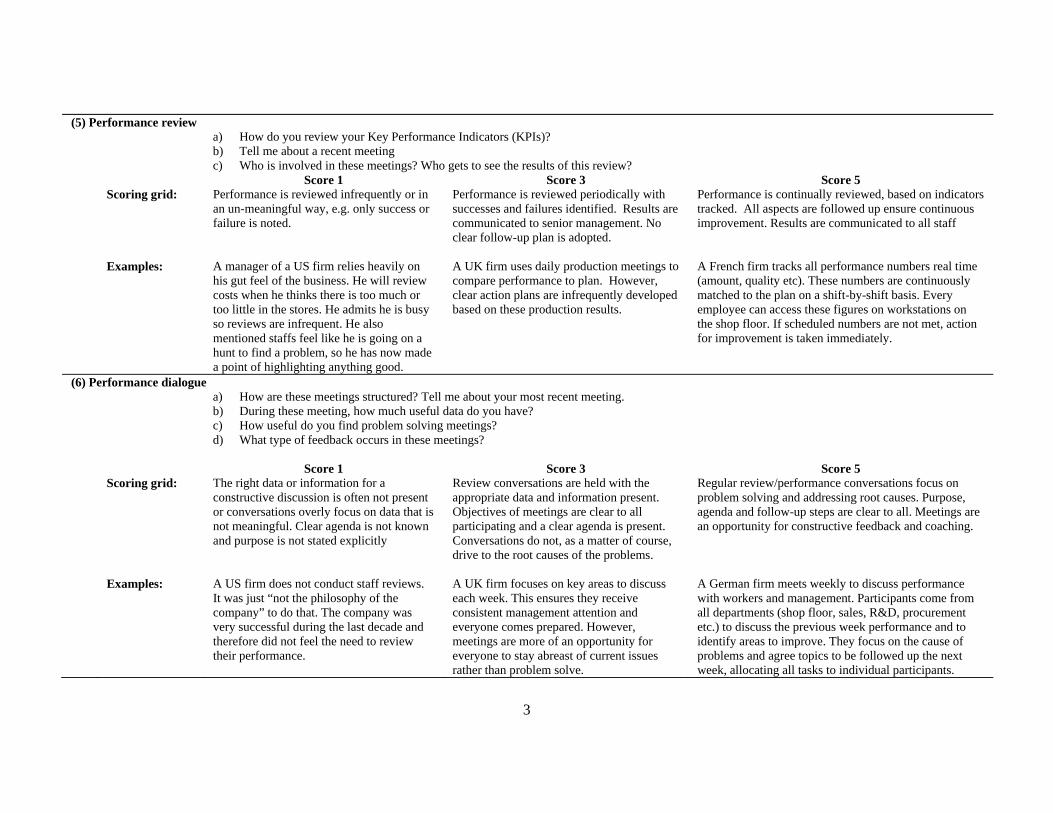
3
(5) Performance review
a) How do you review your Key Performance Indicators (KPIs)? b) Tell me about a recent meeting c) Who is involved in these meetings? Who gets to see the results of this review?
Score 1 Score 3 Score 5 Scoring grid: Performance is reviewed infrequently or in
an un-meaningful way, e.g. only success or failure is noted.
Performance is reviewed periodically with successes and failures identified. Results are communicated to senior management. No clear follow-up plan is adopted.
Performance is continually reviewed, based on indicators tracked. All aspects are followed up ensure continuous improvement. Results are communicated to all staff
Examples: A manager of a US firm relies heavily on his gut feel of the business. He will review costs when he thinks there is too much or too little in the stores. He admits he is busy so reviews are infrequent. He also mentioned staffs feel like he is going on a hunt to find a problem, so he has now made a point of highlighting anything good.
A UK firm uses daily production meetings to compare performance to plan. However, clear action plans are infrequently developed based on these production results.
A French firm tracks all performance numbers real time (amount, quality etc). These numbers are continuously matched to the plan on a shift-by-shift basis. Every employee can access these figures on workstations on the shop floor. If scheduled numbers are not met, action for improvement is taken immediately.
(6) Performance dialogue a) How are these meetings structured? Tell me about your most recent meeting.
b) During these meeting, how much useful data do you have? c) How useful do you find problem solving meetings? d) What type of feedback occurs in these meetings?
Score 1 Score 3 Score 5 Scoring grid: The right data or information for a
constructive discussion is often not present or conversations overly focus on data that is not meaningful. Clear agenda is not known and purpose is not stated explicitly
Review conversations are held with the appropriate data and information present. Objectives of meetings are clear to all participating and a clear agenda is present. Conversations do not, as a matter of course, drive to the root causes of the problems.
Regular review/performance conversations focus on problem solving and addressing root causes. Purpose, agenda and follow-up steps are clear to all. Meetings are an opportunity for constructive feedback and coaching.
Examples: A US firm does not conduct staff reviews. It was just “not the philosophy of the company” to do that. The company was very successful during the last decade and therefore did not feel the need to review their performance.
A UK firm focuses on key areas to discuss each week. This ensures they receive consistent management attention and everyone comes prepared. However, meetings are more of an opportunity for everyone to stay abreast of current issues rather than problem solve.
A German firm meets weekly to discuss performance with workers and management. Participants come from all departments (shop floor, sales, R&D, procurement etc.) to discuss the previous week performance and to identify areas to improve. They focus on the cause of problems and agree topics to be followed up the next week, allocating all tasks to individual participants.
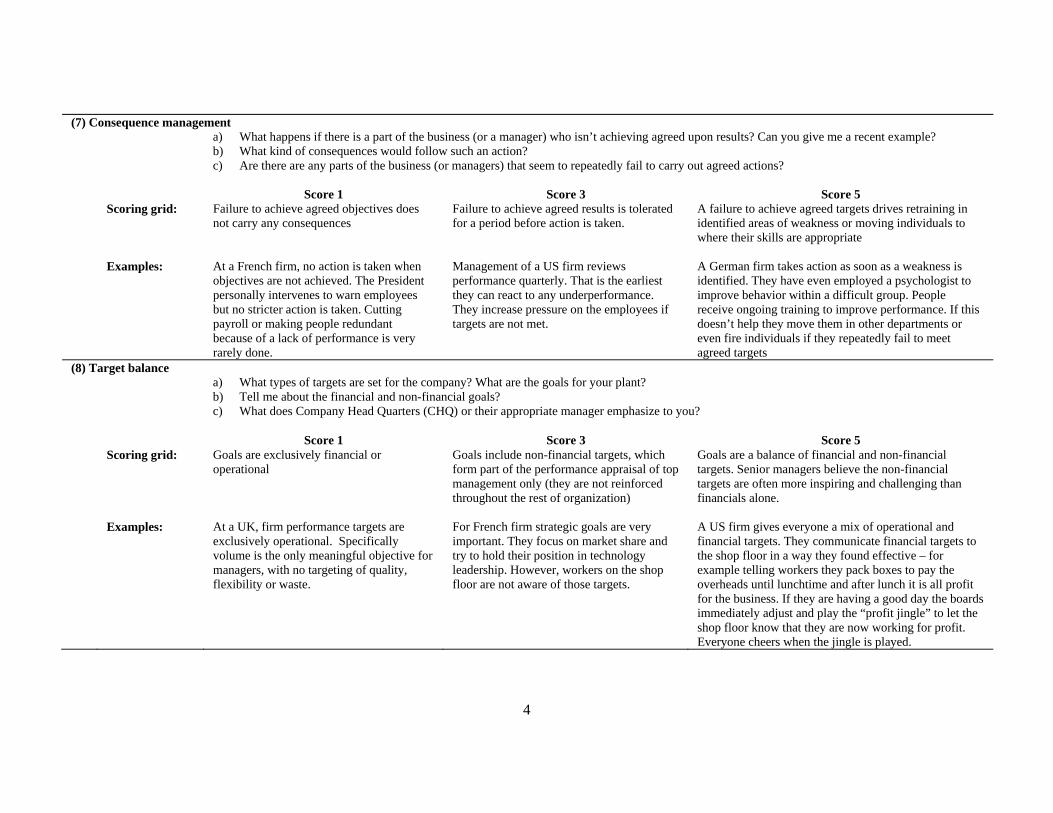
4
(7) Consequence management
a) What happens if there is a part of the business (or a manager) who isn’t achieving agreed upon results? Can you give me a recent example? b) What kind of consequences would follow such an action? c) Are there are any parts of the business (or managers) that seem to repeatedly fail to carry out agreed actions?
Score 1 Score 3 Score 5 Scoring grid: Failure to achieve agreed objectives does
not carry any consequences Failure to achieve agreed results is tolerated for a period before action is taken.
A failure to achieve agreed targets drives retraining in identified areas of weakness or moving individuals to where their skills are appropriate
Examples: At a French firm, no action is taken when objectives are not achieved. The President personally intervenes to warn employees but no stricter action is taken. Cutting payroll or making people redundant because of a lack of performance is very rarely done.
Management of a US firm reviews performance quarterly. That is the earliest they can react to any underperformance. They increase pressure on the employees if targets are not met.
A German firm takes action as soon as a weakness is identified. They have even employed a psychologist to improve behavior within a difficult group. People receive ongoing training to improve performance. If this doesn’t help they move them in other departments or even fire individuals if they repeatedly fail to meet agreed targets
(8) Target balance a) What types of targets are set for the company? What are the goals for your plant?
b) Tell me about the financial and non-financial goals? c) What does Company Head Quarters (CHQ) or their appropriate manager emphasize to you?
Score 1 Score 3 Score 5 Scoring grid: Goals are exclusively financial or
operational Goals include non-financial targets, which form part of the performance appraisal of top management only (they are not reinforced throughout the rest of organization)
Goals are a balance of financial and non-financial targets. Senior managers believe the non-financial targets are often more inspiring and challenging than financials alone.
Examples: At a UK, firm performance targets are exclusively operational. Specifically volume is the only meaningful objective for managers, with no targeting of quality, flexibility or waste.
For French firm strategic goals are very important. They focus on market share and try to hold their position in technology leadership. However, workers on the shop floor are not aware of those targets.
A US firm gives everyone a mix of operational and financial targets. They communicate financial targets to the shop floor in a way they found effective – for example telling workers they pack boxes to pay the overheads until lunchtime and after lunch it is all profit for the business. If they are having a good day the boards immediately adjust and play the “profit jingle” to let the shop floor know that they are now working for profit. Everyone cheers when the jingle is played.
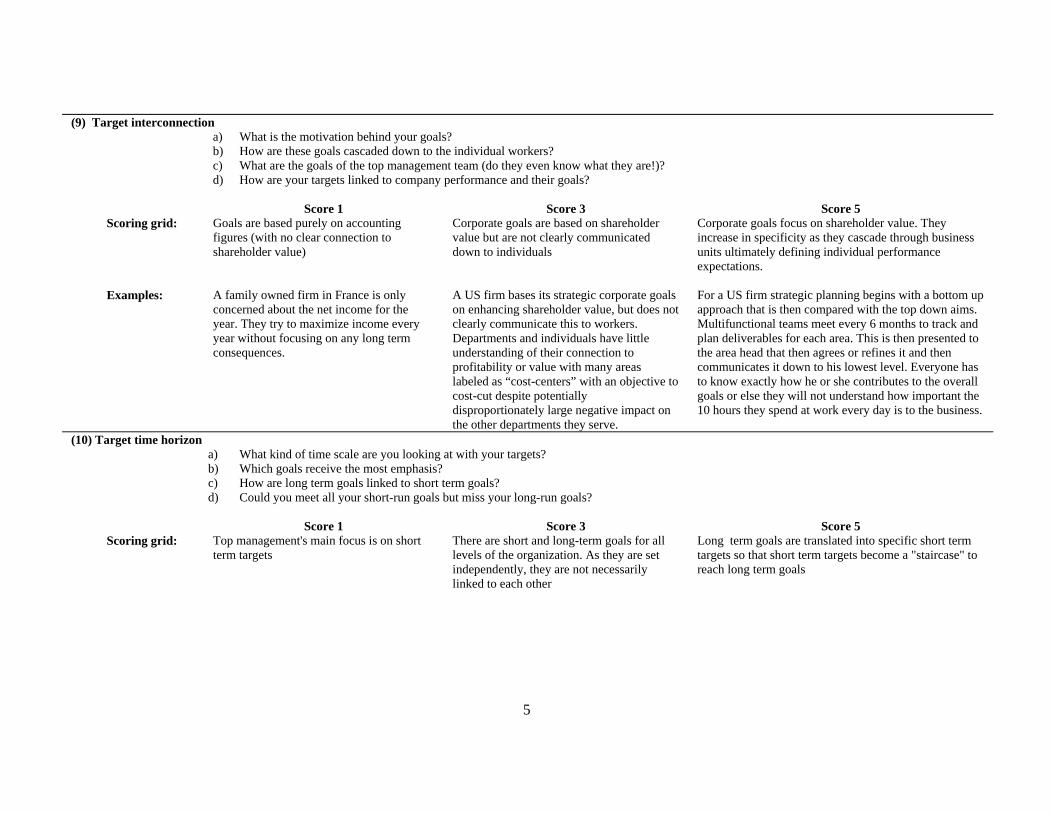
5
(9) Target interconnection a) What is the motivation behind your goals?
b) How are these goals cascaded down to the individual workers? c) What are the goals of the top management team (do they even know what they are!)? d) How are your targets linked to company performance and their goals?
Score 1 Score 3 Score 5 Scoring grid: Goals are based purely on accounting
figures (with no clear connection to shareholder value)
Corporate goals are based on shareholder value but are not clearly communicated down to individuals
Corporate goals focus on shareholder value. They increase in specificity as they cascade through business units ultimately defining individual performance expectations.
Examples: A family owned firm in France is only concerned about the net income for the year. They try to maximize income every year without focusing on any long term consequences.
A US firm bases its strategic corporate goals on enhancing shareholder value, but does not clearly communicate this to workers. Departments and individuals have little understanding of their connection to profitability or value with many areas labeled as “cost-centers” with an objective to cost-cut despite potentially disproportionately large negative impact on the other departments they serve.
For a US firm strategic planning begins with a bottom up approach that is then compared with the top down aims. Multifunctional teams meet every 6 months to track and plan deliverables for each area. This is then presented to the area head that then agrees or refines it and then communicates it down to his lowest level. Everyone has to know exactly how he or she contributes to the overall goals or else they will not understand how important the 10 hours they spend at work every day is to the business.
(10) Target time horizon a) What kind of time scale are you looking at with your targets?
b) Which goals receive the most emphasis? c) How are long term goals linked to short term goals? d) Could you meet all your short-run goals but miss your long-run goals?
Score 1 Score 3 Score 5 Scoring grid: Top management's main focus is on short
term targets There are short and long-term goals for all levels of the organization. As they are set independently, they are not necessarily linked to each other
Long term goals are translated into specific short term targets so that short term targets become a "staircase" to reach long term goals
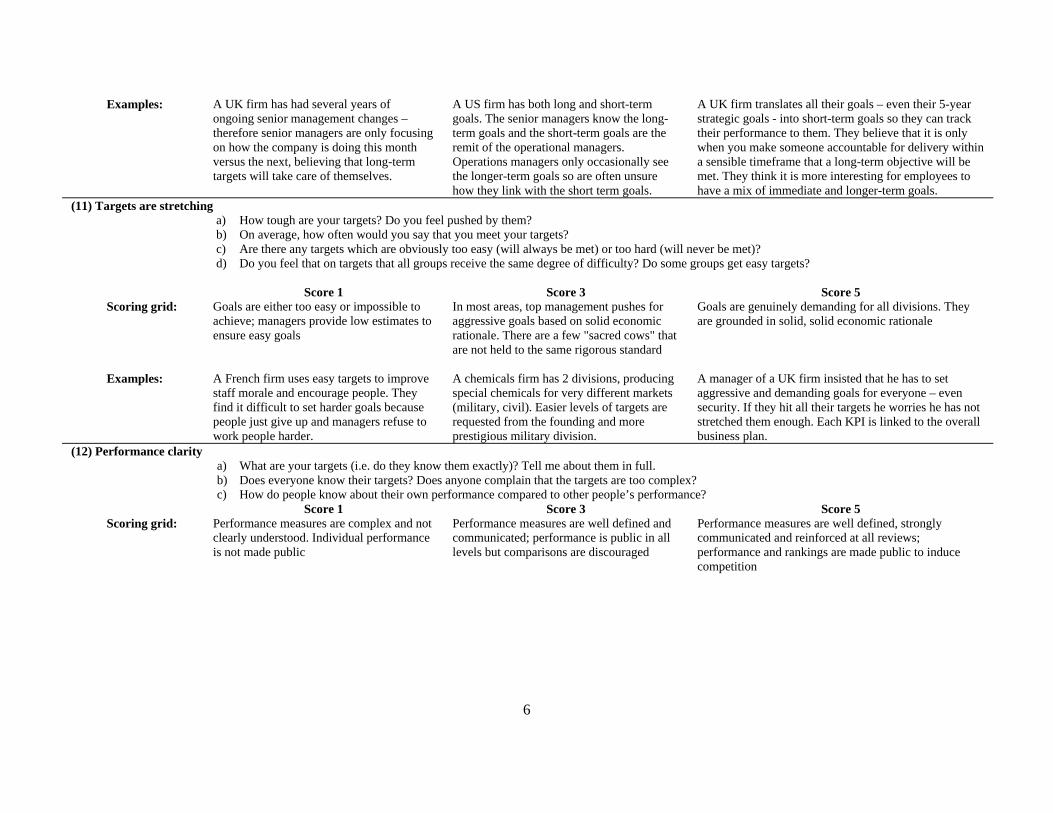
6
Examples: A UK firm has had several years of ongoing senior management changes – therefore senior managers are only focusing on how the company is doing this month versus the next, believing that long-term targets will take care of themselves.
A US firm has both long and short-term goals. The senior managers know the long-term goals and the short-term goals are the remit of the operational managers. Operations managers only occasionally see the longer-term goals so are often unsure how they link with the short term goals.
A UK firm translates all their goals – even their 5-year strategic goals - into short-term goals so they can track their performance to them. They believe that it is only when you make someone accountable for delivery within a sensible timeframe that a long-term objective will be met. They think it is more interesting for employees to have a mix of immediate and longer-term goals.
(11) Targets are stretching a) How tough are your targets? Do you feel pushed by them?
b) On average, how often would you say that you meet your targets? c) Are there any targets which are obviously too easy (will always be met) or too hard (will never be met)? d) Do you feel that on targets that all groups receive the same degree of difficulty? Do some groups get easy targets?
Score 1 Score 3 Score 5 Scoring grid: Goals are either too easy or impossible to
achieve; managers provide low estimates to ensure easy goals
In most areas, top management pushes for aggressive goals based on solid economic rationale. There are a few "sacred cows" that are not held to the same rigorous standard
Goals are genuinely demanding for all divisions. They are grounded in solid, solid economic rationale
Examples: A French firm uses easy targets to improve staff morale and encourage people. They find it difficult to set harder goals because people just give up and managers refuse to work people harder.
A chemicals firm has 2 divisions, producing special chemicals for very different markets (military, civil). Easier levels of targets are requested from the founding and more prestigious military division.
A manager of a UK firm insisted that he has to set aggressive and demanding goals for everyone – even security. If they hit all their targets he worries he has not stretched them enough. Each KPI is linked to the overall business plan.
(12) Performance clarity a) What are your targets (i.e. do they know them exactly)? Tell me about them in full.
b) Does everyone know their targets? Does anyone complain that the targets are too complex? c) How do people know about their own performance compared to other people’s performance?
Score 1 Score 3 Score 5 Scoring grid: Performance measures are complex and not
clearly understood. Individual performance is not made public
Performance measures are well defined and communicated; performance is public in all levels but comparisons are discouraged
Performance measures are well defined, strongly communicated and reinforced at all reviews; performance and rankings are made public to induce competition
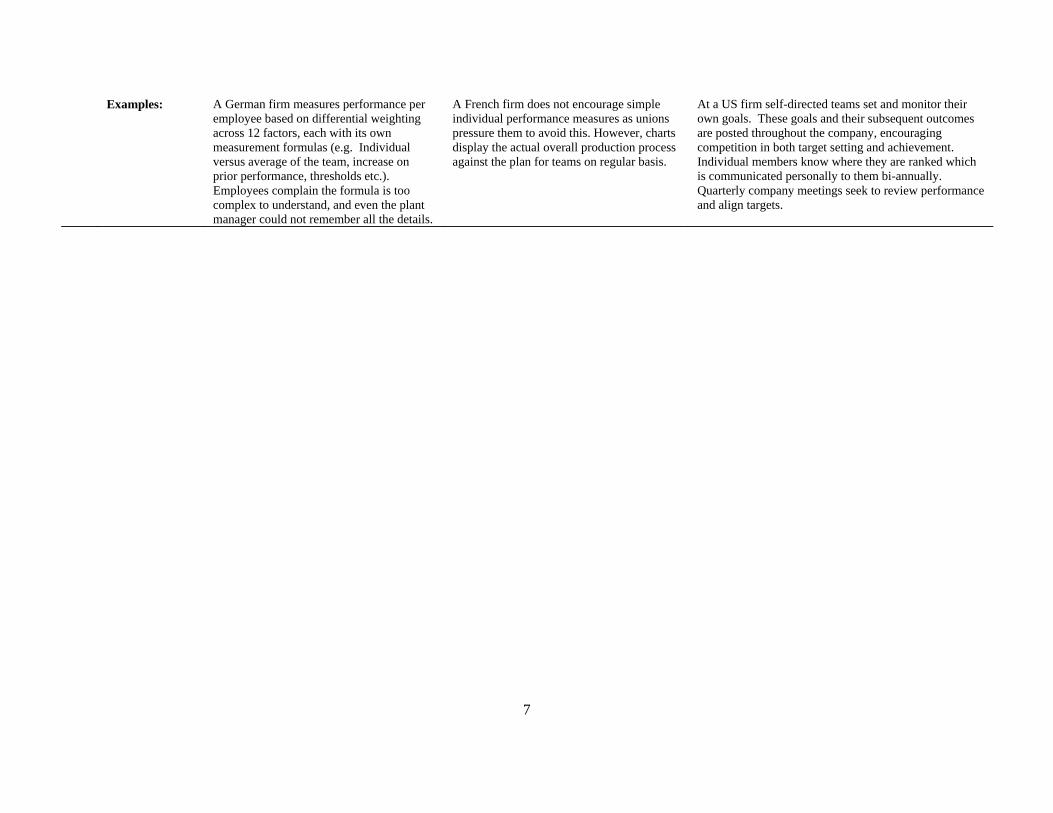
7
Examples: A German firm measures performance per employee based on differential weighting across 12 factors, each with its own measurement formulas (e.g. Individual versus average of the team, increase on prior performance, thresholds etc.). Employees complain the formula is too complex to understand, and even the plant manager could not remember all the details.
A French firm does not encourage simple individual performance measures as unions pressure them to avoid this. However, charts display the actual overall production process against the plan for teams on regular basis.
At a US firm self-directed teams set and monitor their own goals. These goals and their subsequent outcomes are posted throughout the company, encouraging competition in both target setting and achievement. Individual members know where they are ranked which is communicated personally to them bi-annually. Quarterly company meetings seek to review performance and align targets.
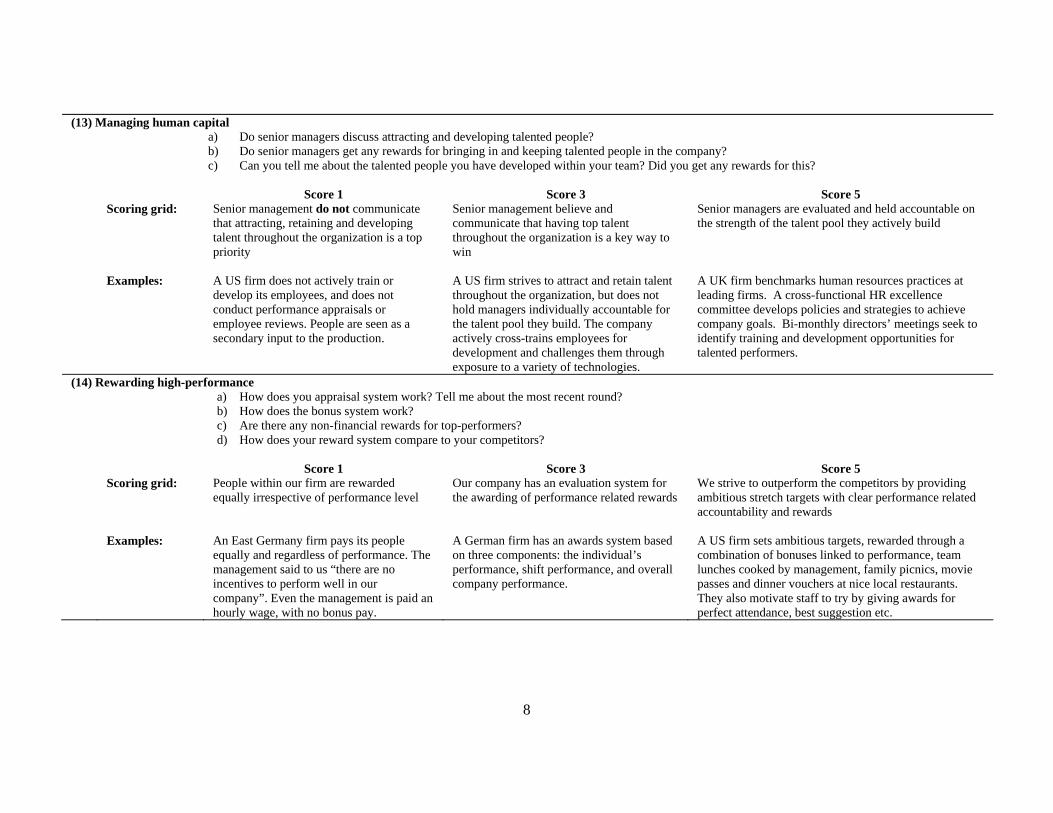
8
(13) Managing human capital a) Do senior managers discuss attracting and developing talented people?
b) Do senior managers get any rewards for bringing in and keeping talented people in the company? c) Can you tell me about the talented people you have developed within your team? Did you get any rewards for this?
Score 1 Score 3 Score 5 Scoring grid: Senior management do not communicate
that attracting, retaining and developing talent throughout the organization is a top priority
Senior management believe and communicate that having top talent throughout the organization is a key way to win
Senior managers are evaluated and held accountable on the strength of the talent pool they actively build
Examples: A US firm does not actively train or develop its employees, and does not conduct performance appraisals or employee reviews. People are seen as a secondary input to the production.
A US firm strives to attract and retain talent throughout the organization, but does not hold managers individually accountable for the talent pool they build. The company actively cross-trains employees for development and challenges them through exposure to a variety of technologies.
A UK firm benchmarks human resources practices at leading firms. A cross-functional HR excellence committee develops policies and strategies to achieve company goals. Bi-monthly directors’ meetings seek to identify training and development opportunities for talented performers.
(14) Rewarding high-performance a) How does you appraisal system work? Tell me about the most recent round?
b) How does the bonus system work? c) Are there any non-financial rewards for top-performers? d) How does your reward system compare to your competitors?
Score 1 Score 3 Score 5 Scoring grid: People within our firm are rewarded
equally irrespective of performance level Our company has an evaluation system for the awarding of performance related rewards
We strive to outperform the competitors by providing ambitious stretch targets with clear performance related accountability and rewards
Examples: An East Germany firm pays its people equally and regardless of performance. The management said to us “there are no incentives to perform well in our company”. Even the management is paid an hourly wage, with no bonus pay.
A German firm has an awards system based on three components: the individual’s performance, shift performance, and overall company performance.
A US firm sets ambitious targets, rewarded through a combination of bonuses linked to performance, team lunches cooked by management, family picnics, movie passes and dinner vouchers at nice local restaurants. They also motivate staff to try by giving awards for perfect attendance, best suggestion etc.
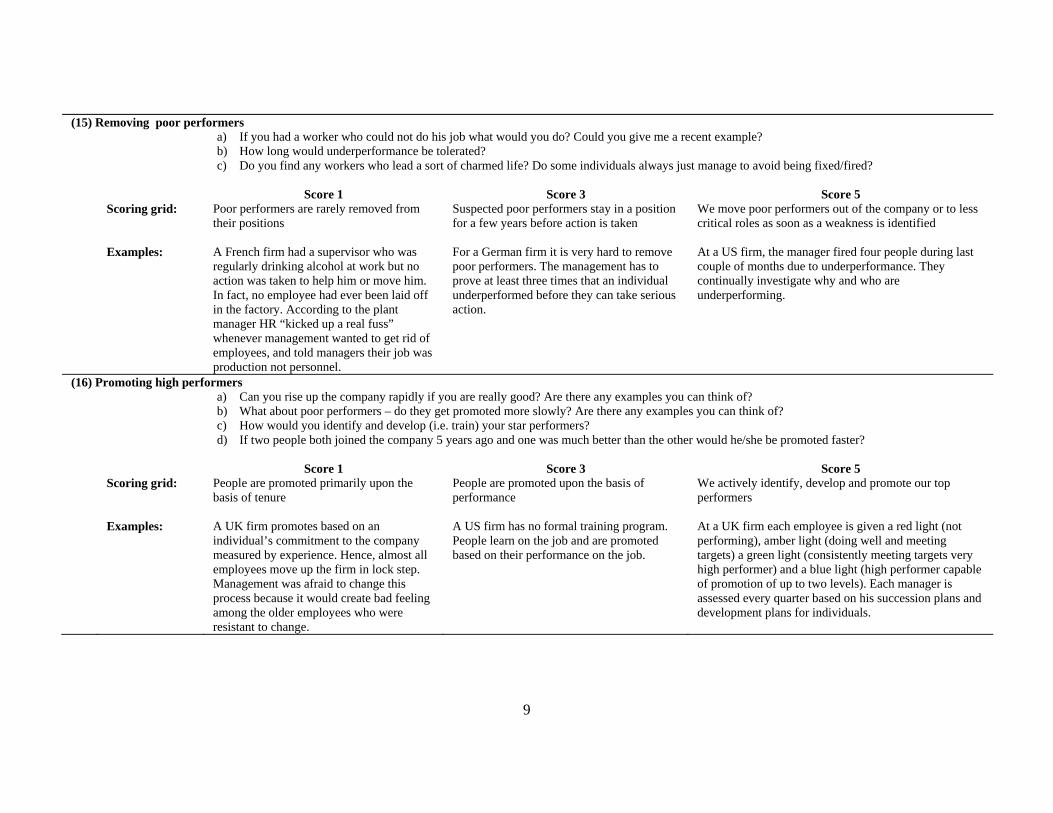
9
(15) Removing poor performers a) If you had a worker who could not do his job what would you do? Could you give me a recent example?
b) How long would underperformance be tolerated? c) Do you find any workers who lead a sort of charmed life? Do some individuals always just manage to avoid being fixed/fired?
Score 1 Score 3 Score 5 Scoring grid: Poor performers are rarely removed from
their positions Suspected poor performers stay in a position for a few years before action is taken
We move poor performers out of the company or to less critical roles as soon as a weakness is identified
Examples: A French firm had a supervisor who was regularly drinking alcohol at work but no action was taken to help him or move him. In fact, no employee had ever been laid off in the factory. According to the plant manager HR “kicked up a real fuss” whenever management wanted to get rid of employees, and told managers their job was production not personnel.
For a German firm it is very hard to remove poor performers. The management has to prove at least three times that an individual underperformed before they can take serious action.
At a US firm, the manager fired four people during last couple of months due to underperformance. They continually investigate why and who are underperforming.
(16) Promoting high performers a) Can you rise up the company rapidly if you are really good? Are there any examples you can think of?
b) What about poor performers – do they get promoted more slowly? Are there any examples you can think of? c) How would you identify and develop (i.e. train) your star performers? d) If two people both joined the company 5 years ago and one was much better than the other would he/she be promoted faster?
Score 1 Score 3 Score 5 Scoring grid: People are promoted primarily upon the
basis of tenure People are promoted upon the basis of performance
We actively identify, develop and promote our top performers
Examples: A UK firm promotes based on an individual’s commitment to the company measured by experience. Hence, almost all employees move up the firm in lock step. Management was afraid to change this process because it would create bad feeling among the older employees who were resistant to change.
A US firm has no formal training program. People learn on the job and are promoted based on their performance on the job.
At a UK firm each employee is given a red light (not performing), amber light (doing well and meeting targets) a green light (consistently meeting targets very high performer) and a blue light (high performer capable of promotion of up to two levels). Each manager is assessed every quarter based on his succession plans and development plans for individuals.
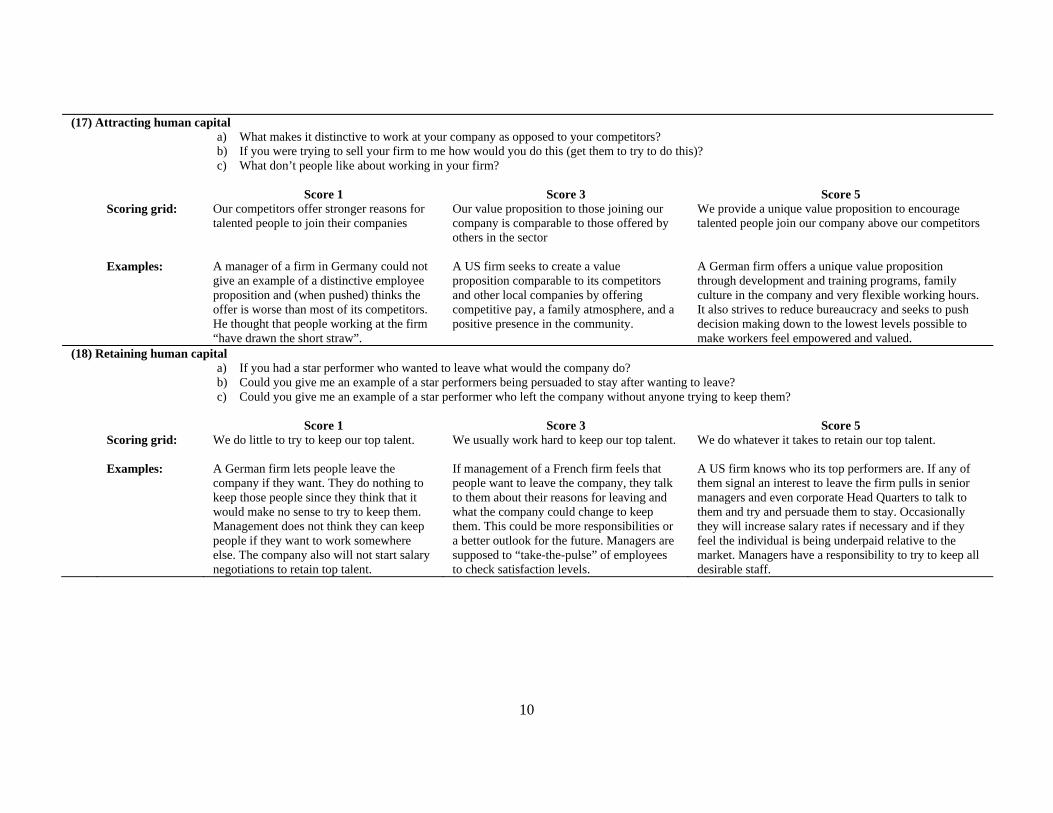
10
(17) Attracting human capital a) What makes it distinctive to work at your company as opposed to your competitors?
b) If you were trying to sell your firm to me how would you do this (get them to try to do this)? c) What don’t people like about working in your firm?
Score 1 Score 3 Score 5 Scoring grid: Our competitors offer stronger reasons for
talented people to join their companies Our value proposition to those joining our company is comparable to those offered by others in the sector
We provide a unique value proposition to encourage talented people join our company above our competitors
Examples: A manager of a firm in Germany could not give an example of a distinctive employee proposition and (when pushed) thinks the offer is worse than most of its competitors. He thought that people working at the firm “have drawn the short straw”.
A US firm seeks to create a value proposition comparable to its competitors and other local companies by offering competitive pay, a family atmosphere, and a positive presence in the community.
A German firm offers a unique value proposition through development and training programs, family culture in the company and very flexible working hours. It also strives to reduce bureaucracy and seeks to push decision making down to the lowest levels possible to make workers feel empowered and valued.
(18) Retaining human capital a) If you had a star performer who wanted to leave what would the company do?
b) Could you give me an example of a star performers being persuaded to stay after wanting to leave? c) Could you give me an example of a star performer who left the company without anyone trying to keep them?
Score 1 Score 3 Score 5 Scoring grid:
We do little to try to keep our top talent. We usually work hard to keep our top talent. We do whatever it takes to retain our top talent.
Examples: A German firm lets people leave the company if they want. They do nothing to keep those people since they think that it would make no sense to try to keep them. Management does not think they can keep people if they want to work somewhere else. The company also will not start salary negotiations to retain top talent.
If management of a French firm feels that people want to leave the company, they talk to them about their reasons for leaving and what the company could change to keep them. This could be more responsibilities or a better outlook for the future. Managers are supposed to “take-the-pulse” of employees to check satisfaction levels.
A US firm knows who its top performers are. If any of them signal an interest to leave the firm pulls in senior managers and even corporate Head Quarters to talk to them and try and persuade them to stay. Occasionally they will increase salary rates if necessary and if they feel the individual is being underpaid relative to the market. Managers have a responsibility to try to keep all desirable staff.

11
TABLE A2: DETAILS OF THE DECENTRALIZATION SURVEY QUESTIONS
For Questions D1, D3 and D4 any score can be given, but the scoring guide is only provided for scores of 1, 3 and 5.Question D1: “To hire a FULL-TIME PERMANENT SHOPFLOOR worker what agreement would your plant need from CHQ (Central Head Quarters)?” Probe until you can accurately score the question – for example if they say “It is my decision, but I need sign-off from corporate HQ.” ask “How often would sign-off be given?” Score 1 Score 3 Score 5 Scoring
grid: No authority – even for replacement hires
Requires sign-off from CHQ based on the business case. Typically agreed (i.e. about 80% or 90% of the time).
Complete authority – it is my decision entirely
Question D2: “What is the largest CAPITAL INVESTMENT your plant could make without prior authorization from CHQ?” Notes: (a) Ignore form-filling (b) Please cross check any zero response by asking “What about buying a new computer – would that be possible?”, and then probe…. (c) Challenge any very large numbers (e.g. >$¼m in US) by asking “To confirm your plant could spend $X on a new piece of equipment without prior clearance from CHQ?” (d) Use the national currency and do not omit zeros (i.e. for a US firm twenty thousand dollars would be 20000). Question D3: “Where are decisions taken on new product introductions – at the plant, at the CHQ or both”? Probe until you can accurately score the question – for example if they say “It is complex, we both play a role “ask “Could you talk me through the process for a recent product innovation?” Score 1 Score 3 Score 5 Scoring
grid: All new product introduction decisions are taken at the CHQ
New product introductions are jointly determined by the plant and CHQ
All new product introduction decisions taken at the plant level
Question D4: “How much of sales and marketing is carried out at the plant level (rather than at the CHQ)”? Probe until you can accurately score the question. Also take an average score for sales and marketing if they are taken at different levels. Score 1 Score 3 Score 5 Scoring
grid: None – sales and marketing is all run by CHQ
Sales and marketing decisions are split between the plant and CHQ
The plant runs all sales and marketing
Question D5: “Is the CHQ on the site being interviewed”? Question D6: “How much do managers decide how tasks are allocated across workers in their teams” Interviewers are read out the following five options, with our scoring for these note above:
Score 1 Score 2 Score 3 Score 4 Score 5 All managers
Mostly managers
About equal Mostly workers
All workers
Question D7: “Who decides the pace of work on the shopfloor” Interviewers are read out the following five options, with “customer demand” an additional not read-out option
Score 1 Score 2 Score 3 Score 4 Score 5 All managers
Mostly managers
About equal Mostly workers
All workers
Source: Bloom, Garicano, Sadun and Van Reenen (2009) Notes: The electronic survey, training materials and survey video footage are available on http://cep.lse.ac.uk/management/default.asp