Embed Size (px)
Citation preview

CENTERS FOR DISEASE CONTROL August 24, 1984 / Vol. 33 / No. 33
469 Human Rabies — Texas 471 Cutaneous Nocardiosis in Cancer
Patients Receiving Immunotherapy Injections — Bahamas
477 Brain Cancer — Texas
MORBIDITY AND MORTALITY WEEKLY REPORT
Epidemiologic Notes and Reports
Human Rabies — Texas
The first case of human rabies occurring in the United States since March 1983 was diagnosed July 27, 1984, in Houston, Texas. The patient, a 12-year-old Laotian refugee, had no known history of exposure to a rabid animal and had not traveled outside Texas since arriving in the United States in 1 980.
The patient was in good health until July 11, when she complained of a headache. Over the next 4 days, she developed a sore throat, fever, fatigue, difficulty swallowing, and, finally, leg weakness. She was admitted to a community hospital in Houston on July 1 5. Initial evaluation disclosed a fever of 40 C (104 F), pharyngitis, retropharyngeal air, and a pneumomediastinum. The heart rate fluctuated between 100 beats/minute at rest to 280/minute when the patient was moved. She was treated for presumptive sepsis with antibiotics and corticosteroids. The following day, she was transferred to a university hospital because of the extreme lability of her heart rate and blood pressure. Provisional admitting diagnosis was Guillain-Barre syndrome. The patient was alert and oriented. There were no symptoms or signs except inability to swallow saliva and generalized weakness, more pronounced in the lower extemities; sensory examination was normal. Lumbar puncture revealed normal opening pressure, cell count, and protein. The patient was intubated because of profuse oral secretions, but rapidly became ventilator-dependent. On July 20, increased agitation was noted. Over the next 3 days, periods of decreased alertness and inability to follow commands developed. On July 24, her pupils became dilated and nonreactive to light. A brain biopsy was performed on July 27 after herpes simplex virus was recovered from a throat culture and a temporal focus of seizure activity developed on a repeat EEG. Histopathology revealed eosinophylic intracytcplas- mic inclusions; electron microscopy revealed rhabdovirus, and the diagnosis of rabies was confirmed by fluorescent antibody testing. Experimental therapy with ribavirin was initiated. The patient died August 8, 27 days after onset of illness.
Sera and cerebrospinal fluid (CSF) were tested at CDC for rabies neutralizing antibodies using the rapid fluorescent focus inhibition test. On July 21, day 11 of illness, serum titer was lower than 1:5; on July 28, day 1 8, it had risen to 1 :280. Appearance of neutralizing antibody in the serum may have been delayed because of the administration of corticosteroids early in the illness. CSF revealed a 1:11 titer on July 25. Rabies virus was isolated from a second
U.S. DEPARTMENT OF HEALTH AND HUMAN SERVICES / PUBLIC HEALTH SERVICE

August 24, 1984
Human Rabies — C ontinued
brain biopsy obtained on July 31. Monoclonal antibody studies of the isolate have shown it to be a classic rabies virus, but it does not resemble two of the most common rabies virus substrains isolated in Texas from the Mexican free-tailed bat or from Texas skunks.
A total of 142 individuals (123 medical and paramedical personnel and 19 friends and family) with some degree of contact with the patient received postexposure prophylaxis. Reported by D Swanson, MD, R Feigin, MD, L Tanney, MD, M Feingold, MD, D Anderson, MD, C Baker, MD, L Jefferson, MD, V Knight, MD, J Laurent, MD, J Parke, MD, D Seavy, / Solis MD, Texas Children's Hospital, W Hill, MD, X Jones, R Wende, MD, Sam Houston Community Hospital, J Haughton, MD, J Baird, MPH, M Lugo-Faria, MD, G Reeve, PhD, M Wilson, MD, D Harrison, City o f Houston Dept o f Public Health, T Betz, MD, C Alexander, MD, Texas Dept o f Health; D iv o f Viral Diseases, Center for Infectious Diseases, CDC.Editorial Note: No more than five cases per year of human rabies have been reported in the United States since 1960. Despite its rarity, rabies should be considered in the differential diagnosis of progressive neurologic diseases, even in the absence of furious behavior, classic hydrophobia, or history of exposure.
In the present case, the pathogenesis of the retropharyngeal and mediastinal emphysema is unknown. The patient had many features of the less common paralytic form of rabies, in which hyperactivity is absent and paralysis dominates the clinical picture (7). The paralysis may ascend, as in the present case, mimicking Guillain-Barre syndrome. This presentation occurs in approximately 20% of human rabies cases, and appears more often after exposure to rabid bats and possibly after postexposure therapy with nerve-tissue vaccines available in some countries outside the United States.
The patient had no history of exposure to an animal known or suspected to be rabid before or after arrival in the United States. The possibility of acquisition outside the United States is remote. Although an exposure can be identified in most cases of rabies, no exposure has been identified in eight (19%) of the 43 cases occurring in the United States from 1960 through the present (2). Incubation periods of less than 1 year are found in 99% of cases; the longest well-documented incubation period was 701 days (3).
The large number of persons receiving postexposure prophylaxis because of contact with the patient demonstrates that tremendous costs may be incurred as a result of undiagnosed cases. The cost of a single postexposure regimen of five doses of human diploid cell rabies vaccine and 20 lU/kg of human rabies immune globulin is approximately $ 4 0 0 for the biologies alone. Postexposure therapy is indicated in certain circumstances after contact with a human rabies ca$e. Although never reported, the theoretic possibility of human-to-human bite transmission exists, as does that of nonbite transmission by contamination of scratches, abrasions, or open wounds with potentially infectious material, such as saliva, urine, or brain tissue. Transmission between humans has only been documented in four persons who received corneal transplants from donors who died of undiagnosed rabies encephalitis. Once rabies is suspected, adherence to contact isolation procedures (4) can markedly reduce the need for postexposure therapy in health-care workers. Each potential exposure to human rabies should be carefully evaluated to minimize unnecessary rabies prophylaxis (5).References1. Chopra JS, Banerjee AK, Murthy JMK, Pal SR. Paralytic rabies. A clinico-pathological study. Brain
1980;103:789-802.2. Anderson LJ, Nicholson KG, Tauxe RV, Winkler WG. Human rabies in the United States 1 960-1 979:
epidemiology, diagnosis, and prevention. Ann Intern Med 1984; 100:728-35.3. CDC. Human rabies death—West Virginia. MMWR 1965;14:195.4. Garner JS, Simmons BP. Guideline for isolation precautions in hospitals. Infect Control 1983;4:
245-325.5. ACIP. Rabies prevention —United States, 1984. MMWR 1984;33:393-408.
470 MMWR

Vol. 33/No. 33 MMWR 471
International Notes
Cutaneous Nocardiosis in Cancer Patients Receiving Immunotherapy Injections—Bahamas
From March 1982 to March 1984, 16 persons attending a private cancer immunotherapy clinic in Freeport, Grand Bahama Island, Bahamas, developed abscesses at injection sites after being treated with subcutaneous injections of human serum proteins. The protein injections are prepared by the clinic and then self-administered by the patients. No randomized clinical trials have been performed to determine the effectiveness of the injections. The clinic, which opened in 1 977, treats approximately 350 new patients annually.
Organisms recovered from abscesses included Nocardia asteroides (seven patients), Staphylococcus aureus (two), Escherichia co/i (one), and an unidentified Actinomyces-Wke organism (one). One culture yielded no growth; four persons were not cultured. One patient with cutaneous nocardiosis also had pneumonia; N. asteroides was isolated from respiratory secretions obtained during bronchoscopic examination.
Information available from clinic records was not sufficient to define incubation periods or clinical courses of abscesses. However, telephone interviews with patients and their physicians in the United States regarding documented Nocardia infections indicated that the incubation period ranged from 3 hours to 48 hours following injection. In general, patients developed abscesses at multiple injection sites, ranging from 2 cm to 20 cm in diameter. Treatment included incision and drainage, along with antimicrobials such as trimethpprim/sulfa- methoxazole. In two patients, however, abscesses were refractory to combination medical and surgical treatment.
Eleven of these 16 persons developed abscesses between November 15, 1983, and March 1, 1984; the attack rate for this period based on a survey of patient charts was 4.5 cases per 100 patients treated. The dates of abscess onset were clustered in three periods: November 16 -25 , 1983; December 20 -30 , 1983; and February 16-March 1, 1984. These clusters suggested repeated common-source exposures.
The only common exposure identified among all 16 patients was the self-administration of subcutaneous serum protein injections produced by this clinic. The clustering of the 11 cases in late 1983 and early 1984 suggested that either several lots of serum protein were contaminated during final packaging or that, on several separate days, open vials of serum were contaminated when the daily injections were drawn up. Since medication lot number and patient injection records were not available, it was not possible to test either hypothesis. Limited access to medical records precluded a thorough epidemiologic investigation.
Four serum proteins for injection are produced at the clinic. The proteins are prepared from normal human serum and clots from blood specimens taken from the oncology patients undergoing treatment. Serum and clots are processed by high-speed centrifugation, heat treatment, and ether extraction to produce the proteins. The proteins are reportedly filtered twice through an 0.8-micron filter and then a 0.45-micron filter, packaged in a 6-ml flip-top vial, and frozen until used. The daily set of injections for each resident patient is prepared at the clinic laboratory by filling each syringe directly from an open, multi-dose vial. These syringes are then capped with needles and delivered to the patient for self-administration later. Each patient in residence self-administers six to 1 2 injections daily; injection sites are rotated between arms, thighs, shoulders, abdomen, and buttocks.
One vial of each of the four protein injections was obtained for culture at CDC. None of the vials tested was sterile, although N. asteroides was not recovered from any of them. Two

MMWR August 24, 1984472Cancer Patients — C ontinued Staphylococcus species, two Bacillus species, one Acinetobacter species, and one Moraxella-like species were recovered from the protein injections.
It was not possible to identify an environmental source of contamination of the protein vials. It was noted, however, that the protein production area was immediately adjacent to several rooms housing large numbers of laboratory mice used for research.Reported by V Allen, MD, Chief Medical Officer, M inistry o f Health, Nassau, Bahamas; M Raff, MD, Louisville, Kentucky; C Shumway, MD, Dillsburg, Pennsylvania; K Lin, MD, Waukegan, R Baker, MD, Chicago, Illinois; Respiratory and Special Pathogens Epidemiology Br, Respiratory and Special Pathogens Laboratory Br, Div o f Bacterial Diseases, Div o f Mycotic Diseases, Center for Infectious Diseases, CDC.Editorial Note: N. asteroides is an aerobic, gram-positive bacterium commonly found in soil. In tissue sections or pus, N. asteroides appears as a beaded branching filament that may be partially or completely acid-fast. N. asteroides grows well on Lowenstein-Jensen medium at 30 C to 37 C; however, it will also grow on blood agar and Saboraud agar. Colonies often appear by 3 days, but growth may take up to 1 week. Laboratories may fail to isolate Nocardia from clinical specimens if plates are discarded after 4 8 hours ( 1).
(Continued on page 477)
TABLE I. Summary—cases specified notifiable diseases, United States
33rd Week Ending Cumulative, 33rd Week EndingDisease August 18,
1984August 20,
1983Median
1 9 7 9 -1 9 8 3August 18,
1984August 20,
1983Median
1979-1983
Acquired Immunodeficiency Syndrome (AIDS) Aseptic meningitisEncephalitis: Primary (arthropod-borne
& unspec.)Post-infectious
Gonorrhea: Civilian Military
Hepatitis: Type AType B Non A, Non B Unspecified
LegionellosisLeprosyMalariaMeasles: Total*
IndigenousImported
Meningococcal infections: Total Civilian Military
MumpsPertussisRubella (German measles)Syphilis (Primary & Secondary): Civilian
MilitaryToxic Shock syndrome Tuberculosis Tularemia Typhoid feverTyphus fever, tick-borne (RMSF)Rabies, animal
83 N N277 6 26 397
32 81 521 2 2
17,864 18,387 2 0 ,9 72401 529 512411 359 4 5 9477 466 383
68 65 N120 150 2 03
6 13 N7 6 5
35 22 2224 14 2723 13 N
1 1 N26 38 3626 38 36
31 25 3542 85 54
8 7 33582 699 6 78
2 6 67 6 N
380 505 50515 9 8
6 13 1435 56 52
162 128 133
2,5583,552
N5,256
N4,235
587 849 70567 64 64
514,811 5 62 ,15 0 615,92713,355 15,420 17,24613,109 13,130 16.04615,719 14,863 12,814
2 ,324 2 ,174 N3,707 4 ,533 6,366
355 451 N142 161 134554 487 658
2,168 1,196 2.5061,921 999 N
247 197 N1,904 1,931 1,9311,899 1,916 1,916
5 15 142,108 2 ,360 4,1361,233 1,403 874
500 745 1,94117,453 2 0,432 19,051
214 262 238277 292 N
13,385 14,621 16,832197 185 146195 2 44 287550 813 808
3,234 4 ,057 4,057
TABLE II. Notifiable diseases of low frequency, United States
AnthraxCum. 1984
1 Plague
Cum. 1984
17Botulism: Foodborne 7 Poliomyelitis: Total 2
Infant (Tenn. 1, Wash. 1) 63 Paralytic 2Other 5 Psittacosis (Tex. 2) 53
Brucellosis (Ala. 1) 65 Rabies, human 1Cholera Tetanus (Fla. 1) 35Congenital rubella syndrome (Calif. 1) 4 Trichinosis (Mass. 1) 57Diphtheria . Typhus fever, flea-borne (endemic, murine) (Tex. 1) 14Leptospirosis 10
‘ One of the 24 reported cases for this week was imported from a foreign country or can be directly traceable to a known internationally imported case within two generations.

Vol. 33/No. 33 MMWR 473
TABLE III. Cases of specified notifiable diseases, United States, weeks endingAugust 18, 1984 and August 20, 1983 (33rd Week)
Reporting AreaAIDS
AsepticMenin
gitis
EncephalitisGonorrhea(Civilian)
Hepatitis (Viral), by typeLegionel-
losis LeprosyPrimary Post-in
fectious A B NA.NB Unspecified
Cum.1984 1984 Cum.
1984Cum.1984
Cum.1984
Cum.1983
1984 1984 1984 1984 1984 Cum.1984
UNITED STATES 2,558 277 587 67 514,811 5 62 ,15 0 411 477 68 120 6 142
NEW ENGLAND 87 32 34 1 14,692 14,179 4 27 1 19 1 7Maine - 2 - - 597 714 _N.H. 1 10 5 412 4 50 . .Vt. - 2 3 - 232 263 . . . .Mass. 47 9 18 - 6,026 6 ,127 . 13 1 18 5R.l. 6 6 - - 988 763 2 6 1 2Conn. 33 3 8 1 6,437 5 ,862 2 8 - 1
MID ATLANTIC 1,121 52 73 8 70,835 71,755 37 68 4 5 25Upstate N Y. 109 13 27 5 10,580 1 1,383 8 9 . 1 2N Y. City 800 6 4 - 29,669 28,957 7 21 . 1 23N.J 159 12 19 11,959 13,342 12 18 - 2Pa 53 21 23 3 18,627 18,073 10 20 4 1
E.N CENTRAL 115 57 144 17 71,174 80,893 18 58 8 10 1 6Ohio 15 20 45 9 18,738 21,422 5 13 - 4 1 2Ind 16 5 31 8,091 7,805 3 12 3 2 _III 60 1 17 6 15,769 22,902 2 4 1 1 2Mich 15 31 34 . 20,633 21,689 8 29 4 3 2Wis. 9 17 2 7,943 7,075 - * -
W N CENTRAL 26 13 41 1 24,834 26,356 22 24 3 1 1 1Minn 7 1 16 3,749 3 ,683 5 . .Iowa 1 17 2,698 2 ,867 - 2 1 1Mo 13 5 4 12,004 12,988 3 15 1 .N Dak 3 . 249 275 - - _S Dak 1 . 1 593 713 4 - - .Nebr 2 . 1 1,719 1,627 1 2 - - .Kans 3 3 3 3,822 4 ,203 9 5 2 1 -
S ATLANTIC 364 44 95 14 130,416 144,832 35 92 12 15 3 6Del 4 1 2 ,342 2 ,593 - 1 -Md 24 8 23 14,789 18,329 1 22 2 -
DC 54 9,431 9 ,992 - - - 1Va 19 11 22 5 12,421 12,833 9 - 7 2 4W Va 4 1 7 1,607 1,515 1 1 -NC 8 9 19 7 21,105 21,9 66 - 5 - 2SC 6 7 4 13,011 13,853 3 16 1 .
Ga 33 . 2 1 24,283 29,256 - .
Fla 212 8 17 1 31,427 34,495 31 39 9 5 1
ES CENTRAL 17 11 30 7 44,831 47,021 21 35 5 3Ky 7 2 5 5,413 5,498 6 14 -
Tenn 4 - 9 1 18,622 19,457 7 13 4 1Ala 4 7 14 6 14,397 14,485 6 6 1 2Miss 2 2 2 * 6 ,399 7,581 2 2 * - -
W S CENTRAL 176 14 43 4 70,358 79,608 64 34 6 35 16Ark 1 - 2 6,078 6 ,042 4 2 7 1La 18 2 6 15,942 14,750 1 6 . 3 1Okla 6 4 14 1 7,555 9 .288 18 4 2 2 .
Tex 151 8 23 1 4 0,783 4 9 .5 28 41 22 4 23 14
MOUNTAIN 38 14 20 7 16,631 17,665 58 26 4 9 7Mont 3 - - 717 749 - 2 .Idaho - - 831 759 . 1Wyo 1 - - - 478 465 - - 1 .Colo 20 8 7 4 ,7 8 0 5 ,034 10 6 3N Mex. - - 1,907 2 ,143 3 4 .Ariz 9 - 7 3 4 ,459 4 ,967 18 10 1 4 5Utah 3 3 6 4 818 841 18 2 1 . 1Nev 5 * 2,641 2 ,707 9 1 1 2 1
PACIFIC 614 40 107 8 7 1,040 79,841 152 113 25 23 74Wash 32 6 4 4 ,946 6 ,213 1 1 1 . 3Oreg 5 - - 4 ,288 4 ,318 16 7 5 1Calif 564 33 101 8 58,821 65.671 134 103 17 21 55Alaska 1 - - 1,780 2 ,026 1 1 .
Hawaii 12 1 2 1,205 1,613 1 1 1 2 15
Guam - U 95 103 U U U U UPR 33 - - 1 2,089 1,708 31 2 2VI. - u - 271 179 U U U U UPac. Trust Terr. u " * u U U U U
N Not notifiable U: Unavailable

474 MMWR August 24, 1984
TABLE III. (Cont'd.) Cases of specified notifiable diseases, United States, weeks endingAugust 18, 1984 and August 20, 1983 (33rd Week)
MalariaMeasles (Rubeola) Menin-
gococcalInfectionsReporting Area
Indigianous Imported * Total Mumps pertussis Rubella
Cum.1984 1984 Cum.
1984 1984 Cum.1984
Cum.1983
Cum.1984 1 984 Cum.
1984 1984 Cum.1984
Cum.1983
1QQA I Cum I Cum | 1984 | 1983
UNITED STATES
NEW ENGLANDMaineN.H.Vt.Mass.R. l.Conn.
MID ATLANTIC Upstate N Y.N Y. City N.J.Pa.
E.N. CENTRALOhioInd.III.Mich.Wis.
W.N. CENTRAL Minn.IowaMo.N. Dak.S. Dak.Nebr.Kans.
S. ATLANTIC Del.Md.DC.Va.W . Va.N.C.S.C.Ga.Fla.
E.S. CENTRAL Ky.Tenn.Ala.Miss.
W.S. CENTRAL Ark.La.Okla.Tex.
MOUNTAINMont.IdahoWyo.Colo.N. Mex.Ariz.UtahNev.
PACIFICWash.OregCalif.AlaskaHawaii
GuamPRV I.Pac. Trust Terr.
554 23 1,921 1 247 1.196
35 93 - 11 15
34 _ 3 33 2 . 5
19 47 _ . 44 . _ .9 10 - 3 8
90 1 111 1 30 9122 21 . 10 920 1 86 1 + 14 5228 4 - 2 2720 - - 4 3
45 1 584 . 68 63111 3 - 5 85
114
2 - 1 400161 - 1 138
9 1 402 . 54 710 16 - 7 1
18 3 7 161 - - 3 1
7 3 . '
422
123 1 6 1 6
24
52
739
1812
11
20268
185
14
6
1
1410
489
91
68
23
535120270
145
83
4
24
115 2
814
39
23
4413
190
10
23
14
731225
135
18559
16821
281
5
1.904 31 2,108 42 1,233 1,403 8 500 745
111 1 66 3 36 44 19 141 1 19 - 1 4 . 16 - 15 6 7 . 1 4
26 - 5 1 17 7 . . 537 - 10 2 10 21 . 17 511 - 8 - 1 5 . .30 - 9 * 1 - -
334 2 244 3 110 272 3 178 133115 - 60 2 63 86 101 24
69 2 18 - 5 42 3 59 8668 . 128 6 17 . 14 382 - 38 1 36 127 - 4 20
307 9 861 6 331 321 . 72 113107 2 429 - 57 86 - 2 2
38 3 49 6 220 33 - 2 2361 . 160 - 20 120 42 4760 1 156 . 20 21 - 18 1541 3 67 - 14 61 - 8 26
118 83 11 102 88 2 31 3022 . 4 . 12 33 - 2 621 . 19 1 8 5 - 136 . 7 1 14 18 -
1 . 1 - - 1 - 36 . . - 7 59 _ 3 9 11 - -
2423 - 49 - 50 26 2 25
3 94 5 149 1 95 191 21 893 . 2 . 2 3 - -
31 2 29 - 8 25 - 1 15 . . . - - -
46 . 14 . 12 45 - - 24 . 28 . 9 5 -
1059 . 19 . 17 21 - -41 . 2 . 1 13 - - 1
1178 . 17 _ 7 55 - 2127 3 38 1 39 24 - 18 64
103 1 41 8 17 9 1141 1 9 1 6 - 3 1024 . 12 4 4 - - •25 . 6 . - 3 - 3 113 - 14 - 3 4 - 3
202 2 112 6 242 260 13 9527 . 5 . 13 17 - 344 . . . 4 5 - 923 N N . 208 192 - -
86108 2 107 6 17 46 - 10
65 2 203 5 91 139 2 16 272 1 6 1 18 1 - - 36 . 9 2 7 5 - 1 82 . 1 . 3 6 - 2 2
24 1 16 32 90 - 27 N N 1 6 9 - -
14 - 164 1 17 14 1 1 67 - 5 . 6 14 . 6 73 - 2 2 - 1 4 1
2 70 9 349 7 218 71 1 141 23341 - 36 7 56 13 1 939 N N 14 6 1 13
182 8 288 . 79 51 1 135 2107 1 7 . . . 1 11 - 18 69 1 - 3
1 U 5 U _ . U 2 .3 3 106 . - 9 . 6 . 3- U 3 u . . u . 2
'U ' u • - u - ■
•For measles only, imported cases includes both out-of-state and international importations.N Not notifiable U Unavailable International ’ Out-of-state

Vol. 33/No. 33 MMWR 475
TABLE III. (Cont'd.) Cases of specified notifiable diseases. United States, weeks endingAugust 18, 1984 and August 20, 1983 (33rd Week)
Reporting Area
Syphilis (Civilian) Primary & Secondary)
Toxic-shock
SyndromeTuberculosis Tula
remiaTyphoid
Fever
Typhus Fever (Tick-borne)
(RMSF)Rabies.Animal
Cum.1984
Cum.1983 1984
Cum.1984
Cum1983
Cum.1984
Cum.1984
Cum1984
Cum1984
UNITED STATES 17,453 20,432 7 13,385 14,621 197 195 550 3,234
NEW ENGLAND 331 432 385 427 4 9 3 28Maine 3 13 . 19 26 . - - 10N.H. 12 18 . 26 29 - - - 8Vt. 1 1 . 8 6 . - -Mass. 191 270 . 207 225 4 7 3 5R.l. 12 14 . 29 32 - - -Conn. 112 116 96 109 - 2 - 5
MID ATLANTIC 2,365 2 ,606 2 2,494 2 ,600 . 28 16 247Upstate N Y. 164 215 425 402 - 10 6 43N Y. City 1,477 1,540 983 1,064 - 7 1 -N.J. 425 502 548 554 - 7 3 12Pa 299 349 2 538 580 - 4 6 192
E.N. CENTRAL 805 1,102 2 1,793 1,922 3 26 37 140Ohio 161 298 1 341 304 - 5 23 14Ind 87 80 194 199 - 2 4 14III. 249 534 . 739 850 3 9 8 56Mich. 259 140 1 408 469 - 4 2 14Wis. 49 50 - 111 100 - 6 - 42
W N. CENTRAL 251 242 1 405 4 70 71 7 38 529Minn. 72 96 . 67 91 1 2 - 56Iowa 11 13 . 45 45 - - 4 108Mo 122 92 . 204 234 36 4 10 40N. Dak. 8 2 . 9 5 - - - 113S Dak 9 1 15 31 31 - 4 133Nebr 12 11 20 19 . - 3 ( 35Kans 26 19 - 45 45 3 1 17 44
S. ATLANTIC 5,184 5,381 2 ,759 2 ,936 5 26 262 898Del 13 22 _ 37 24 - - - 4Md 322 353 . 282 232 - 2 28 483DC 2 09 241 . 103 118 - 6 - -Va 265 376 _ 277 312 - 7 42 150W Va 12 18 . 85 90 - - 6 31NC 528 506 . 421 4 26 1 1 91 13SC 4 8 0 328 . 336 263 - 1 67 35Ga 885 992 389 534 4 1 26 118Fla 2 ,470 2 ,545 829 937 - 8 2 64
E.S CENTRAL 1,172 1,402 1,225 1,319 3 5 53 166Ky 65 93 286 313 - 2 8 44Tenn. 3 16 397 . 382 397 3 2 27 61Ala 3 99 558 _ 369 346 - 1 12 61Miss. 392 354 - 188 263 - - 6 -
W.S. CENTRAL 4 ,298 5,381 1,532 1,770 85 11 127 676Ark. 109 133 . 166 196 62 - 19 70La 764 1,120 . 194 302 6 1 1
8439
Okla. 140 141 _ 155 151 15 2 83Tex. 3 ,285 3 ,987 1,017 1,121 2 8 23 484
m o u n t a in 3 90 4 29 2 350 405 20 10 11 179Mont 2 5 . 14 34 1 1 8 86Idaho 15 6 . 23 23 6 - 1 6Wyo 4 10 . . 10 - - 2 9Colo. 93 94 1 36 52 5 2 - 26N.Mex. 53 126 . 66 83 1 3 9Ariz. 144 105 _ 166 153 3 3 - 31Utah 12 14 1 29 28 2 - - 2Nev. 67 69 16 22 2 1 - 10
PACIFIC 2,657 3,457 2 ,442 2 ,772 6 73 3 371Wash. 83 123 . 124 147 - 2 - 1Oreg. 75 83 . 105 118 2 1 1 1Calif 2 ,445 3 ,198 . 2 ,040 2 ,319 4 65 1 363Alaska 3 7 . 43 36 - 1 1 6Hawaii 51 46 - 130 152 * 4 - -
Guam U 5 5 . . .
PR. 5 00 598 . 254 318 - 3 40VI. 8 16 u 2 2 - 3 - -
pac. Trust Terr. - u ' ' 'U Unavailable

476 MMWR August 24, 1984
TABLE IV. Deaths in 121 U.S. cities,* •* week ending
August 18, 1984 (33rd Week Ending)
All Causes, By Age (Years)p & rTotal
All Causes, By Age (Years)
Reporting Area AllAges 2=65 4 5 -6 4 2 5 -4 4 1-24 < 1
Reporting Area AllAges 2565 4 5 -6 4 2 5 -4 4 1-24 <1
NEW ENGLAND 637 433Boston, Mass. 198 119Bridgeport, Conn. 33 25Cambridge, Mass. 20 19Fall River, Mass 31 20Hartford, Conn. 56 37Lowell, Mass 19 11Lynn, Mass 19 12New Bedford, Mass. 19 17New Haven, Conn. 58 35Providence, R.l. 62 48Somerville, Mass. 4 2Springfield, Mass. 35 30Waterbury, Conn. 29 23Worcester, Mass. 54 35
MID. ATLANTIC 2,445 1,568Albany, N Y. 51 34Allentown, Pa. 14 13Buffalo, N Y. 129 84Camden, N.J. 45 25Elizabeth, N.J. 19 9Erie, Pa t 42 30Jersey City, N.J. 36 19N Y. City, N Y. 1,310 846Newark, N.J. 62 22Paterson, N.J. 21 16Philadelphia, Pa t 305 187Pittsburgh, Pa t 68 47Reading, Pa. 29 23Rochester, N Y. 122 84Schenectady, N Y. 25 21Scranton, Pa t 25 18Syracuse, NY. 71 44Trenton. N.J. 29 19Utica, NY. 20 10Yonkers, N Y. 22 17
E.N. CENTRAL 2,022 1,428Akron, Ohio 28 21Canton, Ohio 49 32Chicago, III § 420 387Cincinnati, Ohio 171 119Cleveland, Ohio 154 89Columbus, Ohio 86 49Dayton, Ohio 101 60Detroit, Mich. 241 138Evansville, Ind. 55 48Fort Wayne, Ind. 50 44Gary, Ind 13 8Grand Rapids, Mich. 67 47Indianapolis, Ind. 142 84Madison, Wis. 30 20Milwaukee, Wis. 117 80Peoria, III 45 27Rockford, III. 46 32South Bend, Ind. 56 36Toledo, Ohio 87 67Youngstown, Ohio 64 40
W.N. CENTRAL 706 452Des Moines, Iowa 81 58Duluth, Minn 31 24Kansas City, Kans. 33 18Kansas City, Mo 113 67Lincoln, Nebr 33 28Minneapolis, Minn 78 44Omaha, Nebr. 83 58St. Louis, Mo 129 83St. Paul, Minn 61 38Wichita, Kans 64 34
1 2 5 3 9 16 23 4 441 17 9 11 18
6 1 1 . 21 . . . .9 1 1 _
12 6 1 . 35 2 1 . .6 1 . . 11 1 . 37 4 1 11 1
13 1 . . 52 - . . .2 2 . 1 65 1 - 2
15 2 2 - 3
5 6 5 19 7 6 0 55 9111
i3 2 1 -
131 7 4 3 171 4 1 1 4
9 . . 1 11 0 1 1 . 1
7 7 - 32 8 8 1 18 3 3 25 4 2
21 16 1 2 23 2 _ . .
7 4 22 12 10 1316 2 1 2 1
6 - . 32 4 9 2 3 7
4 . . .6 1 . . 1
2 2 3 1 1 17 3 . . 17 1 2 . 14 1 - -
3 7 4 9 2 61 58 7 95 1 . 1
1 4 3 . . 42 4 12 6 9
2 9 8 4 11 124 3 11 5 6 121 5 5 6 72 6 5 5 5 .6 2 21 11 9 8
5 1 1 - 25 - - 1 74 . 1 .
13 2 4 1 44 4 6 3 5 .
7 2 1 . 22 9 6 1 1 412 2 4 . 71 0 2 2 . 51 4 4 1 1 311 3 2 4 418 6 - - -
1 6 5 4 2 2 0 27 2 514 6 2 1 3
6 1 . 28 3 2 2 2
3 2 8 2 4 52 1 1 1
15 6 6 717 5 1 2 23 6 5 1 4 215 1 2 5 22 0 6 3 1 7
S. ATLANTIC 1,157 723Atlanta, Ga. 142 84Baltimore, Md. 222 127Charlotte, N.C. 51 33Jacksonville, Fla. 105 61Miami, Fla. 141 88Norfolk, Va. 43 15Richmond, Va. 70 49Savannah, Ga. 55 39St. Petersburg, Fla. 103 85Tampa, Fla. 80 48Washington, D C. 111 70Wilmington, Del. 34 24
E.S. CENTRAL 712 423Birmingham, Ala. 91 49Chattanooga, Tenn. 56 38Knoxville, Tenn 77 47Louisville, Ky. 104 66Memphis, Tenn. 163 102Mobile, Ala 54 28Montgomery, Ala. 55 32Nashville, Tenn. 112 61
W S CENTRAL 1,314 751Austin, Tex. 52 29Baton Rouge, La. 30 20Corpus Christi, Tex. 72 45Dallas, Tex. 187 99El Paso, Tex 66 34Fort Worth, Tex 92 56Houston, Tex. 268 133Little Rock, Ark 92 60New Orleans, La 105 62San Antonio, Tex 151 81Shreveport, La 94 58Tulsa, Okla 105 74
MOUNTAIN 614 377Albuquerque, N.Mex 72 35Colo. Springs, Colo 32 18Denver, Colo 109 66Las Vegas, Nev 64 41Ogden, Utah 15 9Phoenix, Ariz 158 97Pueblo, Colo. 21 13Salt Lake City, Utah 51 31Tucson, Ariz. 92 67
PACIFIC 1,768 1,138Berkeley, Calif. 16 14Fresno, Calif. 62 40Glendale, Calif 34 28Honolulu, Hawaii 75 44Long Beach, Calif 86 55Los Angeles, Calif 482 302Oakland, Calif 76 52Pasadena, Calif 28 24Portland, Oreg 125 82Sacramento, Calif. 117 68San Diego, Calif. 126 69San Francisco, Calif 151 102San Jose, Calif. 140 96Seattle, Wash. 138 87Spokane, Wash. 62 46Tacoma, Wash. 50 29
TOTAL 11,375++ 7,293
278 74 40 42 5039 12 3 4 460 19 9 7 412 4 2 624 7 7 6 1142 6 4 1 117 2 4 5 110 5 3 3 712 3 1 512 2 2 2 621 2 3 6 421 10 2 8 1
8 2
188 41 31 29 3429 4 5 4 213 2 2 1 117 5 3 5 426 7 1 4 447 5 6 3 1312 4 5 511 5 3 4 133 9 6 3 9
331 112 62 58 4710 6 4 3 6
6 1 2 113 3 6 543 25 9 11 516 5 7 4 327 6 2 1 277 33 13 12 522 5 1 4 728 10 4 1
1 145 13 7 524 2 4 6 420 3 3 5 4
136 58 25 18 3015 14 6 2 91 1 2 1 124 1 1 3 5 511 7 4 1 3
4 1 140 12 6 3 2
6 2 - 19 7 2 2
16 4 2 3 9
391 115 74 46 107. 2 - 1
13 3 4 2 75 1 1
20 3 5 3 119 6 3 3
112 35 22 8 2015 4 3 2 9
3 1 225 7 6 5 735 8 5 1 930 15 6 5 1532 1 1 1 5 428 10 4 2 1428 8 12 3 510 1 2 3 716 1 1 3 5
2,553 770 389 356 507
* Mortality data in this table are voluntarily reported from 121 cities in the United States, most of which have populations of 100 ,000 or more A death is reported by the place of its occurrence and by the week that the death certificate was filed Fetal deaths are not included
•* Pneumonia and influenzat Because of changes in reporting methods in these 4 Pennsylvania cities, these numbers are partial counts for the current week Com
plete counts will be available in 4 to 6 weeks.t t Total includes unknown ages
§ Data not available. Figures are estimates based on average of past 4 weeks.

MMWR 477Cancer Patients — C on tinued
Although nocardiosis is usually a pulmonary infection in humans, Nocardia species have been described as a cause of multiple cutaneous abscesses and draining sinus tracts in cattle (2). However, N. asteroides has rarely been reported as a cause of subcutaneous abscess in humans in North America.
Treatment of abscesses caused by N. asteroides should include incision and drainage and use of an antimicrobial agent to which N. asteroides is sensitive, such as trimethoprim/sulfa- methoxazole or minocycline (3). Duration of antimicrobial therapy is uncertain.
Patients receiving immunosuppressives in preparation for organ transplantation have been reported to be at higher risk for disseminated Nocardia infections, and it is likely that oncology patients, such as those attending this immunotherapy clinic, are also at higher risk. Although most of the infections in this cluster were due to N. asteroides, other bacteria were isolated, both from the patients and the protein injections. Physicians should be alert to the possibility of infections in patients receiving immunotherapy and should report such episodes to state health departments.References1 Gordon MA. Aerobic pathogenic Actinomycetaceae. In: Lennette EH, Balows A, Hausler WJ Jr, Truant
JP, eds. Manual of clinical microbiology. 3rd ed. Washington, D.C.: American Society for Microbiology, 1980:180-94.
2. Lerner PL. Nocardia species. In: Mandel GL, Douglas RG, Bennett JE, eds. Principles and practices of infectious diseases. New York: Wiley Medical, 1979:1962-8.
3. Smego RA Jr, Moeller MB, Gallis HA. Trimethoprim-sulfamethoxazole therapy for Nocardia infections. Arch Intern Med 1983;143:711-8.
Vol. 33/No. 33
Epidemiologic Notes and Reports
Brain Cancer — Texas
Because of concern among local physicians in Cooke County, Texas,* about an apparent excess of brain cancers, incidence and mortality rates of these cancers were evaluated. Data were reviewed during 19 73 -198 2 from county death certificates, cancer registry forms for county residents, and hospital records in Cooke and surrounding counties and major referral centers in Dallas. Pathologic diagnoses in medical records or on death certificates coded 191, 192.0-192.3, or 192.9 using either the International Classification of Diseases, Adapted, eighth (ICDA-8) or ninth (ICD-9) revisions, were considered cases of brain cancer. Information on cancer metastatic to the brain was also reviewed. The expected number of cases was calculated by using the National Cancer Institute's Surveillance, Epidemiology, and End Results Program (SEER) incidence and mortality rates for all races and geographic areas ( 1) and applying them to the 1980 population figures for Cooke County. The number of cancer cases observed were then compared to the number expected.
Brain cancer was recorded as the cause of death on 11 death certificates; cancer at another site in the nervous system was recorded on five. These 16 deaths are slightly, though not significantly, more than would be expected in a population of this age and sex distribution. Twelve residents had newly diagnosed brain cancer, and one had cancer of another nervous-system
’Cooke County is predominantly rural and is located north of Dallas on the Oklahoma border.

August 24, 1984
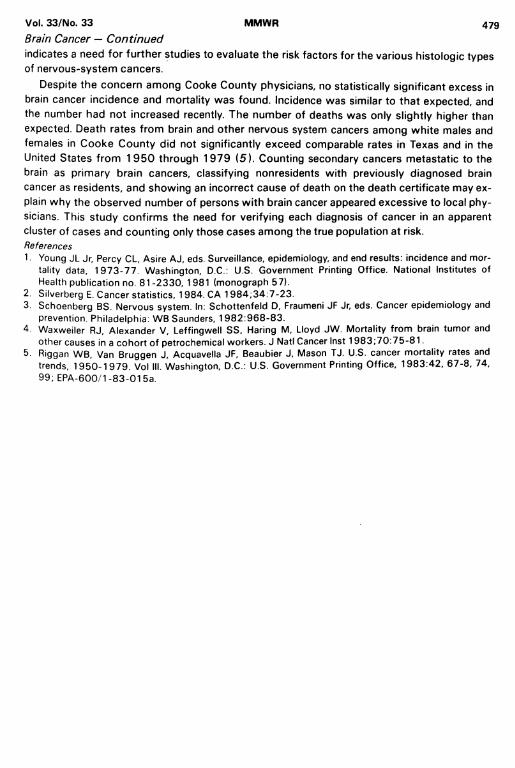
Brain Cancer - C ontinued site. The occurrences of these 13 cancers in this population are not higher than would be expected. Diagnoses of cases occurred relatively randomly over the 10-year period (Figure 1).
The number of persons with brain cancer in Cooke County may have appeared high because: (1) the brain is a frequent site of metastasis, and metastasis to the brain is frequently the cause of death; (2) errors occur in classifying the causes of death on death certificates; (3) residents of rural areas often are more aware of serious illnesses and deaths among the local population than are residents of urban communities.Reported by A Menchetti, Texas Statewide Registry Program, W Barrington, Jr, Bureau o f Vital Statistics, CE Alexander, MD, State Epidemiologist, Texas Dept o f Health; Div o f Field Svcs, Epidemiology Program Office, Cancer Br, Chronic Diseases Div, Center for Environmental Health, CDC.Editorial Note; In 1984, an estimated 12,800 Americans may develop cancers of the brain or other parts of the central nervous system; an estimated 10,400 may be fatal (2 ). These cancers represent approximately 1.6% of all newly diagnosed cancers and approximately 2.3% of all deaths from cancer in the United States. Whites have higher age-adjusted incidence and mortality rates than persons of other races, and males have higher rates than females. Primary brain cancers occur from five to 25 times more often than primary cancers of other parts of the central nervous system ( 1 ).
Although patients with certain rare inherited conditions, such as tuberous sclerosis and von Recklinghausen's neurofibromatosis, are at an increased risk for nervous-system cancers, most patients with these cancers show no evidence for causative genetic factors. Viruses and several chemicals, including the N-nitrosamides and 7 ,12-dimethylbenz[a]anthracene, produce nervous-system cancers in experimental animals. Rubber workers, vinyl chloride workers, and petrochemical workers appear to have an increased risk of brain cancers {3,4). Exposure to x-ray therapy and immunosuppression may also increase this risk (3 ). The observed low survival rate for these cancers—despite surgery, radiotherapy, and chemotherapy—
FIGURE 1. Primary brain cancers among residents — Cooke County, Texas, 19 7 3 -1 9 8 2
478 MMWR
I975I973 1977
YEAR
I979 I9 8 I
MMWR 479Brain Cancer — C on tin ued indicates a need for further studies to evaluate the risk factors for the various histologic types of nervous-system cancers.
Despite the concern among Cooke County physicians, no statistically significant excess in brain cancer incidence and mortality was found. Incidence was similar to that expected, and the number had not increased recently. The number of deaths was only slightly higher than expected. Death rates from brain and other nervous system cancers among white males and females in Cooke County did not significantly exceed comparable rates in Texas and in the United States from 1950 through 1979 (5). Counting secondary cancers metastatic to the brain as primary brain cancers, classifying nonresidents with previously diagnosed brain cancer as residents, and showing an incorrect cause of death on the death certificate may explain why the observed number of persons with brain cancer appeared excessive to local physicians. This study confirms the need for verifying each diagnosis of cancer in an apparent cluster of cases and counting only those cases among the true population at risk.References1 Young JL Jr, Percy CL, Asire AJ, eds. Surveillance, epidemiology, and end results: incidence and mor
tality data, 1973-77. Washington, D.C.: U.S. Government Printing Office. National Institutes of Health publication no. 81-2330, 1 981 (monograph 57).
2. Silverberg E. Cancer statistics, 1984. CA 1984;34:7-23.3. Schoenberg BS. Nervous system. In: Schottenfeld D, Fraumeni JF Jr, eds. Cancer epidemiology and
prevention. Philadelphia: WB Saunders, 1982:968-83.4. Waxweiler RJ, Alexander V, Leffingwell SS, Haring M, Lloyd JW. Mortality from brain tumor and
other causes in a cohort of petrochemical workers. J Natl Cancer Inst 1983;70:75-81 .5. Riggan WB, Van Bruggen J, Acquavella JF, Beaubier J, Mason TJ. U.S. cancer mortality rates and
trends, 1950-1979. Vol III. Washington, D.C.: U.S. Government Printing Office, 1983:42, 67-8, 74, 99; EPA-600/1-83-01 5a.
Vol. 33/No. 33
480 MMWR August 24, 1984
The Morbidity and Mortality Weekly Report is prepared by the Centers for Disease Control, Atlanta, Georgia, and available on a paid subscription basis from the Superintendent of Documents, U.S. Government Printing Office. Washington. D.C. 20402, (202) 783-3238.
The data in this report are provisional, based on weekly reports to CDC by state health departments. The reporting week concludes at close of business on Friday; compiled data on a national basis are officially released to the public on the succeeding Friday.
The editor welcomes accounts of interesting cases, outbreaks, environmental hazards, or other public health problems of current interest to health officials. Such reports and any other m atters pertaining to editorial or other textual considerations should be addressed to: ATTN: Editor, Morbidity and Mortality Weekly Report. Centers for Disease Control, Atlanta. Georgia 30333.
D irector, Centers for Disease C ontro l E ditor Pro TemJames O. Mason, M .D ., D r.P .H . W alter W. W illiam s, M .D ., M .P .H .
D irector, Epidemiology Program O ffice Assistant EditorCarl W. Ty ler, Jr., M .D . Karen L. Foster, M .A .
DEPARTMENT OF HEALTH & HUMAN SERVICESPublic Health Service Centers for Disease Control Atlanta GA 30333
Official BusinessPenalty for Private Use $300
Postage and Fees Paid U.S. D ep t, o f H .H .S . HHS 396
S *H C R H DR V ERN E V IR O L O G YCIO7 - E 1 4
NEWV75 8129 F NEWH0U SE D I V I S I O N
X
HHS Publication No. (CDC) 84-8017 Redistribution using indicia is illegal.