Embed Size (px)
Citation preview
Human Pharmacokinetics and Modeling of the Concentration-Attenuation Relationship of a New Liposomal
Liver-specific Contrast Agent for CT Peter H6glund, MD, PhD, Peter Leander, MD, PhD, Svein Olav Hustvedt, MSc, PharmD
Yngvil Kloster, MSc, Arve Berseth, MSc
To overcome the current limitations with contrast-en- hanced CT, a new contrast agent with liposome-encapsu- lated iodixanol (CTP) has been developed (1-3). After in- travenous administration CTP is phagocytosed by the
Kupffer cells in normal liver tissue and by other cells be- longing to the reticuloendothelial system (RES). eg, in the
spleen and in the bone marrow. The aims of this study were to investigate the pharmacokinetics and the concen-
tration-attenuation relationship of CTP obtained from the first phase I trim of this new contrast agent. The results from this study concerning imaging and safety are pre- sented in an accompanying paper (4).
This was an open single blind phase I trial where 47 healthy males and females of no childbearing potential were each given one single dose of placebo or CTP (10,
30, 70, or 100 mg encapsulated I/kg) as bolus injection (2 mL/sec) or as an infusion over 30 minutes (70 mg encap- sulated I/kg). The contrast medium is a ready-to-use lipo- somal suspension of iodixanol 200 mgUmL (encapsulated 80 mgI/mL) with a liposomal mean size of 350 rim. Whole blood samples were analyzed for iodine by x-ray fluores-
cence. Plasma samples were obtained serially over 28 days and analyzed for iodixanol by HPLC; the results are pre-
Acad Radio11998; 5(suppl 1):$47-$48
From the Department of Clinical Pharmacology, Lund University Hos- pital, Lurid University, SE-221 85 Lund, Sweden (P.H.); the Department of Diagnostic Radiology, Maim6 University Hospital, Luna University, Maim6, Sweden (P.L.); and Nycomed imaging AS, Oslo, Norway (S.O.H., Y.K., A.B.). Address reprint requests to P.H.
©AUR, 1998
sented as iodine concentrations. Urine was collected over
3 days (10 days for the subjects receiving 100 mg encap-
sulated I/kg) and analyzed for iodixanol by HPLC; the re- sults are presented as iodine concentrations. Feces was collected over 10 days for the subjects receiving 100 mg encapsulated I/kg and analyzed for iodine by neutron acti- vation. Standard methods were used for the kinetics. Lipo- somal iodine in plasma was calculated as { [(blood iodine)/
(1-hematocrit)] - free plasma iodine }. The attenuations in liver, spleen, aorta, and vena cava, measured by CT, in Hounsfield units, were converted into iodine. A compart- mental approach was used for the investigation of the con- centration-attenuation relationship. The model equations were solved using Laplace transforms (5-7). In this model
a central compartment for encapsulated iodixanol received input of CTP. Three peripheral compartments (liver, spleen, and other RES cells) were driven by this central compartment, and the outputs from these compartments were used as input into a central compartment for free
iodixanol. This compartment also received input directly
from the administration of the free fraction of iodixanol in CTP. The disposition of free iodixanol was modeled by a two-compartment open model with elimination into urine
and feces.
The areas under the curves of encapsulated and free
iodixanol were linear in the dose range studied. The rate of elimination for free iodixanol was not affected by dose,
but the rate of uptake of encapsulated iodixanol into RES was decreased by dose but not concentration in plasma.
This decrease in rate was accompanied by a lower fraction of the total encapsulated dose being taken up by the RES in the liver (from 58% at a dose of 30 mg encapsulated I/ kg to 38% at a dose of 100 mg encapsulated I/kg). Elimi-
$47
1000
100
"~ 0 0
o ~
. . . . . . . . . . . . . . . . . / / /
1 2 3 7 14 21 28
Time (Hours) Time (Days)
0 30 mg I/kg
o 70 mg I/kg
• 1 O0 rng ]/kg
• 70 mg [/kg (infusion)
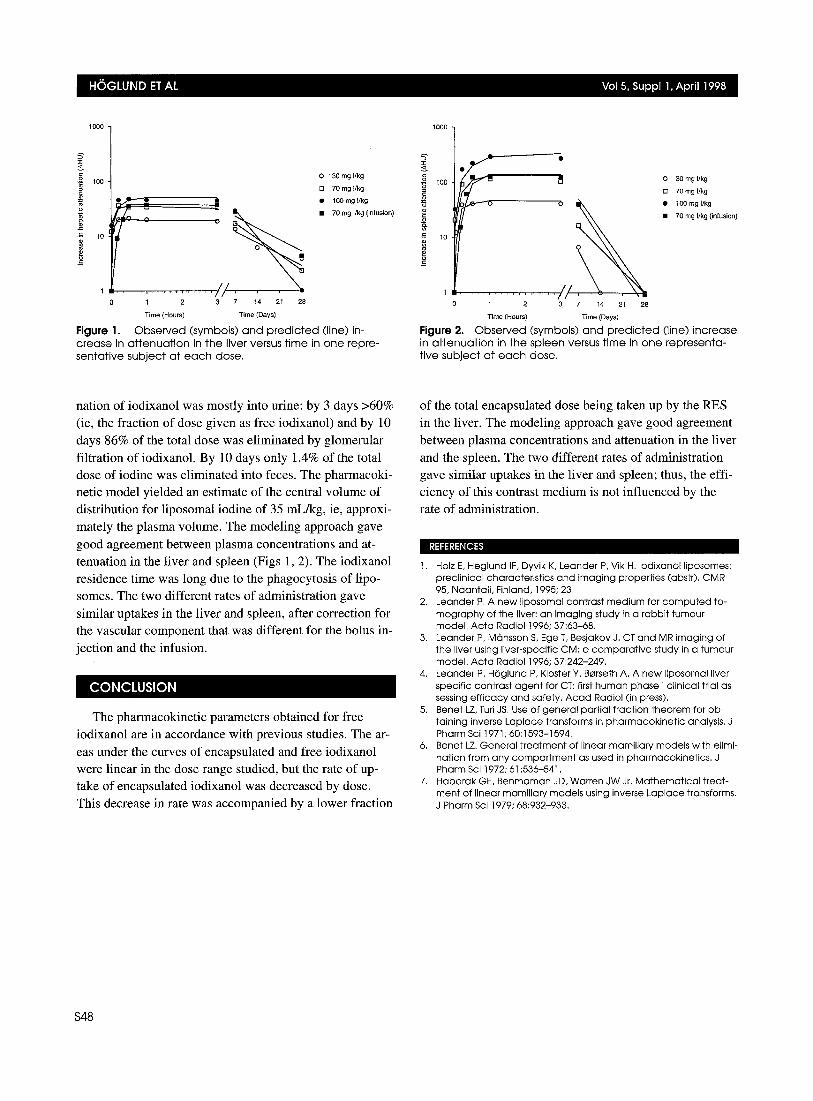
Figure 1. Observed (symbols) a n d p red i c t ed (line) in- c rease in a~enua t i on in the liver versus t ime in one repre- sentat ive subject a t e a c h dose.
• °
g f00
0o Uo 0 % ~,
10 0
o
1
O 30 mg [/kg
[ ] 70 mg I/kg
• 100 mg I lk 9
• 70 rng I/kg (infusion)
0 1 2 3 7 14 21 28
Time (Hours) Time (Days)
Figure 2. O b s e r v e d (symbols) a n d p r e d i c t e d (l ine) inc rease in a H e n u a t i o n in the sp leen versus t ime in o n e rep resen ta - t ive sub jec t a t e a c h dose.
nation of iodixanol was mostly into urine: by 3 days >60% (ie, the fraction of dose given as free iodixanol) and by 10
days 86% of the total dose was eliminated by glomerular
filtration of iodixanol. By 10 days only 1.4% of the total dose of iodine was eliminated into feces. The pharmacoki- netic model yielded an estimate of the central volume of distribution for liposomal iodine of 35 mL/kg, ie, approxi- mately the plasma volume. The modeling approach gave
good agreement between plasma concentrations and at- tenuation in the liver and spleen (Figs 1, 2). The iodixanol residence time was long due to the phagocytosis of lipo- somes. The two different rates of administration gave
similar uptakes in the liver and spleen, after correction for the vascular component that was different for the bolus in-
jection and the infusion.
~F~RENcEs
The pharmacokinetic parameters obtained for free
iodixanol are in accordance with previous studies. The ar-
eas under the curves of encapsulated and free iodixanol were linear in the dose range studied, but the rate of up- take of encapsulated iodixanol was decreased by dose. This decrease in rate was accompanied by a lower fraction
of the total encapsulated dose being taken up by the RES in the liver. The modeling approach gave good agreement
between plasma concentrations and attenuation in the liver
and the spleen. The two different rates of administration gave similar uptakes in the liver and spleen; thus, the effi- ciency of this contrast medium is not influenced by the rate of administration.
1. Holz E, Heglund IF, Dyvik K, Leander P, Vik H. Iodixanol liposomes: preclinical characteristics and imaging properties (abstr). CMR 95, Naantali, Finland, 1995; 23,
2. Leander P. A new Iiposomal contrast medium for computed to- mography of the liver: an imaging study in a rabbit tumour model. Acta Radio11996; 37:63-68.
3. Leander P, M6nsson S, Ege T, Besjakov J. CT and MR imaging of the liver using liver-specific CM: a comparat ive study in a tumour model. Acta Radio11996; 37:242-249.
4. Leander P, HOglund P, Kloster Y, Berseth A. A new liposomal liver specific contrast agent for CT: first human phase I clinical trial as- sessing eff icacy and safety. Acad Radiol (in press).
5. Benet LZ, Turi JS. Use of general partial fraction theorem for ob- taining inverse Laplace transforms in pharmacokinetic analysis. J Pharm Sci 1971; 60:1593-1594.
6. Benet LZ. General treatment of linear mamillary models with elimi- nation from any compartment as used in pharmacokinetics. J Pharm Sci 1972; 61:536-541.
7. Haborak GE, Benmaman JD, Warren JW Jr. Mathematical treat- ment of linear mamillary models using inverse Laplace transforms. J Pharm Sci 1979; 68:932-933.
$48