Embed Size (px)
Citation preview

See discussions, stats, and author profiles for this publication at: https://www.researchgate.net/publication/51507887
Human-like external function of the foot, and fully upright gait, confirmed in
the 3.66 million year old Laetoli hominin footprints by topographic statistics,
experimental footprin...
Article in Journal of The Royal Society Interface · July 2011
DOI: 10.1098/rsif.2011.0258 · Source: PubMed
CITATIONS
80READS
221
9 authors, including:
Some of the authors of this publication are also working on these related projects:
Probabilistic biomechanical finite element simulations: Whole-model classical hypothesis testing based on upcrossing geometry View project
spm1d version 0.4 View project
Robin Huw Crompton
University of Liverpool
142 PUBLICATIONS 4,283 CITATIONS
SEE PROFILE
Todd C Pataky
Kyoto University
139 PUBLICATIONS 1,463 CITATIONS
SEE PROFILE
Russell Savage
University of Liverpool
28 PUBLICATIONS 925 CITATIONS
SEE PROFILE
Kristiaan D'Août
University of Liverpool
92 PUBLICATIONS 1,457 CITATIONS
SEE PROFILE
All content following this page was uploaded by Robin Huw Crompton on 04 June 2014.
The user has requested enhancement of the downloaded file.

J. R. Soc. Interface (2012) 9, 707–719
*Author for c†These author
Electronic sup10.1098/rsif.2
doi:10.1098/rsif.2011.0258Published online 20 July 2011
Received 22 AAccepted 28 J
Human-like external function of thefoot, and fully upright gait, confirmed
in the 3.66 million year old Laetolihominin footprints by topographicstatistics, experimental footprint-
formation and computer simulationRobin H. Crompton1,*,†, Todd C. Pataky2,†, Russell Savage1,†,Kristiaan D’Aout3, Matthew R. Bennett4, Michael H. Day5,
Karl Bates1, Sarita Morse1,4 and William I. Sellers6,†
1Institute of Aging and Chronic Disease, University of Liverpool, Sherrington Buildings,Ashton Street, Liverpool L69 3GE, UK
2Department of Bioengineering, Shinshu University, 3-1-15 Tokida, Ueda-shi,Nagano-ken 386-8567, Japan
3Department of Biology, University of Antwerp–Campus Drie Eiken D.C.1.08,Universiteitsplein 1, 2610 Antwerpen, Belgium
4School of Applied Sciences, Bournemouth University, Talbot Campus, Fern Barrow, Poole,Dorset BH12 5BB, UK
5Department of Palaeontology, The Natural History Museum, London SW7 5BD, UK6Faculty of Life Sciences, University of Manchester, Oxford Road, Manchester M13 9PT, UK
It is commonly held that the major functional features of the human foot (e.g. a functionallongitudinal medial arch, lateral to medial force transfer and hallucal (big-toe) push-off)appear only in the last 2 Myr, but functional interpretations of footbones and footprints ofearly human ancestors (hominins) prior to 2 million years ago (Mya) remain contradictory.Pixel-wise topographical statistical analysis of Laetoli footprint morphology, comparedwith results from experimental studies of footprint formation; foot-pressure measurementsin bipedalism of humans and non-human great apes; and computer simulation techniques,indicate that most of these functional features were already present, albeit less stronglyexpressed than in ourselves, in the maker of the Laetoli G-1 footprint trail, 3.66 Mya. Thisfinding provides strong support to those previous studies which have interpreted theG-1 prints as generally modern in aspect.
Keywords: bipedalism; biomechanics; evolution; hominid; gait
1. INTRODUCTION
The human foot acts primarily to balance the bodywhen standing, and to brake or propel it during gait,although a variable degree of usable grasping andmanipulative capacity remains. The former functionsoccur by exertion of pressures, comprising vertical,transverse and shear force components, against the sub-strate. Even for modern feet, because of the articularcomplexity and inaccessibility of the 22 bones andassociated layers of soft tissue, nearly a century ofanalysis has failed to elucidate internal motion,
orrespondence ([email protected]).s contributed equally to this work.
plementary material is available at http://dx.doi.org/011.0258 or via http://rsif.royalsocietypublishing.org.
pril 2011une 2011 707
particularly in the midfoot [1]. Further, analyses ofthe origin and evolution of early hominin foot-functionhave been based primarily on a limited number of fos-sils, representing only subsets of the foot skeleton [2].It is hardly surprising therefore that interpretations ofexternal function in fossil specimens have been contra-dictory [3,4], with some concluding that there mayhave been multiple paths to bipedality in the differentlineages represented by fossil footbones [5]. Conse-quently, various authors have turned to footprintsand associated trails [6–12] as a more direct line of be-havioural evidence—fossil footprints and trackways,although rare in the geological record, are probablymore common than articulated fossil footbones.
The best-known early hominin footprint trails arethose at Laetoli locality G, Tanzania, dating to
This journal is q 2011 The Royal Society

708 Early hominin foot function at Laetoli R. H. Crompton et al.
3.66 Mya [13], made in nephelinite volcanic ash which isassumed to have been damp at the time of footprint for-mation [14,15]. Trail G-1 was made by a smallindividual walking to the left of trail G-2/3, which con-sists of larger prints made either by one individualwhose feet slipped, or two individuals, the second tread-ing in the footsteps of the first [16]. The overlap/slippage in G-2/3 currently precludes meaningful analy-sis. Functional interpretations of G-1 foot function todate are directly contradictory, arguing either for a gen-erally modern aspect, with a medial longitudinal arch,lateral-to-medial force transfer and push-off by thehallux [6,16]; or that these features are absent and/orfoot-function as close or closer to that of non-humangreat apes [8,17,18]. These contradictions may partlybe attributed to difficulties in statistical analysis offootprint morphology, which, consisting of plasticdeformation of a substrate under pressures applied bydeformable soft tissue, can lack reliable landmarks.Recent quantitative studies of the Laetoli footprintshave either assumed that some landmarks exist [10],or limited themselves to single overall parameters ofthe footprints, e.g. comparing maximum depths underthe hindfoot and forefoot [12]. Moreover, while it is gen-erally agreed that footprint depth reflects foot pressure[7–12], it is unknown whether maximal- or time-integrated pressure is more important in substratedeformation [11]. Measurement of pressures transmittedby humans through moist sand [11] suggests that bothpressure measures are good predictors of depth butwhether maximal pressure or pressure impulse is thebetter predictor of depth varies with foot region. Thisis because of complex, nonlinear interactions betweenfoot and substrate [9,11], but cannot be assumed tohold for hominins where forefoot function may nothave been closely similar to our own. No means of differ-entiating the local effects of maximal- and time-integrated pressure in ancient footprints has yet beenreported, to the best of our knowledge, and until sucha technique has been developed, we can only assumea general equivalence of footprint depth and foot-pressure,sensu lato.
In this study, we aimed to provide tests of the twomain competing hypotheses, that (i) the G-1 footprintsresemble human footprints/foot-pressure records morethan they do equivalent records for voluntary bipedal-ism of non-human apes, in displaying a medial twistof the forefoot on the hindfoot, and thus a medial longi-tudinal arch, lateral-to-medial force transfer and push-off by the hallux [6,19]; or (ii) that these features areabsent, and that the foot-function represented by G-1thus evinces as much, or closer, affinity to foot-functionin non-human apes [8,17,18].
Testing these hypotheses requires that we comparedepths over the whole footprint, and to do so, weapply statistical parametric mapping (SPM), a topolo-gical technique recently adapted for foot-pressurestudies [20] to pixel-by-pixel depth comparison of themean G-1 footprint to means of human footprintsrecorded experimentally in the laboratory and in thefield. We supplement these by experimental recordingsof foot-pressure in the facultative bipedalism of bonobos(pygmy chimpanzees), which have the most human-like
J. R. Soc. Interface (2012)
limb proportions of the non-human great apes, butuse bipedalism in less than 2 per cent of the natural loco-motor repertoire, and orang-utans, with less human-likebody proportions but 7–8% of bipedalism in theirnatural locomotion [21,22], and by computer simulationsof footprint formation in the most likely author (e.g. [19])of the Laetoli G trackways, Australopithecus afarensis,during alternative hypothesized gaits and assumingalternative mass distributions.
2. MATERIAL AND METHODS
2.1. Sediments
The total depth of the Laetoli G ash fall is 120–150 mm, but this contains two components [15,23].Within these, prints of giraffids, rhinoceratids and pro-boscideans are only 20–40 mm deep, indicating themaximum compressibility of the Laetoli sedimentunder the stresses applied by vertebrate trackmakers[15,23]. At this point, either through densification ormore probably as a result of lithification of sub-surfacelayers into an incompressible state, the substrate was bydefinition able to bear the applied pressure, supportingthe animal’s weight and propulsive forces. Strain (andtherefore deformation) ceased, despite any continuedapplication of stress; and the dynamic pressure associ-ated with movement of the trackmaker’s foot wouldno longer be reflected in track morphology. In orderto compare the Laetoli footprints to familiar modernhuman footprints, in conditions broadly applicable tothose of the Laetoli track-bearing substrate, experimen-tal footprints were made by Western human (i.e.habitually shoe-wearing) subjects walking over a 6 mwooden walkway covered with 3–4 cm of loose drysand at self-determined ‘comfortable’ walking speedswhile keeping their eyes on a head-height image on awall at the end of the walkway to avoid targeting. Adlibitum practice was allowed so that subjects couldfind a start point which resulted in a natural same-foot strike in the centre of the test area, a soft-walledbox within the sand, covering a Kistler forceplate/RsScan pressureplate combination, set in the centre ofthe walkway. Procedures followed (for maximum com-parability) the set-up in the most detailed recentstudy of footprint formation [11]. As in this study[11], the box was filled with ca 40 mm of moist (ca20% water content), well-sorted, texturally mature,medium sand (grain size between 0.2 and 0.5 mm)grains generally being well-rounded and of moderateto high sphericity. Similar sands have been reported[6,23] as having consistency similar to that of theLaetoli beds at the time of footprint formation.The depth of ca 40 mm chosen for the sand mimicsthe presence and vertical location of the rheologicallyincompressible sub-surface layers at Laetoli G-1[15,23], and would impose limits on sediment defor-mation and track depth broadly similar to that whichappears to have existed through mechanical layeringof the sediment at Laetoli. It should be cautioned thatfootprint formation under these conditions cannotexclude potential influences of the retaining walls.Therefore, in trials where a subject placed their foot

Early hominin foot function at Laetoli R. H. Crompton et al. 709
near the edge of the box, the trial was discarded and thesubject asked to repeat the trial. Similarly, habitualwearing of footwear will constrain the distribution offoot-pressure [24]. For this reason, a smaller sample offootprints was also recorded in moist sand under less-constrained conditions, made by habitually barefootsubjects from the modern Kenyan village of Ileret.
Experimental prints were laser-scanned at 120 mmresolution with an LDI PS-400. First-generation castsof the Laetoli G-1 prints at the National Museum ofKenya and the modern Ileret experimental sample werelaser-scanned using a Konica-Minolta VI900, vertical res-olution 90 mm. Scans were selected for completeness andoutput as point-clouds. Prints G-1/28 and G-1/30 wereomitted as excessively eroded and damaged by veg-etation; G-1/38 since the posterior-heel imprint ismissing through faulting [14].
The scanners were positioned over the footprints asorthogonally as possible to the surrounding surface andorientation checked with a two-axis spirit level. However,there will always be a slight variation in the orientationof the XY plane of the scanner relative to the substratesurface between prints, which could result in errorwhen extracting the print, as thresholding is performedalong the Z-axis. Further, footprints may be surroundedby uplift and other artifactual relief [9], and the outline isoften particularly affected by disturbance of plant andanimal origin [25]. To correct for orientation and uplifterrors, a plane was fitted to a number of points on thesurface of the substrate in which the print is formed,but well outside the print margin. XYZ values ofrandom points in the laser scan data for the palaeosur-face were selected, 5 points on the medial side of thefootprint and 5 points on its lateral side. The least-squares coefficient of a plane fitted to the extractedpoints was calculated, any deviation of this plane fromthe XY plane of the scanner derived, and the transform-ation values necessary to correct it calculated. Thesetransformation values were then applied to the originalscan data so that the surface lay on the same XYplane as that of the scanner. Prints were then isolatedusing manual thresholding, and downsampled to1 mm2 (100 pixels per square cm) to match pressure-plate pixel density. It is surely unlikely that smallerfeatures would represent substantial gait pressures evenin relatively compacted substrates. Pixel depths belowthe reference surface were the basis of all subsequentanalysis. Since perceived outlines of footprints will varywith depth, and as noted above will be affected byuplift of the surrounding area during footprint formation,by bioturbation of the sediment, and by erosion, outlinesare not analysed or discussed in this study.
Footprints differ particularly in orientation, within atrackway, in size between individuals, and in shapebetween species. Therefore, registration was conductedusing custom Matlab software that manipulated imagelocation, rotation and scaling to maximize the mutualinformation between a pair of images. The result was anoptimally aligned pair of images, a process replicated forall images. Images were mirrored, preliminarily registeredto one of the most detailed prints, G-1/34, pixel-wisemean depth computed and original thresholded imagesre-registered to the mean. The mean of these images
J. R. Soc. Interface (2012)
was analysed. Central pressure, and pixel-depth, ten-dencies were calculated, and samples statisticallycompared using a topological approach under ourcustom software [20], pedobarographic statistical para-metric mapping (pSPM).
2.2. Pedobarographic statistical parametricmapping
pSPM has adapted the SPM approach [26] developedfor cerebral blood flow analysis in functional magneticresonance imaging and positron emission tomography.While SPM methodology is quite complex, its fundamen-tal purpose is quite simple, that is, to detect changes inblood flow. It achieves this by probing the brainvolume to identify regions of significant change topolo-gically. Two important characteristics make thispossible: (i) the brain is contained within regular discretebounds, and (ii) blood flow is spatially smooth. In thispaper, we simply substitute footprints for brains, anddepth for blood flow. Footprints are also (i) containedin generally regular discrete bounds (the plantar footshape) and their depths are also (ii) generally spatiallysmooth across the surface of the foot. As multiple foot-prints have similar geometry, it implies that thefootprints are able to be registered [27] or, equivalently,that they can be spatially manipulated to match atemplate footprint within a certain error tolerance.Once registered, each pixel corresponds to the same ana-tomical location in all co-registered images, so standardtest statistics (e.g. t, F) can be meaningfully computedat each pixel or voxel. The result is a statistical imageor an SPM. However, the value of a test statistic doesnot, by itself, convey statistical significance. While wecould compute p-values for every single pixel in theSPM, we have a major problem. There are tens of thou-sands of pixels in footprint images, so it is very likely thatwe will observe large t values (e.g. t . 3) simply bychance. Fortunately, the second shared characteristic offootprint and brain images, spatial smoothness, providesus with an elegant and powerful solution to this problem:topology. Since neighbouring pixels tend to behave simi-larly, their t values also form a generally smooth SPMand it can be shown that the topological characteristicsof a thresholded SPM (e.g. cluster size, number of clus-ters, etc.) follow analytical probability distributions(e.g. [26]). This is profound because the spatial samplingfrequency, or equivalently the number of pixels, is irrele-vant. What matters is the spatial smoothness of themeasured signal. Thus, SPM transcends classical multi-variate statistics by moving completely into the realmof topology. Indeed, it can be shown that SPM consti-tutes a generalization of univariate statistics ton-dimensional spatio-temporal data and that SPM’stopological approach can be used to analyse a widevariety of spatio-temporal biomechanical data [28].
A sceptic might argue that SPM is unnecessarilycomplex: one could manually identify different land-marks or regions of interest (ROI) over the foot, andthen conduct statistics within each ROI, or incorporateROI data into multivariate analyses, and arrive at asimilar answer to that yielded by SPM procedures.We would counter by suggesting that SPM, or

710 Early hominin foot function at Laetoli R. H. Crompton et al.
something similar, is necessary for objective analysis.Manual ROI identification inevitably involves qualitat-ive judgement, but even when it is highly repeatable[29] more serious problems emerge: the selected ROIsmay miss or distort functionally relevant signal[20,28]. Thus, ROI definition, as a general methodology,constitutes an ad hoc, incomplete and potentiallybiased approach that cannot be guaranteed to assessaccurately the underlying spatio-temporal trends ofsmooth surfaces. We therefore argue that SPM offersthree main benefits for footprint analyses: (i) it is objec-tive, (ii) it assesses the entire spatial domain and(iii) it is not susceptible to problems of ad hoc ROIdiscretization.
2.3. Foot pressure in bipedal walking ofnon-human great apes
Foot pressure in voluntary, unelicited bipedalism ofbonobos was recorded in a large island enclosure atPlanckendael Zoo, at a resolution of 16 pixels cm22,using RSscan Footscan 0.6 m pressure plates set in awooden walkway. Records were also made of a juvenileorang-utan at Twycross Zoo walking over a 1 m Foots-can plate with the same resolution, placed on a rigidfloor. The orang-utan was guided by its habitualkeeper by a light hand-touch, the keeper beingrequested to provide no support. Only records whereno support was evident were retained for analysis. Allsuch work was approved by zoo authorities in advanceand adhered strictly to the ASAB/ABS Guidelines [30].
2.4. Computer simulations
Forward-dynamic models used in the computer simu-lations followed previous procedures [31]: briefly,skeletal models derived from measurements of AL-288-1 and other A. afarensis specimens, taken fromthe literature, were rigged with simulated lower limbmuscles [32] with Hill-type properties, incorporatingboth parallel and serial elastic elements. The modelwas assigned alternatively chimpanzee-like or human-like mass distribution, human values being those pre-viously [31] taken from the standard anthropometryliterature [33] and chimpanzee values obtained fromsegmented specimens using a variant of the complex-pendulum technique [34]. While three-dimensional,the model was constrained to the sagittal planeto avoid lateral instability. Gait was generated usinga finite-state feed-forward controller and genetic-algorithm optimization was used to minimize metaboliccost of locomotion for each gait type/model combi-nation in a process analogous to natural selection [31].The feet were rigid with spring-damper contacts atthe heel and metatarsal heads modelling ground con-tact. Foot-pressure distribution was generated bysumming impulses transmitted through each contact.Both ‘bent-hip, bent-knee’ (BHBK) and erect gaitswere generated by random changes in the muscular acti-vation genome and the most efficient of these wereretained for the next 2000 plus iterations required toidentify stable optima [31].
J. R. Soc. Interface (2012)
3. RESULTS
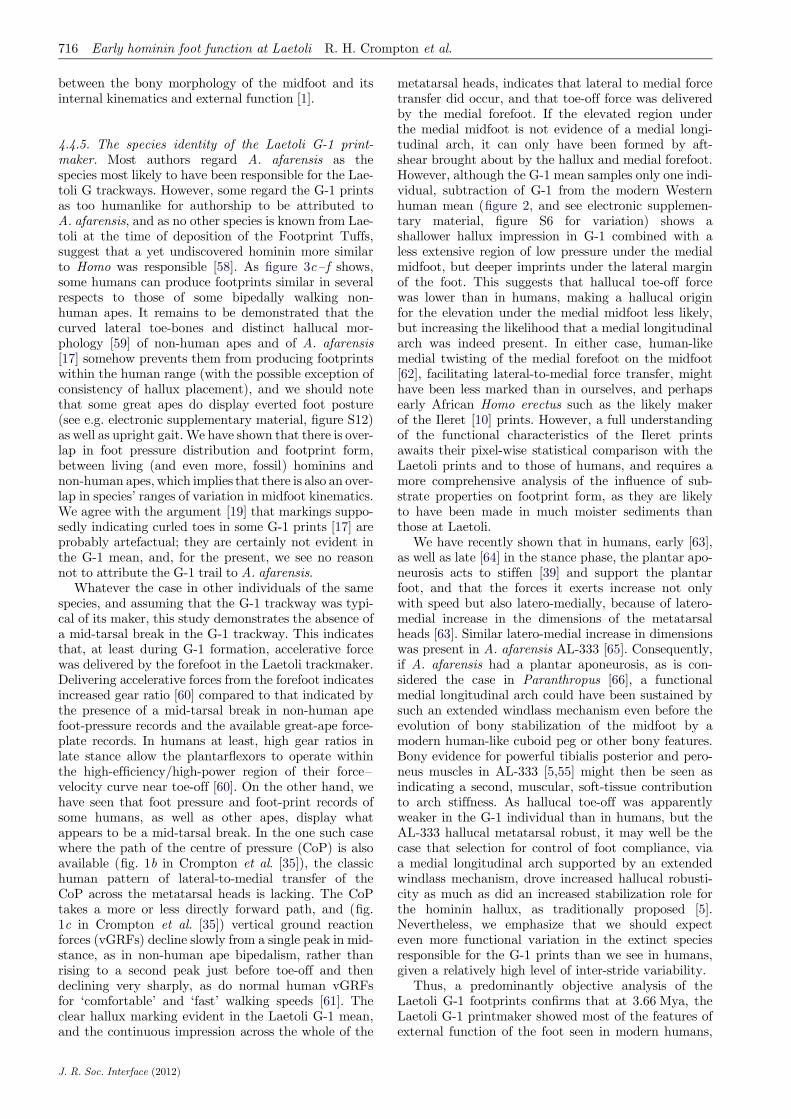
Qualitative comparison (figure 1) of normalized meansfor the three-dimensional morphology of G-1 and exper-imental footprints made in moist sand by Westernhumans (see also electronic supplementary material,figures S1, S5, S6 and movie S1) indicates several simi-larities: (i) the heel impression is substantially deeperthan that of the forefoot; (ii) there is a continuousdepression under the region of the metatarsal headsacross the whole width of the foot; (iii) there is araised area under the medial midfoot area, which doesnot extend into the lateral midfoot (see also electronicsupplementary material, movie S1); and (iv) there is aclear impression under the hallucal phalanges. Directstatistical comparison of manually registered Westernand G-1 means (figure 2 and electronic supplementarymaterial, figure S2) shows that significant differencesnevertheless exist (even though mean footprints fordifferent modern human individuals differ substantiallyin, e.g. depth under the hallux and the position andextent of the maximum depth under the metatarsals).In the Western human mean: (i) the impression in thearea of the human medial longitudinal arch is shallowerand more extensive; the midfoot impression is narrowerand its lateral margin shallower; (ii) the impressions ofthe hallucal phalanges are moderately deeper; (iii) thehallucal metatarsal and central-toe regions are some-what deeper; (iv) the rear heel impression is somewhatdeeper; and (v) the impression under the lateralmargin of the foot is shallower. Consequently, the G-1prints differ in the extent of expression of several func-tionally related characteristics from those made bymodern human feet of habitually shod individuals.However, the most appropriate comparator for theG-1 print-maker must be habitually barefoot humans,and indeed some distinguishing features of the G-1mean are recalled in published foot-pressure records[24] and a small sample of footprints (electronic sup-plementary material, figure S7) for habitually barefootindividuals: toes are somewhat fanned-out; depths andhence foot-pressure maxima are more diffuse; the mid-foot impression is broader and the elevation in themedial longitudinal arch region is less marked. SPMrequires a sufficiently high level of geometric similaritybetween images to allow registration. G-1 footprints,like modern human footprints and pressure records,are sufficiently consistent step-to-step, to allow regis-tration within-species, and close enough to those ofhumans to allow registration between-species. However,there is high inter-step variability in pressure recordingsof bonobo and orang-utan bipedalism (figure 3a,b andelectronic supplementary material, figures S8 and S9).While bonobo and orang-utan records could be regis-tered intra-species, shape/scale differences from boththe G-1 mean and multi-subject means for humanfootprint records precluded registration, so that wecan only make the qualitative observation that distinc-tions from G-1 and human footprint means are verysubstantial: particularly in the combination of evidencefor more consistent placing and intensity of hallucalphalanx contact, greater medial extent and intensityof metatarsal head contact, and greater shallowness

220 30
25
20
15
10
5
0
300
250
200
150
100
50
20 40 60 80 100 120 140 160
30
25
20
15
10
5
0
200
180
160
140
120
100
80
60
40
20
20 40 60 80 100 120 140
(a)
(b) (c)
Figure 1. Central tendency of footprints. (a) Laetoli G-1 mean in perspective. (b) Laetoli G-1 mean as greyscale depth map (n ¼ 11).(c) Habitually shod human mean as greyscale depth map (five male and five female adults, 10 trials each) walking in moist fine-sand.(b,c) Black areas indicate XY reference plane. Darker shades within the ‘footprints’ indicate greater mean depth. Dimensions inmillimetre; resolution 1 mm2. (False-colour plots in electronic supplementary material, figure S1, individual records in falsecolour in electronic supplementary material, figures S5 and S6.) (Online version in colour.)
Early hominin foot function at Laetoli R. H. Crompton et al. 711
and extent of shallow impressions under the medialmidfoot. But, treating pressure and depth as equival-ent, we did succeed in the manual registration of aremarkable single print of a habitually barefoot individ-ual from the modern village of Ileret, walking normallyand apparently asymptomatically (figure 3c), to thebonobo mean (figure 3d–f). We also registered it tothe G-1 mean (electronic supplementary material,figure S10a,b) and subsequently subtracted the regis-tered images (electronic supplementary material,figure S10c). It differs from the G-1 mean, butresembles the bonobo pressure mean, in showing adouble-peaked impression in the lateral midfoot, actu-ally deeper than that for the heel, very limited medialextent and intensity of metatarsal head contact, and avery weak hallux impression. Of course, this singleprint may be atypical of even this individual, but itseems to suggest that the G-1 mean lies within therange of asymptomatic variation of human footprints.This interpretation is further suggested by a similar
J. R. Soc. Interface (2012)
phenomenon in a published pressure record (fig. 1b inCrompton et al. [35]) from normal walking of anotherapparently asymptomatic African individual, and sucha pattern is apparently common in some African popu-lations (J.-P. Wilssens 2005, personal communication toK. D’Aout). We do not have information on the footmorphology of these individuals, but have since ident-ified a similar feature in some habitually shoe-wearing,asymptomatic individuals of British origin for whomwe have collected pressure-treadmill records (see e.g.electronic supplementary material, figure S10d), andare currently analysing internal hard and soft tissuemorphology of their feet using ultrasound.
Figure 4 shows predicted pressure under a simplifiedfoot for our forwards-dynamic simulations of uprightand BHBK gait (see also electronic supplementarymaterial, figure S4). Irrespective of mass distribution,higher pressure occurred under the hindfoot in uprightwalking, but under the forefoot in BHBK walking.Using stature, rather than the more usual hip height,

p = 0.895
p = 0
p = 0 p = 0
10
SPM
(t)
5
0
–5
–10
(a)
(b)
Figure 2. Statistical comparison of G-1 and habitually shodhuman footprints. Heel is to left, toe to right, medial aboveand lateral below in each plot. Black or white outside‘prints’ indicate XY reference plane, inside ‘prints’, regionsof no difference. Brighter areas indicate larger differences.(a) Raw statistical parametric map (SPM(t)), constructedfrom pixel-level t-tests. Lighter regions indicate where themeans differ most. (b) Thresholded inference image (heightthreshold t . 2.5, cluster-size threshold 10 pixels) showingtopological significance p of the immediately adjacent supra-threshold clusters. Significance of the t-values is greatestunder the medial midfoot, hallux and anterior heel. Dimen-sions normalized by registration. (False colour maps inelectronic supplementary material, figure S2.) (Online versionin colour.)
712 Early hominin foot function at Laetoli R. H. Crompton et al.
to derive Froude numbers (loosely, dimensionless speed,following Alexander [36]), we obtained values of approxi-mately 0.35 for optimized BHBK simulations, and 0.24for optimized erect simulations. The stride lengths inthe optimized BHBK simulations were 1.44 and 1.53 mfor chimpanzee-like and human-like mass distributionsimulations, respectively, and for optimized erect walk-ing, 0.76 and 0.85 m for the chimpanzee-like andhuman-like mass distribution simulations, respectively.
4. DISCUSSION
4.1. Effects of speed on footprint depthand morphology
A study [36] of walking speeds represented by the Lae-toli trails (using Froude numbers calculated fromstature) gave values ranging from 0.17 to 0.2. In com-parison, a ‘small town’ human walk tends to occur ata stature-based Froude number of 0.2, and a ‘big city’walk at 0.4 [37]. The self-selected/comfortable treadmillspeed for level walking has a stature-based Froudenumber of 0.34 in humans [38]. The values previouslyestimated for Laetoli [31,36] and those produced byoptimization of the current computer simulations arethus all medium/comfortable walking speeds for indi-viduals of similar stature/limb length. Walking speedin our footprint creation experiments was chosen onthe basis of the earlier estimates [29,34]. On the basisof our experimental studies of human foot pressure
J. R. Soc. Interface (2012)
[39], higher speeds would tend to produce higher press-ures under the forefoot and hindfoot, and lowerpressures under the medial midfoot. Slow walkingwould tend to produce the reverse. We expect thatthe same will be shown to apply to footprint depths,and pilot studies follow this expectation.
4.2. Effects of body mass on footprint depthand morphology
The Laetoli hominins were probably lighter as well asshorter than most modern humans. However, we con-sider this is unlikely to influence footprint form.Firstly, we are comparing not absolute depths butdepth distributions. Secondly, the mass of a subject, istransmitted to the substrate as pressure, i.e. mass/foot area. There exist relatively little data on how plan-tar foot area scales with body mass, but withinconfidence limits, scaling has been found to be isometricin both those reptiles [40] and those mammals [41] so farstudied. Therefore, it seems reasonable to assume protem that mass/foot area was broadly similar to thatin humans, and that mass differences are unlikely toexert much effect on relative depth distributionswithin footprints.
4.3. Effects of moisture on footprint depthand morphology
A previous study using experimental footprint for-mation to interpret the Laetoli footprint trail [12]used sand with at most half the moisture content, butgreater sand depth to our study. Our choice of 40 mmdepth of sand is a more accurate mimic of the sedimen-tological conditions of Laetoli G because of theexistence of rheologically incompressible layers in theLaetoli G stratigraphy at an equivalent relative depth[15,23]. Further, pilot studies showed that for the typeof sand we used, 20–30% moisture content was optimalfor retention of detail combined with reasonable foot-print depth. Below 20 per cent, areas of the footprint(especially under the metatarsal heads) tend to frag-ment, and above some 40 per cent, greater moisturedoes not increase print depth. Increasing moisturecontent initially decreases sediment strength. As theproportion of water increases, the pores fill with water,reducing sediment strength as grain-to-grain inter-actions become facilitated and lubricated, allowingmore plastic deformation to occur. However, soil mech-anics considerations [42] indicate that for any givensediment particle-type, a point will be reached wherethe incompressibility of water offsets its lubricatingeffect, and the sediment becomes less readily deformable.
4.4. The functional characteristics of the Laetolifootprint maker
4.4.1. Facultative or habitual bipedality? Early homininsare often presumed to be uncommitted or facultativebipeds. Comparison of figures 1 and 3 (and of electronicsupplementary material, figures S1 and S5 with S8 andS9) shows that G-1 prints share with humans a higherdegree of inter-step consistency than our bonobo and

125
(a) (b) (c)
(d) (e) ( f )
175
25030
25
20
15
10
5
0
200
150
100
50
150
125
100
75
50
25
100
75
50
25
20 25 50 75 100 125 150 20 60 10040 60 80 100
Figure 3. Foot pressure in orang-utan and bonobo bipedalism. Mean peak-pressure for (a) elicited bipedalism of a hand-rearedorang-utan (n ¼ 10); (b) voluntary bipedalism of naturally reared bonobos (n ¼ 11). Individual records in electronic supplemen-tary material, figures S7 and S8. (c) A footprint from a habitually barefoot human from modern Ileret, showing an apparentmid-tarsal break (resolution 1 mm2). Dimensions in millimetres, pixels 25 mm2. Darkest areas indicate the zero-data referenceplane. Intense pixels within the foot-pressure record or footprint indicate (a,b) higher relative peak pressures; (c) greater relativedepth. Light pixels to upper left of (a) and (b) are made by hallux, and indicate low pressure and highly variable posture. Intensepixels within the pressure record in (a) and (b): bottom, heel-region maximum, middle: mid-tarsal maximum, top: lateral-metatarsal maximum. (d) Bonobo mean pressure; (e) Ileret footprint, after manual registration with (d); ( f ) subtraction of(d) and (e). In the subtraction, dark surround indicates no difference, dark areas ‘inside’ the ‘print’ indicate areas of no difference,brighter areas indicate stronger differences. Dimensions normalized by registration. (False colour maps in electronic supplementarymaterial, figure S3.) (Online version in colour.)
Early hominin foot function at Laetoli R. H. Crompton et al. 713
orang-utan records. Inter-step consistency is stronglysuggestive of habitual bipedality in the G-1 printmaker.
4.4.2. Upright or bent hip, bent-knee gait? Living Afri-can apes apart from ourselves usually employ BHBKgait in their facultative bipedalism. Some have argued[17,43] that A. afarensis would have similar gaiteither as a result of considerable arboreality [17] or asa transition from knuckle-walking quadrupedalism ina purportedly chimpanzee-like common ancestor ofhumans, chimpanzees and bonobos [43]. However,BHBK gait is mechanically inefficient, because of mus-cular work required to stabilize the joints’ postureagainst gravity [44], and would result in increasedforefoot pressures, because of ankle dorsiflexion attouch-down [45]. It might be argued that the anklewould not have dorsiflexed at touchdown in the G-1
J. R. Soc. Interface (2012)
printmaker, because of differences from humans inbody-build. Our computer model of A. afarensisshows that optimized BHBK gaits with chimpanzee-like or human-like mass distribution do indeed bothhave the same dorsiflexed ankle posture at touchdown, leading to near-simultaneous full-foot, or forefoottouchdown (electronic supplementary material, moviesS2 and S3). However, in both erect walking simulations,the heel contacts first (electronic supplementarymaterial, movies S4 and S5). Further, in the BHBKgait, the line of action of the centre of mass liesbehind the knee, but in front of the ankle [45] (elec-tronic supplementary material, movies S2 and S3).Both characteristics will increase forefoot pressure rela-tive to hindfoot pressure and thus predict deeperforefoot impressions and reduced hindfoot impressions.Our present three-dimensional Laetoli G-1 mean data

0.15(a)
(b)
(c)
(d)
15
10
5
0
15
10
5
0
15
10
5
0
15
10
5
0
0.100.05
0.2 0.4 0.6 0.8 1.0 1.2
x (m)
BHBK human mass distribution
BHBK chimp mass distribution
upright chimp mass distribution
upright human mass distribution
1.4 1.6 1.8 2.0 2.2
y (m
)0
–0.05–0.10
0.150.100.05
y (m
)
0–0.05–0.10
0.150.100.05
y (m
)
0–0.05–0.10
0.150.100.05
y (m
)
0–0.05–0.10
Figure 4. Predicted foot pressure in alternative simulated A. afarensis gaits. Predicted foot pressure (impulse, Ns, over 40 mm2
areas) from a simulation of A. afarensis in: (a,b) BHBK gait; (c,d) upright gait. (a,c) Results with chimpanzee-like massdistribution; (b,d) with human-like mass distribution. Dark areas ‘outside’ the ‘prints’ indicate the zero-data reference plane,dark areas within the ‘prints’ the highest predicted pressure, lighter areas lower pressure. (False colour maps in electronicsupplementary material, figure S4.) (Online version in colour.)
714 Early hominin foot function at Laetoli R. H. Crompton et al.
(figure 1) show that heel impressions are substantiallydeeper than forefoot impressions, as predicted by bothour A. afarensis simulations of erect walking.
As previously stated, our three-dimensional laserscans were at millimetric resolution, and pixel depthwas measured with reference to a plane fitted to 10random points on the land-surface well outside the foot-print margin. Sloping of the original land-surface mightintroduce a potential bias in relative depths of the heeland toe impressions, and indeed the Laetoli G areashows a 28 dip [23]. Nevertheless, when we adjustedprint orientation to allow for different up- and down-slopes, disparity in heel versus toe depth was noteliminated until we adjusted print orientation to allowfor 15 per cent (8.538) upslope of the G-1 sediments(electronic supplementary material, figure S11). How-ever, a previous attempt [12] to test whether theLaetoli G-1 printmaker walked erect, or BHBK bycomparing experimental footprints for humans walkingerect and BHBK in sand, suggested that the G-1footprints had near-equal heel and toe depths.The average absolute footprint depths presented inthis previous study [12] are four times greater thanthe mean depths we obtained from carefully alignedlaser scans of the original casts. The cause of this discre-pancy between our work and the previous paper [12] isdifficult to assess as the latter provides limited expla-nation of the derivation of absolute heel and toedepth values from the contour plots in the (Leakey
J. R. Soc. Interface (2012)
and Harris) Laetoli monograph, and of the location,orientation and derivation of the reference plane fromwhich their depth values were measured, so that itwas impossible to reproduce their calculations. Wereiterate that our plotted depth values are calculatedwith reference to a plane fitted to 10 points on thescanned palaeosurface well outside the print outline orany associated push-up structure. The previous study[12] gave raw mean heel-depths and mean toe-depthsof 124.94 and 131.65 mm, respectively, and, afteradjustment for a stated but unreferenced 38 upslope ofthe G locality, mean toe depth of 125.05 mm. Theseabsolute depths would place the palaeosurface abovethe level of an adult human ankle joint. Indeed, thepeak corrected toe depth given, 195.8 mm, is in excessof the 120–150 mm total depth of both units of the Lae-toli Footprint Tuff. We can only assume that when theauthors state that only relative depths are important,they are calculating depths relative to a hypotheticalreference plane located well above the level of thepalaeosurface [12]. Our measured depths are compatiblewith the published depths of the Laetoli Footprint Tuffashfall units above the incompressible sub-layers[15,23]. Given that approximately 15 per cent upslopeis required to produce equal heel and toe depths usingour data and methodology, we are confident that ourresults therefore provide more definitive and unequivo-cal evidence that an efficient, upright gait wasemployed by the Laetoli printmaker.
Early hominin foot function at Laetoli R. H. Crompton et al. 715
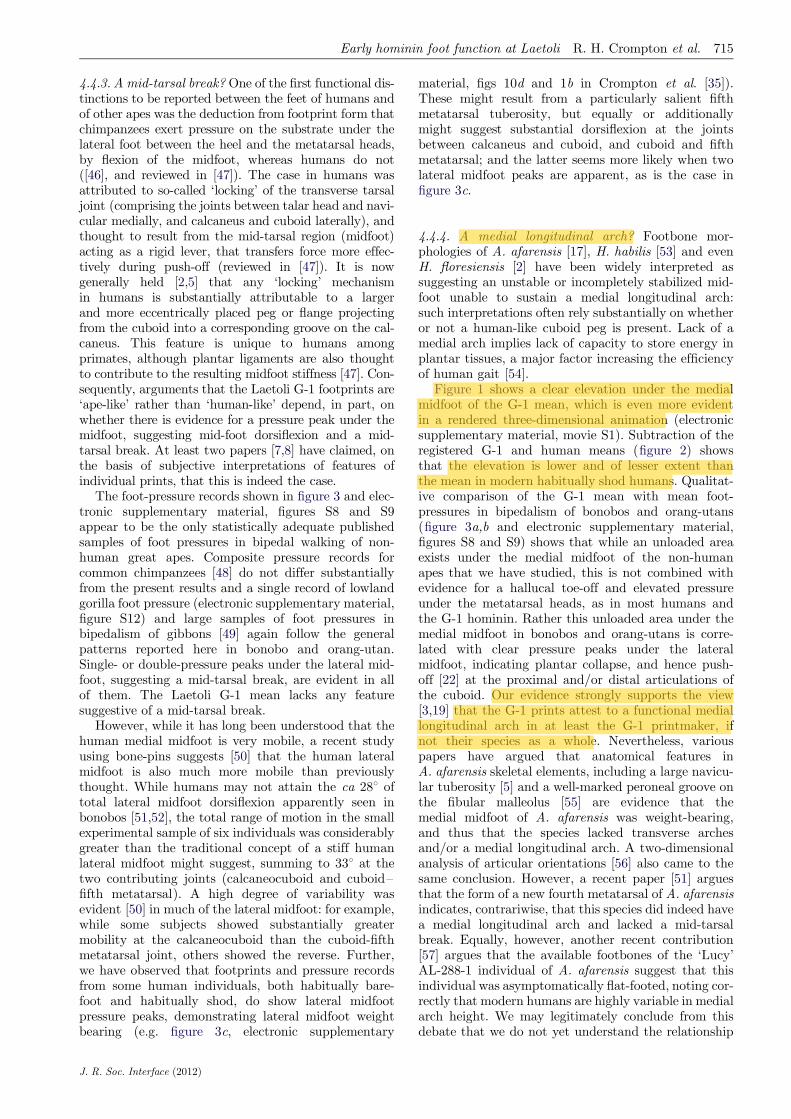
4.4.3. A mid-tarsal break? One of the first functional dis-tinctions to be reported between the feet of humans andof other apes was the deduction from footprint form thatchimpanzees exert pressure on the substrate under thelateral foot between the heel and the metatarsal heads,by flexion of the midfoot, whereas humans do not([46], and reviewed in [47]). The case in humans wasattributed to so-called ‘locking’ of the transverse tarsaljoint (comprising the joints between talar head and navi-cular medially, and calcaneus and cuboid laterally), andthought to result from the mid-tarsal region (midfoot)acting as a rigid lever, that transfers force more effec-tively during push-off (reviewed in [47]). It is nowgenerally held [2,5] that any ‘locking’ mechanismin humans is substantially attributable to a largerand more eccentrically placed peg or flange projectingfrom the cuboid into a corresponding groove on the cal-caneus. This feature is unique to humans amongprimates, although plantar ligaments are also thoughtto contribute to the resulting midfoot stiffness [47]. Con-sequently, arguments that the Laetoli G-1 footprints are‘ape-like’ rather than ‘human-like’ depend, in part, onwhether there is evidence for a pressure peak under themidfoot, suggesting mid-foot dorsiflexion and a mid-tarsal break. At least two papers [7,8] have claimed, onthe basis of subjective interpretations of features ofindividual prints, that this is indeed the case.
The foot-pressure records shown in figure 3 and elec-tronic supplementary material, figures S8 and S9appear to be the only statistically adequate publishedsamples of foot pressures in bipedal walking of non-human great apes. Composite pressure records forcommon chimpanzees [48] do not differ substantiallyfrom the present results and a single record of lowlandgorilla foot pressure (electronic supplementary material,figure S12) and large samples of foot pressures inbipedalism of gibbons [49] again follow the generalpatterns reported here in bonobo and orang-utan.Single- or double-pressure peaks under the lateral mid-foot, suggesting a mid-tarsal break, are evident in allof them. The Laetoli G-1 mean lacks any featuresuggestive of a mid-tarsal break.
However, while it has long been understood that thehuman medial midfoot is very mobile, a recent studyusing bone-pins suggests [50] that the human lateralmidfoot is also much more mobile than previouslythought. While humans may not attain the ca 288 oftotal lateral midfoot dorsiflexion apparently seen inbonobos [51,52], the total range of motion in the smallexperimental sample of six individuals was considerablygreater than the traditional concept of a stiff humanlateral midfoot might suggest, summing to 338 at thetwo contributing joints (calcaneocuboid and cuboid–fifth metatarsal). A high degree of variability wasevident [50] in much of the lateral midfoot: for example,while some subjects showed substantially greatermobility at the calcaneocuboid than the cuboid-fifthmetatarsal joint, others showed the reverse. Further,we have observed that footprints and pressure recordsfrom some human individuals, both habitually bare-foot and habitually shod, do show lateral midfootpressure peaks, demonstrating lateral midfoot weightbearing (e.g. figure 3c, electronic supplementary
J. R. Soc. Interface (2012)
material, figs 10d and 1b in Crompton et al. [35]).These might result from a particularly salient fifthmetatarsal tuberosity, but equally or additionallymight suggest substantial dorsiflexion at the jointsbetween calcaneus and cuboid, and cuboid and fifthmetatarsal; and the latter seems more likely when twolateral midfoot peaks are apparent, as is the case infigure 3c.
4.4.4. A medial longitudinal arch? Footbone mor-phologies of A. afarensis [17], H. habilis [53] and evenH. floresiensis [2] have been widely interpreted assuggesting an unstable or incompletely stabilized mid-foot unable to sustain a medial longitudinal arch:such interpretations often rely substantially on whetheror not a human-like cuboid peg is present. Lack of amedial arch implies lack of capacity to store energy inplantar tissues, a major factor increasing the efficiencyof human gait [54].
Figure 1 shows a clear elevation under the medialmidfoot of the G-1 mean, which is even more evidentin a rendered three-dimensional animation (electronicsupplementary material, movie S1). Subtraction of theregistered G-1 and human means (figure 2) showsthat the elevation is lower and of lesser extent thanthe mean in modern habitually shod humans. Qualitat-ive comparison of the G-1 mean with mean foot-pressures in bipedalism of bonobos and orang-utans(figure 3a,b and electronic supplementary material,figures S8 and S9) shows that while an unloaded areaexists under the medial midfoot of the non-humanapes that we have studied, this is not combined withevidence for a hallucal toe-off and elevated pressureunder the metatarsal heads, as in most humans andthe G-1 hominin. Rather this unloaded area under themedial midfoot in bonobos and orang-utans is corre-lated with clear pressure peaks under the lateralmidfoot, indicating plantar collapse, and hence push-off [22] at the proximal and/or distal articulations ofthe cuboid. Our evidence strongly supports the view[3,19] that the G-1 prints attest to a functional mediallongitudinal arch in at least the G-1 printmaker, ifnot their species as a whole. Nevertheless, variouspapers have argued that anatomical features inA. afarensis skeletal elements, including a large navicu-lar tuberosity [5] and a well-marked peroneal groove onthe fibular malleolus [55] are evidence that themedial midfoot of A. afarensis was weight-bearing,and thus that the species lacked transverse archesand/or a medial longitudinal arch. A two-dimensionalanalysis of articular orientations [56] also came to thesame conclusion. However, a recent paper [51] arguesthat the form of a new fourth metatarsal of A. afarensisindicates, contrariwise, that this species did indeed havea medial longitudinal arch and lacked a mid-tarsalbreak. Equally, however, another recent contribution[57] argues that the available footbones of the ‘Lucy’AL-288-1 individual of A. afarensis suggest that thisindividual was asymptomatically flat-footed, noting cor-rectly that modern humans are highly variable in medialarch height. We may legitimately conclude from thisdebate that we do not yet understand the relationship
716 Early hominin foot function at Laetoli R. H. Crompton et al.
between the bony morphology of the midfoot and itsinternal kinematics and external function [1].
4.4.5. The species identity of the Laetoli G-1 print-maker. Most authors regard A. afarensis as thespecies most likely to have been responsible for the Lae-toli G trackways. However, some regard the G-1 printsas too humanlike for authorship to be attributed toA. afarensis, and as no other species is known from Lae-toli at the time of deposition of the Footprint Tuffs,suggest that a yet undiscovered hominin more similarto Homo was responsible [58]. As figure 3c–f shows,some humans can produce footprints similar in severalrespects to those of some bipedally walking non-human apes. It remains to be demonstrated that thecurved lateral toe-bones and distinct hallucal mor-phology [59] of non-human apes and of A. afarensis[17] somehow prevents them from producing footprintswithin the human range (with the possible exception ofconsistency of hallux placement), and we should notethat some great apes do display everted foot posture(see e.g. electronic supplementary material, figure S12)as well as upright gait. We have shown that there is over-lap in foot pressure distribution and footprint form,between living (and even more, fossil) hominins andnon-human apes, which implies that there is also an over-lap in species’ ranges of variation in midfoot kinematics.We agree with the argument [19] that markings suppo-sedly indicating curled toes in some G-1 prints [17] areprobably artefactual; they are certainly not evident inthe G-1 mean, and, for the present, we see no reasonnot to attribute the G-1 trail to A. afarensis.
Whatever the case in other individuals of the samespecies, and assuming that the G-1 trackway was typi-cal of its maker, this study demonstrates the absence ofa mid-tarsal break in the G-1 trackway. This indicatesthat, at least during G-1 formation, accelerative forcewas delivered by the forefoot in the Laetoli trackmaker.Delivering accelerative forces from the forefoot indicatesincreased gear ratio [60] compared to that indicated bythe presence of a mid-tarsal break in non-human apefoot-pressure records and the available great-ape force-plate records. In humans at least, high gear ratios inlate stance allow the plantarflexors to operate withinthe high-efficiency/high-power region of their force–velocity curve near toe-off [60]. On the other hand, wehave seen that foot pressure and foot-print records ofsome humans, as well as other apes, display whatappears to be a mid-tarsal break. In the one such casewhere the path of the centre of pressure (CoP) is alsoavailable (fig. 1b in Crompton et al. [35]), the classichuman pattern of lateral-to-medial transfer of theCoP across the metatarsal heads is lacking. The CoPtakes a more or less directly forward path, and (fig.1c in Crompton et al. [35]) vertical ground reactionforces (vGRFs) decline slowly from a single peak in mid-stance, as in non-human ape bipedalism, rather thanrising to a second peak just before toe-off and thendeclining very sharply, as do normal human vGRFsfor ‘comfortable’ and ‘fast’ walking speeds [61]. Theclear hallux marking evident in the Laetoli G-1 mean,and the continuous impression across the whole of the
J. R. Soc. Interface (2012)
metatarsal heads, indicates that lateral to medial forcetransfer did occur, and that toe-off force was deliveredby the medial forefoot. If the elevated region underthe medial midfoot is not evidence of a medial longi-tudinal arch, it can only have been formed by aft-shear brought about by the hallux and medial forefoot.However, although the G-1 mean samples only one indi-vidual, subtraction of G-1 from the modern Westernhuman mean (figure 2, and see electronic supplemen-tary material, figure S6 for variation) shows ashallower hallux impression in G-1 combined with aless extensive region of low pressure under the medialmidfoot, but deeper imprints under the lateral marginof the foot. This suggests that hallucal toe-off forcewas lower than in humans, making a hallucal originfor the elevation under the medial midfoot less likely,but increasing the likelihood that a medial longitudinalarch was indeed present. In either case, human-likemedial twisting of the medial forefoot on the midfoot[62], facilitating lateral-to-medial force transfer, mighthave been less marked than in ourselves, and perhapsearly African Homo erectus such as the likely makerof the Ileret [10] prints. However, a full understandingof the functional characteristics of the Ileret printsawaits their pixel-wise statistical comparison with theLaetoli prints and to those of humans, and requires amore comprehensive analysis of the influence of sub-strate properties on footprint form, as they are likelyto have been made in much moister sediments thanthose at Laetoli.
We have recently shown that in humans, early [63],as well as late [64] in the stance phase, the plantar apo-neurosis acts to stiffen [39] and support the plantarfoot, and that the forces it exerts increase not onlywith speed but also latero-medially, because of latero-medial increase in the dimensions of the metatarsalheads [63]. Similar latero-medial increase in dimensionswas present in A. afarensis AL-333 [65]. Consequently,if A. afarensis had a plantar aponeurosis, as is con-sidered the case in Paranthropus [66], a functionalmedial longitudinal arch could have been sustained bysuch an extended windlass mechanism even before theevolution of bony stabilization of the midfoot by amodern human-like cuboid peg or other bony features.Bony evidence for powerful tibialis posterior and pero-neus muscles in AL-333 [5,55] might then be seen asindicating a second, muscular, soft-tissue contributionto arch stiffness. As hallucal toe-off was apparentlyweaker in the G-1 individual than in humans, but theAL-333 hallucal metatarsal robust, it may well be thecase that selection for control of foot compliance, viaa medial longitudinal arch supported by an extendedwindlass mechanism, drove increased hallucal robusti-city as much as did an increased stabilization role forthe hominin hallux, as traditionally proposed [5].Nevertheless, we emphasize that we should expecteven more functional variation in the extinct speciesresponsible for the G-1 prints than we see in humans,given a relatively high level of inter-stride variability.
Thus, a predominantly objective analysis of theLaetoli G-1 footprints confirms that at 3.66 Mya, theLaetoli G-1 printmaker showed most of the features ofexternal function of the foot seen in modern humans,

Early hominin foot function at Laetoli R. H. Crompton et al. 717
albeit expressed to a lesser degree and very likelyimplemented by a different internal bony morphologicalconfiguration. Walking was certainly erect, and externalfunction of the foot was probably characterized by afunctional longitudinal medial arch, lateral-to-medialforce transfer and toe-off force delivered by a consistentlyplaced hallux, the combination of which at least is veryunusual, if not absent, in any living non-human ape.Remarkably, variability in modern human foot-pressurerecords and footprints suggests that mean morphologyof the 3.66 million year old G-1 prints may lie wellwithin the range of asymptomatic modern-humanvariation.
Procedures approved by University of Liverpool ResearchEthics Committee (approval RETH 000088).
This research was funded by The Leverhulme Trust andThe Natural Environment Research Council, UK. Wethank Dr Emma Mbua of the National Museum of Kenyafor permission to scan first-generation casts of the LaetoliG-1 footprints; Dr Jack Harris (Rutgers University) andstaff and students of the Koobi Fora Field School forassistance in collecting the modern Ileret footprint data,Chester and Planckendael zoos for observational access tothe great apes in their care, Drs Ronald J. Clarke andCraig Feibel for advice on Laetoli taphonomy, and theeditor and anonymous referees for helpful and stimulatingcomment.
REFERENCES
1 Wolf, P., Stacoff, A. & Stussi, E. 2004 Modelling of thepassive mobility in human tarsal gears: implications fromthe literature. The Foot 24, 23–34. (doi:10.1016/j.foot.2003.09.002)
2 Jungers, W. L., Harcourt-Smith, W. E. H., Wunderlich,R. E., Tocheri, M. W., Larson, S. G., Sutikna, T., AweDue, R. & Morwood, M. J. 2009 The foot of Homofloresiensis. Nature 459, 81–84. (doi:10.1038/nature07989)
3 Day, M. H. & Napier, J. R. 1964 Fossil foot bones. Nature201, 969–970. (doi:10.1038/201969a0)
4 Kidd, R. S., O’Higgins, P. & Oxnard, C. E. 1996 The OH8foot: a reappraisal of the hindfoot utilizing a multivariateanalysis. J. Hum. Evol. 31, 269–291. (doi:10.1006/jhev.1996.0061)
5 Harcourt-Smith, W. E. H. & Aiello, L. C. 2004 Fossils, feetand the evolution of human bipedal locomotion. J. Anat.204, 403–416. (doi:10.1111/j.0021-8782.2004.00296.x)
6 Day, M. H. & Wickens, E. H. 1980 Laetoli Pliocene homi-nid footprints and bipedalism. Nature 286, 385–387.(doi:10.1038/286385a0)
7 Meldrum, D. J. 2004 Fossilized Hawaiian footprints com-pared with Laetoli Hominid footprints. In From biped tostrider (eds D. J. Meldrum & C. E. Hilton), pp. 63–84.New York, NY: Kluwer.
8 Meldrum, D. J., Lockley, M. G., Lucas, S. G. & Musiba, C.2011 Ichnotaxonomy of the Laetoli trackways: the earliesthominin footprints. J. Afr. Earth Sci. 60, 1–12. (doi:10.1016/j.jafrearsci.2011.01.003)
9 Allen, J. R. L. 1997 Subfossil mammalian tracks (Flan-drian) in the Severn estuary, S.W. Britain: mechanics offormation, preservation and distribution. Phil.Trans. R. Soc. Lond. B 352, 481–519. (doi:10.1098/rstb.1997.0035)
J. R. Soc. Interface (2012)
10 Bennett, M. R. et al. 2009 Early Hominin foot morphologybased on 1.5-million-year-old footprints from Ileret,Kenya. Science 323, 1197–1201. (doi:10.1126/science.1168132)
11 D’Aout, K., Meert, L., Van Gheluwe, B., De Clercq, D. &Aerts, P. 2010 Experimentally generated footprints insand: analysis and consequences for the interpretation offossil and forensic footprints. Am. J. Phys. Anthropol.141, 515–525. (doi:10.1002/ajpa.21169)
12 Raichlen, D. A., Gordon, A. D., Harcourt-Smith, W. E. H.,Foster, A. D. & Randall Hass, W. 2010 Laetoli footprintspreserve earliest evidence of human-like bipedal biomecha-nics. PLoS ONE 5, e9769. (doi:10.1371/journal.pone.0009769)
13 Deino, A. 2011 40Ar/39Ar dating of Laetoli, Tanzania. InPaleontology and dating of Laetoli: human evolution incontext. Geology, geochronology, paleoecology andpalaeoenvironment, vertebrate paleobiology and paleoan-thropology vol. 1, (ed. T. Harrison), pp. 77–97. TheNetherlands: Springer Science þ Business Media.
14 Leakey, M. D. 1987 The Hominid footprints: introduction.In Laetoli: a Pliocene site in Northern Tanzania (edsM. D. Leakey & J. M. Harris), pp. 490–496. Oxford,UK: Oxford University Press.
15 Barker, D. S. & Milliken, K. L. 2008 Cementation of theFootprint Tuff, Laetoli, Tanzania. Can. Mineralogist 46,831–841. (doi:10.3749/canmin.46.4.831)
16 Agnew, N. & Demas, M. 1998 Preserving the Laetolifootprints. Sci. Am. 279, 43–55. (doi:10.1038/scientificamerican0998-44)
17 Stern, J. T. & Susman, R. L. 1983 The locomotor anatomyof Australopithecus afarensis. Am. J. Phys. Anthropol. 60,279–317. (doi:10.1002/ajpa.1330600302)
18 Deloison, Y. 1991 Les australopitheques marchaient-ilscomme nous? Origine(s) de la bipedie chez les Hominides.(eds B. Senut & Y. Coppens), pp. 177–186. Paris, France:CNRS.
19 White, T. D. & Suwa, G. 1987 Hominid footprints atLaetoli: facts and interpretations. Am. J. Phys. Anthropol.72, 485–514. (doi:10.1002/ajpa.1330720409)
20 Pataky, T. C., Goulermas, J. Y. & Crompton, R. H. 2008A comparison of seven methods of within-subjects rigidbody pedobarographic image registration. J. Biomech.41, 3085–3089. (doi:10.1016/j.jbiomech.2008.08.001)
21 Thorpe, S. K. S. & Crompton, R. H. 2006 Orang-utanpositional behavior and the nature of arboreal locomotionin Hominoidea. Am. J. Phys. Anthropol. 131, 384–401.(doi:10.1002/ajpa.20422)
22 Crompton, R. H., Vereecke, E. E. & Thorpe, S. K. S.2008 Locomotion and posture from the common homi-noid ancestor to fully modern hominins, with specialreference to the last common panin/hominin ancestor.J. Anat. 212, 501–543. (doi:10.1111/j.1469-7580.2008.00870.x)
23 Hay, R. L. 1987 Geology of the Laetoli area. In Laetoli: aPliocene site in Northern Tanzania (eds M. D. Leakey &J. M. Harris), pp. 23–47. Oxford, UK: Oxford UniversityPress.
24 D’Aout, K. D., Pataky, T. C., De Clerq, D. & Aerts, P.2010 The effects of habitual footwear use: foot shapeand function in native barefoot walkers. Footwear Sci. 1,81–94. (doi:10.1080/19424280903386411)
25 Feibel, C. S. 2008 Microstratigraphy and Taphonomy ofHominid footprints at Laetoli. A Report on the 1995Field Season. Report to the Getty Conservation Institute,CA, USA.
26 Friston, K. J., Ashburner, J. T., Kiebel, S. J., Nichols,T. E. & Penny, W. D. 2007 Statistical parametric

718 Early hominin foot function at Laetoli R. H. Crompton et al.
mapping: the analysis of functional brain images. Amster-dam, The Netherlands: Elsevier/Academic Press.
27 Maintz, J. B. A. & Viergever, M. A. 1998 A survey ofmedical image registration. Med. Image Anal. 2, 1–37.(doi:10.1016/S1361-8415(01)80026-8)
28 Pataky, T. C. 2010 Generalized n-dimensional biomecha-nical field analysis using statistical parametric mapping.J. Biomech. 43, 1976–1982. (doi:10.1016/j.jbiomech.2010.03.008)
29 Deschamps, K., Birch, I., Mc Innes, J., Desloovere, K. &Matriacali, G. A. 2009 Inter-and intra-observer reliabilityof masking in plantar pressure measurement analysis. GaitPosture 30, 379–382. (doi:10.1016/j.gaitpost.2009.06.015)
30 Animal Behaviour Society. 2006 Guidelines for the treat-ment of animals in behavioural research and teaching.Anim. Behav. 71, 245–253. (doi:10.1016/j.anbehav.2005.10.001)
31 Sellers, W. I., Cain, G. M., Wang, W.-J. & Crompton,R. H. 2005 Stride lengths, speed and energy costs inwalking of Australopithecus afarensis: using evolutio-nary robotics to predict locomotion of early humanancestors. J. R. Soc. Interface 2, 431–441. (doi:10.1098/rsif.2005.0060)
32 Umberger, B. R., Gerritsen, K. G. M. & Martin, P. E. 2003A model of human muscle energy expenditure. Comp.Methods Biomech. Biomed. Eng. 6, 99–111. (doi:10.1080/1025584031000091678)
33 Dempster, W. T. 1955 Space requirements of the seatedoperator. Aerospace Medical Research LaboratoryWADC technical report 55/159. Wright-Patterson AirForce Base, OH, USA.
34 Crompton, R. H., Li, Y., Gunther, M. M. & Alexander,R. McN. 1996 Segment inertial properties of primates:new techniques for laboratory and field studies of loco-motion. Am. J. Phys. Anthropol. 99, 547–570. (doi:10.1002/(SICI)1096-8644(199604)99:4,547::AID-AJPA3.
3.0.CO;2-R)35 Crompton, R. H., Sellers, W. I. & Thorpe, S. K. S.
2010 Arboreality, terrestriality and bipedalism. Phil.Trans. R. Soc. B 365, 3301–3314. (doi:10.1098/rstb.2010.0035)
36 Alexander, R. McN. 1984 Stride length and speed foradults, children, and fossil hominids. Am. J. Phys. Anthro-pol. 63, 23–27. (doi:10.1002/ajpa.1330630105)
37 Bornstein, M. N. & Bornstein, H. G. 1976 The pace of life.Nature 259, 557–558. (doi:10.1038/259557a0)
38 Minetti, A., Boldrini, L., Brusamolin, L., Zamparo, P. &McKee, T. 2003 A feedback-controlled treadmill (tread-mill-on-demand) and the spontaneous speed of walkingand running in humans. J. Appl. Physiol. 95, 838–843.(doi:10.1152/japplphysiol.00128.2003)
39 Pataky, T. C., Caravaggi, P., Savage, R., Parker, D.,Goulermas, J. Y., Sellers, W. I. & Crompton, R. H. 2008New insights into the plantar pressure correlates of walk-ing speed using pedobarographic statistical parametricmapping (pSPM). J. Biomech. 41, 1987–1994. (doi:10.1016/j.jbiomech.2008.03.034)
40 Kubo, T. 2011 Estimating body weight from footprints:application to pterosaurs. Palaeogeogr., Palaeocli-matol., Palaeoecol. 299, 197–199. (doi:10.1016/j.palaeo.2010.11.001)
41 Michilsens, F., Aerts, P., Van Damme, R. & D’Aout, K.2009 Scaling of plantar pressure in mammals. J. Zool.279, 236–242. (doi:10.1111/j.1469-7998.2009.00611.x)
42 Craig, R. F. 1974 Soil mechanics. London: Van NostrandReinhold.
43 Raichlen, D. A., Pontzer, H. & Sockol, M. D. 2008 TheLaetoli footprints and early Hominin locomotor
J. R. Soc. Interface (2012)
kinematics. J. Hum. Evol. 54, 112–117. (doi:10.1016/j.jhevol.2007.07.005)
44 Alexander, R. McN. 1991 Characteristics and advantagesof human bipedalism. In Biomechanics in evolution(eds J. M. V. Rayner & R. J. Wooton), pp. 255–266.Cambridge, UK: Cambridge University Press.
45 Crompton, R. H., Li, Y., Wang, W., Gunther, M. &Savage, R. 1998 The mechanical effectiveness of erectand ‘bent-hip, bent-knee’ bipedal walking in Australo-pithecus afarensis. J. Hum. Evol. 35, 55–74. (doi:10.1006/jhev.1998.0222)
46 Elftman, H. & Manter, J. 1935 Chimpanzee and humanfeet in bipedal walking. Am. J. Phys. Anthropol. 20,69–79. (doi:10.1002/ajpa.1330200109)
47 DeSilva, J. M. 2010 Revisiting the ‘midtarsal break’.Am. J. Phys. Anthropol 141, 245–258. (doi:10.1002/ajpa.21140)
48 Wunderlich, R. E. 1999 Pedal form and plantar pressuredistribution in anthropoid primates. PhD thesis, Bell &Howell UMI Dissertation Services, Ann Arbor, USA.
49 Vereecke, E.E.,D’Aout,K.,De Clercq,D.,VanElsacker, L.&Aerts, P. 2005 Functional analysis of the gibbon foot duringterrestrial bipedal walking: plantar pressure distributionsand 3D ground reaction forces. Am. J. Phys. Anthropol.128, 659–669. (doi:10.1002/ajpa.20158)
50 Lundgren, P., Nester, C., Liu, A., Arndt, A., Jones, R.,Stacoff, A., Wolf, P. & Lundberg, A. 2008 Invasive invivo measurement of rear-, mid- and forefoot motionduring walking. Gait Posture 28, 93–100. (doi:10.1016/j.gaitpost.2007.10.009)
51 Ward, C. V., Kimbel, W. H. & Johanson, D. C. 2011 Com-plete fourth metatarsal and arches in the foot ofAustralopithecus afarensis. Science 331, 750–753.(doi:10.1126/science.1201463)
52 D’Aout, K., Aerts, P., De Clercq, D., De Meester, K. &Van Elsacker, L. 2002 Segment and joint angles of hindlimb during bipedal and quadrupedal walking of thebonobo (Pan paniscus). Am J. Phys. Anthropol. 119,37–51. (doi:10.1002/ajpa.10112)
53 Gebo, D. L. & Schwartz, G. T. 2006 Foot bones from Omo:implications for hominid evolution. Am. J. Phys. Anthro-pol. 129, 499–511. (doi:10.1002/ajpa.20320)
54 Ker, R. F., Bennett, M. B., Bibby, S. R., Kester, R. C. &Alexander, R. McN. 1987 The spring in the arch of thehuman foot. Nature 325, 147–149. (doi:10.1038/325147a0)
55 Sarmiento, E. 1991 Functional and phylogenetic impli-cations of the differences in the pedal skeleton ofaustralopithecines. Am. J. Phys. Anthropol. 12(suppl.), 157.
56 Berillon, G. 2003 Assessing the longitudinal structure ofthe early hominid foot: a two-dimensional architectureanalysis. Hum. Evol. 118, 113–122. (doi:10.1007/BF02436280)
57 DeSilva, J. M. & Throckmorton, Z. J. 2010 Lucy’s flat feet:the relationship between the ankle and rearfoot arching inearly Hominins. PLoS ONE 5, e14432. (doi:10.1371/journal.pone.0014432)
58 Tuttle, R. H. 1987 Kinesiological inferences and evolution-ary implications from Laetoli bipedal trails G-1, G-2/3 andA0. In Laetoli: a Pliocene site in Northern Tanzania (edsM. D. Leakey & J. M. Harris), pp. 503–523. Oxford,UK: Oxford University Press.
59 Proctor, D. J. 2010 Shape analysis of the MT 1 proximalarticular surface in fossil Hominins and shod and unshodHomo. Am. J. Phys. Anthropol. 143, 631–637. (doi:10.1002/ajpa.21404)
60 Carrier, D. R., Heglund, N. C. & Earls, K. D. 1994 Variablegearing during locomotion in the human musculoskeletal

Early hominin foot function at Laetoli R. H. Crompton et al. 719
ViewView
system. Science 265, 651–653. (doi:10.1126/science.8036513)
61 Li, Y., Crompton, R. H., Gunther, M. M., Alexander,R. McN. & Wang, W. J. 1996 Characteristics of groundreaction forces in normal and chimpanzee-like bipedalwalking by humans. Folia Primatol. 66, 13–159. (doi:10.1159/000157191)
62 MacConaill, M. A. 1954 The postural mechanism of thehuman foot. Proc. R. Irish Acad. 50B, 265–278.
63 Caravaggi, P., Pataky, T., Goulermas, J. Y., Savage, R. &Crompton, R. H. 2009 A dynamic model of the windlassmechanism of the foot: evidence for early stance phase
J. R. Soc. Interface (2012)
publication stats publication stats
preloading of the plantar aponeurosis. J. Exp. Biol. 212,2491–2499. (doi:10.1242/jeb.025767)
64 Hicks, J. H. 1953 The mechanics of the foot. II. The plan-tar aponeurosis and the arch. J. Anat. 88, 25–30.
65 Latimer, B., Lovejoy, C. O., Johansen, D. C. & Coppens,Y. 1982 Hominid tarsal, metatarsal, and phalangealbones recovered from the Hadar formation: 1974–1977 col-lections. Am. J. Phys. Anthropol. 57, 701–719. (doi:10.1002/ajpa.1330570412)
66 Susman, R. L. & Brain, T. M. 1988 New first metatarsal fromSwartkrans and the gait of Paranthropus robustus. Am. J.Phys. Anthropol. 77, 7–15. (doi:10.1002/ajpa.1330770103)