Embed Size (px)
Citation preview

HUMAN IMPACT ON CLIMATE CHANGE
Chapter 8

PALEOCLIMATOLOGY
Evidence of Past Climate Change
• We will focus on Tree rings & Ice cores• • There are actually more, for a comprehensive list see:
http://www.ncdc.noaa.gov/paleo/globalwarming/proxydata.html
• When these independent lines of evidence are combined, a more complete picture of past climate change can be formed.
• Only by understanding the natural cycles of past climate change before humans became such a large presence on the planet, can we determine if humans have affected or are affecting the climate.

Quick Lab: Climate & Tree Growth (Page 297 )
• Arrange the tree cores so that you have a continuous record from 1959 to 2008.
• ANSWER:• Has climate
changed during this time period?
• What is the evidence?
• HW: Follow procedure & Answer questions #5 - 8

Tree Ring Data• Most tree ring data shows several decades• Some trees on the Bruce Peninsula are 400 years old• Oldest known tree is about 8000 years old
• Three major climatic factors affect tree growth– Sunlight, water and carbon dioxide
• Indirect (Proxy) Evidence of Climate Change
• Patterns from Ring Data– Thick ring = more growth
• More photosynthesis due to higher CO2 in air, which leads to a higher temperature• More precipitation• More sunlight
– Thin ring = slower growth • Less photosynthesis due to lower CO2 in air, which leads to lower temperature• Less precipitation• Less sunlight

Ice Core Data• Trapped air bubbles contains samples
of ancient atmosphere
• Direct evidence of Climate Change
• These gases that can be analyzed
• Long-term patterns (400, 000 years)

What do these graphs show?

Correlation vs. Cause & Effect
• Analyzing graphs is a useful skill, but you must be careful
• The ice core data shows correlation between atmospheric CO2 and temperature, it does not show cause & effect

Direct Temperature Measurements Show That The Earth is Warming
• Thermometers• Satellite Remote Sensing• Watch video at: http://www.youtube.com/watch?v=gIUN5ziSfNc
These maps show temperatures across the world in the 1880s (left) and the 1980s (right), as compared to average temperatures from 1951 to 1980. Earth's average surface temperature has increased almost 1.5°C during the 20th century. Two-thirds of the warming has occurred since 1975, at a rate of roughly 0.3°C-0.4°C per decade. Source: NASA

Because of Greenhouse Gases
• Naturally occurring– Carbon dioxide– Methane– Nitrous oxide (dinitrogen monoxide)– Water
• Anthropogenic (man-made)– hydrofluorocarbons (HFCs) and chlorofluorocarbons
(CFCs) [These are the same gases that caused the hole in the ozone layer]
– Human activity produces more carbon dioxide, methane and nitrous oxide than occurs naturally (page 300)

Greenhouse Gases Graph
• FROM: http://www.epa.gov/climatechange/science/overview.html
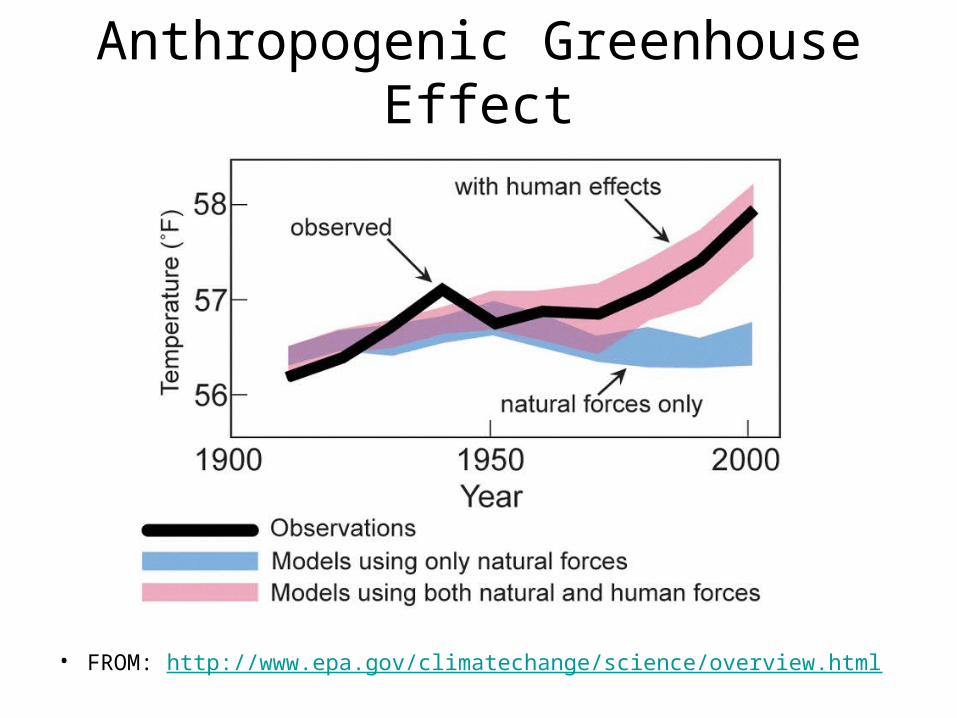
Anthropogenic Greenhouse Effect
• FROM: http://www.epa.gov/climatechange/science/overview.html

Carbon Sources & Sinks• Sources
– Burning fossil fuels– Respiration– Volcanic eruptions
• Sinks– Ocean (carbon dioxide dissolves better in water than
air)– Phytoplankton (algae) in ocean perform most
photosynthesis on earth– Forests perform photosynthesis

Home Fun!
• Page 302 # 1- 5
• Page 319 #1, 4 - 7, 9 – 14
• Go to Dr. Douglas Fir’s Lab and complete the tree ring study at:
http://www.ecokids.ca/pub/eco_info/topics/climate/treerings/index.cfm

From: http://www.ipcc.ch/publications_and_data/ar4/syr/en/mainssyr-introduction.html
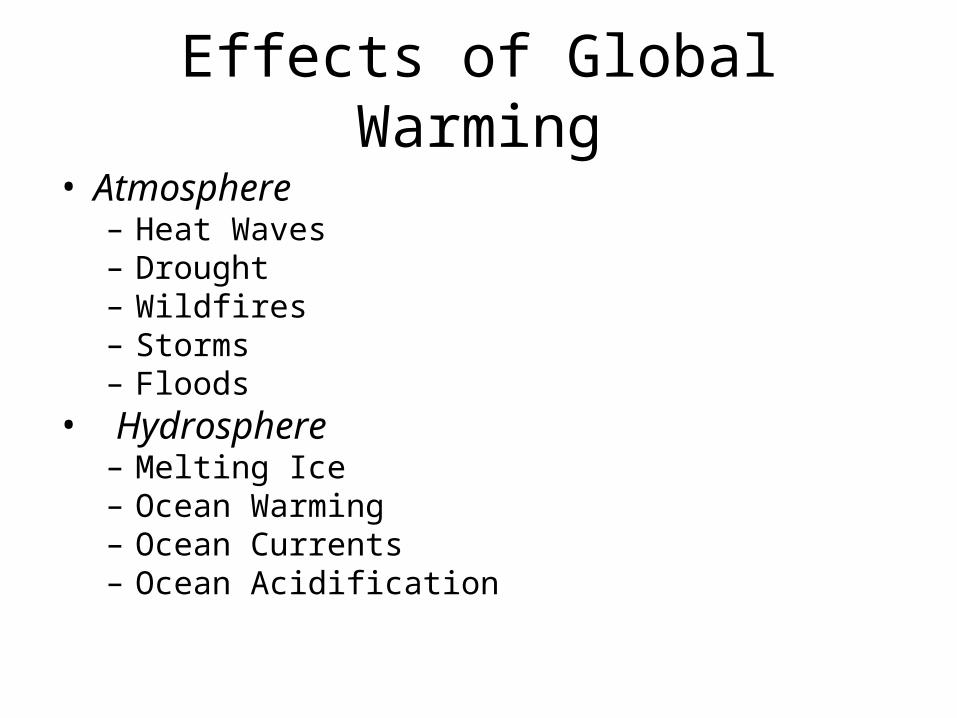
Effects of Global Warming
• Atmosphere– Heat Waves– Drought– Wildfires– Storms– Floods
• Hydrosphere– Melting Ice– Ocean Warming– Ocean Currents– Ocean Acidification

Effects of Global Warming
• Biosphere– Range Shifts– Threatened Species– Affects ALL living organisms, some more than
others– Some organisms may benefit
• eg. Poison Ivy & jellyfish

Home Fun!
• Page 319 #4, 6, 7, 9 - 14, 16, 17
• Page 363 #7 & 24
Check out changes in sea level & sea ice in the recent past at:http://climate.nasa.gov/interactives/climate_time_machine

Feedback Loops
• Positive– Effect becomes amplified– Global warming causes ice to melt which lowers
albedo which causes less reflection of sun’s energy, which causes more warming which causes more melting (runaway feedback loop, a.k.a. “vicious cycle”)
• Negative– Effect is inhibited– Example: Thermostat on an air conditioner (when the
set temperature is reached, the cooling unit shuts off)

Modelling Climate Change(page 339)

Home Fun
• Page 323 #3
• Page 330 #3, 6, 10, 11, 13 - 16
http://www.epa.gov/climatechange/science/overview.html#Explore pop-up beneath the global temperature maps.

What to do about Global Warming?• MITIGATION
– Change philosophy & behaviour to reduce carbon emissions by:• Using less fossil fuels• Carpooling, cycling, walking, working from home• Using alternative methods of producing electricity
– Wind, solar, tidal, fuel cells
• Legislation– Carbon Tax, carbon trading
• Localized economies– Less travel, more secure
• ADAPTATION– Manage/reduce the impacts of events such as floods, storms,
droughts– Technology

Technology
• Carbon Sequestration– http://www.youtube.com/watch?v=OtfuYlhDjw4
– Cogeneration
• Geoengineering (a.k.a. planet hacking)• Watch this 3 minute interview and write a one paragraph
response:http://live.wsj.com/video/geoengineering-a-controversial-solution-to-global-warming/1FE4AFFE-8BD2-4964-AA16-46C5440B0387.html#!1FE4AFFE-8BD2-4964-AA16-46C5440B0387
• 5 ways to save the planet video

Carbon Sequestration

Home Fun
• Page 347 #3, 11, 12
• Page 360 # 1- 5, 8, 11, 15