Embed Size (px)
Citation preview

WA Department of Water and Environmental Regulation Human Health Risk Assessment (HHRA) for the Proposed East Rockingham Waste to Energy Facility 4 October 2018
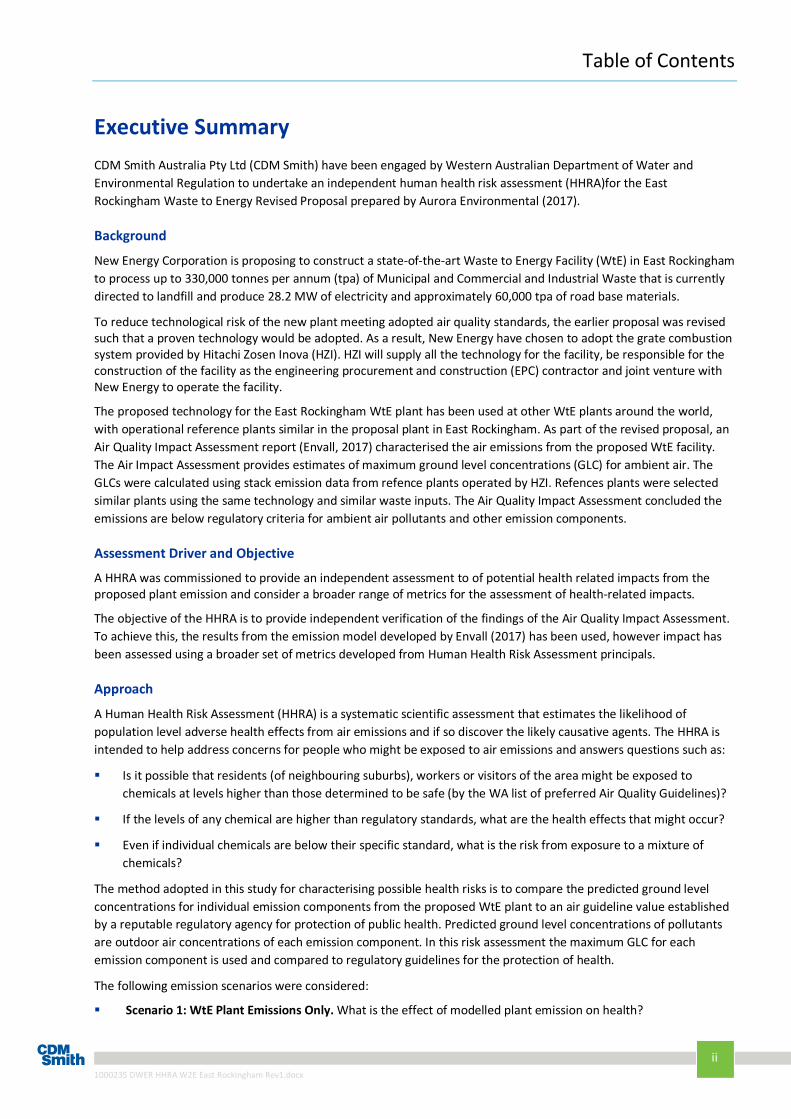
Table of Contents
ii 1000235 DWER HHRA W2E East Rockingham Rev1.docx
Executive Summary CDM Smith Australia Pty Ltd (CDM Smith) have been engaged by Western Australian Department of Water and Environmental Regulation to undertake an independent human health risk assessment (HHRA)for the East Rockingham Waste to Energy Revised Proposal prepared by Aurora Environmental (2017).
Background
New Energy Corporation is proposing to construct a state-of-the-art Waste to Energy Facility (WtE) in East Rockingham to process up to 330,000 tonnes per annum (tpa) of Municipal and Commercial and Industrial Waste that is currently directed to landfill and produce 28.2 MW of electricity and approximately 60,000 tpa of road base materials.
To reduce technological risk of the new plant meeting adopted air quality standards, the earlier proposal was revised such that a proven technology would be adopted. As a result, New Energy have chosen to adopt the grate combustion system provided by Hitachi Zosen Inova (HZI). HZI will supply all the technology for the facility, be responsible for the construction of the facility as the engineering procurement and construction (EPC) contractor and joint venture with New Energy to operate the facility.
The proposed technology for the East Rockingham WtE plant has been used at other WtE plants around the world, with operational reference plants similar in the proposal plant in East Rockingham. As part of the revised proposal, an Air Quality Impact Assessment report (Envall, 2017) characterised the air emissions from the proposed WtE facility. The Air Impact Assessment provides estimates of maximum ground level concentrations (GLC) for ambient air. The GLCs were calculated using stack emission data from refence plants operated by HZI. Refences plants were selected similar plants using the same technology and similar waste inputs. The Air Quality Impact Assessment concluded the emissions are below regulatory criteria for ambient air pollutants and other emission components.
Assessment Driver and Objective
A HHRA was commissioned to provide an independent assessment to of potential health related impacts from the proposed plant emission and consider a broader range of metrics for the assessment of health-related impacts.
The objective of the HHRA is to provide independent verification of the findings of the Air Quality Impact Assessment. To achieve this, the results from the emission model developed by Envall (2017) has been used, however impact has been assessed using a broader set of metrics developed from Human Health Risk Assessment principals.
Approach
A Human Health Risk Assessment (HHRA) is a systematic scientific assessment that estimates the likelihood of population level adverse health effects from air emissions and if so discover the likely causative agents. The HHRA is intended to help address concerns for people who might be exposed to air emissions and answers questions such as:
Is it possible that residents (of neighbouring suburbs), workers or visitors of the area might be exposed to chemicals at levels higher than those determined to be safe (by the WA list of preferred Air Quality Guidelines)?
If the levels of any chemical are higher than regulatory standards, what are the health effects that might occur?
Even if individual chemicals are below their specific standard, what is the risk from exposure to a mixture of chemicals?
The method adopted in this study for characterising possible health risks is to compare the predicted ground level concentrations for individual emission components from the proposed WtE plant to an air guideline value established by a reputable regulatory agency for protection of public health. Predicted ground level concentrations of pollutants are outdoor air concentrations of each emission component. In this risk assessment the maximum GLC for each emission component is used and compared to regulatory guidelines for the protection of health.
The following emission scenarios were considered:
Scenario 1: WtE Plant Emissions Only. What is the effect of modelled plant emission on health?

Table of Contents
iii 1000235 DWER HHRA W2E East Rockingham Rev1.docx
Scenario 2: Combined Background and WtE Plant Emissions. What is the cumulative effect of emissions with the addition of emissions from the East Rockingham WtE plant?
The HHRA has been conducted in accordance with national and international guidelines and best practice. Assumptions have been made that bias the assessment towards protection of public health. Where a potential concern has been identified as part of a screening process it has been subject to further refined evaluation if data allows.
Measure of Impact
The metrics used to characterise human health risks in this assessment are summarised below in Table 1.
Table 1 Metrics used to characterise human health risks
Pathway Metric What does this metric tell us?
Primary Pathway (Inhalation)
Metric 1: Air Quality Index
How does the proposed facility emissions affect resident activities and health? In other words, will the emissions reduce air quality in East Rockingham in a way that impacts on people’s health or ability to go about normal activities? This has been assessed in Section 4.2 using an assessment of the impact of the proposed WtE plant on the local air quality index (AQI).
Metric 2: Acute Risk
Over a short duration of time are there any emission components and/or is the emission in total present at air concentrations that are potentially harmful to health? This has been assessed in Section 4.3. This is assessed by estimating hazard quotients and a hazard index.
Metric 3: Chronic Risk
Over a long period of time are there any emission components and/or is the emission in total present in air that are potentially harmful to health? This has been assessed in Section 4.4. This is assessed by estimating hazard quotients and a hazard index.
Metric 4: Lifetime Cancer Risk
Do any individual emission components or mixture of emission components present an unacceptable cancer risk to the general population? This has been assessed in Section 4.5 by estimating incremental cancer risk.
Secondary Pathways
Metric 5: Other considerations (e.g. Indoor exposures, food uptake)
How can we be confident that the emission components don’t present any other environmental risks? The confidence, conservatism and uncertainty in this assessment are summarised in Section 5 and Appendix A.

Table of Contents
iv 1000235 DWER HHRA W2E East Rockingham Rev1.docx
Analysis from each metric is ranked as one of five ‘Levels of Concern’, as described below in Plate 1. The level of concern is not a health assessment for any particular individual but a tool to help health professionals understand health risk at a population level. Plate 1 provides an overview of the levels of concern and their corresponding hazard index and blood lead levels used to assess the level of concern.
Plate 1 Level of Concern Rankings
Table 2 summarise the outcomes for both scenarios and shows ranking for each metric for the level of concern for adverse health effects to the general population and sensitive subpopulations for each exposure scenario assessed. In considering health risk both the toxicity of individual emission components and the emission as a whole has been considered.
Table 2 Metric Ranking for Each Emission Scenario
Pathway Metric Scenario 1:
Background Emissions only
Scenario 2:
WtE Plant Emissions only
Scenario 3:
Combined Background and WtE Plant Emissions
Primary Pathway
(Inhalation)
Metric 1: Air Quality Index
Metric 2: Acute Risk
Metric 3: Chronic Risk
Metric 4: Lifetime Cancer Risk
Secondary Pathway
(Ingestion)
Metric 5: Other considerations (e.g. Indoor exposures, food uptake)
Overall Conclusion The New Energy Corporation Waste to Energy Facility (WtE) proposed for East Rockingham based on the emission estimates provided and the emission controls in place is unlikely to impact on health and well-being of sensitive subpopulations or the general public living in the vicinity of the proposed plant. The control and monitoring measures described within the Air Quality Impact Assessment report are supported.
Serious
•Serious Concern - At levels that are known to cause health effects
Concern•Concern - Close to levels that could cause health effects
Some•Some Concern - Below levels that could cause health effects.
Minimal
•Minimal Concern - Well below levels associated with health effects (adequate safety margin).
Negligible
•Negligible Concern - Either not measurable or very low in people or within background levels

Table of Contents
v 1000235 DWER HHRA W2E East Rockingham Rev1.docx
Table of Contents Executive Summary ..................................................................................................................................................... ii
Table of Contents ........................................................................................................................................................ v
Plates ......................................................................................................................................................................... vi
Tables ......................................................................................................................................................................... vi
Document history & status ........................................................................................................................................ vii
Distribution of copies ................................................................................................................................................ vii
Section 1 Introduction ................................................................................................................................................. 8
1.1 Background ................................................................................................................................................. 8
1.2 Objective ..................................................................................................................................................... 8
1.3 Methodology ............................................................................................................................................... 9
Section 2 Problem Formulation ................................................................................................................................. 10
2.1 What is a Human Health Risk Assessment? ................................................................................................ 10
2.2 Where are the exposure pathways complete?............................................................................................ 10
2.3 How reliable is the emission data for the East Rockingham proposal? ........................................................ 12
Section 3 Exposure Assessment ................................................................................................................................. 16
3.1 Contaminants of Interest ........................................................................................................................... 16
3.2 Emission Model ......................................................................................................................................... 16
3.3 Exposure Metrics ....................................................................................................................................... 16
3.4 Toxicity Assessment ................................................................................................................................... 19
Section 4 Risk Characterisation ................................................................................................................................. 23
4.1 Context and Introduction ........................................................................................................................... 23
4.2 Metric 1: Impact on Air Quality Index (AQI) in East Rockingham ................................................................. 25
4.3 Metric 2: Acute Health Hazards due to Air Emissions .................................................................................. 27
4.4 Metric 3: Chronic Hazard Index .................................................................................................................. 28
4.5 Lifetime Cancer Risk ................................................................................................................................... 29
Section 5 Confidence, Conservatism and Uncertainty ............................................................................................... 30
Section 6 References ................................................................................................................................................. 32
Appendix A Screening Assessment for Secondary Pathways ....................................................................................... 1
A.1 Secondary Exposure Pathways ..................................................................................................................... 2
A.2 Dioxins ........................................................................................................................................................ 2
A.3 Polycyclic aromatic hydrocarbons ................................................................................................................ 4
A.4 Metals ......................................................................................................................................................... 5

Plates
vi 1000235 DWER HHRA W2E East Rockingham Rev1.docx
Disclaimer and Limitations .......................................................................................................................................... 8
Plates Plate 1 Level of Concern Rankings ...................................................................................................................................... iv Plate 2 Outline of Conceptual Exposure Model.................................................................................................................. 11 Plate 3 Inputs for setting emissions................................................................................................................................... 12 Plate 4 Layout for HZI Buchinghamshire (UK) plant, which is used as a key reference plant for the East Rockingham WtE
plant design and planning .................................................................................................................................... 15
Tables Table 1 Metrics used to characterise human health risks .................................................................................................... iii Table 2 Metric Ranking for Each Emission Scenario ............................................................................................................. iv Table 3 Decision points influencing emission output from the proposed WtE Plant in East Rockingham .............................. 12 Table 4 Summary of Emission Model ................................................................................................................................. 16 Table 5 Metrics used to characterise human health risks ................................................................................................... 17 Table 6 Background and Modelled Concentrations (Aurora Environmental, 2017) .............................................................. 18 Table 7 Toxicity Category for Chemicals of Interest ............................................................................................................ 20 Table 8 Health-based Ambient Air Criteria from Various Environmental Organisations (μg/m3) ........................................... 21 Table 9 AQI (Air quality index) and key Health Messages.................................................................................................... 25 Table 10 AQI Results (based on Maximum Predicted Ground Level Concentration.) .............................................................. 26 Table 11 Chronic Air Pollutants (based on Maximum Predicted Ground Level Concentration.) .............................................. 26 Table 12 Acute HQ/HI Results for Individual Chemicals ........................................................................................................ 27 Table 13 Incremental and Cumulative Chronic Hazard Quotients (HQ) and Hazard Index (HI)................................................ 28 Table 14 Estimated Incremental Lifetime Cancer Risk .......................................................................................................... 29 Table 15 Relative Concentrations of Dioxin Like Substances in Air .......................................................................................... 3 Table 16 Estimated Total Intakes of Dioxin Like Substances for Australian Adults ................................................................... 3 Table 17 Comparison of Ambient Air Concentrations (various airsheds) with the Estimated Maximum Ground Level
Concentrations for the Project (Aurora Environmental, 2017). ................................................................................. 6
Document history & status
vii 1000235 DWER HHRA W2E East Rockingham Rev1.docx
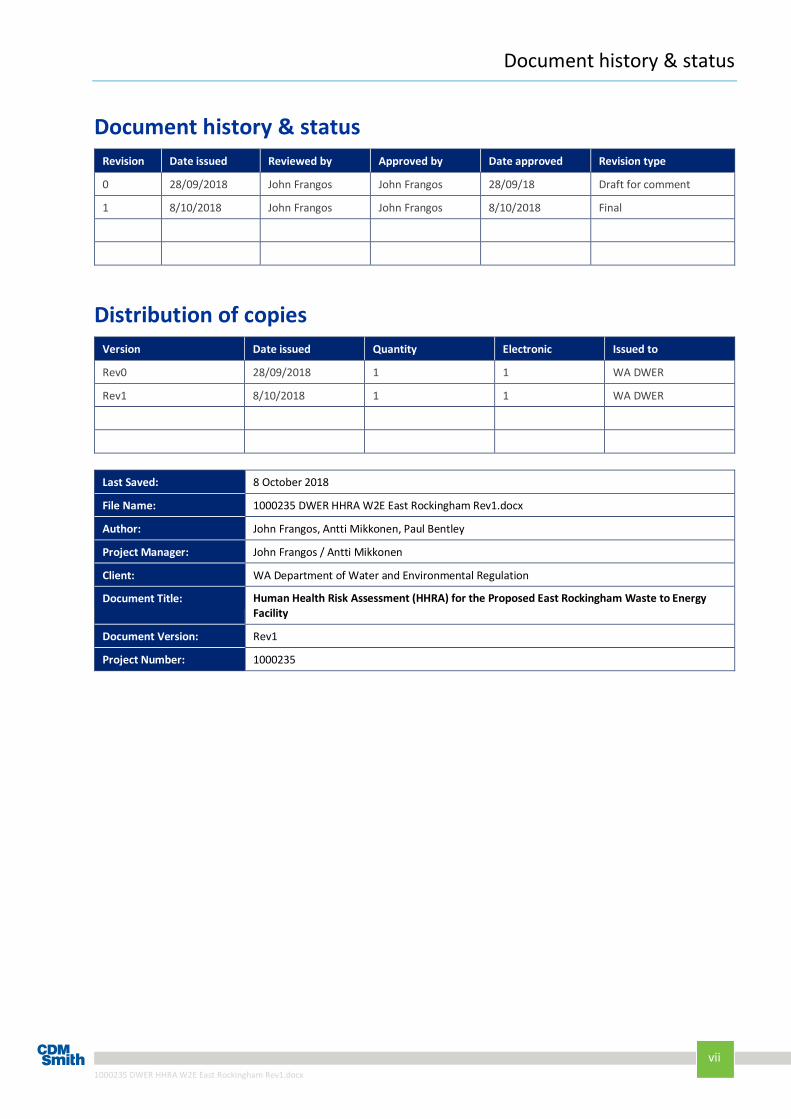
Document history & status Revision Date issued Reviewed by Approved by Date approved Revision type
0 28/09/2018 John Frangos John Frangos 28/09/18 Draft for comment
1 8/10/2018 John Frangos John Frangos 8/10/2018 Final
Distribution of copies Version Date issued Quantity Electronic Issued to
Rev0 28/09/2018 1 1 WA DWER
Rev1 8/10/2018 1 1 WA DWER
Last Saved: 8 October 2018
File Name: 1000235 DWER HHRA W2E East Rockingham Rev1.docx
Author: John Frangos, Antti Mikkonen, Paul Bentley
Project Manager: John Frangos / Antti Mikkonen
Client: WA Department of Water and Environmental Regulation
Document Title: Human Health Risk Assessment (HHRA) for the Proposed East Rockingham Waste to Energy Facility
Document Version: Rev1
Project Number: 1000235

8 1000235 DWER HHRA W2E East Rockingham Rev1.docx
Section 1 Introduction CDM Smith Australia Pty Ltd (CDM Smith) have been engaged by Western Australian Department of Water and Environmental Regulation to undertake an independent human health risk assessment for the East Rockingham Waste to Energy Revised Proposal.
1.1 Background New Energy Corporation is proposing to construct a state-of-the-art Waste to Energy Facility (WtE) to process up to 330,000 tonnes per annum (tpa) of Municipal and Commercial and Industrial Waste that is currently directed to landfill and produce 28.2 MW of electricity and approximately 60,000 tpa of road base materials.
Building, siting and designing a WtE plant involves a long decision-making process, balancing a range of economic, technological, regulatory and social dimensions. Since the 1970s, significant attention and emphasis has been given to cleaner and greener industrial technologies toward reducing and eliminating the impact of industry on human and environmental health. Modern WtE plants are required to meet among the most stringent emissions requirements of any industrial process, specifically to minimise the emissions of acid gases, particulates, dioxins and heavy metals. Many of these plants tend to be located in or near highly urbanised areas to be close to the fuel source, and customers for the plant products (energy, steam, and ash). The proximity of many plants to urban centres requires they must meet very low emission standards, in particular in jurisdictions such as the European Union and United States of America.
To reduce technological risk of the new plant meeting adopted air quality standards, the earlier proposal was revised such that a proven technology would be adopted. As a result, New Energy have chosen to adopt the grate combustion system provided by Hitachi Zosen Inova (HZI). HZI will supply all the technology for the facility, be responsible for the construction of the facility as the engineering procurement and construction (EPC) contractor and joint venture with New Energy to operate the facility. HZI will act as the EPC contractor and operator for the facility (Aurora Environmental, 2017). HZI is a “turnkey” supplier of waste to energy projects meaning that they supply all technology used (not just the grate as other suppliers do) and take responsibility for constructing and commissioning the project as an EPC contractor
The proposed technology for the East Rockingham WtE plant has been used at other WtE plants around the world, with operational reference plants similar in the proposal plant in East Rockingham. As part of the revised proposal, an Air Quality Impact Assessment report (Envall, 2017) characterised the air emissions from the proposed WtE facility. The Air Impact Assessment provides estimates of maximum ground level concentrations (GLC) for ambient air. The GLCs were calculated using stack emission data from refence plants operated by HZI. Refences plants were selected similar plants using the same technology and similar waste inputs. The Air Quality Impact Assessment concluded the emissions are below regulatory criteria for ambient air pollutants and other emission components.
1.2 Objective The objective of the HHRA is to provide independent verification of the findings of the Air Quality Impact Assessment.

9 1000235 DWER HHRA W2E East Rockingham Rev1.docx
1.3 Methodology The overall methodology employed in this risk assessment is consistent with that of the Department of Health in Western Australia (DoH, 2006 and 2010), the Australian enHealth Council (enHealth 2012) and the US Environmental Protection Agency (2009).
The following is an outline of the approach used in this HHRA:
Problem formulation involves a data review with the aim to identify contaminants of interest (COI) and describe the links between COI and receptors (who is exposed?).
Exposure Assessment aims to determine the amount of a contaminant (dose) that receptors may be exposed to. This step involves the estimation of exposure which relies upon:
– Assessment of what is in the emissions,
– Assessment of the concentration of emission components at point of release to atmosphere, and
– Dispersion modelling to predict the ‘ground level concentration’ of contaminant at locations where people may live or spend appreciable amounts of time.
Toxicity assessment determines the relationship between the exposure concentration and the probability of adverse effects. Although direct health effects from air emissions are assessed quantitatively, there are aspects that are primarily of a screening nature due to the fact that air emission health risk assessment deals with risks for people who are hypothetically exposed to the highest atmospheric emission concentrations that are reasonably expected to occur (within the modelled areas). This step identifies screening criteria and provides a brief overview toxicological information for the COI.
Risk characterisation provides an assessment of the risks posed by exposure to emissions and whether the risk is considered acceptable.

10 1000235 DWER HHRA W2E East Rockingham Rev1.docx
Section 2 Problem Formulation
2.1 What is a Human Health Risk Assessment? A Human Health Risk Assessment (HHRA) is a systematic scientific assessment that estimates the likelihood of population level adverse health effects from air emissions and if so discover the likely causative agents. The HHRA is intended to help address concerns for people who might be exposed to air emissions and answers questions such as:
Is it possible that residents (of neighbouring suburbs), workers or visitors of the area might be exposed to chemicals at levels higher than those determined to be safe (by the WA list of preferred Air Quality Guidelines)?
If the levels of any chemical are higher than regulatory standards, what are the health effects that might occur?
Even if individual chemicals are below their specific standard, what is the risk from exposure to a mixture of chemicals?
2.2 Where are the exposure pathways complete? Structured decision making is used to organise problem formulation and decision analysis and has been used to address complex decision making in environmental management. Risk based frameworks are commonly used by regulators across various environmental disciplines (USEPA 2009). Risk management in governance and risk frameworks provide a structured and accepted practice for complex decision making, by accounting for uncertainty with qualitative and quantitative approaches. Environmental risk frameworks emerged from the 1970s onwards, beginning with the US EPA (USEPA 1998, 2009)) with origins in regulatory risk-based decision making. Risk frameworks follow a structured process (e.g ISO31000:2018), however today many variations and customised approaches exist.
Undertaking an HHRA requires the consideration of three elements: source, pathway and receptor. These three elements need to be overlap for an exposure to be realised. Once realised, the next step is to assess exposure and characterise the risk posed to identified receptors.
Risk assessments provide a structured and familiar framework for regulators to examine scenarios with complex environmental interactions. A Conceptual Exposure Model is commonly used to describe the pathways by which exposure to any contamination from source may occur. A Conceptual Exposure Model is typically developed as a preliminary screening tool and revised and improved as more information about issues becomes available and issues better understood. For exposure to occur, a complete pathway must exist between a source of contamination and a receptor. Where the exposure pathway is incomplete, there is no exposure and hence no risk via that pathway.
The Conceptual Exposure Model below (Plate 2) summarises the exposure pathways and assessment endpoints used in this assessment.

11 1000235 DWER HHRA W2E East Rockingham Rev1.docx
Plate 2 Outline of Conceptual Exposure Model

12 1000235 DWER HHRA W2E East Rockingham Rev1.docx
2.3 How reliable is the emission data for the East Rockingham proposal?
2.3.1 Decision Points in Setting Emission Controls
This section outlines decision points for setting emission controls for East Rockingham proposal. The combination of each decision points must deliver the technical and economic aspects of the project within the given regulatory environment. Information provided below in Table 3 outlines the controls proposed to manage emissions from the WtE plant.
Table 3 Decision points influencing emission output from the proposed WtE Plant in East Rockingham (summarised from Aurura Environmental, 2017)
Decision Points Description
Regulatory Adopted Air Emission Standards
The energy from waste process is required to meet the emission criteria specified in the European Union’s Industrial Emissions Directive (IED) for the following substances (Aurora Environmental, 2017; Envall 2017): Total particulates (dust) PM10; CO, acid and corrosive gases - hydrogen chloride (HCl), hydrogen fluoride (HF), sulphur dioxide (SO2) and NOx; Heavy metals - cadmium (Cd), mercury (Hg), lead (Pb) and other heavy metals; Organic compounds - dioxins, furans and volatile organic compounds (VOCs).
Regulatory Emission monitoring
Emissions from the stack will be monitored using certified CEMS for: particulates, CO, SO2, HCl, oxygen (O2), NOx and VOCs. In addition to the continuous monitoring, periodic sampling and measurement will be undertaken for nitrous oxide (N2O), HF, Cd, thallium (Tl), Hg, antimony (Sb), arsenic (As), Pb, chromium (Cr), cobalt (Co), copper (Cu), manganese (Mn), nickel (Ni), vanadium (V), dioxins and furans and dioxin like PCBs. Periodic measurements will be carried out typically four times in the first year of operation and twice per year thereafter. The frequency and extent of monitoring will be confirmed by the Department of Water and Environmental Regulation (DWER) in licence issued under Part V of the Environmental Protection Act 1986.
Plate 3 Inputs for setting emissions

13 1000235 DWER HHRA W2E East Rockingham Rev1.docx
Decision Points Description
Waste Accepted Waste Streams
Waste in WA is managed using a waste hierarchy approach, such that municipal wastes and controlled wastes are typically managed as separate waste streams. This separation allows the plant to select which waste streams to accept for incineration, and the plant can choose which waste streams to accept. Waste streams planned for East Rockingham include: 300,000 tpa of MSW and residual wastes (processed C&I and C&D waste and residuals from MBT and MRF) as well as up to 30,000 tpa of sewage sludge for a total of up to 330,000 tpa.
Waste Excluded Waste Streams
The following wastes will not be accepted for processing at East Rockingham: Scheduled wastes such as Polychlorinated Biphenyls (PCBs) and Organochlorine Wastes; Asbestos; Highly corrosive or toxic liquids or gases such as strong acids or chlorine or fluorine; Explosive materials; Radioactive wastes; and Wastes which mechanically cannot be handled by the facility. Any other wastes which are identified by staff as potentially hazardous to health or the environment will also be quarantined.

14 1000235 DWER HHRA W2E East Rockingham Rev1.docx
Decision Points Description
Technology Best Available Technology
Environmental management of municipal waste combustion facilities focuses on the control of air emissions and the management of ash residues. Ash, heavy metals, and a variety of organic and inorganic compounds can be found in varying quantities. The selection of the flue gas cleaning system depends primarily on the actual emission standards and the desired emission level. The closest reference plant from HZI to the proposed East Rockingham plant is the Buckinghamshire UK plant (see section 2.3.2). The flue gas treatment is based on a selective non-catalytic reduction (SNCR) DeNOx system, a Hitachi Zosen Inova SemiDry system consisting of a fluid bed reactor with lime and activated carbon injection, and a bag house filter as follows: a dry reagent scrubbing system with absorbent injection system followed by a compartmentalised pulse jet fabric filter baghouse filtration (FFB). NOx emissions are controlled using a HZI’s own SNRC technology. a dry flue gas cleaning system downstream of the boiler to control the air emissions. Hydrated lime is injected into the flue gas where it neutralises acidic components such as hydrogen chloride, hydrogen fluoride and sulphur dioxide. At the same injection point activated carbon is added to the flue gas that adsorbs dioxins and furans, gaseous mercury, and other components. Downstream of the injection of the reactants, the flue gas passes through a fabric filter (bag filters) which trap fine particulates.

15 1000235 DWER HHRA W2E East Rockingham Rev1.docx
2.3.2 Proposed Plant Layout The proposed Rockingham waste to energy plant comprises a furnace equipped with the selective noncatalytic reaction (SNCR) process for control of nitrogen oxides (NOx), a HZI heat recovery boiler, an effective turbine-generator set for the heat utilisation and the HZI dry flue gas treatment system. The main process stages from waste to energy are described below:
Waste Receival and Storage. The waste receival area typically has a tipping floor and pit where waste is tipped directly from collection vehicles. The area is enclosed inside a building to control wind and odour problems.
Combustion system. An automatic crane transfers waste from the pit into a feed hopper which feeds waste into the combustion grate (Hitachi Zosen Inova grate). Waste passes through the different combustion phases: drying, ignition, combustion, and burnout. The reaction temperature is between 850 and 1450ºC, and combustion occurs in the gas and solid phase. The combustion process uses primary air from the waste receival area, while secondary air and recirculated flue gas are reinjected above the grate.
Energy recovery. A boiler is used for energy recovery from heated flue gases.
Flue Gas Treatment. During incineration, exhaust gases are created which, and after cleaning, exit to the atmosphere via a pipe/ stack called a flue. These flue-gases also contain particulates (dust) and gaseous air pollutants which must be removed via a flue-gas purification process.
Residual and Waste Handling. The products of combustion include the bottom ash and fly ash. The bottom ash includes the non-combustible materials (i.e. ferrous and nonferrous metals, glass, ceramics, etc.) and ash from the incinerator, whilst fly ash is fine particulate recovered from flue gas treatment.
Plate 4 Layout for HZI Buchinghamshire (UK) plant, which is used as a key reference plant for the East
Rockingham WtE plant design and planning 1
1 Buckingham Shire, UK, HZI, Energy from Waste Plant 2016, viewed on Sept 20 2018, source: http://www.hz-inova.com/cms/wp-content/uploads/2016/05/Buckinghamshire_Online_E.pdf

16 1000235 DWER HHRA W2E East Rockingham Rev1.docx
Section 3 Exposure Assessment
3.1 Contaminants of Interest Municipal waste contains a wide variety of wastes including plastics, incineration has the potential to liberate a range of airborne contaminants in the exhaust gas stream including heavy metals, dioxins, other toxic organic compounds and acid gases including SOX, NOX, HCl and HF.
3.2 Emission Model This HHRA is intended to build on the existing information for the proposed waste power station project. More specifically, this work draws on the air dispersion modelling described in the Air Quality Impact Assessment Report (Aurora Environmental 2017) which modelled ground level air concentrations at the proposed site (and surrounds) as a result of plant operations. The Aurora Environmental (2017) report provides an overview of pre-project (baseline) air quality levels in East Rockingham and modelled air quality based on estimated plant emissions.
Table 4 Summary of Emission Model
Item Description
Reference WtE Plants
The emission rates provided by HZI are understood to be conservative estimates based on review of actual emission data from the following operating facilities constructed by HZI:
the recently commissioned Greatmoor Facility in Buckinghamshire which is of the same capacity and design as the East Rockingham Facility;
Severnside EfW – 2 lines, each line slightly smaller; and
Ferrybridge FM1 – 2 lines, each line slightly larger.
Plant emission sources considered in the model
Three sources of air emissions are considered in the dispersion modelling:
Flue gas treatment system, the main 60 m high stack discharging from the flue gas treatment system (i.e. main discharge point);
Waste delivery and storage hall, a 48 m high shutdown stack used to vent internal odours from the bunkers when the combustor is not operating (i.e. venting gases from the waste delivery and storage hall); and odours released from the receival hall truck doors during truck entry and departure.
Baseline Data The baseline air quality data were gathered from nearby monitoring stations:
East Rockingham (nitrogen dioxide (NO2) and sulphur dioxide (SO2)); and
South Lakes (carbon monoxide (CO), particulate matter (for particles having an equivalent aerodynamic diameter of less than 2.5 micrometres (PM2.5) and less than 10 micrometres (PM10)).
A number of other substances, expected to contribute to air emissions were also modelled including heavy metals and Volatile Organic Compounds (VOC). No baseline air quality data were available for metals or VOCs.
Emission Scenarios
The following emission scenarios were considered:
Scenario 1: Background Emissions only
Scenario 2: WtE Plant Emissions only
Scenario 3: Combined Background and WtE Plant Emissions
3.3 Exposure Metrics For each of these receptor locations around the site the potential for direct health effects has been evaluated for predicted short-term and long-term exposures. Metrics used in this assessment are summarised below in Table 1.

17 1000235 DWER HHRA W2E East Rockingham Rev1.docx
Table 5 Metrics used to characterise human health risks
Pathway Metric What does this metric tell us?
Primary Pathway (Inhalation)
Metric 1: Air Quality Index
How does the proposed facility emissions affect resident activities and health? In other words, will the emissions reduce air quality in East Rockingham in a way that impacts on people’s health or ability to go about normal activities? This has been assessed in Section 4.2 using an assessment of the impact of the proposed WtE plant on the local air quality index (AQI).
Metric 2: Acute Risk
Over a short duration of time are there any emission components and/or is the emission in total present at air concentrations that are potentially harmful to health? This has been assessed in Section 4.3. This is assessed by estimating hazard quotients and a hazard index.
Metric 3: Chronic Risk
Over a long period of time are there any emission components and/or is the emission in total present in air that are potentially harmful to health? This has been assessed in Section 4.4. This is assessed by estimating hazard quotients and a hazard index.
Metric 4: Lifetime Cancer Risk
Do any individual emission components or mixture of emission components present an unacceptable cancer risk to the general population? This has been assessed in Section 4.5 by estimating incremental cancer risk.
Secondary Pathway (Ingestion)
Metric 5: Other considerations (eg Indoor exposures, food uptake)
How can we be confident that the emission components don’t present any other environmental risks? The confidence, conservatism and uncertainty in this assessment are summarised in Section 5 and Appendix 1.
In all instances, apart from assessment of cancer, the likelihood for the most sensitive health effect of an emission component has been characterised using a health-based air guideline value sourced from authorities (WA list of preferred Air Quality Guidelines). These air quality guidelines were established to protect the general population (inclusive of sensitive sub-groups) against the most sensitive health effect associated with each chemical. The most sensitive health effect is the one that occurs with the lowest level of exposure.
Background concentrations for PM, CO, NO2 and SO2 were obtained (by Aurora Environmental, 2017) from ambient air quality reports and monitoring stations nearby (Rockingham- and South Lakes monitoring stations). Background concentrations for metals and TOC (as benzene) are based on Background Air Quality Monitoring in Kwinana 2005–10 for Calista (DEC 2011).
The modelled concentration is referred to as a ground level concentration (GLC). The results presented in the Aurora Environmental report (2017) are summarised in Table 6 (for a more detailed discussion of the background air quality and modelling results refer to Appendix 7 of the Air Assessment Impact Report (Aurora Environmental, 2017).
This HHRA assumes that people are exposed to background concentrations (of the COI) prior to plant operations and to the combined estimate of background and emissions once the plant is operational.

18 1000235 DWER HHRA W2E East Rockingham Rev1.docx
Table 6 Background and Modelled Concentrations (Aurora Environmental, 2017)
Substance Averaging time
Background conc. (μg/m3)
Emission (μg/m3) (Predicted maximum conc.)
Background + Emission conc.(μg/m3)
CO 8-hour 815 21.9 836.9
NO2 1-hour 84 53.8 137.8
NO2 1-year 10 1 11
PM10 24-hour 24 2.17 26.17
PM10 1-year 15 0.0702 15.0702
PM2.5 24-hour 12 0.978 12.978
PM2.5 1-year 7.4 0.0316 7.43
SO2 1-hour 35 33.8 68.8
SO2 24-hour 5.3 10.9 16.2
SO2 1-year 2.7 0.351 3.051
HCl 1-hour - 6.76 -
HF 1-hour - 0.676 -
TOC (as Benzene) 1-hour 3.8 0.811 4.611
Dioxins and Furans 1-hour - 6.76E-08 -
As 1-hour 0.0041 0.00338 0.0075
As 1-year 0.0005 0.0000351 0.0005
Cd 1-hour 0.0001 0.00591 0.006
Cd 24-hour 0.0001 0.0019 0.002
Co 1-year 0.0001 0.0000351 0.0001
Cr(VI) 1-year 5.409E-05 0.00000702 6.1E-05
Cr(III) 1-hour 0.0034 0.00608 0.0061
Cu 1-hour 0.0022 0.0439 0.0461
Hg 1-hour 0.01 0.0338 0.0438
Hg 1-year 0.01 0.000351 0.0104
Mn 1-hour 0.0202 0.0372 0.0574
Mn 1-year 0.0034 0.000386 0.0038
Ni 1-hour 0.0061 0.00338 0.0095
Ni 1-year 0.001 0.0000351 0.001
Pb 1-year 0.0012 0.00207 0.0033
Sb 1-hour 0.0121 0.0372 0.0493
Tl 1-hour 0.0003 0.000845 0.0011
Tl 1-year 0.0001 0.00000877 0.0001
V 24-hour 0.0043 0.00109 0.0054
Notes:
HF, HCl and dioxins and furans were included in the modelling, however there was no available information on their concentrations in background ambient air. Background data for CO, NO2, SO2 and PM were adopted form the Aurora Environmental (2017) report and metals and TOC (as benzene) concentrations are based on Background Air Quality Monitoring in Kwinana 2005–10 for Calista (DEC 2011).

19 1000235 DWER HHRA W2E East Rockingham Rev1.docx
3.4 Toxicity Assessment Although direct health effects from air emissions are assessed quantitatively, there are aspects that are primarily of a screening nature due to the fact that air emission health risk assessment deals with risks for people who are hypothetically exposed to the highest atmospheric emission concentrations (that are reasonably expected to occur within the modelled areas) for the most sensitive health endpoint. As such the likelihood for the occurrence of adverse effects (for the most sensitive non-cancer health endpoint) has been characterised using health-based air guideline values (for each COI) sourced from standard setting authorities These air quality guidelines were established to protect the general population (inclusive of sensitive sub-groups) against the most sensitive health endpoint associated with each chemical. The most sensitive health effect is the one that occurs with the lowest level of exposure.
For carcinogenic constituents a non-threshold effects assessment was undertaken to estimate the likelihood of developing cancer from long-term exposures. To assess non-threshold effects, cancer slope factors, recommended by regulatory agencies, were used.
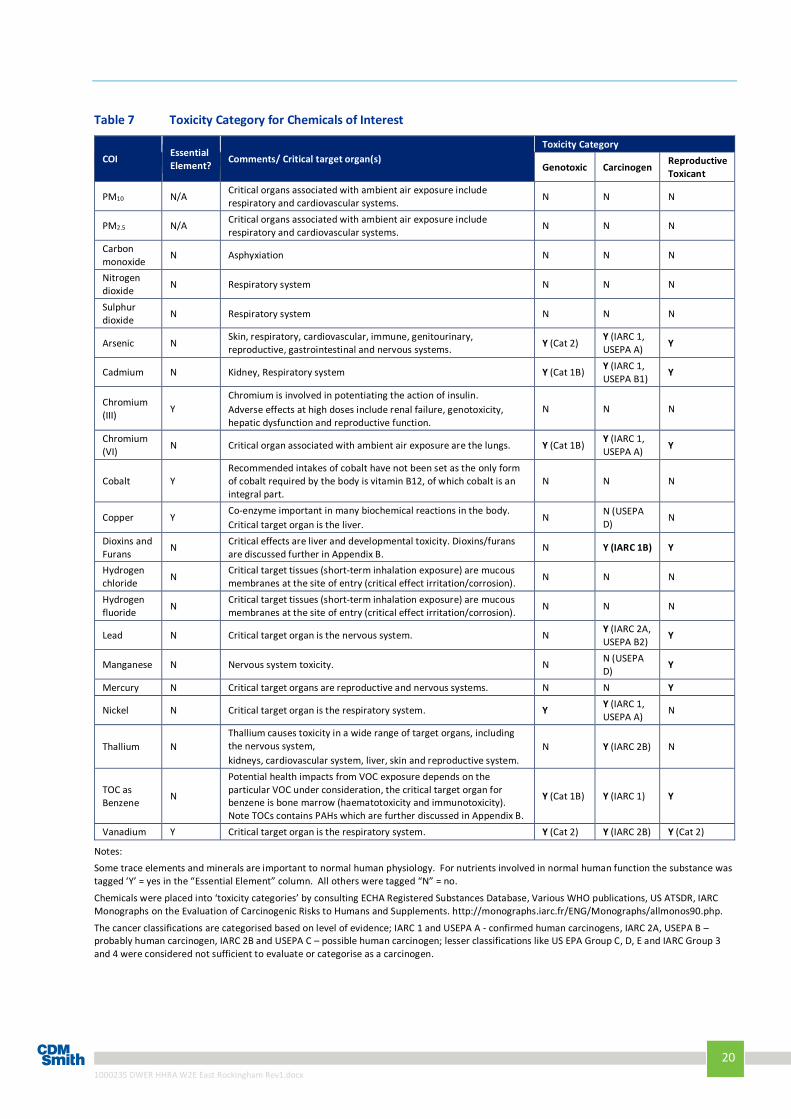
Table 7 provides a high-level summary of the following:
Whether the identified COI are nutritional trace elements or minerals.
Whether the COI possesses genotoxic, carcinogenic or reproductive toxicity potential.
The major target organs for which critical effects have been observed.
Health-based ambient air criteria used in this risk assessment are presented in Table 8 which contains criteria from multiple organisations for comparison with the selected criteria. The point of the comparison is not to choose the lowest number but to demonstrate that the selected criteria are current and derived by competent organisations.
20 1000235 DWER HHRA W2E East Rockingham Rev1.docx
Table 7 Toxicity Category for Chemicals of Interest
COI Essential Element?
Comments/ Critical target organ(s) Toxicity Category
Genotoxic Carcinogen Reproductive Toxicant
PM10 N/A Critical organs associated with ambient air exposure include respiratory and cardiovascular systems. N N N
PM2.5 N/A Critical organs associated with ambient air exposure include respiratory and cardiovascular systems.
N N N
Carbon monoxide
N Asphyxiation N N N
Nitrogen dioxide N Respiratory system N N N
Sulphur dioxide N Respiratory system N N N
Arsenic N Skin, respiratory, cardiovascular, immune, genitourinary, reproductive, gastrointestinal and nervous systems. Y (Cat 2)
Y (IARC 1, USEPA A) Y
Cadmium N Kidney, Respiratory system Y (Cat 1B) Y (IARC 1, USEPA B1)
Y
Chromium (III) Y
Chromium is involved in potentiating the action of insulin. Adverse effects at high doses include renal failure, genotoxicity, hepatic dysfunction and reproductive function.
N N N
Chromium (VI) N Critical organ associated with ambient air exposure are the lungs. Y (Cat 1B)
Y (IARC 1, USEPA A) Y
Cobalt Y Recommended intakes of cobalt have not been set as the only form of cobalt required by the body is vitamin B12, of which cobalt is an integral part.
N N N
Copper Y Co-enzyme important in many biochemical reactions in the body. Critical target organ is the liver.
N N (USEPA D)
N
Dioxins and Furans
N Critical effects are liver and developmental toxicity. Dioxins/furans are discussed further in Appendix B.
N Y (IARC 1B) Y
Hydrogen chloride N
Critical target tissues (short-term inhalation exposure) are mucous membranes at the site of entry (critical effect irritation/corrosion). N N N
Hydrogen fluoride N
Critical target tissues (short-term inhalation exposure) are mucous membranes at the site of entry (critical effect irritation/corrosion). N N N
Lead N Critical target organ is the nervous system. N Y (IARC 2A, USEPA B2)
Y
Manganese N Nervous system toxicity. N N (USEPA D)
Y
Mercury N Critical target organs are reproductive and nervous systems. N N Y
Nickel N Critical target organ is the respiratory system. Y Y (IARC 1, USEPA A)
N
Thallium N Thallium causes toxicity in a wide range of target organs, including the nervous system, kidneys, cardiovascular system, liver, skin and reproductive system.
N Y (IARC 2B) N
TOC as Benzene
N
Potential health impacts from VOC exposure depends on the particular VOC under consideration, the critical target organ for benzene is bone marrow (haematotoxicity and immunotoxicity). Note TOCs contains PAHs which are further discussed in Appendix B.
Y (Cat 1B) Y (IARC 1) Y
Vanadium Y Critical target organ is the respiratory system. Y (Cat 2) Y (IARC 2B) Y (Cat 2)
Notes: Some trace elements and minerals are important to normal human physiology. For nutrients involved in normal human function the substance was tagged ‘Y’ = yes in the “Essential Element” column. All others were tagged “N” = no.
Chemicals were placed into ‘toxicity categories’ by consulting ECHA Registered Substances Database, Various WHO publications, US ATSDR, IARC Monographs on the Evaluation of Carcinogenic Risks to Humans and Supplements. http://monographs.iarc.fr/ENG/Monographs/allmonos90.php.
The cancer classifications are categorised based on level of evidence; IARC 1 and USEPA A - confirmed human carcinogens, IARC 2A, USEPA B – probably human carcinogen, IARC 2B and USEPA C – possible human carcinogen; lesser classifications like US EPA Group C, D, E and IARC Group 3 and 4 were considered not sufficient to evaluate or categorise as a carcinogen.

21 1000235 DWER HHRA W2E East Rockingham Rev1.docx
Table 8 Health-based Ambient Air Criteria from Various Environmental Organisations (μg/m3)
COI Averaging Time
Selected Criteria
NEPC 2016 US NAAQS
EU AQFD
WHO 2014
WHO 2005 (Europe)
TCEQ 2016 OHHEA ATSDR (a) US EPA IRIS
Alternate Guideline
Jurisdiction
Carbon Monoxide 8-hour 10000 10000 10000 10000 - 10000 must meet NAAQS
- - - - -
Nitrogen Dioxide 1-hour 246 246 205.3 200 200 400 must meet NAAQS
- - - - -
Nitrogen Dioxide 1-year 62 62 108 40 40 - must meet NAAQS
- - - - -
PM10 24-hour 50 50 150 50 50 - must meet NAAQS
- - - - -
PM10 1-year 25 25 - 40 20 - must meet NAAQS
- - - - -
PM2.5 24-hour 25 25 35 25 25 - must meet NAAQS
- - - - -
PM2.5 1-year 8 8 12 20 10 - must meet NAAQS
- - - - -
Sulphur Dioxide 1-hour 570 570 214 350 - 350 must meet NAAQS
- - - - -
Sulphur Dioxide 24-hour 228 228 - 125 20 - must meet NAAQS
- - - - -
Sulphur Dioxide 1-year 60 60 - - - - must meet NAAQS
- - - - -
Hydrogen Chloride 1-hour 100 - - - - - 190 2100 - 20 100 WA DoH (2005)
Hydrogen Fluoride 1-hour 100 - - - - - 18 240 - - 100 WA DoH (2007)
TOC(AsBenzene) 1-hour 29 - - - - - 170 (for benzene)
- - - 29 DEC NSW (2005)
Dioxins and Furans 1-hour 0.000001 - - - - - - - - - 0.000001 Toxikos (2010)
Arsenic 1-hour 0.09 - - - - - 3 - - - 0.09 DEC NSW (2005)
Arsenic 1-year 0.003 - - - - - 0.067 - - - 0.003 Toxikos (2010)
Cadmium 1-hour 0.018 - - - - - 5.4 - - - 0.018 DEC NSW (2005)
Cadmium 24-hour 0.016 - - - - - - - - - 0.016 Toxikos (2010)

22 1000235 DWER HHRA W2E East Rockingham Rev1.docx
COI Averaging Time
Selected Criteria
NEPC 2016 US NAAQS
EU AQFD
WHO 2014
WHO 2005 (Europe)
TCEQ 2016 OHHEA ATSDR (a) US EPA IRIS
Alternate Guideline
Jurisdiction
Cobalt 1-year 0.1 - - - - - 0.02 - 0.1 - 0.1 Toxikos (2009)
Chromium (IV) 1-year 0.0002 - - - - - 0.0043(b) 0.2 - 0.1 0.0002 Toxikos (2010)
Chromium (III) 1-hour 10 - - - - - 3.6 (c) - - - 10 Toxikos (2010)
Copper 1-hour 1 - - - - - 10 100 - - 1 Toxikos (2010)
Mercury 1-hour 1.8 - - - - - 0.25 0.6(d) - - 1.8 DEC NSW (2005)
Mercury 1-year 1 - - - - 1 0.025 0.03 0.2 0.3 1 Toxikos (2010)
Manganese 1-hour 18 - - - - - 2 - - - 18 DEC NSW (2005)
Manganese 1-year 0.15 - - - - 1 0.2 0.09 0.3 0.05 0.15 Toxikos (2010)
Nickel 1-hour 0.18 - - - - - 0.33 0.2 - - 0.18 DEC NSW (2005)
Nickel 1-year 0.003 - - - - - 0.059 0.014 0.09 - 0.003 Toxikos (2010)
Lead 1-year 0.5 0.5 - - - 0.5-1.0 must meet NAAQS
- - - - -
Lead 1-hour 9 - - - - - 5 - - - 9 DEC NSW (2005)
Thallium 1-hour 1 - - - - - 50 - - - 1 Toxikos (2010)
Thallium 1-year 0.1 - - - - - 5 - - - 0.1 Toxikos (2009)
Vanadium 24-hour 1 - - - - 1 - - - - 1 Toxikos (2010)
Notes: - indicates no value available (a) Minimum Risk Levels used for ATSDR sources (b) Chromium (IV) Compounds used for this value (c) Chromium (III) Oxide used for this value (d) The value is for acute mercury – not specifically for a 1 hour averaging time

23 1000235 DWER HHRA W2E East Rockingham Rev1.docx
Section 4 Risk Characterisation
4.1 Context and Introduction The risk characterisation describes the findings of the HHRA. The risk is characterised as follows:
How does the proposed facility emissions affect resident activities and health? In other words will the emissions reduce air quality in East Rockingham in a way that impacts on people’s health or ability to be outdoors? This has been assessed in Section 4.2 using the air quality index.
Over a short duration of time are there any emission components and/or is the emission in total present at air concentrations that are potentially harmful to health? This has been assessed in Section 4.3. This is assessed by estimating hazard quotients and a hazard index. These terms are described below.
Over a long period of time are there any emission components and/or is the emission in total present in air that are potentially harmful to health? This has been assessed in Section 4.4. This is assessed by estimating hazard quotients and a hazard index. These terms are described below.
Do any individual emission components or mixture of emission components present an unacceptable cancer risk to the general population? This is assessed by estimating incremental cancer risk. This term is described below.
How can we be confident that the emission components don’t present any other environmental risks? This has been assessed by previous authors and their findings are summarised in Section 5. In addition, this is addressed in Appendix A.
4.1.1 Hazard Quotients and Hazard Index For assessing the potential for non-cancer health impacts of individual chemicals, predicted ground level concentrations are compared to individual health-based ambient air criteria to protect public health. This comparison is performed by calculating a hazard quotient (HQ) which is the ratio of ground level concentration (GLC) to the selected health-based ambient air criteria.
Thus, a hazard quotient is calculated for each contaminant using the simple equation below.
HQ = Estimated GLC / Criteria Equation 2
For assessing the potential effects of the mixture of COI emitted to air it has been assumed that individual components may have additive effects and so an overall hazard index (HI) is calculated (US EPA 2000). The hazard index (HI) is the sum of all the emission component’s hazard quotients. The HQs can be determined from either the acute or chronic air guideline values, thus an acute and a chronic hazard index can be generated.
𝐻𝐻𝐻𝐻𝐻𝐻 = ∑ 𝐻𝐻𝐻𝐻 𝐻𝐻 𝐻𝐻 Equation 3
Where HIj is the sum of HQ’s for all pollutants from i to j (for acute and chronic averaging times).
This process assumes:
There is a threshold level of exposure below which no adverse health effects will occur.
Either the toxicological effect of chemicals and/or the dose is additive.
Multiple sub-threshold exposures may result in an adverse health effect.
Besides the air quality indicators discussed in the previous section (PM, NO2, SO2 and CO) this risk assessment will also consider 14 individual COI. Although these chemicals will likely have more than one toxicological effect which often requires different levels of exposure to become apparent; it is impractical to determine all the dose effect(s) relationships for all chemicals of concern. Hence it is difficult to identify with confidence all the substances that will have common sites of toxicological action. Instead, a pragmatic approach has been adopted. Regardless of the mode

24 1000235 DWER HHRA W2E East Rockingham Rev1.docx
of toxicological action or site of adverse health effect, acute and chronic non-cancer hazard indices have been generated for all COI as if they all act additively.
An unacceptable risk, as defined by regulatory standards and requirements, is often determined as the exposure being larger than the air criteria value used to calculate the HQ (i.e., the HQ>1). This definition of unacceptable risk does not equate with risk of adverse health effects. It simply means that the health-based criteria has been exceeded.
The general rule of thumb for interpreting a HQ and HI is:
That values less than 1 present no cause for concern;
Values greater than 1, often do not represent cause for concern because of the inherent conservatism embedded in the exposure portions of a preliminary risk assessment.
For values greater than 1, it is usual to examine, and refine, the level of conservatism that has been assumed in the exposure assumptions.
4.1.2 Estimating Incremental Lifetime Cancer Risk Incremental Lifetime cancer risk for carcinogens, whose mode of action is by directly altering genetic material (i.e. they are genotoxic), is calculated by multiplying the average lifetime chemical exposure by an estimate of the carcinogenic potency of the chemical. For air emissions this is called the unit risk factor (UR).
For air borne carcinogens, the unit is generally 1 µg/m3 and depending on the nature of the data used to determine the carcinogenic potency, the numerical value refers to the additional risk of cancer due to the emission component. The unit risk factor (UR) is a benchmark that is published by expert agencies such as the World Health Organisation or the US Environment Protection Agency.
The incremental cancer risk is expressed as the number of excess cancers per population. That is one in one million (1 x 10⁻⁶). The target acceptable risk band adopted in this assessment is 1 x 10⁻⁶ to 1 x 10⁻⁵, i.e. with a lifetime exposure there is a chance of developing a tumour between one in one hundred thousand and one in a million.
Incremental lifetime cancer risk (ILCR) = lifetime average air concentration (AC; µg/m3) x unit risk factor (UR; µg/m3) -1
ILCR = AC (µg/m3) x UR (µg/m3) -1 Equation 4
It is common practice (conservative assessment practice) to assume cancer risks due to different genotoxic carcinogenic air pollutants is additive, sum of the individual cancer risks is used to estimate a total lifetime risk of developing cancer.
25 1000235 DWER HHRA W2E East Rockingham Rev1.docx
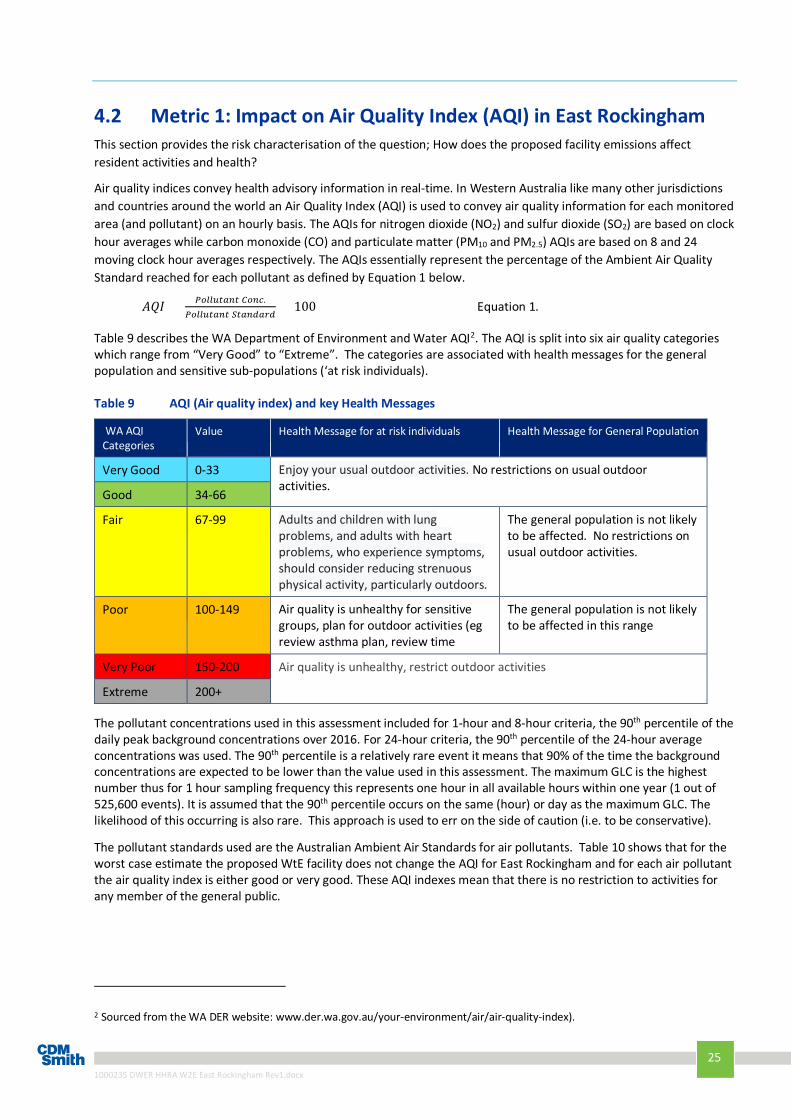
4.2 Metric 1: Impact on Air Quality Index (AQI) in East Rockingham This section provides the risk characterisation of the question; How does the proposed facility emissions affect resident activities and health?
Air quality indices convey health advisory information in real-time. In Western Australia like many other jurisdictions and countries around the world an Air Quality Index (AQI) is used to convey air quality information for each monitored area (and pollutant) on an hourly basis. The AQIs for nitrogen dioxide (NO2) and sulfur dioxide (SO2) are based on clock hour averages while carbon monoxide (CO) and particulate matter (PM10 and PM2.5) AQIs are based on 8 and 24 moving clock hour averages respectively. The AQIs essentially represent the percentage of the Ambient Air Quality Standard reached for each pollutant as defined by Equation 1 below.
𝐴𝐴𝐻𝐻𝐻𝐻 = 𝑃𝑃𝑃𝑃𝑃𝑃𝑃𝑃𝑃𝑃𝑃𝑃𝑃𝑃𝑃𝑃𝑃𝑃 𝐶𝐶𝑃𝑃𝑃𝑃𝐶𝐶.𝑃𝑃𝑃𝑃𝑃𝑃𝑃𝑃𝑃𝑃𝑃𝑃𝑃𝑃𝑃𝑃𝑃𝑃 𝑆𝑆𝑃𝑃𝑃𝑃𝑃𝑃𝑆𝑆𝑃𝑃𝑆𝑆𝑆𝑆
× 100 Equation 1.
Table 9 describes the WA Department of Environment and Water AQI2. The AQI is split into six air quality categories which range from “Very Good” to “Extreme”. The categories are associated with health messages for the general population and sensitive sub-populations (‘at risk individuals).
Table 9 AQI (Air quality index) and key Health Messages
WA AQI Categories
Value Health Message for at risk individuals Health Message for General Population
Very Good 0-33 Enjoy your usual outdoor activities. No restrictions on usual outdoor activities.
Good 34-66
Fair 67-99 Adults and children with lung problems, and adults with heart problems, who experience symptoms, should consider reducing strenuous physical activity, particularly outdoors.
The general population is not likely to be affected. No restrictions on usual outdoor activities.
Poor 100-149 Air quality is unhealthy for sensitive groups, plan for outdoor activities (eg review asthma plan, review time
The general population is not likely to be affected in this range
Very Poor 150-200 Air quality is unhealthy, restrict outdoor activities Extreme 200+
The pollutant concentrations used in this assessment included for 1-hour and 8-hour criteria, the 90th percentile of the daily peak background concentrations over 2016. For 24-hour criteria, the 90th percentile of the 24-hour average concentrations was used. The 90th percentile is a relatively rare event it means that 90% of the time the background concentrations are expected to be lower than the value used in this assessment. The maximum GLC is the highest number thus for 1 hour sampling frequency this represents one hour in all available hours within one year (1 out of 525,600 events). It is assumed that the 90th percentile occurs on the same (hour) or day as the maximum GLC. The likelihood of this occurring is also rare. This approach is used to err on the side of caution (i.e. to be conservative).
The pollutant standards used are the Australian Ambient Air Standards for air pollutants. Table 10 shows that for the worst case estimate the proposed WtE facility does not change the AQI for East Rockingham and for each air pollutant the air quality index is either good or very good. These AQI indexes mean that there is no restriction to activities for any member of the general public.
2 Sourced from the WA DER website: www.der.wa.gov.au/your-environment/air/air-quality-index).

26 1000235 DWER HHRA W2E East Rockingham Rev1.docx
Table 10 AQI Results (based on Maximum Predicted Ground Level Concentration.)
COI Background Concentration (μg/m3)
Air Quality Criteria
AQI (existing airshed)
Total (Max GLC + Background) (μg/m3)
Worst Case AQI (existing + New Energy)
Short-Term Indicator
CO 815 10000 8.2 (Very Good) 836.9 8.4 (Very Good)
NO2 84 246 34 (Good) 137.8 56.1 (Good)
PM10(a) 24 50 48 (Good) 26.17 52 (Good)
PM2.5 12 25 48 (Good) 12.978 52 (Good)
SO2 35 570 6 (Very Good) 68.8 12 (Very Good)
The AQI is an assessment of short term air quality intended for delivering health messages to the general public on a daily basis.
Table 11 uses the same method as the AQI but it is based on the annual average. The same criterion and AQI ranges are utilised (refer Table 9) but the annual average concentrations are compared to annual average air quality standards. The annual average is for the maximum GLC estimated for the proposed WtE facility. That means in most cases the W2E facility annual averages are anticipated to be lower. For NO2, SO2, and PM10 the AQI conclusion is very good to good air quality.
The background annual average fine particulate matter (PM2.5) concentration is 7.4 μg/m3. The major contributor to background annual average PM2.5 in Perth is bushfires and controlled burns (smoke) (DWER 2016, 2017). The proposed WtE plant contributes a maximum of 0.3 μg/m3 to the annual average PM2.5. The proposed W2E plant controls PM2.5 emissions with an efficiency of approximately 98-99%. The maximum contribution does not alter public amenity or health risk due to background exposure. Thus, it is concluded that the WtE plant does not contribute to long term risks of fine particulate matter in East Rockingham.
Table 11 Chronic Air Pollutants (based on Maximum Predicted Ground Level Concentration.)
COI Background Concentration (μg/m3)
Air Quality Criteria
Hazard Quotient
Total (Max GLC + Background) (μg/m3)
Air Quality Criteria
Worst Case AQI (existing + New Energy)
NO2 10 62 16 11 62 18
PM10(a) 15 25 60 15.07 25 60
PM2.5 7.4 8 93 7.7 8 96
SO2 2.7 60 4.5 3.1 60 5

27 1000235 DWER HHRA W2E East Rockingham Rev1.docx
4.3 Metric 2: Acute Health Hazards due to Air Emissions The acute results present the modelled change in background air quality for COI daily. The HQs are calculated for the maximum predicted GLCs (i.e. the maximum GLC at any modelled area in the vicinity of the Project) hence the hazard index in Table 12 is overly conservative. The values presented are the reasonable worst-case values predicted within the modelling domain.
Table 12 Acute HQ/HI Results for Individual Chemicals
COI Maximum Predicted Ground Level Concentrations (μg/m3)
Air Quality Criteria (μg/m3)
HQ for Total (Plant + Background)
Incremental Risk Due to the Plant (HQ attributable to plant emissions only)
Background Project Only
Total (Plant + Background)
HCl 5.3 10.9 16.2 100 0.07 0.068
HF - 6.76 6.76 100 0.007 0.007
TOC (as Benzene) - 0.676 0.676 29 0.028 0.028
As - 6.76E-08 6.76E-08 0.09 0.04 0.038
Cd 0.0041 0.00338 0.0075 0.018 0.33 0.328
Cr(III) 0.0001 0.00591 0.006 10 0.0006 0.119
Cu 0.0001 0.0019 0.002 1 0.04 0.0006
Hg 0.0034 0.00608 0.0095 1.8 0.019 0.044
Mn 0.0022 0.0439 0.0461 18 0.002 0.019
Ni 0.01 0.0338 0.0438 0.18 0.019 0.002
Sb 0.0202 0.0372 0.0574 9 0.004 0.019
Tl 0.0061 0.00338 0.0095 1 0.0008 0.004
V 0.0121 0.0372 0.0493 1 0.001 0.0008
Hazard Index 0.86 0.62 Notes: (a)Particulate matter, measured as either PM10 or PM2.5, has been associated with health effects. The health effects of particulate matter are interrelated and the measurement of PM10 includes the PM2.5 fraction. In order to avoid duplication in the cumulative impact of air emissions only PM10 was included in the Hazard Index calculation.
The acute hazard index is below 1, the only emissions related contaminants which contribute significantly (contribute more than 10% of the HI) are Cd and Cr (III). It is noted that chromium (trivalent) is the only chemical in Table 12 which had significantly higher maximum predicted ground level concentrations (an order of magnitude) than the existing background concentrations.

28 1000235 DWER HHRA W2E East Rockingham Rev1.docx
4.4 Metric 3: Chronic Hazard Index This assessment considers non-cancer adverse health effects to humans including developmental and reproductive effects and organ damage. It is conducted in a conservative manner as the maximum annual average GLCs are used. Not all emission components have chronic duration GLCs. These compounds were not included in the assessment. Table 13 summarises the chronic HQ and HI for incremental exposure (i.e. exposure to the maximum annual average GLC) results from the proposal (plant only) and also cumulative exposure (background and plant exposure combined). Each hazard quotient and hazard index for both scenarios are below unity. Thus there is negligible risk of adverse health effects due to the key emission components and the emission mixture.
Table 13 Incremental and Cumulative Chronic Hazard Quotients (HQ) and Hazard Index (HI)
COI Maximum Predicted Ground Level Concentrations (μg/m3)
Air Quality Criteria (μg/m3)
HQ for Total (Cumulative)
Incremental HQ (Plant only max GLC))
Background Plant Only Total (Cumulative)
As 0.0005 0.000035 0.0005 0.003 0.17 0.012
Co 0.0001 0.000035 0.0001 0.1 0.0013 0.0004
Cr(VI) 0.0001 0.000007 0.0001 0.0002 0.31 0.035
Hg 0.01 0.00035 0.0104 1 0.01 0.0004
Mn 0.0034 0.00039 0.0038 0.15 0.025 0.003
Ni 0.001 0.000035 0.001 0.003 0.34 0.012
Pb 0.0012 0.00207 0.0033 0.5 0.0066 0.004
Tl 0.0001 0.0000088 0.0001 0.1 0.0007 0.0001
Hazard Index 0.79 0.07
The chronic hazard index is below 1, none of the emissions related contaminants contribute significantly (contribute more than 10% of the HQ) to the HI. The incremental contribution attributable to plant emissions is an order of magnitude lower than background air quality.
The hazard indices (both acute and chronic) presented above are considered conservative as they are based on the sum of the maximum predicted ground level concentrations and the assumption that effects across individual chemicals is additive.
Across both chronic and acute air criteria there were no individual COI which exceeded an HQ of 1 and neither HI exceeded 1.
29 1000235 DWER HHRA W2E East Rockingham Rev1.docx
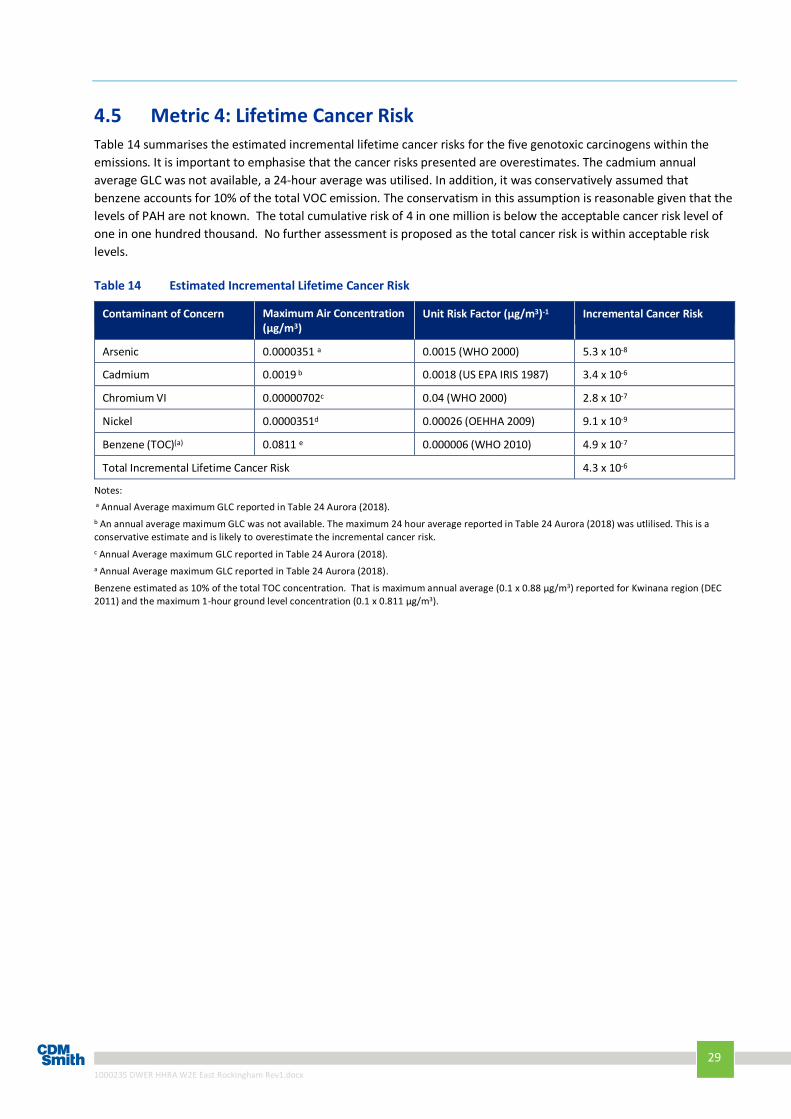
4.5 Metric 4: Lifetime Cancer Risk Table 14 summarises the estimated incremental lifetime cancer risks for the five genotoxic carcinogens within the emissions. It is important to emphasise that the cancer risks presented are overestimates. The cadmium annual average GLC was not available, a 24-hour average was utilised. In addition, it was conservatively assumed that benzene accounts for 10% of the total VOC emission. The conservatism in this assumption is reasonable given that the levels of PAH are not known. The total cumulative risk of 4 in one million is below the acceptable cancer risk level of one in one hundred thousand. No further assessment is proposed as the total cancer risk is within acceptable risk levels.
Table 14 Estimated Incremental Lifetime Cancer Risk
Contaminant of Concern Maximum Air Concentration (µg/m3)
Unit Risk Factor (μg/m3)-1 Incremental Cancer Risk
Arsenic 0.0000351 a 0.0015 (WHO 2000) 5.3 x 10⁻⁸
Cadmium 0.0019 b 0.0018 (US EPA IRIS 1987) 3.4 x 10⁻⁶
Chromium VI 0.00000702c 0.04 (WHO 2000) 2.8 x 10⁻⁷
Nickel 0.0000351d 0.00026 (OEHHA 2009) 9.1 x 10⁻⁹
Benzene (TOC)(a) 0.0811 e 0.000006 (WHO 2010) 4.9 x 10⁻⁷
Total Incremental Lifetime Cancer Risk 4.3 x 10⁻⁶
Notes: a Annual Average maximum GLC reported in Table 24 Aurora (2018). b An annual average maximum GLC was not available. The maximum 24 hour average reported in Table 24 Aurora (2018) was utlilised. This is a conservative estimate and is likely to overestimate the incremental cancer risk.
c Annual Average maximum GLC reported in Table 24 Aurora (2018). a Annual Average maximum GLC reported in Table 24 Aurora (2018).
Benzene estimated as 10% of the total TOC concentration. That is maximum annual average (0.1 x 0.88 µg/m3) reported for Kwinana region (DEC 2011) and the maximum 1-hour ground level concentration (0.1 x 0.811 µg/m3).

30 1000235 DWER HHRA W2E East Rockingham Rev1.docx
Section 5 Confidence, Conservatism and Uncertainty The most important emissions to air from the combustion of combustible fuels are sulphur dioxide (SO2), nitrogen oxides (NOX), carbon monoxide (CO), particulate matter (dust, PM10, PM2.5). Other substances, such as heavy metals, hydrogen fluoride, hydrogen chloride, unburnt hydrocarbons, non-methane volatile organic compounds (NMVOCs) and dioxins, are emitted in smaller quantities but may have a significant influence on the environment due to their toxicity or their persistence (Lecomte 2017). These emissions are amongst the most important considerations in solid waste combustion plant design and operation in Europe. This is because of their vicinity to large population centres, the large amount of large combustion plants in Europe and their growing importance as an alternative to coal. There are approximately 2,841 large combustion plants in the European Union of which 248 are in the UK. The dense urbanised population centres across the EU present a need for advanced emission controls to avoid widespread air, land and water contamination.
In parallel to the increasing number of large plants emissions of the main air pollutants decreased significantly between 1990 and 20153:
emissions of nitrogen oxides decreased by 52 % (56 % in the EU-28). In 1990 the total emissions due to energy production and distribution was 4,448.1 Gg, in 2011 this had been reduced to 2,234.5 Gg;
emissions of sulphur oxides decreased by 83 % (89 % in the EU-28);
emissions of non-methane volatile organic compounds decreased by 59 % (61 % in the EU-28);
emissions of ammonia decreased by 18 % (23 % in the EU-28);
emissions of fine particulate matter decreased by 28 % (26 % in the EU-28) from 2000.
Based on a recent review of best available technology for 2,841 large combustion plants in Europe, and the general trend is toward lower emissions through increasing adoption of better technology. The best available technology process developed through the EU DIR provides confidence in the air emission estimates presented in the Air Quality Impact Assessment (Envall, 2017).
The Air Quality Impact Assessment only quantifies estimates for a small number of emission components. Combustion plants can produce a large amount of emission components but at trace concentrations. How can the HHRA be confident that the trace amount of these emissions does not contribute to the health risks due to the proposed plant?
It is possible the extent of emissions has been underestimated. However, the likelihood is considered to be minimal and the impact on the risk calculations minimal since any ‘missing’ emission components will be minor constituents. It is considered that minimising air pollutant concentrations (both gaseous and particulate) also reduces the emission of trace emission components. In addition, the emission components assessed by the proponents are those identified as important for solid waste combustion in previous reviews from Europe and Canada (Lecomte 2017, Intrinsik 2014).
Although it is considered unlikely a marked underestimation of emissions from the proposed WtE plant is likely to occur we believe the conservatism built into the dispersion modelling and risk assessment will cater for possible underestimation.
Process variability and hence emissions variability is not known at this time?
Emissions may be under or over estimated. A routine monitoring and reporting regime should be used to support plant operation and maintenance. There is good confidence in the inventory for air pollutants. These are the substances that have the greatest potential to increase in background emissions and thus require careful monitoring and control.
3 https://www.eea.europa.eu/data-and-maps/indicators/main-anthropogenic-air-pollutant-emissions/assessment-5

31 1000235 DWER HHRA W2E East Rockingham Rev1.docx
Emissions during start-up and shut-down conditions have not been characterised.
Potential exposure to emissions during start-up/shut-down will be short. Given the industrial land use around the proposed facility, controls to include meteorological conditions are conservative with respect to potential emissions, and the margin of safety calculated with the emissions during normal operation, it is considered unlikely there will be significant risk to health should exposure occur. It acknowledged however this is an uncertainty with respect to these operational modes and an appropriate monitoring plan for of emissions from the WtE plant may be required to provide confidence around assumptions.
This was included in the air emission study (they included the odours from the receival hall and the secondary emission stack during shutdown). Dust from the solid waste treatment was not included.
Only direct inhalation exposure is considered within the HHRA (i.e. primary pathways). What about the potential of emissions to impact on food, water, land contamination (i.e. secondary pathways)?
Indirect exposure via settling of emissions onto land, water, vegetation and subsequent uptake via the food chain was assessed in Appendix A. It is concluded that such impacts are unlikely.
Some of the conservative aspects of the HRA taken to account for the above uncertainties include:
Those associated with the estimated maximum ground level concentrations:
– For some contaminants modelled concentrations were only available for short-term averaging times (1-hour) which meant that long-term exposure estimates in those cases are likely very conservative.
Those associated with exposure estimation and receptors:
– The modelling only provided maximum ground level concentrations for the entire domain, as such these maximum values were used to consider exposure for all potential receptors. This is likely highly conservative.
Contaminant specific uncertainties:
– The screening guidelines used in this assessment were selected from regulatory agencies based on the WA preferred criteria. Guidelines from other agencies may be lower than those selected, however in most cases guidelines that were selected were chosen because they were derived by competent organisations.
– Most studies on air pollutants have been limited to single air pollutants and very little research has been done on complex mixtures of compounds that exist in ambient air. Therefore, the assumptions made about mixture toxicity in this report (for individual chemicals) is likely conservative. Air quality indicators like PM, CO, NO2 and SO2 were assessed individually as there is some overlap between the guidelines already in their derivations.

32 1000235 DWER HHRA W2E East Rockingham Rev1.docx
Section 6 References Aurora Environmental 2017. East Rockingham Waste to Energy Facility, Environmental Review Document, Assessment No. 2116, Dated 30 October 2017’
British Columbia Centre for Disease Control (BCCDC) 2012. Health assessment for thermal treatment of municipal solid waste in British Columbia. December 2012
DEC 2011. Background Air Quality Monitoring in Kwinana 2005-2010. Technical Report. Accessed https://www.der.wa.gov.au/images/documents/your-environment/air/publications/background_AQ_kwinana_2005-2010.pdf
EnHealth 2012. Environmental Health Risk Assessment, Guidelines for Assessing Human Health Risks from Environmental Hazards. Department of Health and Ageing and enHealth Council. Commonwealth of Australia, 2012.
Envall 2017. APPENDIX 7: Air Quality Impact Assessment Report. Aurora Environmental – NEC2017-004-PER_005_pz – 30 October 2017
Intrinsik 2014. Literature Review of Potential Health Risk Issues Associated with New Waste to-Energy Facilities. Prepared for Metro Vancouver. May 2014.
Office of Environmental Health Hazard Assessment (OEHHA) (2009). Technical Support Document for Cancer Potency Factors 2009.
Texas Commission on Environmental Quality (TCEQ) 2016. Effects Screening Levels (ESLs). Toxicology Division TCEQ, Accessed from: http://www.tceq.state.tx.us/implementation/tox/
Thierry Lecomte, José Félix Ferrería de la Fuente, Frederik Neuwahl, Michele Canova, Antoine Pinasseau, Ivan Jankov, Thomas Brinkmann, Serge Roudier, Luis Delgado Sancho; Best Available Techniques (BAT) Reference Document for Large Combustion Plants; EUR 28836 EN; doi:10.2760/949
US EPA 2009. Guidance for Superfund Volume I: Human Heatlh Evaluation Manual (Part F, Supplemental Guidance for Inhalation Risk Assessment) . United States Environment Protection Agency.
U.S. EPA IRIS 1987. Chemical Assessment Summary for Cadmium (CASRN 7440-43-9). Slope factor revised 1987. Integrated Risk Information System, Accessed from http://www.epa.gov/iris/subst/0141.htm
USEPA (1998) Guidelines for Ecological Risk Assessment. US Environmental Protection Agency (USEPA), Washington, DC.
USEPA (2009) Science and Decisions: Advancing Risk Assessment. In 'Science and Decisions: Advancing Risk Assessment.' (Ed. Committee on Improving Risk Analysis Approaches Used by the U.S. EPA Board on Environmental Studies and Toxicology Division on Earth and Life Studies.) (National Academies Press: Washington (DC))
U.S. EPA IRIS 2013. Chemical Assessment Summary for 1,4-Dioxane; CASRN 123-91-1. Integrated Risk Information System, Accessed from http://www.epa.gov/iris/subst/0326.htm
WA Department of Health (DoH) 2006. Health Risk Assessment in Western Australia
WA Department of Health (DoH) 2010. Health Risk Assessment (Scoping) Guidelines
WA Department of Water and Environment Regulation (DWER) 2016. Annual Air Quality Monitoring Report.
WA Department of Water and Environment Regulation (DWER) 2017. Annual Air Quality Monitoring Report.
World Health Organisation (WHO) 2000. World Health Organisation Air quality guidelines for Europe. 2nd edition. Geneva. Available at: http://www.euro.who.int/air/activities/20050223_4
WHO (World Health Organisation) 2005. Air Quality Guidelines Global Update 2005. WHO Regional Office for Europe. Copenhagen, Denmark.

33 1000235 DWER HHRA W2E East Rockingham Rev1.docx
WHO (World Health Organisation) Regional Office for Europe 2010. WHO guidelines for indoor air quality: selected pollutants. Copenhagen.

Appendix A Screening Assessment for Secondary Pathways

A.1 Secondary Exposure Pathways Direct inhalation is the most important exposure pathway in majority of circumstances for most pollutants found in industrial emissions with modern pollution controls. That is to say, exposure to chemicals from plant emissions will primarily occur through direct exposure pathways like inhalation.
However, substances with the appropriate physiochemical (e.g. solubility in fat), environmental (e.g. persistence) and biological (e.g. poor rates of metabolism and excretion) properties, can accumulate through the human food chain in situations where there is exposure to these contaminants. Exposure in this case would entail deposition to land (where food productions occurs) which recent studies have shown (for modern waste to energy plants) to be minimal. As part of the Greater Vancouver Regional District's ambient monitoring program, monitoring of the impact of the emissions to the neighbouring area's soils and vegetation was conducted. This study showed no evidence of emission related impacts to soil from organic contaminants and demonstrated that metal related impacts are difficult to assess due to natural enrichment and other industrial activities likely to contribute to soil metal concentrations (BCCDC 2012).
These pathways are called secondary pathways (e.g. deposition onto food crops or soil which may be ingested by humans and/or food producing animals). Contaminants deposited to soil or plant surfaces can theoretically be internalised and accumulated by plants or the animals that feed upon them (it is noted that the land surrounding the proposed development site is zoned industrial and is not used for large scale food production). However, over the last few decades, research has shown that only relatively few chemicals have the potential to present significant health risks to humans as a result of accumulation through the food chain. Such chemicals have a common set of chemical and biological properties:
They are poorly degraded in the environment and hence have long environmental half-lives;
They are slowly metabolized/ excreted (by humans and animals) and hence have long biological half lives (in the body); and
They are highly soluble in fat (or partition to a high degree to some other tissue) which together with the poor metabolism means they can accumulate and be stored in various tissues of the body. If this storage in the body is significant, body burdens of the chemical may reach a level where toxicity might occur.
The groups of chemicals associated with the project which could meet this description are:
Dioxins;
PAHs (sub group of TOCs); and
Metals.
These chemical groups are discussed further in the following sections.
A.2 Dioxins Maximum ground level concentrations for dioxins and furans were provided in the Air Quality Impact Assessment (Aurora Environmental 2017; 6.7 x 10⁻⁸ TEQ μg/m3) which has been used in this assessment. The ground level concentrations were provided as the sum of International Toxic Equivalents (TEQs) for dioxins and furans.
Air Concentrations of Dioxin Like Substances
A comparison of relative concentrations of dioxin like substances in air is provided in Table 15. The highest annual average ground level concentration predicted in the vicinity of the proposed plant is 0.000067 pg TEQ/m3 while in Europe a background concentration of 0.1 pg TEQ/m3 is assumed but certain industrial and urban areas, as well as areas close to major sources, may have up to 20 times higher air concentrations (WHO 2000). In Japan atmospheric concentrations of 0.55 pg TEQ/m3 for dioxins/furans plus PCBs have been measured and used for assessing risk

(EA/MoHW 1999). Concentrations measured at Griffith University were approximately 0.009 – 0.0174 pg TEQ/m3 (Muller et al. 1998).
Table 15 Relative Concentrations of Dioxin Like Substances in Air
Location Concentration (pg TEQ/m3) Reference
East Rockingham 0.000067 Aurora Environmental 2017
Wattleup c 0.016 Gras et al. (2004).
Duncraig d 0.057 Gras et al. (2004).
Griffith University, Brisbane 0.009 – 0.017 b Muller et al. (1998).
Urban Brisbane 0.0047 b Muller et al. (1998).
Urban Sydney 0.0016 – 0.062 b Cited in Muller et al. (1998)
Assumed for Europe 0.1 WHO (2000).
Japan 0.55 EA/MoHW (1999).
Notes: a Predicted incremental increase due to waste to energy facility emissions. b Total TCCD equivalents calculated with NATO factors. c Wattleup, in the Kwinana area, Perth, WA (industrial). d Duncraig, Perth, WA (mid-sized urban).
Methodology for assessing risk to dioxins emissions
A pivotal aspect of the screening risk assessment for secondary exposure pathways for dioxin exposure is the estimation used for background intake of dioxin like substances.
The Australian Government has published estimates for background intake of dioxin like substances for Australians (OCS 2004). The estimated total background intakes from all sources of exposure for dioxins and furans, polychlorinated biphenyls (PCBs) and total dioxin like substances for Australian adults are presented in Table 16.
Intake from food accounts for between 95-99% of the total intakes and intakes from air are generally less than 1-5% (OCS 2004). For the purposes of this risk assessment the upper bound total intake estimates are used from this review. Although dioxins have long biological half-lives (approximately 7 years) (NHMRC 2002) and it takes many years for steady state body burdens to be achieved it is assumed in this screening assessment that steady state has been achieved between the incremental increase in the environmental load of dioxins (due to plant emissions) and those accumulated in the food sources.
Table 16 Estimated Total Intakes of Dioxin Like Substances for Australian Adults
Total Intake (pg WHO TEQ/kg bw month)
Dioxins and Furans PCBs Total Dioxin TEQ
Lower Bound Upper Bound Lower Bound Upper Bound Lower Bound Upper Bound
1.06 10.37 2.83 5.42 3.89 15.79
Notes: Data from OCS 2004 (Table 3-32)
The general principle for assessing potential health impacts for dioxins (emitted from the waste to energy plant) is to determine an incremental monthly intake from all exposure routes which can be attributable to the dioxin content of emissions. The incremental exposure due to emissions is added to the upper bound estimate of monthly background 4 These are calculated as NATO toxic equivalents, the difference between the NATO and WHO98 TEFs used for the WAPL emission is insignificant in the context of the contextual information.

intake. This sum is then compared to the monthly intake considered tolerable (TMI) by the Australian Government Department of Health and Ageing (NHMRC 2002).
The Air Quality Impact Assessment Report (Aurora Environmental 2017) estimated that the maximum ground level concentration for dioxin like substances is 6.7 x 10⁻⁵ pg TEQ/m3 (due to plant related emissions).
Hence the incremental monthly average intake for an adult via inhalation5 (MlINHAL) would be:
MlINHAL = [(6.7 x 10⁻⁵ pg TEQ/m3) x (20m3/day x 30 days)] / 70kg bw = 0.00057 pg TEQ/kg bw month
The incremental increase in exposure due to the waste to energy emissions is <0.01% of the background exposure. The sum of the incremental inhalation exposure and background intakes is 15.7906 pg TEQ/ kg bw per month.
Comparison to TMI
To emphasise the relatively long-time frames required for exposure to dioxin like substances before effects are likely to occur, the Australian NHMRC/TGA recommend6 (NHMRC 2002) a tolerable monthly intake (TMI) of 70 pg TEQ/kg bw. This is instead of the more common Tolerable Daily Intakes recommended for most other substances. The TMI is a monthly intake of dioxins and dioxin like PCBs that can occur over 40 - 50 years such that the body burden associated with adverse health effects is not achieved. A safety factor of about 10-fold is incorporated into the establishment of the TMI relative to accumulated body burdens in experimental animals associated with subtle adverse effects. As such the TMI is considered an intake that can pragmatically be considered as safe.
The total intake (background + inhalation) estimated for dioxins (in the vicinity of the proposed plant) is approximately 23% of the Tolerable Monthly Intake. Practically the entirety of the dioxin intake is associated with the background intake (upper bound); the incremental increase due to the waste to energy emissions is estimated to be 0.001%.
Conclusion for Dioxins
Assuming steady state conditions between the emission rate of dioxin like material, increased environmental load and human body burden, the theoretical increase over background monthly intake of dioxin like substances from the emissions is very small (less than 0.001%) and the total intake, including background, is much less than the tolerable monthly intake recommended by Australian health authorities. It is therefore concluded the emissions do not present a likely human health risk from direct and/or indirect exposures, it is also concluded that it is not necessary to conduct a detailed analysis of secondary pathways of exposure for dioxins.
A.3 Polycyclic aromatic hydrocarbons The Air Quality Impact Assessment (Aurora Environmental 2017) reported organic constituents as TOC (as benzene); this fraction is likely to also consist of polycyclic aromatic hydrocarbons (PAHs). Although not directly measured this section provides some further discussion on PAHs and their potential for bioaccumulation.
PAHs are typically by-products of incomplete combustion of organic material; the predominant sources of PAH pollution are motor vehicle traffic (both petrol- and diesel-fuelled), residential heating, especially with wood, coal, burning-off and bushfires.
5 The US EPA (1997b) sum the relative proportions of air intake for an adult male while at rest and undertaking a mixture of light, moderate and heavy breathing activities during a day to give a total daily inhalation rate of 21.4 m3/d. enHealth (2002) of Australia recommend a default inhalation rate for adults of 22 m3/d, this is the same as the average of males and females suggested by IPCS (1994). Health Canada (1999) recommend 23 m3/d. For this risk assessment Australian enHealth recommendations are followed and 22 m3/d used. 6 The TGA recommendation for a tolerable monthly intake of dioxin-like substances for Australians is based on deliberations of the WHO (1998a), EC-SCF(2001) and JECFA (2001) and was endorsed by the NHMRC on 24th October 2002. The guideline was established through the NHMRC process to ensure national acceptability. The report upon which the guideline is based underwent public consultation processes and was subject to external review before finalisation. This health reference value for dioxin like substances is the appropriate value for use in risk assessments for Australia.

The distribution of PAHs between air and particulate matter under normal atmospheric conditions depends on the lipophilicity, vapour pressure, and aqueous solubility of the specific PAH. Generally, PAHs with few (two to four) aromatic rings occur in the vapour phase, whereas PAHs consisting of more aromatic rings exist mainly adsorbed onto particulates. PAHs are usually adsorbed onto particles like fly ash and soot that are emitted during combustion (WHO 1998a). At 200C benzo(α)pyrene in ambient air is approximately 80% bound to particulates (Bidleman 1988).
Benzo(α)pyrene (BaP) is a PAH, considered to be amongst the most potent of the carcinogenic PAHs and is often used as an indicator of the carcinogenic potency of PAHs in a mixture. However, BaP is not regarded as being environmentally persistent because it decays rapidly in air despite it tending to favour partitioning into the lipid phases of the environment (Bennett et al. 2002). The persistence of a chemical in the environment depends in part on which media it is released to (Webster et al. 1998), the persistence of BaP is much lesser when it is released to air than to water (Bennett et al. 2002). On the basis of model calculations, Mackay et al. (1992) calculated the persistence of BaP in air, water, soil, and sediment as half-life ranges of approximately 4 – 12 days, 42 – 125 days, 1 – 3.5 years and > 3.5 years.
Levels of PAHs in ambient air vary considerably, with higher levels being found in urban areas. Depending on location the background concentrations of individual PAHs in urban air spans several orders of magnitude but are generally in the range <0.1 – 100 ng/m3. The average levels of individual PAHs in ambient air of rural areas are generally 0.1 – 1 ng/m3, and in urban areas 1 – 30 ng/m3 with some locations being greater than 200 ng/m3 for specific PAHs (WHO 1998a).
The concentration of PAH in vegetation is generally considerably lower than that in soil; with bioaccumulation factors ranging from 0.0001-0.33 for benzo (α)pyrene and from 0.001-0.18 for a range of other PAHs reported (WHO1998a). In UK cropland soils given repeated applications of PAHs in sewerage sludge over a number of years, the concentrations of PAHs in plants did not correlate with soil concentrations, and PAH on aboveground plant parts were concluded as probably being the result of atmospheric deposition. In a separate study there was minimal movement of PAHs from the root peel of carrots to the inner core, suggesting simple adsorption onto the roots was the major process whereby PAHs may be found on plants (ATSDR 1995). Thus, there is little uptake and translocation of PAHs by plants from soil.
It can be inferred from the available information on the total human body burden that PAHs do not persist in the body and that turnover is rapid. This inference excludes those PAH moieties that become covalently bound to tissue constituents, in particular nucleic acids, and are not removed by repair (WHO 1998a).
Conclusion for PAHs
Although PAHs were not modelled in the Air Quality Impact Assessment, studies conducted by other agencies have shown no evidence of emission related impacts to soils (in the vicinity of waste to energy plants) from PAHs (BCCDC 2012). In addition, it is considered unlikely that PAHs would accumulate in plants or animals (and up the food chain) due to limited uptake and relatively rapid excretion. It is therefore considered that evaluation of secondary exposure pathways for PAHs is not warranted.
A.4 Metals For metals, the screening procedure is pragmatically grounded in a comparison of predicted receptor ground level concentrations with rural background concentrations that are not associated with significant exposures via secondary pathways. This is augmented by a requirement for a significant inhalation margin of exposure for individual metals such that if exposure was to occur via secondary pathways there is ample conservatism in the screening process to ensure the additional non-inhalation intakes will not result in adverse health effects in humans.
Predicted Air Concentrations Relative to Background.
Ambient background air concentrations from Rockingham/ Kwinana and other parts of the world have been sought from authority reviews. These are presented in Table 17 together with the background and emission modelled concentrations for the metals (Aurora Environmental, 2017).

In general, the Estimated Maximum Ground Level Concentrations for the Project (for metals) fall below the relevant guidelines and are within ambient background concentrations reported from around the world. Metal exposure via either direct inhalation or secondary pathways has not been flagged as an issue at these background locations. If it is reasonably assumed that the background air concentrations for metals, within the zone of influence of the waste to energy emissions is the same as, or lower than those cited in Table 17 it would be expected that exposure via the secondary pathways is not significant.
Table 17 Comparison of Ambient Air Concentrations (various airsheds) with the Estimated Maximum Ground Level Concentrations for the Project (Aurora Environmental, 2017).
Metal Estimated Maximum Ground Level Concentrations (ng/m3)
Ambient background (ng/m3)
Comment on location Reference
Antimony 49.3 2 0.6 – 7 0.5-171 0.04-4.6 12.1a
Ave background. US rural areas. US urban areas NSW Urban Rockingham/ Kwinana
ATSDR (1992b) NSW (2003) DEC (2011)
Arsenic 7.5 1 – 3 1 – 28 4.2 – 9.6 20 – 100 0.09-2.5 0.5
US remote locations. US rural areas. Long term mean, Great Lakes. US urban areas. NSW Urban Rockingham/ Kwinana
ATSDR (2000a) NSW (2003 DEC (2011))
Cadmium 6a < 5 1-5 5-50 0.03-1 0.1
US general ambient. Rural Locations. Urban/ Industrialised Areas NSW Urban Rockingham/ Kwinana
ATSDR (1999b) WHO (1992) NSW (2003) DEC (2011)
Chromium 6.2 5-525 <100 <20 3.5
All US Non-industrialized areas Australia Urban Rockingham/ Kwinana
ATSDR (2000) WHO (1988a) EA (2002) DEC (2011)
Copper 46.1 5-50 2.4-28 <650 2.2a
Rural NSW Urban WA Urban Rockingham/ Kwinana
WHO (1998d) NSW (2003) EA (2002) DEC (2011)
Lead 3.3 0.1-8 200-400 100 1000-3000 5000-1000 2.4-99 140-1570 20 1.2
Remote areas. US urban areas. Australia Rural. Australia Urban Australia- Near heavy traffic NSW Urban WA Urban WA CBD Rockingham/ Kwinana
WHO (1977) ATSDR (1999c) Maynard (1991) NSW (2003) EA (2002) NEPC (2002b) DEC (2011)

Metal Estimated Maximum Ground Level Concentrations (ng/m3)
Ambient background (ng/m3)
Comment on location Reference
Manganese 3.8 10 – 70 1 3 3.7-119 <10 3.4
Europe US rural sites US urban sites. NSW Urban WA Urban Rockingham/ Kwinana
WHO (2000) ATSDR (2000c) NSW (2003) EA (2002) DEC (2011))
Mercury 10.4 10 – 20 1 2-4 10 10
Industrialised areas. Remote Southern Hemisphere Rural areas. Urban areas Rockingham/ Kwinana
ATSDR (1999d) WHO (1989) WHO (2000) DEC (2011)
Nickel 9.5 2.22 0.6-78 1-328 <0.1-1 0.86-20 <10 1
General ambient 1996. US rural US urban Marine NSW urban WA Urban Rockingham/ Kwinana
ATSDR (2003c) WHO (1991) NSW (2003) EA (2002) DEC (2011)
Thallium 0.1 < 1 0.02 – 0.1 0.3
Europe. Six US cities Rockingham/ Kwinana
ATSDR (1992d) DEC (2011)
Vanadium 5.4 0.001-0.8 0.21-64 50-200 0.16-49 4.3a
Remote Rural Urban NSW Urban Rockingham/ Kwinana
WHO (1988b) WHO (2000) NSW (2003) DEC (2011))
a Averaging time 1 hour
Conclusion for Metals
Considering that the screening criteria for metals were not exceeded, and the Estimated Maximum Ground Level Concentrations for the Project are generally within ambient background concentrations, a detailed examination of the secondary exposure pathways is not required for metals.

Disclaimer and Limitations This report has been prepared by CDM Smith Australia Pty Ltd (CDM Smith) for the sole benefit of WA Department of Water and Environmental Regulation for the sole purpose of assessing human health risk due to air emissions of a proposed waste to energy plant in East Rockingham.
This report should not be used or relied upon for any other purpose without CDM Smith’s prior written consent. Neither CDM Smith, nor any officer or employee of CDM Smith, accepts responsibility or liability in any way whatsoever for the use of or reliance on this report for any purpose other than that for which it has been prepared.
Neither CDM Smith, nor any officer or employee of CDM Smith, accepts responsibility or liability for or in respect of any use or reliance upon this report by any third party.
The information on which this report is based has been provided by WA Department of Water and Environmental Regulation and third parties. CDM Smith (including its officers and employees):
a. has relied upon and presumed the accuracy of this information;
b. has not verified the accuracy or reliability of this information (other than as expressly stated in this report);
c. has not made any independent investigations or enquiries in respect of those matters of which it has no actual knowledge at the time of giving this report to WA Department of Water and Environmental Regulation; and
d. makes no warranty or guarantee, expressed or implied, as to the accuracy or reliability of this information.
In recognition of the limited use to be made by WA Department of Water and Environmental Regulation of this report, WA Department of Water and Environmental Regulation agrees that, to the maximum extent permitted by law, CDM Smith (including its officers and employees) shall not be liable for any losses, claims, costs, expenses, damages (whether in statute, in contract or tort for negligence or otherwise) suffered or incurred by WA Department of Water and Environmental Regulation or any third party as a result of or in connection with the information, findings, opinions, estimates, recommendations and conclusions provided in the course of this report.
If further information becomes available, or additional assumptions need to be made, CDM Smith reserves its right to amend this report.