Embed Size (px)
Citation preview

Wendy A. Mitteager
State University of New York, Oneonta
Chapter 3 Lecture
Human Geography: Places and
Regions in Global Context Sixth Edition
Population Geography

© 2013 Pearson Education, Inc.
Key Concepts
• Census
• Demographics
• Population Dynamics
• Movement of Population
• Population Patterns
• Sustainable Development
Figure 3.1 Biometric census taking in
India, 2011

Key Concepts
Important Terms
• Census: A count of the population in a
country
– In U.S.A., done every 10 years (next one
2020)
– What does it include:
© 2013 Pearson Education, Inc.
Key Concepts
• Demographics: the patterns and rates of
population change, including birth and
death rates, age, migration trends, ethnic
background, religious background and
population distribution patterns.
• Population Dynamics: short-term and long-
term changes in the size and age of
populations, and the processes influencing
those changes
© 2013 Pearson Education, Inc.

Key Concepts
• Movement of Population
• Population Patterns
• Sustainable Development: The level of
development that can be maintained in a
country without depleting resources to the
extent that future generations will be
unable to achieve a comparable level of
development
© 2013 Pearson Education, Inc.
© 2013 Pearson Education, Inc.
Demography
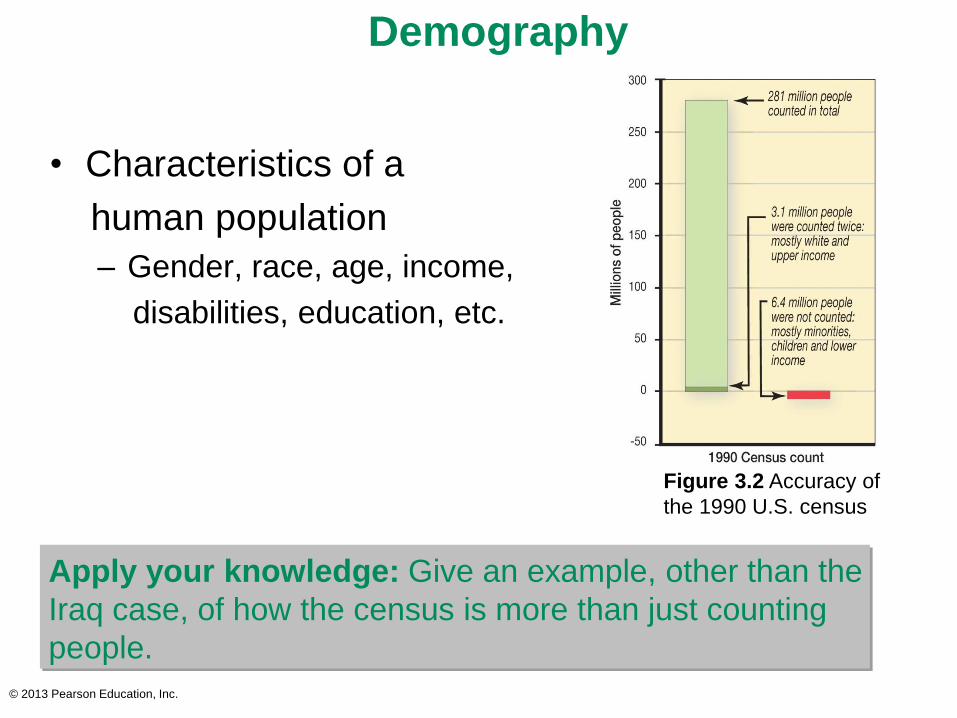
• Characteristics of a
human population
– Gender, race, age, income,
disabilities, education, etc.
Figure 3.2 Accuracy of
the 1990 U.S. census
Apply your knowledge: Give an example, other than the
Iraq case, of how the census is more than just counting
people.

Demography
• Census
– Vital records
• In U.S., these are public records
– Limitations
• Only as accurate as the people giving the information or
filling out the form
© 2013 Pearson Education, Inc.

© 2013 Pearson Education, Inc.
Population Distribution
Figure 3.3 World population density, 2010

© 2013 Pearson Education, Inc.
Population Distribution, (cont'd)
• Geographic reasons
– Environmental &
physical factors
– Political & economic
experiences
– Cultural
characteristics
• Examine at many
scales
– Global, national,
regional, metropolitan
Figure 3.4 Population distribution of Egypt

© 2013 Pearson Education, Inc.
[Insert Figure 3.A]
A New Sense of Identity, USA
Figure 3.A Mixed-race
Americans
Figure 3.B Mixed-race Americans, by region

© 2013 Pearson Education, Inc.
Population Density and Composition
• Crude (arithmetic)
density: The total
number of people
divided by the total
land area.
Figure 3.5 Mexico City, a classic high-density
urban settlement

Population Density and Composition
• Nutritional density: the measure of how
much nutrition can be produced from land
(a ratio between the total population and
the amount of land under cultivation in a
given area)
• Agricultural density: The ratio of the
number of farmers to the total amount of
land suitable for agriculture.
© 2013 Pearson Education, Inc.

© 2013 Pearson Education, Inc.
Health Care Density
Figure 3.6 Countries with a high proportion of old people face unique challenges. This map
shows the ratio of physicians to the population by nation.

© 2013 Pearson Education, Inc.
Age-Sex Pyramids
• Shape of pyramid
is dependent on
proportion of
people in each
age cohort
Figure 3.7 Population of Germany by age
and sex, 2000

Age-Sex Pyramids
• Dependency ratio
– A measure of the portion of a population
which is composed of dependents (people
who are too young or too old to work).
– The dependency ratio is equal to the number
of individuals aged below 15 or above 64
divided by the number of individuals aged 15
to 64, expressed as a percentage.
© 2013 Pearson Education, Inc.

Age-Sex Pyramids
• Dependency ratio
– A rising dependency ratio is a concern in
many countries that are facing an aging
population, since it becomes difficult for
pension and social security systems to
provide for a significantly older, non-working
population.
© 2013 Pearson Education, Inc.

© 2013 Pearson Education, Inc.
Figure 3.8 Population Pyramids of Core and Peripheral
Countries
Age-Sex Pyramids, (cont'd)
Apply your knowledge: Why do researchers divide the
population of a country into youth, middle, and old-age
cohorts? What do these categories indicate about the
potential of a country's population?

© 2013 Pearson Education, Inc.
U.S. Population
• Baby Boom generation
– Born 1946-1964
• Demographic, political,
and economic factors
– Suburbanization
• Aging of the core
countries
• Impacts on younger
Americans
– The Net Generation
Figure 3.D Improved health care leading to
longer life expectancies

© 2013 Pearson Education, Inc.
U.S. Population, (cont'd)
Figure 3.9 U.S. baby boomers, 1960-2040

© 2013 Pearson Education, Inc.
Birth (or Fertility) Rates
• Crude birthrate (CBR):
the total number of live
births in a year for
every 1000 people
alive in the society.
• Total fertility rate (TFR)
The average number of
children a woman will
have throughout her
childbearing years.
Table 3.3 TFR provides more insight into the
potential of a population

Birth (or Fertility) Rates
• Doubling time: The number of years
needed to double a population, assuming
a constant rate of natural increase.
© 2013 Pearson Education, Inc.

© 2013 Pearson Education, Inc.
Death (or Mortality) Rates
• Crude death rate
(CDR): The total
number of deaths
in a year for every
1000 people alive
in the society.
Figure 3.12 World crude death rates, 2009 &
2010

Death (or Mortality) Rates
• Infant mortality rate: The total number of deaths
in a year among infants under one year old for
every 1000 live births in a society.
• Life expectancy: The average number of years
an individual can be expected to live, given
current social, economic, and medical
conditions. Life expectancy at birth is the
average number of years a newborn infant can
expect to live.
© 2013 Pearson Education, Inc.

© 2013 Pearson Education, Inc.
Death (or Mortality) Rates, (cont'd)
Figure 3.14 World infant mortality rates 2009

© 2013 Pearson Education, Inc.
Figure 3.13
World Rates of Natural Increase, 2009

© 2013 Pearson Education, Inc.
Figure 3.15
HIV Infection, 2010
Apply your knowledge: How does the level of wealth of
a country affect its ability to respond to health issues like
HIV/AIDS, infant mortality, or life expectancy?

© 2013 Pearson Education, Inc.
Demographic Transition Theory
Figure 3.16 Demographic
transition model Figure 3.17 World trends in birth and
death rates, 1775-2050

© 2013 Pearson Education, Inc.
Demographic Transition Theory, (cont'd)
Apply your knowledge: Why would a country be
concerned about its population being too small? What
might a country gain by increasing or decreasing the
birthrate?

© 2013 Pearson Education, Inc.
Mobility and Migration
• Emigration: migration from a location
• Immigration: migration to a location
• International & internal migration
– Permanent & temporary
• Gross Migration: the total number of people who
leave and enter a country in a given time period

Mobility and Migration
• Net Migration: the difference between the
number of immigrants and the number of
emigrants
• Push Factors: induces people to move out
of their present location
• Pull Factors: induces people to move into
a new location
© 2013 Pearson Education, Inc.

Mobility and Migration
• Voluntary migration: the migrant has chosen to
move for economic improvement
– Guest workers: citizens of poor countries who obtain
jobs in Western Europe and Southwest Asia
– Undocumented workers: those who immigrate illegally
and enter a country without proper documents
• Forced migration: the migrant has been
compelled to move by cultural factors
© 2013 Pearson Education, Inc.

Mobility and Migration
• Refugees: people who have been forced
to migrate from their home country and
cannot return for fear of persecution
because of their race, religion, nationality,
membership in a social group, or political
opinion (Sometimes called “displaced
persons”
© 2013 Pearson Education, Inc.

Mobility and Migration
• Internally displaced persons (IDPs):
individuals who are uprooted within the
boundaries of their own country because
of conflict or human rights abuse
© 2013 Pearson Education, Inc.

© 2013 Pearson Education, Inc.
Mobility and Migration, (cont'd)
Figure 3.18 Global voluntary migration, 2005
© 2013 Pearson Education, Inc.
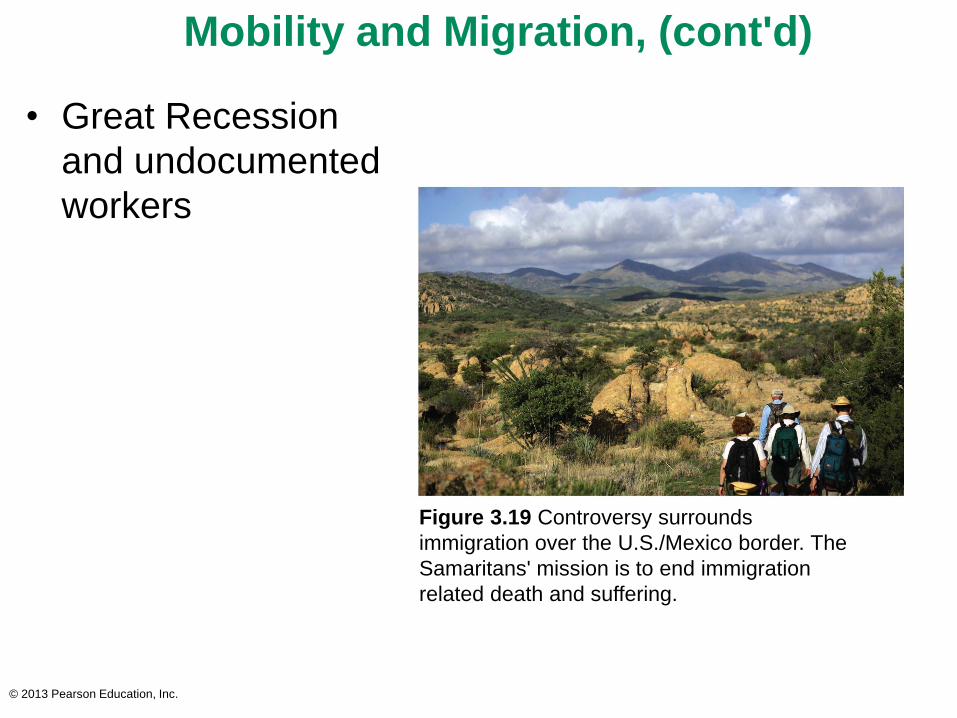
Mobility and Migration, (cont'd)
• Great Recession
and undocumented
workers
Figure 3.19 Controversy surrounds
immigration over the U.S./Mexico border. The
Samaritans' mission is to end immigration
related death and suffering.

Mobility and Migration, (cont'd)
• Transnational migrants: people who set up
homes and/or work in more than one
nation-state (People that may work in one
country at one season, then in another a
different season)
• Eco-migration: Population movement
caused by the degradation of land and
essential natural resources.
© 2013 Pearson Education, Inc.

© 2013 Pearson Education, Inc.
Figure 3.E Internally displaced persons, 2007
Mobility and Migration, (cont'd)

© 2013 Pearson Education, Inc.
Mobility and Migration, (cont'd)
Figure 3.21 Iraqi diaspora before 2003
and since
Figure 3.22 Palestinian refugees
in the Middle East

© 2013 Pearson Education, Inc.
Mobility and Migration, (cont'd)
Figure 3.23 Changing demographic center of
the U.S. 1790-2010
Figure 3.24 U.S. Rustbelt -- where population
was impacted by the movement of
corporations

© 2013 Pearson Education, Inc.
Population Debates and Policies
• Population and
Resources
– Malthus
– Neo-Malthusians
• Population policy
Figure 3.29 Educating girls in
Afghanistan
Figure 3.27 World population
projections

Population Debates and Policies
• Population and Resources – Malthus: Author of "Essay on the Principle of Population" (1798)
who claimed that population grows at an exponential rate while
food production increases arithmetically, and thereby that,
eventually, population growth would outpace food production.
– Neo-Malthusians: Advocacy of population control programs to
ensure enough resources for current and future populations.
© 2013 Pearson Education, Inc.

Population Debates and Policies
• Population policy: Laws set in place by a
country to limit growth of people
– China: Prior to Nov. 2015 limited couples to
one child
• If had more, tax penalties
– China: after Nov. 2015 said couples could
have TWO children without penalties
© 2013 Pearson Education, Inc.
© 2013 Pearson Education, Inc.
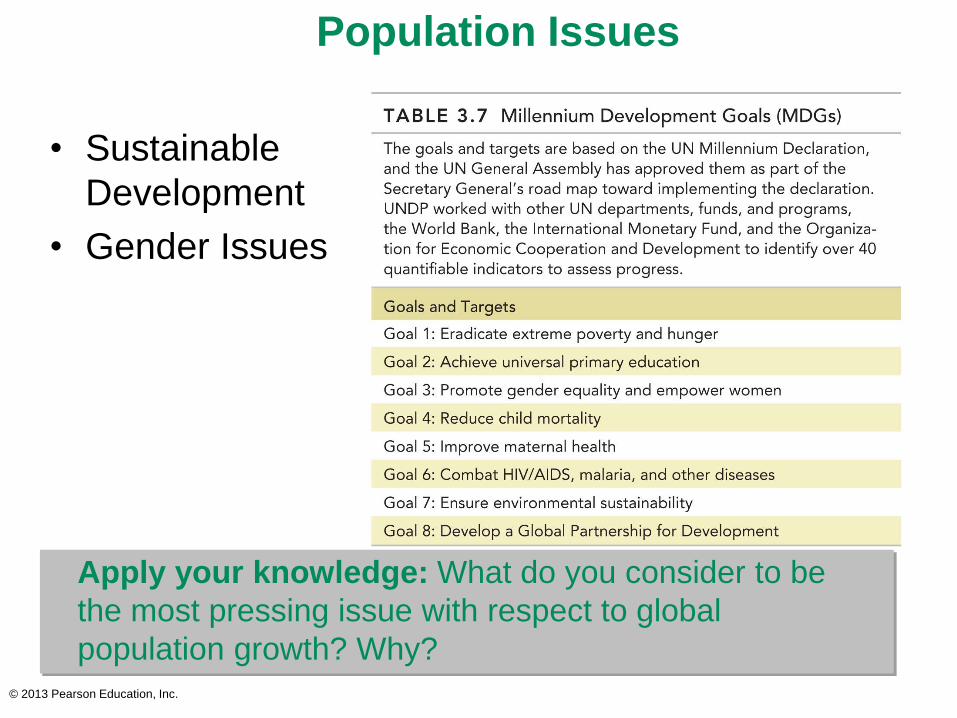
Population Issues
• Sustainable
Development
• Gender Issues
Apply your knowledge: What do you consider to be
the most pressing issue with respect to global
population growth? Why?

Population Issues
• Neoliberalism: Derives from the idea that
government intervention into markets is
inefficient and undesirable, and should be
resisted wherever possible. Popular during
the late twentieth century, structural
adjustment loans were often part of
neoliberalism.
© 2013 Pearson Education, Inc.

© 2013 Pearson Education, Inc.
Future Geographies
• Oct. 31, 2011
population reached
7 billion
• Projected to
increase
– 9.3 billion by 2050
– Core vs. periphery
growth
• What will happen in
the future?
– How will urban
systems keep up?
Figure 3.31 Shanghai, China: one of
the world's largest cities at 14 million

© 2013 Pearson Education, Inc.
End of Chapter 3