Embed Size (px)
Citation preview
Page 1 of 17 ver. 1.6
Human Genetics
Human genetic traits are difficult to study because of the relatively long life span and the limited number of human offspring. In addition, the number of chromosome pairs (23) increases the possible number of genetic combinations. It is possible, however, to take a sample from human populations to estimate the frequency of a trait and the possible ways a given trait is inherited.
Objectives: • Investigate the inheritance of some human traits. • Estimate the frequency of selected traits in a given population. • Estimate the genetic probability of the occurrence of representative traits.
Materials: PTC papers (phenylthiocarbamide), Sodium Benzoate papers, Thiourea papers Forceps Colored Pencils Two Coins (to flip) Trait sketches and photos provided in lab
Methods: Part I. Geneticists probably know more about blood types than any other inherited human trait. In the "ABO" blood group system the presence or absence of A and B antigens (mucopolysaccharides on the cell surface) determines the four basic blood types. For laboratory purposes consider the ABO blood groups to be determined by a single pair of genes expressing codominance. Thus, the genotype of type A blood may be homozygous (I A I A) or heterozygous (I A i). The genotype of type B blood may be homozygous (I B I B ) or heterozygous (I B i). Type O blood must be homozygous (ii). Type AB blood must have both A and B antigens (I A I B ) with both being expressed through codominance.
1. Using the Punnett Square provided on Worksheet I determine the genotypes possible among the offspring of a cross between a heterozygous type A parent and a type AB parent. Use the information provided above, and the results of the Punnett Square, to answer questions 1 through 5 on Worksheet I.
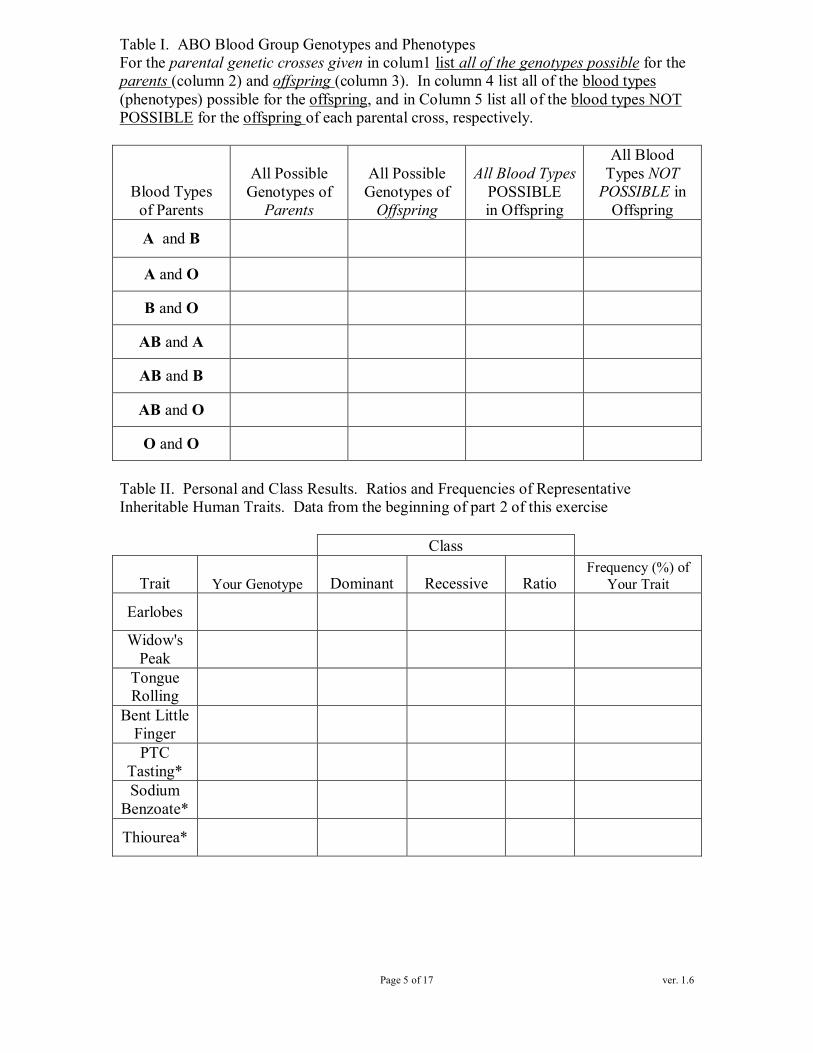
2. The lefthand column of Table 1 (page 42) provides a list of parental crosses based on their respective blood types.
Determine: (1) all of the genotypes possible for the respective pairs of parents (2) all of the genotypes possible for the offspring of the respective pairs of parents (3) all of the blood types (phenotypes) possible for the offspring of the respective pairs of parents, and (4) all of the blood types NOT POSSIBLE for the offspring of the respective pairs of parents. Enter your results in the spaces provided in Table 1.
Part II. An inherited trait is symbolized an assigned letter. Normally the dominant form of a trait is symbolized by an upper case letter (e.g. E), and the recessive form is symbolized as a lower case of the same letter (e.g. e). Read the descriptions of the traits
Page 2 of 17 ver. 1.6
listed below and determine whether you are dominant or recessive for each trait. Record the letter for each of your traits in the space provided in Table II. Use only a single letter since you don't know whether you are homozygous or heterozygous for each trait. One exception (assuming complete dominance) is if you are recessive for a given trait. In that case you must be homozygous recessive (e.g. ee) for that trait to be expressed.
A. Attached Earlobe: The dominant gene (E) codes for the earlobe to hang free and is found in the majority of people. If a person is homozygous for the recessive trait (ee) the earlobes are attached directly to the side of the head.
B. Widow's Peak: The dominant trait (W) is where the forehead hairline drops down and forms a distinct point. This is known as a Widow's Peak. The recessive trait (ww) is expressed as the absence of the downward point.
C. Tongue Rolling: The dominant gene (R) allows a person to roll their tongue into a "U" shape when extended out of the mouth. With the nonroller recessive trait (rr) a person only produce a slight downward curve of the tongue.
D. Bent Little Finger: A dominant gene (B) causes the last joint of the little finger to bend in toward the fourth finger. Lay both hands on the table, relax the muscles, and note whether you have bent or straight little fingers. With the recessive trait (bb) the little fingers are somewhat straight.
E. PTC Tasting: Place a piece of PTC containing paper under your tongue. The dominant trait (T) allows one to taste the chemical on the paper. Individuals expressing the recessive trait (tt) will detect no obvious taste.
F. Mouth Shape: The dominant trait (M) is expressed as a mouth that is relatively long across the face. The recessive trait (mm) is expressed as a mouth that is relatively short across the face, or appears relatively small.
Once the class has collected all their results the instructor will compile the data for the entire class. Record the class data in the appropriate spaces in Table II (page 43).
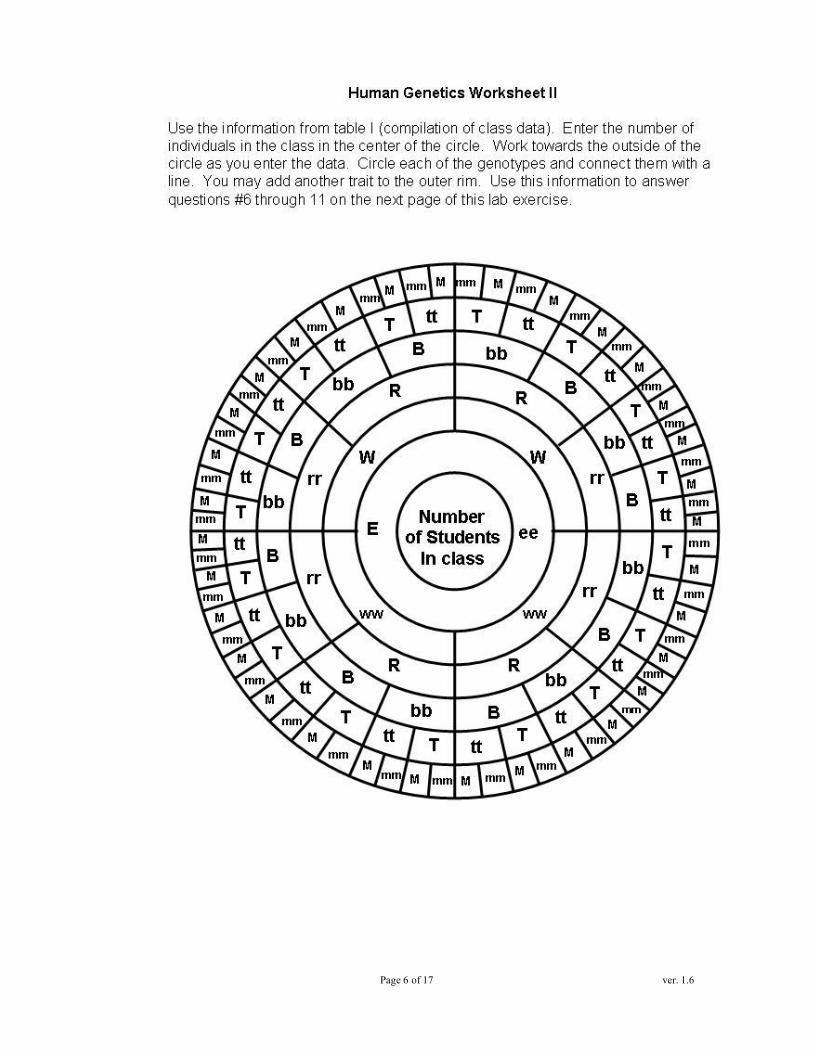
Genetic Circle/ Worksheet 2 (page 44) 1. The Genetic Circle permits you to visualize how human traits vary. In the center of
the circle enter the number of individuals in your class. 2. Start from the middle of the circle, and using the data from Table II, work toward the
outside circling your genotype in each of the respective spaces. 3. Connect the circled spaces with a line. 4. Use the information from the Genetic Circle to answer questions number 6 through
10 (page 45).
Part III: Performing hypothetical genetic crosses by flipping coins to represent random combinations of the traits presented in Figure I. Flipping two coins at a time, each coin represents the gametes possible from either the mother or the father. Heads represents a Dominant gene contributed to the respective trait of the offspring, and Tails represents a Recessive gene contributed to the trait of the offspring. Proceed making the genetic crosses as follows: 1. Choose a trait from Figure I (pp. 4755). 2. Select two people, one to represent one parent, the second the other parent. 3. Each person flips a coin to symbolize a genetic cross for the trait chosen. However
the coin lands determines the gene contributed by the respective parent (Heads = Dominant, Tails = Recessive)

Page 3 of 17 ver. 1.6
4. The pair of genes determined by the coin toss represents the genotype for that trait in the offspring (viz. Heads:Heads = homozygous dominant, Heads:tails =heterozygous, or tails:tails = homozygous recessive).
5. Record the offspring genotype and phenotype for the respective trait in Table III (p. 49).
6. Repeat steps 1 through 5 for all of the traits presented in Figure I.
Using the phenotypes from the hypothetical genetic cross made above draw a sketch of the resulting offspring. Use the space below and colored pencils provided to draw the resulting offspring.
Page 4 of 17 ver. 1.6
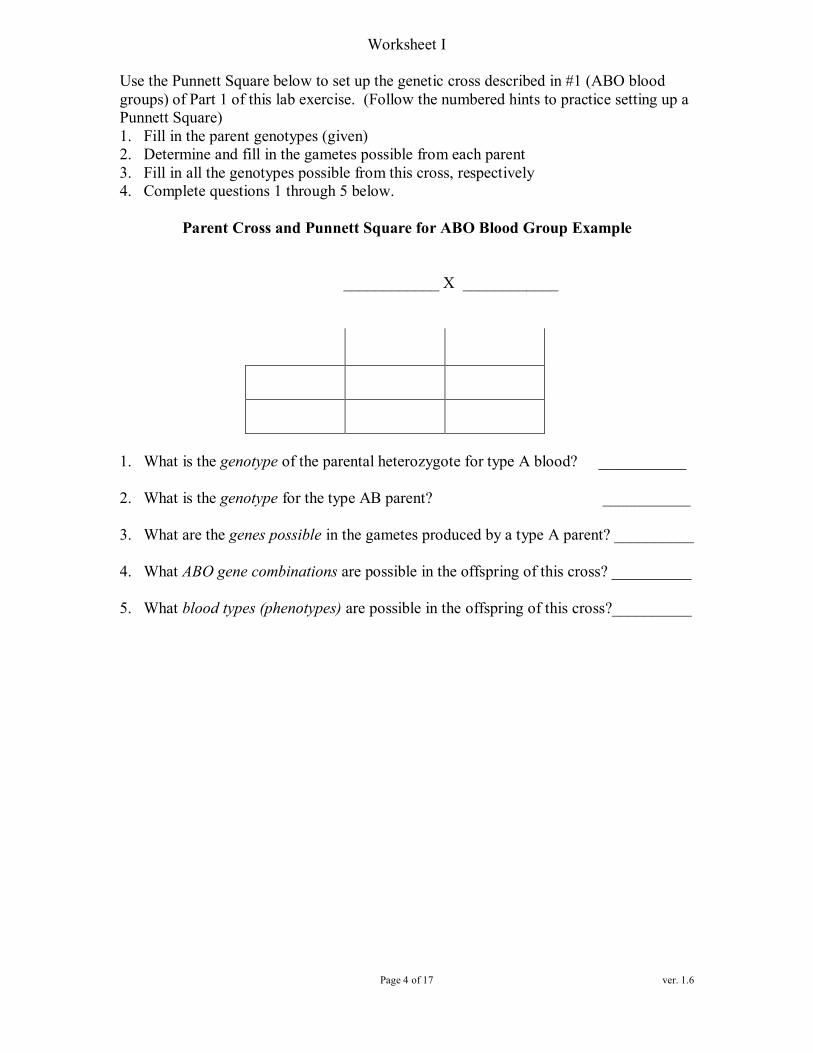
Worksheet I
Use the Punnett Square below to set up the genetic cross described in #1 (ABO blood groups) of Part 1 of this lab exercise. (Follow the numbered hints to practice setting up a Punnett Square) 1. Fill in the parent genotypes (given) 2. Determine and fill in the gametes possible from each parent 3. Fill in all the genotypes possible from this cross, respectively 4. Complete questions 1 through 5 below.
Parent Cross and Punnett Square for ABO Blood Group Example
____________ X ____________
1. What is the genotype of the parental heterozygote for type A blood? ___________
2. What is the genotype for the type AB parent? ___________
3. What are the genes possible in the gametes produced by a type A parent? __________
4. What ABO gene combinations are possible in the offspring of this cross? __________
5. What blood types (phenotypes) are possible in the offspring of this cross?__________
Page 5 of 17 ver. 1.6
Table I. ABO Blood Group Genotypes and Phenotypes For the parental genetic crosses given in colum1 list all of the genotypes possible for the parents (column 2) and offspring (column 3). In column 4 list all of the blood types (phenotypes) possible for the offspring, and in Column 5 list all of the blood types NOT POSSIBLE for the offspring of each parental cross, respectively.
Blood Types of Parents
All Possible Genotypes of Parents
All Possible Genotypes of Offspring
All Blood Types POSSIBLE in Offspring
All Blood Types NOT POSSIBLE in Offspring
A and B
A and O
B and O
AB and A
AB and B
AB and O
O and O
Table II. Personal and Class Results. Ratios and Frequencies of Representative Inheritable Human Traits. Data from the beginning of part 2 of this exercise
Class
Trait Your Genotype Dominant Recessive Ratio Frequency (%) of
Your Trait
Earlobes
Widow's Peak Tongue Rolling
Bent Little Finger PTC
Tasting* Sodium
Benzoate*
Thiourea*
Page 6 of 17 ver. 1.6
Page 7 of 17 ver. 1.6
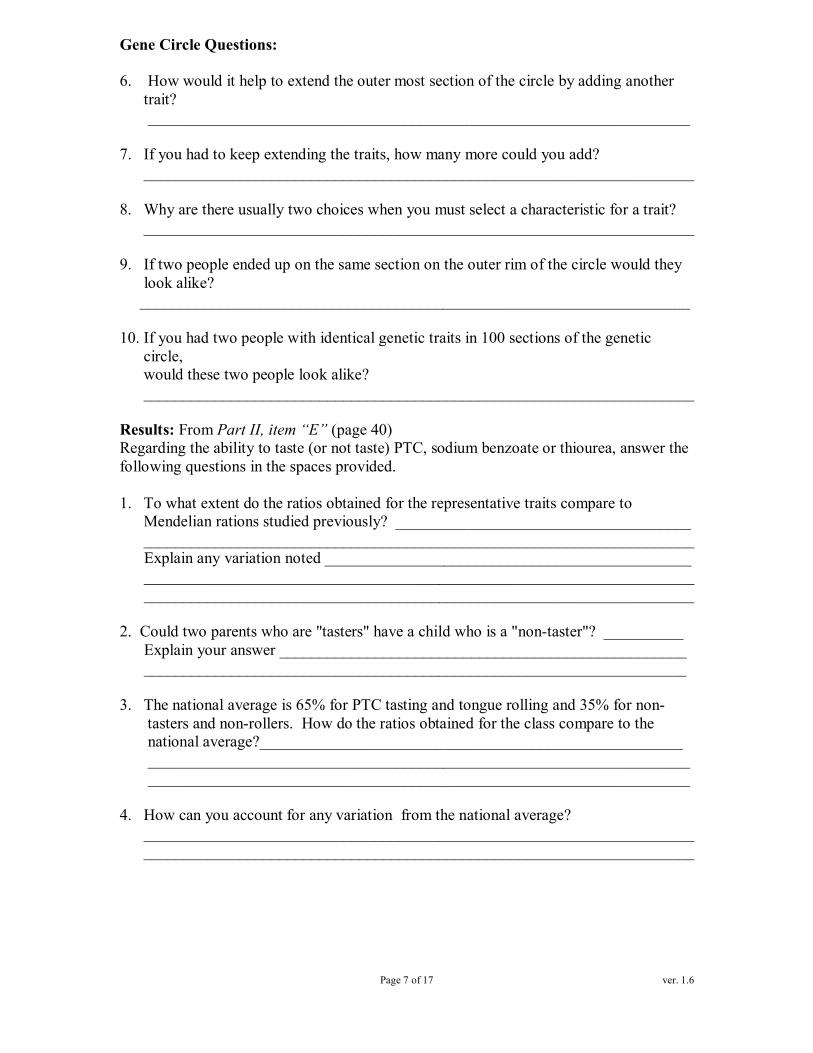
Gene Circle Questions:
6. How would it help to extend the outer most section of the circle by adding another trait? ____________________________________________________________________
7. If you had to keep extending the traits, how many more could you add? _____________________________________________________________________
8. Why are there usually two choices when you must select a characteristic for a trait? _____________________________________________________________________
9. If two people ended up on the same section on the outer rim of the circle would they look alike? _____________________________________________________________________
10. If you had two people with identical genetic traits in 100 sections of the genetic circle, would these two people look alike? _____________________________________________________________________
Results: From Part II, item “E” (page 40) Regarding the ability to taste (or not taste) PTC, sodium benzoate or thiourea, answer the following questions in the spaces provided.
1. To what extent do the ratios obtained for the representative traits compare to Mendelian rations studied previously? _____________________________________ _____________________________________________________________________ Explain any variation noted ______________________________________________ _____________________________________________________________________ _____________________________________________________________________
2. Could two parents who are "tasters" have a child who is a "nontaster"? __________ Explain your answer ___________________________________________________ ____________________________________________________________________
3. The national average is 65% for PTC tasting and tongue rolling and 35% for non tasters and nonrollers. How do the ratios obtained for the class compare to the national average?_____________________________________________________ ____________________________________________________________________ ____________________________________________________________________
4. How can you account for any variation from the national average? _____________________________________________________________________ _____________________________________________________________________

Page 8 of 17 ver. 1.6

Page 9 of 17 ver. 1.6
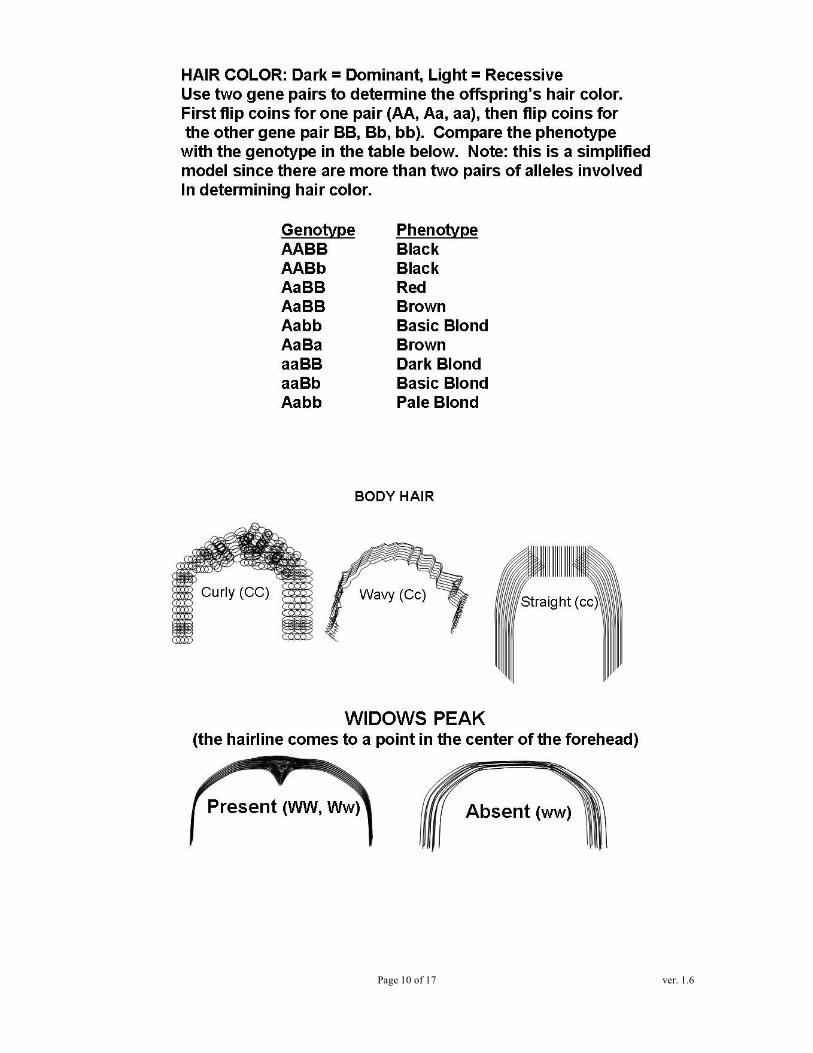
Page 10 of 17 ver. 1.6
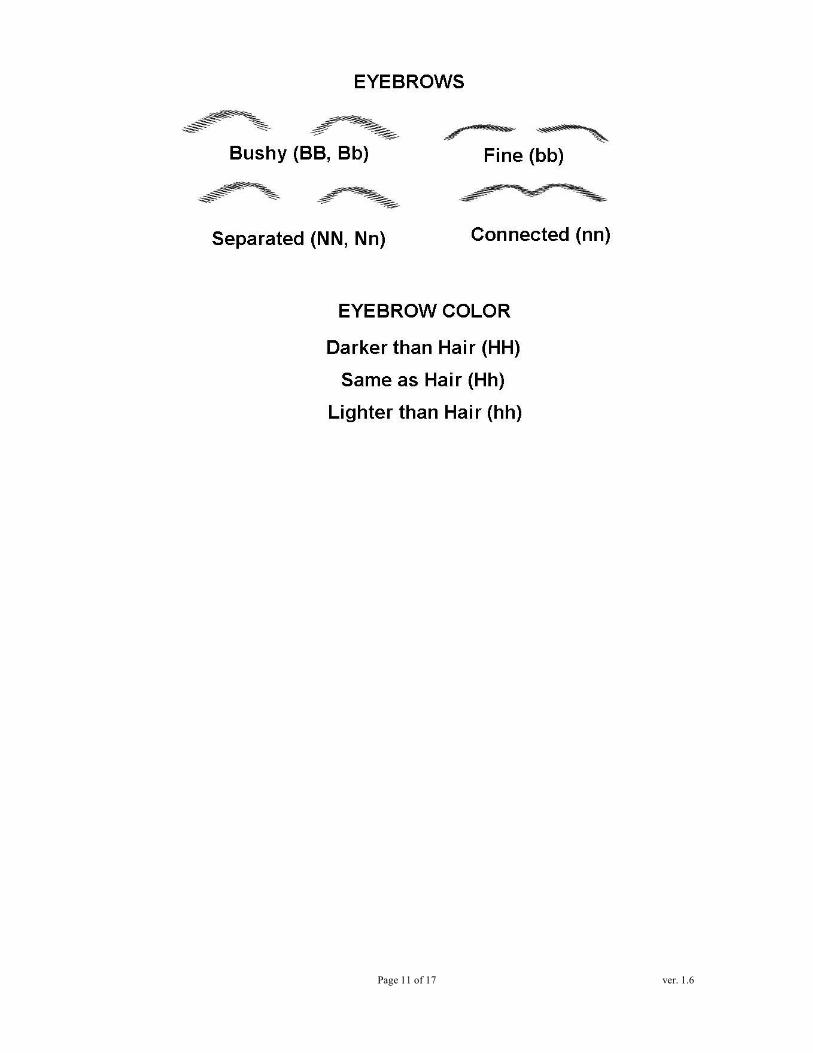
Page 11 of 17 ver. 1.6
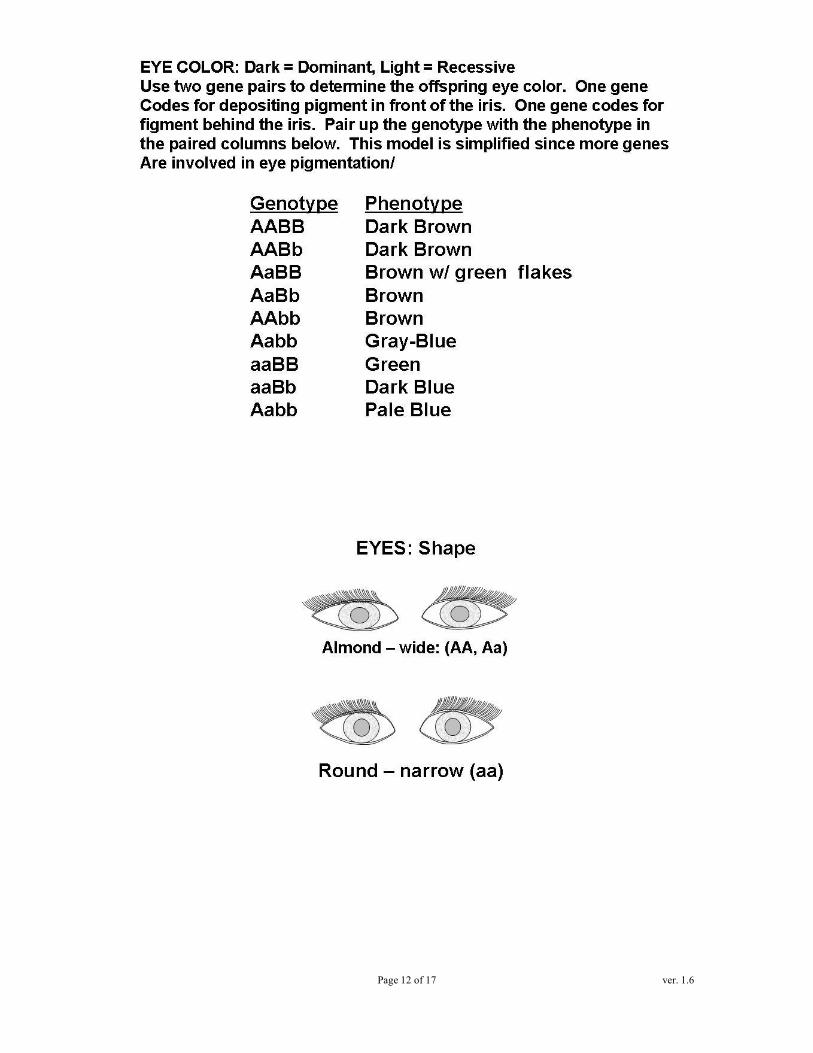
Page 12 of 17 ver. 1.6
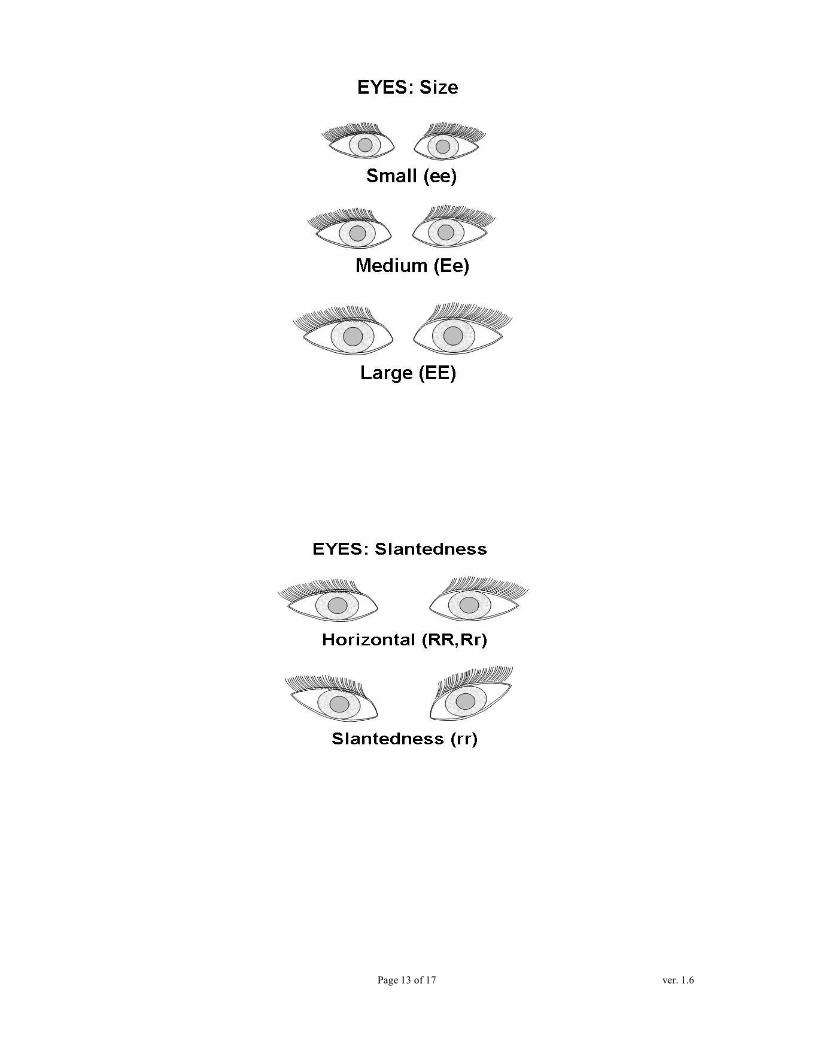
Page 13 of 17 ver. 1.6

Page 14 of 17 ver. 1.6

Page 15 of 17 ver. 1.6
Page 16 of 17 ver. 1.6

Page 17 of 17 ver. 1.6
Table III. Hypothetical Genetic Crosses. Record the genotypes resulting from the coin flips ("random selection") performed as described in Part 3 above. Based on the genotypes acquired for the "Mother" and the "Father", determine the genotype and phenotype of the offspring for each of the traits listed.
Parent 1 Parent 2 Child
Trait Father's Genes Mother's Genes Offspring
Genotype Offspring Phenotype
Sex
Ears
Face Shape
Chin Shape (a)
Chin Shape (b)
Cleft Chin
Hair Body
Widow's Peak
Hair Color
Eyebrows (a)
Eyebrows (b)
Eyebrow Color
Eye Distance
Eye Size
Eye Shape
Eye Slantedness
Eye Color
Eyelashes
Mouth Size
Lip Size
Hapsburg Lip
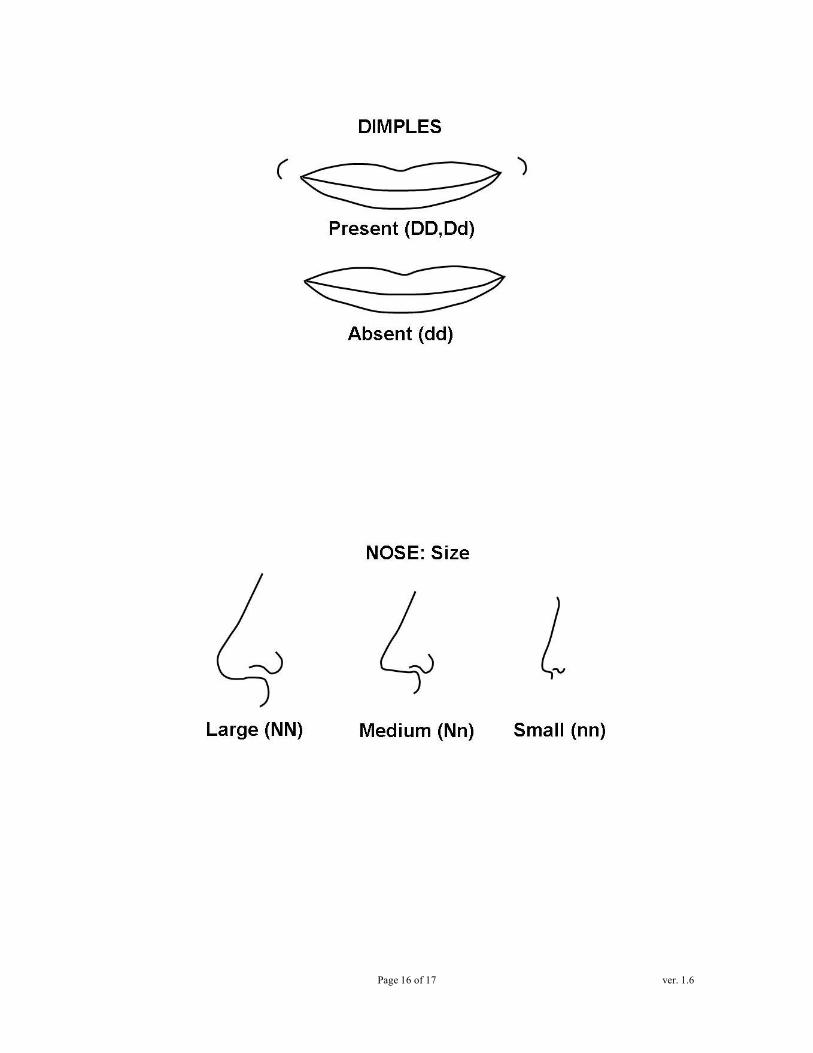
Dimples
Nose Size