Embed Size (px)
Citation preview
1
Human Development as a Universal Theory of Social Change:
Cross-Level- and Cross-Cultural Evidence from 63 Societies
Christian Welzel, Ronald Inglehart and Hans-Dieter Klingemann
ABSTRACT
In this paper we introduce the concept of ‘Human Development’ as a general theory of social
change. We argue that growth of human choice, or Human Development (HD), is the general
principle that unifies three major trends of social change, namely economic modernization,
expressive value change, and democratization. From the human development perspective these
are three subprocesses within one overarching process of diminishing constraints on human
choice. Modernization (economic HD) reduces physical and cognitive constraints, expressive
value change (ethical HD) reduces motivational or ethical constraints, and democratization
(institutional HD) reduces formal or normative constraints. We show overwhelmingly strong
evidence from 63 societies of the World Values Surveys that (1) these processes originate in the
mechanism of “aspiration adjustment” on the individual level, (2) that social interaction
reinforces dramatically the relation between these processes on the cross-national level, (3) that
these relations operate primarily through a sequence from economic to ethical to institutional HD,
(4) that this sequence shows cross-cultural validity, and (5) that this sequence holds against rival
influences, in particular the transnational diffusion of changes in historically connected societies.
2
INTRODUCTION
Contemporary social sciences have assembled an immense body of knowledge on three major
trends of social change, which are described as modernization in the economic sphere, as a shift
towards liberal and self-expressive values in the cultural sphere, and as move from autocratic to
democratic rules in the institutional sphere. However, in terms of a general theory of social
change, there is little clarity on the interrelation between these processes. This lack of theoretical
insight derives from a widespread disinterest in the search of the underlying dimension of these
processes. The proportion of scientists dealing with modernization, value change, or
democratization on a comparative level declines with each higher level of theoretical abstraction.
On the lowest level of abstraction, the empirical description of one of these processes, the number
of scientists is difficult to assess. On the second level of abstraction, the empirical relations
between two of these processes, the body of literature is still very large but becomes calculable.
There are many empirical studies dealing comparatively (1) with the relation between
modernization and democratic institutions (e.g. Lipset 1959, Burkhart/Lewis-Beck 1994,
Przeworski/Limongi 1997, Vanhanen 1997), (2) with modernization and value change (e.g.
Almond/Verba 1963, Inkeles/Smith 1974, Inglehart 1990, Fukuyama 1995), and (3) with value
change and democratic institutions (e.g. North 1981, Putnam 1993, Landes 1998). On the third
level of abstraction, the interrelation between all three of these processes, the number of
comparative studies does not amount to even a dozen (Dahl 1973, Huntington 1991,
Muller/Seligson 1994, Inglehart 1997). Finally, on the highest level of abstraction, there is not a
single empirical study, as far as we know, which deduces the interrelation of these processes from
its underlying dimension.
3
Having no clear conception of the underlying dimension from which modernization, value
change and democratization emerge is theoretically and empirically consequential. Without such
a conception one cannot understand these processes as partial functions within the whole process
of social change. Hence, the common origin from which one could deduce the causal relations
between the partial processes remains a black box. This problem accounts for further deficiencies.
First, claims for causal relations between modernization, value change and democratization
remain strictly within the logic of bivariate relations. For instance, reasons are given for why
modernization is associated with value change, and value change with democratization, but not
why all three of these processes are connected with each other. Second, there is extreme
confusion of the existence of dominant causal directions in the relation of these processes. Is
democracy, for example, conducive to value change or value change to democracy? The literature
presents arguments for each logically possible direction in the relation between modernization,
value change and democracy. Third, though these are relations at the aggregate level, reasons why
they exist are often derived from assumptions of the behavior of individuals, but either without
making these assumptions explicit or without making plausible how exactly relations on the
individual level turn over to the aggregate level of whole nations.
In the next section we demonstrate these deficiencies by a closer look at the relevant
literature. After that we introduce the concept of Human Development (HD) as a solution of these
problems. In particular we argue that HD, or the growth of human choice, is the common origin
from which modernization, value change and democratization emerge. Viewing these processes
from their common origin allows us to determine each processe’s partial function. And knowing
their partial functions enables us to deduce straightforward hypotheses on the major causal
direction in the relation between modernization, value change and democratization. In the third
4
section we present strong evidence that the (1) the HD-relations have a micrological basis on the
individual level, (2) that social interaction reinforces the HD-relations on the aggregate level, (3)
that the HD-relations hold across cultures and (4) against rival influences, such as those from
transnational diffusion of aggregate levels in HD-elements.
1. THEORY
1.1 The Puzzle of the Interrelations between Modernization, Value Change
and Democratization
Researchers concerned with long-term patterns of change in human societies have identified
modernization, value change and democratization as the three major trends in different spheres of
society. The most fundamental of these processes is modernization in the socio-economic sphere.
Modernization in this sense represents a syndrome of interrelated changes including
industrialization, urbanization, growing prosperity, the expansion of education and
communication, and increasing occupational diversification (Lerner 1958, Rustow 1963; Chirot
1986, Bell 1973, Barro 1997, Landes 1998, Hughes 1999). The second subprocess is located in
the field of culture, consisting of human beliefs and values. The key changes in this field are
described as increasing tolerance, interpersonal trust, subjective well-being, and political
moderation, as well as the rise of more self-determined forms of participation and increasingly
liberal values among mass publics (Almond/Verba 1963, Inkeles/Smith 1974, Inglehart 1977,
1990, 1997, Brint 1984, Dalton 1996, Nevitte 1996). As shown by Inglehart (1997), these
complex attitudinal changes converge in the broader dimension of self-expressive values. We will
refer to it as a shift from self-protective or -restrictive values to self-expressive values, or simply
expressive value change. The third major component of change lies in the field of political
institutions. Here the most notable development during the past two decades has been the rise and
5
spread of democratic institutions through the “Third Wave” of democratization, as Huntington
terms it (Huntington 1991, Diamond 1993, Gurr/Jaggers 1995, Vanhanen 1997). The trend
towards more democracy is not only evident among former autocracies but also within
established democracies insofar as they tend to widen citizen’s opportunities to influence public
decisions. This trend goes in the direction toward more direct democracy (Budge 1996, Scarrow
1999).
Certain as these trends might be, their causal relations are extremely controversial. Indeed,
each logical possibility finds support from both theoretical rationales and empirical evidence. One
of the most widely discussed hypotheses in empirical political science is the claim that economic
development causes democracy (Lipset 1959, Coleman 1960, Cutright 1963, Russett 1965,
Bollen/Jackman 1985, Lipset/Seong/Torres 1991, Burkhart/Lewis-Beck 1994, Barro 1997,
Przeworski/Limongi 1997, Gasiorowski/Power 1998). But the opposite claim has also been made:
democratic institutions favor economic development (North 1981, Hirschman, Ersson/Lane 1996,
Leblang 1997, Yi Feng 1997, Tilly 1997, Sen 1997, Frey/Al-Roumi 1999). Moreover, some
observers argue that economic development leads to value changes (Inkeles/Smith 1974, Inglehart
1990, 1997), while others, following the tradition of Weber’s Protestant Ethic thesis, emphasize
the role of culture in economic development (Putnam 1993, Fukuyama 1995,
Granato/Inglehart/Leblang 1996, Landes 1998). The two claims are not incompatible, of course:
Inglehart, for example, argues that high levels of prosperity give rise to value changes that
eventually shift a society’s goals away from maximal exploitation of nature, leading to more
“sustainable development.” Finally, while some analysts suggest that democracy causes value
change (Rustow 1970, Barry 1973, Schmitter/Karl 1991, Muller/Seligson 1994, Rohrschneider
6
1995; Jackman 1999), others emphasize the opposite flow of causation (Inglehart 1997, Dalton
1996).
Each of these possibilities can be supported by theoretically plausible reasons and empirical
evidence. One can plausibly argue that economic development should favor democracy, because
more widespread economic resources empower mass publics to carry through with their demand
for free and equal participation in the making of public policies (Vanhanen 1997). On the other
hand, the claim that democracy promotes economic development seems also plausible, since the
freedom rights connected with democracy allow citizens to unfold their creative potential,
including commercial engagement, and because democracy urges governments to be responsive
to the people’s demand for rising prosperity (North 1981, Landes 1998). In this context, Sen
(1999) has shown that less developed democracies, such as India, never experienced such
desastrous famines as they regularly occured in less developed autocracies like China. In line with
this finding, other authors demonstrate that democracies tend to be more successful in rising the
physical quality of life of their citizens (Diamond 1992, Lane/Ersson 1996, Frey/Al-Roumi 1999).
Empirically, there is unambiguous evidence of a close correlation between economic
development and levels of democratization, which could be taken to support either or both
interpretations. But both interpretations have to deal with striking deviant cases. On one hand, the
existence of a relatively democratic but poor India seems to contradict the thesis that democracy
generates economic development; while the existence of the rich but autocratic Persian Gulf
states and Singapore seem to contradict the thesis that economic development automatically
generates democracy.1
1 But against the counter-factual indication given by the Gulf-states one can argue that
economic growth that derives from the exploitation of natural resources (instead of
7
Another and even more controversial debate concerns the relation between value change
and democratization. One group of authors (Almond/Verba 1963; Eckstein 1966; Putnam 1993;
Inglehart 1997) argues that value change towards pro-democratic attitudes must occur first before
democratic institutions gain stability. Against this claim another camp of scholars postulates that
democratic institutions must be in place first before a pro-democratic political culture can evolve.
These authors argue that pro-democratic attitudes can only emerge through “habituation” or
“instituional learning” from the practical use of democratic institutions (Rustow 1970, Barry
1973, Schmitter/Karl 1991, Muller/Seligson 1994, Rohrschneider 1995, Jackman 1999). Thus,
there is a contradiction between the claim that a pro-democratic culture creates stable democratic
institutions and the opposite claim that long-lasting democratic institutions produce a pro-
democratic culture.
1.2 Revisiting the Debate from the Perspective of Human Development
The debate so far is characterized by an under-specification of the common dimension in which
modernization, value change and democratization converge. All scholars argue within the logic of
bivariate relations, rather than deducing their causal hypotheses from a more general logic of
social change. But we need to understand this overall logic in order to deduce from it the partial
processes’ specific function in social change as a whole.
investments in human capital) is not conducive to democracy (Barro 1997). A historical
example is Spain who, at the time of early colonialism, became the richest European nation
because of the state-managed exploitation of Latin American silver. In contrast to Holland
and England whose colonial prosperity derived from private commerce, Spain and Portugal
did not develop liberal institutions (Landes 1998).
8
We propose the growth of human choice in society, or Human Development (HD), as the
general principle which links all three processes. Following Sen HD can be understood as the
development of human beings’ capabilities and opportunities to base their lives on free choice. In
this sense HD can take place on different levels. First, it can take place on the level of the
biological human potential, where HD means the evolution of human beings’ genetical capacities
to make free choice. The major process in biological HD is the evolution of the human brain.
With each step in the long-lasting evolution of the neocortex, human beings’ cognitive capacities
to conceptualize options and to make choices between them grew (Birch/Cobb 1986). Second,
HD occurs on the level of personal actualization of the genetical potential. Different persons have
different achievement motivations and thus make different use of their potential. These
differences may be characterized as personal HD (Inkeles/Diamond 1980). And third HD can
take place on the level of the societal opportunity structure, where HD means large-scale
contextual conditions which determine human beings’ chances to actualize their personal
potential. This is how we define societal HD.
Clearly a social theory of HD can only start from the third level. It is evident that different
human beings have different personal talents and potentials but the ranges of those differences are
similar in each human community (Birch/Cobb 1986, Cavalli-Sforza 1996). Human communities
show neither a difference in biological HD nor on the ranges in which their human beings differ
in personal HD (Diamond 1997). But communities show dramatic differences in the opportunity
structure that they offer human beings to unfold their potentials. This opportunity structure is the
topic of a social theory of HD. From the perspective of societal HD we can reconceptualize
modernization, expressive value change and democratization as partial functions in the growth of
9
human choice in society. Each of these processes reduces one specific constraint on human
choice.
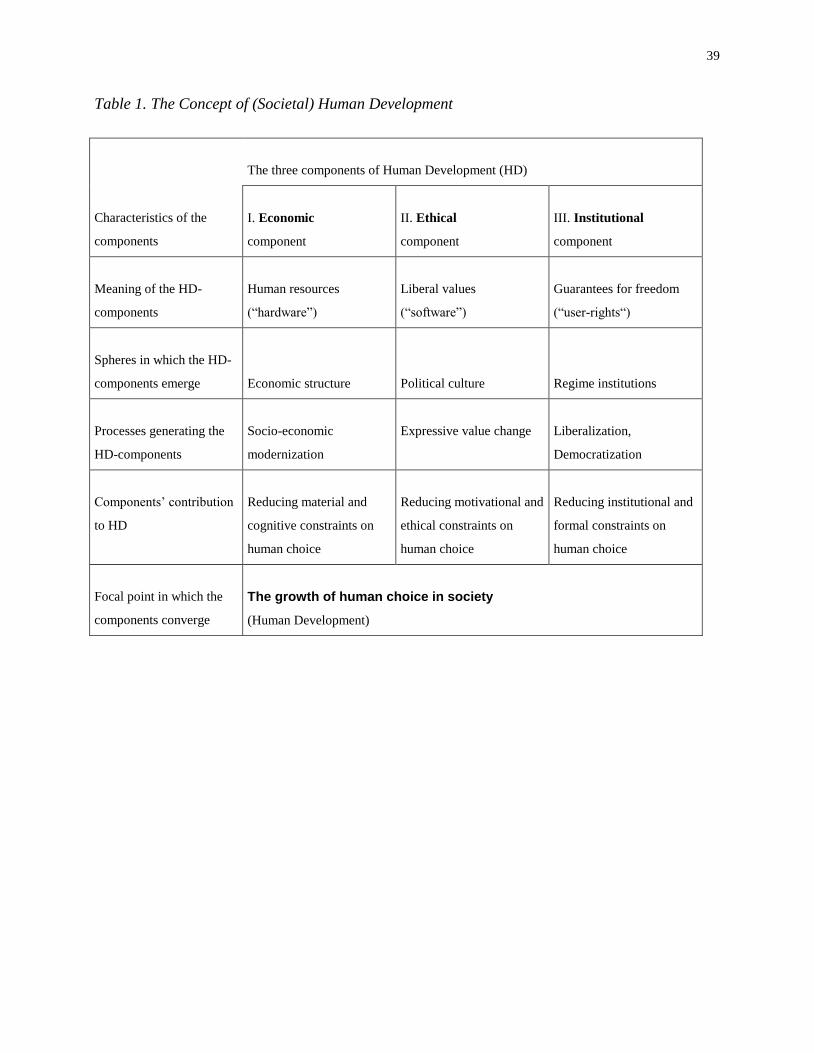
Modernization, or economic HD, reduces constraints on the level of objective means by
enlarging peoples’ physical and cognitive resources. Value change, or ethical HD, reduces
constraints on the level of subjective aspirations by intensifying human strive for self-expression.
And democratization, or institutional HD, reduces constraints on the level of formal rules by
granting citizens with ”negative” and ”positive” freedom rights (see Table 1 for a summary of our
concept).
Table 1 (about here)
Economic resources, expressive values, and freedom rights improve the societal
opportunity structure in favor of human choice. This is most obvious in case of freedom rights
because they are defined on the societal, not the individual, level. But the same is true for
economic resources and expressive values. Though different individuals within the same society
dispose of these HD-elements in different degrees, aggregate measures should not be considered
as an accumulation of genuine individual characteristics. Also reversely aggregate levels of
resources and values indicate the opportunity structure with which people are confronted when
they grow into a given society. People who are born into an affluent and expressive society have
better chances to become rich and to develop an expressive orientation themselves than people
who grow up in a poor and protective society.
Economic, ethical, and institutional HD do not only share the theoretical focus of growing
human choice. Empirically, too, they tend to correspond to each other, either on low, middle or
high levels, with societies which are far or less advanced in one of the HD-elements also being far
or less advanced in the other HD-elements. The question, however, is how this correspondence is
10
generated. A universal theory of social change must locate the mechanism of correspondence in
the individual. Otherwise this theory would only be a single-level theory lacking an
anthropological or behavioral basis. But a theory that deserves the attribute of a social theory
must also offer an explanation on how the mechanism of correspondence is transferred from the
individual to the societal level.
We argue that the basic mechanism of correspondence on the individual level is aspiration
adjustment, which implies that human beings tend to adjust their subjective aspirations to their
objective means. If opportunities increase on the level of objective means by the process of
resource mobilization, human beings tend to rise their subjective aspirations, giving more
emphasis on individual self-expression. Human motivation is led in general by the strive for self-
expression or growing choice. This evident from the World Values Surveys, since these data
show that individuals‘ life satisfaction depends significantly on their feeling of having free choice
in their lives. The average Pearson correlation between life satisfaction and the feeling of free
choice points to .37 over 118 national surveys (significant at the .0001-level in most surveys),
with a standard error of the mean correlation of only .008 (the lowest correlation being .09 and
.61 the largest). However, human beings tend to adjust the priority on self-expression to the
margin given by their objective means (Maslow 1954, McCarthy/Zonderman/McRae 1996,
Birch/Cobb 1986, Sirgy 1996, Hagerty 1999). Therefore, we will see from the World Values
Surveys that people with higher education and higher incomes (i.e., greater physical and cognitive
resources) put stronger emphasis on self-expression. These people have greater means to unfold
their potential which makes it perfectly rational that they put stronger emphasis on self-
expression. This is the micrological origin of the relation between resource mobilization and
expressive values. In addition, there is a micrological origin of the relation between expressive
11
values and democratic institutions. When people gain an increasingly self-expressive orientation
it becomes perfectly rational that they support democracy, since democracy is the regime that
enlarges their formal opportunities for self-expression. Exactly for this reason we will see that
people tend to be the more supportive of democracy the stronger they emphasize expressive
values.
However, as we will show, these relations are much more pronounced on the societal than
on the individual level. The relation between resource mobilization and expressive values shows
a .20 correlation on the individual level but a .80 correlation on the societal level. Similarly, the
correlation between expressive values and democratic institutions points to a .20 correlation on
the individual level but to a .90 correlation on the societal level. These differences indicate that
the HD-relations become dramatically strengthened when transmitted from the individual to the
aggregate level. Logically this must have to do with the aggregation process itself. We explain the
enforcement-effect of aggregation by a mechanism of social interaction. Resource-rich people in
each society have a significant tendency to expressive values, but when a society comprises many
resource-rich people who are interrelated they reinforce each other in their expressive tendency,
thus rising the national expressive tendency on the mass-level. Depending on the proportion of
resource-reich people the enforcement-effect of social interaction is weak or strong. Therefore,
social interaction increases the cross-national variation in mass tendencies. So the few rich people
in poor societies (such as Nigeria) have substantially lower expressive tendencies than the few
poor people in prosperous societies (such as Germany). The difference in expressiveness between
the few rich people in poor societies and the few poor people in rich societies is much larger than
the corresponding difference between rich and poor people within the same society. Similarly, the
difference in democratic support between more and less expressive individuals within the same
12
society is much lower than the corresponding difference between the few highly-expressive
people in low-expressive societies (such as Russia) and the few low-expressive people in highly-
expressive societies (such as Sweden). This observation indicates that nations’ central tendency
on the mass-level represent in themselves a contextual impact sui generis, binding individual
variances within the center of gravitiy given by the national mean in expressive values and
support for democracy (note that in each society the mean in expressive values and support for
democracy represents indeed the center of gravity because these attitudes are distributed in
perfectly bell-shaped form around the national mean).
Summing this up, people become increasingly self-expressive if societies mobilize more
resources. And people become increasingly supportive of democracy if the societal shift to self-
expressive values makes democracy the rational choice of regime. It is conceivable that
expressive values contribute reversely to resource mobilization because expressive people show
higher achievement motivation in general and thus also in economic activity. However, people
will not put strong emphasis on self-expression if there is only a narrow margin for self-
expression on the basis of physical and cognitive resources. Similarly, it is conceivable that
people learn to support democracy by practical use of its rules. But in how far people are prepared
to learn the use of democratic rules depends on how far their value orientations let them view
democracy as the preferable regime. Since the behavioral mechanism of aspiration adjustment
works from objective means to subjective aspirations (i.e., from resources to values) rather than
the reverse, the reinforcement of aspiration adjustment through social interaction, too, must
operate in the direction from resource mobilization to expressive values to democratic support.
From the logic of aspiration adjustment on the individual level and from the logic of the
reinforcing transfer of aspiration adjustment to the societal level, it is much more plausible that
13
causation—not only but—primarily moves along the sequence from economic to ethical to
institutional HD. In the next section we will present evidence for our hypotheses from 63
societies of the World Values Surveys.
2. ANALYSES
2.1 Micro-Level Evidence
In our theory political culture, or value orientations, play a central role as the ethical element of
HD linking economic and institutional HD. Because of the importance of value orientations we
need cross-national survey data to test our theory. The broadest available data are the World
Values Surveys (WVS), which comprise 124 national representative surveys conducted in 63
societies between 1981 and 1998 representing more than 75 percent of the world’s population.2
Covering a wide range of cultural traits, economic development levels and ranging from
authoritarian states to long-established democracies, this sample can reasonably be viewed as
representing the universe of states.
Our micro-level hypotheses claim that the relation between resource mobilization and
expressive values on one hand, and the relation between expressive values and democratic
institutions on the other hand, are present on the individual level in each society regardless of its
particular cultural background. We measure individual differences in resource mobilization (with
regard to physical resources) by income and (with regard to cognitive resources) by education.
Variable V217 of the WVS provides a 10-category measure of rising levels of formal educational
2 Ronald Inglehart is the coordinator of the World Values Survey study group. World Values
Surveys I and II are available via the International Consortium for Political Research (study-
no.: 6160) at the University of Michigan, Ann Arbor. World Values Survey III will be
available soon. See the web page of the WVS-study group: “http://wvs.isr.umich.edu.”
14
attainment. Similarly, V227 gives a 10-category measure of rising income decils in a country.
Though educational and income levels are hardly comparable across nations, they can be used to
identify individuals’ different resource levels within societies.
The level of individuals’ expressive orientation is measured by a factor scale based on 10
attitudes summarized by a confirmatory factor analyses. We forced to generate two factors using
varimax rotation and administered the factor analyses using the pooled data of all 124 surveys. As
with Inglehart’s (1997) earlier analyses, we obtain a religios/secular value dimension (which is
not of further interest here) and a protective/expressive value dimension (or survival/self-
expression dimension to use Inglehart’s term) with higher factor scores indicating higher
emphasis on self-expression. Attitudes loading on the protective/expressive dimension are (1)
“liberty aspirations” (.733 net loading) measured by a 6-point scale indicating peoples’ priority
for “protecting freedom of speech,” “having a say in important government decisions,” and
“greater say in job and community”; (2) “spontaneous engagement” (.485 net loading) given
when people reported to have already signed a petition (V118); (3) “tolerance” (.468) measured
on a 10-point scale indicating peoples’ tolerance towards homosexuality (V197); (4) “happiness”
(.472 net loading) measured on a 4-point scale indicating rising feelings of personal happiness
(V65); (5) “interpersonal trust” (.158 net loading) indicated when people reported to generally
trust other citizens (V27).
Support for democracy is measured by an index developed by Klingemann (Klingemann
1999; Hofferbert and Klingemann 1999). The basic idea of this index is to measure “consistent”
support for democracy. This is done by subtracting support of “having a strong leader” (V154)
and “having the army rule” (V156) from support of “having a democratic system” (V157) and
“democracy may have problems but it’s better than any other form of government” (V163). Since
15
the partial indices are based on 4-point ordinal scales this additive combination produces an index
reaching from –8 (no support for democracy) to +8 (strong consistent support for democracy).
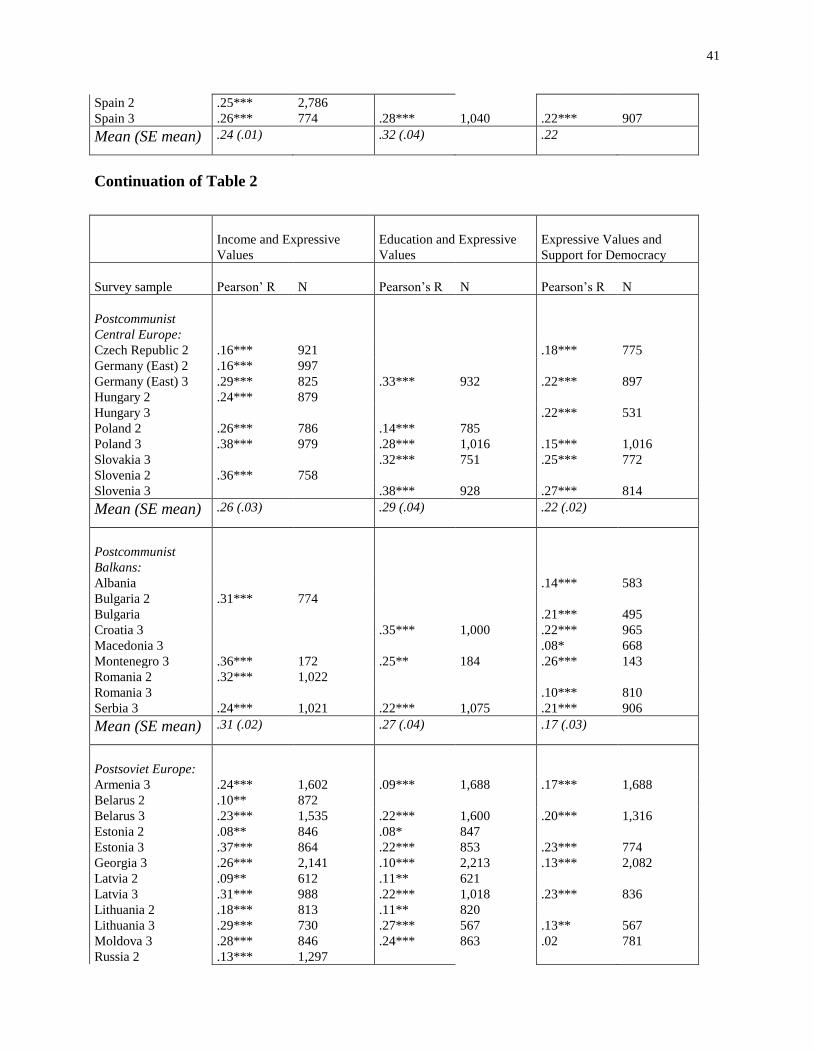
Table 2 (about here)
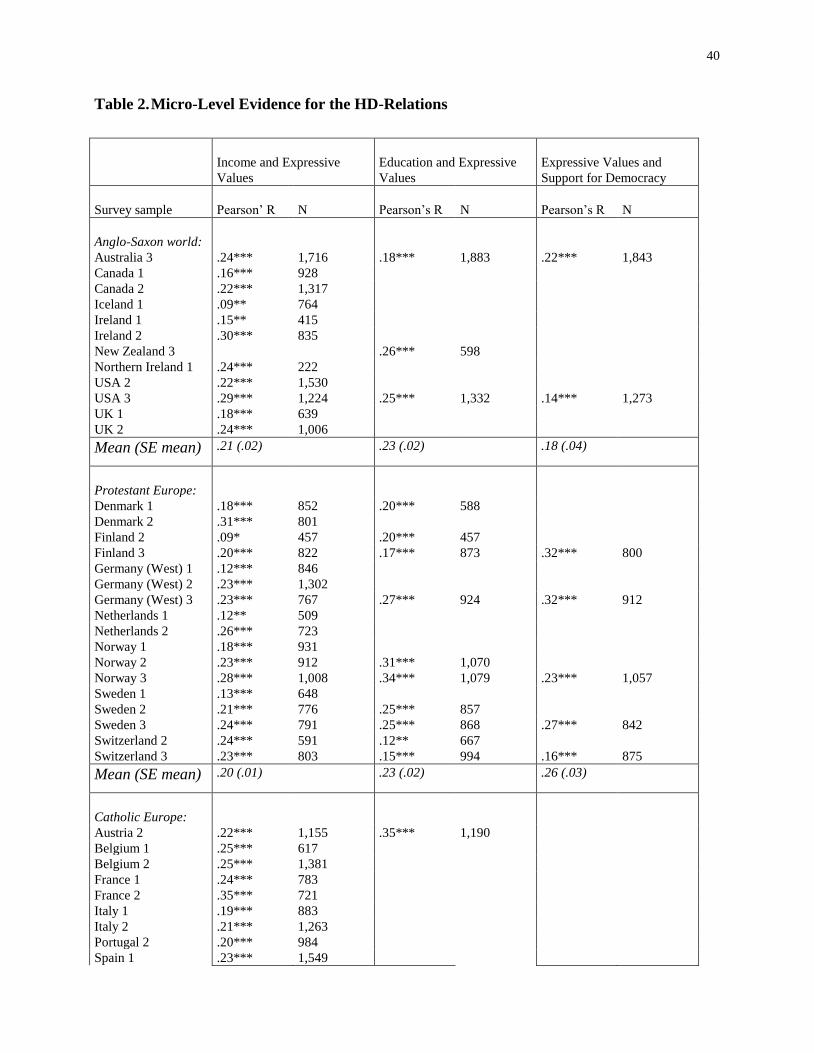
The evidence given in Table 2 is overwhelmingly in favor of our micro-level hypotheses.
For nearly each society for which the relevant variables could be generated we observe a
significantly positive correlation between the variables mentioned above. Considering the relation
between resource mobilization and expressive values, we observe that in 92 out of 94 surveys the
correlation between individuals’ income level and expressive values is significantly positive at
least on the .01-level but in the large majority of surveys on the .0001-level pointing to an average
Pearson correlation of .23. The few exceptions are China II (but not China III) and South Africa I
(but not South Africa II). Similarly in 52 out of 55 surveys, individuals’ expressive values rise
significantly with growing education levels, mostly at the .0001-level with an average Pearson
correlation of .21. The few exceptions here are the Philippines II and Nigeria II and III. It is
important to notice that the strength and significance of correlations does not substantially vary
between nations of different cultural zones of the globe. This can be seen from comparing the
regional averages (calculated only of the basis of significant correlations) with the global average.
The relation between expressive values and democratic institutions, too, appears to have a
micrological origin. In 39 out of 40 surveys there is a significant positive correlation between
individuals’ support for democracy and expressive values, amounting to a .19 Pearson correlation
on average (note that the questions necessary to generate the support for democracy index have
only been asked in the 3rd WVS, primarily in Eastern European and Latin American countries).
In 31 of these surveys the correlation is significant at the .0001-level. In three surveys it is
significant on the .001-level, and in three others on the .01-level, and in only four surveys
16
(Azerbaijan, India, Moldova, Taiwan) the correlation is insignificant with one having the wrong
sign (Azerbaijan).
These findings give undubitable evidence that the HD-relations are generally valid on the
individual level and thus have a micrological origin in practically each society. Though these
correlations are not exceptionally strong, they are at least fairly strong for individual level data.
The most important information to prove that the HD-relations have a micrological origin is not
the magnitude of these correlations but the fact that they are significant and have the expected
sign. Actually we did not expect these correlations to be exceptionally strong on the individual
level because the variance between individuals’ attitudes is bounded in each society within the
national center of gravitiy. Since limited variances in singular attitudes limits the covariance
between them, one should not expect exceptionally strong correlations within nations. But as we
hypothesized, it is another case when looking at the cross-national correlations for the same HD-
relations.
2.2 Macro-Level Evidence
2.2.1 Bivariate Correlations
The measures we use to indicate resource mobilization on the individual level are not comparable
across nations, since nations have different educational systems which makes it difficult to see
similar levels of educational attainment as equivalent for different nations. Moreover, the income
levels in the surveys are given by an individual’s position in income decils of a national sample.
Since nations show extremely different average income levels, the same decil in one nation is not
equivalent with the same decil in another nation. So we should use an objective measure of a
nation’s level of resource mobilization. And we should use a comprehensive measure which
17
combines physical and cognitive resources. Given these premises, we decided to use Vanhanen’s
index of economic resource distribution (Vanhanen 1997).
Vanhanen generates his index from six indicators which he combines additively to three
subindices for the distribution of physical resources (1), the distribution of cognitive reources (2),
and occupational diversification (3). The subindex of physical resource distribution is generated
from indicators for the share of family farms in the agricultural sector (weighted for the
agricultural sector’s share in GDP) and the deconcentration of non-agricultural resources
(measured by 100 minus the share in GDP generated by the state, foreign enterprises and large
national trusts). The subindex of cognitive resource distribution is measured by the number of
students per 100,000 inhabitants and the literacy rate. And the subindex of occupational
diversification is produced from the proportion of the urban population and the percentage of the
non-agricultural work force (for a description of data sources and scaling procedures, see
Vanhanen 1997:42-63). Assuming that the additive subindices represent three different
dimensions of resource distribution, Vanhanen multiplies these subindices to generate his overall
measure of resource distribution. Theoretically this index can range from 0 to 100. We
experimented also with other indices, such as per capita GDP, the Physical Quality of Life Index
and the Human Development Index. But these indices show substantially lower connections with
our aggregate measures of ethical and institutional HD.
On the aggregate level we are less interested in the relation between expressive values and
support for democracy (though this relation is much stronger there than on the individual level
with a .62 Pearson correlation). Instead we are more interested in the direct relationship between
expressive values and democratic institutions (which cannot be measured on the individual level).
Therefore, we need an indicator for the societies’ objective level of democratic institutions.
18
Democratic institutions are relevant for Human Development insofar as they grant citizens
freedom rights. Thus, we need an indicator which measures democracy in its freedom rights
dimension. Given this premise, Vanhanen’s indicator of democracy is not adequate, since this
index measures participation rates and the competitiveness of national elections. The same is true
for the Gurr/Jaggers-index which taps constitutional traits but not freedom rights (Gurr/Jaggers
1995). So from the HD-perspective, the freedom rights measures of Freedom House provide the
most reliable indicators for institutional HD (see Freedom in the World 1996:530-5 for a
description of sampling and scaling procedures). In contrast to many other scholars we do not use
the average of the political and civil rights scores but the product of these scores. This is a crucial
improvement, since a global inspection (Figure 3) of these scores shows that democratization
occured much more in the political rights dimension by introducing free and competitive
elections but substantially less in the civil rights dimension. This implies that many “illiberal” or
merely “electoral” democracies came into being—a fact that we would average out when working
with the mean instead of the product of the two scores.
Figures 1 and 2 show in how far the equivalents of the HD-relations on the individual level
do also exist on the aggregate level of national societies. Figure 1 shows the cross-national
correlation between resource mobilization (RM) measured in 1993 and expressive values (EV)
taken from the third WVS in 1995-98. Figure 2 shows the cross-national correlation between
expressive values and democratic institutions (DI). We used a long term measure of democratic
institutions, since the impact of long-term stable expressive values on democratic institutions
must be most pronounced in the long run. Because the yearly product of the highest possible civil
and political rights scores can generate (7*7=) 49 points at the maximum, the highest possible
level that democratic institutions could have reached over the 27 years from 1972 to 1998
19
amounts to (27*49=) 1,323 points. This level has been reached, for instance, by Switzerland,
Sweden and the US.
As one can clearly see, the equivalents of the individual-level HD-relations are much more
pronounced on the macro-level. While the correlation between resource mobilization and
expressive values points to only .23 (in case of education) or .21 (in case of income) on the
individual level, the corresponding correlation points to .80 on the macro-level (significant at the
.000-level). Similarly, the correlation between expressive values and democratic institutions on
the micro-level points to .19 but to .90 on the macro-level (significant at the .000-level). This is
indicative for the enforcement of individual tendencies on the mass-level, thus transferring the
variation between nations into much larger scales than those observed between individuals within
societies. So we can explain 80% of the variance in nations’ expressive values by the cross-
national variance in resource mobilization. And long-term differences in democratic institutions
can be explained with nearly 90% by cross-national variation in expressive values.
Figures 1 and 2 (about here)
As one can see, the HD-relations are steeply but curvilinearly increasing with varying
slopes along the course of progressing HD. On low levels of resource mobilization, let’s say from
Belarus to Latvia, expressive values rise steeply with additional units of resource mobilization;
while on middle levels of resource mobilization (from Latvia to Argentina), increases in
expressive values are less steep with additional units in resource mobilization; and on high levels
of resource mobilization (from Japan to Norway) expressive values again rise very steeply with
additional units in resource mobilization. Considering the relation between expressive values and
democratic institutions, in the broad middle zone of expressive values (from Bosnia-Herzegovina
to Venezuela) democratic institutions improve very steeply with additional units of expressive
20
values; while on low levels of expressive values (from Russia to Nigeria) as well as on high
levels (from Japan to Sweden) there is no significant improvement of democratic institutions with
additional units of expressive values. As it seems, the increase in expressive values must surpass
a critical threshold (approximately the level of Hungary) to have an effect on democratic
institutions. On very high levels of expressive values, by contrast, there is a marginal
improvement on democratic institutions when approaching the possible maximum level.
2.2.2 Cross-Cultural Validity
We have seen in Table 2 that the HD-relations within societies do not substantially differ for the
cultural zones of these societies. Table 3 documents that the same is true for the macro-level. The
cross-national HD-relations remain on fairly strong and significantly positive levels within each
of the cultural zones covered by the WVS. Obviously, the existence of positively significant HD-
relations is nothing that differs between cultural zones. The existence of these relations is
independent from cultural zones. But by contrast, differences between cultural zones are not
independent from differences in levels of HD. Quite the contrary, cultural differences can be
expressed in varying HD-levels, with cultural zones scoring high or low in resource mobilization
also scoring high or low in expressive values and democratic institutions. Since cultural zones
tend to be homogenous on either low, middle or high levels in each of the three HD-elements, the
explainable variance within cultural zones is lower than the variance between them. This explains
why the correlations become lower when disaggregated from the global level to the regional level
of cultural zones.
Table 3 (about here)
Though the HD-relations tend to be a little bit lower in the postcommunist zone, also here
they are on a fairly high level pointing to Pearson correlations between .44 and .52. The lower but
21
still fairly high level of these correlations in the postcommunist zone reflects that communism
was a historical formation that, by political means, disturbed the HD-relations. But communism
did not destroy the HD-relations. Even among these countries expressive values emerged in
proportion to resource mobilization and gave rise to democratic institutions when the
international opportunity occured at the end of the 1980s. Communism failed because it disturbed
but could not destroy the HD-relations. But the question of causal directionality requires more
intense investigation.
2.2.3 Causal Relations
The close correlations between all three of the HD-elements suggest that they indeed tap a
common underlying dimension, that of Human Development. Therefore, it is plausible to assume
that these relations are reciprocal. However, as explained in section 1.2, there are strong
theoretical reasons (from the logic of aspiration adjustment and its enforcing aggregation to the
societal level) that these relations are not perfectly symmetric in each direction, but follow at least
a relatively dominant direction along the sequence from resource mobilization to expressive
values to democratic institutions. Whether this or the opposite sequence is true can be tested
within a recursive system of equations in which each of the three HD-elements appears at one
time as a dependent variable regressed on preceding levels of the other two HD-elements. But
causation requires not only that causes must precede effects but also that other important
influences are controlled for. One such control predictor in each of our equations should be the
interaction effect of the two regressors, since it is possible that HD-relations differ in strength on
different HD-levels, in which case the interaction effect would have a significant impact.
However, controlling for the interaction of two of the HD-elements does not introduce elements
22
from outside of our theory as control predictors. In order to apply a severe test of our theory we
should introduce control predictors tapping strictly contradicting assumptions.
In this context, two traits of HD-theory can be challenged. This is at first true for the
assumption that societies’ levels in one HD-element are endogenously caused by her levels in the
other HD-elements or their interaction, respectively. In order to test the endogeneity-assumption
we operationalize an exogenously driven effect, namely transnational diffusion of HD-levels from
other societies within the same cultural zone. Thus we include in each of the three equations the
diffusion-effect of the dependent variable by assigning each country the average regional level of
the dependent HD-element. A second trait of our theory is its claim of cultural generalizability.
For many scholars this might reflect one of the most dubitable assumptions, since many
researchers still believe that expressive values and democratic institutions are inherently Western
phenomenons (Bollen/Jackman 1985). We follow the suggestion of other scholars to indicate the
strength of the Western tradition by Western Christianity measured as the percentage of
Protestants plus Catholics in a population (Muller/Seligson 1994).3 So we introduce Western
Christianity as an additional control predictor. Should our theory be true, then diffusion predictors
and Western Christianity should come out as the least significant and weakest predictors in each
of our models. Thus, we have three equations, one for each of the HD-elements as the dependent
variable regressed on lagged measures of the remaining two HD-elements as well as on their
interaction effect and on diffusion and Western Christianity. We assume, first, that in each
equation one of the HD-elements turns out to be a stronger and more significant predictor than
diffusion and Western Christianity. Second, from our sequence-thesis we assume (a) that resource
3 These figures are taken from the Britannica book of the year 1991 and refer mostly to the
mid 1980s.
23
mobilization wins over democratic institutions in predicting expressive values, and (b) that
expressive values win over resource mobilization in predicting democratic institutions. Predicting
resource mobilization, our sequential thesis does not provide a favorable effect—except that one
of the HD-elements should win over diffusion and Western Christianity.
The next task for correct modelling is to identify the adequate time sequence for measuring
variables. We have measures of democratic institutions for each year since 1972, measures of
expressive values for 1981, 1990-91 and 1995-98 (for partly different subsets of countries) and
measures of resource mobilization for 1988 and 1993. In particular the latter urges us to work
with time lags of not more than five years between independent and dependent variables. But
fortunately the resource mobilization measures lay exactly arround the time window through
which the 3rd Wave of democratization has moved. This is an absolutely crucial information.
Resource mobilization and expressive value change evolve incremental and continuously since
these are quasi-natural processes which cannot be targetedly steered. But with democratic
institutions the case is completely different. Democratic institutions are the product of deliberate
constitutional creation implemented by national elites. Therefore, the shape of regime institutions
can nearly completely change over night through far reaching constituional recreation. Exactly
that happened during the 3rd Wave of democratization when more than 30 countries worldwide
adopted democratic institutions within a very short time, namely the period between 1987/88 and
1992/93. Inspecting that global move empirically using the Freedom House scores (Figure 3) one
can see that nearly all countries were on stable levels of democratic institutions over the five-year
period before the 3rd wave (1983-88) and again on rather stable levels over the five-year term
after that wave (1993-98). But during that wave many countries experienced a major shift
upwards from their levels in 1983-88 to the levels in 1993-98.
24
Figure 3 (about here)
In order to test the sequential thesis correctly, we must measure the variables in the
historically adequate time sequence. So we should measure democratic institutions over mid-term
periods before and after the 3rd Wave, and we should use in our models the 1990-91 measure of
expressive values as the center around which we arrange preceding and subsequent measures of
democratic institutions and resource mobilization. Denoting democratic institutions as DI,
expressive values as EV, resource mobilization as RM, diffusion variables with suffix DIF_,
Western Christianity as WESTCHR, regression coefficients with , the constant with c, and the
error term with , we obtain the following system of recursive sequential equations:
(1) EV1990=c+ 1*RM1988+ 2*DI1983-88+ 3*(RM*DI)+ 4*DIF_EV+ 5*WESTCHR+
(2) DI1993-98=c+ 1*EV1990+ 2*RM1988+ 3*(EV*RM)+ 4*DIF_DI+ 5*WESTCHR+
(3) RM1993=c+ 1*EV1990+ 2*DI1990+ 3*(EV*DI)+ 4*DIF_RM+ 5*WESTCHR+
Using only the 1990 EV-measure would reduce our sample to 42 nations, though 63 nations
took part in all three waves of the WVS. Therefore, we imputed missing values for EV for 21
nations from the existing information on their EV-levels measured either in 1981 or in 1995-95
and from the existing data on RM, DI and WESTCHR. Since the explained variance of EV
regressed on these variables is more than 90%, one can be sure that these imputations produce
reliable data. Using the newest technique for multiple imputation from the AMELIA-program
developed by King et. al. (1999) cannot produce another variance-covariance structure than that
of the existing data. However, in order to exclude that we rely on artifacts produced by
imputation, we calculated the equations also with the existing data only. These figures are given
in parentheses in Tables 4-6. As one can see, they do not differ from the results with imputed
data. So we can rest our conclusions on the models with imputed data. Another problem which
25
we expected to ocuur (because of the close correlations betweeen the HD-elements) is
collinearity. Therefore, we calculated Variance Inflation Factors (VIF) to detect problems with
collinearity.4
Tables 4 to 6 (about here)
Considering the results, we obtain a clear effect structure. In none of the analyses does the
introduction of the two control predictors outside the HD-relations increase the explained
variance substantially nor does it change the effect structure within the HD-relations. And in none
of the models, does Western Christianity play a significant role. Thus, our theory is not
invalidated by the assumption that it would not hold in non-Western cultures. Moreover, in all
models at least one the HD-elements is among the most significant and strongest predictors. And
in predicting expressive values, resource mobilization seems to be far more important than
democratic institutions, as suggested by our sequential thesis. However, some results contradict
our hypotheses. Predicting expressive values, the regional diffusion of expressive values seems to
be more important than levels of resource mobilization and democratic institutions within
societies. Moreover, in predicting democratic institutions, resource mobilization seems to be
much more important than expressive values (in contrast to our sequential thesis). However, an
inspection of the Variance Inflation Factors indicates that some coefficients are by far too highly
inflated with collinearity in order to be seen as reliable. This is true for the effect of resource
mobilization on expressive values (VIF=18.289), the effect of the interaction between resource
4 Variance Inflation Factors represent a measure of collinearity among predictors. Following
a common convention, the values should remain below 5.0 or the results can be considered
adulterated by collinearity (Judge et al. 1988: 869). The formula for the variance inflation
factor is: VIF = 1 / (1 – Rj2).
26
mobilization and democratic institutions on expressive values (29.035), the effect of expressive
values on democratic institutions (10.673), the effect of expressive values on resource
mobilization (26.335), and the effect of the interaction between expressive values and democratic
institutions on resource mobilization (18.363).
The most appropriate way to deal with such strong indications of collinearity is to bias the
estimators with a k-factor in Ridge-regression (Kmenta 1997:440-1). With increasing k-factors
that method reduces the determination coefficient but takes variance inflation out of the
coefficients and stabilizes them approaching their true relation to each other. Following the “ridge
trace” of the coefficients (which is produced by displaying the change in effect-relation for
increasing k-factors), one obtains a picture of the true effect relation. The ridge traces of the
effects shown in Tables 4-6 are displayed in Figures 4-6. We do not look at the magnitude of the
coefficients but at the change in their relative size to each other based on their T-Ratios, i.e. the
ratio of the magnitude of the regression coefficient to its standard error.
Figures 4 to 6 (about here)
All changes that occur in the ridge-traces bring the results systematically more in line with
our sequential thesis. Predicting expressive values (Figure 4), the effect of democratic institutions
remains at a minor level compared to resource mobilization, while the relative effect of value-
diffusion becomes smaller and smaller falling substantially below the level of resource
mobilization. Thus, HD-effects play the major role in predicting expressive values with resource
mobilization being the dominant effect, as suggested by our sequential theses. In addition it turns
out that democratic institutions play an important role only in interaction with resource
mobilization, indicating that democratic institutions have an impact on expressive values but only
in connection with rising levels of resource mobilization.
27
Predicting democratic institutions (Figure 5), the effect of expressive values moves steeply
upwards reaching nearly the same level as the effect of resource mobilization, all other effects
being on minor levels. Similar dramatic changes occur in predicting resource mobilization
(Figure 6), where the effect of expressive values rapidly moves to the highest level with
increasing k-factors. Thus, it seems that expressive values are an important predictor of both
democratic institutions and resource mobilization, representing the linkage element between
economic and institutional HD. The strongest indication of recursiveness applies to the relation
between expressive values and resource mobilization, while democratic institutions do neither
have a major impact on resource mobilization nor on expressive values once controlled for the
other HD-elements. Institutional HD seems to be more a consequence than a precondition of
economic and ethical HD.
However, the statistical evidence for causation is limited and does not justify a definite
decision. It is still a matter of theoretical interpretation. But what is at least overwhelmingly
evident is that the interrelations between the HD-elements are exceptionally strong and hold
against rival influences. Moreover, even if these effects should be strongly recursive, such
recursivity necessarily implies that causation does also flow along the sequence from resource
mobilization to expressive values to democratic institutions. So let us concentrate on exactly that
sequence and whether it holds for rival influences.
2.2.4 The Economic-Ethical-Institutional HD-Sequence
In order to test the existence of the economic-ethical-institutional sequence directly, we apply a
two-stage-least squares regression model in which we predict democratic institutitons measured
after the 3rd Wave (DI1993-98) with expressive values measured within the 3rd Wave (EV1990)
using resource mobilization measured before the 3rd Wave (RM1988) as an instrument to obtain
28
more reliable estimates of expressive values. Again we test this sequence against the two major
opposing explanations of democratic institutions: regional diffusion of democratic institutions
(DIF_DI) and Western culture (WESTCHR). The results are shown in Table 7.
Table 7 (about here)
According to Table 7 expressive values clearly outmatch the effects of regional diffusion
and Western culture in predicting democratic institutions. The impact of expressive values is
significant at the .000-level, while none of the two rival effects comes near any acceptable
significance-level. This result is strictly in line with our theory. Yet, similar levels of democratic
institutions can result from either high regime stability or from far reaching regime change during
the 3rd Wave. Therefore, the question arises whether the sequence also holds in explaining ranges
of change in democratic institutions. In order to give an answer to this question we test the effect
of expressive values directly against that of resource mobilization, since from the analyses above
resource mobilization seemed to have a slightly more important impact on democratic institutions
than expressive values.
Figure 7 (about here)
For this purpose, we must differentiate countries into different start groups, since different
levels of democracy before the 3rd Wave allow for different ranges of change in direction to
democracy. Hence, we categorized countries according to the level of democracy with which they
entered the 3rd Wave into four groups: minimum start level, low start level, medium start level
and high start level. Figure 7 demonstrates that in all four groups ranges of change rise
significantly in proportion to levels of expressive values, with increasing slopes along with
decreasing start levels of democratic institutions. This reflects the simple fact that greater ranges
of democratic change could be reached from lower start levels of democracy.
29
Table 8 (about here)
In Table 8 we controlled the effect of expressive values on democratic institutions for levels
of resource mobilization. We did that in a system of Seemingly Unrelated Regressions (SUR) for
the different start levels of democracy. Using SUR has the advantage that we calculate the
regressions from a common error structure which makes coefficients more comparable (Kmenta
1997:635-48). What we see from Table 9 is that within each start-level group the effect of
expressive values outmatches that of resource mobilization, being significant at least on the .0-
level, while resource mobilization does not show any significant effect once controlled for
expressive values. The level of expressive values present in 1990 actually had a major impact on
democratic change that occured during the 3rd Wave.
SUMMARY AND SPECULATION
In this paper we introduced the concept of ‘Human Development’ as a general theory of social
change. We argued that the growth of human choice, or Human Development (HD), is the general
principle that unifies the three major trends in social change, namely economic modernization,
expressive value change, and democratization. From the human development perspective these
are three subprocesses within one overarching process of diminishing constraints on human
choice. Modernization (economic HD) reduces physical and cognitive constraints, expressive
value change (ethical HD) reduces motivational or aspirational constraints, and democratization
(institutional HD) reduces formal or normative constraints.
We have shown strong evidence from 63 societies of the World Values Surveys that (1)
these processes originate in the mechanism of aspiration adjustment on the individual level, (2)
that social interaction reinforces dramatically the relation between these processes on the cross-
national level, (3) that these relations operate—may be not only but also—along a sequence from
30
economic to ethical to institutional HD, (4) that this sequence shows cross-cultural validity, and
(5) that this sequence holds against rival influences, in particular the transnational diffusion of
changes in historically connected societies.
HD-theory has several advantages. It identifies the micrological or behavioral-
anthropological basis of cross-national relations in the mechanism of aspiration adjustment. It
offers an explanation how the micrological relations are transferred to the societal level through
social interaction. And it identifies the common focus of three major processes of change making
the claim that this focus is culturally universal. The human strive for greater choice is a universal
but one that comes into work on the ethical level only if the needed resource basis is present. But
when the economic and ethical basis of human choice exceed a certain level, then there is mass
pressure on elites to preserve or deepen democracy—the regime that opens the widest margin for
human choice.
HD guided the whole human history when societies rose from one civilizational level to
another, for instance from hunting-gathering-societies to agricultural societies or from agricultural
to mercantile societies. Each civilizational step widened human choice, but only for privileged
groups such as casts, estates or classes. HD had an extremely exclusionary character over the
largest part of human history. Against this background, the entrance into the inclusive phase of
HD was an evolutionary leap. It occured at first in Northwestern Europe, beginning with the
Mercantile and the Industrial Revolution. But inclusve HD diffused all over Europe, North
America, Australasia, Japan, Southeast Asia and some parts of Southern America. Inclusive HD
even occurs in some Islamic societes, such as Malaysia and Indonesia which are the most recent
democratizing countries. In the past, the entrance into into increasingly progressive and inclusive
HD was caused by ecological advantages. Already in the pre-industrial era HD had a more
31
inclusive character in the Western Europe and Northern America, since steady rainfall did not
allow for a despotic agricultural regime as it occured in the great river valley civilizations
(Nolan/Lenski 1984, Midlarski 1999). Similarly, the Southeast Asian economies’ take off had
much to do with the fact that these societies did not dispose over large natural resources and
therefore were forced to invest in human capital (Barro 1997, Landes 1998). However, in the era
of global communication societes can much more lear from each other, thus being less dependent
on ecological advantages in the future. This offers improved opportunities for societies in Sub-
Saharan Africa and Central Asia to catch up in HD.
HD theory offers immense possibilities for further research and discussion. For instance,
one can investigate HD for sequences, for different profiles in different regions, for the degrees of
freedom that elites have to influence HD. One can investigate HD on the individual level and the
societal level. One can ask for the relation between biological and societal HD. One can discuss
societal HD in human history. HD can be easily linked to the moral or philosophical discussion
on the universality of human rights. HD is linked with questions of “sustainable development,”
since ethical HD (expressive values) brings with it more ecological consciousness. And finally,
HD is linked with the development of civil society and social capital, because expressive values
increase a society’s creative potential. In summary, HD may really have the potential for an
integrating theory of social change.
32
LITERATURE
Almond, Gabriel A. and Sidney Verba. 1963. The Civic Culture: Political Attitudes in Five
Western Democracies. Princeton: Princeton University Press.
Barnes, Samuel H. and Max Kaase et. al. 1979. Political Action: Mass Participation in Five
Western Democracies, Beverly Hills: Sage.
Barro, Robert J. 1997: Determinants of Economic Growth: A Cross-Country Empirical Study.
Cambridge: MIT Press.
Barry, Brian. 1978. Sociologists, Economists, and Democracy. Chicago: University of Chicago
Press.
Bell, Daniel. 1973. The Coming of Postindustrial Society. New York: Penguin.
Birch, Charles and John B. Cobb Jr. 1981. The Liberation of Life: From the Cell to the
Community. Cambridge: Cambridge University Press.
Bollen, Kenneth A. and Robert W. Jackman. 1985. Political Democracy and the Size Distribution
of Income. In: American Sociological Review 50 (August): 438-457.
Brint, Steven. 1984. „New Class“ and Cumulative Trend Explanations of the Liberal Political
Attitudes of Professionals. In: American Journal of Sociology 90 (1): 30-71.
Britannica Book of the Year. verschiedene Jahrgänge. Hrsg. v. Encyclopaedia Britannica.
London: Encyclopaedia Britannica Inc.
Budge, Ian. 1996. The New Challenge of Direct Democracy. Cambridge: Polity Press.
Burkhart, Ross E. and Michael S. Lewis-Beck. 1994. Comparative Democracy: The Economic
Development Thesis. In: American Political Science Review 88 (December): 903-910.
33
Cavalli-Sforza, Luigi Luca. 1996. Gènes, Peuples et Langues. Les Fondations Biologique de
Notre Civilisation, Paris: Odile Jacob.
Chirot, Daniel. 1986. Social Change in the Modern Era. Orlando: Harcourt Brace Jovanovich.
Costa, P. T., R. R. McCrae and A. B. Zonderman. 1987. British Journal of Psychology 78: 299-
306.
Coulter, Philip. 1975. Social Mobilization and Liberal Democracy: A Macroquantitative Analysis
of Global and Regional Models. Lexington: Lexington Books.
Cutright, Phillips. 1963. National Political Development: Measurement and Analysis. In:
American Sociological Review 28 (April): 253-264.
Cutright, Phillips and James A. Wiley. 1969. Modernization and Political Representation, 1927-
1966. In: Studies in Comparative International Development 5 (1): 23-44.
Dahl, Robert A. 1973. Polyarchy: Participation and Opposition (1. Auflage 1971). New Haven:
Yale University Press.
Dalton, Russell J., 1996: Citizen Politics: Public Opinion and Political Parties in Advanced
Western Democracies. Chatham: Chatham House.
Diamond, Larry. 1992. Economic Development and Democracy Reconsidered. In: Garry Marks
and Larry Diamond (Hrsg.): Reexamining Democracy. London: Sage, 93-139.
Diamond, Larry. 1993. The Globalization of Democracy. In: Robert O. Slater, Barry M. Schutz
and Steven R. Dorr (Hrsg.): Global Transfromation and the Third World. Boulder: Lynne
Rienner: 31-69.
Diamond, Jared. 1997. Guns, Germs, and Steel: The Fate of Human Societies. New York: W. W.
Norton.
34
Ersson, Svante and Jan-Erik Lane. 1996. Democracy and Development: A Statistical Exploration.
In: Adrian Leftwich (Hrsg.): Democracy and Development: Theory and Practice.
Cambridge: Polity Press, 45-73.
Freedom in the World. versch. Jahrgänge. Hrsg v. Freedom House, Lanham: University Press of
America.
Frey, R. Scott and Ali Al-Roumi. 1999. Political Democracy and the Physical Quality of Life: The
Cross-National Evidence. In: Social Indicators Research 47 (May): 73-97.
Fukuyama, Francis. 1995. Trust: Social Virtues and the Creation of Prosperity. New York: Free
Press.
Gasiorowski, Mark J. and Timothy J. Power. 1998. The Structural Determinants of Democratic
Consolidation: Evidence form the Third World. In: Comparative Political Studies 31
(December): 740-771.
Hagerty, Michael R. 1999. Testing Maslow’s Hierarchy of Needs: National Quality-of-Life
Across Time. In: Social Indicators Research 46 (March): 249-271.
Helliwell, John F. 1993. Empirical Linkages Between Democracy and Economic Growth. In:
British Journal of Political Science 24 (April): 225-248.
Hirschman, Albert O. 1982. Rival Interpretations of Market Society: Civilizing, Destructive, or
Feeble? In: The Journal of Economic Literature 20: 1463-1484.
Hofferbert, Richard I. and Hans-Dieter Klingemann. 1999. Remembering the Bad Old Days:
Human Rights, Economic Conditions, and Democratic Performance in Transitional
Regimes. In: European Journal of Political Research 36 (1): 155-174
Hughes, Barry B. 1999. International Futures: Choices in the Face of Uncertainty (3. Auflage).
Boulder: Westview Press.
35
Human Development Report. verschiedene Jahrgänge. Hrsg. v. United Nations Development
Program (UNDP). New York: Oxford University Press.
Huntington, Samuel P. 1991. The Third Wave: Democratization in the Late Twentieth Century.
Norman: University of Oklahoma Press.
Huntington, Samuel P. 1996. The Clash of Civilizations and the Remaking of the World Order.
New York: Simon & Schuster.
Inglehart, Ronald. 1977. The Silent Revolution. Princeton: Princeton University Press.
Inglehart, Ronald. 1990. Culture Shift in Advanced Industrial Societies. Princeton: Princeton
University Press.
Inglehart, Ronald. 1997. Modernization and Postmodernization: Cultural, Economic and Political
Change in 43 Societies. Princeton: Princeton University Press.
Inkeles, Alex and David H. Smith. 1974. Becoming Modern: Individual Change in Six
Developing Countries. Cambridge: Harvard University Press.
Inkeles, Alex and Larry Diamond. 1980. Personal Development and National Development: A
Cross-National Perspective. In: Alexander Szalai and Frank M. Andrews (Hrsg.): The
Quality of Life: Comparative Studies. London: Sage, 73-110.
Jaggers, Keith and Ted Robert Gurr. 1995. Tracking Democracy’s Third Wave with the Polity III
Data. In: Journal of Peace Research 32 (4): 469-482.
Jones, Eric L. 1985. The European Miracle: Environments, Economies and Geopolities in the
History of Europe and Asia (3. Neudruck, Erstauflage 1981). Cambridge: Cambridge
University Press.
Kennedy, Paul. 1993. Preparing for the Twenty-First Century. New York: Random House.
36
King, Gary et al. 1999a. Analyzing Incomplete Political Science Data: An Alternative Algorithm
for Multiple Imputation (Internet-Paper: “http://www.gking.harvard.edu”).
King, Gary. et al. 1999b. Amelia: A Program for Missing Data, Version 1.07 (Internet-Paper:
“http://www.gking.harvard.edu”).
Klingemann, Hans-Dieter. 1999: Mapping Political Support in the 1990s: A Global Analysis. In:
Norris (Hrsg.): 31-56.
Landes, David S. 1998. The Wealth and Poverty of Nations: Why Some are So Rich and Some So
Poor. New York: W.W. Norton.
Laslett, Peter. 1989. The European Family and Early Industrialization. In: Baechler, Hall and
Mann (Hrsg.): 234-242.
Leblang, David A. 1997. Political Democracy and Economic Growth: Pooled Cross-Sectional and
Time-Series Evidence. In: British Journal of Political Science 27 (3): 453-472.
Lipset, Seymour M. 1959. Some Social Requisites of Democracy: Economic Development and
Political Legitimacy. In: American Political Science Review 53 (March): 69-105.
Lipset, Seymour M., Kyoung-Ryung Seong and John C. Torres. 1993. A Comparative Analysis of
the Social Requisites of Democracy. In: International Social Science Journal 45 (May): 155-
175.
Maravall, José María. 1994. The Myth of the Authoritarian Advantage. In: Journal of Democracy
5 (4): 17-31.
Maslow, Abraham. 1970. Motivation and Personality (2. Auflage, Erstauflage 1954). New York:
Harper & Row.
37
McCrone, Donald J. and Charles F. Cnudde. 1967. Toward A Communications Theory of
Democratic Political Development: A Causal Model. In: American Political Science
Review 61 (March): 72-79.
Mouzelis, Nicos. 1999. Modernity: A Non-European Conceptualization. In: British Journal of
Sociology 50 (March): 141-159.
Muller, Edward N. and Mitchell A. Seligson. 1994. Civic Culture and Democracy: The Question
of Causal Relationships. In: American Political Science Review 88 (3): 635-52.
Nevitte, Neil. 1996. The Decline of Deference. Ontario: Broadview Press.
Norris, Pippa (Hrsg.). 1999. Critical Citizens: Global Support for Democratic Governance. New
York: Oxford University Press.
North, Douglas C. 1981. Structure and Change in Economic History. New York: W.W. Norton.
Olson, Mancur C. 1982. The Rise and Decline of Nations: Economic Growth, Stagflation, and
Social Rigidities. New Haven: Yale University Press.
Perkin, Harold. 1996. The Third Revolution: Professional Elites in the Modern World. London:
Routledge.
Przeworski, Adam and Fernando Limongi. 1997. Modernization: Theories and Facts. In: World
Politics 49 (January): 155-183.
Putnam, Robert D. 1993. Making Democracy Work: Civic Traditions in Modern Italy. Princeton:
Princeton University Press.
Rohrschneider, Robert. 1994. Report from the Laboratory: The Influence of Institutions on
Political Elites‘ Democratic Values in Germany. In: American Political Science review 88
(4): 927-941.
38
Rostow, W. W. 1961. The Stages of Economic Growth: A Non-Communist Manifesto.
Cambridge: Cambridge University Press.
Rustow, Dankwart A. 1970. Transitions to Democracy: Toward a Dynamic Model. In:
Comparative Politics 2 (April): 337-363.
Scarrow, Susan. 1999. The Expansion of Direct Democracy: A Comparative Investigation of
Institutional Change (unveröffentl. Manuskript zum Jahrestreffen der Midwest Political
Science Association in Chicago, 15.-17. April 1999).
Sen, Amartya. 1997. Human Capital and Human Capability. In: World Development 25 (12):
1959-1961.
Sen, Amartya. 1999. Development as Freedom. Stanford: Knopf.
Tilly, Charles. 1997. Coercion, Capital, and European States, AD 990-1992 (5. Neudruck der 2.
Auflage von 1992, Erstauflage 1990). Oxford: Blackwell.
Vanhanen, Tatu (Hrsg.). 1997. Prospects of Democracy: A Study of 172 Countries. London:
Routledge.
Verba, Sidney, Norman H. Nie and Jae-On Kim. 1978. Participation and Political Equality: A
Seven Nation Comparison. Cambridge: Cambridge University Press.
Welzel, Christian and Ronald Inglehart. 1999. Analyzing Democratic Change and Stability: A
Human Development Theory of Democracy. In: WZB-Discussion Papers FS III 99-202.
Berlin: WZB.
Yi Feng. 1997. Democracy, Political Stability and Economic Growth. In: British Journal of
Political Science 27 (3): 391-418.
39
Table 1. The Concept of (Societal) Human Development
The three components of Human Development (HD)
Characteristics of the
components
I. Economic
component
II. Ethical
component
III. Institutional
component
Meaning of the HD-
components
Human resources
(“hardware”)
Liberal values
(“software”)
Guarantees for freedom
(“user-rights“)
Spheres in which the HD-
components emerge
Economic structure
Political culture
Regime institutions
Processes generating the
HD-components
Socio-economic
modernization
Expressive value change
Liberalization,
Democratization
Components’ contribution
to HD
Reducing material and
cognitive constraints on
human choice
Reducing motivational and
ethical constraints on
human choice
Reducing institutional and
formal constraints on
human choice
Focal point in which the
components converge
The growth of human choice in society
(Human Development)
40
Table 2. Micro-Level Evidence for the HD-Relations
Income and Expressive
Values
Education and Expressive
Values
Expressive Values and
Support for Democracy
Survey sample
Pearson’ R
N
Pearson’s R
N
Pearson’s R
N
Anglo-Saxon world:
Australia 3 .24*** 1,716 .18*** 1,883 .22*** 1,843
Canada 1 .16*** 928
Canada 2 .22*** 1,317
Iceland 1 .09** 764
Ireland 1 .15** 415
Ireland 2 .30*** 835
New Zealand 3 .26*** 598
Northern Ireland 1 .24*** 222
USA 2 .22*** 1,530
USA 3 .29*** 1,224 .25*** 1,332 .14*** 1,273
UK 1 .18*** 639
UK 2 .24*** 1,006
Mean (SE mean) .21 (.02) .23 (.02) .18 (.04)
Protestant Europe:
Denmark 1 .18*** 852 .20*** 588
Denmark 2 .31*** 801
Finland 2 .09* 457 .20*** 457
Finland 3 .20*** 822 .17*** 873 .32*** 800
Germany (West) 1 .12*** 846
Germany (West) 2 .23*** 1,302
Germany (West) 3 .23*** 767 .27*** 924 .32*** 912
Netherlands 1 .12** 509
Netherlands 2 .26*** 723
Norway 1 .18*** 931
Norway 2 .23*** 912 .31*** 1,070
Norway 3 .28*** 1,008 .34*** 1,079 .23*** 1,057
Sweden 1 .13*** 648
Sweden 2 .21*** 776 .25*** 857
Sweden 3 .24*** 791 .25*** 868 .27*** 842
Switzerland 2 .24*** 591 .12** 667
Switzerland 3 .23*** 803 .15*** 994 .16*** 875
Mean (SE mean) .20 (.01) .23 (.02) .26 (.03)
Catholic Europe:
Austria 2 .22*** 1,155 .35*** 1,190
Belgium 1 .25*** 617
Belgium 2 .25*** 1,381
France 1 .24*** 783
France 2 .35*** 721
Italy 1 .19*** 883
Italy 2 .21*** 1,263
Portugal 2 .20*** 984
Spain 1 .23*** 1,549
41
Spain 2 .25*** 2,786
Spain 3 .26*** 774 .28*** 1,040 .22*** 907
Mean (SE mean) .24 (.01) .32 (.04) .22
Continuation of Table 2
Income and Expressive
Values
Education and Expressive
Values
Expressive Values and
Support for Democracy
Survey sample
Pearson’ R
N
Pearson’s R
N
Pearson’s R
N
Postcommunist
Central Europe:
Czech Republic 2 .16*** 921 .18*** 775
Germany (East) 2 .16*** 997
Germany (East) 3 .29*** 825 .33*** 932 .22*** 897
Hungary 2 .24*** 879
Hungary 3 .22*** 531
Poland 2 .26*** 786 .14*** 785
Poland 3 .38*** 979 .28*** 1,016 .15*** 1,016
Slovakia 3 .32*** 751 .25*** 772
Slovenia 2 .36*** 758
Slovenia 3 .38*** 928 .27*** 814
Mean (SE mean) .26 (.03) .29 (.04) .22 (.02)
Postcommunist
Balkans:
Albania .14*** 583
Bulgaria 2 .31*** 774
Bulgaria .21*** 495
Croatia 3 .35*** 1,000 .22*** 965
Macedonia 3 .08* 668
Montenegro 3 .36*** 172 .25** 184 .26*** 143
Romania 2 .32*** 1,022
Romania 3 .10*** 810
Serbia 3 .24*** 1,021 .22*** 1,075 .21*** 906
Mean (SE mean) .31 (.02) .27 (.04) .17 (.03)
Postsoviet Europe:
Armenia 3 .24*** 1,602 .09*** 1,688 .17*** 1,688
Belarus 2 .10** 872
Belarus 3 .23*** 1,535 .22*** 1,600 .20*** 1,316
Estonia 2 .08** 846 .08* 847
Estonia 3 .37*** 864 .22*** 853 .23*** 774
Georgia 3 .26*** 2,141 .10*** 2,213 .13*** 2,082
Latvia 2 .09** 612 .11** 621
Latvia 3 .31*** 988 .22*** 1,018 .23*** 836
Lithuania 2 .18*** 813 .11** 820
Lithuania 3 .29*** 730 .27*** 567 .13** 567
Moldova 3 .28*** 846 .24*** 863 .02 781
Russia 2 .13*** 1,297
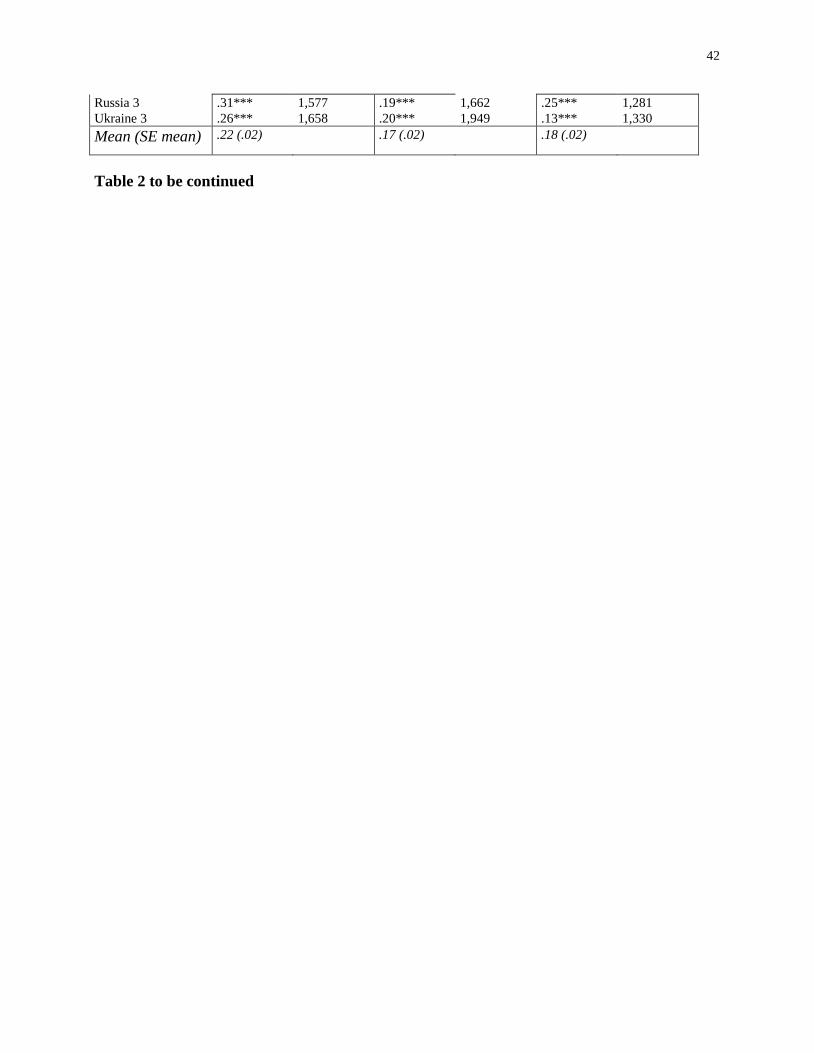
42
Russia 3 .31*** 1,577 .19*** 1,662 .25*** 1,281
Ukraine 3 .26*** 1,658 .20*** 1,949 .13*** 1,330
Mean (SE mean) .22 (.02) .17 (.02) .18 (.02)
Table 2 to be continued
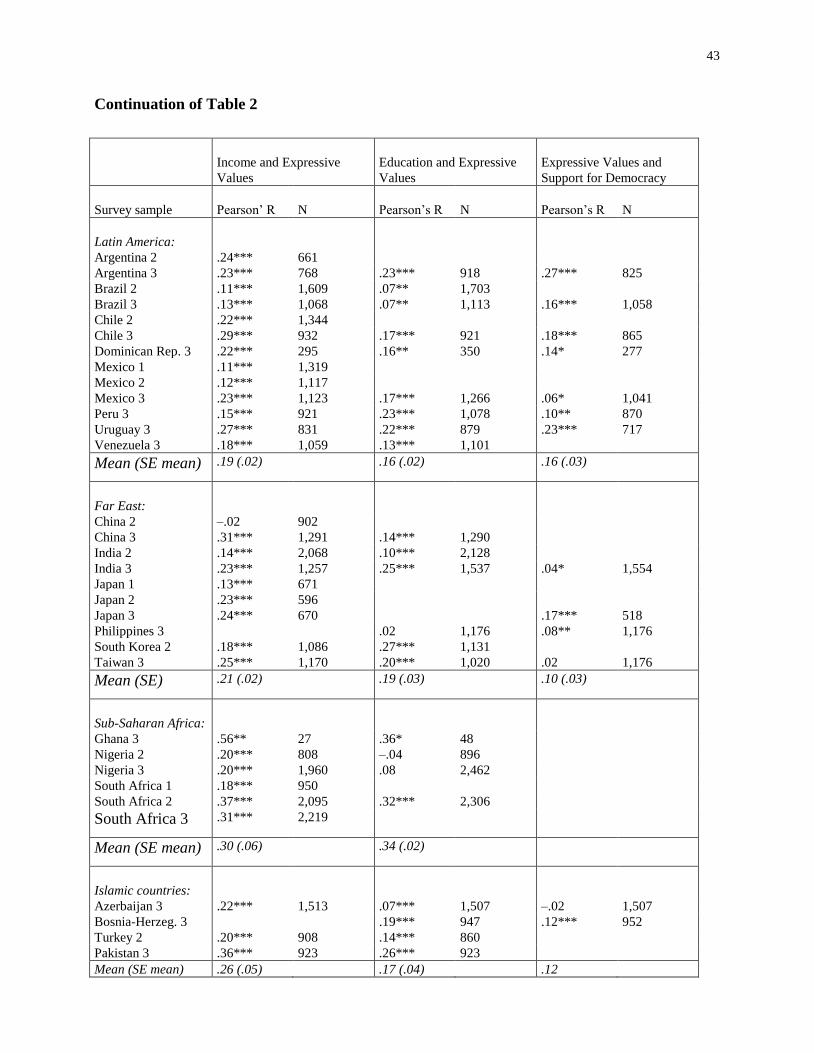
43
Continuation of Table 2
Income and Expressive
Values
Education and Expressive
Values
Expressive Values and
Support for Democracy
Survey sample
Pearson’ R
N
Pearson’s R
N
Pearson’s R
N
Latin America:
Argentina 2 .24*** 661
Argentina 3 .23*** 768 .23*** 918 .27*** 825
Brazil 2 .11*** 1,609 .07** 1,703
Brazil 3 .13*** 1,068 .07** 1,113 .16*** 1,058
Chile 2 .22*** 1,344
Chile 3 .29*** 932 .17*** 921 .18*** 865
Dominican Rep. 3 .22*** 295 .16** 350 .14* 277
Mexico 1 .11*** 1,319
Mexico 2 .12*** 1,117
Mexico 3 .23*** 1,123 .17*** 1,266 .06* 1,041
Peru 3 .15*** 921 .23*** 1,078 .10** 870
Uruguay 3 .27*** 831 .22*** 879 .23*** 717
Venezuela 3 .18*** 1,059 .13*** 1,101
Mean (SE mean) .19 (.02) .16 (.02) .16 (.03)
Far East:
China 2 –.02 902
China 3 .31*** 1,291 .14*** 1,290
India 2 .14*** 2,068 .10*** 2,128
India 3 .23*** 1,257 .25*** 1,537 .04* 1,554
Japan 1 .13*** 671
Japan 2 .23*** 596
Japan 3 .24*** 670 .17*** 518
Philippines 3 .02 1,176 .08** 1,176
South Korea 2 .18*** 1,086 .27*** 1,131
Taiwan 3 .25*** 1,170 .20*** 1,020 .02 1,176
Mean (SE) .21 (.02) .19 (.03) .10 (.03)
Sub-Saharan Africa:
Ghana 3 .56** 27 .36* 48
Nigeria 2 .20*** 808 –.04 896
Nigeria 3 .20*** 1,960 .08 2,462
South Africa 1 .18*** 950
South Africa 2 .37*** 2,095 .32*** 2,306
South Africa 3 .31*** 2,219
Mean (SE mean) .30 (.06) .34 (.02)
Islamic countries:
Azerbaijan 3 .22*** 1,513 .07*** 1,507 –.02 1,507
Bosnia-Herzeg. 3 .19*** 947 .12*** 952
Turkey 2 .20*** 908 .14*** 860
Pakistan 3 .36*** 923 .26*** 923
Mean (SE mean) .26 (.05) .17 (.04) .12

44
Overall mean (SE) .23 (.01) .21 (.01) .19 (.01)
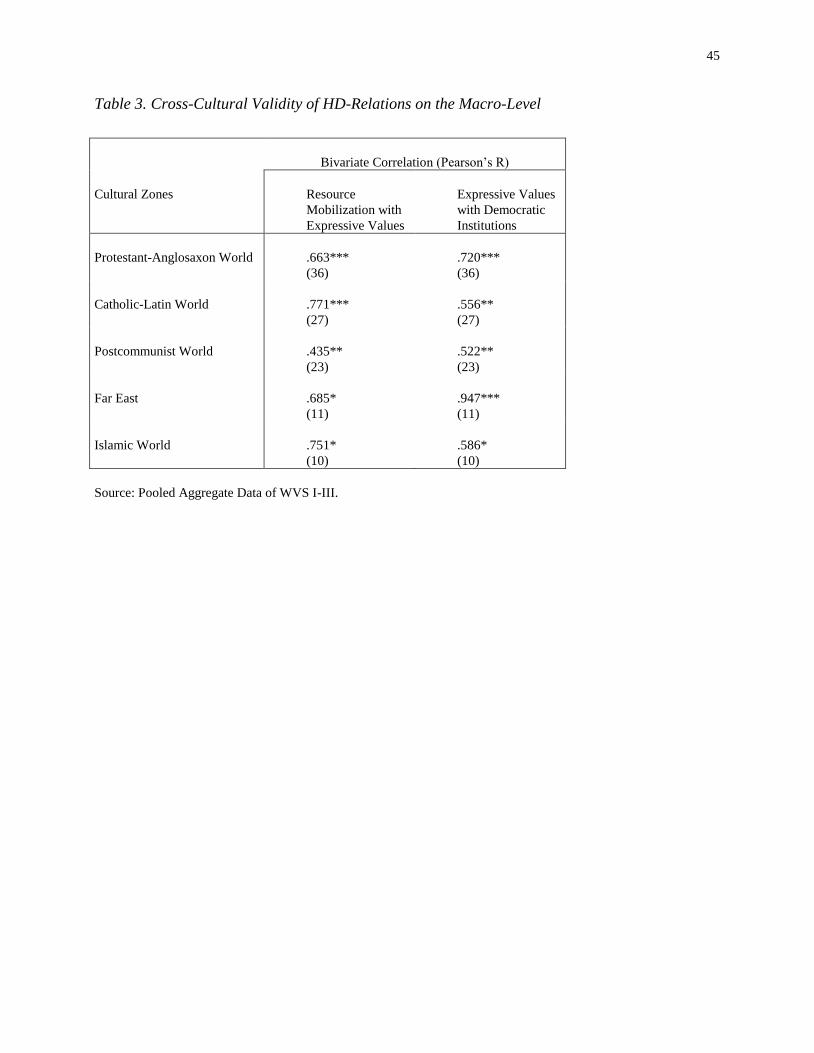
45
Table 3. Cross-Cultural Validity of HD-Relations on the Macro-Level
Bivariate Correlation (Pearson’s R)
Cultural Zones
Resource
Mobilization with
Expressive Values
Expressive Values
with Democratic
Institutions
Protestant-Anglosaxon World
.663***
(36)
.720***
(36)
Catholic-Latin World
.771***
(27)
.556**
(27)
Postcommunist World
.435**
(23)
.522**
(23)
Far East
.685*
(11)
.947***
(11)
Islamic World
.751*
(10)
.586*
(10)
Source: Pooled Aggregate Data of WVS I-III.
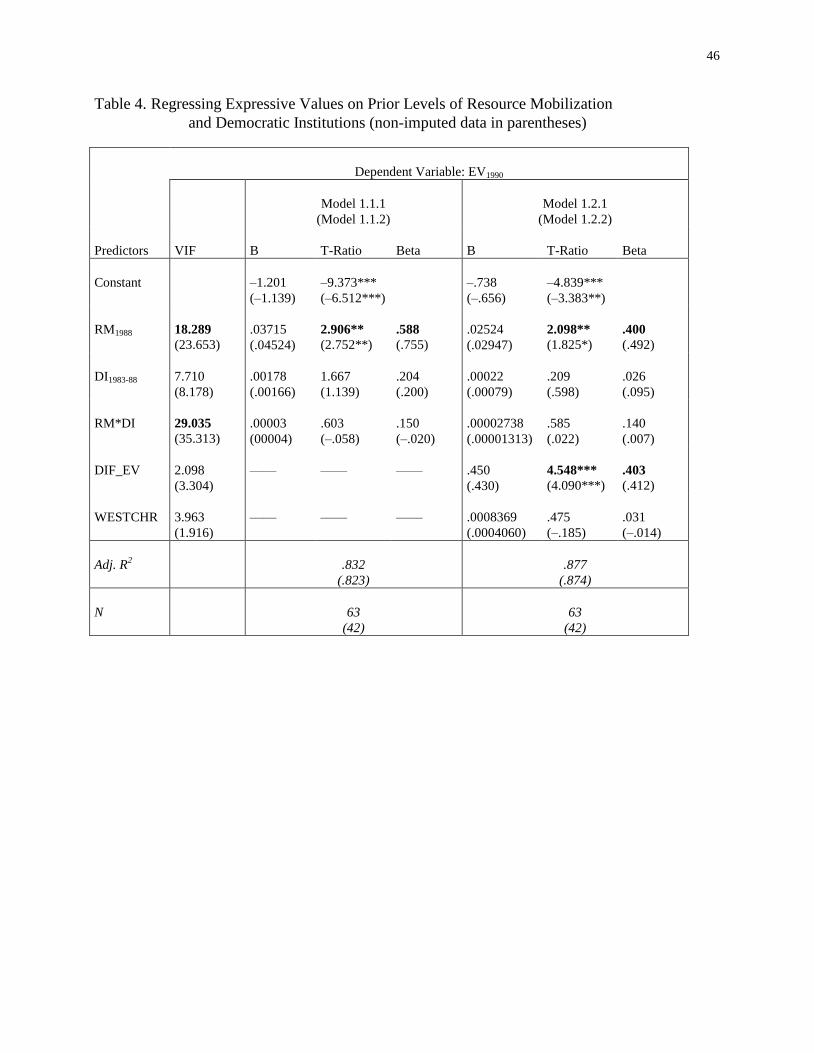
46
Table 4. Regressing Expressive Values on Prior Levels of Resource Mobilization
and Democratic Institutions (non-imputed data in parentheses)
Dependent Variable: EV1990
Model 1.1.1
(Model 1.1.2)
Model 1.2.1
(Model 1.2.2)
Predictors
VIF
B
T-Ratio
Beta
B
T-Ratio
Beta
Constant
–1.201
(–1.139)
–9.373***
(–6.512***)
–.738
(–.656)
–4.839***
(–3.383**)
RM1988
18.289
(23.653)
.03715
(.04524)
2.906**
(2.752**)
.588
(.755)
.02524
(.02947)
2.098**
(1.825*)
.400
(.492)
DI1983-88
7.710
(8.178)
.00178
(.00166)
1.667
(1.139)
.204
(.200)
.00022
(.00079)
.209
(.598)
.026
(.095)
RM*DI
29.035
(35.313)
.00003
(00004)
.603
(–.058)
.150
(–.020)
.00002738
(.00001313)
.585
(.022)
.140
(.007)
DIF_EV
2.098
(3.304)
——
——
——
.450
(.430)
4.548***
(4.090***)
.403
(.412)
WESTCHR
3.963
(1.916)
——
——
——
.0008369
(.0004060)
.475
(–.185)
.031
(–.014)
Adj. R2
.832
(.823)
.877
(.874)
N
63
(42)
63
(42)
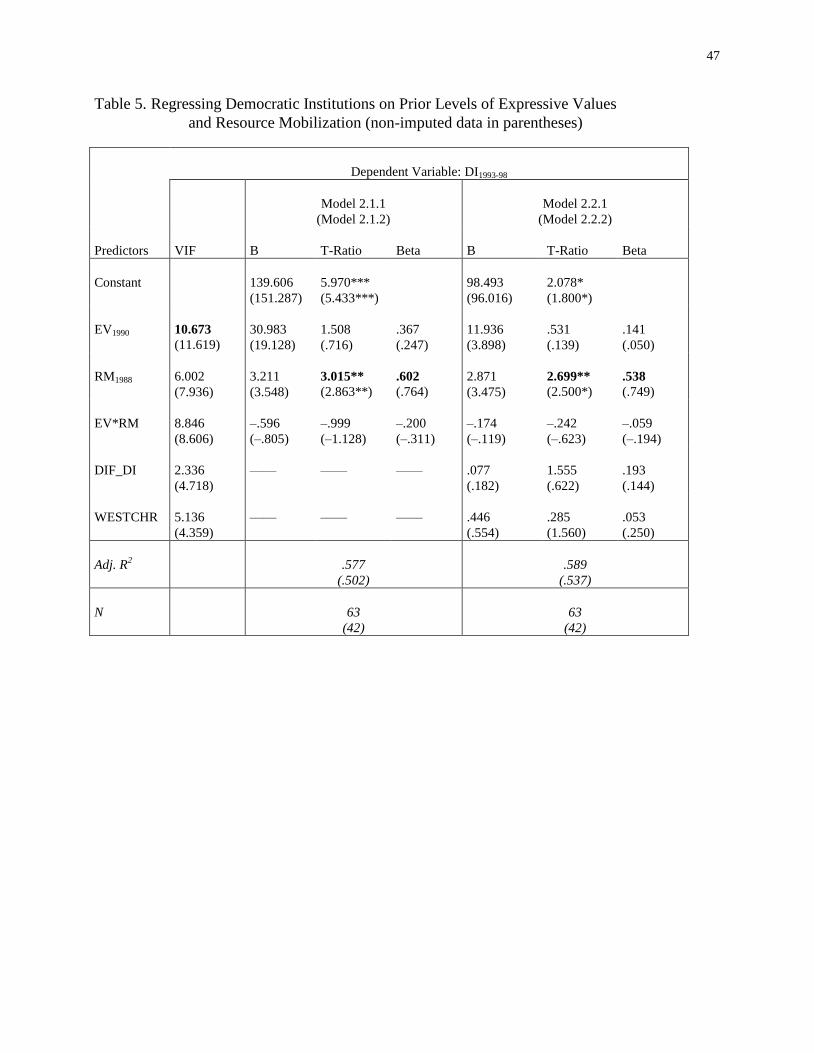
47
Table 5. Regressing Democratic Institutions on Prior Levels of Expressive Values
and Resource Mobilization (non-imputed data in parentheses)
Dependent Variable: DI1993-98
Model 2.1.1
(Model 2.1.2)
Model 2.2.1
(Model 2.2.2)
Predictors
VIF
B
T-Ratio
Beta
B
T-Ratio
Beta
Constant
139.606
(151.287)
5.970***
(5.433***)
98.493
(96.016)
2.078*
(1.800*)
EV1990
10.673
(11.619)
30.983
(19.128)
1.508
(.716)
.367
(.247)
11.936
(3.898)
.531
(.139)
.141
(.050)
RM1988
6.002
(7.936)
3.211
(3.548)
3.015**
(2.863**)
.602
(.764)
2.871
(3.475)
2.699**
(2.500*)
.538
(.749)
EV*RM
8.846
(8.606)
–.596
(–.805)
–.999
(–1.128)
–.200
(–.311)
–.174
(–.119)
–.242
(–.623)
–.059
(–.194)
DIF_DI
2.336
(4.718)
——
——
——
.077
(.182)
1.555
(.622)
.193
(.144)
WESTCHR
5.136
(4.359)
——
——
——
.446
(.554)
.285
(1.560)
.053
(.250)
Adj. R2
.577
(.502)
.589
(.537)
N
63
(42)
63
(42)
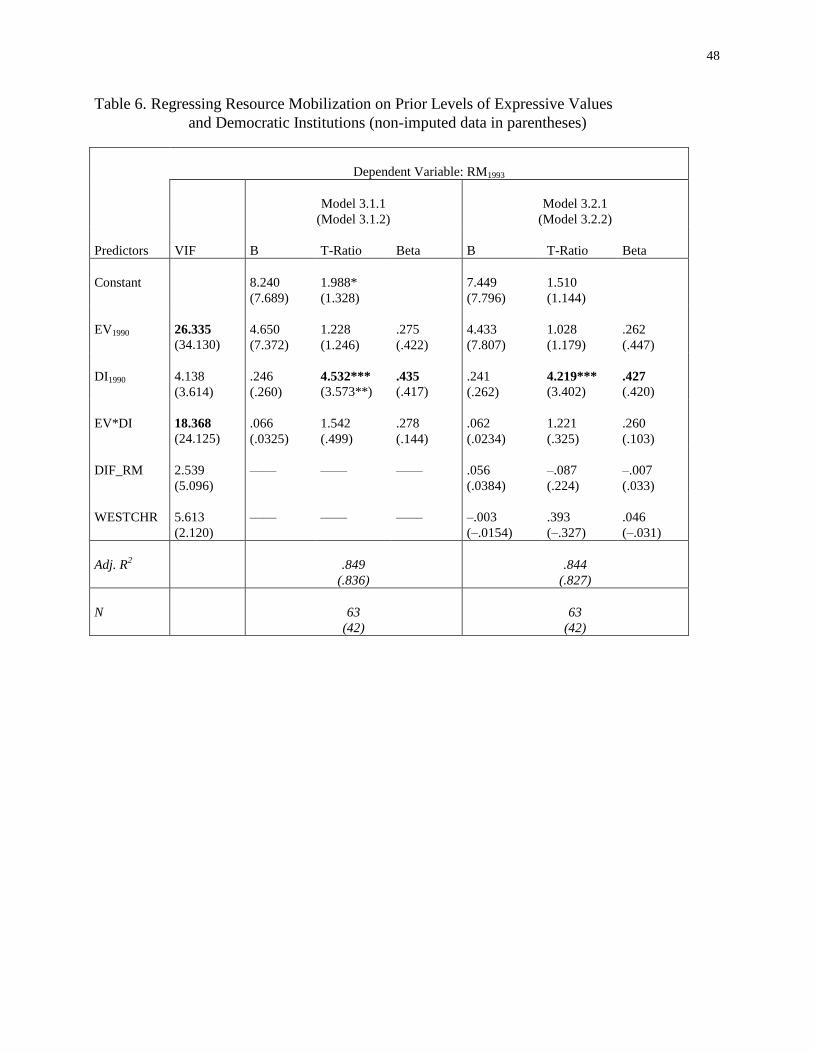
48
Table 6. Regressing Resource Mobilization on Prior Levels of Expressive Values
and Democratic Institutions (non-imputed data in parentheses)
Dependent Variable: RM1993
Model 3.1.1
(Model 3.1.2)
Model 3.2.1
(Model 3.2.2)
Predictors
VIF
B
T-Ratio
Beta
B
T-Ratio
Beta
Constant
8.240
(7.689)
1.988*
(1.328)
7.449
(7.796)
1.510
(1.144)
EV1990
26.335
(34.130)
4.650
(7.372)
1.228
(1.246)
.275
(.422)
4.433
(7.807)
1.028
(1.179)
.262
(.447)
DI1990
4.138
(3.614)
.246
(.260)
4.532***
(3.573**)
.435
(.417)
.241
(.262)
4.219***
(3.402)
.427
(.420)
EV*DI
18.368
(24.125)
.066
(.0325)
1.542
(.499)
.278
(.144)
.062
(.0234)
1.221
(.325)
.260
(.103)
DIF_RM
2.539
(5.096)
——
——
——
.056
(.0384)
–.087
(.224)
–.007
(.033)
WESTCHR
5.613
(2.120)
——
——
——
–.003
(–.0154)
.393
(–.327)
.046
(–.031)
Adj. R2
.849
(.836)
.844
(.827)
N
63
(42)
63
(42)
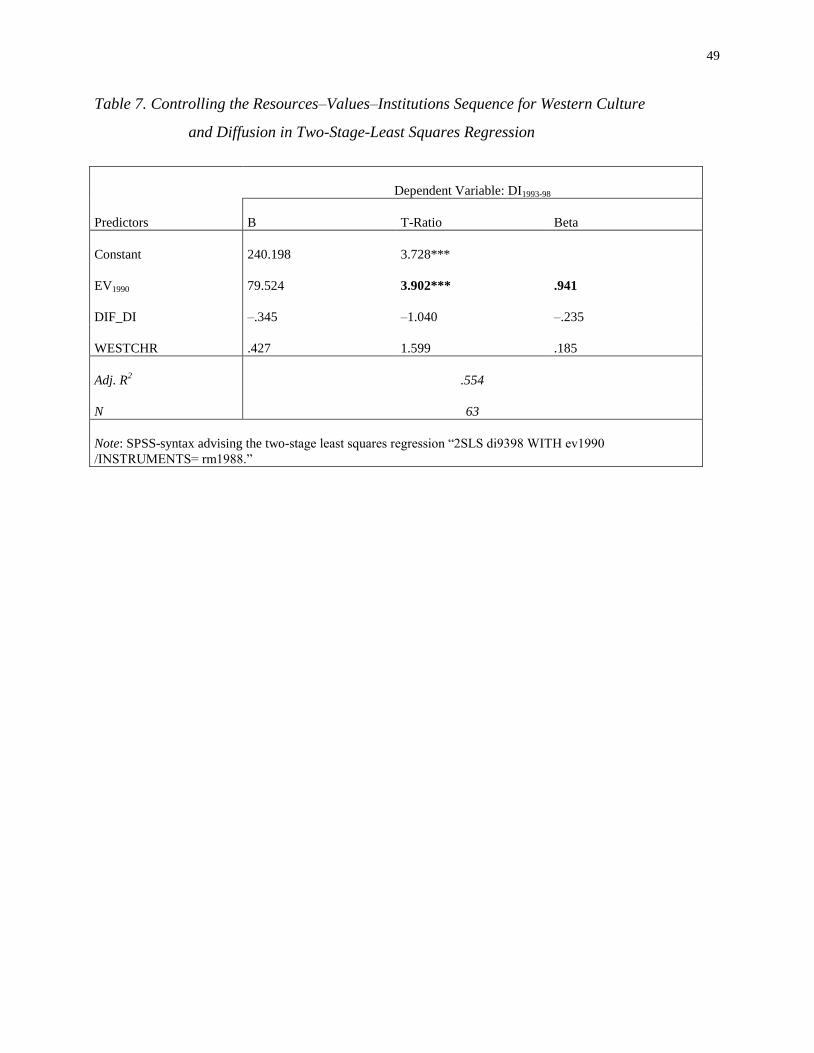
49
Table 7. Controlling the Resources–Values–Institutions Sequence for Western Culture
and Diffusion in Two-Stage-Least Squares Regression
Dependent Variable: DI1993-98
Predictors
B
T-Ratio
Beta
Constant
240.198
3.728***
EV1990
79.524
3.902***
.941
DIF_DI
–.345
–1.040
–.235
WESTCHR
.427
1.599
.185
Adj. R2
.554
N
63
Note: SPSS-syntax advising the two-stage least squares regression “2SLS di9398 WITH ev1990
/INSTRUMENTS= rm1988.”
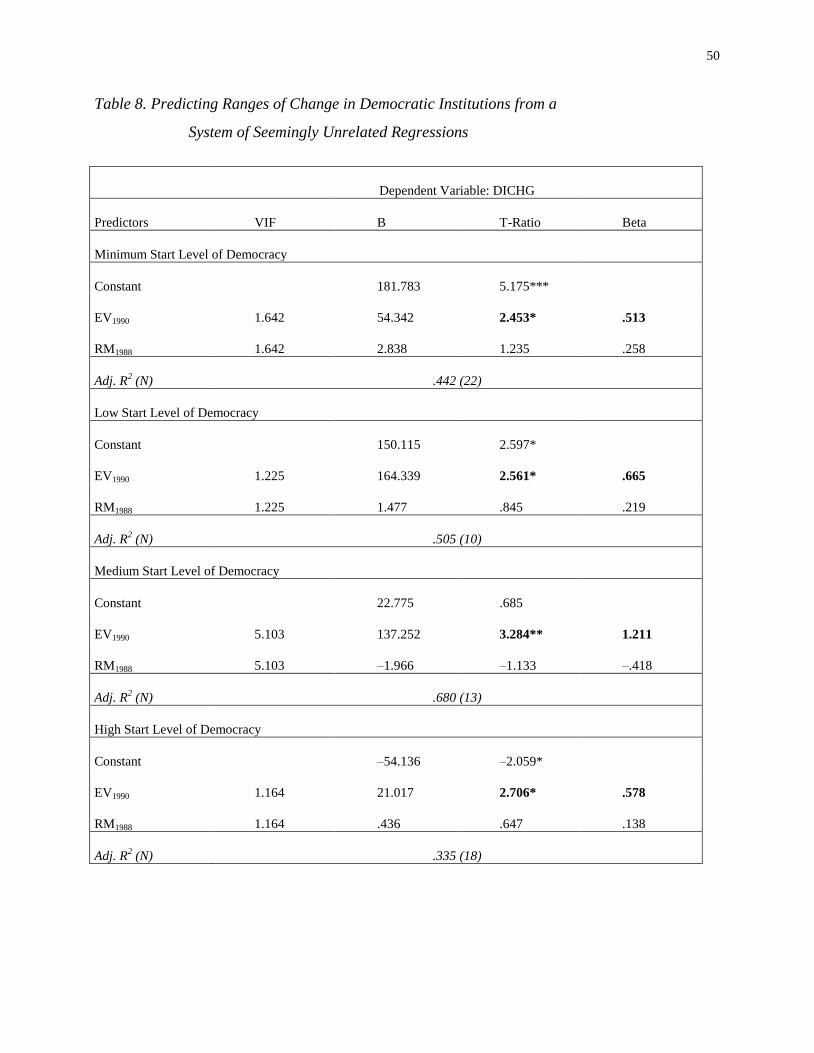
50
Table 8. Predicting Ranges of Change in Democratic Institutions from a
System of Seemingly Unrelated Regressions
Dependent Variable: DICHG
Predictors
VIF
B
T-Ratio
Beta
Minimum Start Level of Democracy
Constant
181.783
5.175***
EV1990
1.642
54.342
2.453*
.513
RM1988
1.642
2.838
1.235
.258
Adj. R2 (N)
.442 (22)
Low Start Level of Democracy
Constant
150.115
2.597*
EV1990
1.225
164.339
2.561*
.665
RM1988
1.225
1.477
.845
.219
Adj. R2 (N)
.505 (10)
Medium Start Level of Democracy
Constant
22.775
.685
EV1990
5.103
137.252
3.284**
1.211
RM1988
5.103
–1.966
–1.133
–.418
Adj. R2 (N)
.680 (13)
High Start Level of Democracy
Constant
–54.136
–2.059*
EV1990
1.164
21.017
2.706*
.578
RM1988
1.164
.436
.647
.138
Adj. R2 (N)
.335 (18)
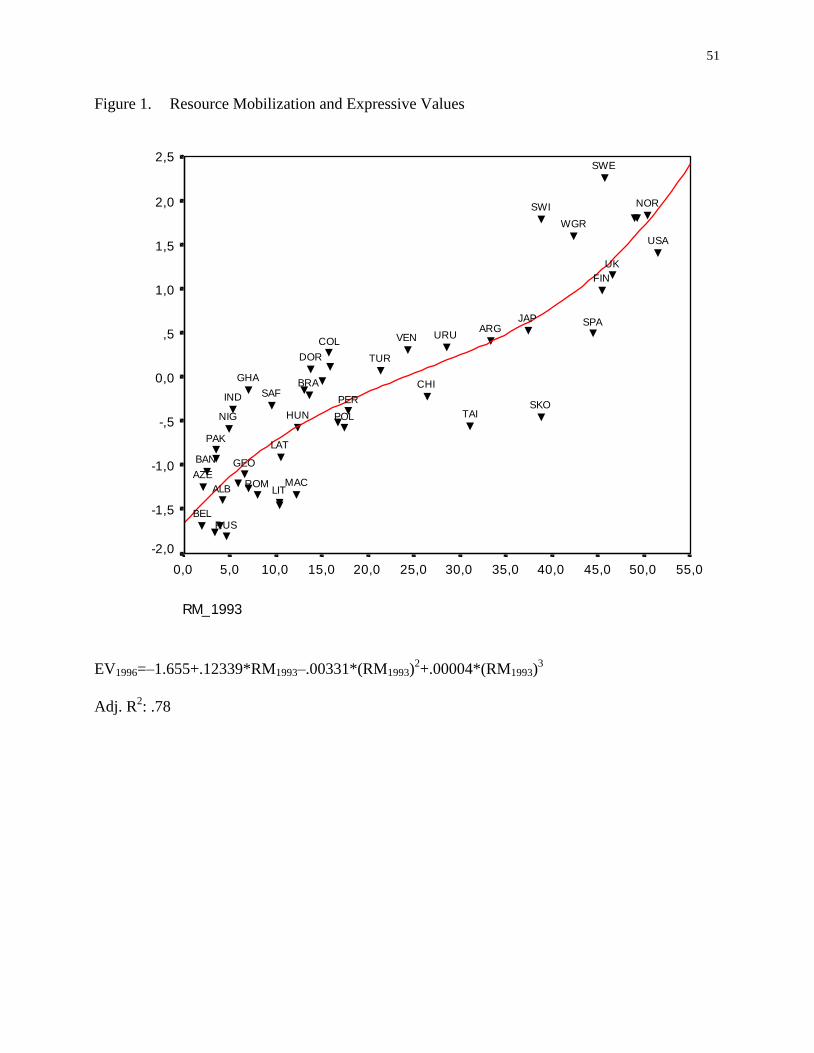
51
Figure 1. Resource Mobilization and Expressive Values
EV1996=–1.655+.12339*RM1993–.00331*(RM1993)2+.00004*(RM1993)
3
Adj. R2: .78
RM_1993
55,050,045,040,035,030,025,020,015,010,05,00,0
EV
_1996
2,5
2,0
1,5
1,0
,5
0,0
-,5
-1,0
-1,5
-2,0
MAC
COL
ALB
BAN
DOR
AZEGEO
GHA
URUVEN
PER
RUS
LAT
LIT
TUR
TAI
PAK
ROM
IND
BEL
CHI
NIG
BRA
SWI
POLSKO
FIN
ARG
SWE
NOR
HUN
SAF
JAP
USA
SPA
WGR
UK
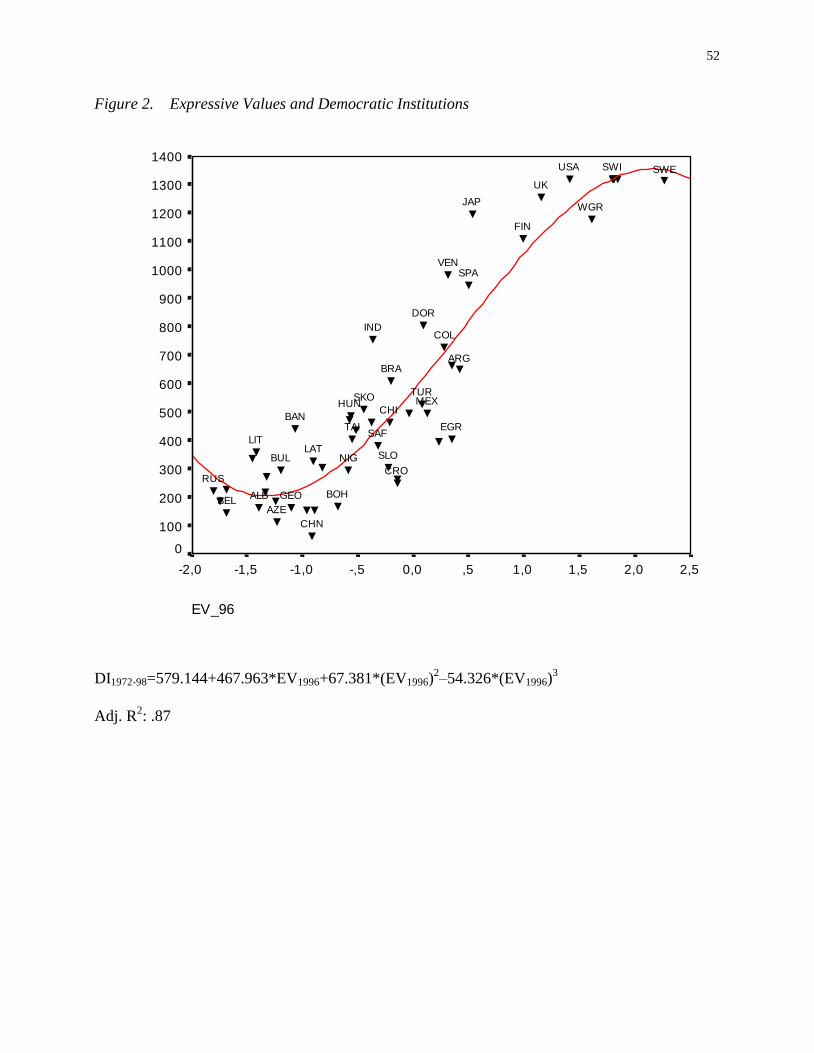
52
Figure 2. Expressive Values and Democratic Institutions
DI1972-98=579.144+467.963*EV1996+67.381*(EV1996)2–54.326*(EV1996)
3
Adj. R2: .87
EV_96
2,52,01,51,0,50,0-,5-1,0-1,5-2,0
DI_
72-9
8
1400
1300
1200
1100
1000
900
800
700
600
500
400
300
200
100
0
BOH
SLO
CRO
COL
ALB
BAN
DOR
AZE
GEO
VEN
RUS
LATLIT
TUR
TAI
CHN
BUL
EGR
IND
BEL
CHI
NIG
BRA
SWI
SKO
FIN
ARG
SWE
HUN
SAF
MEX
JAP
USA
SPA
WGR
UK
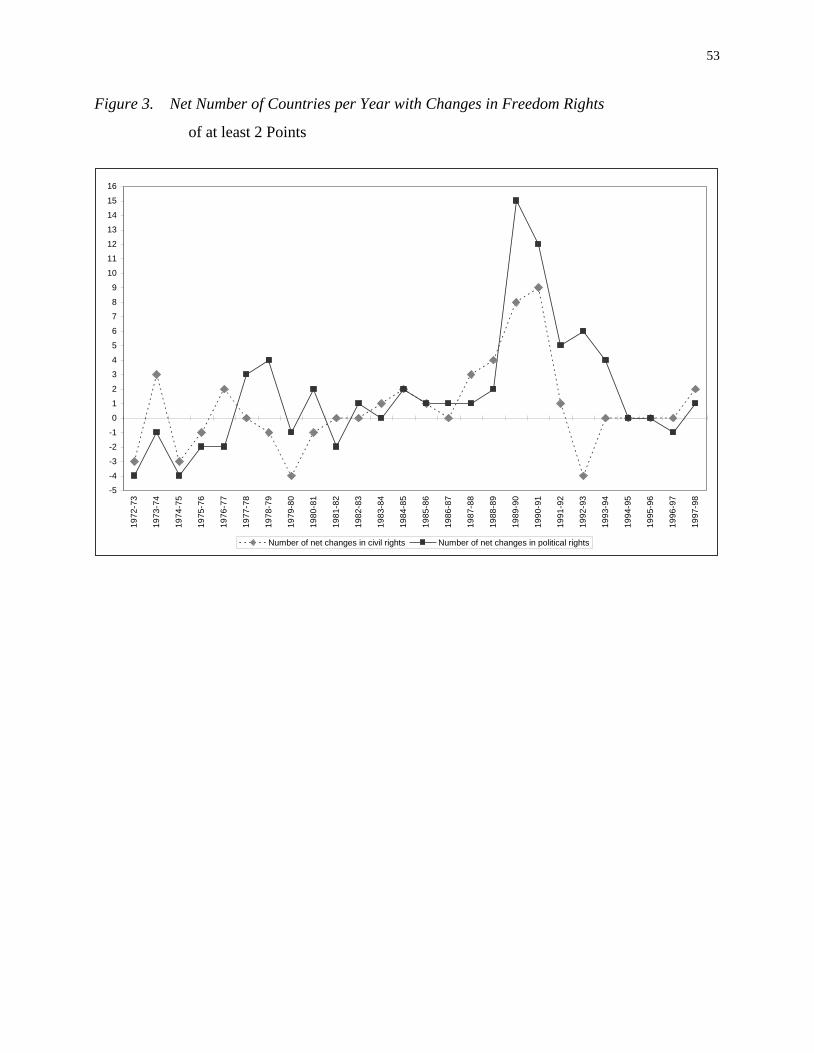
53
Figure 3. Net Number of Countries per Year with Changes in Freedom Rights
of at least 2 Points
-5
-4
-3
-2
-1
0
1
2
3
4
5
6
7
8
9
10
11
12
13
14
15
16
19
72
-73
19
73
-74
19
74
-75
19
75
-76
19
76
-77
19
77
-78
19
78
-79
19
79
-80
19
80
-81
19
81
-82
19
82
-83
19
83
-84
19
84
-85
19
85
-86
19
86
-87
19
87
-88
19
88
-89
19
89
-90
19
90
-91
19
91
-92
19
92
-93
19
93
-94
19
94
-95
19
95
-96
19
96
-97
19
97
-98
Number of net changes in civil rights Number of net changes in political rights
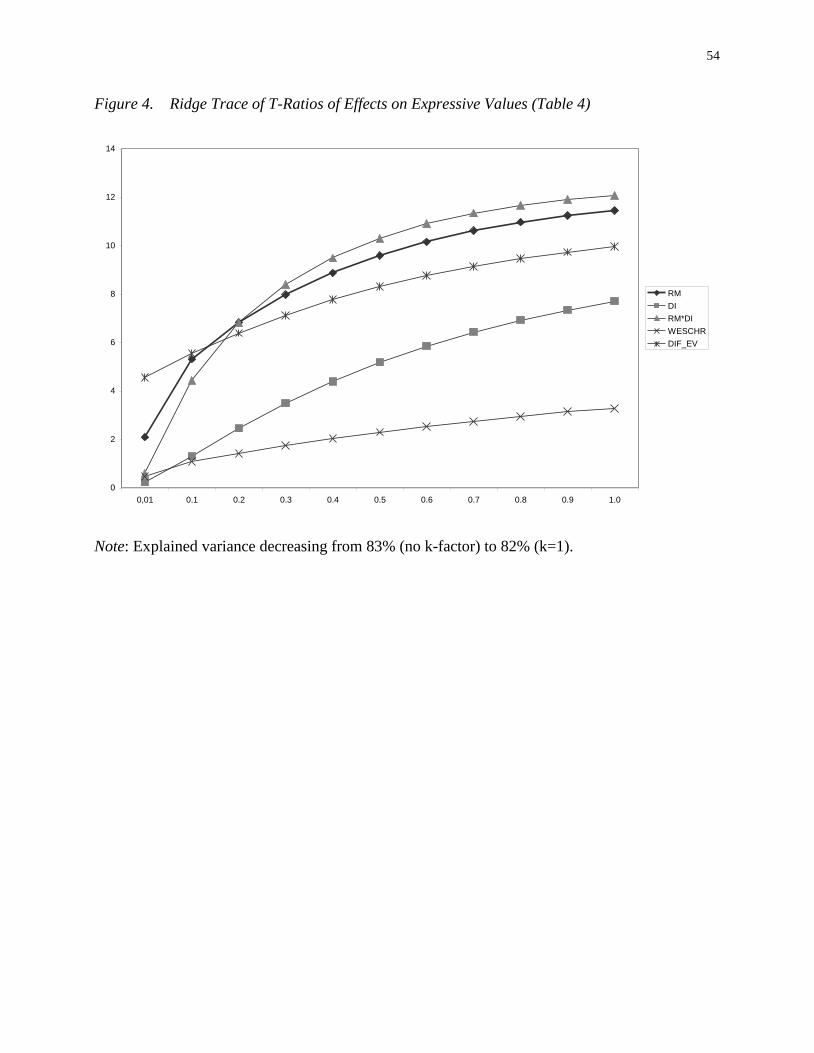
54
Figure 4. Ridge Trace of T-Ratios of Effects on Expressive Values (Table 4)
Note: Explained variance decreasing from 83% (no k-factor) to 82% (k=1).
0
2
4
6
8
10
12
14
0,01 0.1 0.2 0.3 0.4 0.5 0.6 0.7 0.8 0.9 1.0
RM
DI
RM*DI
WESCHR
DIF_EV
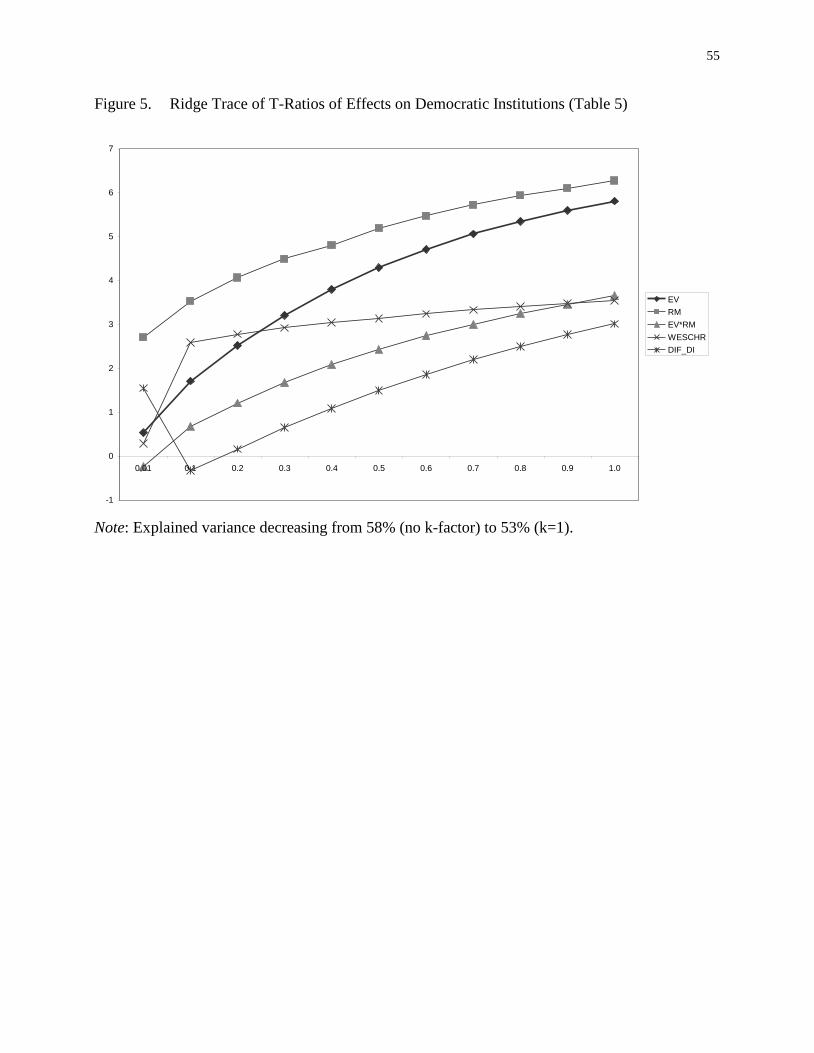
55
Figure 5. Ridge Trace of T-Ratios of Effects on Democratic Institutions (Table 5)
Note: Explained variance decreasing from 58% (no k-factor) to 53% (k=1).
-1
0
1
2
3
4
5
6
7
0,01 0.1 0.2 0.3 0.4 0.5 0.6 0.7 0.8 0.9 1.0
EV
RM
EV*RM
WESCHR
DIF_DI
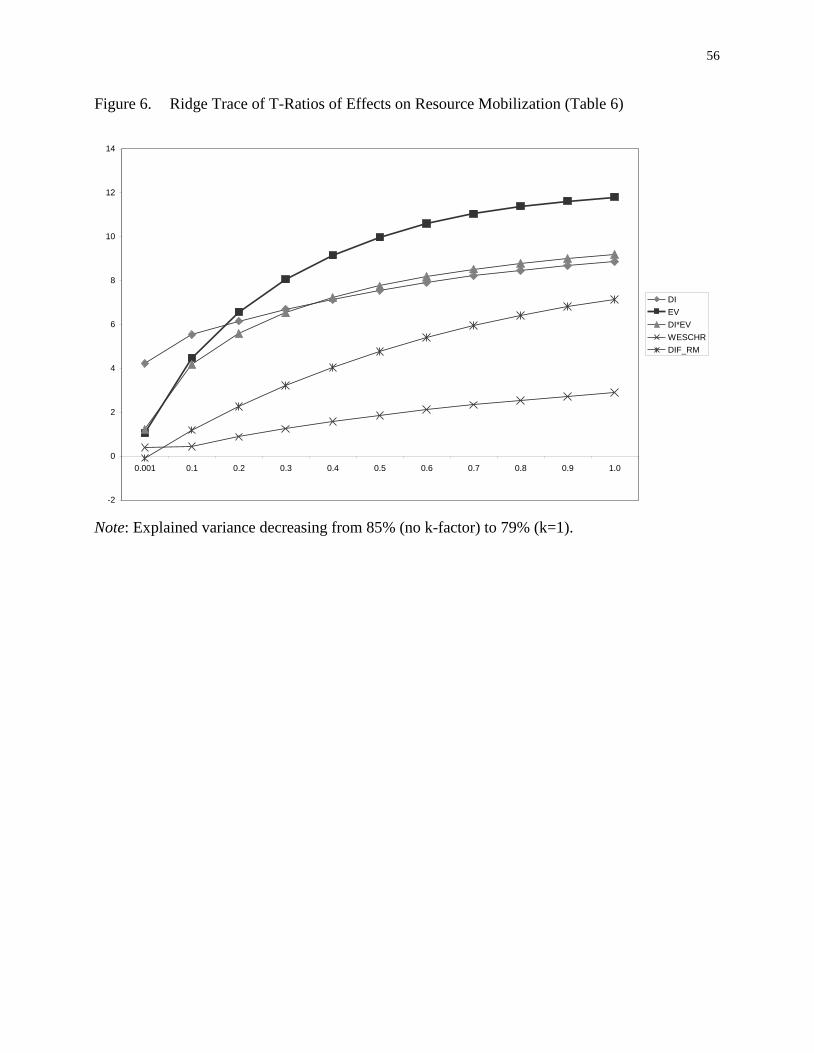
56
Figure 6. Ridge Trace of T-Ratios of Effects on Resource Mobilization (Table 6)
Note: Explained variance decreasing from 85% (no k-factor) to 79% (k=1).
-2
0
2
4
6
8
10
12
14
0.001 0.1 0.2 0.3 0.4 0.5 0.6 0.7 0.8 0.9 1.0
DI
EV
DI*EV
WESCHR
DIF_RM
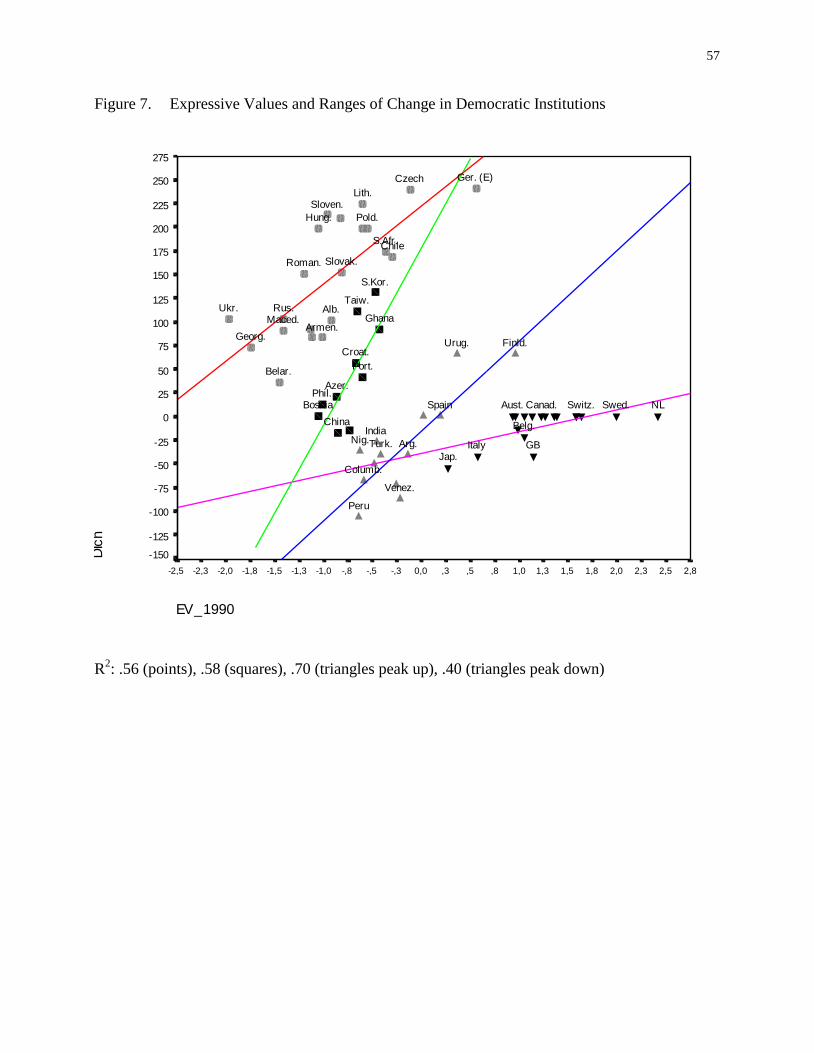
57
Figure 7. Expressive Values and Ranges of Change in Democratic Institutions
R2: .56 (points), .58 (squares), .70 (triangles peak up), .40 (triangles peak down)
EV_1990
2,82,52,32,01,81,51,31,0,8,5,30,0-,3-,5-,8-1,0-1,3-1,5-1,8-2,0-2,3-2,5
DIc
h
275
250
225
200
175
150
125
100
75
50
25
0
-25
-50
-75
-100
-125
-150
Jap.
Aust.
Belg.
Italy
Switz. Swed.Canad. NL
GBTurk.
IndiaNig.
Columb.
Urug.
Venez.
Peru
Arg.
Spain
Finld.
Azer.Phil.
Ghana
Taiw.
China
S.Kor.
Bosnia
Croat.
Port.
Georg.
S.Afr.
Armen.
Rus.Ukr.
Lith.
Belar.
Slovak.
Maced.Alb.
Roman.
Sloven.
Czech
Pold.Hung.
Chile
Ger. (E)