Embed Size (px)
Citation preview

HUMAN-COMPUTER INTERACTIONMEASURING IN HCI RESEARCH
Professor Bilge MutluComputer Sciences, Psychology, & Industrial and Systems Engineering
University of Wisconsin–Madison
CS/Psych-770 Human-Computer Interaction

LAST WEEK
REVIEW
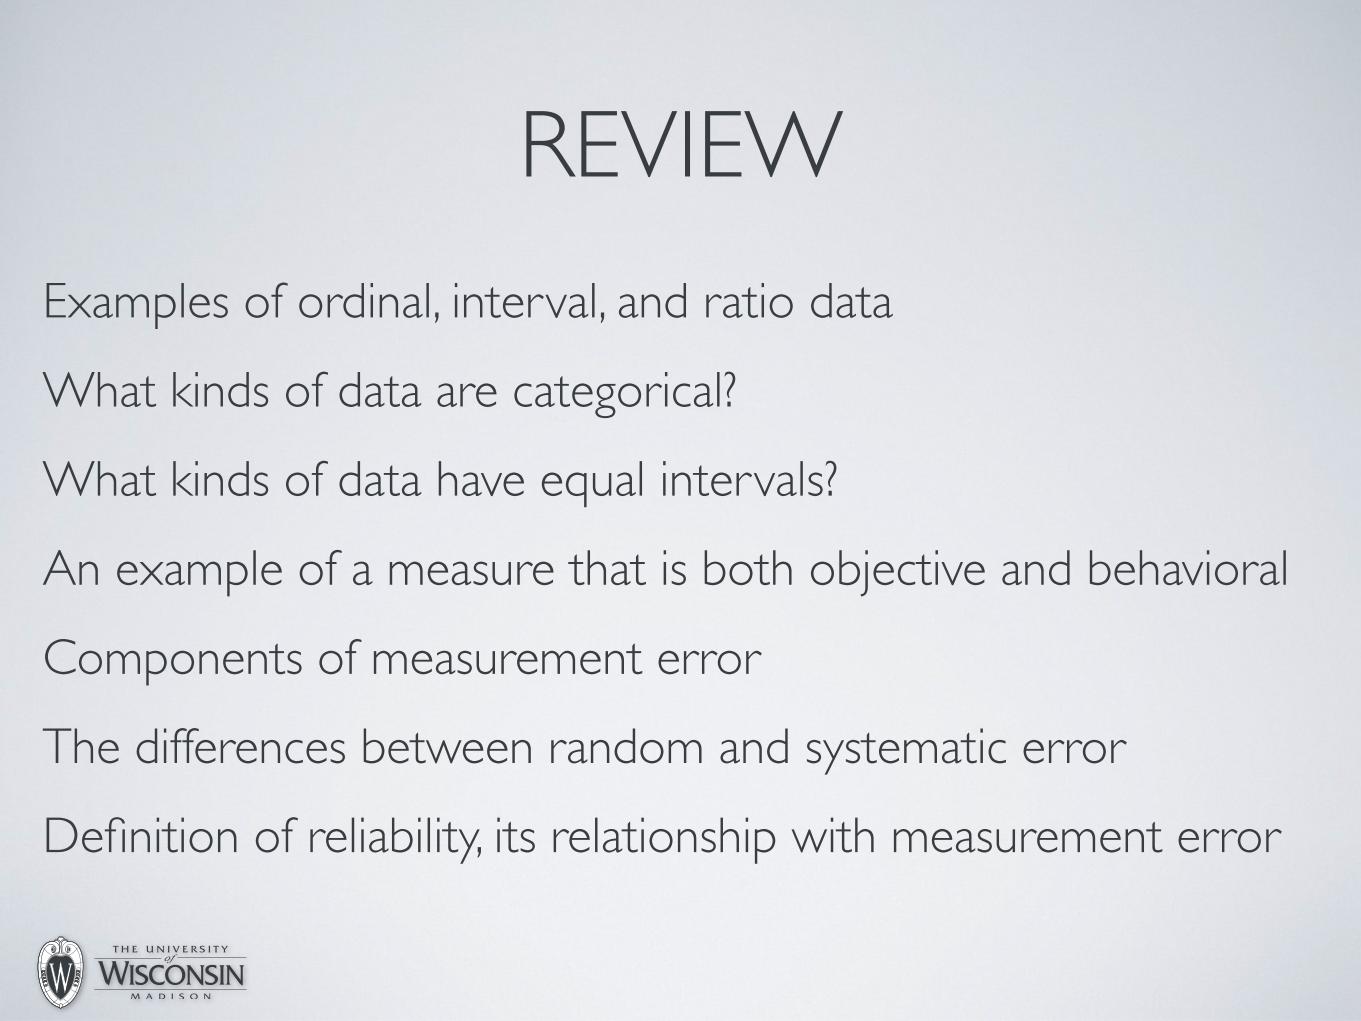
Examples of ordinal, interval, and ratio data
What kinds of data are categorical?
What kinds of data have equal intervals?
An example of a measure that is both objective and behavioral
Components of measurement error
The differences between random and systematic error
Definition of reliability, its relationship with measurement error
REVIEW
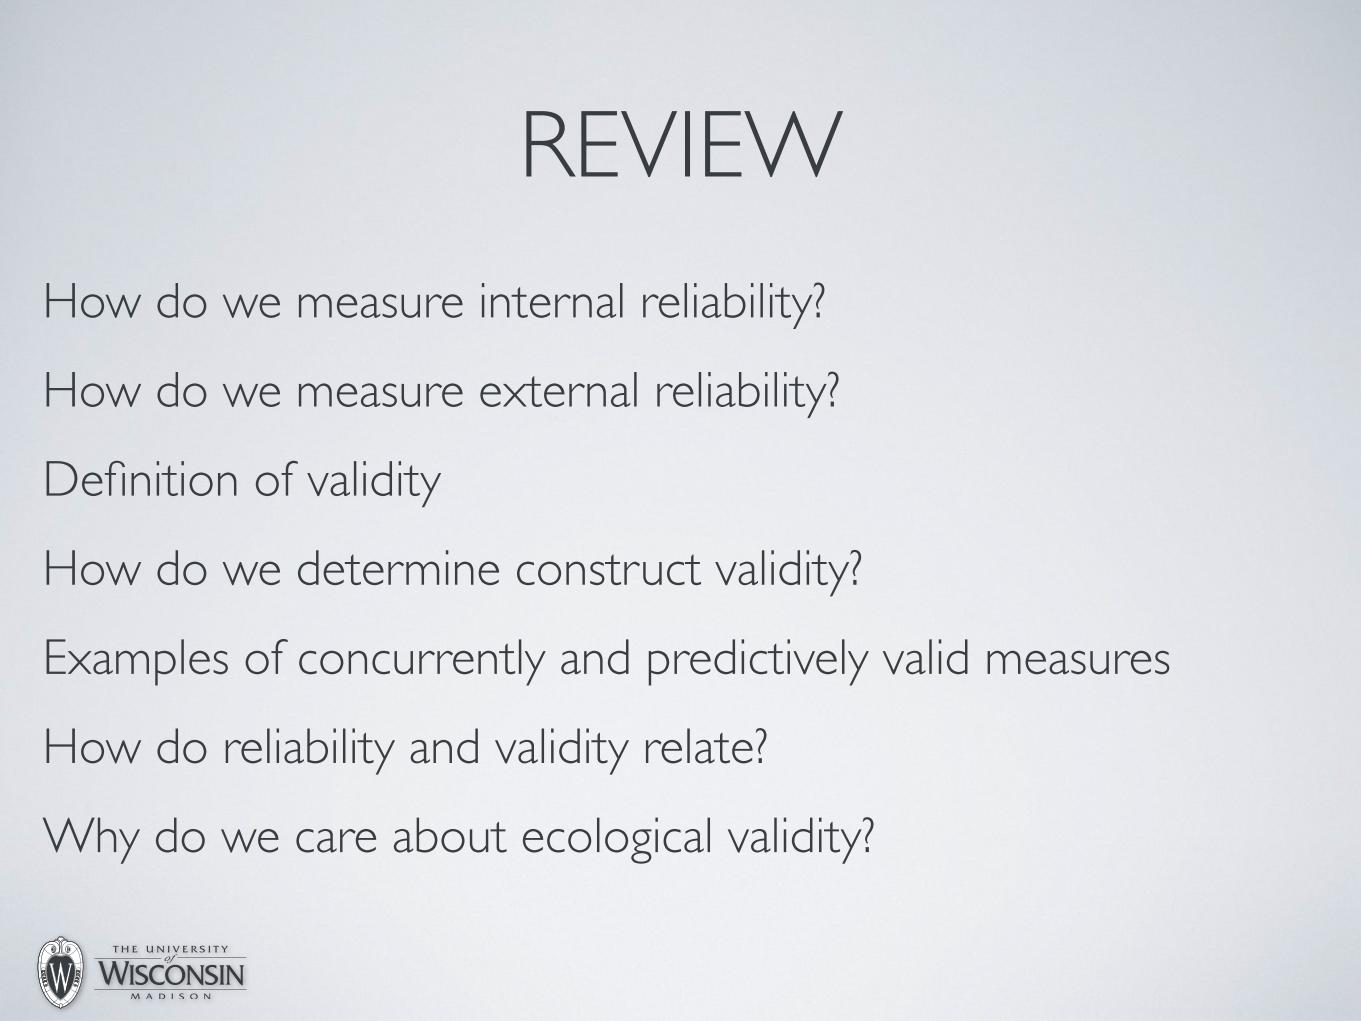
How do we measure internal reliability?
How do we measure external reliability?
Definition of validity
How do we determine construct validity?
Examples of concurrently and predictively valid measures
How do reliability and validity relate?
Why do we care about ecological validity?

OBJECTIVE MEASURES
OBJECTIVE MEASURES
Measurements of variables that can be determined objectively, through direct observation
E.g., recall performance, response time
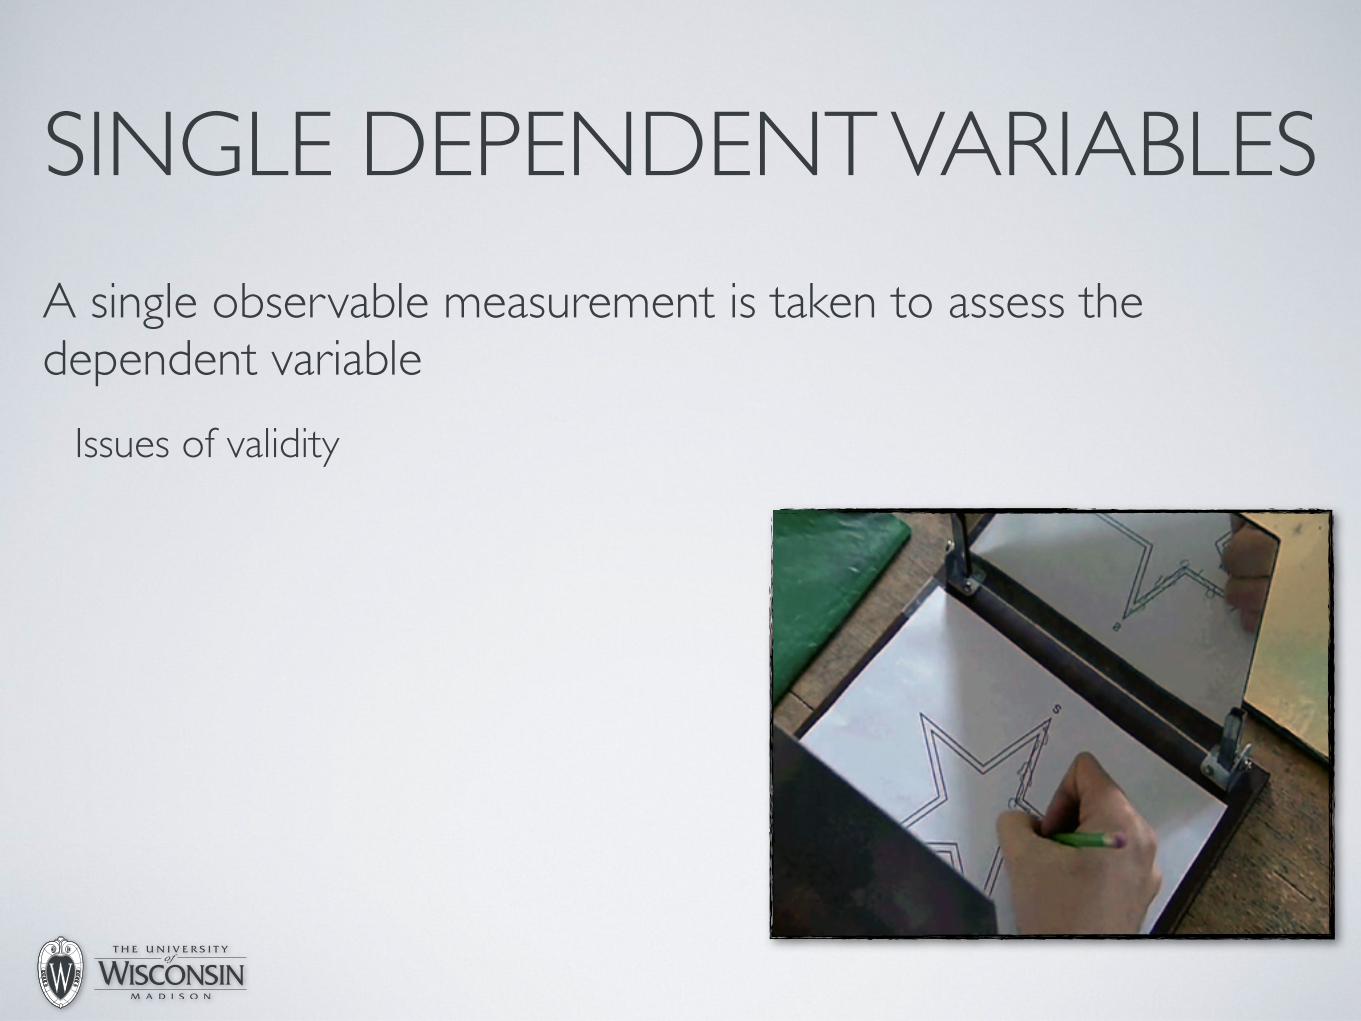
SINGLE DEPENDENT VARIABLES
A single observable measurement is taken to assess the dependent variable
Issues of validity
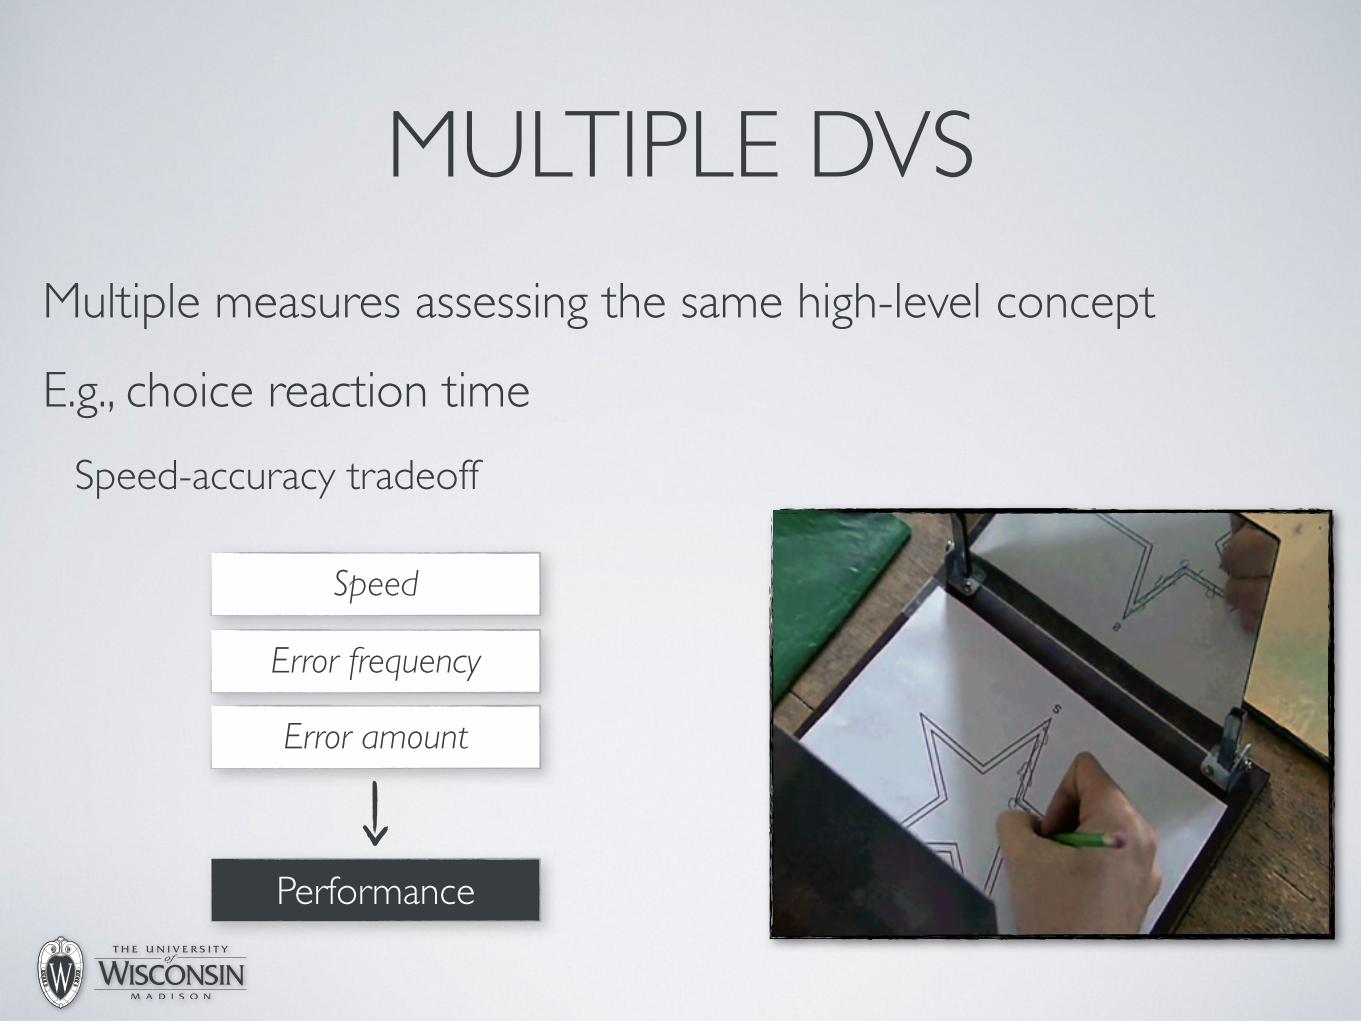
Multiple measures assessing the same high-level concept
E.g., choice reaction time
Speed-accuracy tradeoff
MULTIPLE DVS
Speed
Error frequency
Error amount
Performance
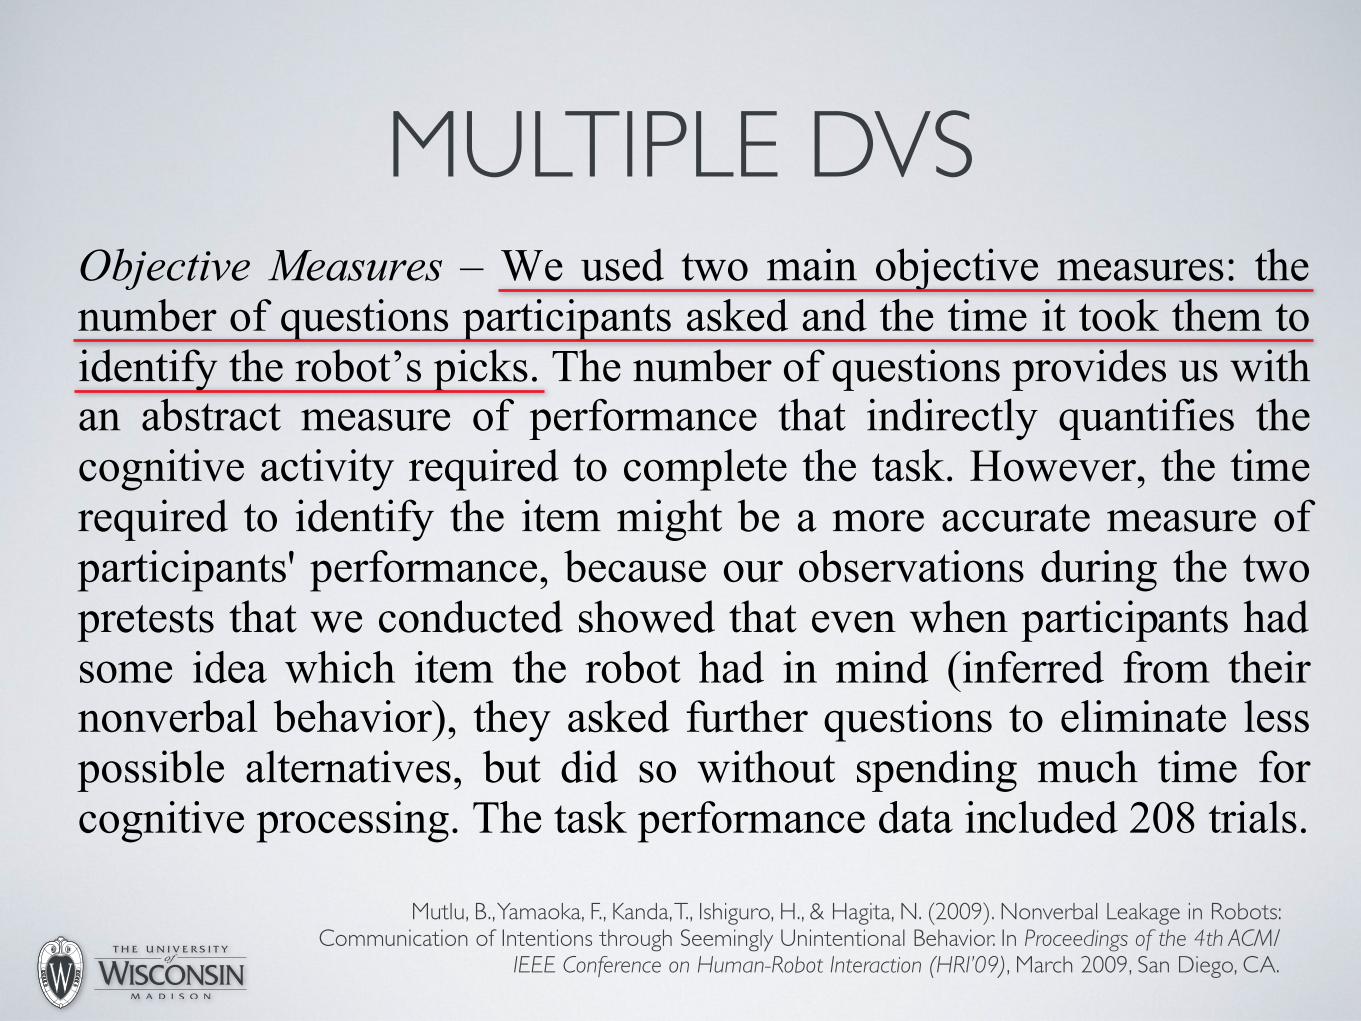
MULTIPLE DVS
Mutlu, B., Yamaoka, F., Kanda, T., Ishiguro, H., & Hagita, N. (2009). Nonverbal Leakage in Robots: Communication of Intentions through Seemingly Unintentional Behavior. In Proceedings of the 4th ACM/
IEEE Conference on Human-Robot Interaction (HRI’09), March 2009, San Diego, CA.
4. RESULTS
We analyzed objective measures using a mixed-effects analysis of variance (ANOVA). We included in the model participant and trial IDs as random effects and measured and manipulated independent variables (participant gender, pet ownership, and the robot with which participants interacted) as fixed effects. We analyzed subjective measures using a fixed-effects analysis of variance. We did the manipulation check using a contingency analysis. We also conducted correlation analyses to understand how subjective and objective measures correlated with each other.
Objective Measures – We used two main objective measures: the number of questions participants asked and the time it took them to identify the robot’s picks. The number of questions provides us with an abstract measure of performance that indirectly quantifies the cognitive activity required to complete the task. However, the time required to identify the item might be a more accurate measure of participants' performance, because our observations during the two pretests that we conducted showed that even when participants had some idea which item the robot had in mind (inferred from their nonverbal behavior), they asked further questions to eliminate less possible alternatives, but did so without spending much time for cognitive processing. The task performance data included 208 trials. Two of these trials were excluded due to operator error. We also carefully studied the distributions and excluded 2 and 13 outliers that lied above 1.5 interquartile ranges (1.5!IQR) beyond the third quartile (Q3) in the number of questions participants asked and the
time it took participants to identify the item respectively. The resulting performance data included 200 and 193 trials for the former and latter performance measures respectively.
Our first hypothesis predicted that participants would perform significantly better in identifying the item when the robots produced the gaze cue than when they did not. Analyses of variance of both performance measures supported this hypothesis. Participants asked significantly fewer questions (F[1,164]=4.30, p=0.04) and took significantly less time (F[1,150]=5.49, p=0.02) to identify the robots’ picks when the robots produced the gaze cue than when they did not do so (Figures 5.a and 5.b).
Our second hypothesis predicted that the gaze cue would affect participant performance with Geminoid but not with Robovie. Our analysis of the second performance measure provided support for this hypothesis. Participants identified the item significantly faster in the presence of the gaze cue when they played the game with Geminoid (F[1,149]=3.93, p=0.05), but their performance was not significantly affected by the gaze cue when they played the game with Robovie (F[1,151]=1.75, p=ns), as shown in Figure 5.c. On the other hand, a contingency analysis for the manipulation check (whether or not participants reported identifying the gaze cue and using this information to correctly guess the robots’ picks) showed that significantly fewer participants reported identifying the gaze cue in Geminoid’s behavior than in Robovie’s ("2(1,26)=7.54, p<.01), as shown in Figure 5.d. Furthermore, our analysis showed that those who reported identifying the gaze cue did not differ in performance from those who did not report identifying the gaze cue (F(1,22)=1.68, p=ns). These findings are further supported by our qualitative data; several participants reported in the semi-structured interviews that they identified Robovie’s gaze cues but did not attribute intentionality to the cue, which might explain why the gaze cue did not significantly affect their performance with Robovie. This explanation is further considered in the Discussion section.
Our analysis also showed that participants generally identified the item significantly faster with Robovie than with Geminoid (F[1,23]=8.11, p<0.01) as shown in Figure 5.c. This effect was present both when the robots produced the gaze cue (F[1,46]=4.36, p=0.04) and when they did not (F[1,46]=7.06, p=0.01). We discuss alternative explanations of this result in the Discussion section.
Our analysis found no effect of gender on how the gaze cue affected participants’ performance but found a significant interaction between pet ownership and how the gaze cue affected the it took participants to identify the robots‘ picks (F[1,174]=5.53, p=0.02). Those who owned pets identified the robots’ picks using significantly fewer questions (F[1,173]=9.46, p<0.01) and in a
Figure 4. Participants in the experiment interacting with Robovie (top) and with Geminoid (bottom).
Figure 5. Results on objective measures: (a) Number of questions that participants asked to identify the item with and without gaze cue, (b) the time it took participants to identify the item with and without gaze cue, (c) the time it took participants to identify the item with and without the gaze cue
for the two robots, (d) whether or not participants reported identifying the gaze cue for the two robots, and (e) the time it took pet owners and others to identify the item with and without gaze cues. Lower ratings represent better task performance. (*) denotes statistically significant probabilities.

COMPOSITE DVSCombining single DVs into a composite DV
E.g., intelligence testing
Two DVs: Verbal and performance
Performance is a composite of multiple single DVs:
General information
Digit span
Vocabulary
Arithmetic
Comprehension
Similarities

QUESTIONS?
BEHAVIORAL MEASURES
BEHAVIORAL MEASURES
Not all behavioral measures are inherently objective
Methods exist to ensure objectivity
E.e., inter-coder reliability
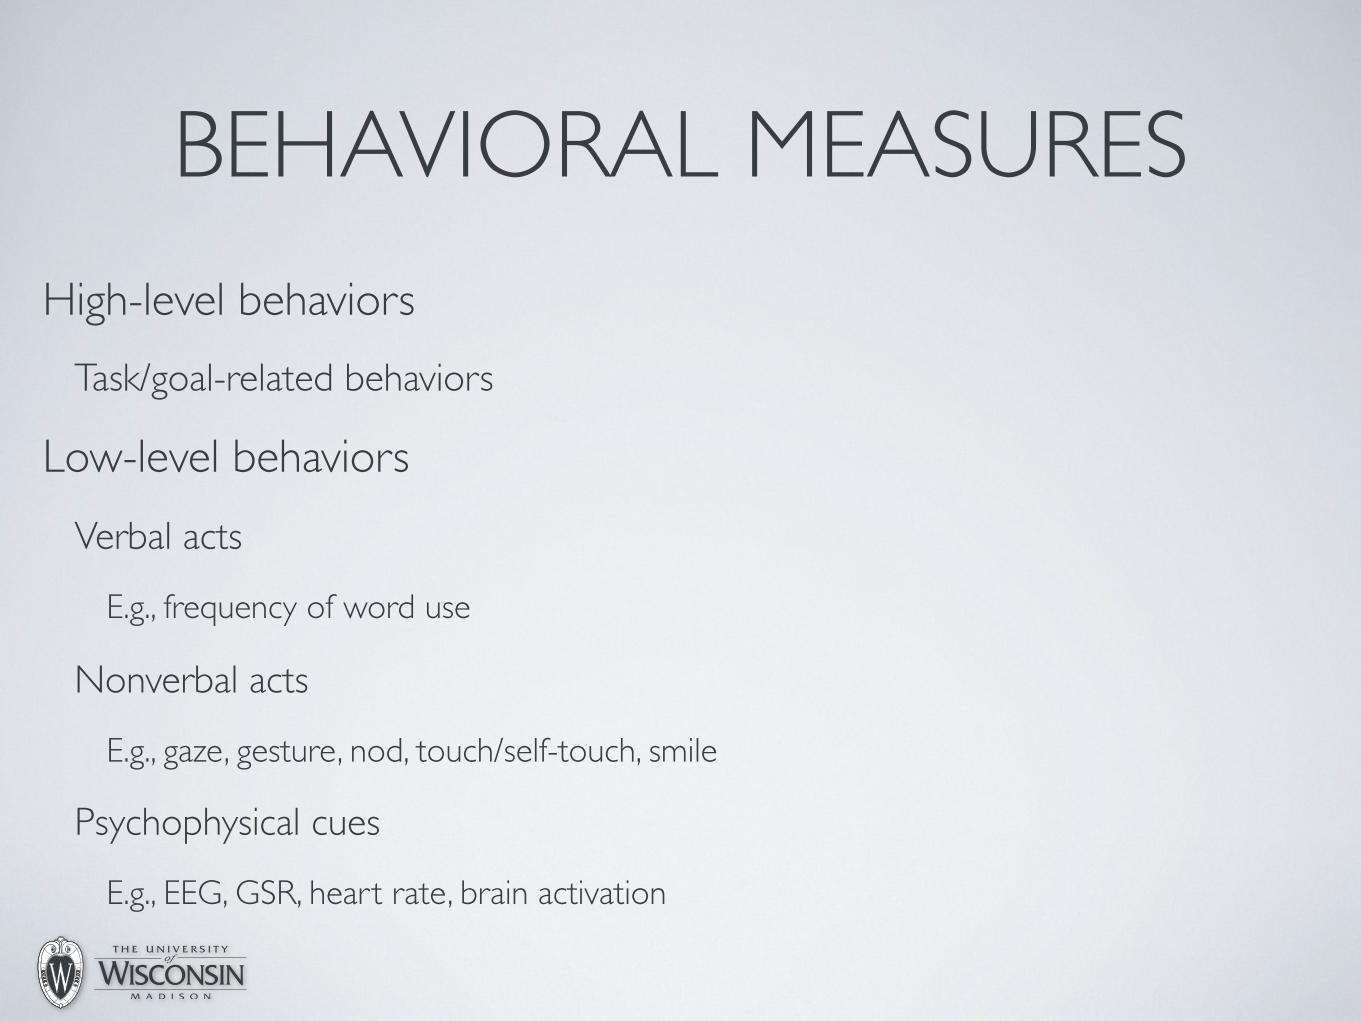
BEHAVIORAL MEASURES
High-level behaviors
Task/goal-related behaviors
Low-level behaviors
Verbal acts
E.g., frequency of word use
Nonverbal acts
E.g., gaze, gesture, nod, touch/self-touch, smile
Psychophysical cues
E.g., EEG, GSR, heart rate, brain activation
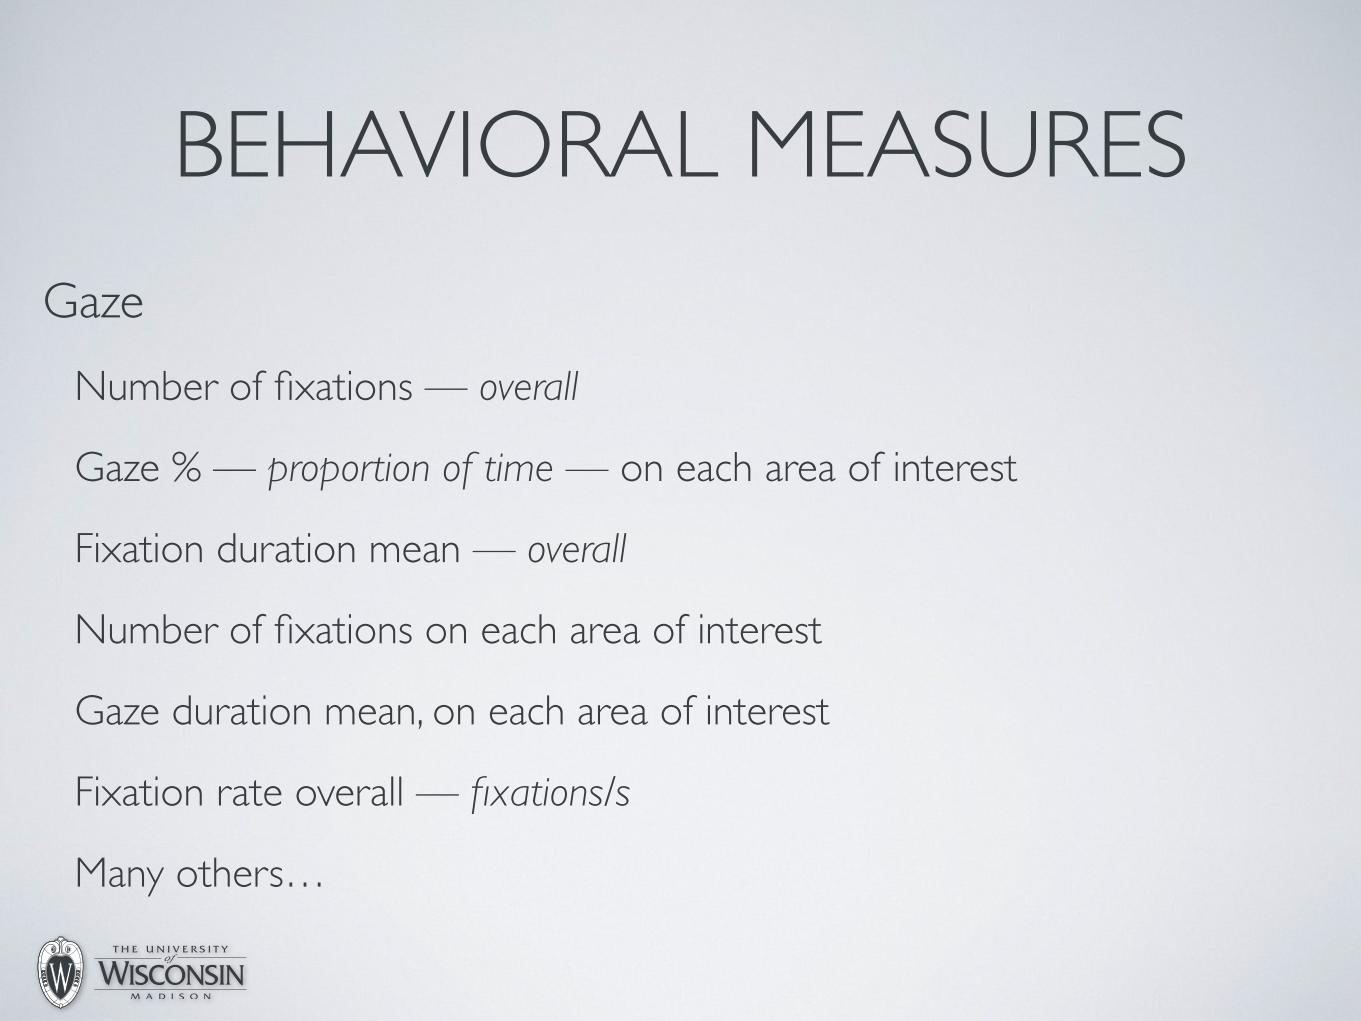
BEHAVIORAL MEASURES
Gaze
Number of fixations — overall
Gaze % — proportion of time — on each area of interest
Fixation duration mean — overall
Number of fixations on each area of interest
Gaze duration mean, on each area of interest
Fixation rate overall — fixations/s
Many others…

BAD NEWS
Difficult to ensure objectivity and reliability

GOOD NEWS
lation at the 1-minute slice length (r = .41). The top half of Table 2summarizes these results.
Slice(s) removed from the 15-minute interaction correlations. Thesecorrelations were calculated as the correlation between a given slicelength behavior total and the 15-minute behavior total with the slicelength behavior subtracted out. This calculation was based on a part-whole correlation formula (Cohen & Cohen, 1983).3 The bottom half ofTable 2 summarizes these results. As shown in Table 2, the part-wholecorrelations between 1-minute slices and the 15-minute interaction for
TABLE 2
Correlations Between Randomly Selected Slices of Coded Behavior and15 Minutes of Coded Behavior
Behavior 1-minute slice Two 1-minute slices Three 1-minute slices
Slice(s) contained in 15-minute interactionGaze .73** .81** .91**Gesture .95** .91** .92**Nod .79** .75** .69**Self-touch .41 .76** .83**Smile .62* .68* .76**
Mean r .79 .80 .84
Slice(s) removed from 15-minute interactionGaze .64* .72** .85**Gesture .93** .80** .77**Nod .70** .60* .37Self-touch .32 .68** .73**Smile .52* .52* .56*
Mean r .68 .67 .68
Note: All ns = 15, except gaze n = 13. Two 1-minute represents the sum of behavior fortwo randomly selected 1-minute slices from the full 15-minute interaction. Three 1-minuterepresents the sum of behavior for three randomly selected 1-min slices from the full 15-minuteinteraction. Slice(s) removed from 15-minute interaction refers to a part-whole correlationbetween (J) and (W – J), where (J) = given slice length behavior total and (W) = the sum ofbehavior in the 15-minute interaction including J. Slice(s) contained in 15-minute interactionrefers to a correlation between (J) and (W). Mean r s are weighted.
*p £ .05. **p £ .01.
242
JOURNAL OF NONVERBAL BEHAVIOR
Murphy, N.A. (2005). Using thin slices for behavioral coding. Journal of Nonverbal Behavior, 29(4), 235-246.

QUESTIONS?

SUBJECTIVE MEASURES
SUBJECTIVE MEASURES
Surveys
Administered by researcher
Structured interview — researcher-administered survey
Administered by respondent
Questionnaire — self-administered survey
Self-reported, subjective answers to questions

TYPES OF QUESTIONS
Factual questions — characteristics, frequency of behaviors
Subjective questions — attitudes
Screening questions — testing eligibility
Manipulation checks
Multiple questions for complex phenomena

WHICH ONE TO USE
Interviews
Effective way of getting people to respond
Ability to probe and follow-up
Capture multiple sources of data
Rapport building for sensitive issues
Questionnaires
Sample a larger population
Ask multiple questions efficiently
Comparatively low cost
Provide quantifiable results
Allow sampling from a population
Minimize social desirability
Allow standardization across respondents
Facilitate data management
DESIGN IS KEY
Physical format
E.g., booklet is preferred, print vertical on one side
Question ordering
E.g, cognitive effects, researcher-participant conversation
Page layout
E.g, group similar items, consistent fonts and response categories
Pre-testing
E.g., pilot interviews, think-alouds

SURVEY BIAS
Sampling
Survey only some, and not all, people in the population
Coverage
Every person in population does not have an equal chance of selection
Measurement
Question wording or ordering obstructs interpretation
Non-response
People who respond differ from those who do not respond

THANKS!Professor Bilge Mutlu
Computer Sciences, Psychology, & Industrial and Systems EngineeringUniversity of Wisconsin–Madison
CS/Psych-770 Human-Computer Interaction