Embed Size (px)
Citation preview

Policy Research Working Paper 8650
Human Capital and Macro-Economic Development
A Review of the Evidence
Federico Rossi
Human Development Global Practice November 2018
WPS8650P
ublic
Dis
clos
ure
Aut
horiz
edP
ublic
Dis
clos
ure
Aut
horiz
edP
ublic
Dis
clos
ure
Aut
horiz
edP
ublic
Dis
clos
ure
Aut
horiz
ed

Produced by the Research Support Team
Abstract
The Policy Research Working Paper Series disseminates the findings of work in progress to encourage the exchange of ideas about development issues. An objective of the series is to get the findings out quickly, even if the presentations are less than fully polished. The papers carry the names of the authors and should be cited accordingly. The findings, interpretations, and conclusions expressed in this paper are entirely those of the authors. They do not necessarily represent the views of the International Bank for Reconstruction and Development/World Bank and its affiliated organizations, or those of the Executive Directors of the World Bank or the governments they represent.
Policy Research Working Paper 8650
This paper reviews the evidence on the importance of human capital for macro-economic development. Through the lens of a simple aggregate production function, human capital might increase output per capita by directly entering in the production process, incentivising the accumulation of complementary inputs and facilitating the adoption of new technologies. The paper discusses the advantages and limitations of three methodological approaches that have been used to evaluate the importance of these channels:
cross-country regressions, development accounting and quantitative models. The key findings in the literature are reviewed, and some of them are replicated using updated data. The bulk of the evidence suggests that human capital is an important determinant of cross-country income gaps, especially when its measurement is broadened to go beyond simple proxies of educational attainment. The paper con-cludes by highlighting promising avenues for future work.
This paper is a product of the Human Development Global Practice. It is part of a larger effort by the World Bank to provide open access to its research and make a contribution to development policy discussions around the world. Policy Research Working Papers are also posted on the Web at http://www.worldbank.org/research. The author may be contacted at [email protected].
Human Capital and Macro-EconomicDevelopment: A Review of the Evidence∗
Federico Rossi†
∗This paper was written while I was a Short-Term Consultant to the Human Development Practice Groupat the World Bank. It is part of a larger effort by the World Bank to provide open access to its researchand make a contribution to development policy discussions around the world. Policy Research Working Pa-pers are also posted on the Web at http://www.worldbank.org/research. The author may be contacted at [email protected]. The author is grateful to Ciro Avitabile, Roberta Gatti and Aart Kraay for usefulcomments and suggestions.†University of Warwick and Johns Hopkins University - SAIS. Corresponding address: University of War-
wick, Department of Economics, Coventry, CV4 7AL, UK.

1 Introduction
Does human capital contribute to economic development? If so, how much? And throughwhich channels? Different declinations of these questions have played a central role in themacro-development literature of the last few decades.
Credible answers are needed to inform several policy debates. At a broad level, thedegree to which gaps in human capital, as opposed to other factors of production and tech-nology, explain cross-country differences in income per capita is informative on the extent towhich growth-promoting policies should focus on education and skills formation. Moreover,understanding which dimensions of human capital are particularly lacking in developingcountries and why is necessary to guide the formulation of concrete policy interventions.
This paper discusses the academic literature on the links between human capital accumu-lation and aggregate economic performance. I consider several methodological approachesthat have been used to analyse different aspects of this complex relationship: cross-countryregressions, development accounting and quantitative models. Rather than offering an ex-haustive list of all papers in these areas, I focus on a general discussion of the underlying as-sumptions, advantages and limitations of these approaches for evaluating the role of humancapital, as well as of the broad insights that have emerged in several decades of research.1
Moreover, I replicate and illustrate some of the key results using recent data.A significant part of the debate concerns the definition of human capital. Traditionally,
economists have concentrated on years of schooling and other measures of educational at-tainment. However, several pieces of evidence suggest that this focus on schooling quantitymisses important dimensions of the variation in human capital, both at the individual andthe aggregate levels. As a consequence, recent work gives a more central role to schoolingquality on one hand, and human capital accumulated outside of the schooling system on theother.
Across countries, observable proxies for human capital are strongly correlated with mea-sures of aggregate economic performance, explaining the prominence of this theme in thedevelopment debate. Figure 1 shows average years of schooling completed in the working-age population against log GDP per worker in 2010. There is a positively sloped relation-ship, and the cross-country gaps in educational achievement appear large. A similar patternemerges when focusing on a direct measure of cognitive skills, the average performancein standardized tests (Figure 2), or on a proxy for the health status of the population, thesurvival rate to age 65 (Figure 3).2
1Previous reviews on cross-country growth regressions and development accounting include Klenow andRodrıguez-Clare (1997a) and Caselli (2005), while a related discussion on human capital is Flabbi and Gatti(2018). Compared to these works, the present review focuses in greater detail on recent contributions in thedevelopment accounting and quantitative modeling literatures.
2The sources and construction of these variables are discussed below.
2
While suggestive, these correlations are not necessarily informative on the role of hu-man capital for economic development. On one hand, the relationship might not be causalin nature, as third factors might explain cross-country differences in both human capital andGDP per worker, and the latter might also explain the accumulation of the former. Moreover,several dimensions of human skills are inherently difficult to measure, and the proxies con-sidered here might miss an important part of the picture. Finally, even a positive and causalrelationship between average human capital and development would not be fully informativeon the potentially complex role of human skills in the production process.
The approaches reviewed in this paper attempt to overcome these problems throughdifferent strategies. As a background for the discussion of these methodologies, I start bysketching in Section 2 a simple production function framework which highlights how humancapital can affect aggregate economic performance.
Section 3 reviews results from the cross-country regressions approach, which consistsof relating measures of economic performance and human capital in a regression model.Section 4 discusses development accounting, a methodology based on the direct calibrationof an aggregate production function (rather than its estimation). Here I also replicate someof the key results in this literature using data from 2010. Section 5 reviews some of thekey insights from quantitative models on the accumulation and allocation of human capital.Finally, the last Section concludes by drawing general lessons and highlighting avenues forfuture work.
2 A General Framework
The starting point for most macroeconomic analyses on the effects of human capital is thepostulation of an aggregate production function,
Y “ AF pK,Hq (1)
The aggregate production function relates GDP (Y ) to the amounts of physical capital(K), human capital (H) and technology (A) available in the economy. In the simplest spec-ification, aggregate human capital is the sum of the human capital of all workers, that isH “ hL where h is the human capital of a representative worker and L is the number ofworkers. Alternative specifications assume that H is a more complex aggregator of differenttypes of workers.
A common choice for the F aggregator is the Cobb-Douglas function,
F pK,Hq “ KαH1´α (2)
3

which is characterized by constant returns to scale. Under competitive markets for factorsof production, α is the physical capital share of income, while 1 - α is the human capitalshare. The fact that these shares are approximately constant both in the US time-series andin the cross-section provides a justification for the Cobb-Douglas assumption. Moreover,estimates of these income shares reprensent useful benchmarks for the estimation or thecalibration of the production function.
Cross-country comparisons of standards of living are normally based on differences inGDP per worker, y “ Y {L. Broadly speaking, there are three main ways human capitalplays a role in shaping these cross-country differences.
First, there is a direct effect implied by the fact thatH is a factor of production. Countrieswith higher levels of human capital per worker have, mechanically, higher levels of GDP perworker (or, equivalently, growth rates of GDP per worker are positively related to growthrates of human capital). Higher levels of human capital per worker can be achieved throughhuman capital accumulation at the individual level as well as, depending on the specifichuman capital aggregator, through different combinations of heterogeneous workers.
Second, if human and physical capital are complementary in production, a larger avail-ability of the former encourages the accumulation of the latter. The degree of complementar-ity might depend on the composition of both K and H . For example, the empirical evidencesuggests that computers are more complementary with human capital than other types ofequipments (Caselli and Wilson, 2004), and capital equipment appears to complement morecollege-educated workers than less skilled labor (Krusell et al., 2000).
Third, endogenous growth models emphasize that technological innovations, i.e. changesin A over time, are determined by a number of economic forces, including the availabilityof human capital. In particular, human capital is seen as instrumental in the development,adoption and operation of new technologies (Nelson and Phelps, 1966). In the context of anaggregate production function like (1), this effect can be captured by assuming that rate ofchange of A is a function of H . A direct implication is that the level of human capital at agiven point in time affects the growth rate of GDP per worker over subsequent periods.
To summarise, a simple aggregate production framework suggests several mechanismsthrough which human capital can affect aggregate economic performance. Human capitaldirectly enters in the production process, encourages the accumlation of complementary in-puts and facilitates the adoption of new technologies. Through these channels, human capitalgaps should be reflected in cross-country differences in GDP per worker levels and growthrates. The rest of the paper discusses alternative approaches to investigate the empiricalrelevance of these predictions.
4

3 Cross-Country Regressions
In the growth literature, the earliest studies on the importance of human capital and otherfactors of production were based on cross-country regressions. This approach was originallymotivated by the purpose of testing the predictions of the Solow-Swan model. While the firstcontributions mostly focused on physical capital, starting from Mankiw et al. (1992) therewas a burgeoning of studies examining the importance of human capital.
Broadly speaking, the approach consists of running a regression of GDP per worker onproxies for physical and human capital per worker. This regression is normally run usinglogs, since the Cobb-Douglas production function implies a linear relationship between thelogarithms of output per worker and factors of production. Technology is treated as unob-servable, and as such is part of the residual. The main objects of interest of this type ofanalysis are the coefficients on the proxies for human and physical capital as well as theR squared, which provides an estimate of the share of cross-country variation in GDP perworker “explained” by observable factors of production.
The vast majority of the studies employing this approach have traditionally focused oneducational attainment as a measure of human capital. More recently, however, strands ofthe literature focusing on alternative dimensions of human capital have developed. In thenext subsections I consider in turn these lines of work.
3.1 Educational Attainment
Mankiw et al. (1992) is an early implementation of the cross-country regression approach.This paper considers a version of the Solow model augmented with a process of humancapital accumulation, and estimates a specification based on the steady state expression foroutput per worker in that model. In the authors’ preferred specification, GDP per workeris regressed on the fraction of the working age population enrolled in secondary school (aproxy for the rate of human capital accumulation), the saving rate and the rates of capitaldepreciation, population growth and productivity growth.
The results are supportive of an important role for human capital. The coefficient on thehuman capital variable is positive and highly significant. When all controls are included,the R squared of the regression is 78%, suggesting that proxies for physical and humancapital account for most of the cross-country variation in GDP per worker. Moreover, ina specification based on the transitional dynamics of the Solow model, human capital ispositively related to GDP growth between 1960 and 1985 (conditional on the starting levelof GDP, as well as on the other determinants of the steady state income per worker).
These conclusions have been disputed in successive work. The identification assumptionin Mankiw et al. (1992) is that measures of physical and human capital are uncorrelated
5

with unobservable determinants of cross-country differences in economic performance. Aspointed out in Klenow and Rodrıguez-Clare (1997b), countries with policies discouragingcapital accumulation are also likely to have in place policies or institutions discouragingtechnology adoption. This would lead to a violation of identification assumption in Mankiwet al. (1992), where the level of technology is treated as unobservable.
Various approaches have been proposed to overcome these identification challenges. Is-lam (1995) adopts a panel data approach, where time invariant “country effects” are added tothe dynamic specification of Mankiw et al. (1992). To the extent that the common drivers ofcapital accumulation and technology adoption are indeed fixed over time, they are capturedby these country effects and do not spuriously inflate the contribution of physical and hu-man capital to output per worker. In this setting, Islam (1995) finds that proxies for humancapital are not strongly related to output per worker, questioning the empirical relevanceof the Solow model with human capital accumulation. While levels of school enrollmentare positively related to levels of GDP per worker, the relationship is much weaker whenintroducing the temporal dimension.
This approach is itself subject to a number of issues. First, the least squares estimationof dynamic panel model including fixed effects is generally biased, as showed by Nickell(1981). Second, temporal comparisons are particularly sensitive to problems in the measure-ment of human capital. Given that average school attainment at the country level changesslowly over time, short-run fluctuations are likely to be mostly driven by measurement er-ror. Indeed, Lindahl and Krueger (2001) argue that commonly used international data oneducational attainment are subject to problems of incompleteness, imprecision and lack ofconsistency across countries. Cohen and Soto (2007) show that when using a more accuratedataset on average years of schooling across countries, increases over time in this measureof human capital are in fact positively related to GDP growth.
Other authors attempted to solve the identification problem through instrumental vari-ables. This approach consists of finding variables (instruments) that are correlated with thevariables of interest, but not with the unobservable confounders that bias the regression re-sults to start with. By focusing on variation “induced” by these instruments, in principle onecan separate the effect of the variables of interest from the one of unobservable factors.
Unfortunately, finding suitable instruments in the context of cross-country regression is achallenging task. A seminal contribution in this direction is Acemoglu et al. (2001). The pa-per focuses on political institutions, and proposes to identify the importance of institutionalquality for economic development by using the mortality rate among European colonizersas an instrumental variable. The logic is that colonizers created extractive institutions incolonies where they could not easily settle, whereas they attempted to recreate European in-stitutions in environments more favourable to their inhabitancy. The main result of the paper
6

is that the cross-country variation in institutions induced by these historical circumstanceshas a large effect on income per worker.
Using a similar methodology, Glaeser et al. (2004) questions Acemoglu et al. (2001)’sview on the importance of institutional quality for economic development, and argues for acentral role of human capital (as measured by educational attainment). The starting pointis the observation that European settlers did not just bring European institutions with them-selves, but also their human capital. Indeed, Glaeser et al. (2004) show that the instrumentused by Acemoglu et al. (2001) is positively correlated with current educational attainment,and argues that institutional quality is a product as opposed to a cause of the process ofeconomic development. This view is supported by a regression specification where institu-tional quality and educational attainment are simultaneously instrumented for, from whichit emerges that educational attainment has a stronger explanatory power for economic per-formance. This conclusion has been in turn questioned by Acemoglu et al. (2014), whichargues that the instruments used by Glaeser et al. (2004) are not valid sources of exogenousvariation.3
Recent work has shifted the focus from a national to a subnational setting. Gennaioliet al. (2013) use data at the regional level across 110 countries to examine the relative im-portance of human capital and other possible determinants of local economic performance.Within-country comparisons allow the authors to control for unobservable factors varyingat the country-level, such as national institutions, national culture and national language. Inthis subnational regression specification, educational attainment emerges as the most im-portant predictor of regional economic performance. Moreover, Gennaioli et al. (2013) usefirm-level data to document that entrepreneurs’ and managers’ human capital plays a partic-ularly important role in explaining differences in firms’ productivity. However, Acemoglu etal. (2014) argue that country fixed effects are not sufficient to eliminate omitted variable bi-ases, and that the measure of institutions used by Gennaioli et al. (2013) misses meaningfulsubnational variation in institutional quality.
Another study exploiting within-country heterogeneity is Ciccone and Papaioannou (2009).The paper adopts a sectoral perspective to test whether human capital favours technologyadoption and growth. The authors use data for 37 manufacturing industries across 40 coun-tries, and show that countries with higher levels of education in 1980 saw faster growthin human-capital-intensive industries (relative to other industries) in the following decades,a period characterised by the rapid introduction of skilled labor augmenting technologies.They interpret this result as evidence that high educational attainment was instrumental in
3The instruments used by Glaeser et al. (2004) are a dummy for French legal origin and either settlermortality or population density in 1500. As pointed out by Acemoglu et al. (2014), the rationale behind thisempirical strategy is not clearly discussed, and it is even unclear whether the two instruments have distinctexplanatory power when considered jointly.
7

the adoption of these technologies.
3.2 Other Dimensions of Human Capital
A recent strand of the cross-country regression literature proposes to go beyond measuresof schooling quantity and to focus on direct proxies for knowledge and skills. The rationalefor this is twofold. On one hand, if school quality varies across countries, a given level ofeducational attainment implies different levels of human capital depending on where it isreached. Moreover, by construction measures of schooling quantity do not capture skillsacquired outside of the schooling system.
Hanushek and Woessmann (2012a) consider international standardized tests in mathe-matics and science as proxies for the stock of cognitive skills across countries. The authorsdocument that long-run growth rates (between 1960 and 2000) across countries are posi-tively related to the performance in these tests, and that this relationship is stronger andmore robust than the corresponding association between economic growth and traditionalmeasures of school attainment. In the baseline estimates, one standard deviation in testscores is associated with a higher average annual growth rate in GDP per worker of twopercentage points.
This result is subject to similar identification concerns to those discussed above for cross-country regressions including education-based measures of human capital. Countries wherestudents perform well in standardised tests might be inherently different in terms of cultureor institutions, and these factors might explain their faster growth. Moreover, country-leveleconomic performance itself might have an impact on school resources and students’ learn-ing, leading to concerns of reverse causality.
Hanushek and Woessmann (2012a) provide several pieces of evidence to alleviate theseconcerns. The authors show that the results are robust to an instrumental variable strategybased on the use of institutional features of the school system as instruments for test per-formance, and to a specification relating changes in performance over time to changes ingrowth rates. Moreover, they show that US immigrants from countries with high averagetest scores earn higher wages than immigrants from countries with low average test scores,but only if they were educated in their home country (as opposed to being educated in theUS). They interpret this as evidence for the fact that the schooling system is the crucial fac-tor setting apart high-scoring and low-scoring countries. While the authors acknowledgethat achieving a perfectly credible identification is impossible in a cross-country setting,these different pieces of evidence all point towards an important role of cognitive skills forexplaining cross-country differences in economic performance.
Another aspect of human capital that has received attention in the cross-country re-gression literature is health. Since a large micro literature suggests that improvements in
8
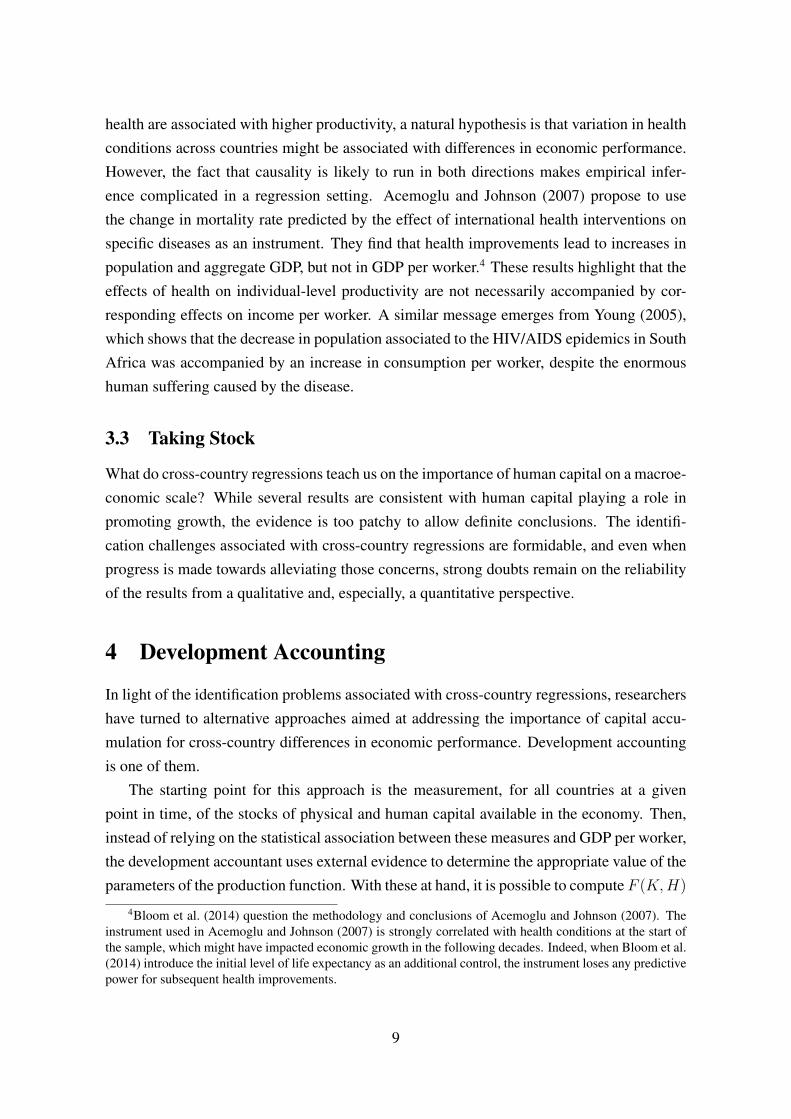
health are associated with higher productivity, a natural hypothesis is that variation in healthconditions across countries might be associated with differences in economic performance.However, the fact that causality is likely to run in both directions makes empirical infer-ence complicated in a regression setting. Acemoglu and Johnson (2007) propose to usethe change in mortality rate predicted by the effect of international health interventions onspecific diseases as an instrument. They find that health improvements lead to increases inpopulation and aggregate GDP, but not in GDP per worker.4 These results highlight that theeffects of health on individual-level productivity are not necessarily accompanied by cor-responding effects on income per worker. A similar message emerges from Young (2005),which shows that the decrease in population associated to the HIV/AIDS epidemics in SouthAfrica was accompanied by an increase in consumption per worker, despite the enormoushuman suffering caused by the disease.
3.3 Taking Stock
What do cross-country regressions teach us on the importance of human capital on a macroe-conomic scale? While several results are consistent with human capital playing a role inpromoting growth, the evidence is too patchy to allow definite conclusions. The identifi-cation challenges associated with cross-country regressions are formidable, and even whenprogress is made towards alleviating those concerns, strong doubts remain on the reliabilityof the results from a qualitative and, especially, a quantitative perspective.
4 Development Accounting
In light of the identification problems associated with cross-country regressions, researchershave turned to alternative approaches aimed at addressing the importance of capital accu-mulation for cross-country differences in economic performance. Development accountingis one of them.
The starting point for this approach is the measurement, for all countries at a givenpoint in time, of the stocks of physical and human capital available in the economy. Then,instead of relying on the statistical association between these measures and GDP per worker,the development accountant uses external evidence to determine the appropriate value of theparameters of the production function. With these at hand, it is possible to compute F pK,Hq
4Bloom et al. (2014) question the methodology and conclusions of Acemoglu and Johnson (2007). Theinstrument used in Acemoglu and Johnson (2007) is strongly correlated with health conditions at the start ofthe sample, which might have impacted economic growth in the following decades. Indeed, when Bloom et al.(2014) introduce the initial level of life expectancy as an additional control, the instrument loses any predictivepower for subsequent health improvements.
9

in (1), and back out the level of technology A to match Y . This strategy mirrors the one ofgrowth accounting, with a focus on cross-country differences at a given point in time asopposed to cross-time variation within a given country.
The typical questions asked are: how much of the cross-country variation in Y is ex-plained by A as opposed to F pK,Hq? Do rich countries have more physical and humancapital than poor countries? How would the income distribution look like if all countrieshad the same level of factors of production?
As in the cross-country regression approach, technology is treated as an unobservableresidual. However, development accounting does not involve any estimation, and as suchit does not rely on implausible assumptions on the orthogonality between observable andunobservable factors of production. On the contrary, by measuring F pK,Lq and A indepen-dently, the development accountant can test whether capital abundance is correlated withthe level of technology, and the relative role of physical and human capital in explaining thiscorrelation.5
Development accounting does not come without limitations. This approach strongly re-lies on the postulation of a given aggregate production function and on the precise measure-ment of factors of production, and as such it is subject to concerns related to the unavoidableapproximations associated with these tasks. Perhaps the most important limitation residesin the “accounting” nature of the exercise. Development accounting quantifies the role ofhuman and physical capital as “proximate” causes of development, but has little to say onwhat is driving the cross-country variation in these factors of production to start with (the“ultimate” causes of development). Relatedly, factor accumulation and technological inno-vations are interdependent phenomena, and this approach is not well suited to characterisethe links between the two, and therefore to ask counterfactual questions on how, for example,technology would respond to improvements in human capital.
In spite of these limitations, development accounting remains a useful diagnostic tool.If one finds that human capital varies greatly across countries, a natural implication is thatpolicies aimed at stimulating human capital accumulation are a promising avenue to promoteeconomic development. Moreover, by measuring different dimensions of human capital indifferent ways, one can learn which are particularly important for cross-country gaps ineconomic performance, therefore further restricting the range of alternative policies underconsideration.
I consider implementations of development accounting based on the Cobb-Douglas pro-
5In the cross-country regression approach, technology is estimated as the residual of the best linear rela-tionship between the logs of GDP per worker and proxies for physical and human capital, so that by construc-tion it is uncorrelated with the latter.
10

duction function in (2), which rewritten in per worker terms becomes
y “ Akαh1´α (3)
where k “ K{L and h “ H{L are physical and human capital per worker. Instead ofworking with (3) directly, I follow Klenow and Rodrıguez-Clare (1997b) and many papersthereafter in rewriting output per worker as a function of physical capital intensity, humancapital and technology
y “
ˆ
k
y
˙α
1´α
A1
1´αh (4)
The logic of using the formulation in (4) for development accounting is as follows. Stan-dard models of physical capital accumulation predict that increases in A
11´αh induce a pro-
portional increase in k, so that the capital to output ratio is unaffected. By focusing on thecross-country variation in capital intensity, I give “credit” to technology and human capitalfor the variation in physical capital induced by these factors.6
In what follows, I focus on two main measures to summarise the importance of humancapital in accounting for cross-country differences in GDP per worker. I take the UnitedStates as a benchmark country, and for each country c I compute human capital per workerrelative to the United States, hUS{hc, as well as the share of output per worker gaps ac-counted by human capital gaps,
ShareUSc “hUS{hcyUS{yc
where a value of 1 would imply that, everything else equal, equalizing human capital perworker would close the income gap between country c and the United States.
As an additional summary statistic, I consider the the cross-country variance ratio be-tween the logs of human capital and output per worker
Success “V ar rlog hcs
V ar rlog ycs
which, following the terminology in Caselli (2005), I refer to as the “success” of humancapital in explaining cross-country variation in economic performance. A value of 0 wouldreflect equal endowments of human capital across countries, while a value of 1 would be
6The treatment of physical and human capital is asymmetric here, as human capital differences that arise asresponses to pre-existing differences in technology or physical capital are not separately accounted for. Giventhat in what follows I consider different dimensions of human capital, it is unclear what model of humancapital accumulation should be used to assess the strength of these responses. For this reason, I chose to notimplement any adjustment in this respect. In Section 5 I discuss how more structural approaches shed light onthe link between endogenous human capital accumulation and productivity differences across countries.
11
consistent with human capital driving the whole cross-country variation.7
In the next subsections, I consider different alternatives to measure h. The approach iscumulative: I start from from measures based only on educational attainment, and I gradu-ally introduce additional dimensions of human capital to evaluate their relative importance.I use recent data to replicate the main measurement strategies that have been proposed in theliterature, and to illustrate their implications in terms of development accounting results.8
4.1 Educational Attainment
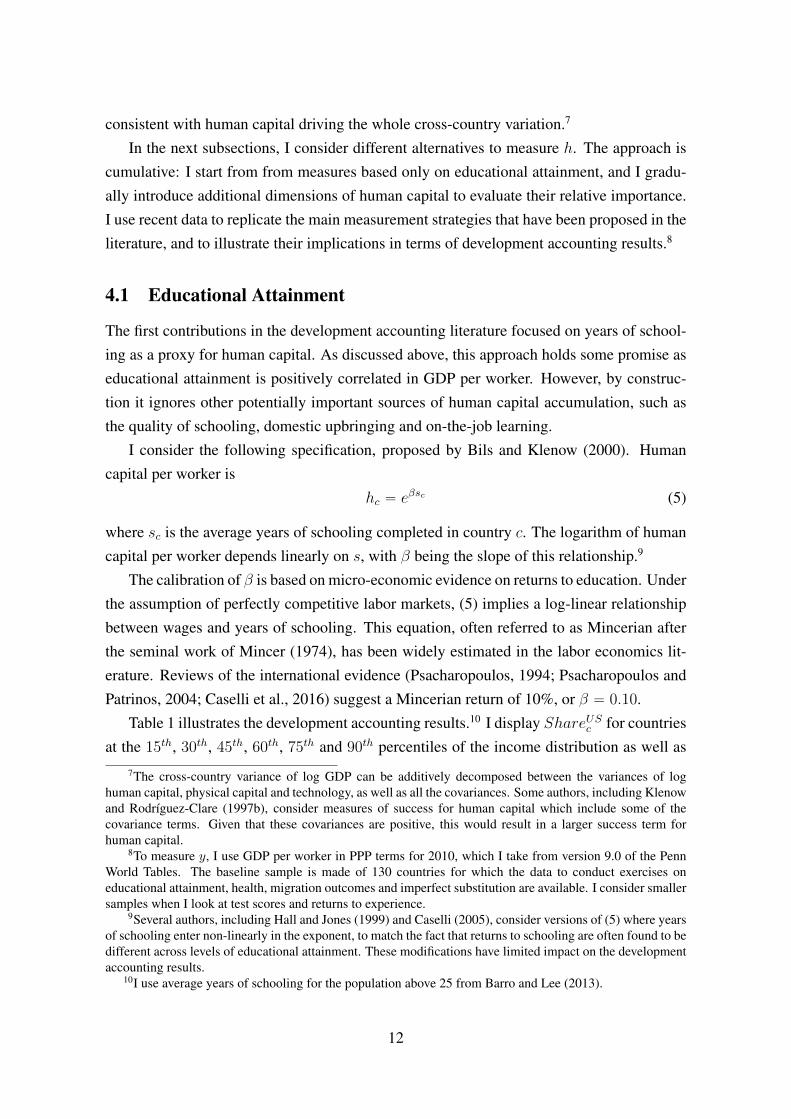
The first contributions in the development accounting literature focused on years of school-ing as a proxy for human capital. As discussed above, this approach holds some promise aseducational attainment is positively correlated in GDP per worker. However, by construc-tion it ignores other potentially important sources of human capital accumulation, such asthe quality of schooling, domestic upbringing and on-the-job learning.
I consider the following specification, proposed by Bils and Klenow (2000). Humancapital per worker is
hc “ eβsc (5)
where sc is the average years of schooling completed in country c. The logarithm of humancapital per worker depends linearly on s, with β being the slope of this relationship.9
The calibration of β is based on micro-economic evidence on returns to education. Underthe assumption of perfectly competitive labor markets, (5) implies a log-linear relationshipbetween wages and years of schooling. This equation, often referred to as Mincerian afterthe seminal work of Mincer (1974), has been widely estimated in the labor economics lit-erature. Reviews of the international evidence (Psacharopoulos, 1994; Psacharopoulos andPatrinos, 2004; Caselli et al., 2016) suggest a Mincerian return of 10%, or β “ 0.10.
Table 1 illustrates the development accounting results.10 I display ShareUSc for countriesat the 15th, 30th, 45th, 60th, 75th and 90th percentiles of the income distribution as well as
7The cross-country variance of log GDP can be additively decomposed between the variances of loghuman capital, physical capital and technology, as well as all the covariances. Some authors, including Klenowand Rodrıguez-Clare (1997b), consider measures of success for human capital which include some of thecovariance terms. Given that these covariances are positive, this would result in a larger success term forhuman capital.
8To measure y, I use GDP per worker in PPP terms for 2010, which I take from version 9.0 of the PennWorld Tables. The baseline sample is made of 130 countries for which the data to conduct exercises oneducational attainment, health, migration outcomes and imperfect substitution are available. I consider smallersamples when I look at test scores and returns to experience.
9Several authors, including Hall and Jones (1999) and Caselli (2005), consider versions of (5) where yearsof schooling enter non-linearly in the exponent, to match the fact that returns to schooling are often found to bedifferent across levels of educational attainment. These modifications have limited impact on the developmentaccounting results.
10I use average years of schooling for the population above 25 from Barro and Lee (2013).
12
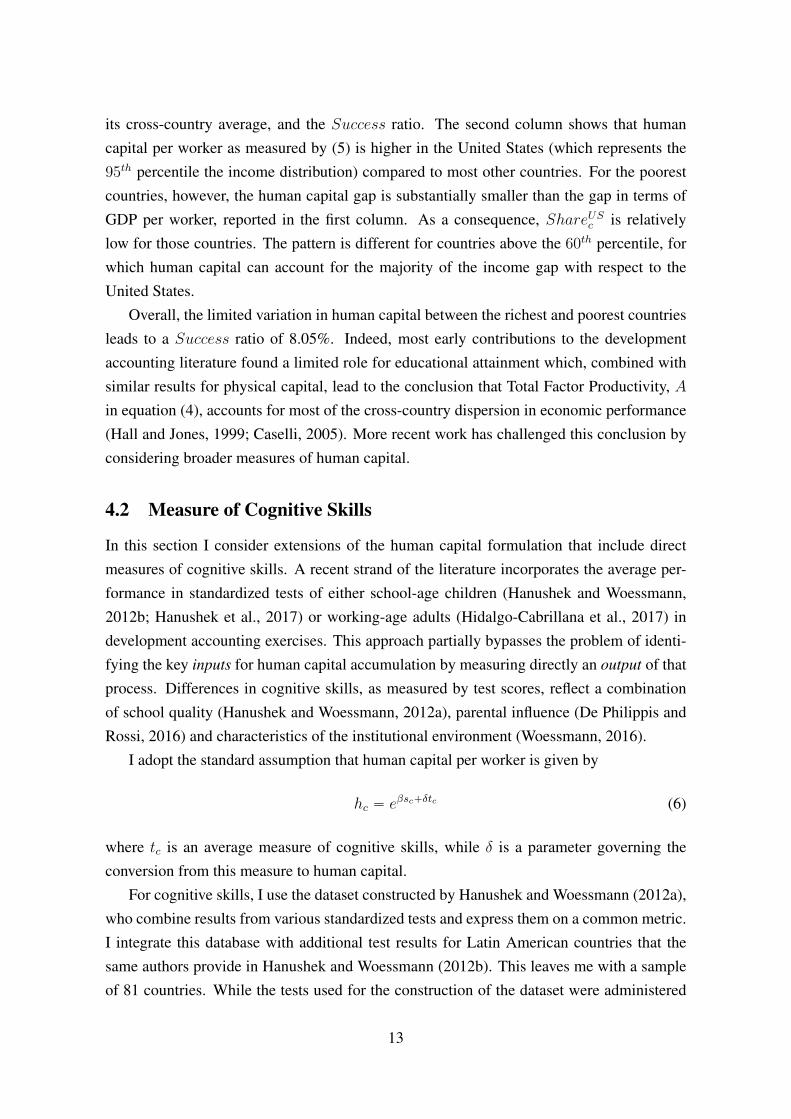
its cross-country average, and the Success ratio. The second column shows that humancapital per worker as measured by (5) is higher in the United States (which represents the95th percentile the income distribution) compared to most other countries. For the poorestcountries, however, the human capital gap is substantially smaller than the gap in terms ofGDP per worker, reported in the first column. As a consequence, ShareUSc is relativelylow for those countries. The pattern is different for countries above the 60th percentile, forwhich human capital can account for the majority of the income gap with respect to theUnited States.
Overall, the limited variation in human capital between the richest and poorest countriesleads to a Success ratio of 8.05%. Indeed, most early contributions to the developmentaccounting literature found a limited role for educational attainment which, combined withsimilar results for physical capital, lead to the conclusion that Total Factor Productivity, Ain equation (4), accounts for most of the cross-country dispersion in economic performance(Hall and Jones, 1999; Caselli, 2005). More recent work has challenged this conclusion byconsidering broader measures of human capital.
4.2 Measure of Cognitive Skills
In this section I consider extensions of the human capital formulation that include directmeasures of cognitive skills. A recent strand of the literature incorporates the average per-formance in standardized tests of either school-age children (Hanushek and Woessmann,2012b; Hanushek et al., 2017) or working-age adults (Hidalgo-Cabrillana et al., 2017) indevelopment accounting exercises. This approach partially bypasses the problem of identi-fying the key inputs for human capital accumulation by measuring directly an output of thatprocess. Differences in cognitive skills, as measured by test scores, reflect a combinationof school quality (Hanushek and Woessmann, 2012a), parental influence (De Philippis andRossi, 2016) and characteristics of the institutional environment (Woessmann, 2016).
I adopt the standard assumption that human capital per worker is given by
hc “ eβsc`δtc (6)
where tc is an average measure of cognitive skills, while δ is a parameter governing theconversion from this measure to human capital.
For cognitive skills, I use the dataset constructed by Hanushek and Woessmann (2012a),who combine results from various standardized tests and express them on a common metric.I integrate this database with additional test results for Latin American countries that thesame authors provide in Hanushek and Woessmann (2012b). This leaves me with a sampleof 81 countries. While the tests used for the construction of the dataset were administered
13
across different decades and to school-age children only, cross-country gaps in performanceare quite persistent over time, suggesting that these measures of cognitive skills are to a largeextent relevant for the current labor force as well.
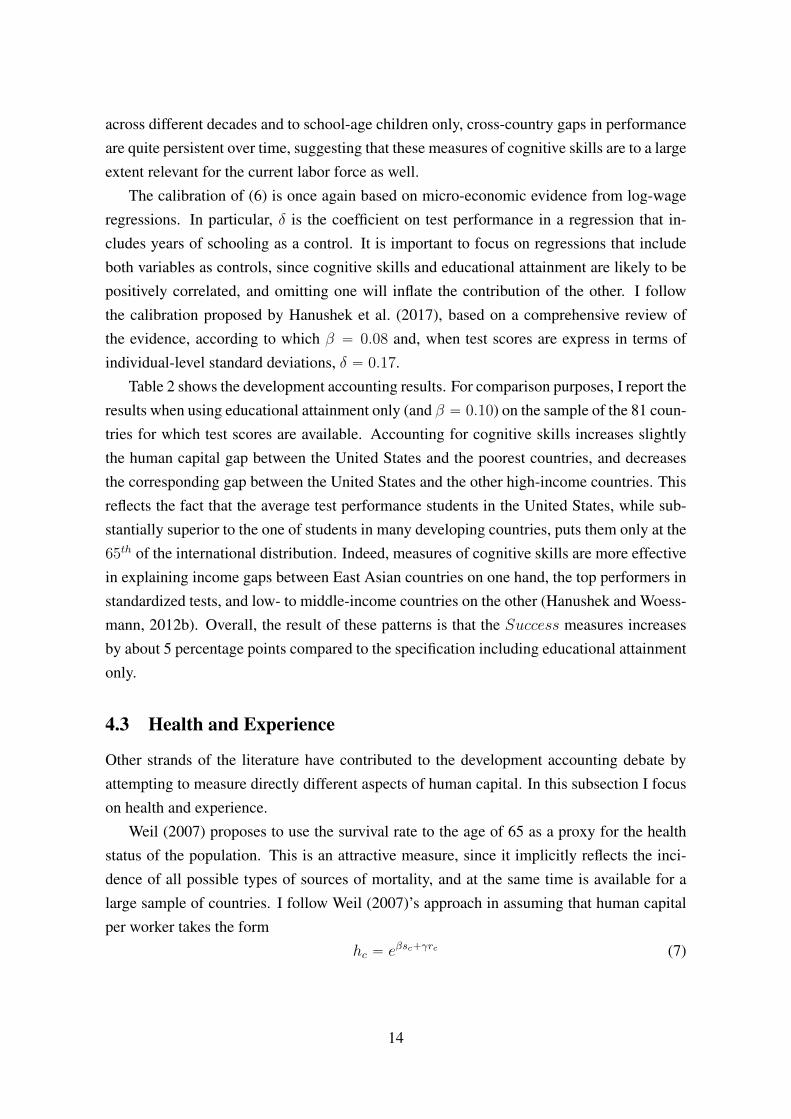
The calibration of (6) is once again based on micro-economic evidence from log-wageregressions. In particular, δ is the coefficient on test performance in a regression that in-cludes years of schooling as a control. It is important to focus on regressions that includeboth variables as controls, since cognitive skills and educational attainment are likely to bepositively correlated, and omitting one will inflate the contribution of the other. I followthe calibration proposed by Hanushek et al. (2017), based on a comprehensive review ofthe evidence, according to which β “ 0.08 and, when test scores are express in terms ofindividual-level standard deviations, δ “ 0.17.
Table 2 shows the development accounting results. For comparison purposes, I report theresults when using educational attainment only (and β “ 0.10) on the sample of the 81 coun-tries for which test scores are available. Accounting for cognitive skills increases slightlythe human capital gap between the United States and the poorest countries, and decreasesthe corresponding gap between the United States and the other high-income countries. Thisreflects the fact that the average test performance students in the United States, while sub-stantially superior to the one of students in many developing countries, puts them only at the65th of the international distribution. Indeed, measures of cognitive skills are more effectivein explaining income gaps between East Asian countries on one hand, the top performers instandardized tests, and low- to middle-income countries on the other (Hanushek and Woess-mann, 2012b). Overall, the result of these patterns is that the Success measures increasesby about 5 percentage points compared to the specification including educational attainmentonly.
4.3 Health and Experience
Other strands of the literature have contributed to the development accounting debate byattempting to measure directly different aspects of human capital. In this subsection I focuson health and experience.
Weil (2007) proposes to use the survival rate to the age of 65 as a proxy for the healthstatus of the population. This is an attractive measure, since it implicitly reflects the inci-dence of all possible types of sources of mortality, and at the same time is available for alarge sample of countries. I follow Weil (2007)’s approach in assuming that human capitalper worker takes the form
hc “ eβsc`γrc (7)
14
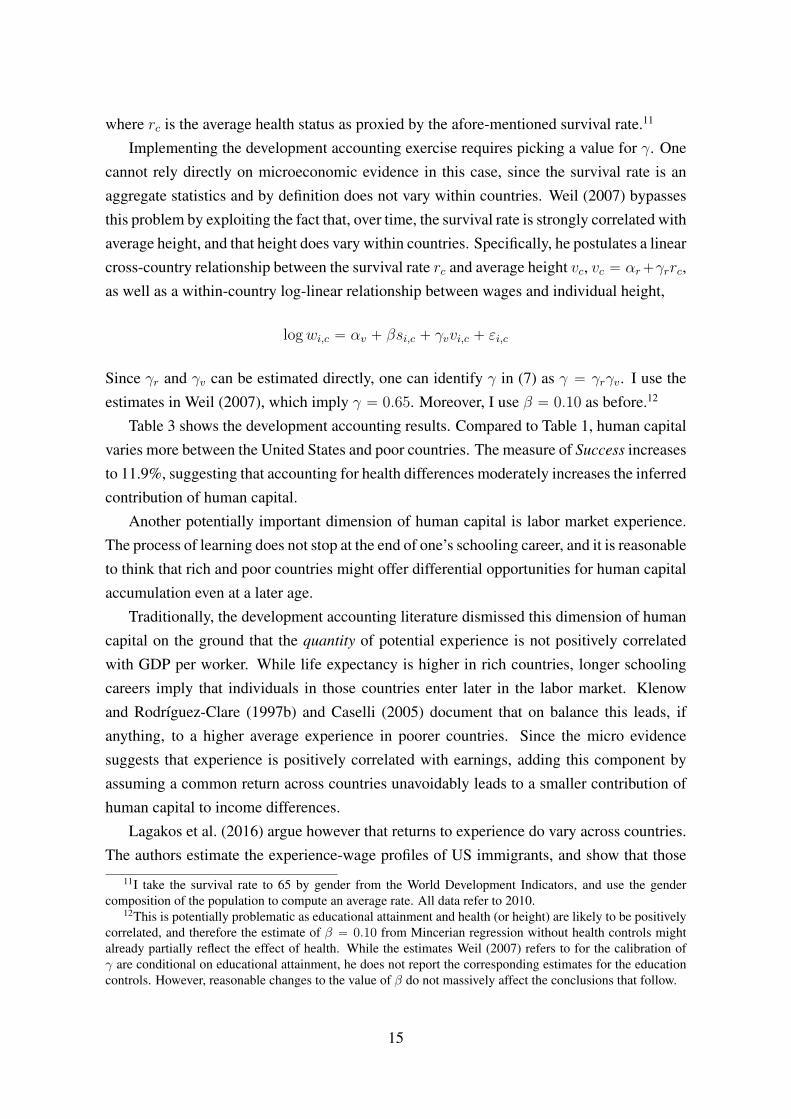
where rc is the average health status as proxied by the afore-mentioned survival rate.11
Implementing the development accounting exercise requires picking a value for γ. Onecannot rely directly on microeconomic evidence in this case, since the survival rate is anaggregate statistics and by definition does not vary within countries. Weil (2007) bypassesthis problem by exploiting the fact that, over time, the survival rate is strongly correlated withaverage height, and that height does vary within countries. Specifically, he postulates a linearcross-country relationship between the survival rate rc and average height vc, vc “ αr`γrrc,as well as a within-country log-linear relationship between wages and individual height,
logwi,c “ αv ` βsi,c ` γvvi,c ` εi,c
Since γr and γv can be estimated directly, one can identify γ in (7) as γ “ γrγv. I use theestimates in Weil (2007), which imply γ “ 0.65. Moreover, I use β “ 0.10 as before.12
Table 3 shows the development accounting results. Compared to Table 1, human capitalvaries more between the United States and poor countries. The measure of Success increasesto 11.9%, suggesting that accounting for health differences moderately increases the inferredcontribution of human capital.
Another potentially important dimension of human capital is labor market experience.The process of learning does not stop at the end of one’s schooling career, and it is reasonableto think that rich and poor countries might offer differential opportunities for human capitalaccumulation even at a later age.
Traditionally, the development accounting literature dismissed this dimension of humancapital on the ground that the quantity of potential experience is not positively correlatedwith GDP per worker. While life expectancy is higher in rich countries, longer schoolingcareers imply that individuals in those countries enter later in the labor market. Klenowand Rodrıguez-Clare (1997b) and Caselli (2005) document that on balance this leads, ifanything, to a higher average experience in poorer countries. Since the micro evidencesuggests that experience is positively correlated with earnings, adding this component byassuming a common return across countries unavoidably leads to a smaller contribution ofhuman capital to income differences.
Lagakos et al. (2016) argue however that returns to experience do vary across countries.The authors estimate the experience-wage profiles of US immigrants, and show that those
11I take the survival rate to 65 by gender from the World Development Indicators, and use the gendercomposition of the population to compute an average rate. All data refer to 2010.
12This is potentially problematic as educational attainment and health (or height) are likely to be positivelycorrelated, and therefore the estimate of β “ 0.10 from Mincerian regression without health controls mightalready partially reflect the effect of health. While the estimates Weil (2007) refers to for the calibration ofγ are conditional on educational attainment, he does not report the corresponding estimates for the educationcontrols. However, reasonable changes to the value of β do not massively affect the conclusions that follow.
15

coming from richer countries have higher returns to both US and foreign experience. In aseparate paper, they document that a similar gap exists when looking at non-migrants acrossa smaller set of rich and poor countries (Lagakos et al., 2018). They interpret these results asevidence for the fact that workers born in rich countries accumulate more human capital overtheir life-cycle, possibly because of differences in the quantity and quality of their education.
I follow Lagakos et al. (2016) in implementing a development accounting exercise basedon their country-specific estimates for the returns to experience. I assume that human capitalper worker is
hc “ eβsc`φcpθcq (8)
where θc is the average experience and φc p.q is a country-specific function, reflecting dif-ferent returns across countries. Since most countries in Lagakos et al. (2016)’s sample havebetween 15 and 19 years of average experience, I simply use the estimated returns for thiscategory. I focus on returns to foreign experience from their baseline specification.13
Table 4 shows the result. I report the results for the specification using educationalattainment only for the 66 countries for which returns to experience are available. Since theestimates are relative to foreign experience for US immigrants, the sample does not includethe United States. I use instead France (90th percentile of the income distribution) as abenchmark country for the computation of both income and human capital gaps.
Accounting for different returns to experience substantially boosts the contribution ofhuman capital. While human capital in France is 47% larger than in Ghana when mea-sured by educational attainment, the gap is of 366% when experience is taken into account.Overall, the success measure more than triplicates, from 9% to 29%. The accumulation ofhuman capital during workers’ career appears to be an important source of cross-countrydifferences in economic performance.
4.4 Development Accounting with Migration Data
In this section I discuss further recent work using migration data to investigate cross-countrydifferences in human capital. The premise of this approach is that when individuals migratethey bring the human capital accumulated in their country of origin, but then face a commontechnological and institutional environment in the new host country. Therefore, comparingearnings across migrants’ nationalities is informative on the cross-country variation in hu-man capital, since it allows to keep constant the impact of other factors of production. Ofcourse, these exercises need to take into account that migrants are not randomly selected
13Lagakos et al. (2016) emphasize that this approach ignores that life-cycle wage growth also dependson the time allocated to human capital investment. They incorporate this aspect in an alternative exercise,disciplined by a Ben-Porath model of human capital accumulation. They find that the resulting contribution ofexperience to development accounting is marginally lower.
16
from the labor force of their country of origin, and that their labor market outcomes in thenew host country do not depend solely on their human capital.
The first implementation of this idea is Hendricks (2002). He documents that gaps interms of average wages between US natives and immigrants from poor countries to the USare relatively small, and concludes from this that the cross-country variation in human capi-tal must be limited. However, subsequent work points out that Hendricks (2002)’s findingsare consistent with some degree of positive selection of immigrants and larger cross-countrydifferences in human capital (Seshadri and Manuelli, 2014).
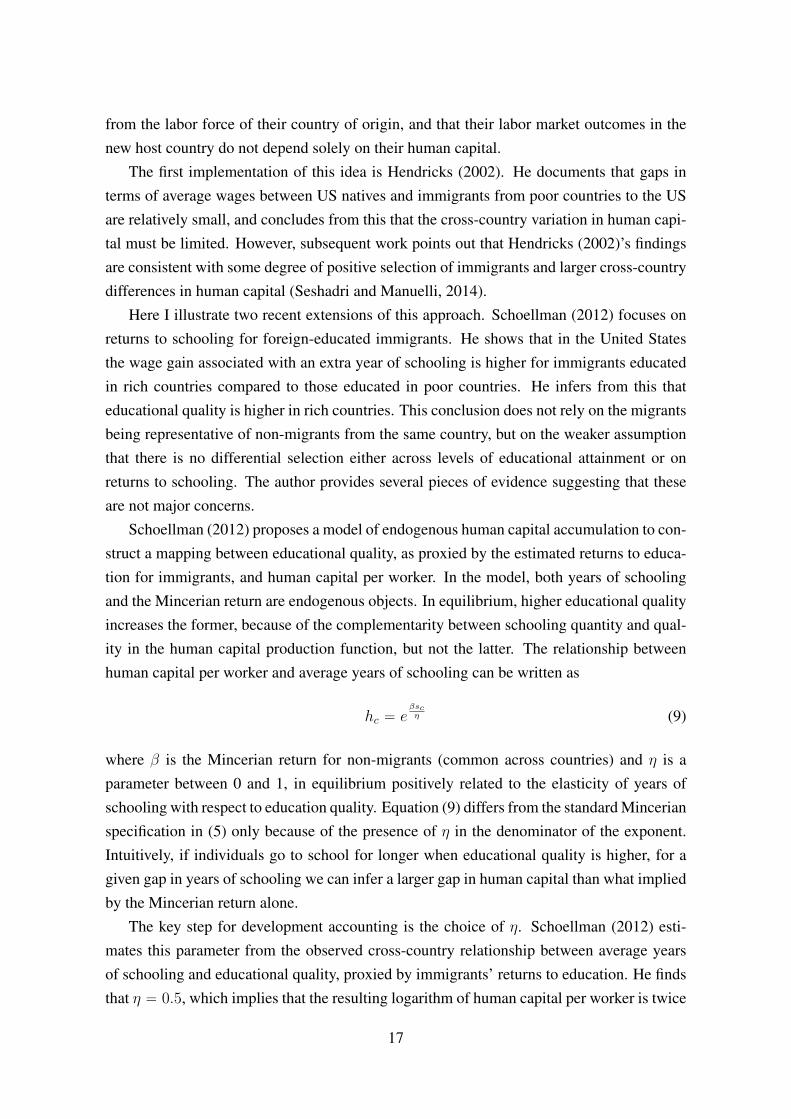
Here I illustrate two recent extensions of this approach. Schoellman (2012) focuses onreturns to schooling for foreign-educated immigrants. He shows that in the United Statesthe wage gain associated with an extra year of schooling is higher for immigrants educatedin rich countries compared to those educated in poor countries. He infers from this thateducational quality is higher in rich countries. This conclusion does not rely on the migrantsbeing representative of non-migrants from the same country, but on the weaker assumptionthat there is no differential selection either across levels of educational attainment or onreturns to schooling. The author provides several pieces of evidence suggesting that theseare not major concerns.
Schoellman (2012) proposes a model of endogenous human capital accumulation to con-struct a mapping between educational quality, as proxied by the estimated returns to educa-tion for immigrants, and human capital per worker. In the model, both years of schoolingand the Mincerian return are endogenous objects. In equilibrium, higher educational qualityincreases the former, because of the complementarity between schooling quantity and qual-ity in the human capital production function, but not the latter. The relationship betweenhuman capital per worker and average years of schooling can be written as
hc “ eβscη (9)
where β is the Mincerian return for non-migrants (common across countries) and η is aparameter between 0 and 1, in equilibrium positively related to the elasticity of years ofschooling with respect to education quality. Equation (9) differs from the standard Mincerianspecification in (5) only because of the presence of η in the denominator of the exponent.Intuitively, if individuals go to school for longer when educational quality is higher, for agiven gap in years of schooling we can infer a larger gap in human capital than what impliedby the Mincerian return alone.
The key step for development accounting is the choice of η. Schoellman (2012) esti-mates this parameter from the observed cross-country relationship between average yearsof schooling and educational quality, proxied by immigrants’ returns to education. He findsthat η “ 0.5, which implies that the resulting logarithm of human capital per worker is twice
17

as large compared to when educational quality is not accounted for.The second and third columns of Table 5 show the corresponding development account-
ing results. Human capital per worker gaps between the United States and poor countriesare substantially higher compared to Table 1. As a result, the Success measure jumps from8% to 32%.
In a subsequent study, Hendricks and Schoellman (2018) use data on wage gains atmigration to provide yet another perspective on cross-country differences in human capital.This approach treats human capital as a residual: wage gains at migration are informativeon combined effect of technology and physical capital, and the cross-country dispersion thatremains after acocunting for these factors can be attributed to human capital. Formally, fromthe production function in (4) , the wage of a migrant from country c (and correspondinghuman capital hc) when working in the US can be written as
wUS,c “ p1´ αq
ˆ
kUSyUS
˙α
1´α
A1
1´α
US hc (10)
while the pre-migration wage of the same worker is (10) with kUS, yUS and AUS replacedby the corresponding quantities for country c. It follows that the wage gain upon migrationis
wUS,cwc,c
“
ˆ
kUS{yUSkc{yc
˙α
1´αˆ
AUSAc
˙1
1´α
so that the relative human capital per worker can be found as
hUShc
“yUS{yc
wUS,c{wc,c
This approach is not subject to concerns on migrants’ selection, as wage gains are con-structed at the level of individual migrants (therefore keeping constant both observable andunobservable human capital). Moreover, the authors do not need to impose any structureon the human capital production function. Since hc is measured as a residual, its variationacross countries might reflect a combination of the quantity and quality of education, as wellas of all other country-specific inputs relevant for human capital formation.
Hendricks and Schoellman (2018), for confidentiality restrictions, display only the av-erage wage gains across five groups of countries, corresponding to the five quintiles of theGDP per worker distribution in 2005. To implement my version of their development ac-counting exercise, I assign to each country in my sample the average wage gain of therelevant group (implictly assuming no change in this quantity between 2005 and 2010). Theresults are reported in the last two columns of Table 5.
Since wage gains upon migration are small relative to GDP gaps, human capital per
18

worker is inferred to vary substantially across countries. Compared to Table 1, human gapsare noticeably higher for countries in the bottom part of the distribution. The Success ratioincreases up to 52.5%.
4.5 Imperfect Substitution
All the approaches reviewed so far treat workers with different levels of human capital asperfect substitutes. This is an extreme assumption, as it implies that high- and low-skilllabor supply the same type of inputs in the production process, the difference between thetwo groups being solely a matter of embedded productivity. Empirical studies (mostly withUS data) provide evidence against this assumption, since the relative wage of skilled andunskilled workers appears to react to changes in their relative supply, as predicted by frame-works with imperfect subsitutability between the two (Katz and Murphy, 1992; Ciccone andPeri, 2005).
A recent line of work investigates the implications of relaxing this assumption for de-velopment accounting. Caselli and Ciccone (2013) show that allowing for imperfect substi-tutability between skill types necessarily reduces the contribution of human capital, whenmeasured by educational attainment. Intuitively, under imperfect substitutability increasingthe share of skilled (highly educated) workers has two effects: an increase of the share of themost productive workers (which increases output), and a decrease in the relative marginalproductivity of skilled and unskilled workers (which decreases output). With perfect substi-tutability the second effect is not present, and therefore the results in Table 1 can be treatedas un upper bound for the contribution of schooling quantity in development accounting.
However, imperfect substitutability has implications for the measurement of other di-mensions of human capital (beyond schooling quantity). To illustrate this, I consider thesimple case where the aggregate human capital stock is a combination of two types of work-ers, skilled and unskilled, so that human capital per worker can be written as
hc “”
phS,clS,cqε´1ε ` phU,clU,cq
ε´1ε
ıεε´1
(11)
where lS,c and lU,c are the shares of skilled and unskilled workers in the labor force, and hS,cand hU,c represent the amount of labor services supplied by a given skilled and unskilledworker. The aggregator in (11) features a constant elasticity of substitution equal to ε. As-suming perfectly competitive labor markets, the wage ratio between skilled and unskilledworkers (skill premium) is
wS,cwU,c
“
ˆ
hS,chU,c
˙ε´1ε
ˆ
lS,clU,c
˙´ 1ε
(12)
19
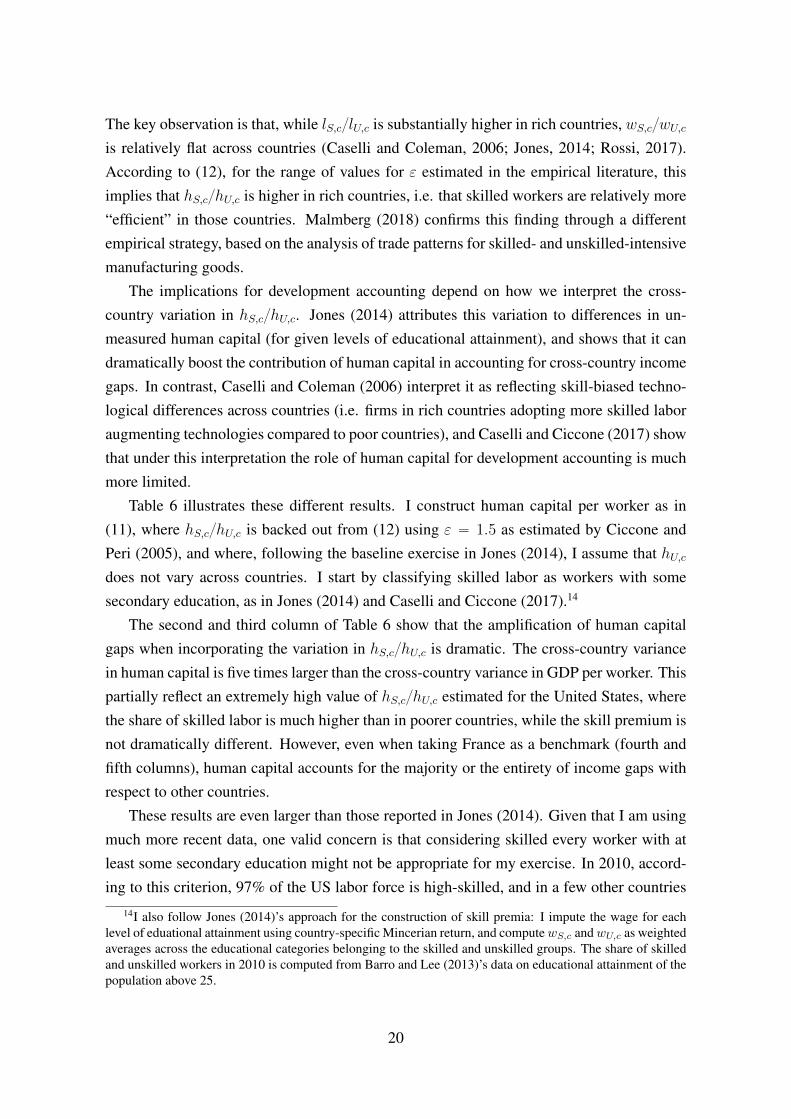
The key observation is that, while lS,c{lU,c is substantially higher in rich countries, wS,c{wU,cis relatively flat across countries (Caselli and Coleman, 2006; Jones, 2014; Rossi, 2017).According to (12), for the range of values for ε estimated in the empirical literature, thisimplies that hS,c{hU,c is higher in rich countries, i.e. that skilled workers are relatively more“efficient” in those countries. Malmberg (2018) confirms this finding through a differentempirical strategy, based on the analysis of trade patterns for skilled- and unskilled-intensivemanufacturing goods.
The implications for development accounting depend on how we interpret the cross-country variation in hS,c{hU,c. Jones (2014) attributes this variation to differences in un-measured human capital (for given levels of educational attainment), and shows that it candramatically boost the contribution of human capital in accounting for cross-country incomegaps. In contrast, Caselli and Coleman (2006) interpret it as reflecting skill-biased techno-logical differences across countries (i.e. firms in rich countries adopting more skilled laboraugmenting technologies compared to poor countries), and Caselli and Ciccone (2017) showthat under this interpretation the role of human capital for development accounting is muchmore limited.
Table 6 illustrates these different results. I construct human capital per worker as in(11), where hS,c{hU,c is backed out from (12) using ε “ 1.5 as estimated by Ciccone andPeri (2005), and where, following the baseline exercise in Jones (2014), I assume that hU,cdoes not vary across countries. I start by classifying skilled labor as workers with somesecondary education, as in Jones (2014) and Caselli and Ciccone (2017).14
The second and third column of Table 6 show that the amplification of human capitalgaps when incorporating the variation in hS,c{hU,c is dramatic. The cross-country variancein human capital is five times larger than the cross-country variance in GDP per worker. Thispartially reflect an extremely high value of hS,c{hU,c estimated for the United States, wherethe share of skilled labor is much higher than in poorer countries, while the skill premium isnot dramatically different. However, even when taking France as a benchmark (fourth andfifth columns), human capital accounts for the majority or the entirety of income gaps withrespect to other countries.
These results are even larger than those reported in Jones (2014). Given that I am usingmuch more recent data, one valid concern is that considering skilled every worker with atleast some secondary education might not be appropriate for my exercise. In 2010, accord-ing to this criterion, 97% of the US labor force is high-skilled, and in a few other countries
14I also follow Jones (2014)’s approach for the construction of skill premia: I impute the wage for eachlevel of eduational attainment using country-specific Mincerian return, and computewS,c andwU,c as weightedaverages across the educational categories belonging to the skilled and unskilled groups. The share of skilledand unskilled workers in 2010 is computed from Barro and Lee (2013)’s data on educational attainment of thepopulation above 25.
20

this share approaches 100%. In the sixth and seventh column of Table 6 I show that, whenusing the completion of secondary school as the minimum requisite for skilled workers, theinferred human capital gaps are somewhat smaller. Still, the main conclusion stands: humancapital can account for most or all the cross-country dispersion in income when incorporat-ing the hS,c{hU,c term.
The last two columns show the results of the alternative exercise proposed in Caselli andCiccone (2017). Here, it is assumed that the variation in human capital only comes from lH,c
and lU,c, while hH,c and hU,c are treated as technology terms. I compute for each country thehuman capital per worker that would result if the shares of skilled and unskilled labor wereequalized with those of the United States,
hUSc “
”
phS,clS,USqε´1ε ` phU,clU,USq
ε´1ε
ıεε´1
and then compare it in the sixth column to hc as computed above. The results suggest thatequalizing educational attainment would actually lower hc in most countries, since havingthe US share of skilled labor would imply negative skill premia given the technology ofthose countries.15 The Success ratio is also substantially lower than what implied by Jones(2014)’s exercise.16
These results suggest that understanding the cross-country variation in hS,c{hU,c is cru-cial to evaluate whether imperfect substitutability amplifies the role of human capital indevelopment accounting. Rossi (2017) shows that the patterns of skill premia across USimmigrants are not consistent with the variation in hS,c{hU,c being driven to a large extentby differences in educational quality or selection into higher education. His results pointtowards the importance of country-specific technological and institutional factors in shapingskill premia, consistently with Caselli and Coleman (2006). Whether other forms of humancapital might contribute the dispersion in hS,c{hU,c is an open area for future reaserch.
4.6 Taking Stock
Development accounting provides a rich picture of the cross-country variation in human cap-ital and its importance for gaps in economic performance. From the approaches reviewedhere, a few messages emerge. First, while educational attainment is higher in rich countries,by itself this contributes relatively little to cross-country differences in income. Second, hu-
15This calculation ignores that in practice skilled workers might be able to work in unskilled occupations,which they would find profitable in such a scenario.
16When hH,c and hU,c are treated as technology parameters, the logarithm of output per worker is notadditively separable in human capital and other factors of production. To calculate Success, I define hc as thehuman capital per worker evaluated at the sample average of hS,c{hU,c, and use the variance of log hc for thenumerator.
21

man capital gaps are more pronounced when dimensions such as educational quality, healthand experience are taken into account. Third, approaches that identify human capital as aresidual find even larger cross-country differences, suggesting that some important dimen-sions of its variation are not captured by the available observable proxies.
5 Quantitative Theory
An alternative approach to the ones described above is to use quantitative models to under-stand how much and why human capital is associated with economic development. Thisallows to bypass some of the measurement issues associated with development accountingand cross-country regressions. Moreover, models are more suitable to ask counterfactualquestions (such as, how much would income increase if a given human capital policy wasimplemented?), given that they can incorporate general equilibrium effects and the link be-tween policy interventions and the endogenous responses of economic actors.
In this subsection I review the insights from two broad types of models. First, I con-sider models where human capital is accumulated endogenously, as a response to variouseconomic fundamentals. Second I discuss models on the allocation, within a given econ-omy, of the human capital of heterogeneous individuals and its consequences in terms of theorganization of production.
5.1 Models of Endogenous Human Capital Accumulation
Consider the general production function in (1). The models reviewed in this section treatH as the endogenous outcome of human capital accumulation decision. They can be seenas providing a mapping
H “ gpA, ξq
where the human capital stock depends on total factor productivity A, typically treated asexogenous, and a vector of exogenous economic, institutional and demographic factors, ξ.Different contributions in the literature vary on how broad the notion of H is (i.e. years ofschooling vs other dimensions) as well as on the factors considered in ξ and the shape of thegp.q function.
This structure can be used to ask two types of (related) questions. First, what explains thedispersion in observable components of H , either across countries and over time? Second,for a given dispersion in A and ξ, how much can we infer H as a whole to be varying acrosscountries? The latter is closely related to the development accounting question, though herethe direct measurement of H is replaced by the computation of the equilibrium outcome ofa human capital accumulation model.
22

A seminal contribution in this literature is Bils and Klenow (2000). This paper focuseson educational attainment as the only source of human capital accumulation, and proposesa model where average years of schooling directly responds to future economic growth.This is because the benefit of more schooling is proportional to future productivity (throughits effect on future wages), while the cost is proportional to current productivity (throughits effect on the opportunity cost of not working). This result, combined with a relativelylimited role of schooling in a growth accounting exercise, leads the authors to conclude thecorrelation between educational attainment and subsequent economic growth is more theresult of reverse causality and omitted factors than a causal effect of the former on the latter.
More recent contributions have considered different determinants of educational choices,as well as richer dimensions of human capital accumulation. As pointed out by Cordoba andRipoll (2013), the mechanism in Bils and Klenow (2000) can account for a small part of thecross-country dispersion in years of schooling. To improve on this, Cordoba and Ripoll(2013) consider a model of educational investment with credit frictions, and find that cross-country differences in fertility, mortality and access to public education are the most impor-tant drivers of the international dispersion in years of schooling. Moreover, by modellingprivate and public expenditures on educational services, their approach delivers endoge-nous cross-country differences in the “quality” of schooling, and gaps in human capital perworker larger than those that can be inferred from years of schooling alone.
Other papers assign a more central role to total factor productivity in driving humancapital accumulation. Erosa et al. (2010) consider a model where human capital dependson two inputs: schooling time and goods (such as food, health investments, extracurricularactivities, and so on). They show that a higher TFP increases the benefit and the time cost ofschooling, but not the cost associated with the expenditures on goods. Since their calibrationimplies a large role for the latter, the model predicts that individuals in countries with higherlevels of TFP endogenously accumulate more human capital, therefore amplifying the effectof TFP on output.
Seshadri and Manuelli (2014) find an even larger amplification of TFP differences dueto human capital accumulation. Compared to Erosa et al. (2010) and Cordoba and Ripoll(2013), this paper adds post-schooling human capital accumulation, in the form of on-the-job training, and an explicit role for early childhood investments. The authors find that rela-tively small differences in TFP are associated with large gaps in human capital per worker,and that these gaps are mostly driven by schooling quality (i.e. the amount of human capitalaccumulated in a given year of schooling) and pre- and post-school investments as opposedto schooling quantity.
Overall, the following key messages emerge from this literature. Across countries, hu-man capital accumulation responds to economic and institutional characteristics, and am-
23
plifies the effect of gaps in productivity. The key margin of this response is not schoolingquantity, but a combination of investments that determine the productivity of a given timespent in school of out-of-school human capital accumulation. This result resounds well withthe conclusions from the development accounting literature discussed above.
5.2 Models of Human Capital Allocation
So far, the discussion has focused on the determinants and the variation of average humancapital per worker. Recently, several papers have focused instead on the skill heterogeneitywithin a given economy, and on the various ways this affects and is affected by the processof economic development. Here, I briefly review contributions on the allocation of differenttypes of human capital in the production process.
One key insight emerging from this literature is that frictions preventing workers frompursuing their comparative advantage are harmful for aggregate economic performance.Hsieh et al. (2013) study the consequences of the discrimination against women and blacksin the United States. They consider a model of human capital accumulation and occupationalchoice, where individuals have heterogeneous talents for different occupations. Blacks andwomen face barriers that limit both their educational and occupational choices. The entity ofthese barriers can be inferred from the equilibrium conditions of the model, allowing the au-thors to evaluate to what extent these frictions have been changing over time. The key resultis that the allocation of talent improved substantially between 1960 and 2008, contributingto aggregate wage and productivity growth.
While these results are relative to the US, the misallocation of human talent likely rep-resents an even larger problem in developing countries. Lagakos and Waugh (2013) showthat subsistence requirement lead workers relatively unproductive in agriculture to work inthat sector, while Jaimovich (2011) argues that the increase in sectoral variety associatedwith development improves the allocation of entrepreneurial talent. Other factors that havenbeen linked to human capital misallocation are financial frictions (Buera et al., 2011) andintergenerational occupational persistence (Sinha, 2016). Overall, this line of work suggeststhat improving the allocation of existing talent might be as important as encouraging theaccumulation of new human capital.
Another strand of this recent literature has focused on understanding how the endoge-nous allocation of production roles across individuals with different skills is related to theprocess of economic development. Many of these papers build on the seminal contributionof Lucas (1978), which develops a model where the most talented individuals become man-agers and leverage their human capital by increasing the size of their firms. Roys and Se-shadri (2014) introduce two variations to this framework: endogenous human capital accu-mulation decisions and imperfect substitutability between the quantity and quality of work-
24

ers. By varying exogenously aggregate TFP, the model is able to account for many cross-country patterns on the organization of production, such as lower firm and wage growth andhigher dispersion in firm and labor productivity in poor countries.
Porzio (2017) studies the interaction between the allocation of talent and technologyadoption. He shows that in poorer countries, where firms have the opportunity to importtechnologies much more advanced than the locally prevailing vintage, the equilibrium al-location features more concentration of talent and more productivity dispersion across pro-duction teams. This prediction is supported by the fact that in developing countries workerswith different skills, as proxied by educational attainment, are relatively more segregatedacross different sectors. The model is also able to account for a sizeable part of the largerproductivity dispersion across sectors in poor countries.
This line of research is only in its early stages, and still far from definite conclusions.However, these contribution do suggests that the accumulation and allocation of humancapital is a key factor in shaping many features of economic development.
6 Conclusions
Economists have studied the relationship between human capital and economic developmentthrough a variety of methodologies. While all the approaches reviewed in this paper comewith their own limitations, an overarching consideration of their findings does lead to somegeneral lessons.
Human capital is an important ingredient of economic development. By any metric,rich countries are more abundant in human capital compared to poor countries. The gap isparticularly meaningful when the notion of human capital is broadened to go beyond ed-ucational attainment, and to incorporate differences in schooling quality and out-of-schoolinvestments in skills. Moreover, human capital plays an important role in shaping technol-ogy, productivity, wages and the firm size distribution along the process of development.
The cross-country dispersion in these forms of human capital calls for a better under-standing of their determinants and implications. Differences in early childhood investments,within-family interactions and institutional features of educational systems might all be im-portant factors behind cross-country gaps in economic performance. Better quantificationsand characterizations of their roles are promising avenues for future work.
25
References
Acemoglu, Daron and Simon Johnson, “Disease and Development: The Effect of LifeExpectancy on Economic Growth,” Journal of Political Economy, December 2007, 115
(6), 925–985.
, Francisco A. Gallego, and James A. Robinson, “Institutions, Human Capital, andDevelopment ,” Annual Review of Economics, August 2014, 6 (1), 875–912.
, Simon Johnson, and James A. Robinson, “The Colonial Origins of Comparative De-velopment: An Empirical Investigation,” American Economic Review, December 2001,91 (5), 1369–1401.
Barro, Robert J. and Jong Wha Lee, “A New Data Set of Educational Attainment in theWorld, 1950-2010,” Journal of Development Economics, 2013, 104 (C), 184–198.
Bils, Mark and Peter J. Klenow, “Does Schooling Cause Growth?,” American Economic
Review, December 2000, 90 (5), 1160–1183.
Bloom, David E., David Canning, and Gunther Fink, “Disease and Development Revis-ited,” Journal of Political Economy, 2014, 122 (6), 1355–1366.
Buera, Francisco J., Joseph P. Kaboski, and Yongseok Shin, “Finance and Development:A Tale of Two Sectors,” American Economic Review, August 2011, 101 (5), 1964–2002.
Caselli, Francesco, “Accounting for Cross-Country Income Differences,” in PhilippeAghion and Steven Durlauf, eds., Handbook of Economic Growth, Vol. 1 of Handbook of
Economic Growth, Elsevier, 2005, chapter 9, pp. 679–741.
and Antonio Ciccone, “The contribution of schooling in development accounting: Re-sults from a nonparametric upper bound,” Journal of Development Economics, 2013, 104
(C), 199–211.
and , “The Human Capital Stock: A Generalized Approach Comment,” DiscussionPapers 1733, Centre for Macroeconomics (CFM) November 2017.
and Daniel J. Wilson, “Importing technology,” Journal of Monetary Economics, January2004, 51 (1), 1–32.
and Wilbur John Coleman, “The World Technology Frontier,” American Economic
Review, June 2006, 96 (3), 499–522.
, Jacopo Ponticelli, and Federico Rossi, A New Data Set on Mincerian Returns Tech-nology Differences across Space and Time, Princeton University Press, 2016.
26

Ciccone, Antonio and Elias Papaioannou, “Human Capital, the Structure of Production,and Growth,” The Review of Economics and Statistics, February 2009, 91 (1), 66–82.
and Giovanni Peri, “Long-Run Substitutability Between More and Less Educated Work-ers: Evidence from U.S. States, 1950-1990,” The Review of Economics and Statistics,November 2005, 87 (4), 652–663.
Cohen, Daniel and Marcelo Soto, “Growth and human capital: good data, good results,”Journal of Economic Growth, March 2007, 12 (1), 51–76.
Cordoba, Juan Carlos and Marla Ripoll, “What explains schooling differences acrosscountries?,” Journal of Monetary Economics, 2013, 60 (2), 184–202.
De Philippis, Marta and Federico Rossi, “Parents, Schools and Human Capital Differ-ences across Countries,” CFM Discussion Paper 2016-14 2016.
Erosa, Andres, Tatyana Koreshkova, and Diego Restuccia, “How Important Is HumanCapital? A Quantitative Theory Assessment of World Income Inequality,” Review of
Economic Studies, 2010, 77 (4), 1421–1449.
Flabbi, Luca and Roberta Gatti, “A Primer on Human Capital,” World Bank Policy Re-search Working Paper 8309, World Bank January 2018.
Gennaioli, Nicola, Rafael La Porta, Florencio Lopez de Silanes, and Andrei Shleifer,“Human Capital and Regional Development,” The Quarterly Journal of Economics, 2013,128 (1), 105–164.
Glaeser, Edward L., Rafael La Porta, Florencio Lopez de Silanes, and Andrei Shleifer,“Do Institutions Cause Growth?,” Journal of Economic Growth, September 2004, 9 (3),271–303.
Hall, Robert E. and Charles I. Jones, “Why Do Some Countries Produce So Much MoreOutput per Worker than Others?,” The Quarterly Journal of Economics, February 1999,114 (1), 83–116.
Hanushek, Eric A. and Ludger Woessmann, “Do Better Schools lead to More Growth?Cognitive Skills, Economic Outcomes, and Causation,” Journal of Economic Growth,2012, 17 (4), 267–321.
and , “Schooling, educational achievement, and the Latin American growth puzzle,”Journal of Development Economics, 2012, 99 (2), 497–512.
27

, Jens Ruhose, and Ludger Woessmann, “Knowledge Capital and Aggregate IncomeDifferences: Development Accounting for US States,” American Economic Journal:
Macroeconomics, October 2017, 9 (4), 184–224.
Hendricks, Lutz, “How Important Is Human Capital for Development? Evidence fromImmigrant Earnings,” American Economic Review, 2002, 92 (1), 198–219.
and Todd Schoellman, “Human Capital and Development Accounting: New Evidencefrom Wage Gains at Migration*,” The Quarterly Journal of Economics, 2018, 133 (2),665–700.
Hidalgo-Cabrillana, Ana, Zoe Kuehn, and Cristina Lopez-Mayan, “Development ac-counting using PIAAC data,” SERIEs: Journal of the Spanish Economic Association,2017, 8 (4), 373–399.
Hsieh, Chang-Tai, Erik Hurst, Charles I. Jones, and Peter J. Klenow, “The Allocationof Talent and U.S. Economic Growth,” NBER Working Papers 18693, National Bureauof Economic Research Jan 2013.
Islam, Nazrul, “Growth Empirics: A Panel Data Approach,” The Quarterly Journal of
Economics, 1995, 110 (4), 1127–1170.
Jaimovich, Esteban, “Sectoral differentiation, allocation of talent, and financial develop-ment,” Journal of Development Economics, September 2011, 96 (1), 47–60.
Jones, Benjamin F., “The Human Capital Stock: A Generalized Approach,” American Eco-
nomic Review, November 2014, 104 (11), 3752–3777.
Katz, Lawrence F. and Kevin M. Murphy, “Changes in Relative Wages, 1963-1987: Sup-ply and Demand Factors,” The Quarterly Journal of Economics, 1992, 107 (1), 35–78.
Klenow, Peter and Andres Rodrıguez-Clare, “The Neoclassical Revival in Growth Eco-nomics: Has It Gone Too Far?,” in “NBER Macroeconomics Annual 1997, Volume 12”NBER Chapters, National Bureau of Economic Research, May 1997, pp. 73–114.
and , “The Neoclassical Revival in Growth Economics: Has It Gone Too Far?,” in“NBER Macroeconomics Annual 1997, Volume 12” NBER Chapters, National Bureauof Economic Research, Inc, 1997, pp. 73–114.
Krusell, Per, Lee E. Ohanian, Jose-Victor Rios-Rull, and Giovanni L. Violante,“Capital-Skill Complementarity and Inequality: A Macroeconomic Analysis,” Econo-
metrica, September 2000, 68 (5), 1029–1054.
28
Lagakos, David and Michael E. Waugh, “Selection, Agriculture, and Cross-Country Pro-ductivity Differences,” American Economic Review, April 2013, 103 (2), 948–980.
, Benjamin Moll, Tommaso Porzio, Nancy Qian, and Todd Schoellman, “Life-CycleHuman Capital Accumulation Across Countries: Lessons From U.S. Immigrants,” NBERWorking Papers 21914, National Bureau of Economic Research January 2016.
, , , , and , “Life Cycle Wage Growth across Countries,” Journal of Political
Economy, 2018, 126 (2), 797–849.
Lindahl, Mikael and Alan B. Krueger, “Education for Growth: Why and for Whom?,”Journal of Economic Literature, December 2001, 39 (4), 1101–1136.
Lucas, Robert, “On the Size Distribution of Business Firms,” Bell Journal of Economics,Autumn 1978, 9 (2), 508–523.
Malmberg, Hannes, “How does the eciency of skilled labor vary across rich and poorcountries? An analysisusing trade and industry data,” Working Paper 2018.
Mankiw, N. Gregory, David Romer, and David N. Weil, “A Contribution to the Empiricsof Economic Growth,” The Quarterly Journal of Economics, 1992, 107 (2), 407–437.
Mincer, Jacob A., Schooling, Experience, and Earnings, New York: Columbia UniversityPress, 1974.
Nelson, Richard R. and Edmund S. Phelps, “Investment in Humans, Technological Dif-fusion, and Economic Growth,” The American Economic Review, 1966, 56 (1/2), 69–75.
Nickell, Stephen J, “Biases in Dynamic Models with Fixed Effects,” Econometrica,November 1981, 49 (6), 1417–1426.
Porzio, Tommaso, “Cross-Country Differences in the Optimal Allocation of Talent andTechnology,” Working Paper 2017.
Psacharopoulos, George, “Returns to investment in education: A global update,” World
Development, September 1994, 22 (9), 1325–1343.
and Harry Anthony Patrinos, “Returns to investment in education: a further update,”Education Economics, 2004, 12 (2), 111–134.
Rossi, Federico, “The Relative Efficiency of Skilled Labor across Countries: Measurementand Interpretation,” Working Paper 2017.
29

Roys, Nicolas and Ananth Seshadri, “Economic Development and the Organization ofProduction,” Working Paper 2014.
Schoellman, Todd, “Education Quality and Development Accounting,” Review of Eco-
nomic Studies, 2012, 79 (1), 388–417.
Seshadri, Ananth and Rodolfo Manuelli, “Human Capital and the Wealth of Nations,”American Economic Review, 2014.
Sinha, Rishabh, “Intergenerational Occupational Mobility and Labor Productivity,” Work-ing Paper 2016.
Weil, David N., “Accounting for the Effect Of Health on Economic Growth*,” The Quar-
terly Journal of Economics, 2007, 122 (3), 1265–1306.
Woessmann, Ludger, “The Importance of School Systems: Evidence from InternationalDifferences in Student Achievement,” Journal of Economic Perspectives, 2016, 30 (3),3–32.
Young, Alwyn, “The Gift of the Dying: The Tragedy of AIDS and the Welfare of FutureAfrican Generations,” Quarterly Journal of Economics, May 2005, 120.
30

Figures
Figure 1: Educational Attainment and Economic Development
ALB
DZA
ARG
ARMAUS
AUT
BHR
BGD
BRB
BELBLZ
BEN
BOL
BWA
BRA
BRN
BGR
BDI
KHM
CMR
CAN
CAF
CHL
CHNCOL
COG
CRI
CIV
HRV CYP
CZE
COD
DNK
DOMECUEGY
SLV
EST
FJIFIN
FRA
GAB
GMB
DEU
GHA
GRC
GTMHTI
HND
HKG
HUN
ISL
IND
IDNIRN
IRQ
IRLISR
ITAJAM
JPN
JOR
KAZ
KEN KWT
KGZ
LAO
LVA
LSO
LBR
LTU LUX
MAC
MWI
MYS
MDV
MLI
MLT
MRT
MUSMEX
MDA
MNG
MAR
MOZ
MMR
NAM
NPL
NLDNZL
NIC
NER
NOR
PAK
PAN
PRY
PERPHL
POL
PRT
QAT
ROURUS
RWA
SAU
SEN
SRB
SLE
SGP
SVKSVN
ZAF
KOR
ESPLKA
SDNSWZ
SWE
CHE
SYR
TWNTJK
TZA
THA
TGO
TTO
TUN TUR
UGA
UKR
ARE
GBR
USA
URYVENVNM
YEM
ZMBZWE
05
1015
Aver
age
Year
s of
Sch
oolin
g (2
010)
7 8 9 10 11 12Log GDP per worker in PPP (2010)
Notes: The figure plots average years of schooling in the population above 25 against log GDP per worker in2010.
31

Figure 2: Performance in Cognitive Tests and Economic Development
ALBARG
ARM
AUSAUT
BHR
BEL
BOL
BWABRA
BGRCAN
CHL
CHN
COL
CRI CYP
CZEDNK
ECU
EGY
SLV
EST FINFRADEU
GHA
GRC
GTM
HND
HKGHUN
ISL
IND
IDN
IRN
IRL
ISR ITA
JPN
JORKWT
LVALTULUX
MAC
MYS
MEX
MDA
MAR
NLDNZL
NOR
PANPRY PER
PHL
POL
PRTROU
RUS
SAU
SRB
SGP
SVKSVN
ZAF
KOR
ESP
SWZ
SWECHE
TWN
THA
TUN
TUR
GBR USA
URY
VEN
ZWE
23
45
6Av
erag
e Pe
rform
ance
in C
ogni
tive
Test
s
8 9 10 11 12Log GDP per worker in PPP (2010)
Notes: The figure plots the average performance in a sample of standardized cognitive tests from Hanushek andWoessmann (2012a) against log GDP per worker in 2010. Test scores are normalized so that the individual-level average and standard deviation across students in OECD countries are 5 and 1 respectively.
32

Figure 3: Health and Economic Development
ALBDZAARG
ARM
AUSAUTBHR
BGD
BRBBEL
BLZ
BEN
BOL
BWA
BRA
BRN
BGR
BDI
KHM
CMR
CAN
CAF
CHLCHN
COL
COG
CRI
CIV
HRV
CYP
CZE
COD
DNK
DOMECU
EGYSLV
EST
FJI
FINFRA
GABGMB
DEU
GHA
GRC
GTM
HTI
HND
HKG
HUN
ISL
INDIDN
IRN
IRQ
IRLISR ITA
JAM
JPN
JOR
KAZ
KEN
KWT
KGZ
LAO
LVA
LSO
LBR
LTU
LUXMAC
MWI
MYSMDV
MLI
MLT
MRT
MUSMEX
MDAMNG
MAR
MOZ
MMR
NAM
NPL
NLDNZL
NIC
NER
NOR
PAK
PAN
PRYPER
PHL
POL
PRT QAT
ROU
RUSRWA
SAU
SEN
SRB
SLE
SGP
SVK
SVN
ZAF
ESP
LKA
SDN
SWZ
SWECHE
SYRTJK
TZA
THA
TGO
TTO
TUN TUR
UGA
UKR
AREGBR
USAURY
VENVNM
YEM
ZMB
ZWE
.2.4
.6.8
1Su
rviva
l Rat
e to
Age
65
7 8 9 10 11 12Log GDP per worker in PPP (2010)
Notes: The figure plots the survival rate to age 65 against log GDP per worker in 2010.
33

Tables
Table 1: Development Accounting - Educational Attainment
Educational Attainment
yUS{yc hUS{hc ShareUSc
15th Percentile (Ghana) 17.62 1.95 0.1130th Percentile (Philippines) 7.25 1.69 0.2345th Percentile (Brazil) 4.08 1.78 0.4460th Percentile (Argentina) 2.51 1.48 0.5975th Percentile (New Zealand) 1.78 1.24 0.6990th Percentile (France) 1.25 1.32 1.06
Average 9.40 1.81 0.50
# Countries 130Success (%) 8.05
Notes: The Table shows development accounting results when human capital is measured as educationalattainment.
34
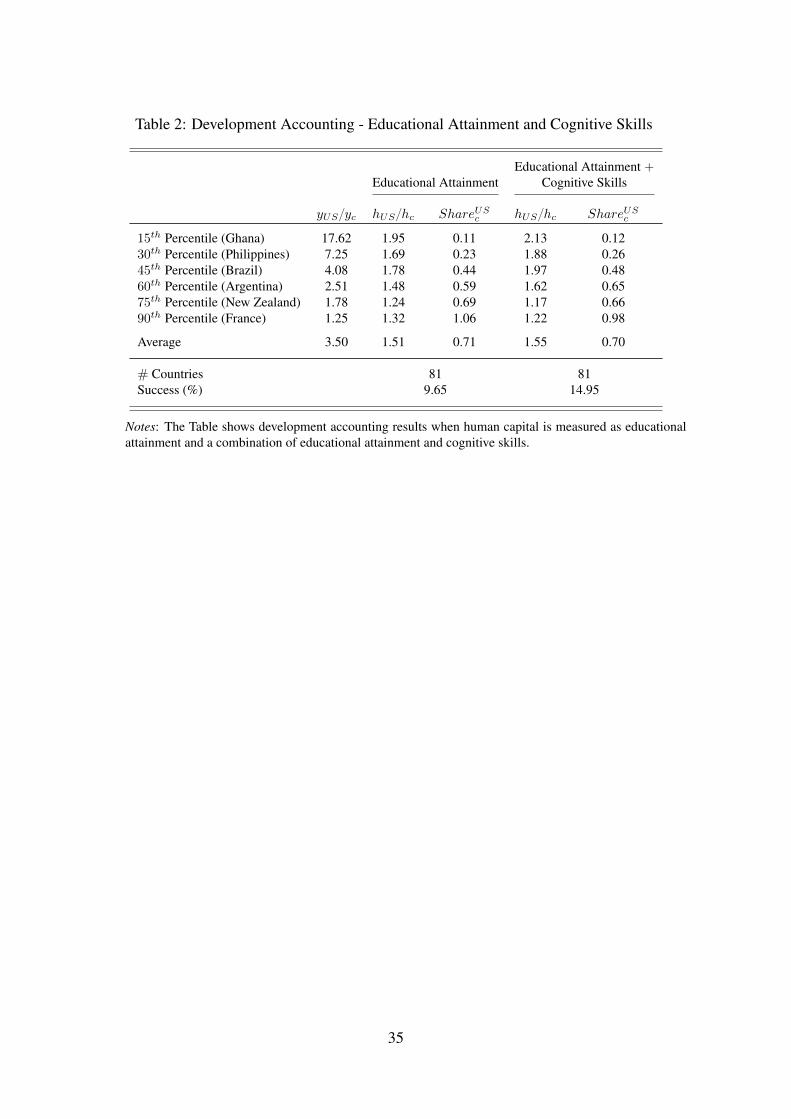
Table 2: Development Accounting - Educational Attainment and Cognitive Skills
Educational Attainment `Educational Attainment Cognitive Skills
yUS{yc hUS{hc ShareUSc hUS{hc ShareUS
c
15th Percentile (Ghana) 17.62 1.95 0.11 2.13 0.1230th Percentile (Philippines) 7.25 1.69 0.23 1.88 0.2645th Percentile (Brazil) 4.08 1.78 0.44 1.97 0.4860th Percentile (Argentina) 2.51 1.48 0.59 1.62 0.6575th Percentile (New Zealand) 1.78 1.24 0.69 1.17 0.6690th Percentile (France) 1.25 1.32 1.06 1.22 0.98
Average 3.50 1.51 0.71 1.55 0.70
# Countries 81 81Success (%) 9.65 14.95
Notes: The Table shows development accounting results when human capital is measured as educationalattainment and a combination of educational attainment and cognitive skills.
35

Table 3: Development Accounting - Health
Educational Attainment `Health
yUS{yc hUS{hc ShareUSc
15th Percentile (Ghana) 17.62 2.29 0.1330th Percentile (Philippines) 7.25 1.87 0.2645th Percentile (Brazil) 4.08 1.86 0.4660th Percentile (Argentina) 2.51 1.52 0.6075th Percentile (New Zealand) 1.78 1.20 0.6790th Percentile (France) 1.25 1.29 1.03
Average 9.40 1.99 0.51
# Countries 130Success (%) 11.90
Notes: The Table shows development accounting results when human capital is measured as a combinationof educational attainment and health.
36

Table 4: Development Accounting - Educational Attainment and Experience
Educational Attainment `Educational Attainment Experience
yFR{yc hFR{hc ShareFRc hFR{hc ShareFR
c
15th Percentile (Ghana) 14.09 1.47 0.10 3.66 0.2630th Percentile (Philippines) 5.80 1.28 0.22 3.83 0.6645th Percentile (Brazil) 3.26 1.35 0.41 2.56 0.7860th Percentile (Argentina) 2.01 1.12 0.56 2.66 1.3275th Percentile (New Zealand) 1.43 0.94 0.66 - -90th Percentile (France) 1 1 1 1 1
Average 4.30 1.25 0.51 2.88 1.06
# Countries 66 66Success (%) 9.25 29.39
Notes: The Table shows development accounting results when human capital is measured as educationalattainment and a combination of educational attainment and experience.
37

Table 5: Development Accounting - Migrants
Hendricks &Schoellman (2012) Schoellman (2018)
yUS{yc hUS{hc ShareUSc hUS{hc ShareUS
c
15th Percentile (Ghana) 17.62 3.79 0.22 9.94 0.5630th Percentile (Philippines) 7.25 2.85 0.39 4.25 0.5945th Percentile (Brazil) 4.08 3.17 0.78 2.95 0.7260th Percentile (Argentina) 2.51 2.20 0.88 1.67 0.6675th Percentile (New Zealand) 1.78 1.53 0.86 1.08 0.6190th Percentile (France) 1.25 1.74 1.39 1.08 0.87
Average 9.40 3.60 0.80 3.98 0.64
# Countries 130 130Success (%) 32.19 52.50
Notes: The Table shows development accounting results when human capital is measured using the ap-proaches of Schoellman (2012) and Hendricks and Schoellman (2018).
38
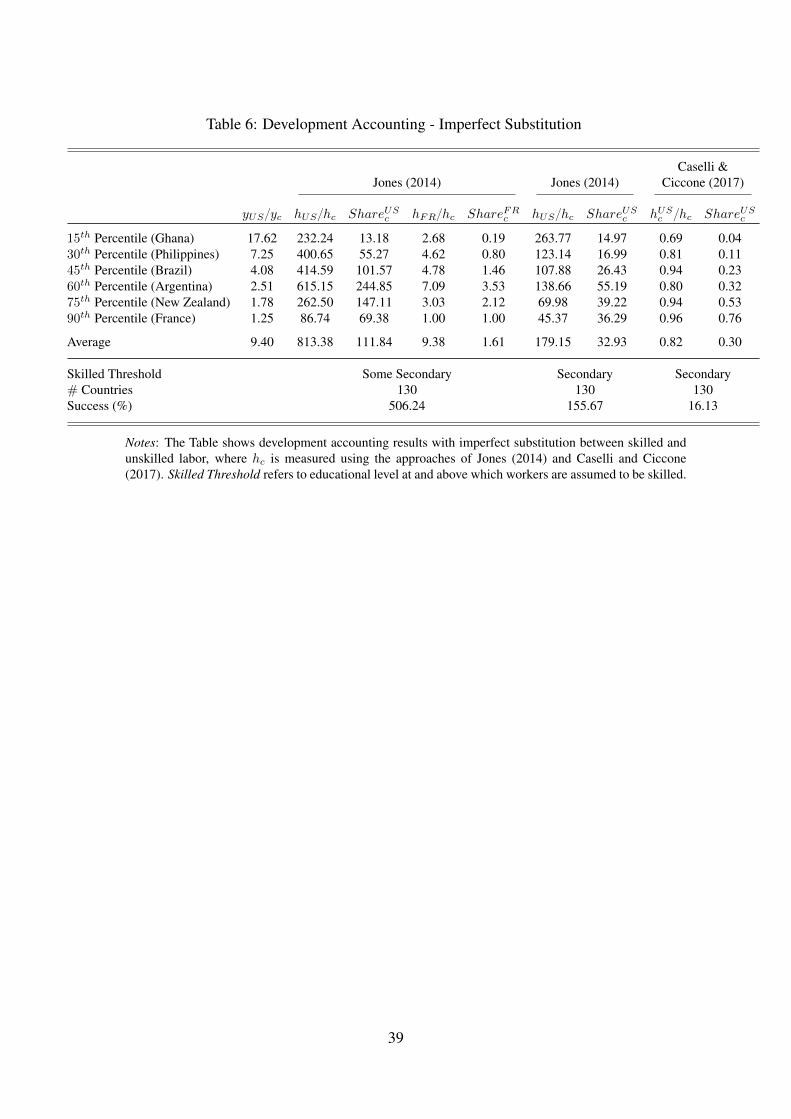
Table 6: Development Accounting - Imperfect Substitution
Caselli &Jones (2014) Jones (2014) Ciccone (2017)
yUS{yc hUS{hc ShareUSc hFR{hc ShareFR
c hUS{hc ShareUSc hUS
c {hc ShareUSc
15th Percentile (Ghana) 17.62 232.24 13.18 2.68 0.19 263.77 14.97 0.69 0.0430th Percentile (Philippines) 7.25 400.65 55.27 4.62 0.80 123.14 16.99 0.81 0.1145th Percentile (Brazil) 4.08 414.59 101.57 4.78 1.46 107.88 26.43 0.94 0.2360th Percentile (Argentina) 2.51 615.15 244.85 7.09 3.53 138.66 55.19 0.80 0.3275th Percentile (New Zealand) 1.78 262.50 147.11 3.03 2.12 69.98 39.22 0.94 0.5390th Percentile (France) 1.25 86.74 69.38 1.00 1.00 45.37 36.29 0.96 0.76
Average 9.40 813.38 111.84 9.38 1.61 179.15 32.93 0.82 0.30
Skilled Threshold Some Secondary Secondary Secondary# Countries 130 130 130Success (%) 506.24 155.67 16.13
Notes: The Table shows development accounting results with imperfect substitution between skilled andunskilled labor, where hc is measured using the approaches of Jones (2014) and Caselli and Ciccone(2017). Skilled Threshold refers to educational level at and above which workers are assumed to be skilled.
39