Embed Size (px)
Citation preview
Neuron
Article
Human Areas V3A and V6 Compensatefor Self-Induced Planar Visual MotionElvira Fischer,1,2,5 Heinrich H. Bulthoff,2,3 Nikos K. Logothetis,2,4 and Andreas Bartels1,2,5,*1Vision and Cognition Lab, Centre of Integrative Neuroscience, University of Tubingen, 72076 Tubingen, Germany2Max Planck Institute for Biological Cybernetics, 72076 Tubingen, Germany3Department of Brain and Cognitive Engineering, Korea University, Seoul 136-713, Korea4Division of Imaging Science and Biomedical Engineering, University of Manchester, Manchester M13 9PT, UK5These authors contributed equally to this work
*Correspondence: [email protected]
DOI 10.1016/j.neuron.2012.01.022
SUMMARY
Little is known about mechanismsmediating a stableperception of the world during pursuit eye move-ments. Here, we used fMRI to determine to whatextent human motion-responsive areas integrateplanar retinal motion with nonretinal eye movementsignals in order to discard self-induced planar retinalmotion and to respond to objective (‘‘real’’) motion.In contrast to other areas, V3A lacked responsesto self-induced planar retinal motion but respondedstrongly to head-centered motion, even whenretinally canceled by pursuit. This indicates a near-complete multimodal integration of visual with non-visual planar motion signals in V3A. V3A could bemapped selectively and robustly in every singlesubject on this basis. V6 also reported head-centeredplanarmotion, evenwhen3Dflowwasadded to it, butwas suppressed by retinal planar motion. These find-ings suggest a dominant contribution of human areasV3A and V6 to head-centered motion perception andto perceptual stability during eye movements.
INTRODUCTION
Whenwe visually track amoving object with eyemovements, the
world around us appears still despite the self-induced retinal
motion, demonstrating the remarkable capability of the visual
system to integrate retinal motion signals with nonretinal signals
during eye movements (Gibson, 1954; Ilg et al., 2004; Royden
et al., 1992). A failure of this integration leads to the false percep-
tion of environmental motion during eyemovements as observed
in a patient with bilateral parieto-occipital lesions (Haarmeier
et al., 1997). Single-unit studies in the macaque have shown
the presence of so-called ‘‘real-motion’’ neurons in several
cortical regions that receive efference signals of eye or head
movements, such as V3A, MST, VIP, V6, and the visual posterior
sylvian (VPS) area (Dicke et al., 2008; Erickson and Thier, 1991;
Galletti et al., 1990; Ilg et al., 2004; Zhang et al., 2004). These
neurons respond to moving stimuli during fixation, but reduce
or abolish responses when retinal motion is induced by active
1228 Neuron 73, 1228–1240, March 22, 2012 ª2012 Elsevier Inc.
pursuit over a static target, andare thought tomediate perceptual
stability during visual pursuit. In the human brain, comparably
little is known about this type of ‘‘objective’’ or head-centered
motion response. Among motion-responsive regions V5/MT,
MST, V3A, medial parietal and cingulate regions (Morrone
et al., 2000;Orbanet al., 2003; Tootell et al., 1997;Wall andSmith,
2008),MST,CSv, andputativeVIPhomologs havebeen shown to
prefer complexmotion types compatible with egomotion such as
3D forward-flow or full-field planar motion (Bartels et al., 2008b;
Fischer et al., 2011; Morrone et al., 2000; Peuskens et al., 2001;
Wall and Smith, 2008), and to integrate visual motion signals
across nonvisual modalities (Sereno and Huang, 2006; Smith
et al., 2011). In particular, V5/MT, MST, V3A, and V6 have been
similarly implicated in the integration of eye movement signals
with heading-related forward flow (Arnoldussen et al., 2011;
Goossens et al., 2006), as well as in spatiotopic responses at
fixed eye positions (Crespi et al., 2011; d’Avossa et al., 2007).
However, prior human studies have not examined the neural
substrates involved in integrating pursuit eye movements with
planar motion, which involves neural substrates that are distinct
from those involved in processing heading-related expansion
flow (Duffy and Wurtz, 1995; Gu et al., 2008; Morrone et al.,
2000; Royden and Vaina, 2004; Zhang et al., 2004). In contrast
to forward-heading cues, retinal 2D planar motion can be directly
integrated with efferent copies of eyemovements. Human neural
structures involved in discounting pursuit eye movement signals
from planar retinal motion signals have not been systematically
studied. In this study we, therefore, used a paradigm that
combined physical planar motion with pursuit in such a way
that responses to objective as well as to retinal motion could
be separated without confounds related to eye movements.
We analyzed responses in individually localized areas V3A,
V3B, V5/MT, MST, V6, and VPS, and additionally examined
voxel-wise responses across the whole brain. Both analyses
revealed a unique integration of pursuit with visual motion signals
in V3A that responded exclusively in a head-centered frame of
reference. V6 integrated signals similarly well but was addition-
ally suppressed by retinal motion.
RESULTS
We localized visual areas V5/MT, MST, V3A, V3B, V6, and VPS
using retinotopy and additional standard localizer procedures
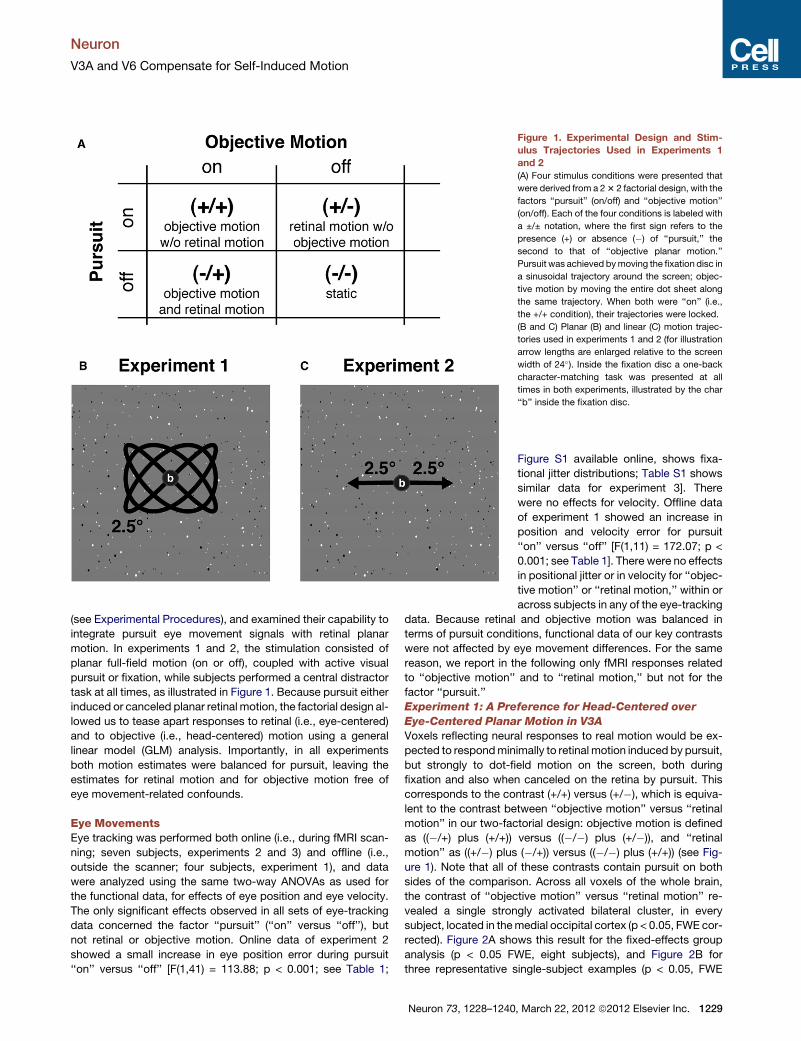
Figure 1. Experimental Design and Stim-
ulus Trajectories Used in Experiments 1
and 2
(A) Four stimulus conditions were presented that
were derived from a 23 2 factorial design, with the
factors ‘‘pursuit’’ (on/off) and ‘‘objective motion’’
(on/off). Each of the four conditions is labeled with
a ±/± notation, where the first sign refers to the
presence (+) or absence (�) of ‘‘pursuit,’’ the
second to that of ‘‘objective planar motion.’’
Pursuit was achieved bymoving the fixation disc in
a sinusoidal trajectory around the screen; objec-
tive motion by moving the entire dot sheet along
the same trajectory. When both were ‘‘on’’ (i.e.,
the +/+ condition), their trajectories were locked.
(B and C) Planar (B) and linear (C) motion trajec-
tories used in experiments 1 and 2 (for illustration
arrow lengths are enlarged relative to the screen
width of 24�). Inside the fixation disc a one-back
character-matching task was presented at all
times in both experiments, illustrated by the char
‘‘b’’ inside the fixation disc.
Neuron
V3A and V6 Compensate for Self-Induced Motion
(see Experimental Procedures), and examined their capability to
integrate pursuit eye movement signals with retinal planar
motion. In experiments 1 and 2, the stimulation consisted of
planar full-field motion (on or off), coupled with active visual
pursuit or fixation, while subjects performed a central distractor
task at all times, as illustrated in Figure 1. Because pursuit either
induced or canceled planar retinal motion, the factorial design al-
lowed us to tease apart responses to retinal (i.e., eye-centered)
and to objective (i.e., head-centered) motion using a general
linear model (GLM) analysis. Importantly, in all experiments
both motion estimates were balanced for pursuit, leaving the
estimates for retinal motion and for objective motion free of
eye movement-related confounds.
Eye MovementsEye tracking was performed both online (i.e., during fMRI scan-
ning; seven subjects, experiments 2 and 3) and offline (i.e.,
outside the scanner; four subjects, experiment 1), and data
were analyzed using the same two-way ANOVAs as used for
the functional data, for effects of eye position and eye velocity.
The only significant effects observed in all sets of eye-tracking
data concerned the factor ‘‘pursuit’’ (‘‘on’’ versus ‘‘off’’), but
not retinal or objective motion. Online data of experiment 2
showed a small increase in eye position error during pursuit
‘‘on’’ versus ‘‘off’’ [F(1,41) = 113.88; p < 0.001; see Table 1;
Neuron 73, 1228–1240
Figure S1 available online, shows fixa-
tional jitter distributions; Table S1 shows
similar data for experiment 3]. There
were no effects for velocity. Offline data
of experiment 1 showed an increase in
position and velocity error for pursuit
‘‘on’’ versus ‘‘off’’ [F(1,11) = 172.07; p <
0.001; see Table 1]. There were no effects
in positional jitter or in velocity for ‘‘objec-
tive motion’’ or ‘‘retinal motion,’’ within or
across subjects in any of the eye-tracking
data. Because retinal and objective motion was balanced in
terms of pursuit conditions, functional data of our key contrasts
were not affected by eye movement differences. For the same
reason, we report in the following only fMRI responses related
to ‘‘objective motion’’ and to ‘‘retinal motion,’’ but not for the
factor ‘‘pursuit.’’
Experiment 1: A Preference for Head-Centered over
Eye-Centered Planar Motion in V3A
Voxels reflecting neural responses to real motion would be ex-
pected to respondminimally to retinal motion induced by pursuit,
but strongly to dot-field motion on the screen, both during
fixation and also when canceled on the retina by pursuit. This
corresponds to the contrast (+/+) versus (+/�), which is equiva-
lent to the contrast between ‘‘objective motion’’ versus ‘‘retinal
motion’’ in our two-factorial design: objective motion is defined
as ((�/+) plus (+/+)) versus ((�/�) plus (+/�)), and ‘‘retinal
motion’’ as ((+/�) plus (�/+)) versus ((�/�) plus (+/+)) (see Fig-
ure 1). Note that all of these contrasts contain pursuit on both
sides of the comparison. Across all voxels of the whole brain,
the contrast of ‘‘objective motion’’ versus ‘‘retinal motion’’ re-
vealed a single strongly activated bilateral cluster, in every
subject, located in themedial occipital cortex (p < 0.05, FWE cor-
rected). Figure 2A shows this result for the fixed-effects group
analysis (p < 0.05 FWE, eight subjects), and Figure 2B for
three representative single-subject examples (p < 0.05, FWE
, March 22, 2012 ª2012 Elsevier Inc. 1229
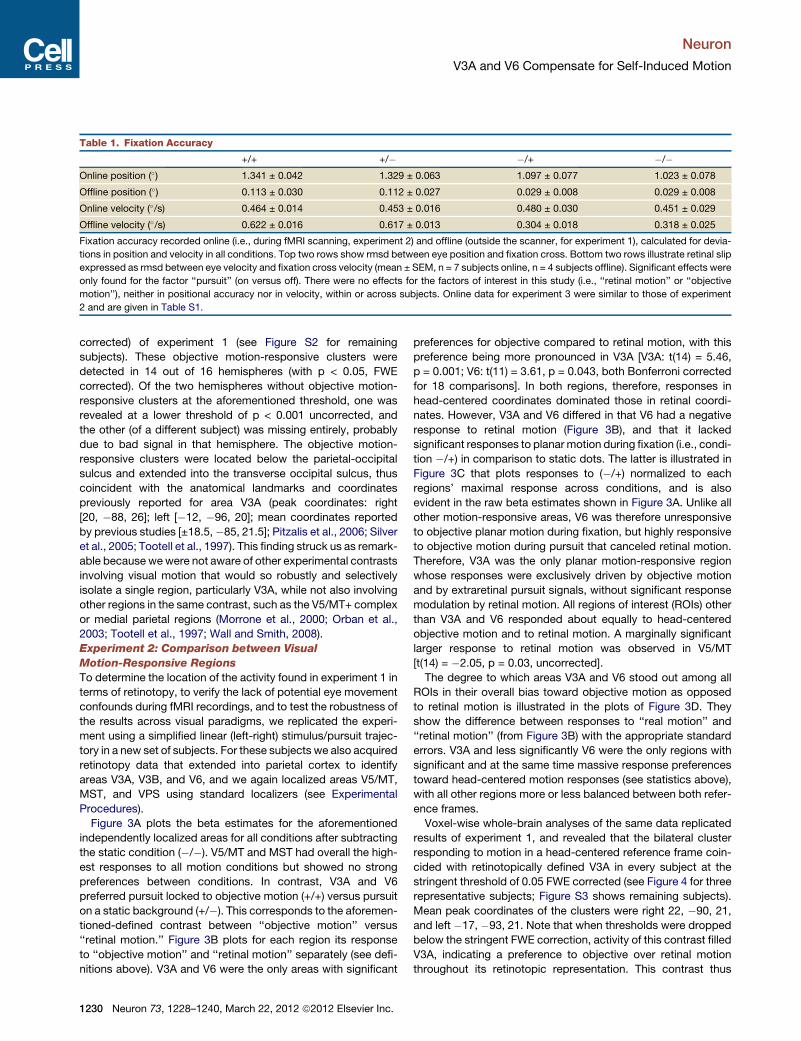
Table 1. Fixation Accuracy
+/+ +/� �/+ �/�Online position (�) 1.341 ± 0.042 1.329 ± 0.063 1.097 ± 0.077 1.023 ± 0.078
Offline position (�) 0.113 ± 0.030 0.112 ± 0.027 0.029 ± 0.008 0.029 ± 0.008
Online velocity (�/s) 0.464 ± 0.014 0.453 ± 0.016 0.480 ± 0.030 0.451 ± 0.029
Offline velocity (�/s) 0.622 ± 0.016 0.617 ± 0.013 0.304 ± 0.018 0.318 ± 0.025
Fixation accuracy recorded online (i.e., during fMRI scanning, experiment 2) and offline (outside the scanner, for experiment 1), calculated for devia-
tions in position and velocity in all conditions. Top two rows show rmsd between eye position and fixation cross. Bottom two rows illustrate retinal slip
expressed as rmsd between eye velocity and fixation cross velocity (mean ± SEM, n = 7 subjects online, n = 4 subjects offline). Significant effects were
only found for the factor ‘‘pursuit’’ (on versus off). There were no effects for the factors of interest in this study (i.e., ‘‘retinal motion’’ or ‘‘objective
motion’’), neither in positional accuracy nor in velocity, within or across subjects. Online data for experiment 3 were similar to those of experiment
2 and are given in Table S1.
Neuron
V3A and V6 Compensate for Self-Induced Motion
corrected) of experiment 1 (see Figure S2 for remaining
subjects). These objective motion-responsive clusters were
detected in 14 out of 16 hemispheres (with p < 0.05, FWE
corrected). Of the two hemispheres without objective motion-
responsive clusters at the aforementioned threshold, one was
revealed at a lower threshold of p < 0.001 uncorrected, and
the other (of a different subject) was missing entirely, probably
due to bad signal in that hemisphere. The objective motion-
responsive clusters were located below the parietal-occipital
sulcus and extended into the transverse occipital sulcus, thus
coincident with the anatomical landmarks and coordinates
previously reported for area V3A (peak coordinates: right
[20, �88, 26]; left [�12, �96, 20]; mean coordinates reported
by previous studies [±18.5,�85, 21.5]; Pitzalis et al., 2006; Silver
et al., 2005; Tootell et al., 1997). This finding struck us as remark-
able because wewere not aware of other experimental contrasts
involving visual motion that would so robustly and selectively
isolate a single region, particularly V3A, while not also involving
other regions in the same contrast, such as the V5/MT+ complex
or medial parietal regions (Morrone et al., 2000; Orban et al.,
2003; Tootell et al., 1997; Wall and Smith, 2008).
Experiment 2: Comparison between Visual
Motion-Responsive Regions
To determine the location of the activity found in experiment 1 in
terms of retinotopy, to verify the lack of potential eye movement
confounds during fMRI recordings, and to test the robustness of
the results across visual paradigms, we replicated the experi-
ment using a simplified linear (left-right) stimulus/pursuit trajec-
tory in a new set of subjects. For these subjects we also acquired
retinotopy data that extended into parietal cortex to identify
areas V3A, V3B, and V6, and we again localized areas V5/MT,
MST, and VPS using standard localizers (see Experimental
Procedures).
Figure 3A plots the beta estimates for the aforementioned
independently localized areas for all conditions after subtracting
the static condition (�/�). V5/MT and MST had overall the high-
est responses to all motion conditions but showed no strong
preferences between conditions. In contrast, V3A and V6
preferred pursuit locked to objective motion (+/+) versus pursuit
on a static background (+/�). This corresponds to the aforemen-
tioned-defined contrast between ‘‘objective motion’’ versus
‘‘retinal motion.’’ Figure 3B plots for each region its response
to ‘‘objective motion’’ and ‘‘retinal motion’’ separately (see defi-
nitions above). V3A and V6 were the only areas with significant
1230 Neuron 73, 1228–1240, March 22, 2012 ª2012 Elsevier Inc.
preferences for objective compared to retinal motion, with this
preference being more pronounced in V3A [V3A: t(14) = 5.46,
p = 0.001; V6: t(11) = 3.61, p = 0.043, both Bonferroni corrected
for 18 comparisons]. In both regions, therefore, responses in
head-centered coordinates dominated those in retinal coordi-
nates. However, V3A and V6 differed in that V6 had a negative
response to retinal motion (Figure 3B), and that it lacked
significant responses to planar motion during fixation (i.e., condi-
tion �/+) in comparison to static dots. The latter is illustrated in
Figure 3C that plots responses to (�/+) normalized to each
regions’ maximal response across conditions, and is also
evident in the raw beta estimates shown in Figure 3A. Unlike all
other motion-responsive areas, V6 was therefore unresponsive
to objective planar motion during fixation, but highly responsive
to objective motion during pursuit that canceled retinal motion.
Therefore, V3A was the only planar motion-responsive region
whose responses were exclusively driven by objective motion
and by extraretinal pursuit signals, without significant response
modulation by retinal motion. All regions of interest (ROIs) other
than V3A and V6 responded about equally to head-centered
objective motion and to retinal motion. A marginally significant
larger response to retinal motion was observed in V5/MT
[t(14) = �2.05, p = 0.03, uncorrected].
The degree to which areas V3A and V6 stood out among all
ROIs in their overall bias toward objective motion as opposed
to retinal motion is illustrated in the plots of Figure 3D. They
show the difference between responses to ‘‘real motion’’ and
‘‘retinal motion’’ (from Figure 3B) with the appropriate standard
errors. V3A and less significantly V6 were the only regions with
significant and at the same time massive response preferences
toward head-centered motion responses (see statistics above),
with all other regions more or less balanced between both refer-
ence frames.
Voxel-wise whole-brain analyses of the same data replicated
results of experiment 1, and revealed that the bilateral cluster
responding to motion in a head-centered reference frame coin-
cided with retinotopically defined V3A in every subject at the
stringent threshold of 0.05 FWE corrected (see Figure 4 for three
representative subjects; Figure S3 shows remaining subjects).
Mean peak coordinates of the clusters were right 22, �90, 21,
and left �17, �93, 21. Note that when thresholds were dropped
below the stringent FWE correction, activity of this contrast filled
V3A, indicating a preference to objective over retinal motion
throughout its retinotopic representation. This contrast thus
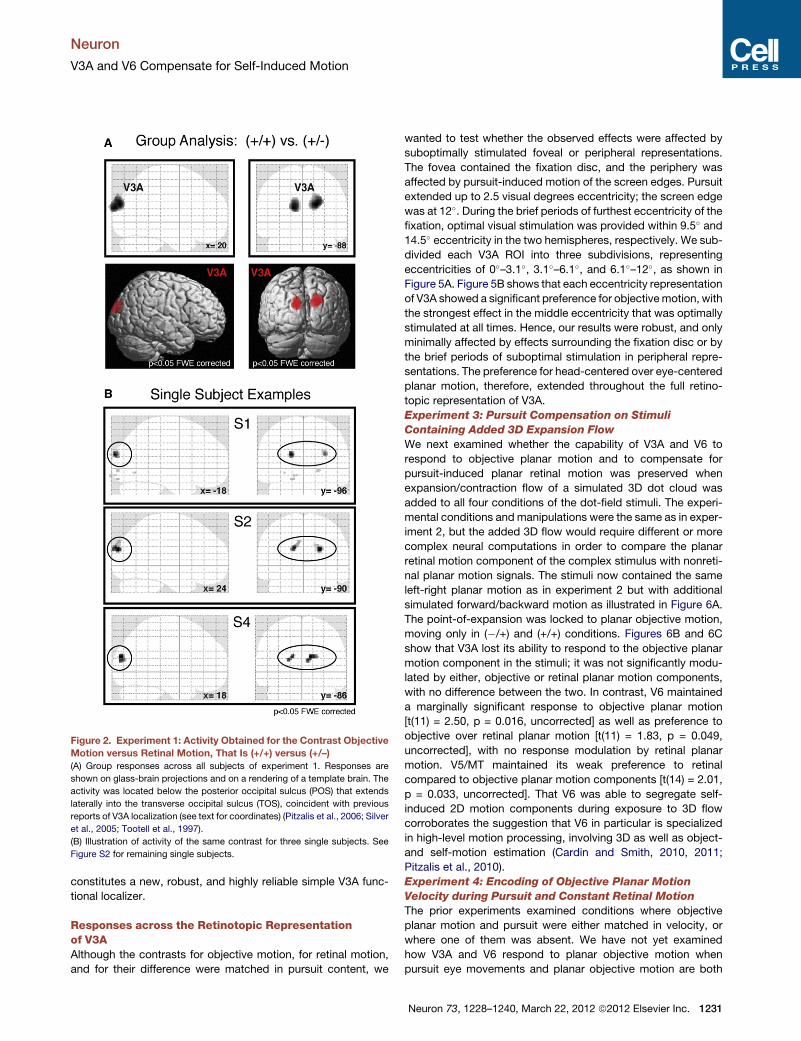
Figure 2. Experiment 1: Activity Obtained for the Contrast Objective
Motion versus Retinal Motion, That Is (+/+) versus (+/–)
(A) Group responses across all subjects of experiment 1. Responses are
shown on glass-brain projections and on a rendering of a template brain. The
activity was located below the posterior occipital sulcus (POS) that extends
laterally into the transverse occipital sulcus (TOS), coincident with previous
reports of V3A localization (see text for coordinates) (Pitzalis et al., 2006; Silver
et al., 2005; Tootell et al., 1997).
(B) Illustration of activity of the same contrast for three single subjects. See
Figure S2 for remaining single subjects.
Neuron
V3A and V6 Compensate for Self-Induced Motion
constitutes a new, robust, and highly reliable simple V3A func-
tional localizer.
Responses across the Retinotopic Representationof V3AAlthough the contrasts for objective motion, for retinal motion,
and for their difference were matched in pursuit content, we
wanted to test whether the observed effects were affected by
suboptimally stimulated foveal or peripheral representations.
The fovea contained the fixation disc, and the periphery was
affected by pursuit-induced motion of the screen edges. Pursuit
extended up to 2.5 visual degrees eccentricity; the screen edge
was at 12�. During the brief periods of furthest eccentricity of the
fixation, optimal visual stimulation was provided within 9.5� and14.5� eccentricity in the two hemispheres, respectively. We sub-
divided each V3A ROI into three subdivisions, representing
eccentricities of 0�–3.1�, 3.1�–6.1�, and 6.1�–12�, as shown in
Figure 5A. Figure 5B shows that each eccentricity representation
of V3A showed a significant preference for objectivemotion, with
the strongest effect in the middle eccentricity that was optimally
stimulated at all times. Hence, our results were robust, and only
minimally affected by effects surrounding the fixation disc or by
the brief periods of suboptimal stimulation in peripheral repre-
sentations. The preference for head-centered over eye-centered
planar motion, therefore, extended throughout the full retino-
topic representation of V3A.
Experiment 3: Pursuit Compensation on Stimuli
Containing Added 3D Expansion Flow
We next examined whether the capability of V3A and V6 to
respond to objective planar motion and to compensate for
pursuit-induced planar retinal motion was preserved when
expansion/contraction flow of a simulated 3D dot cloud was
added to all four conditions of the dot-field stimuli. The experi-
mental conditions and manipulations were the same as in exper-
iment 2, but the added 3D flow would require different or more
complex neural computations in order to compare the planar
retinal motion component of the complex stimulus with nonreti-
nal planar motion signals. The stimuli now contained the same
left-right planar motion as in experiment 2 but with additional
simulated forward/backward motion as illustrated in Figure 6A.
The point-of-expansion was locked to planar objective motion,
moving only in (�/+) and (+/+) conditions. Figures 6B and 6C
show that V3A lost its ability to respond to the objective planar
motion component in the stimuli; it was not significantly modu-
lated by either, objective or retinal planar motion components,
with no difference between the two. In contrast, V6 maintained
a marginally significant response to objective planar motion
[t(11) = 2.50, p = 0.016, uncorrected] as well as preference to
objective over retinal planar motion [t(11) = 1.83, p = 0.049,
uncorrected], with no response modulation by retinal planar
motion. V5/MT maintained its weak preference to retinal
compared to objective planar motion components [t(14) = 2.01,
p = 0.033, uncorrected]. That V6 was able to segregate self-
induced 2D motion components during exposure to 3D flow
corroborates the suggestion that V6 in particular is specialized
in high-level motion processing, involving 3D as well as object-
and self-motion estimation (Cardin and Smith, 2010, 2011;
Pitzalis et al., 2010).
Experiment 4: Encoding of Objective Planar Motion
Velocity during Pursuit and Constant Retinal Motion
The prior experiments examined conditions where objective
planar motion and pursuit were either matched in velocity, or
where one of them was absent. We have not yet examined
how V3A and V6 respond to planar objective motion when
pursuit eye movements and planar objective motion are both
Neuron 73, 1228–1240, March 22, 2012 ª2012 Elsevier Inc. 1231
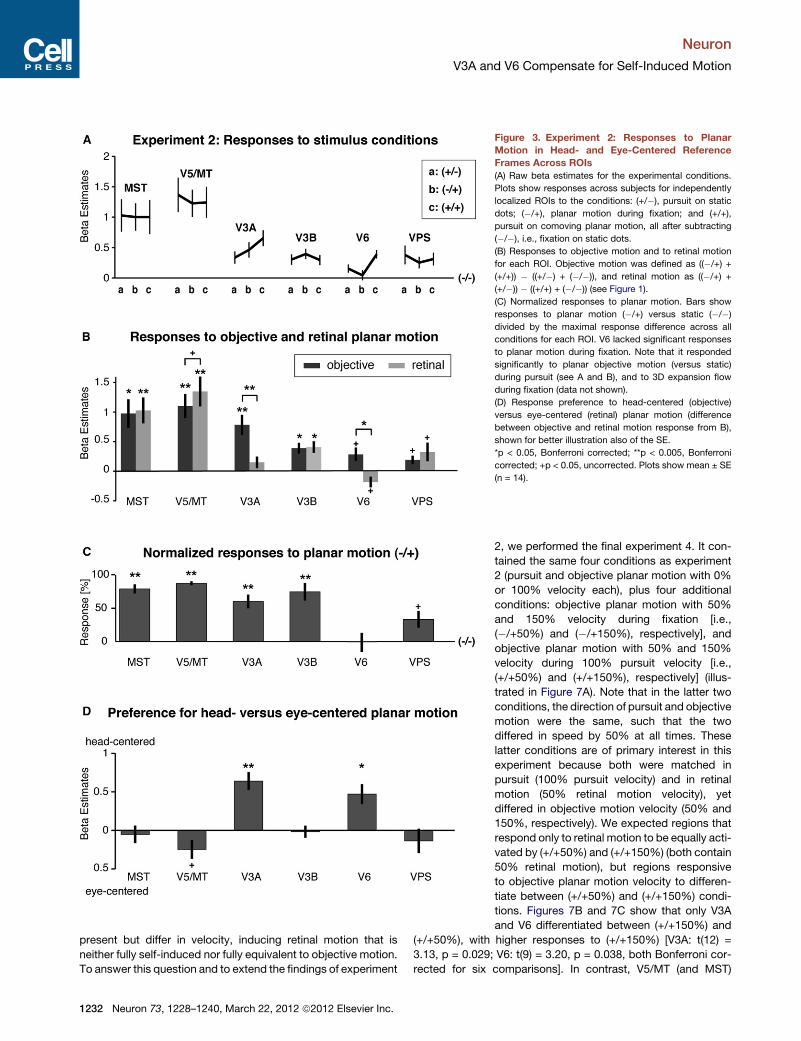
Figure 3. Experiment 2: Responses to Planar
Motion in Head- and Eye-Centered Reference
Frames Across ROIs
(A) Raw beta estimates for the experimental conditions.
Plots show responses across subjects for independently
localized ROIs to the conditions: (+/�), pursuit on static
dots; (�/+), planar motion during fixation; and (+/+),
pursuit on comoving planar motion, all after subtracting
(�/�), i.e., fixation on static dots.
(B) Responses to objective motion and to retinal motion
for each ROI. Objective motion was defined as ((�/+) +
(+/+)) � ((+/�) + (�/�)), and retinal motion as ((�/+) +
(+/�)) � ((+/+) + (�/�)) (see Figure 1).
(C) Normalized responses to planar motion. Bars show
responses to planar motion (�/+) versus static (�/�)
divided by the maximal response difference across all
conditions for each ROI. V6 lacked significant responses
to planar motion during fixation. Note that it responded
significantly to planar objective motion (versus static)
during pursuit (see A and B), and to 3D expansion flow
during fixation (data not shown).
(D) Response preference to head-centered (objective)
versus eye-centered (retinal) planar motion (difference
between objective and retinal motion response from B),
shown for better illustration also of the SE.
*p < 0.05, Bonferroni corrected; **p < 0.005, Bonferroni
corrected; +p < 0.05, uncorrected. Plots show mean ± SE
(n = 14).
Neuron
V3A and V6 Compensate for Self-Induced Motion
present but differ in velocity, inducing retinal motion that is
neither fully self-induced nor fully equivalent to objective motion.
To answer this question and to extend the findings of experiment
1232 Neuron 73, 1228–1240, March 22, 2012 ª2012 Elsevier Inc.
2, we performed the final experiment 4. It con-
tained the same four conditions as experiment
2 (pursuit and objective planar motion with 0%
or 100% velocity each), plus four additional
conditions: objective planar motion with 50%
and 150% velocity during fixation [i.e.,
(�/+50%) and (�/+150%), respectively], and
objective planar motion with 50% and 150%
velocity during 100% pursuit velocity [i.e.,
(+/+50%) and (+/+150%), respectively] (illus-
trated in Figure 7A). Note that in the latter two
conditions, the direction of pursuit and objective
motion were the same, such that the two
differed in speed by 50% at all times. These
latter conditions are of primary interest in this
experiment because both were matched in
pursuit (100% pursuit velocity) and in retinal
motion (50% retinal motion velocity), yet
differed in objective motion velocity (50% and
150%, respectively). We expected regions that
respond only to retinal motion to be equally acti-
vated by (+/+50%) and (+/+150%) (both contain
50% retinal motion), but regions responsive
to objective planar motion velocity to differen-
tiate between (+/+50%) and (+/+150%) condi-
tions. Figures 7B and 7C show that only V3A
and V6 differentiated between (+/+150%) and
(+/+50%), with higher responses to (+/+150%) [V3A: t(12) =
3.13, p = 0.029; V6: t(9) = 3.20, p = 0.038, both Bonferroni cor-
rected for six comparisons]. In contrast, V5/MT (and MST)
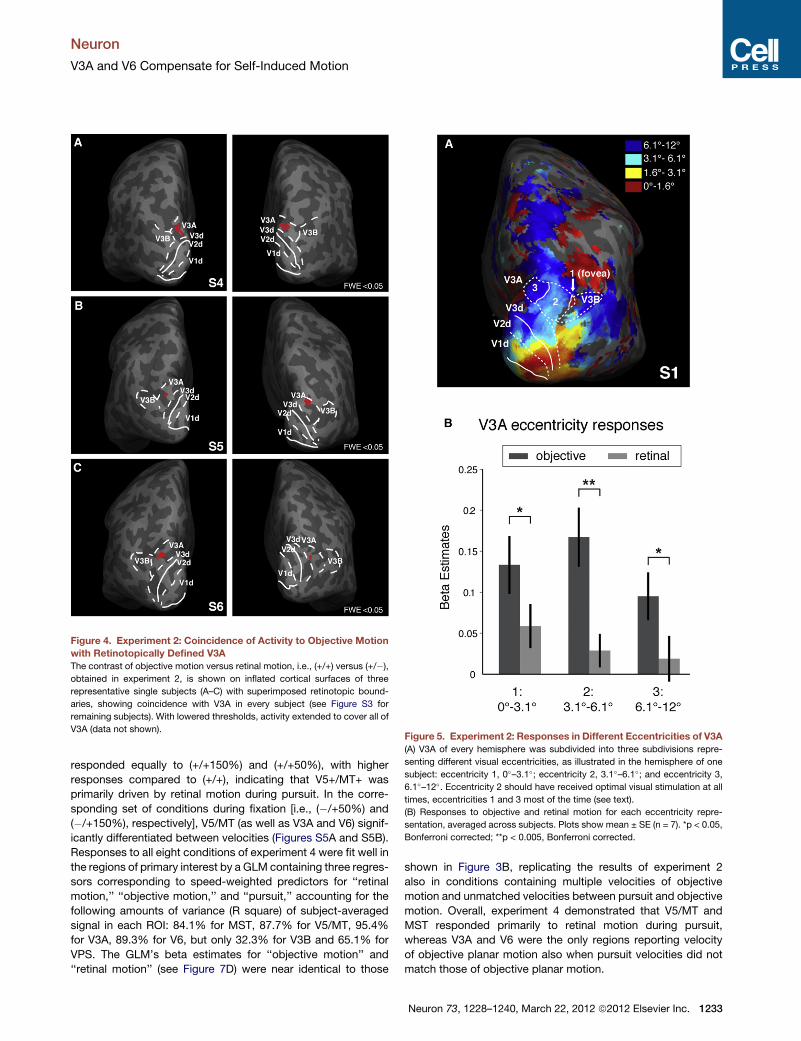
Figure 4. Experiment 2: Coincidence of Activity to Objective Motion
with Retinotopically Defined V3A
The contrast of objective motion versus retinal motion, i.e., (+/+) versus (+/�),
obtained in experiment 2, is shown on inflated cortical surfaces of three
representative single subjects (A–C) with superimposed retinotopic bound-
aries, showing coincidence with V3A in every subject (see Figure S3 for
remaining subjects). With lowered thresholds, activity extended to cover all of
V3A (data not shown).Figure 5. Experiment 2: Responses in Different Eccentricities of V3A
(A) V3A of every hemisphere was subdivided into three subdivisions repre-
senting different visual eccentricities, as illustrated in the hemisphere of one
subject: eccentricity 1, 0�–3.1�; eccentricity 2, 3.1�–6.1�; and eccentricity 3,
6.1�–12�. Eccentricity 2 should have received optimal visual stimulation at all
times, eccentricities 1 and 3 most of the time (see text).
(B) Responses to objective and retinal motion for each eccentricity repre-
sentation, averaged across subjects. Plots show mean ± SE (n = 7). *p < 0.05,
Bonferroni corrected; **p < 0.005, Bonferroni corrected.
Neuron
V3A and V6 Compensate for Self-Induced Motion
responded equally to (+/+150%) and (+/+50%), with higher
responses compared to (+/+), indicating that V5+/MT+ was
primarily driven by retinal motion during pursuit. In the corre-
sponding set of conditions during fixation [i.e., (�/+50%) and
(�/+150%), respectively], V5/MT (as well as V3A and V6) signif-
icantly differentiated between velocities (Figures S5A and S5B).
Responses to all eight conditions of experiment 4 were fit well in
the regions of primary interest by a GLM containing three regres-
sors corresponding to speed-weighted predictors for ‘‘retinal
motion,’’ ‘‘objective motion,’’ and ‘‘pursuit,’’ accounting for the
following amounts of variance (R square) of subject-averaged
signal in each ROI: 84.1% for MST, 87.7% for V5/MT, 95.4%
for V3A, 89.3% for V6, but only 32.3% for V3B and 65.1% for
VPS. The GLM’s beta estimates for ‘‘objective motion’’ and
‘‘retinal motion’’ (see Figure 7D) were near identical to those
shown in Figure 3B, replicating the results of experiment 2
also in conditions containing multiple velocities of objective
motion and unmatched velocities between pursuit and objective
motion. Overall, experiment 4 demonstrated that V5/MT and
MST responded primarily to retinal motion during pursuit,
whereas V3A and V6 were the only regions reporting velocity
of objective planar motion also when pursuit velocities did not
match those of objective planar motion.
Neuron 73, 1228–1240, March 22, 2012 ª2012 Elsevier Inc. 1233
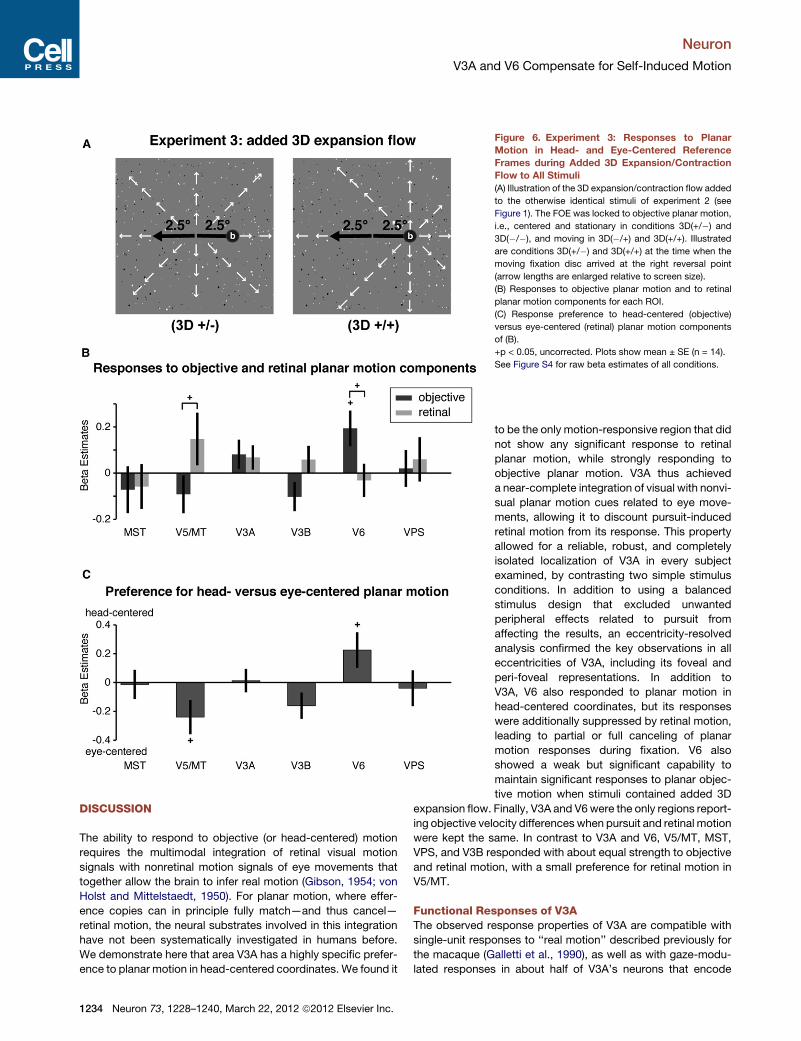
Figure 6. Experiment 3: Responses to Planar
Motion in Head- and Eye-Centered Reference
Frames during Added 3D Expansion/Contraction
Flow to All Stimuli
(A) Illustration of the 3D expansion/contraction flow added
to the otherwise identical stimuli of experiment 2 (see
Figure 1). The FOE was locked to objective planar motion,
i.e., centered and stationary in conditions 3D(+/�) and
3D(�/�), and moving in 3D(�/+) and 3D(+/+). Illustrated
are conditions 3D(+/�) and 3D(+/+) at the time when the
moving fixation disc arrived at the right reversal point
(arrow lengths are enlarged relative to screen size).
(B) Responses to objective planar motion and to retinal
planar motion components for each ROI.
(C) Response preference to head-centered (objective)
versus eye-centered (retinal) planar motion components
of (B).
+p < 0.05, uncorrected. Plots show mean ± SE (n = 14).
See Figure S4 for raw beta estimates of all conditions.
Neuron
V3A and V6 Compensate for Self-Induced Motion
DISCUSSION
The ability to respond to objective (or head-centered) motion
requires the multimodal integration of retinal visual motion
signals with nonretinal motion signals of eye movements that
together allow the brain to infer real motion (Gibson, 1954; von
Holst and Mittelstaedt, 1950). For planar motion, where effer-
ence copies can in principle fully match—and thus cancel—
retinal motion, the neural substrates involved in this integration
have not been systematically investigated in humans before.
We demonstrate here that area V3A has a highly specific prefer-
ence to planar motion in head-centered coordinates. We found it
1234 Neuron 73, 1228–1240, March 22, 2012 ª2012 Elsevier Inc.
to be the only motion-responsive region that did
not show any significant response to retinal
planar motion, while strongly responding to
objective planar motion. V3A thus achieved
a near-complete integration of visual with nonvi-
sual planar motion cues related to eye move-
ments, allowing it to discount pursuit-induced
retinal motion from its response. This property
allowed for a reliable, robust, and completely
isolated localization of V3A in every subject
examined, by contrasting two simple stimulus
conditions. In addition to using a balanced
stimulus design that excluded unwanted
peripheral effects related to pursuit from
affecting the results, an eccentricity-resolved
analysis confirmed the key observations in all
eccentricities of V3A, including its foveal and
peri-foveal representations. In addition to
V3A, V6 also responded to planar motion in
head-centered coordinates, but its responses
were additionally suppressed by retinal motion,
leading to partial or full canceling of planar
motion responses during fixation. V6 also
showed a weak but significant capability to
maintain significant responses to planar objec-
tive motion when stimuli contained added 3D
expansion flow. Finally, V3A and V6were the only regions report-
ing objective velocity differences when pursuit and retinal motion
were kept the same. In contrast to V3A and V6, V5/MT, MST,
VPS, and V3B responded with about equal strength to objective
and retinal motion, with a small preference for retinal motion in
V5/MT.
Functional Responses of V3AThe observed response properties of V3A are compatible with
single-unit responses to ‘‘real motion’’ described previously for
the macaque (Galletti et al., 1990), as well as with gaze-modu-
lated responses in about half of V3A’s neurons that encode
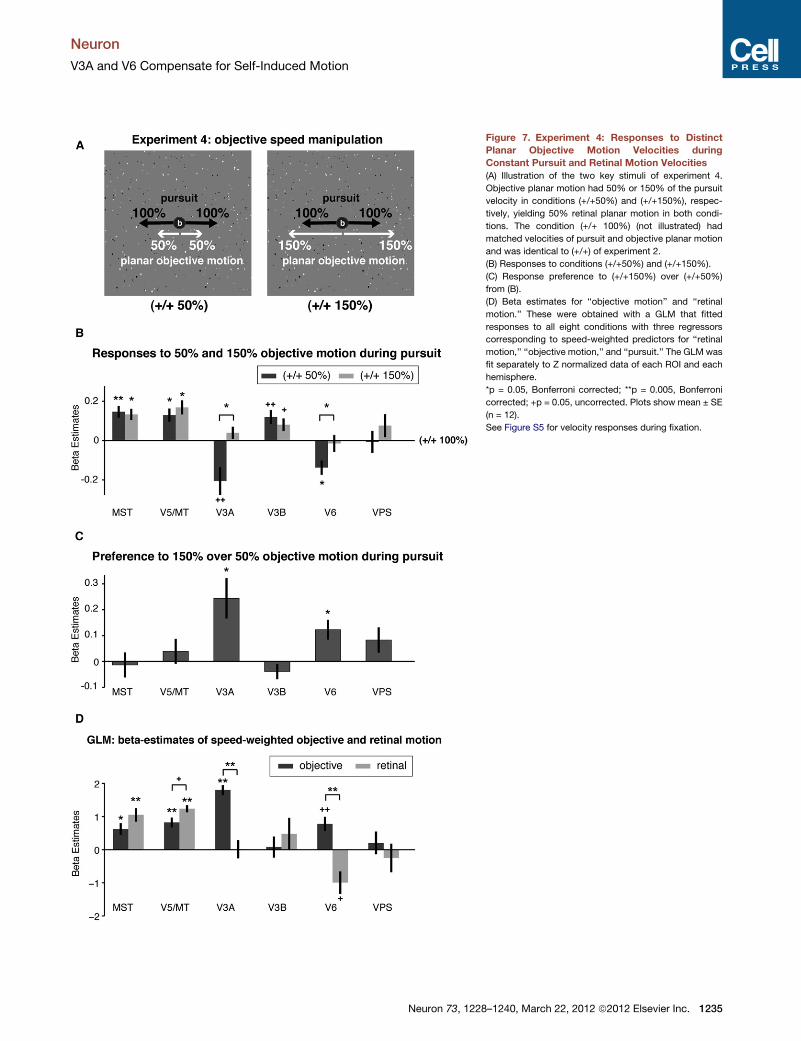
Figure 7. Experiment 4: Responses to Distinct
Planar Objective Motion Velocities during
Constant Pursuit and Retinal Motion Velocities
(A) Illustration of the two key stimuli of experiment 4.
Objective planar motion had 50% or 150% of the pursuit
velocity in conditions (+/+50%) and (+/+150%), respec-
tively, yielding 50% retinal planar motion in both condi-
tions. The condition (+/+ 100%) (not illustrated) had
matched velocities of pursuit and objective planar motion
and was identical to (+/+) of experiment 2.
(B) Responses to conditions (+/+50%) and (+/+150%).
(C) Response preference to (+/+150%) over (+/+50%)
from (B).
(D) Beta estimates for ‘‘objective motion’’ and ‘‘retinal
motion.’’ These were obtained with a GLM that fitted
responses to all eight conditions with three regressors
corresponding to speed-weighted predictors for ‘‘retinal
motion,’’ ‘‘objective motion,’’ and ‘‘pursuit.’’ The GLM was
fit separately to Z normalized data of each ROI and each
hemisphere.
*p = 0.05, Bonferroni corrected; **p = 0.005, Bonferroni
corrected; +p = 0.05, uncorrected. Plots show mean ± SE
(n = 12).
See Figure S5 for velocity responses during fixation.
Neuron
V3A and V6 Compensate for Self-Induced Motion
Neuron 73, 1228–1240, March 22, 2012 ª2012 Elsevier Inc. 1235
Neuron
V3A and V6 Compensate for Self-Induced Motion
spatial locations in a head-centered frame of reference (Galletti
and Battaglini, 1989; Nakamura and Colby, 2002). Interestingly,
macaque V3A contains relatively few motion-responsive
neurons in comparison to macaque areas V5/MT, MST, and
VIP (Orban et al., 2003; Tootell et al., 1997). Consequently, neural
response properties, but also multimodal integration of visual
motion signals with nonvisual signals, such as pursuit-related
or vestibular input, have been studied far more extensively in
regions other than V3A, both in humans and macaques (Goos-
sens et al., 2006; Gu et al., 2008; Ilg et al., 2004; Zhang et al.,
2004). However, in contrast to macaque physiology and
macaque fMRI signals, human imaging has revealed a strong
involvement of V3A in motion processing, comparable to that
of human V5/MT and MST (Bartels et al., 2008b; McKeefry
et al., 2008; Orban et al., 2003; Tootell et al., 1997; Wall and
Smith, 2008). This points to a functional difference between
macaque and human V3A with respect to motion processing
(Orban et al., 2003). The present study emphasizes that further
by demonstrating motion responses entirely driven by objective,
but not retinal, motion in human V3A. V3A has strong connec-
tions with areas V6 and V6A and has been associated with path-
ways serving visual control of grasping rather than control of
pursuit and estimation of self-motion found in MST (Galletti
et al., 2003; Nakamura et al., 2001). For grasping and associated
object vision, head- or body-centered representations would be
crucial for successful execution. In contrast, visual control of
pursuit would require both, retinal as well as head-centered
representations, such as found in the V5+/MT+ complex
(Chukoskie and Movshon, 2009; Ilg et al., 2004). The observed
presence of both retinal as well as head-centered responses in
V5/MT and MST and the preference for retinal responses in
V5/MT agree with the distribution of units in both areas respon-
sive to motion in the two reference frames (Arnoldussen et al.,
2011; Chukoskie and Movshon, 2009; Ilg et al., 2004). Similarly,
task-dependent spatiotopic responses found in human V5/MT
and MST (that take fixed eye position into account) are compat-
ible with the present results (Crespi et al., 2011; d’Avossa
et al., 2007).
Responses of Area V6Human V6 has been shown to respond to large-field motion
(Pitzalis et al., 2006, 2010), to have the highest response bias
amongmotion-responsive regions toward stimuli simulatingego-
motion in depth (expansion flow) (Cardin andSmith, 2010), and to
achieve the highest integration between stereo-depth with 3D
motion flow among flow-responsive regions (Cardin and Smith,
2011). In addition to this, macaque V6 contains gaze-modulated
neurons that remap receptive fields to head-centered coordi-
nates (Galletti et al., 1995, 2001), and human V6 has been shown
to contain spatiotopic motion representations, taking fixed eye
position into account (Crespi et al., 2011). Together with its
reciprocal connections with higher-level motion processing
regions MST and VIP, V6 has been implied to be a crucial hub
involved in egomotion processing or in processing of motion of
graspable objects (Cardin and Smith, 2011). The motivation for
the latter stems from its tight connectivity with areas involved in
grasping (Galletti et al., 2001, 2003) and its putative preference
to near-field stimuli in humans (Quinlan and Culham, 2007).
1236 Neuron 73, 1228–1240, March 22, 2012 ª2012 Elsevier Inc.
Given the high-level visual motion-processing function of V6,
the question arises how the absence of planar motion responses
in V6 (see Figure 3C) can be accounted for. Is it a general lack in
motion response due to poor retinotopic localization of V6, or the
limitation of the screen to the central 24 3 18 visual degrees
given its wide-field bias (Pitzalis et al., 2010)? Two reasons speak
against this. First, we found highly significant responses in V6 to
3D expansion flow [t(11) = 3.51; p = 0.003] compared to static
dots using the same stimulus setup and same subjects (data
not shown), in accord with V6 responses of prior studies (Cardin
and Smith, 2010; Pitzalis et al., 2010). Second, the significant
response difference in V6 to objective and retinal motion (Fig-
ure 3), and its preference for 150% versus 50% objective motion
velocity during pursuit (Figure 7), can only be accounted for by
dot motion on the screen. Together, experiments 2, 3, and 4
provide clear evidence that V6 integrates retinal with nonretinal
(pursuit) signals to respond to objective planar motion, even
during pursuit (see Figures 3D, 6B, and 7C). The lack of response
to 2D planar motion during fixation in V6 is therefore most parsi-
moniously explained by the contrast for ‘‘retinal motion’’ of
experiment 2 (Figure 3B) and by the GLM beta estimate for the
speed-weighted ‘‘retinal motion’’ regressor of experiment 4 (Fig-
ure 7D), both showing that retinal planar motion suppressed V6
responses. This suppression was strongest when objective
motion was presented during fixation, fully (Figure 3) or partially
(see Figure S5) canceling V6 responses. Therefore, we interpret
our experiments 2, 3, and 4 to add to V6 attributes that it
responds to motion in a head- (or world-) centered reference
frame, while being suppressed by purely retinal motion (see Fig-
ure 3C). In terms of BOLD signal, V6 therefore reports planar
objective velocity of visually tracked motion, but less so for non-
tracked motion. At the cellular level, the inhibitory response
related to retinal motion and the excitatory response related to
objective motion may of course be related to entirely separate
units or processes.
Neural Substrates Involved in 2D Planar and 3DForward-Flow ProcessingAn important difference of this study with regard to previous
human pursuit studies is the systematic use of planar motion
as opposed to heading-related 3D expansion stimuli (Arnoldus-
sen et al., 2011; Goossens et al., 2006), with the two motion
types being known to involve distinct circuitries both at single-
cell as well as at regional levels (Duffy and Wurtz, 1995; Gu
et al., 2008; Morrone et al., 2000; Royden and Vaina, 2004;
Zhang et al., 2004). A comparison of results from prior pursuit
studies using 3D flow stimuli with our findings suggests that
partly distinct neural substrates support the integration of pursuit
eyemovements with 2D planar motion versus 3D expansion flow
(Morrone et al., 2000; Royden and Vaina, 2004). Although our
results are compatible with the presence of distinct functional
units responsive to heading either in retinal or in head-centered
frames of reference in V5/MT, MST, V3A, and V6 (Arnoldussen
et al., 2011; Chukoskie and Movshon, 2009; Ilg et al., 2004),
they indicate drastic imbalances across regions in context of
planar motion integration. Our results show that V3A and V6
are heavily involved in the integration of planar motion signals
with eye movements, whereas previous human studies have
Neuron
V3A and V6 Compensate for Self-Induced Motion
not reported systematic regional differences for pursuit integra-
tion during heading-related forward motion (Arnoldussen et al.,
2011). One reason why distinct neural substrates may be
involved in integrating extraretinal signals with planar retinal
motion or with more complex retinal motion types could, in
theory, be explained by the following reasoning. An efference
copy most likely only contains information about planar
speed—this can in principle be integrated with retinal planar
speed signals directly, without further computations. As soon
as any other motion component (such as 3D forward flow, or
other types of relative motion) is contained within retinal motion,
the calculations would likely become more complex, involving
for example an initial estimation (or parsing) of the planar compo-
nent embedded in the complex motion, followed by its compar-
ison with the efference speed signal. Because V6 is highly
specialized for both, 3D flow processing (Cardin and Smith,
2010, 2011; Pitzalis et al., 2010) and, as shownhere, for 2Dplanar
objective motion estimation, it is a good candidate region for the
aforementioned function of parsing 2D signals from complex
stimuli containing 3D and 2D motion cues. The results of our
experiment 3 (Figure 6) are consistent with this, though at uncor-
rected levels, extending the previous literature in suggesting that
V6 has access to 2D planar velocity in complex stimuli also
containing 3D flow, allowing it to discriminate self-induced from
objective 2D planar motion components even in complex stimuli.
VPS and Relation of Present Results to Filehne IllusionThe putative human VPS homolog, identified here based on its
general motion response, anatomy, and previous studies
(Lindner et al., 2006; Trenner et al., 2008), showed about equal
pursuit integration as retinal responses. Our finding is compat-
ible with physiology experiments that identified about 50% of
VPS units whose firing rates correlated with the small perceived
illusory background motion during pursuit (Filehne illusion) when
background dots were briefly flashed during pursuit (Dicke et al.,
2008). However, for slow-imaging techniques like fMRI, the use
of the Filehne illusion is problematic due to the confounding
adapting displays preceding each trial (Trenner et al., 2008).
Interestingly, fast human imaging approaches that used MEG
and thus largely circumvented the confounding adaptation
problem identified a region whose activity correlated with the
subjectively perceived background motion during pursuit in
medial occipito-parietal cortex (Tikhonov et al., 2004). Their
result is thus strikingly consistent with the location of V3A iden-
tified here using continuous visual-pursuit integration without
rapid transients or preceding adaptation, and the location is
also consistent with the atrophy observed in a patient failing to
integrate pursuit with self-induced planar visual motion (Haarme-
ier et al., 1997).
Potential Sources of Extraretinal SignalsOverall, our findings thus extend the single-cell physiology data
of the macaque in revealing that in humans V3A stands out
by a large margin in comparison to other motion-responsive
regions with its overwhelming response to planar motion in
head-centered as opposed to eye-centered coordinates, with
V6 having a similar, though somewhat weaker and more com-
plex, response.
What are potential anatomical sources mediating the ob-
served responses in V3A? V3A has a rich set of connections to
various subcortical as well as cortical regions in both dorsal
and ventral streams that may facilitate integration with eye
movements. In particular, V3A receives input via the superior
colliculus (SC)-pulvinar route bypassing V1, with about one-third
of its cells still visually responding after inactivation of V1 (which
silenced V3 responses), indicating a substantial functional influ-
ence through this pathway (Girard et al., 1991). Although the
sources of extraretinal signals in V3A are unknown, the SC-
pulvinar route has been pointed to as a potential source for visual
as well as nonvisual pursuit-related signals, including corollary
discharges related to eye movements (Girard et al., 1991). V3A
receives relatively little input directly from V1 and derives most
of its bottom-up input from V2 and V3 (Anderson and Martin,
2005). The strong BOLD specificity to objective motion may
therefore also originate from feedback to V3A rather than from
feed-forward signals, bearing in mind that fMRI is particularly
susceptible to feedback and local processing (Bartels et al.,
2008a). V3A (in contrast to V3) has strong feedback connections
from motion-processing region MST (Boussaoud et al., 1990)
that contains a large proportion of gaze-dependent and ‘‘real
motion’’ cells (Chukoskie and Movshon, 2009; Ilg et al., 2004).
In addition, V3A connects strongly with parietal regions with
gaze-dependent properties, including V6 (Galletti et al., 2001)
and LIP (Cavada and Goldman-Rakic, 1989; Nakamura et al.,
2001). Importantly, V3A has direct connections with the smooth
pursuit region of the frontal eye fields (Stanton et al., 2005). The
latter have been proposed to provide eye movement signals to
the visual-tracking neurons in monkey MST, endowing them
with head-centered motion responses (Ilg et al., 2004), and
may thus endow V3A with similar capabilities. Indeed, it has
been shown that V3A has access to motor commands (or effer-
ence copies) because remapping in it occurred prior to eye
movements (Nakamura and Colby, 2002). Conversely, it is
known that perceptual stability during eye movements is medi-
ated by the integration of efference copies with visual signals
(von Holst and Mittelstaedt, 1950).
Together, our findings indicate that V3A and V6 achieve
a profound multimodal integration of pursuit eye movements
particularly with planar visual motion, and thus suggest a crucial
function of both areas in our perception of a stable world and of
object motion during pursuit eye movements.
EXPERIMENTAL PROCEDURES
Subjects
A total of 14 volunteers participated in this study: 8 in experiment 1, 7 in exper-
iments 2 and 3 (1 overlapping with experiment 1), and 6 in experiment 4
(subset of experiment 2). Six participants were male, and eight were female
(age 23–34 years, with one that was left-handed). The ethics committee of
the University Hospital and Max Planck Institutes Tubingen approved the
study. Prior to scanning, subjects were instructed about the experimental
procedures, signed an informed consent form, and performed a test trial to
get accustomed to stimuli and task.
Experimental Stimuli and Paradigm
Six experiments were conducted: experiments 1–4 measured responses to
retinal and objective motion using planar motion and pursuit trajectories.
Trajectories included horizontal and vertical dimensions (2D) in experiment
Neuron 73, 1228–1240, March 22, 2012 ª2012 Elsevier Inc. 1237
Neuron
V3A and V6 Compensate for Self-Induced Motion
1, and linear (1D, horizontal only) trajectories in experiments 2–4. Experiment 5
localized V5/MT and MST; experiment 6 mapped retinotopically organized
areas V1–V3, V3A, V3B, and V6. Visual stimuli were gamma corrected and pro-
jected on a screen positioned behind the observers’ head viewed at 82 cm
distance spanning 243 18 visual degrees. Stimuli were generated with Cogent
Graphics v.1.29 developed by John Romaya at the Wellcome Department of
Imaging Neuroscience (http://www.vislab.ucl.ac.uk/cogent.php), and run on
MATLAB 7.3.0 (MathWorks) on a Windows PC.
Experiment 1: 2D Planar Motion and Pursuit
Experiment 1 included four conditions. Each was presented four times in each
of six scanning sessions. Trials lasted 12 s and were presented in pseudo-
random sequences where each condition preceded equally often all other
conditions. Visual stimuli consisted of 320 randomly arranged black and white
dots (100% contrast, diameter between 0.1� and 1.1�) on a gray (90 cd/m2)
background, yielding a density of 0.75 dots/�2.The four conditions resulted from a 2 3 2 factorial design including two
factors with two states each. The two factors were pursuit (on/off) and 2D
planar motion (on/off) (Figure 1A). During 2D planar motion the entire dot field
moved sinusoidally along the vertical and horizontal axes with three or four
cycles per trial (randomly assigned, respectively) and with random initial
phases and directions, resulting in smooth sinusoidal 2D planar trajectories
of 5 visual degrees in diameter (Figure 1B). During pursuit the otherwise central
fixation disc (that contained the task, see below) moved along the same trajec-
tory (also 5� in diameter). When both pursuit and planar motion were ‘‘on,’’ the
fixation task moved locked together with the dots, resulting in zero planar
retinal motion. The mean (median) dot/pursuit speed was 3.80 (3.80) �/s, andthe maximal eccentricity of the fixation disc reached 2.5�. A GLM analysis of
this 2 3 2 factorial design allowed us to separate cortical responses related
to the main factors of (1) eye movements (pursuit), (2) objective (2D planar)
motion, and their interaction (3) retinal motion. Both (2) 2D planar motion and
(3) retinal motion were balanced for conditions with and without pursuit (see
Figure 1), and were thus not confounded by effects related to pursuit (such
as peripheral motion induced by the screen edges, or potentially less accurate
fixation during pursuit).
Experiment 2: 1D Linear Motion and Pursuit
Experiment 2 was identical to experiment 1 but used 1D (horizontal only)
trajectories with four cycles per trial (see Figures 1A and 1C), and the speed
of the motion trajectory was changed from a sine function to abs(sin(t))(1/3) in
order to achieve a more linear velocity profile. The mean (median) dot/pursuit
speed was 3.30 (2.3) �/s. During this experiment, eye movements were re-
corded inside the scanner.
Experiment 3: Added Expansion/Contraction Flow
Experiment 3 was identical to experiment 2, but expansion/contraction flow
was added to all stimuli, as illustrated in Figure 6A. The flow alternated
between contraction and expansion with a period of four cycles per trial
(same velocity profile as planar motion), and with matched mean (median)
dot speeds for pure 3D flow of 3.2 (2.3) �/s [in condition 3D(�/�)]. In each trial,
starting directions for left/right and forward/backward motion were deter-
mined randomly and independently. The flow simulated forward-backward
motion of a 3D dot cloudwith a visibility of 0.4–2.40mdistance to the observer,
and a simulated maximal (mean) velocity of 0.67 (0.55) m/s. The focus of
expansion (FOE) was locked to objective planar motion, i.e., was centered
and stationary in conditions 3D(+/�) and 3D(�/�), and moved in 3D(�/+)
and 3D(+/+). Eye movements were recorded inside the scanner during this
experiment.
Experiment 4: Varied Objective Motion Velocity during Constant
Pursuit Velocity
Experiment 4 was a replication of experiment 2, with the following four addi-
tional conditions: (�/+50%), (�/+150%), (+/+50%), and (+/+150%) (see Fig-
ure 7A). The percentages refer to the objective motion velocities that were
either 50% slower or 50% faster than that of the original (�/+) and (+/+) condi-
tions. Because pursuit velocities were unchanged (100%), the (+/+50%) and
(+/+150%) conditions differed in objective planar motion velocity (50% or
150%, respectively) but had the same pursuit velocity (100% in both), and
the same retinal planar motion velocity (50% in both). The eight conditions
of this experiment were presented in history-matched pseudorandom
sequences, recorded in six scanning sessions in each subject.
1238 Neuron 73, 1228–1240, March 22, 2012 ª2012 Elsevier Inc.
Localizer Experiment
V5/MT and MST were identified using standard methods (Huk et al., 2002). A
full-field coherent random dot-flow field activated all motion-responsive areas
relative to a static dot display. MST was defined as ipsilateral response within
the V5/MT+ complex when the stimulus was confined to the left or right third of
the display, V5/MT being the contralateral response without MST (Fischer
et al., 2011). The VPS area was identified as coherent motion-responsive
cluster near the dorsal end of the lateral sulcus, based on previous studies
(Lindner et al., 2006; Trenner et al., 2008).
Fixation Task
Throughout each of the aforementioned experiments, subjects performed
a character repetition-detection task on the fixation disc, ensuring fixation as
well as balanced attentional load across conditions. A total of 26 characters
were presented in random succession (1.6� height, red) on a gray fixation
annulus (2� width, 72 cd/m2), with random presentation times of 1–2.16 s.
Subjects indicated character repetitions (every three to eight presentations)
by button press.
Eye Tracking
We performed eye tracking both offline (for experiment 1) and online (during
fMRI in experiments 2 and 3). Experiment 1 was repeated in a dedicated
eye-tracking setup with a video-based infrared eye tracker (SMI, Boston,
MA, USA) to record horizontal and vertical eye positions at 50 Hz with high
precision in four subjects. During experiments 2 and 3, a 60 Hz video-based
infrared eye tracker with long-range optics (Eye-Trac6; Applied Science Labo-
ratories, Bedford, MA, USA) was used for all subjects. After blink removal,
drifts due to changes in head position were removed, and data were smoothed
using a Gaussian filter. The eye velocity was calculated using a six-point
running average-and-differentiating filter, and saccades were identified at
a velocity threshold of >21�/s. Following saccade removal, data points were
linearly interpolated. Fixation accuracy was quantified by calculating the
root-mean-square (rms) error of (1) the actual eye position relative to the fixa-
tion cross and (2) the eye velocity compared to that of the fixation cross, for
each stimulus condition separately, across sessions and subjects (n = 42).
Two-way ANOVAs with factors pursuit (on/off) and planar motion (on/off)
were performed for eye position and eye velocity signals separately.
Retinotopic Mapping
A standard phase-encoded retinotopy paradigm coupled to a covert attention
task was used to define visual areas V1, V2, V3, V3A, V3B, and V6 and their
eccentricities (Pitzalis et al., 2006; Silver et al., 2005). For each subject a total
of 60wedge rotations and 30 ring expansion/contraction cycles were recorded
in 9 consecutive sessions, each cycle lasting 50 s. The black and white check-
erboardwedge and ring stimuli flickered (luminance inversion) with a frequency
of 6 Hz, extended to the edge of the screen, and were displayed on a gray
background. Check sizes were scaled logarithmically according to the cortical
magnification factor. For polar angle mapping a 30� wedge rotated clockwise
in half of the sessions and counterclockwise in the other half in steps of 22.5�
(= 1 TR). An attention task was coupled to the visual stimulation as follows. On
top of the wedge, three semitransparent red rectangles (width-to-height = 2:1)
were displayed at eccentricities of 3�, 6�, and 12� and scaled according to their
eccentricity. Each rectangle was oriented either parallel or orthogonal to the
wedge orientation, changing orientation randomly and in sync with the others
every 1.5 s. Subjects fixated the center of the screen and pressed a button
whenever all rectangles were oriented parallel to the wedge.
For eccentricity mapping subjects fixated a central dot and pressed a button
whenever it changed from gray to red to maintain vigilance (15 times per
session at random intervals).
Data were processed and analyzed using cortical surface-based methods
using Freesurfer software (http://surfer.nmr.mgh.harvard.edu/fswiki). The
functional scans were motion corrected, slice time corrected, and spatially
smoothed with a Gaussian Kernel of 5 mm full-width at half maximum. For
each subject functional scans were coregistered with the individual’s high-
resolution anatomical volume, which was further used to reconstruct the
cortical inflations. Each registration was checked individually to guarantee
a precise overlay and was manually corrected if needed. Each subject’s
Neuron
V3A and V6 Compensate for Self-Induced Motion
structural image was segmented, and the white matter surface inflated. BOLD
data were analyzed using a Fourier transform, and the phases at stimulus
frequency projected onto the rendered surface. These surface data were
smoothed using a Gaussian Kernel with 5 mm full-width at half maximum.
The area boundaries were then determined using standard criteria with the
aid of field-sign maps (Silver et al., 2005).
Image Acquisition
Functional gradient-echo echoplanar T2*-weighted images (EPI) were
acquired on a Siemens TIM 3T scanner with a 12-channel phased-array
head coil (Siemens, Erlangen, Germany), with the following parameters: TR
2,300 ms, TE 40 ms, flip angle 90�, field of view 192 3 192 mm. Images con-
sisted of 32 slices with 643 64 pixels (2.6 mm thick plus 0.4mm gap), resulting
in 33 33 3mm voxels. Sessions for localizer andmain experiments consisted
of 226 and 176 images acquired in 8.4 and 6.4 min, respectively. Retinotopy
data were acquired with a higher resolution of 2 3 2 3 2 mm in 36 slices (TR
3,120ms, TE 39ms). The initial four images of each scanning session were dis-
carded to allow for equilibration of T1 signal. A high-resolution anatomical scan
was also obtained for each observer with a T1-weighted MP-RAGE sequence
of 1 3 1 3 1 mm resolution.
fMRI Data Processing
Data (except retinotopy) were processed using SPM5 (http://www.fil.ion.ucl.
ac.uk/spm/) including slice-time and head-motion correction and spatial
normalization to MNI space. For group analyses, images were spatially
smoothed with a Gaussian Kernel of 12 mm full-width at half maximum.
Data were left unsmoothed for single-subject analyses (including ROI data
extraction).
Statistical Analysis
Each subject was analyzed separately using the GLM. Each condition was
modeled separately, including button presses, and the six realignment param-
eters obtained from the motion correction. A high-pass filter with 128 s cutoff
removed low-frequency signal drifts.We report single-subject results as voxel-
wise statistical maps, thresholded at p < 0.05 FWE corrected. ROI analyses
include one mean beta estimate extracted per hemisphere for each ROI,
with subsequent (RFX) t tests applied across all hemispheres. Responses to
retinal motion and to real motion contained in the 2 3 2 conditions of the
main experiment were extracted using the following contrasts (using the nota-
tion of Figure 1, [pursuit/planar motion]): retinal motion, ((+/�) plus (�/+))
versus ((�/�) plus (+/+)); and real motion, ((�/+) plus (+/+)) versus ((�/�) plus
(+/�)). At the group level, the aforementioned contrasts were extracted from
single-subject beta estimates using a second-level GLM.
SUPPLEMENTAL INFORMATION
Supplemental Information includes five figures and one table and can be found
with this article online at doi:10.1016/j.neuron.2012.01.022.
ACKNOWLEDGMENTS
This research was supported by the Centre of Integrative Neuroscience,
Tubingen, by the Max Planck Society, Germany, and also received support
by theWCU (World Class University) program funded by theMinistry of Educa-
tion, Science and Technology through the National Research Foundation of
Korea (R31-10008).
Accepted: January 10, 2012
Published: March 21, 2012
REFERENCES
Anderson, J.C., andMartin, K.A. (2005). Connection from cortical area V2 to V3
A in macaque monkey. J. Comp. Neurol. 488, 320–330.
Arnoldussen, D.M., Goossens, J., and van den Berg, A.V. (2011). Adjacent
visual representations of self-motion in different reference frames. Proc.
Natl. Acad. Sci. USA 108, 11668–11673.
Bartels, A., Logothetis, N.K., andMoutoussis, K. (2008a). fMRI and its interpre-
tations: an illustration on directional selectivity in area V5/MT. Trends Neurosci.
31, 444–453.
Bartels, A., Zeki, S., and Logothetis, N.K. (2008b). Natural vision reveals
regional specialization to local motion and to contrast-invariant, global flow
in the human brain. Cereb. Cortex 18, 705–717.
Boussaoud, D., Ungerleider, L.G., and Desimone, R. (1990). Pathways for
motion analysis: cortical connections of the medial superior temporal and
fundus of the superior temporal visual areas in the macaque. J. Comp.
Neurol. 296, 462–495.
Cardin, V., and Smith, A.T. (2010). Sensitivity of human visual and vestibular
cortical regions to egomotion-compatible visual stimulation. Cereb. Cortex
20, 1964–1973.
Cardin, V., and Smith, A.T. (2011). Sensitivity of human visual cortical area V6
to stereoscopic depth gradients associated with self-motion. J. Neurophysiol.
106, 1240–1249.
Cavada, C., and Goldman-Rakic, P.S. (1989). Posterior parietal cortex in rhe-
sus monkey: I. Parcellation of areas based on distinctive limbic and sensory
corticocortical connections. J. Comp. Neurol. 287, 393–421.
Chukoskie, L., and Movshon, J.A. (2009). Modulation of visual signals
in macaque MT and MST neurons during pursuit eye movement.
J. Neurophysiol. 102, 3225–3233.
Crespi, S., Biagi, L., d’Avossa, G., Burr, D.C., Tosetti, M., and Morrone, M.C.
(2011). Spatiotopic coding of BOLD signal in human visual cortex depends on
spatial attention. PLoS One 6, e21661.
d’Avossa, G., Tosetti, M., Crespi, S., Biagi, L., Burr, D.C., and Morrone, M.C.
(2007). Spatiotopic selectivity of BOLD responses to visual motion in human
area MT. Nat. Neurosci. 10, 249–255.
Dicke, P.W., Chakraborty, S., and Thier, P. (2008). Neuronal correlates of
perceptual stability during eye movements. Eur. J. Neurosci. 27, 991–1002.
Duffy, C.J., andWurtz, R.H. (1995). Response of monkeyMST neurons to optic
flow stimuli with shifted centers of motion. J. Neurosci. 15, 5192–5208.
Erickson, R.G., and Thier, P. (1991). A neuronal correlate of spatial stability
during periods of self-induced visual motion. Exp. Brain Res. 86, 608–616.
Fischer, E., Bulthoff, H.H., Logothetis, N.K., and Bartels, A. (2011). Visual
motion responses in the posterior cingulate sulcus: a comparison to V5/MT
and MST. Cereb. Cortex, in press. Published online June 27, 2011.
Galletti, C., and Battaglini, P.P. (1989). Gaze-dependent visual neurons in area
V3A of monkey prestriate cortex. J. Neurosci. 9, 1112–1125.
Galletti, C., Battaglini, P.P., and Fattori, P. (1990). ‘Real-motion’ cells in area
V3A of macaque visual cortex. Exp. Brain Res. 82, 67–76.
Galletti, C., Battaglini, P.P., and Fattori, P. (1995). Eye position influence on the
parieto-occipital area PO (V6) of the macaque monkey. Eur. J. Neurosci. 7,
2486–2501.
Galletti, C., Gamberini, M., Kutz, D.F., Fattori, P., Luppino, G., and Matelli, M.
(2001). The cortical connections of area V6: an occipito-parietal network pro-
cessing visual information. Eur. J. Neurosci. 13, 1572–1588.
Galletti, C., Kutz, D.F., Gamberini, M., Breveglieri, R., and Fattori, P. (2003).
Role of the medial parieto-occipital cortex in the control of reaching and
grasping movements. Exp. Brain Res. 153, 158–170.
Gibson, J.J. (1954). The visual perception of objective motion and subjective
movement. Psychol. Rev. 61, 304–314.
Girard, P., Salin, P.A., and Bullier, J. (1991). Visual activity in areas V3a and
V3 during reversible inactivation of area V1 in the macaque monkey.
J. Neurophysiol. 66, 1493–1503.
Goossens, J., Dukelow, S.P., Menon, R.S., Vilis, T., and van den Berg, A.V.
(2006). Representation of head-centric flow in the human motion complex.
J. Neurosci. 26, 5616–5627.
Gu, Y., Angelaki, D.E., and Deangelis, G.C. (2008). Neural correlates of multi-
sensory cue integration in macaque MSTd. Nat. Neurosci. 11, 1201–1210.
Neuron 73, 1228–1240, March 22, 2012 ª2012 Elsevier Inc. 1239
Neuron
V3A and V6 Compensate for Self-Induced Motion
Haarmeier, T., Thier, P., Repnow, M., and Petersen, D. (1997). False percep-
tion of motion in a patient who cannot compensate for eye movements.
Nature 389, 849–852.
Huk, A.C., Dougherty, R.F., and Heeger, D.J. (2002). Retinotopy and functional
subdivision of human areas MT and MST. J. Neurosci. 22, 7195–7205.
Ilg, U.J., Schumann, S., and Thier, P. (2004). Posterior parietal cortex neurons
encode target motion in world-centered coordinates. Neuron 43, 145–151.
Lindner, A., Haarmeier, T., Erb, M., Grodd, W., and Thier, P. (2006).
Cerebrocerebellar circuits for the perceptual cancellation of eye-movement-
induced retinal image motion. J. Cogn. Neurosci. 18, 1899–1912.
McKeefry, D.J., Burton, M.P., Vakrou, C., Barrett, B.T., and Morland, A.B.
(2008). Induced deficits in speed perception by transcranial magnetic stimula-
tion of human cortical areas V5/MT+ and V3A. J. Neurosci. 28, 6848–6857.
Morrone, M.C., Tosetti, M., Montanaro, D., Fiorentini, A., Cioni, G., and Burr,
D.C. (2000). A cortical area that responds specifically to optic flow, revealed
by fMRI. Nat. Neurosci. 3, 1322–1328.
Nakamura, K., and Colby, C.L. (2002). Updating of the visual representation in
monkey striate and extrastriate cortex during saccades. Proc. Natl. Acad. Sci.
USA 99, 4026–4031.
Nakamura, H., Kuroda, T., Wakita, M., Kusunoki, M., Kato, A., Mikami, A.,
Sakata, H., and Itoh, K. (2001). From three-dimensional space vision to
prehensile hand movements: the lateral intraparietal area links the area V3A
and the anterior intraparietal area in macaques. J. Neurosci. 21, 8174–8187.
Orban, G.A., Fize, D., Peuskens, H., Denys, K., Nelissen, K., Sunaert, S.,
Todd, J., and Vanduffel, W. (2003). Similarities and differences in motion
processing between the human and macaque brain: evidence from fMRI.
Neuropsychologia 41, 1757–1768.
Peuskens, H., Sunaert, S., Dupont, P., Van Hecke, P., and Orban, G.A. (2001).
Human brain regions involved in heading estimation. J. Neurosci. 21, 2451–
2461.
Pitzalis, S., Galletti, C., Huang, R.S., Patria, F., Committeri, G., Galati, G.,
Fattori, P., and Sereno, M.I. (2006). Wide-field retinotopy defines human
cortical visual area v6. J. Neurosci. 26, 7962–7973.
Pitzalis, S., Sereno, M.I., Committeri, G., Fattori, P., Galati, G., Patria, F., and
Galletti, C. (2010). Human v6: the medial motion area. Cereb. Cortex 20,
411–424.
1240 Neuron 73, 1228–1240, March 22, 2012 ª2012 Elsevier Inc.
Quinlan, D.J., and Culham, J.C. (2007). fMRI reveals a preference for near
viewing in the human parieto-occipital cortex. Neuroimage 36, 167–187.
Royden, C.S., and Vaina, L.M. (2004). Is precise discrimination of low level
motion needed for heading discrimination? Neuroreport 15, 1013–1017.
Royden, C.S., Banks, M.S., and Crowell, J.A. (1992). The perception of
heading during eye movements. Nature 360, 583–585.
Sereno, M.I., and Huang, R.S. (2006). A human parietal face area contains
aligned head-centered visual and tactile maps. Nat. Neurosci. 9, 1337–1343.
Silver, M.A., Ress, D., and Heeger, D.J. (2005). Topographic maps of visual
spatial attention in human parietal cortex. J. Neurophysiol. 94, 1358–1371.
Smith, A.T., Wall, M.B., and Thilo, K.V. (2011). Vestibular inputs to human
motion-sensitive visual cortex. Cereb. Cortex, in press. Published online July
9, 2011.
Stanton, G.B., Friedman, H.R., Dias, E.C., and Bruce, C.J. (2005). Cortical
afferents to the smooth-pursuit region of the macaque monkey’s frontal eye
field. Exp. Brain Res. 165, 179–192.
Tikhonov, A., Haarmeier, T., Thier, P., Braun, C., and Lutzenberger, W. (2004).
Neuromagnetic activity in medial parietooccipital cortex reflects the percep-
tion of visual motion during eye movements. Neuroimage 21, 593–600.
Tootell, R.B., Mendola, J.D., Hadjikhani, N.K., Ledden, P.J., Liu, A.K., Reppas,
J.B., Sereno, M.I., and Dale, A.M. (1997). Functional analysis of V3A and
related areas in human visual cortex. J. Neurosci. 17, 7060–7078.
Trenner, M.U., Fahle, M., Fasold, O., Heekeren, H.R., Villringer, A., and
Wenzel, R. (2008). Human cortical areas involved in sustaining perceptual
stability during smooth pursuit eye movements. Hum. Brain Mapp. 29,
300–311.
von Holst, E., and Mittelstaedt, H. (1950). Das Reafferenzprinzip.
Naturwissenschaften 37, 464–476.
Wall, M.B., and Smith, A.T. (2008). The representation of egomotion in the
human brain. Curr. Biol. 18, 191–194.
Zhang, T., Heuer, H.W., and Britten, K.H. (2004). Parietal area VIP neuronal
responses to heading stimuli are encoded in head-centered coordinates.
Neuron 42, 993–1001.