Embed Size (px)
Citation preview
Huggan White Wealth Management
May 2013
CRAIG WHITE, CIM, FCSI Financial Advisor
Phone: 250-979-3044
JOHN HUGGAN, FMA Financial Advisor
Phone: 250-979-2707
Raymond James Ltd.
Suite 500 – 1726 Dolphin Ave.
Kelowna, BC V1Y 9R9
Toll Free: 1-877-979-2700
The Reverse Bungee!
Of the many things I often reference in these commentaries is my keen interest in adventure,
travel and exploring all that our globe has to offer. Over the years I have been lucky enough to
visit a few distant places stretching from the beautiful coastlines of North America, to tiny
islands in the South Pacific Ocean to third-world villages in East Asia. Not surprisingly, each
journey has created lasting memories that I often look back upon with joy, happiness and the
realization of just how lucky most of us truly are. Recently, I recalled one of the more extreme
undertakings I experienced while travelling in Surfer’s Paradise on the Gold Coast of Eastern
Australia. On this particular day in late 1999 the group I was travelling with decided to test our
daredevil capabilities by visiting a local attraction called the SlingShot Bungee. For those not
familiar with this contraption, it more-less mirrors that of a traditional hand-held slingshot.
Basically, the ride consists of two telescopic gantry towers mounted on a platform which feeds
two elastic ropes down to a two person passenger car constructed from an open sphere of steel.
The passenger car is secured to the platform with an electro-magnetic latch as the elastic ropes
are stretched. When the electromagnet is turned off, the passenger car is catapulted vertically
with a G-Force of 3-5, reaching an altitude of 100 meters and a top speed of 160 km per hour in a
matter of seconds. As the passenger car ascends, it is free to rotate between the two ropes, giving
the rider a chaotic and disorienting ride. For yours truly this was an experience I was not going
to pass up and I jumped at the first opportunity. As expected, several of my travelling
companions initially refused to partake as they felt the experience was far too dangerous and
mistrusting. Finally though, after witnessing the fun others were having, the bystanders jumped
on board and joined in on the action.
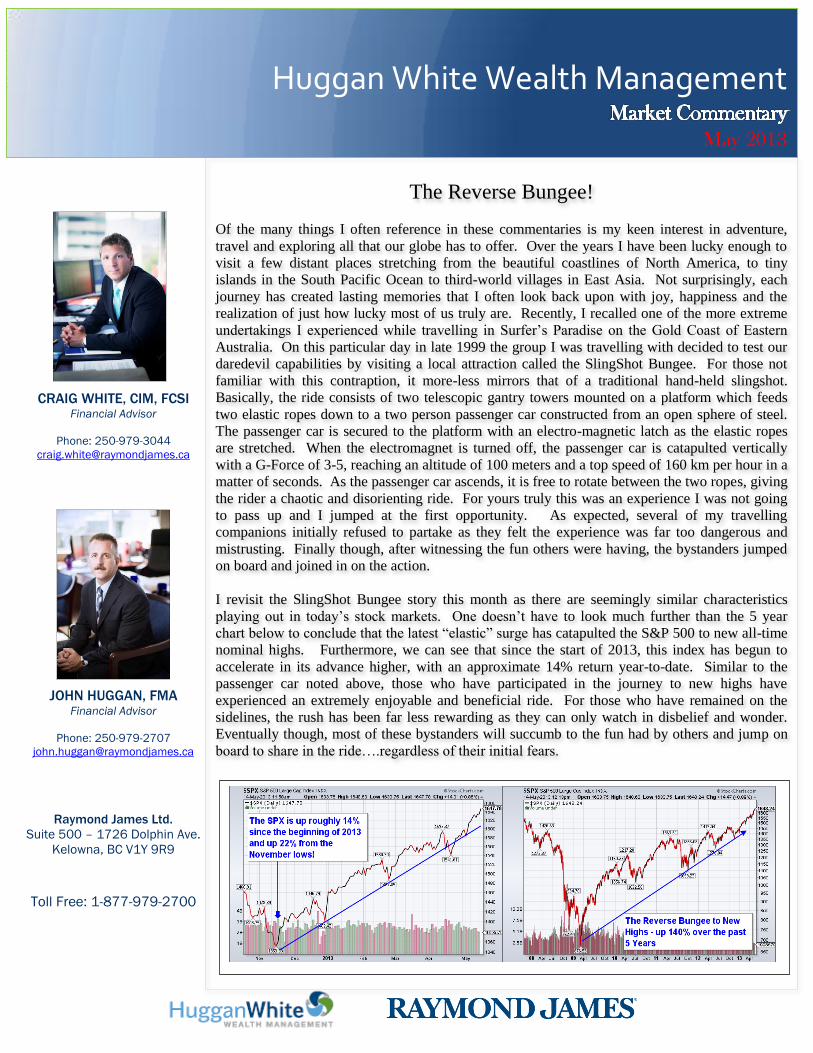
I revisit the SlingShot Bungee story this month as there are seemingly similar characteristics
playing out in today’s stock markets. One doesn’t have to look much further than the 5 year
chart below to conclude that the latest “elastic” surge has catapulted the S&P 500 to new all-time
nominal highs. Furthermore, we can see that since the start of 2013, this index has begun to
accelerate in its advance higher, with an approximate 14% return year-to-date. Similar to the
passenger car noted above, those who have participated in the journey to new highs have
experienced an extremely enjoyable and beneficial ride. For those who have remained on the
sidelines, the rush has been far less rewarding as they can only watch in disbelief and wonder.
Eventually though, most of these bystanders will succumb to the fun had by others and jump on
board to share in the ride….regardless of their initial fears.
HUGGANWHITE WEALTH MANAGEMENT MARKET COMMENTARY
January 1, 2012
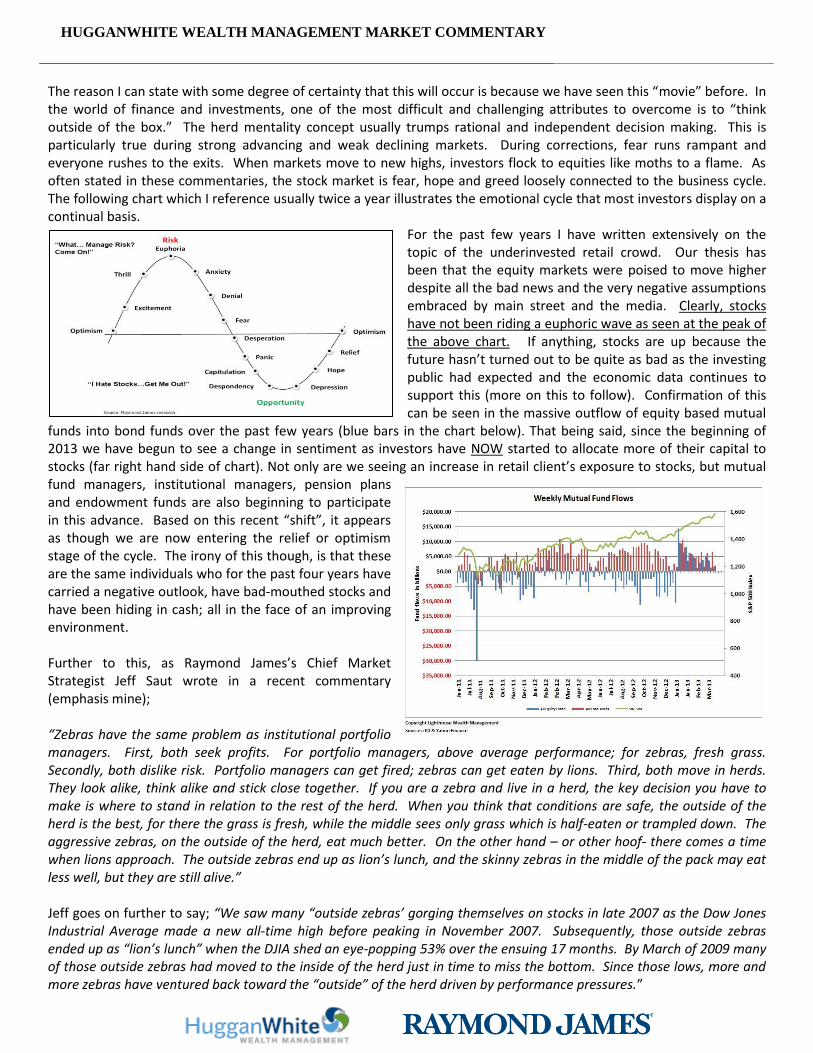
The reason I can state with some degree of certainty that this will occur is because we have seen this “movie” before. In the world of finance and investments, one of the most difficult and challenging attributes to overcome is to “think outside of the box.” The herd mentality concept usually trumps rational and independent decision making. This is particularly true during strong advancing and weak declining markets. During corrections, fear runs rampant and everyone rushes to the exits. When markets move to new highs, investors flock to equities like moths to a flame. As often stated in these commentaries, the stock market is fear, hope and greed loosely connected to the business cycle. The following chart which I reference usually twice a year illustrates the emotional cycle that most investors display on a continual basis.
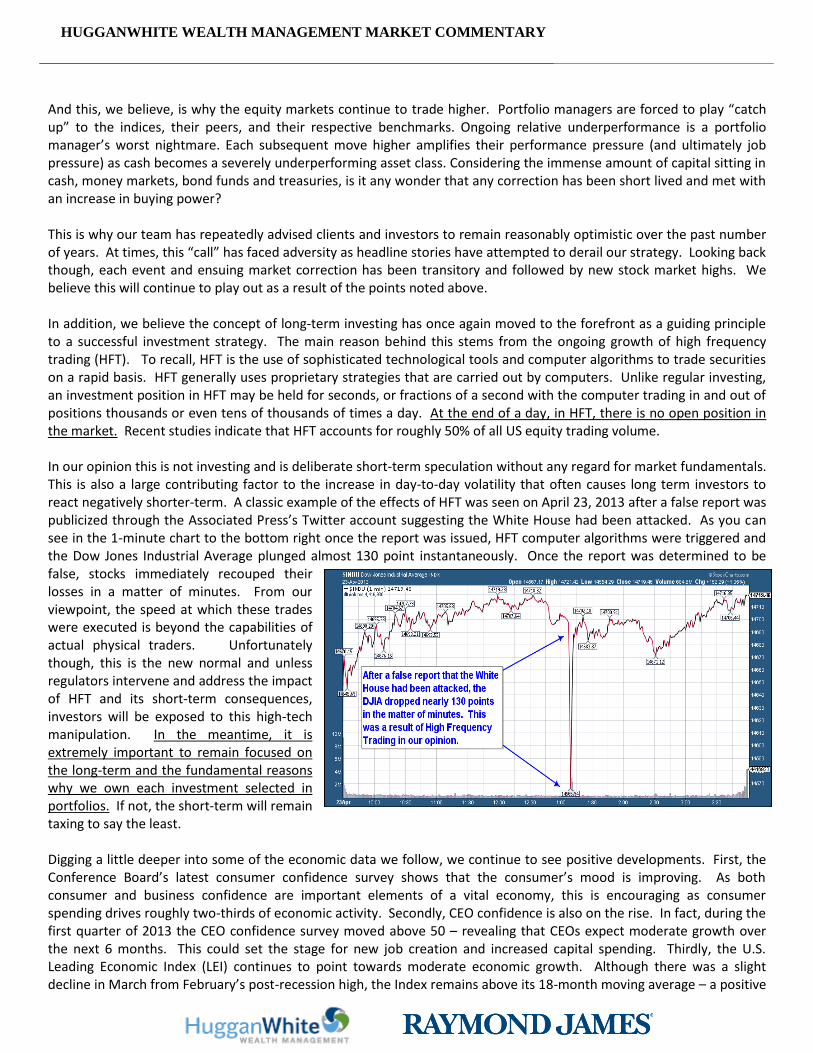
For the past few years I have written extensively on the topic of the underinvested retail crowd. Our thesis has been that the equity markets were poised to move higher despite all the bad news and the very negative assumptions embraced by main street and the media. Clearly, stocks have not been riding a euphoric wave as seen at the peak of the above chart. If anything, stocks are up because the future hasn’t turned out to be quite as bad as the investing public had expected and the economic data continues to support this (more on this to follow). Confirmation of this can be seen in the massive outflow of equity based mutual
funds into bond funds over the past few years (blue bars in the chart below). That being said, since the beginning of 2013 we have begun to see a change in sentiment as investors have NOW started to allocate more of their capital to stocks (far right hand side of chart). Not only are we seeing an increase in retail client’s exposure to stocks, but mutual fund managers, institutional managers, pension plans and endowment funds are also beginning to participate in this advance. Based on this recent “shift”, it appears as though we are now entering the relief or optimism stage of the cycle. The irony of this though, is that these are the same individuals who for the past four years have carried a negative outlook, have bad-mouthed stocks and have been hiding in cash; all in the face of an improving environment. Further to this, as Raymond James’s Chief Market Strategist Jeff Saut wrote in a recent commentary (emphasis mine); “Zebras have the same problem as institutional portfolio managers. First, both seek profits. For portfolio managers, above average performance; for zebras, fresh grass. Secondly, both dislike risk. Portfolio managers can get fired; zebras can get eaten by lions. Third, both move in herds. They look alike, think alike and stick close together. If you are a zebra and live in a herd, the key decision you have to make is where to stand in relation to the rest of the herd. When you think that conditions are safe, the outside of the herd is the best, for there the grass is fresh, while the middle sees only grass which is half-eaten or trampled down. The aggressive zebras, on the outside of the herd, eat much better. On the other hand – or other hoof- there comes a time when lions approach. The outside zebras end up as lion’s lunch, and the skinny zebras in the middle of the pack may eat less well, but they are still alive.” Jeff goes on further to say; “We saw many “outside zebras’ gorging themselves on stocks in late 2007 as the Dow Jones Industrial Average made a new all-time high before peaking in November 2007. Subsequently, those outside zebras ended up as “lion’s lunch” when the DJIA shed an eye-popping 53% over the ensuing 17 months. By March of 2009 many of those outside zebras had moved to the inside of the herd just in time to miss the bottom. Since those lows, more and more zebras have ventured back toward the “outside” of the herd driven by performance pressures.”
HUGGANWHITE WEALTH MANAGEMENT MARKET COMMENTARY
January 1, 2012
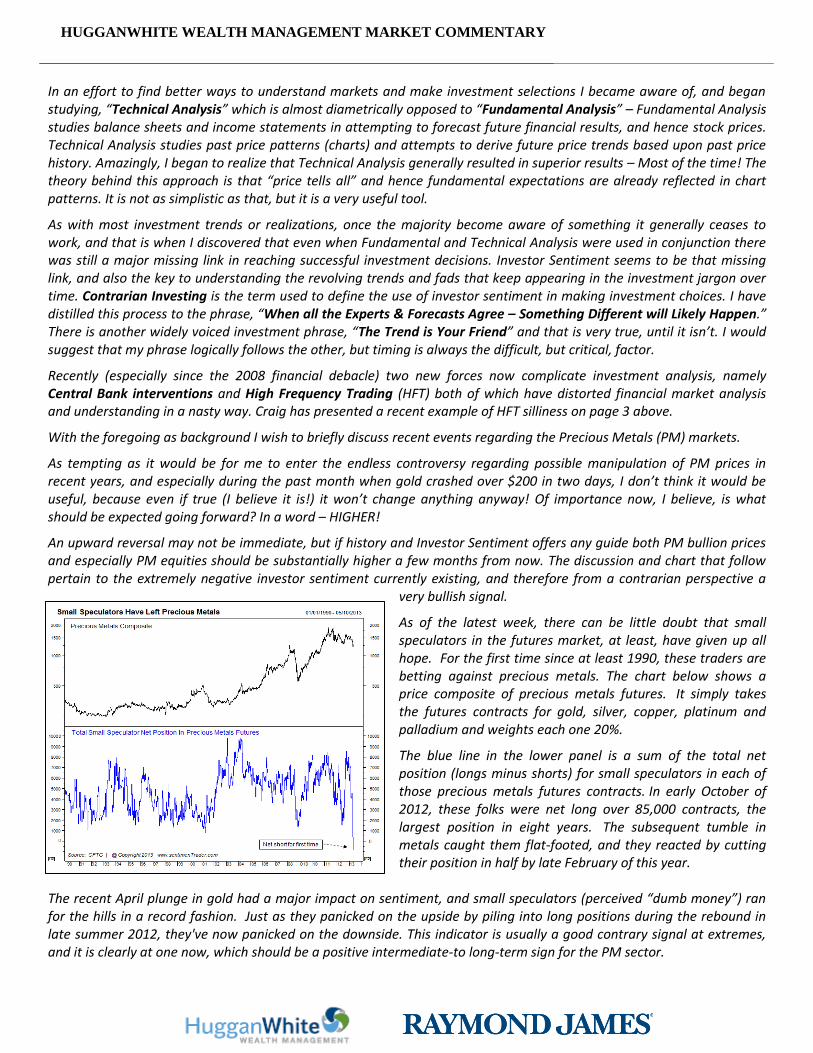
And this, we believe, is why the equity markets continue to trade higher. Portfolio managers are forced to play “catch up” to the indices, their peers, and their respective benchmarks. Ongoing relative underperformance is a portfolio manager’s worst nightmare. Each subsequent move higher amplifies their performance pressure (and ultimately job pressure) as cash becomes a severely underperforming asset class. Considering the immense amount of capital sitting in cash, money markets, bond funds and treasuries, is it any wonder that any correction has been short lived and met with an increase in buying power? This is why our team has repeatedly advised clients and investors to remain reasonably optimistic over the past number of years. At times, this “call” has faced adversity as headline stories have attempted to derail our strategy. Looking back though, each event and ensuing market correction has been transitory and followed by new stock market highs. We believe this will continue to play out as a result of the points noted above. In addition, we believe the concept of long-term investing has once again moved to the forefront as a guiding principle to a successful investment strategy. The main reason behind this stems from the ongoing growth of high frequency trading (HFT). To recall, HFT is the use of sophisticated technological tools and computer algorithms to trade securities on a rapid basis. HFT generally uses proprietary strategies that are carried out by computers. Unlike regular investing, an investment position in HFT may be held for seconds, or fractions of a second with the computer trading in and out of positions thousands or even tens of thousands of times a day. At the end of a day, in HFT, there is no open position in the market. Recent studies indicate that HFT accounts for roughly 50% of all US equity trading volume. In our opinion this is not investing and is deliberate short-term speculation without any regard for market fundamentals. This is also a large contributing factor to the increase in day-to-day volatility that often causes long term investors to react negatively shorter-term. A classic example of the effects of HFT was seen on April 23, 2013 after a false report was publicized through the Associated Press’s Twitter account suggesting the White House had been attacked. As you can see in the 1-minute chart to the bottom right once the report was issued, HFT computer algorithms were triggered and the Dow Jones Industrial Average plunged almost 130 point instantaneously. Once the report was determined to be false, stocks immediately recouped their losses in a matter of minutes. From our viewpoint, the speed at which these trades were executed is beyond the capabilities of actual physical traders. Unfortunately though, this is the new normal and unless regulators intervene and address the impact of HFT and its short-term consequences, investors will be exposed to this high-tech manipulation. In the meantime, it is extremely important to remain focused on the long-term and the fundamental reasons why we own each investment selected in portfolios. If not, the short-term will remain taxing to say the least. Digging a little deeper into some of the economic data we follow, we continue to see positive developments. First, the Conference Board’s latest consumer confidence survey shows that the consumer’s mood is improving. As both consumer and business confidence are important elements of a vital economy, this is encouraging as consumer spending drives roughly two-thirds of economic activity. Secondly, CEO confidence is also on the rise. In fact, during the first quarter of 2013 the CEO confidence survey moved above 50 – revealing that CEOs expect moderate growth over the next 6 months. This could set the stage for new job creation and increased capital spending. Thirdly, the U.S. Leading Economic Index (LEI) continues to point towards moderate economic growth. Although there was a slight decline in March from February’s post-recession high, the Index remains above its 18-month moving average – a positive

HUGGANWHITE WEALTH MANAGEMENT MARKET COMMENTARY
January 1, 2012
sign for the world’s largest economy. As Investech Research wrote in their latest commentary; “In the past 50 years not one recession began without the Conference Board’s Leading Economic Index (LEI) peaking and turning downward ahead of the economy. The minimum lead time was four months in 1960 and the lead time for every recession since 1970 had been nine months or more (chart below). Fourthly, as of last May 10th, 57.6% of reporting companies have beaten earnings estimates with 51.6% beating revenue estimates. Finally, the April unemployment data released recently exceeded expectations. Nonfarm payrolls rose more than expected in April, while figures for February and March were revised higher. The current jobless rate in the U.S. sits at 7.5%, its lowest level since December 2008.
As this market moves higher, we are also aware that all bull markets come to an end at some point. In conjunction with some of the data above, we continue to look for warning signs that may suggest a more imminent top is forming (which is not the case right now). Of those, two remain at the top of our list; 1) yields on 10 and 30 year bonds and 2) the U.S. Dollar. If the global economy begins to stagnate, even in the face of central bank intervention, yields on bonds could drop to new lows. If this occurs, this may be a deflationary “red-flag” and suggest recession is likely. Likewise, over the past number of years the U.S. dollar has been remarkably stable. However, a major warning flag would appear if the dollar suddenly drops to the previous lows seen in 2008. This would imply that purchasers are losing faith in the dollar (and the US Government) and would most likely lead to higher long-term interest rates. As always, if any changes do occur
in our indicators, these will be relayed to our clients in an appropriate and timely manner. At this time, we remain comfortable with the allocations in our portfolios. Finally, I want to touch upon a sector of the market that has received much attention over the past month due to its abysmal performance…the precious metals sector. It is no hidden secret that over the past 2 years (and 4 months specifically) gold, silver and precious metals related investments have been under severe selling pressure. For a full explanation on this, I am going to turn to a fellow investment advisor and recent addition to our team; John Skelton. Many of you know John from working with him in the past and without doubt he has gathered a significant amount of market insight, investment knowledge and experience over his 40 year career in this business. Although John has entered his retirement phase as of May 1st, he will be around our offices assisting in market research, passing on investment ideas and contributing to this monthly newsletter. This will only be beneficial to our clients as the knowledge John has attained is invaluable. This, in part, is an introductory piece to provide some background for those not familiar with John. With that I am going to turn it over to John for his recent comments on gold: “The personality and character of financial markets is constantly changing. Becoming an Investment Advisor over 40 years ago I arrived with over 8 years of general business experience, including a high level finance position with a major international manufacturing company, a MBA degree, an accounting designation and 5 years of personal investment “success.” On paper such a background should have been beneficial to a career in the investment industry. At that point in late 1972 stock markets had been on a relentless upward trend for the previous two years; shortly thereafter (Nov. 14, 1972) the Dow Jones Industrial Average closed above the 1,000 level for the very first time. The following January the DJIA peaked at a slightly higher high, then began one of the most brutal bear markets in decades. Preceding this vicious decline the investment world had been rejoicing over the new trendy investment strategy and the buzz phrase of the time – “the Nifty 50!” The nifty-50 stocks were those most favored by institutional investors in the 1960s and 1970s and were companies usually characterized by consistent earnings growth and high P/E ratios. They became known as "one-decision" stocks because investors were told they could buy and hold them forever! This fad of the times seemed to be working well for the investing public until it didn’t, and that is the point when I realized all my previous training that concentrated on “Fundamental Analysis” was of little use in attempting to make profitable investment selections on behalf of clients.
HUGGANWHITE WEALTH MANAGEMENT MARKET COMMENTARY
January 1, 2012
In an effort to find better ways to understand markets and make investment selections I became aware of, and began studying, “Technical Analysis” which is almost diametrically opposed to “Fundamental Analysis” – Fundamental Analysis studies balance sheets and income statements in attempting to forecast future financial results, and hence stock prices. Technical Analysis studies past price patterns (charts) and attempts to derive future price trends based upon past price history. Amazingly, I began to realize that Technical Analysis generally resulted in superior results – Most of the time! The theory behind this approach is that “price tells all” and hence fundamental expectations are already reflected in chart patterns. It is not as simplistic as that, but it is a very useful tool.
As with most investment trends or realizations, once the majority become aware of something it generally ceases to work, and that is when I discovered that even when Fundamental and Technical Analysis were used in conjunction there was still a major missing link in reaching successful investment decisions. Investor Sentiment seems to be that missing link, and also the key to understanding the revolving trends and fads that keep appearing in the investment jargon over time. Contrarian Investing is the term used to define the use of investor sentiment in making investment choices. I have distilled this process to the phrase, “When all the Experts & Forecasts Agree – Something Different will Likely Happen.” There is another widely voiced investment phrase, “The Trend is Your Friend” and that is very true, until it isn’t. I would suggest that my phrase logically follows the other, but timing is always the difficult, but critical, factor.
Recently (especially since the 2008 financial debacle) two new forces now complicate investment analysis, namely Central Bank interventions and High Frequency Trading (HFT) both of which have distorted financial market analysis and understanding in a nasty way. Craig has presented a recent example of HFT silliness on page 3 above.
With the foregoing as background I wish to briefly discuss recent events regarding the Precious Metals (PM) markets.
As tempting as it would be for me to enter the endless controversy regarding possible manipulation of PM prices in recent years, and especially during the past month when gold crashed over $200 in two days, I don’t think it would be useful, because even if true (I believe it is!) it won’t change anything anyway! Of importance now, I believe, is what should be expected going forward? In a word – HIGHER!
An upward reversal may not be immediate, but if history and Investor Sentiment offers any guide both PM bullion prices and especially PM equities should be substantially higher a few months from now. The discussion and chart that follow pertain to the extremely negative investor sentiment currently existing, and therefore from a contrarian perspective a
very bullish signal.
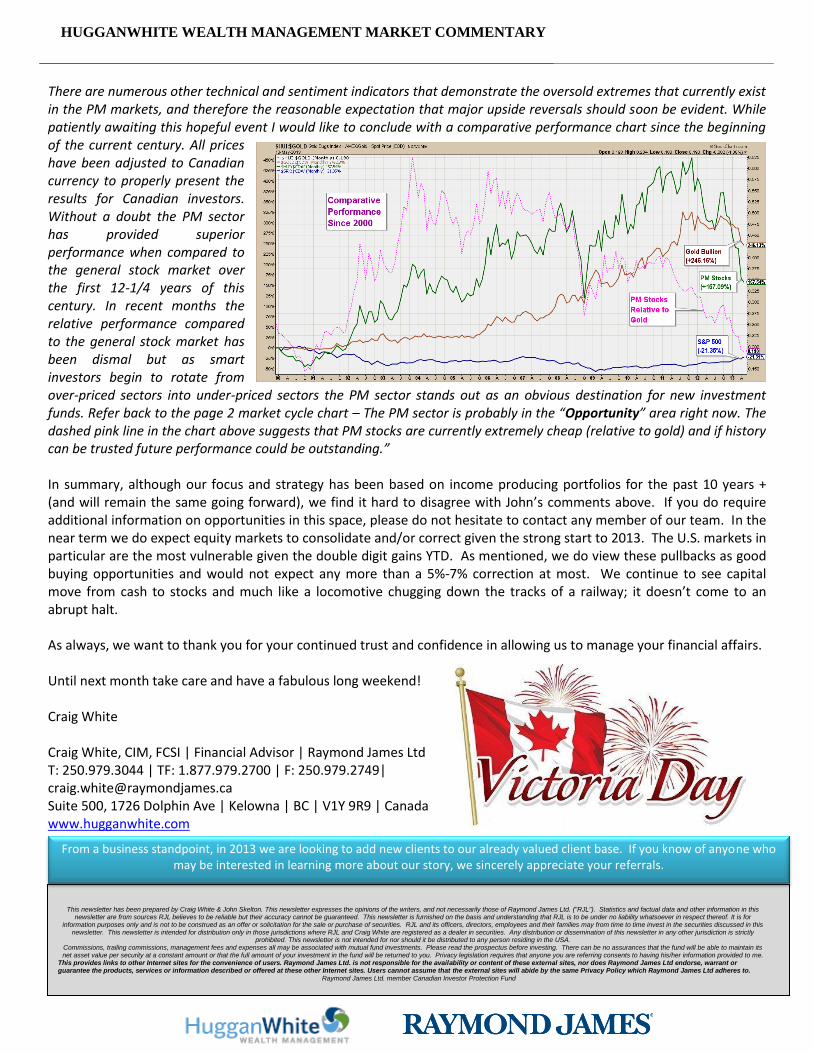
As of the latest week, there can be little doubt that small speculators in the futures market, at least, have given up all hope. For the first time since at least 1990, these traders are betting against precious metals. The chart below shows a price composite of precious metals futures. It simply takes the futures contracts for gold, silver, copper, platinum and palladium and weights each one 20%.
The blue line in the lower panel is a sum of the total net position (longs minus shorts) for small speculators in each of those precious metals futures contracts. In early October of 2012, these folks were net long over 85,000 contracts, the largest position in eight years. The subsequent tumble in metals caught them flat-footed, and they reacted by cutting their position in half by late February of this year.
The recent April plunge in gold had a major impact on sentiment, and small speculators (perceived “dumb money”) ran for the hills in a record fashion. Just as they panicked on the upside by piling into long positions during the rebound in late summer 2012, they've now panicked on the downside. This indicator is usually a good contrary signal at extremes, and it is clearly at one now, which should be a positive intermediate-to long-term sign for the PM sector.
HUGGANWHITE WEALTH MANAGEMENT MARKET COMMENTARY
January 1, 2012
There are numerous other technical and sentiment indicators that demonstrate the oversold extremes that currently exist in the PM markets, and therefore the reasonable expectation that major upside reversals should soon be evident. While patiently awaiting this hopeful event I would like to conclude with a comparative performance chart since the beginning of the current century. All prices have been adjusted to Canadian currency to properly present the results for Canadian investors. Without a doubt the PM sector has provided superior performance when compared to the general stock market over the first 12-1/4 years of this century. In recent months the relative performance compared to the general stock market has been dismal but as smart investors begin to rotate from over-priced sectors into under-priced sectors the PM sector stands out as an obvious destination for new investment funds. Refer back to the page 2 market cycle chart – The PM sector is probably in the “Opportunity” area right now. The dashed pink line in the chart above suggests that PM stocks are currently extremely cheap (relative to gold) and if history can be trusted future performance could be outstanding.”
In summary, although our focus and strategy has been based on income producing portfolios for the past 10 years + (and will remain the same going forward), we find it hard to disagree with John’s comments above. If you do require additional information on opportunities in this space, please do not hesitate to contact any member of our team. In the near term we do expect equity markets to consolidate and/or correct given the strong start to 2013. The U.S. markets in particular are the most vulnerable given the double digit gains YTD. As mentioned, we do view these pullbacks as good buying opportunities and would not expect any more than a 5%-7% correction at most. We continue to see capital move from cash to stocks and much like a locomotive chugging down the tracks of a railway; it doesn’t come to an abrupt halt. As always, we want to thank you for your continued trust and confidence in allowing us to manage your financial affairs. Until next month take care and have a fabulous long weekend!
Craig White
Craig White, CIM, FCSI | Financial Advisor | Raymond James Ltd T: 250.979.3044 | TF: 1.877.979.2700 | F: 250.979.2749| [email protected] Suite 500, 1726 Dolphin Ave | Kelowna | BC | V1Y 9R9 | Canada www.hugganwhite.com
This newsletter has been prepared by Craig White & John Skelton. This newsletter expresses the opinions of the writers, and not necessarily those of Raymond James Ltd. ("RJL"). Statistics and factual data and other information in this newsletter are from sources RJL believes to be reliable but their accuracy cannot be guaranteed. This newsletter is furnished on the basis and understanding that RJL is to be under no liability whatsoever in respect thereof. It is for
information purposes only and is not to be construed as an offer or solicitation for the sale or purchase of securities. RJL and its officers, directors, employees and their families may from time to time invest in the securities discussed in this newsletter. This newsletter is intended for distribution only in those jurisdictions where RJL and Craig White are registered as a dealer in securities. Any distribution or dissemination of this newsletter in any other jurisdiction is strictly
prohibited. This newsletter is not intended for nor should it be distributed to any person residing in the USA. Commissions, trailing commissions, management fees and expenses all may be associated with mutual fund investments. Please read the prospectus before investing. There can be no assurances that the fund will be able to maintain its net asset value per security at a constant amount or that the full amount of your investment in the fund will be returned to you. Privacy legislation requires that anyone you are referring consents to having his/her information provided to me.
This provides links to other Internet sites for the convenience of users. Raymond James Ltd. is not responsible for the availability or content of these external sites, nor does Raymond James Ltd endorse, warrant or guarantee the products, services or information described or offered at these other Internet sites. Users cannot assume that the external sites will abide by the same Privacy Policy which Raymond James Ltd adheres to.
Raymond James Ltd. member Canadian Investor Protection Fund
From a business standpoint, in 2013 we are looking to add new clients to our already valued client base. If you know of anyone who may be interested in learning more about our story, we sincerely appreciate your referrals.