Embed Size (px)
Citation preview

Huanglongbing (HLB)
An Overview
Ute AlbrechtPlant [email protected]
Southwest Florida Research and Education CenterUF/IFAS, Immokalee, FL
PLP 5115C – Citrus Pathology20 Nov 2017

Outline
I. Introduction to HLB
II. Plant responses and
physiological consequences(Leaves, roots, and fruit)
III. HLB tolerance

I. INTRODUCTION

Origin of HLB
Theories about the origins of HLB are controversial.
Disease of unknown cause found in southern China in the late
19th century.
By the 1920s similar diseases recorded in Taiwan (“likubin”,
“drooping disease”), the Philippines (“mottle leaf disease”), and
India (“citrus die-back”).
First noticed in Africa in the late 1920s (“yellow branch” or
“greening”).
In the 1940s in Indonesia described as “phloem degeneration”.
In the 1960s these diseases were recognized as being the same
disease.

Distribution of HLB
First confirmed in the Americas in 2004 (São Paulo State, Brazil). First discovered in Florida in 2005, but vector present since 1998. In the US now also in Texas, California, South Carolina, Georgia,
and Louisiana. Widespread in the Caribbean.
Gottwald et al 2007
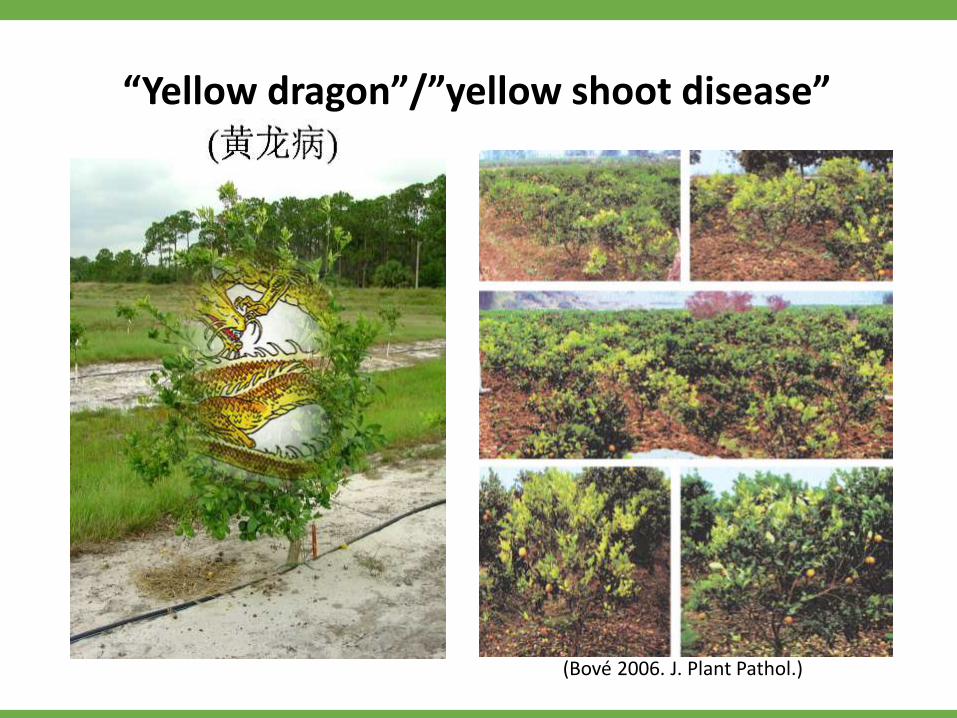
“Yellow dragon”/”yellow shoot disease”
(Bové 2006. J. Plant Pathol.)

Healthy Infected
Huanglongbing (HLB)Most citrus cultivars are susceptible to HLB.

Asian citrus psyllid
Huanglongbing (HLB)Vector and pathogen
Insect vector:
Asian citrus psyllid (Diaphorina citri)
African psyllid (Trioza erytreae)
Honey dew droplet
Sieve element
Epidermis
Parenchyma
Stylet tip
Stylet sheath
(Guerrierri and Digilio, J. Plant Interaction 2008)
Stylet bundle
Labium

Asian citrus psyllid
Associated pathogens:Candidatus Liberibacter asiaticus (CLas)Ca. L. americanus (CLam)Ca. L. africanus (CLaf)
→ Phloem-limited
Huanglongbing (HLB)Vector and pathogen
Insect vector:Asian citrus psyllid (Diaphorina citri)
African psyllid (Trioza erytreae)
Rogers & Stansly ENY-739Photo: Monique Garnier

Foliar disease symptoms
ChlorosisBlotchy mottle
Green islandsBlotchy mottle Corky veins

Fruit symptoms
(Bové 2006. J. Plant Pathol.)

II. PLANT RESPONSES AND PHYSIOLOGICAL CONSEQUENCES
OF HLB

Effects on leaves

Methods of inoculation(CLas is non-culturable)
buds

Albrecht et al. (2014) HortScience 49:367-377
Psyllid inoculationGraft inoculation
(Albrecht et al. 2014. HortScience)
Methods of inoculation
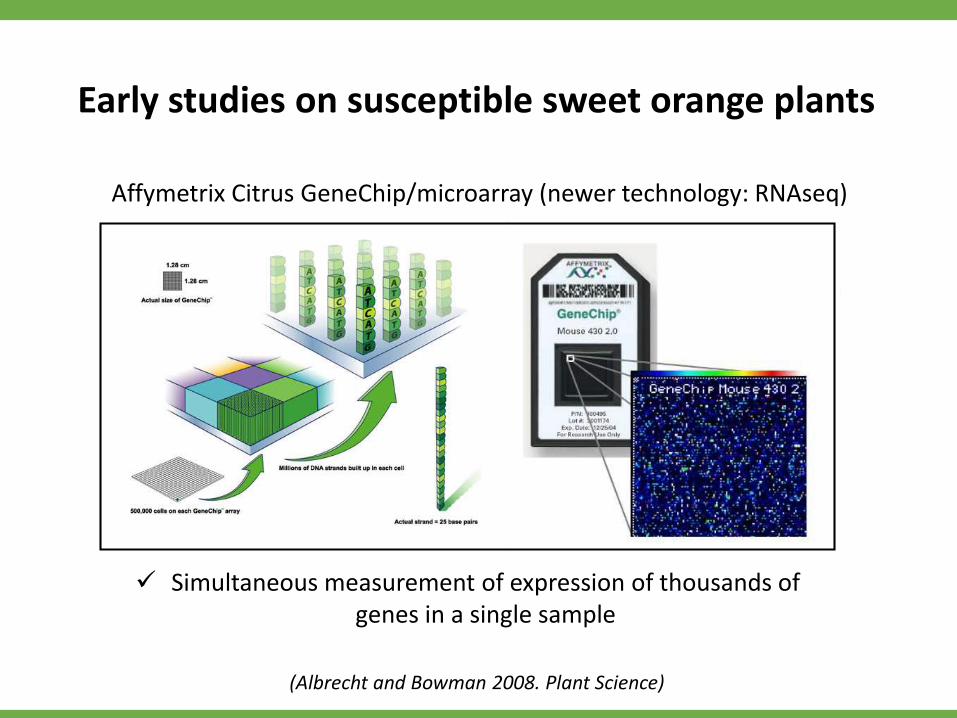
Early studies on susceptible sweet orange plants
Affymetrix Citrus GeneChip/microarray (newer technology: RNAseq)
Simultaneous measurement of expression of thousands of genes in a single sample
(Albrecht and Bowman 2008. Plant Science)

Experimental design
Plant material:Greenhouse-grown ‘Valencia’ (Citrus sinensis) plants.
Tissue used for analysis:Leaves collected at 5 and 9 weeks after inoculation (“early”-asymptomatic) and at 13 and 15 wai (“late”- symptomatic).
Inoculation:Graft-inoculation with bark pieces from infected plants or from healthy plants (control).

Plant defense mechanisms
Constitutive defense Preformed barriers (thorns, bark,
cuticle, cell wall).
Inducible defense Production of toxic chemicals (defensins, primary and
secondary metabolites - phenolics: flavonoids, phyoalexins). Pathogen degrading enzymes (proteinase inhibitors,
hydrolytic enzymes/PR proteins: chitinases, glucanases). Oxidative burst, cell wall reinforcement (callose), cell suicide
(hypersensitive response). SAR (systemic acquired resistance).
www2.nau.edu
http://research4.dfci.harvard.edu
HR

Plant defense response
(Broekgaarden et al. 2015. Plant Physiol.)
The speed and magnitude of defense response and the ability of the pathogen to suppress it are important for the outcome of the host-pathogen interaction (resistant or susceptible).
Salicylic acid (SA), jasmonic acid (JA), and other signaling pathways

Up-regulated (%) Down-regulated (%)
Biological process Early Late Early Late
Response to stress 9.2 10.8 12.2 12.3
Response to abiotic or biotic stimuli 13.3 15.2 16.3 13.1
Signal transduction 6.1 3.2 4.1 1.6
Transcription 9.2 3.2 0 0.8
Transport 13.3 10.1 8.2 8.2
Cell organization and biogenesis 4.1 1.9 4.1 1.6
Electron transport or energy pathways 9.2 8.9 6.1 6.6
DNA or RNA metabolism 0 4.4 12.2 0
Protein metabolism 5.1 3.2 4.1 5.7
Developmental processes 4.1 1.9 4.1 1.6
Other cellular processes 38.8 34.8 30.6 31.1
Other metabolic processes 42.9 35.4 36.7 44.3
Unknown biological processes 21.4 24.1 26.5 25.4
Citrus response to CLas

Up-regulated (%) Down-regulated (%)
Cellular component Early Late Early Late
Cell wall 6.1 5.6 2.3 5.8
Chloroplast 15.3 8.1 15.9 26.4
Cytosol 5.1 3.1 4.5 0.8
ER 0 1.2 0 1.7
Extracellular 3.1 7.5 0 0
Nucleus 10.2 8.7 18.2 2.5
Other cellular components 1.0 3.1 2.3 1.7
Other cytoplasmic components 3.1 8.1 4.5 24.0
Other intracellular components 2.0 8.1 18.2 25.6
Other membranes 32.7 47.8 27.3 50.4
Plasma membrane 4.1 0.6 0 3.3
Plastid 1.0 3.1 2.3 19.0
Unknown cellular components 29.6 22.4 34.1 20.7
Citrus response to CLas

Citrus defense response to CLas
Genes for defense related proteins (peroxidase, lipoxygenase, chitinase, osmotin, thaumatin, superoxide dismutase) are not substantially upregulated at the early stage of infection. Some are downregulated at the later stage.
Genes associated with SA-signaling were not considerably up-regulated.
→ Insufficient defense response→ Host plant is unable to suppress
the pathogen (susceptible interaction).
(Albrecht and Bowman 2008. Plant Science)

0
500
1000
1500
2000
2500
5-9 wai 13-17 wai
Sig
nal
inte
nsit
y
Glucose-6-phosphate/phosphate translocator (Cit.9625.1.S1_s_at)
0
250
500
750
1000
1250
1500
1750
5-9 wai 13-17 wai
Sig
nal
inte
nsit
y
ADP-glucose pyrophosphorylaselarge subunit (Cit.13437.1.S1_s_at)
Genes for key enzymes of carbohydrate/starch metabolism are upregulated at the early/asymptomatic and at the late/symptomatic
stage of disease.
AGPase (APL3)Catalyzes the rate-limiting step in starch biosynthesis in the chloroplasts.
GPTResponsible for the exchange of G6P and Pi across the plastid membrane.
HLB and carbohydrate metabolism
(Albrecht and Bowman 2008. Plant Science)

Starch accumulation in response to infection
Infected
Healthy
Healthy
Infected
(Albrecht and Bowman 2008. Plant Science)
Iodine staining

Leaf carbohydrate analysis in field-grown sweet orange trees
(Albrecht and Bowman 2010, Proc. 11th ICC, Wuhan, China)
Glucose
0
2
4
6
8
10
12
14
mg
/g le
af MA
MS
YA
YS
Fructose
0
2
4
6
8
10
12
14
mg
/g le
af
Sucrose
0
50
100
150
200
250
mg
/g le
af MA
MS
YA
YS
Starch
0
200
400
600
800
1000
1200
mg
glu
co
se
/g le
af
cc
b
a
bb
a
a
bb b
a
b
a
cc
Starch
Glucose Fructose
Mature
blotchy
mottled
leaves
Younger
severely
chlorotic
leaves
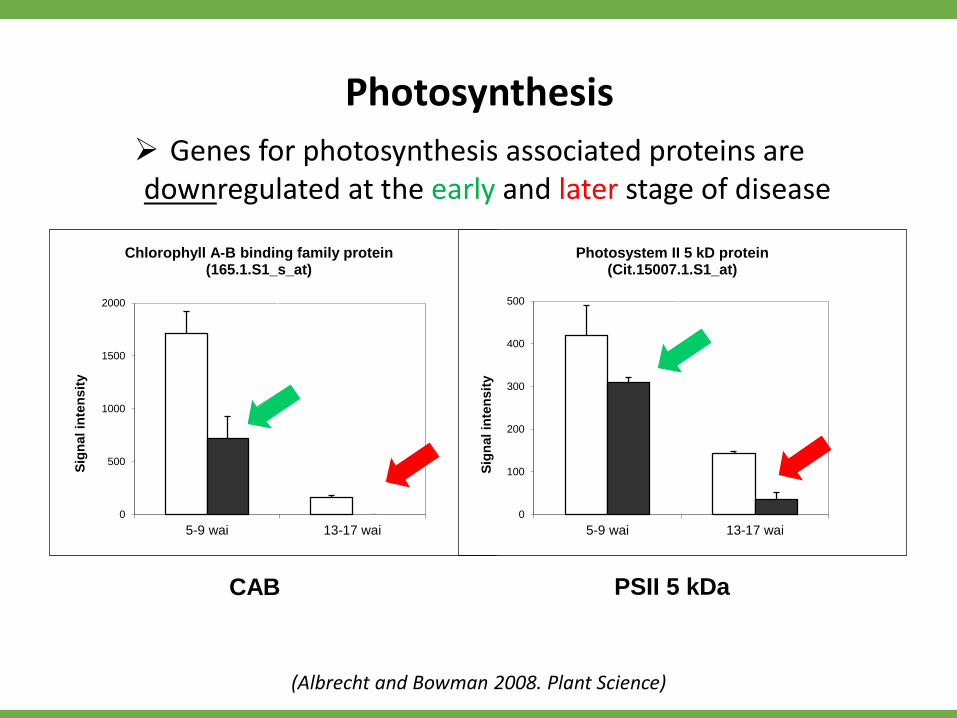
Genes for photosynthesis associated proteins are downregulated at the early and later stage of disease
CAB PSII 5 kDa
0
500
1000
1500
2000
5-9 wai 13-17 wai
Sig
nal
inte
nsit
y
Chlorophyll A-B binding family protein(165.1.S1_s_at)
0
100
200
300
400
500
5-9 wai 13-17 wai
Sig
nal
inte
nsit
y
Photosystem II 5 kD protein(Cit.15007.1.S1_at)
Photosynthesis
(Albrecht and Bowman 2008. Plant Science)

0
500
1000
1500
2000
2500
3000
5-9 wai 13-17 wai
Sig
nal
inte
nsit
y
Phloem-specific lectin PP2-like protein(Cit.39675.1.S1_at)
Albrecht and Bowman (2008) Plant Science 175:291-306
Genes for a phloem specific lectin like protein and for proteins involve in cell organization are upregulated at
the later disease stage.
ExpansinsKey regulators of cell wall extension
0
400
800
1200
1600
5-9 wai 13-17 wai
Sig
nal
inte
nsit
y
Beta-expansin (EXBP2)(Cit.9528.1.S1_x_at)
PP2Sieve cell differentiation, long-
distance signaling
Phloem and cell organization
(Albrecht and Bowman 2008. Plant Science)

Phloem necrosis(Achor et al. 2010. Plant Path. J.)
a) Sieve element with bacteria and plugged sieve plate→ Callose and PP2 (defense response?)
b) Collapsed phloem with plugged sieve elements (infected leaf)c) Normal phloem (healthy leaf)
a b c
→ Blockage of the transportation stream

Cell wall loosening enzymes
→ Vascular differentiation→ Key regulators of cell wall extension→ Replacement phloem formation(Sampedro and Cosgrove 2005 Genome Biology 6)
(Brodersen et al. 2014)

Other findings
Later stage of disease: Upregulation of stress and
defense-related genes. Upregulation of membrane
transporter genes.
(Albrecht and Bowman 2008. Plant Science)

Effects on roots

Root tissue(Etxeberria et al. 2009. Physiol. Mol. Plant Pathol.)
→ Starch is depleted in roots of infected trees.
Infected
Healthy

Stem Roots
Root transcriptome responses(Aritua et al. 2013. Plos One)
Expression of genes encoding enzymes and proteins that are involved in carbohydrate metabolism was only affected in the stem, not in the roots.
More starch was found in healthy roots than in infected roots. Root phloem was not much affected.

Scion Cleo Cleo Cleo Val Val Val
Rootstock 802 897 942 802 Cleo Cleo 802 897 942 802
APL3 10.7 12.0 7.1 3.1 6.6 22.8 -5.2 1.1 -1.3 -7.3 -3.2 -12.9
GPT2 32.8 27.2 8.1 22.7 72.0 134.5 -4.4 -1.4 -1.1 -37.1 -3.6 -92.0
PP2B15 1.0 1.0 1.0 8.3 1.5 155.4 1.0 1.0 1.0 1.0 1.0 1.0
CALS -2.1 -1.6 -1.8 1.4 1.3 -1.4 1.0 1.2 -1.1 1.4 2.4 -1.6
CHIT 9.6 8.6 36.0 17.9 8.6 132.1 1.5 1.5 -1.6 -1.2 1.2 1.1
PDF2 1.5 1.5 1.5 1.7 2.4 3.0 1.4 2.1 1.0 1.3 3.1 4.8
CDR1 4.7 4.7 2.6 3.3 -1.2 3.9 -1.7 -1.1 1.0 -1.7 1.6 -2.0
ANK 1.3 2.7 2.3 4.5 1.1 16.5 -1.1 1.3 1.2 1.1 1.5 1.4
ACD1 -1.4 -1.1 -1.5 1.9 1.4 1.0 -1.1 1.2 -1.3 1.2 5.3 -1.8
PAD4 1.6 2.0 1.8 1.9 1.9 3.6 -1.5 1.0 1.0 1.1 1.4 1.8
NPR1 -1.5 -1.1 1.0 1.8 1.5 1.6 -1.2 1.5 -1.1 1.0 3.2 1.9
JMT 7.7 3.9 2.3 15.4 2.3 13.8 2.5 1.9 -2.1 -5.8 11.5 -17.2
OMT 9.8 6.3 4.9 4.4 10.6 28.7 -1.3 -1.1 -1.6 -1.4 5.1 -7.9
JAR1 -1.8 -2.1 -1.8 1.3 -1.5 -1.4 1.9 1.1 -1.3 1.1 5.0 1.7
LOX 6.4 5.8 6.6 5.9 1.8 5.3 -1.4 1.6 -1.4 -1.9 1.5 1.0
UGT73B3 -1.9 -1.5 -1.3 -1.1 1.0 1.1 -1.1 1.4 1.1 1.0 2.2 1.6
UGT 1.0 1.6 1.4 3.1 1.9 2.0 -1.4 1.7 -1.1 -1.1 2.6 -2.4
CSD1 8.2 3.1 3.1 2.8 1.0 25.5 1.3 2.0 1.1 -1.3 2.6 2.6
TRX 1.2 -1.4 1.5 -1.5 -2.3 -21.0 2.5 1.6 1.1 9.6 21.3 17.1
MIR 182.2 90.1 98.3 11.3 3.1 7.5 1.8 -1.3 -8.0 -5.3 -4.7 42.3
ZIP5 6.3 28.7 8.7 19.7 23.7 506.0 1.2 6.5 2.6 -1.7 3.3 2.8
Leaves RootsCleo Val
Cleo
Fold change of gene expression in response to Las(Albrecht, unpublished)
Fold change of gene expression in leaves and roots of infected greenhouse-grown plants compared with non-infected plants 16 months after inoculation.

Association of Clas and root decline(Johnson et al. Plant Pathol. 2014)
Clas can colonize the roots prior to colonization of leaves (roots are a sink for most of the year) from where it can move to the canopy during subsequent leaf flushes (sink).
→ Root damage is not associated with carbohydrate starvation caused by phloem plugging.
Roots become damaged prior to development of visible foliar symptoms.

Summary of major consequences of HLB
→ Changes in carbohydrate partitioning (changes in source-sink relation ships).
→ Sugars are not transported to sink tissue such as developing fruits and roots.
→ Starch accumulates in most tissue in the above-ground portion of trees.
→ Roots decline. Fruits do not develop properly.→ Situation is exacerbated by phloem necrosis.
Infection with CLas causes disturbance of carbohydrate metabolism

Yellow diseases
Coconut lethal yellowing Grapevine yellows Aster yellows Peach X-disease Apple proliferation diseases
Bertaccini and Duduk (2009) Phytopathol. Mediterr. 48:355-378
Similar disorders are caused other phloem-limited plant pathogenic microorganisms (phytoplasmas) that are associated with “yellow-type” diseases.
http://idtools.org/id/palms/symptoms/factsheet.php?name=Lethal+Yellowing

Other metabolic consequences

Endproduct of cellular regulatory processes.
Ultimate physiological response of a biological system to genetic or environmental changes.
Metabolites
Metabolic profiling

Which leaf metabolic pathways are affected?
Arginine and proline metabolism(proline, hydroxyproline, ornithine, citrulline).
Alanine, aspartate and glutamate metabolism (alanine, asparagine, glutamine, GABA).
→ Known to accumulate in response to stress.→ Osmoprotectants→ Scavenging of reactive oxygen species (ROS)→ Reinforcement of the cell wall
(Albrecht et al. 2016, Plant Physiol. Biochem.)

Which leaf metabolic pathways are affected?
Both pathways closely associated with nitrogen metabolism, specifically N storage and transport.
Pathways initially up-regulated (defense), but down-regulated as disease progresses (breakdown of defenses).
Similar observations for other pathways:o Galactose metabolismo TCA cycleo Starch and sucrose metabolism.
(Albrecht et al. 2016, Plant Physiol. Biochem.)

Conclusions
Physiological responses are activated to counteract the negative effects of CLas.
But, defense responses break down as the disease progresses, ultimately leading to disease symptom expression and plant decline.
Duan et al. (2008) suggested that CLas is parasitic rather than pathogenic.
Disease symptoms arise primarily as a result of host metabolic imbalances caused by nutrient depletion or interference of transportation.

Effects on nutrient status

(Modified after Spann and Schumann, HS1181)
Nutrient Symbol Function in plants
NitrogenPhosphorousPotassiumCalciumMagnesiumSulfurChlorineIronBoronManganeseCopperZincMolybdenum
NPK
CaMgSClFeB
MnCuZnMo
Proteins, amino acidsNucleic acids, ATPCatalyst, ion transportCell wall componentPart of chlorophyllAmino acidsPhotosynthesis reactionsChlorophyll synthesisCell wall componentActivates enzymesComponent of enzymesActivates enzymesInvolved in N fixation
Importance of plant nutrients

Asymptomatic
(CLas+)
Blotchy
mottle
(CLas+)
Chlorosis
(CLas+)
Control
(CLas-)
HLB effect on leaf nutrient content
Greenhouse-grown Valencia plants (4 mai)

Leaf type N Fe
Control 6 46.50 a 104.64 a 35972 a 5.876 b 62.03 ab 20273 ab
Asymptomatic 9 28.56 b 82.38 b 18332 b 8.027 a 62.83 a 22953 a
Blotchy mottle/yellow veins 6 27.23 b 78.17 b 16937 b 5.783 b 46.92 bc 17582 b
Chlorosis 6 15.04 c 49.15 c 4709 c 4.845 b 32.23 c 17738 b
P
Leaf type N
Control 6 3489 a 66.66 a 0.0510 a 1.565 a 2440 a 17.13 a
Asymptomatic 9 2430 b 55.99 a 0.0039 a 1.483 a 2033 b 12.81 a
Blotchy mottle/yellow veins 6 1910 b 46.96 a -0.0246 a 1.374 a 1533 c 9.77 a
Chlorosis 6 1172 c 20.36 b -0.0386 a 4.461 a 1681 c 12.32 a
P < 0.00002< 0.00001 < 0.00012 > 0.05 > 0.05 > 0.05
ZnMg Mn Mo Ni P
Al B Ca Cu K
< 0.00001 < 0.00001 < 0.00001 < 0.00117 < 0.00003 < 0.00001
Greenhouse-grown Valencia plants (4 mai)
(numbers are parts per million)
Leaf nutrient analysis(Albrecht, Albano, Bowman, unpublished)

Effects on fruits

Rosales and Burns (2011) J. Plant Growth Regul.
HLB effects on fruits

Carbohydrate status of fruits(Rosales and Burns 2011. J. Plant Growth Regul.)
Lower starch and sucrose content in flavedo of symptomatic mature Valencia fruit.
Immature fruit Mature fruit
Immature fruit Mature fruit

Girdling did not cause misshapen fruit or differential peel coloration. Many gene expression changes were found in the flavedo of infected
symptomatic fruit, but not in fruit from girdled trees.→ HLB symptoms do not appear to be a direct consequence of carbohydrate
starvation.
Comparison of fruit from infected and girdled tree(Lia and Burns 2012. J. Exp. Bot.)
HLB Girdled

Phytohormonal imbalances in fruits(Rosales and Burns 2011. J. Plant Growth Regul.)
Healthy side of fruit
Misshapen side of fruit
Higher IAA concentrations in the misshapen side of a symptomatic fruit.

Effect on fruit/juice quality(Baldwin et al. 2010. J. Agric. Food Chem.)
Many fruit quality factors are not negatively affected in asymptomatic fruit, but symptomatic fruit are of lower quality.
Juice from asymptomatic fruit and especially from symptomatic fruit is higher in the bitter compounds nomilin and limonin, causing flavor problems.

Fruit drop

HLB and preharvest fruit drop
Average
fruit drop
2007-2008:
8-15%(NASS, 2016)
Average
fruit drop
2015-2016:
30-45%(NASS, 2016)
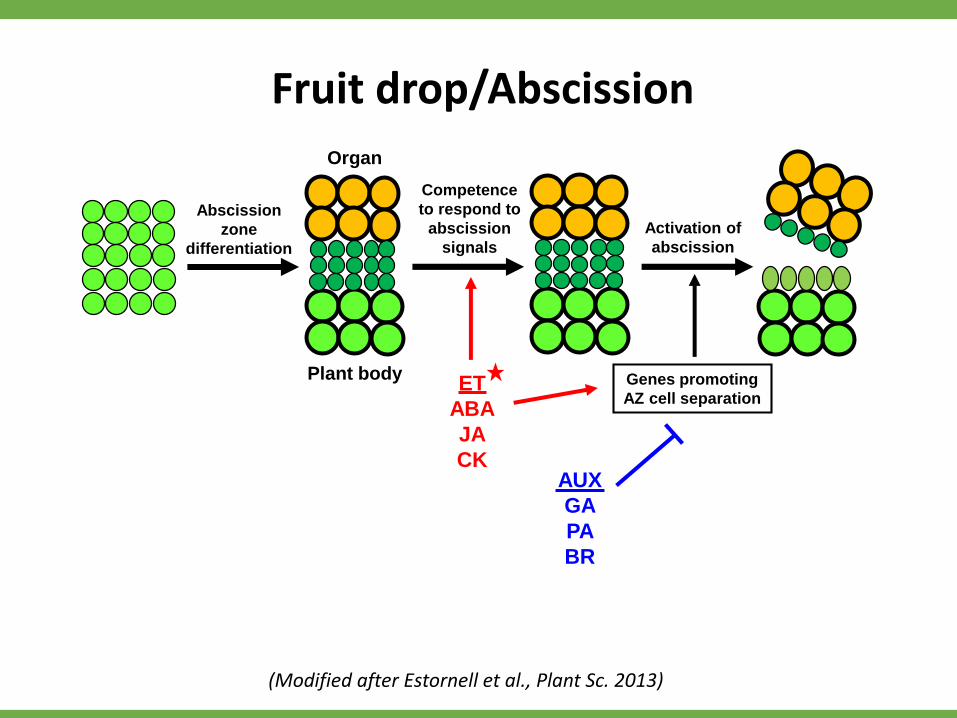
Competence
to respond to
abscission
signals
Activation of
abscission
Organ
Plant body
Abscission
zone
differentiation
ET
ABA
JA
CK
Genes promoting
AZ cell separation
AUX
GA
PA
BR
Fruit drop/Abscission
(Modified after Estornell et al., Plant Sc. 2013)

Competence
to respond to
abscission
signals
Activation of
abscission
Organ
Plant body
Abscission
zone
differentiation
ET
ABA
JA
CK
Genes promoting
AZ cell separation
(Modified after Estornell et al., Plant Sc. 2013)
Nutrient deficiencies
(Fe, P, K, S, B, N, Mg)
AUX
GA
PA
BR
Carbohydrate
deficiency
Water stress
Sucrose
Fruit drop/Abscission
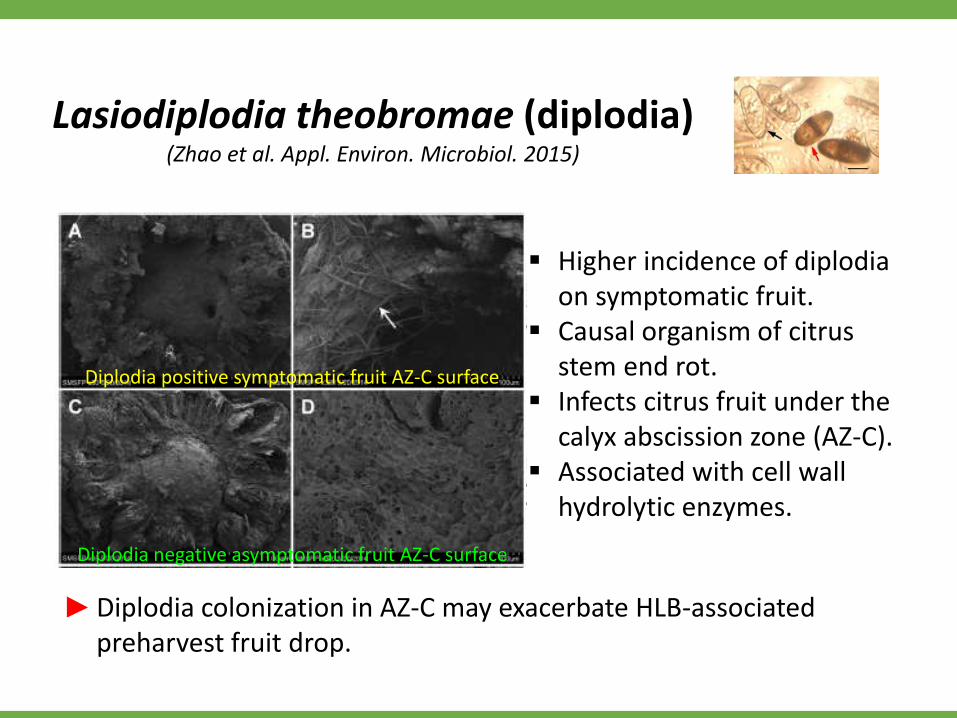
Lasiodiplodia theobromae (diplodia)(Zhao et al. Appl. Environ. Microbiol. 2015)
Higher incidence of diplodiaon symptomatic fruit.
Causal organism of citrus stem end rot.
Infects citrus fruit under the calyx abscission zone (AZ-C).
Associated with cell wall hydrolytic enzymes.
Diplodia positive symptomatic fruit AZ-C surface
Diplodia negative asymptomatic fruit AZ-C surface
Diplodia colonization in AZ-C may exacerbate HLB-associated preharvest fruit drop.

III. HLB TOLERANCE

US-897 – HLB tolerant(Citrus reticulata ‘Cleopatra’ x Poncirus trifoliata ‘Flying Dragon’)
Usually used as rootstock.

Effect of CLas on rootstock seedlings
Infected
Greenhouse evaluations
Cleopatra
Control
US-897 US-942
Infected InfectedControl Control

Cleopatra
US-897
Field evaluations

CleopatraCarrizo US-802US-812US-897US-942
Metabolic profilingComparison of rootstock seedlings with different
sensitivity to Clas .
Objective:Identify metabolites that are associated with HLB
tolerance.

Carrizo CTRL
Carrizo CTRLCarrizo CTRL
Carrizo CTRL
Carrizo CTRL
Carrizo CTRL
Carrizo LASCarrizo LAS
Carrizo LAS
Carrizo LASCarrizo LAS
Carrizo LAS
Cleo CTRL
Cleo CTRLCleo CTRL
Cleo CTRLCleo CTRL
Cleo CTRL
Cleo LASCleo LASCleo LAS
Cleo LAS
Cleo LASCleo LAS
US-802 CTRL
US-802 CTRL
US-802 CTRL
US-802 CTRL
US-802 CTRL
US-802 CTRL
US-802 LAS
US-802 LAS
US-802 LAS
US-802 LAS
US-802 LAS
US-802 LAS
US-812 CTRL
US-812 CTRLUS-812 CTRL
US-812 CTRLUS-812 CTRLUS-812 CTRLUS-812 LASUS-812 LAS
US-812 LAS
US-812 LAS
US-812 LASUS-812 LASUS-897 CTRLUS-897 CTRL
US-897 CTRL
US-897 CTRLUS-897 CTRLUS-897 CTRL
US-897 LAS
US-897 LASUS-897 LAS
US-897 LAS
US-897 LAS
US-897 LASUS-942 CTRL
US-942 CTRL
US-942 CTRL
US-942 CTRL
US-942 CTRLUS-942 CTRL
US-942 LASUS-942 LAS
US-942 LAS
US-942 LAS
US-942 LASUS-942 LAS
-50 -40 -30 -20 -10 0 10 20 30
PC1 (22.9%)
-20
-10
0
10
20
30
PC
3 (
7.8
%)
Carrizo CTRL
Carrizo CTRLCarrizo CTRL
Carrizo CTRL
Carrizo CTRL
Carrizo CTRL
Carrizo LASCarrizo LAS
Carrizo LAS
Carrizo LASCarrizo LAS
Carrizo LAS
Cleo CTRL
Cleo CTRLCleo CTRL
Cleo CTRLCleo CTRL
Cleo CTRL
Cleo LASCleo LASCleo LAS
Cleo LAS
Cleo LASCleo LAS
US-802 CTRL
US-802 CTRL
US-802 CTRL
US-802 CTRL
US-802 CTRL
US-802 CTRL
US-802 LAS
US-802 LAS
US-802 LAS
US-802 LAS
US-802 LAS
US-802 LAS
US-812 CTRL
US-812 CTRLUS-812 CTRL
US-812 CTRLUS-812 CTRLUS-812 CTRLUS-812 LASUS-812 LAS
US-812 LAS
US-812 LAS
US-812 LASUS-812 LASUS-897 CTRLUS-897 CTRL
US-897 CTRL
US-897 CTRLUS-897 CTRLUS-897 CTRL
US-897 LAS
US-897 LASUS-897 LAS
US-897 LAS
US-897 LAS
US-897 LASUS-942 CTRL
US-942 CTRL
US-942 CTRL
US-942 CTRL
US-942 CTRLUS-942 CTRL
US-942 LASUS-942 LAS
US-942 LAS
US-942 LAS
US-942 LASUS-942 LAS
PCA score plot of leaf metabolites (N = 650)
Cleopatra
US-812
US-897
US-942
US-802
Carrizo
(Albrecht et al. 2016, Plant Physiol. Biochem.)
Metabolic profiling

BinBase nameCarrizo/
Cleopatra
US-802/
Cleopatra
US-812/
Cleopatra
US-897/
Cleopatra
US-942/
Cleopatra
309738 6.7 321.1 398.2 318.6 317.8
703026 96.3 8.6 64.3 116.5 257.1
702907 89.4 53.1 182.9 102.5 83.2
309580 2.7 88.2 98.3 96.2 100.6
703269 3.9 2.6 12.2 24.3 24.5
suberyl glycine 1.1 1.1 1.8 23.4 6.4
702913 41.7 46.5 42.1 16.0 27.6
702941 7.2 8.4 25.3 16.0 19.5
702920 1.6 0.4 10.5 12.0 17.9
702911 39.4 41.1 35.0 11.9 19.0
703276 0.8 0.8 1.4 11.1 12.2
ornithine 2.5 1.1 1.8 9.1 10.0
703379 1.2 14.8 15.1 8.9 11.4
703271 4.2 3.0 1.5 7.6 7.8
214418 55.4 47.5 6.9 5.0 8.4
quinic acid 2.2 3.4 4.4 4.7 4.4
202088 31.5 34.8 5.2 3.3 5.8
214422 47.3 26.1 4.8 2.7 5.5
703066 77.5 83.7 3.8 2.2 1.9
glucose 0.8 1.3 0.4 0.3 0.1
synephrine 0.0 0.0 0.3 0.3 0.4
238513 0.5 0.5 0.4 0.2 0.1
fructose 0.7 2.4 0.6 0.2 0.2
raffinose 0.7 0.3 0.2 0.1 0.1
703146 0.1 0.0 0.1 0.1 0.1
Fold difference
Heat map of selected leaf metabolites
Carrizo
US-802
US-812
US-897
US-942
Cleopatra
(Total = 650)
Metabolic profiling

A large number of primary metabolites were differentially regulated in susceptible rootstock seedlings in response to CLas.
Very few metabolites responded to infection in the most tolerant rootstock seedlings.
Many metabolites were differentially regulated in some of the tolerant varieties at the symptomatic disease stage.
→ Tolerance is not associated with the expression of large amounts of protective metabolites in response to infection.
→ It is unclear to what extent the disease symptoms are caused directly by the bacterium or by the plant defense response.
Metabolic profiling(Albrecht et al. 2016, Plant Physiol. Biochem)

Suggested mechanisms of tolerance to CLas
The compositions of sugars and amino acids that accumulate in response to infection are less suitable for pathogen survival.
Different concentrations of specific metabolites independent of infection that are harmful to CLas(Albrecht et al. 2016, Killiny and Hijaz 2016).
Other possible mechanisms: Ability to better regenerate phloem (Fan et al. 2013). Ability of plants to regenerate lost roots and limbs
more quickly.