Embed Size (px)
Citation preview
VS.
http://www.youtube.com/watch?v=vN2WzQzxuoA
Poverty and Affluencein the world
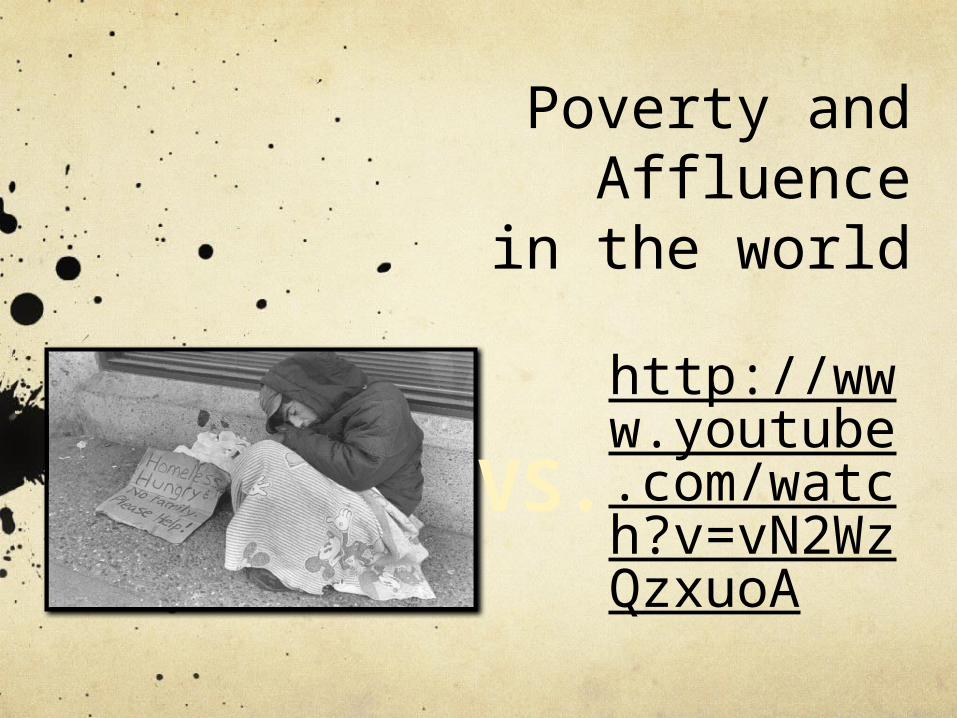
AFFLUENCE“The state of having much wealth or property”
Canada is recognized as a prosperous and affluent country based on the following:
Highly developed social welfare system that includes universal health-care
Strong human rights policies
Generous social benefits
Education is mandatory through age 15
literacy rate exceeds 97 percent.
highest 10 % of the population accounts for 23.8 % of all income
At the same time, the lowest 10 % makes only 2.8 %t of all income
The majority of Canadians make up the middle class.
Thus, while most Canadians may enjoy the nation’s prosperity, several groups continue to be excluded: Native people, immigrants, women and the disabled.
Poverty and Economic Inequality: Social Problems and
Causes of PovertyMany major social problems are a result of economic inequality – what do you think they are?
Examples:IlliteracyPoor educationLack of basic necessitiesHomelessnessMental Stress and IllnessCrime – ViolenceAddictions – Substance AbuseIsolationEnvironmental Issues
Affluencehttp://www.newgeography.com/content/003420-worlds-most-affluent-metropolitan-areas-2012
http://www.tnsglobal.com/press-release/biggest-ever-study-global-affluence-shows-80-worlds-wealthy-are-still-west
Poverty and Affluence in Developing Countries
Poverty
Impact of poverty around the world
Bangladesh http://www.cbc.ca/player/Shows/ID/2411701502/ 25 min Child Brides http://www.cbn.com/tv/1916820365001 5 min
Poverty
Poverty and Affluence in Developed countries
Gap Between Rich and Poor is Getting Biggerhttp://www.globalresearch.ca/gap-between-rich-and-poor-is-widening-the-us-poverty-report-and-obamas-economic-recovery/5304865
Gap Between Rich and Poor is Widening: The US Poverty Report and Obama’s “Economic Recovery”
By Andre Damon and Barry Grey
Global Research, September 16, 2012
World Socialist Web Site
The report revealed that the ranks of those classified by the government as poor remained at record highs in 2011, while the gap between rich and poor widened further.
Some 46.2 million people remained below the official poverty line in 2011, the highest number in more than half a century. The 15.0 percent poverty rate, essentially unchanged from 2010, was the highest since 1983.
The impact of poverty is particularly devastating for the young. One in five American children was poor in 2011. The poverty rate of young adults age 25-34 living with their parents, based on their own income alone, was 43.7 percent.
All of these figures grossly underestimate the real level of poverty, since the government’s poverty threshold, set at an annual income of $23,021 for a family of four, is absurdly low.
A major factor in the further fall in household income was a decline in wages. Average weekly wages for non-supervisory workers fell 0.3 percent after adjusting for inflation. The impact of the nationwide campaign of wage-cutting was reflected most clearly in a 17.3 percent jump in the number of workers in the lowest income group holding down full-time jobs.
The combined share of income declined for the middle and fourth quintiles of US households. It increased 1.6 percent for the highest quintile, and within that quintile, the share of aggregate income for the top 5 percent increased 4.9 percent. The top 1 percent of earners saw a 6 percent rise in income.
The second and third quintile of Americans now account for only 23.8 percent of the nation’s income, the lowest since the 1960s.
http://www.cbsnews.com/video/watch/?id=7358670n 13 min
Hard times generation: homeless kids
March 6, 2011
For some children, socializing and learning are being cruelly complicated by homelessness, as Scott Pelley reports from Florida, where school buses now stop at motels for children who've lost their homes.
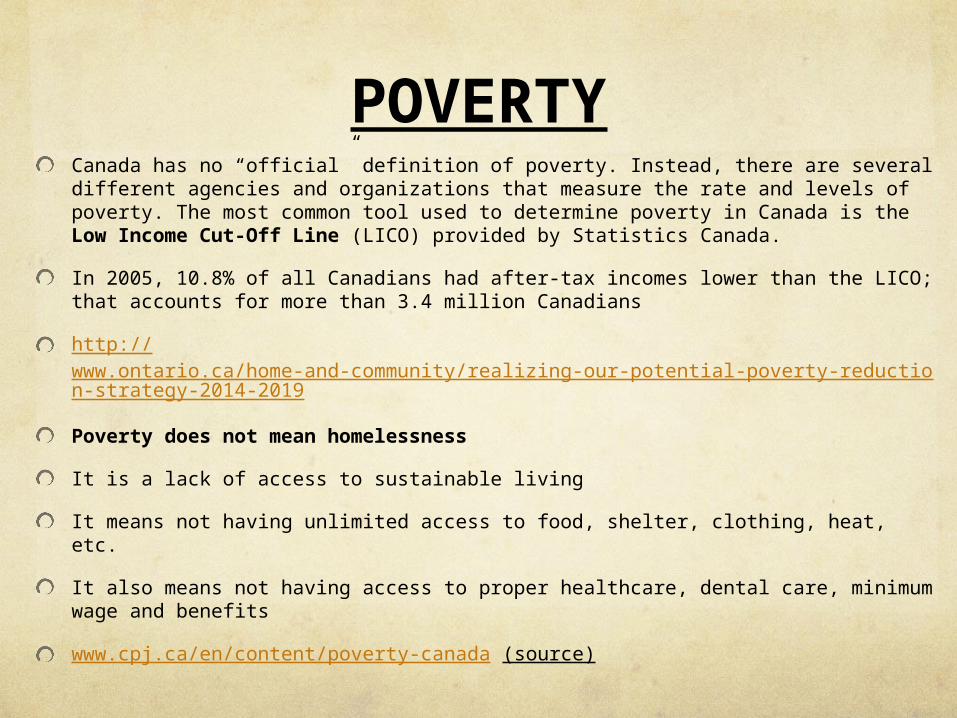
POVERTYCanada has no “official” definition of poverty. Instead, there are several different agencies and organizations that measure the rate and levels of poverty. The most common tool used to determine poverty in Canada is the Low Income Cut-Off Line (LICO) provided by Statistics Canada.
In 2005, 10.8% of all Canadians had after-tax incomes lower than the LICO; that accounts for more than 3.4 million Canadians
http://www.ontario.ca/home-and-community/realizing-our-potential-poverty-reduction-strategy-2014-2019
Poverty does not mean homelessness
It is a lack of access to sustainable living
It means not having unlimited access to food, shelter, clothing, heat, etc.
It also means not having access to proper healthcare, dental care, minimum wage and benefits
www.cpj.ca/en/content/poverty-canada (source)
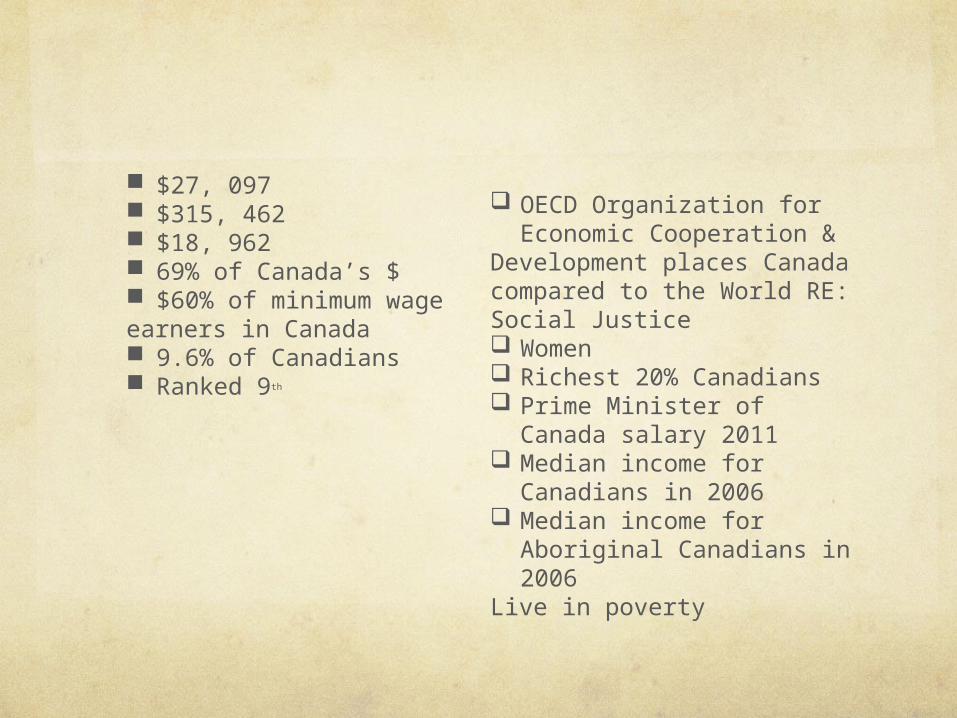
$27, 097 $315, 462 $18, 962 69% of Canada’s $ $60% of minimum wageearners in Canada 9.6% of Canadians Ranked 9th
OECD Organization for Economic Cooperation &
Development places Canada compared to the World RE: Social Justice Women Richest 20% Canadians Prime Minister of Canada
salary 2011 Median income for
Canadians in 2006 Median income for
Aboriginal Canadians in 2006
Live in poverty
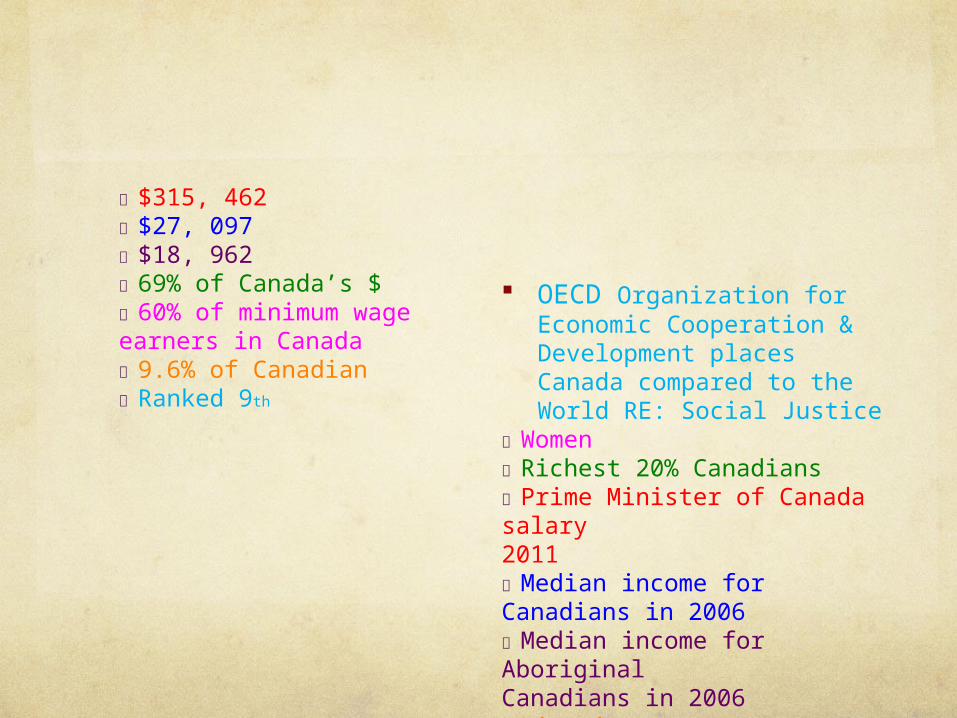
$315, 462 $27, 097 $18, 962 69% of Canada’s $ 60% of minimum wageearners in Canada 9.6% of Canadian Ranked 9th
OECD Organization for Economic Cooperation & Development places Canada compared to the World RE: Social Justice
Women Richest 20% Canadians Prime Minister of Canada salary2011 Median income for Canadians in 2006 Median income for AboriginalCanadians in 2006 Live in poverty
Gap Between Rich and Poor is Getting BiggerThanksgiving news http://www.ctvnews.ca/canada/winnipeg-shelter-serves-record-breaking-1-125-thanksgiving-meals-1.1497132
Barrie Food Bank http://www.barriefoodbank.org/news
Is there poverty in Canada?
http://www12.statcan.gc.ca/nhs-enm/2011/dp-pd/prof/index.cfm?Lang=E
Income analysis http://www12.statcan.gc.ca/nhs-enm/2011/as-sa/99-014-x/99-014-x2011001-eng.cfm#a1
Review summary http://www4.hrsdc.gc.ca/[email protected]?iid=23
Review and analyze the information found on the mentioned government sites. You can also do additional research. Is there poverty in Canada? Why or why not, please support your opinion? If there is, what are the caused of poverty in Canada? Is the whole society responsible for it? What can we or should we do to address this issue. If not, explain what should people of low income do to change their situation. Can they do it alone? Should the whole society be involved?
TermsTerms and Theories
Absolute vs. Relative Poverty
Absolute Poverty - a lack of basic necessities for survival (e.g. Starvation)
Relative Poverty - survival, but far below the general living standards of the society or social group in which they are living
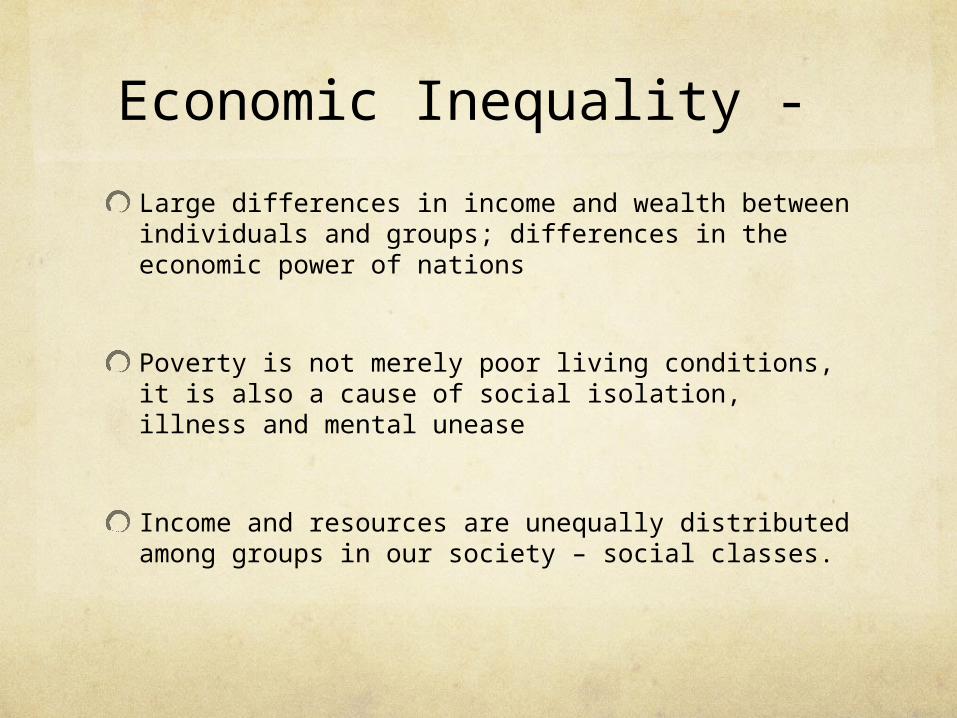
Economic Inequality -
Large differences in income and wealth between individuals and groups; differences in the economic power of nations
Poverty is not merely poor living conditions, it is also a cause of social isolation, illness and mental unease
Income and resources are unequally distributed among groups in our society – social classes.
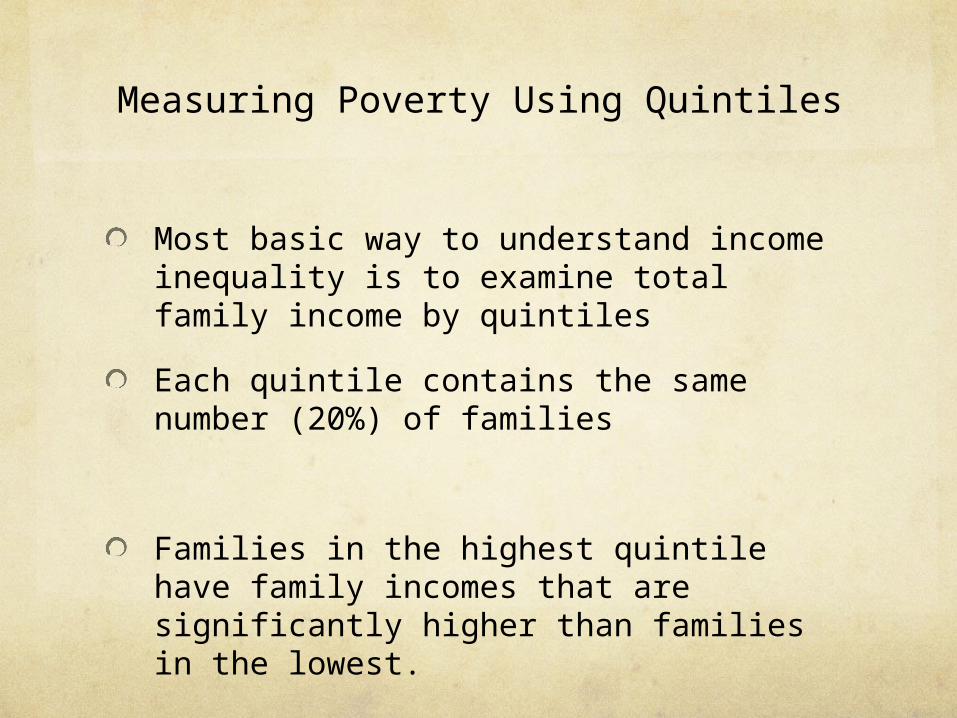
Measuring Poverty Using Quintiles
Most basic way to understand income inequality is to examine total family income by quintiles
Each quintile contains the same number (20%) of families
Families in the highest quintile have family incomes that are significantly higher than families in the lowest.
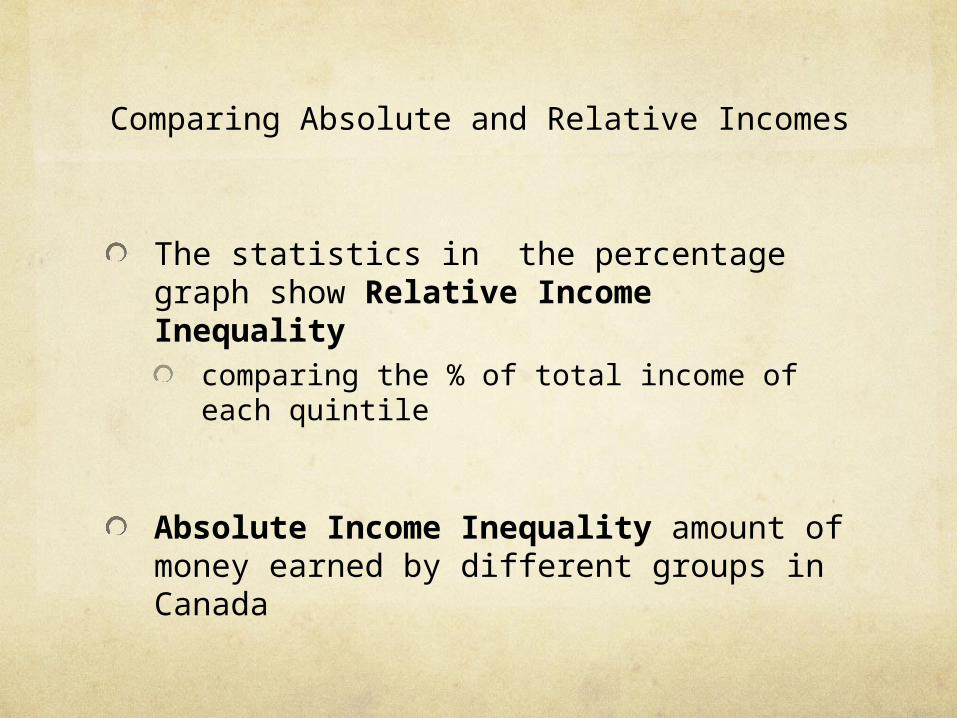
Comparing Absolute and Relative Incomes
The statistics in the percentage graph show Relative Income Inequality
comparing the % of total income of each quintile
Absolute Income Inequality amount of money earned by different groups in Canada
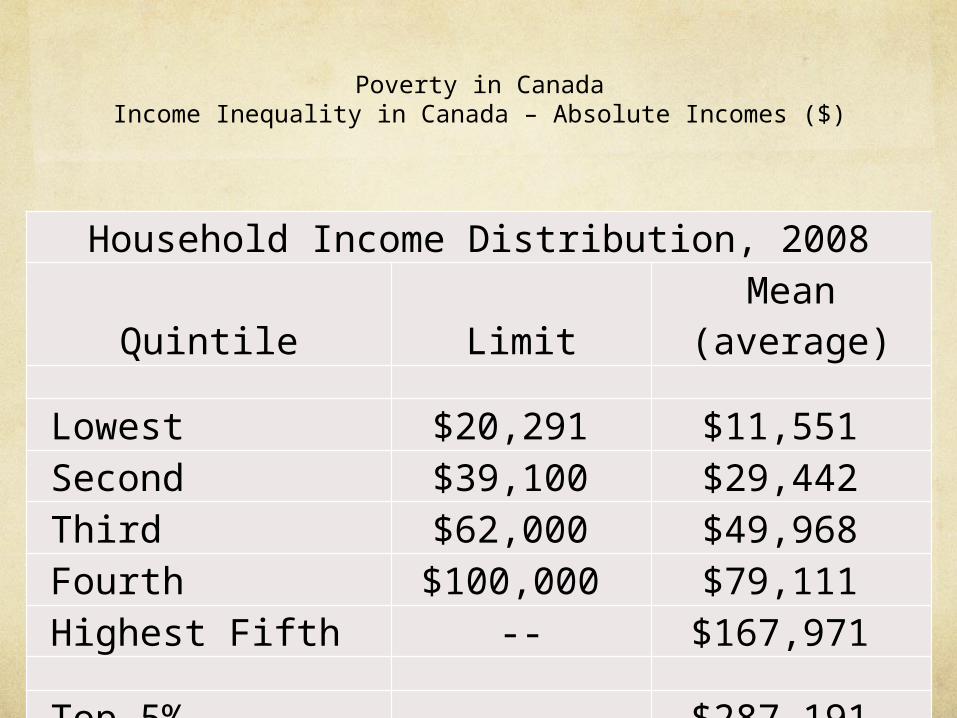
Poverty in CanadaIncome Inequality in Canada – Absolute Incomes ($)
Household Income Distribution, 2008
Quintile LimitMean
(average)
Lowest $20,291 $11,551 Second $39,100 $29,442 Third $62,000 $49,968 Fourth $100,000 $79,111 Highest Fifth -- $167,971
Top 5% $287,191
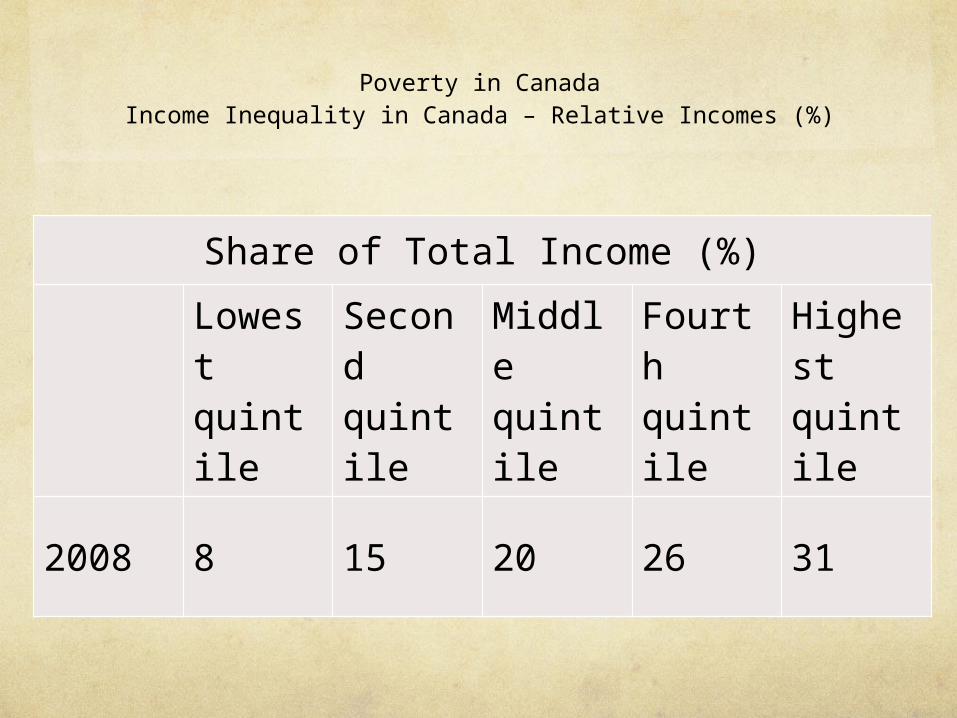
Poverty in CanadaIncome Inequality in Canada – Relative Incomes (%)
Share of Total Income (%)
Lowest quintile
Second quintile
Middle quintile
Fourth quintile
Highest quintile
2008 8 15 20 26 31
Measures of Poverty
Statistics Canada determines every year what it calls the (LICO) Low Income Cut Off Line aka poverty line
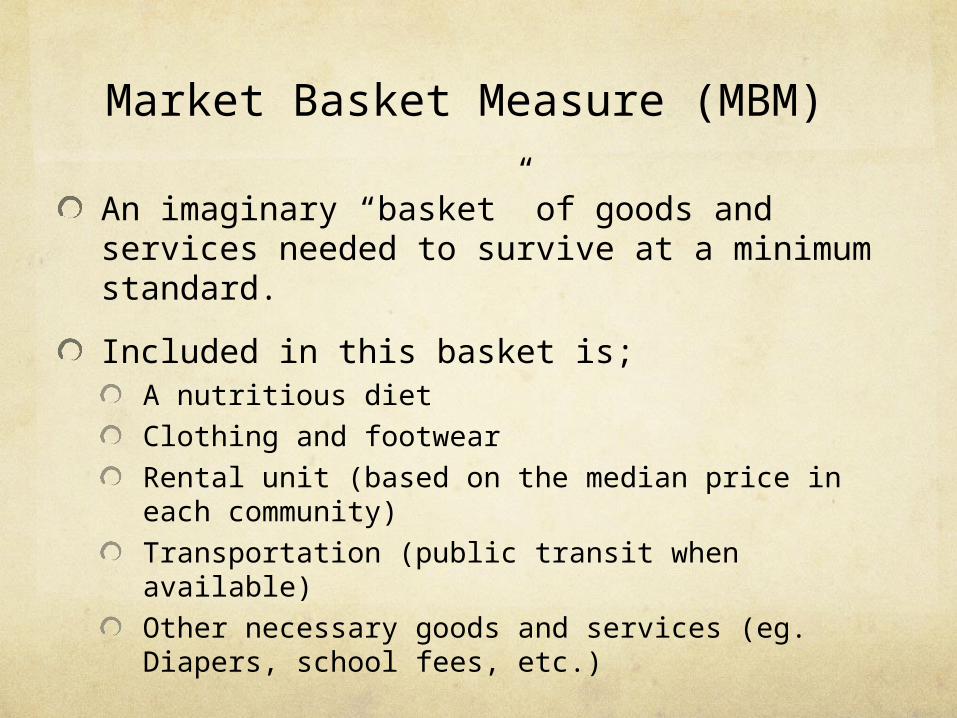
Market Basket Measure (MBM)
An imaginary “basket” of goods and services needed to survive at a minimum standard.
Included in this basket is;A nutritious dietClothing and footwearRental unit (based on the median price in each community)Transportation (public transit when available)Other necessary goods and services (eg. Diapers, school fees, etc.)
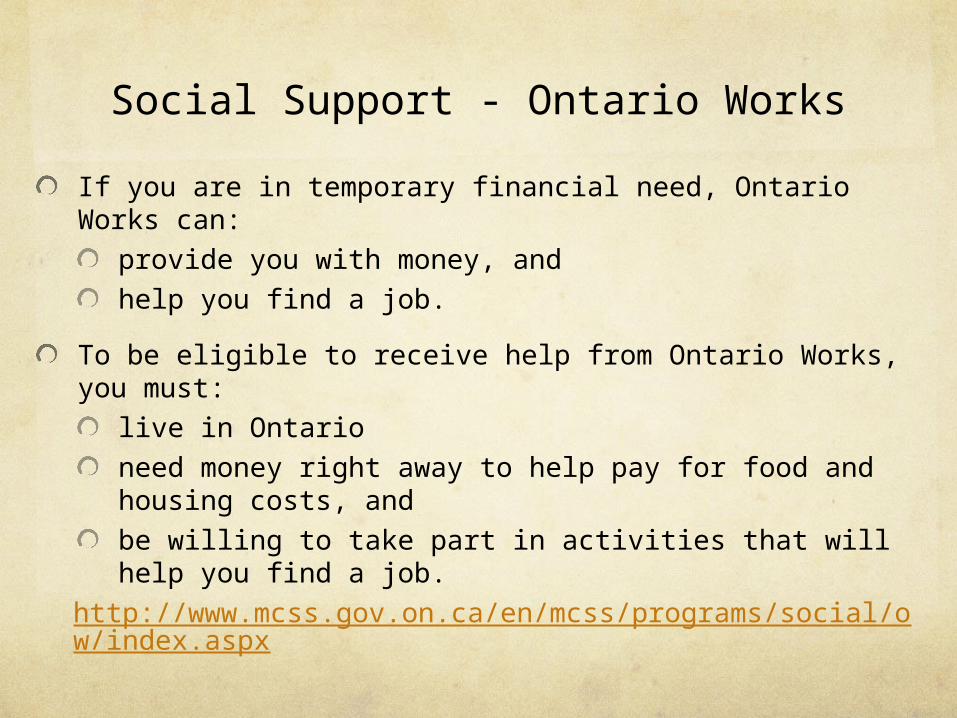
Social Support - Ontario Works
If you are in temporary financial need, Ontario Works can:
provide you with money, and help you find a job.
To be eligible to receive help from Ontario Works, you must:
live in Ontario need money right away to help pay for food and housing costs, and be willing to take part in activities that will help you find a job.
http://www.mcss.gov.on.ca/en/mcss/programs/social/ow/index.aspx
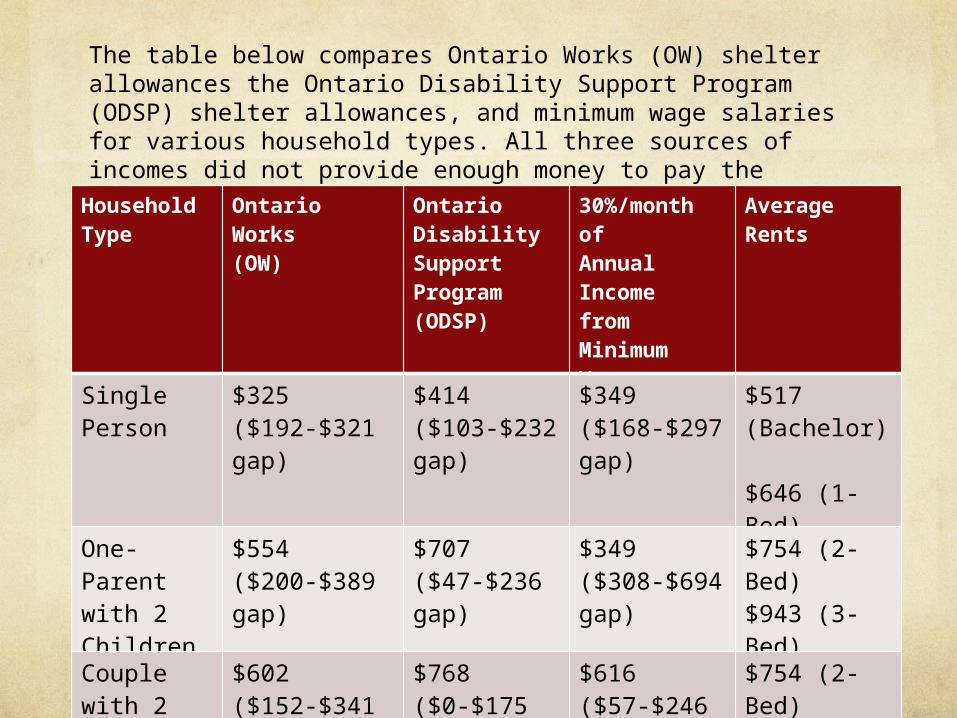
The table below compares Ontario Works (OW) shelter allowances the Ontario Disability Support Program (ODSP) shelter allowances, and minimum wage salaries for various household types. All three sources of incomes did not provide enough money to pay the average rent for an appropriate unit.HouseholdType
Ontario Works(OW)
OntarioDisabilitySupportProgram(ODSP)
30%/month ofAnnual Incomefrom MinimumWage
Average Rents
Single Person
$325($192-$321 gap)
$414($103-$232 gap)
$349($168-$297 gap)
$517 (Bachelor)
$646 (1-Bed)
One-Parentwith 2Children
$554($200-$389 gap)
$707($47-$236 gap)
$349($308-$694 gap)
$754 (2-Bed)$943 (3-Bed)
Couple with 2Children
$602($152-$341 gap)
$768($0-$175 gap)
$616($57-$246 gap)
$754 (2-Bed)$943 (3-Bed)
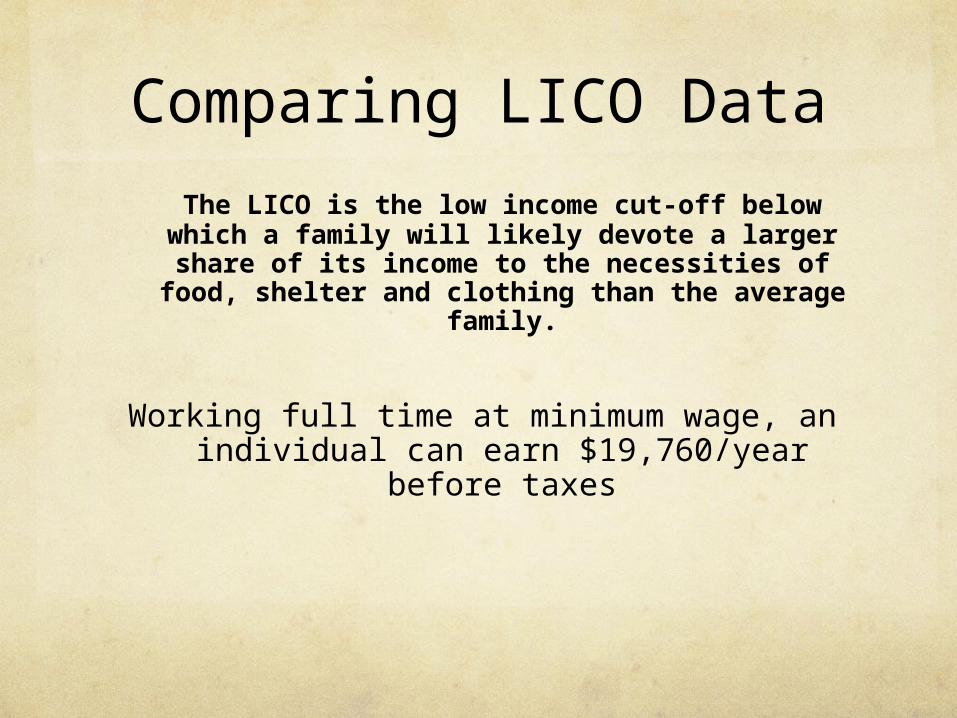
Comparing LICO Data
The LICO is the low income cut-off below which a family will likely devote a larger
share of its income to the necessities of food, shelter and clothing than the average family.
Working full time at minimum wage, an individual can earn $19,760/year before
taxes
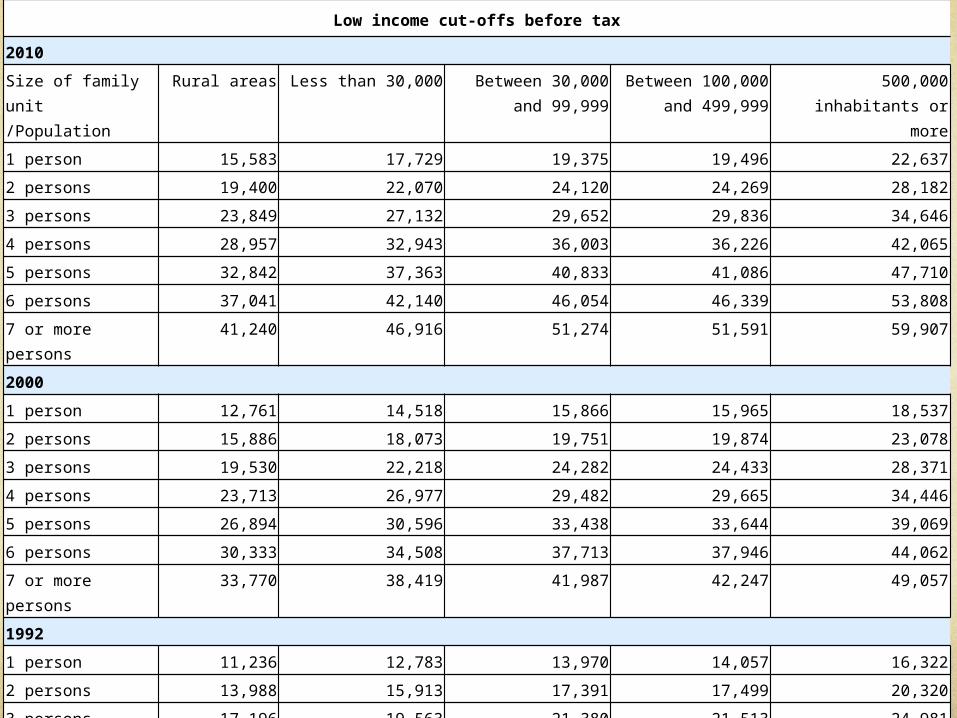
Low income cut-offs before tax
2010
Size of family unit/Population
Rural areas Less than 30,000 Between 30,000 and 99,999
Between 100,000 and 499,999
500,000 inhabitants or more
1 person 15,583 17,729 19,375 19,496 22,637
2 persons 19,400 22,070 24,120 24,269 28,182
3 persons 23,849 27,132 29,652 29,836 34,646
4 persons 28,957 32,943 36,003 36,226 42,065
5 persons 32,842 37,363 40,833 41,086 47,710
6 persons 37,041 42,140 46,054 46,339 53,808
7 or more persons 41,240 46,916 51,274 51,591 59,907
2000
1 person 12,761 14,518 15,866 15,965 18,537
2 persons 15,886 18,073 19,751 19,874 23,078
3 persons 19,530 22,218 24,282 24,433 28,371
4 persons 23,713 26,977 29,482 29,665 34,446
5 persons 26,894 30,596 33,438 33,644 39,069
6 persons 30,333 34,508 37,713 37,946 44,062
7 or more persons 33,770 38,419 41,987 42,247 49,057
1992
1 person 11,236 12,783 13,970 14,057 16,322
2 persons 13,988 15,913 17,391 17,499 20,320
3 persons 17,196 19,563 21,380 21,513 24,981
4 persons 20,879 23,753 25,959 26,120 30,330
5 persons 23,680 26,940 29,442 29,624 34,400
6 persons 26,708 30,384 33,206 33,412 38,797
7 or more persons 29,735 33,828 36,970 37,199 43,195
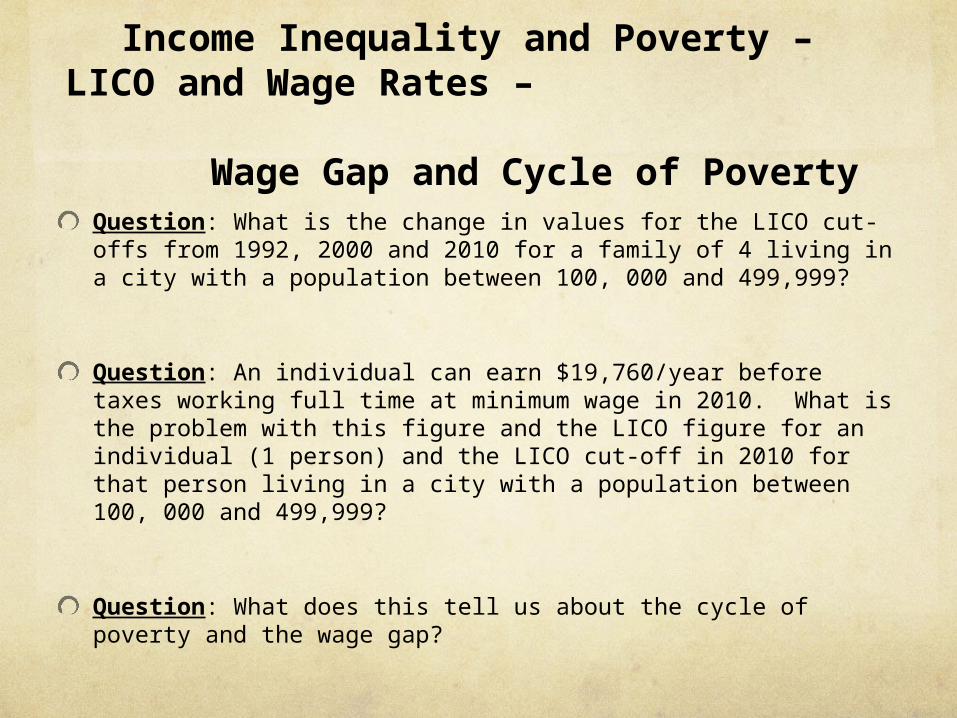
Income Inequality and Poverty – LICO and Wage Rates – Wage Gap and Cycle
of PovertyQuestion: What is the change in values for the LICO cut-offs from 1992, 2000 and 2010 for a family of 4 living in a city with a population between 100, 000 and 499,999?
Question: An individual can earn $19,760/year before taxes working full time at minimum wage in 2010. What is the problem with this figure and the LICO figure for an individual (1 person) and the LICO cut-off in 2010 for that person living in a city with a population between 100, 000 and 499,999?
Question: What does this tell us about the cycle of poverty and the wage gap?
Generational and Situational Poverty
Generational means a person has been that way for two generations or more.
Situational poverty is when there is a death, a divorce, or an illness, and resources are temporarily reduced. Example: college days, or the first few years of teaching.
Social Stratification – Development of Social Classes
Social Stratification
Most societies have systems of social stratification
Social stratification is a system of inequality that ranks people on a hierarchy
These could be based on race, class, gender, ethnicity, age, religion and so on
Stratified societies are not equitable – people’s experiences and opportunities are defined by the social categories they belong to
Social Stratification Systems
Closed systemsBoundaries are rigid, very little change to social position – people have set or ascribed status
Examples caste system in India or slavery
Open systemsMore flexible and people may move based on achieved status
Social mobility (movement) can occur either inter or intra generationally – inter meaning by family members of the next generation or intra - in ones own lifetime
Example class system in Canada (DeCoeur, Rawes & Warecki, 2012) ~
SlaveryOriginated with the onset of the agricultural era
Specialization of tasks increases divisions and inequalities between labourers and employees
People were or are enslaved… to pay off debts, as punishment for a crime, as prisoners of war, born into slavery, or stolen during the slave trade
During the Atlantic slave trade, Africans were captured and sold to European traders and then shipped to North and South America – forced to labour in mines, on plantations, in rice and sugar fields or as house servants.
Became based on race with black people being subservient to whites. Slavery ends in the US in 1865 but the legacy continues to impact relationships between whites and blacks in North America
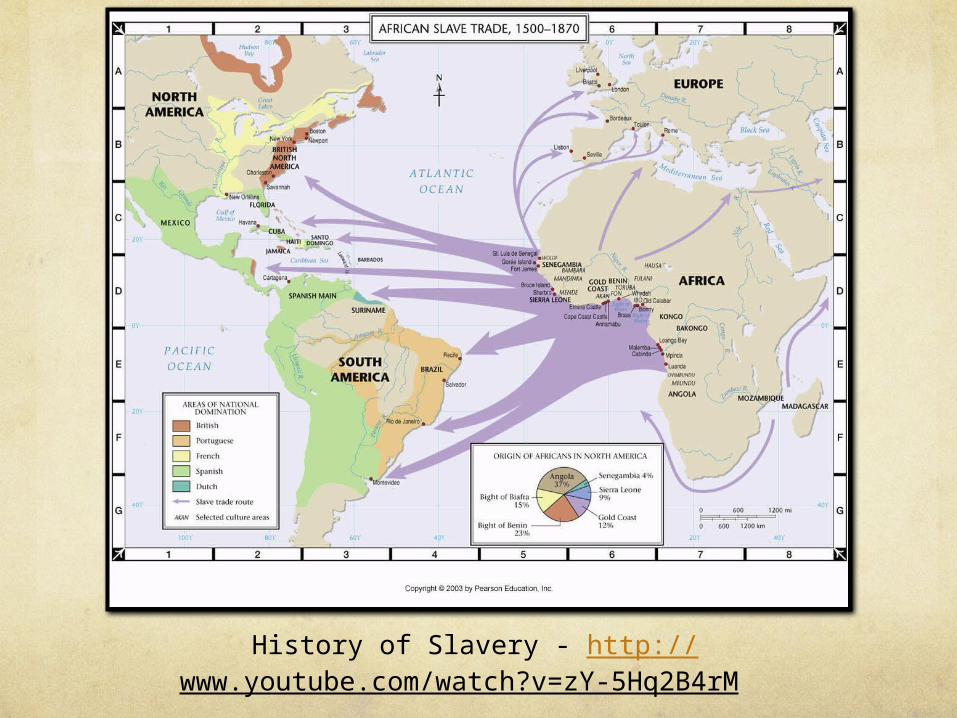
History of Slavery - http://www.youtube.com/watch?v=zY-5Hq2B4rM
Modern Day SlaverySlavery exists today, known as human trafficking, bonded labour, or sex trafficking and it is present world wide with an estimated 12 to 27 million people affected despite laws prohibiting it
Nearly ¾ of these are women and ½ are children
Most are poverty stricken and mislead; some are kidnapped
In a global economy based on trade, even people are considered a commodity for sale
Global Human Trafficking – 12 min http://www.ted.com/talks/sunitha_krishnan_tedindia.html
Human Trafficking in Kitchener- Waterloo-Cambridge Region: http://metronews.ca/news/kitchener/381176/human-traffickers-operating-in-waterloo-region-group-warns/
http://www.therecord.com/news/article/743750--highway-401-a-magnet-for-human-trafficking-police-say
Caste System
This closed system is based on stratification that a person is born into
Stratifications affect a person’s work, marriage, social life, and belief systems
Caste systems exist(ed) in India and South Africa (Apartheid- racial segregation practiced in South Africa), and while both of these are working on breaking these systems, they still impact these cultures and people
People are generally required to marry within their caste
People are often segregated in different neighbourhoods based on caste – contact with a lower caste could pollute you
http://www.youtube.com/watch?v=CTC51EZbtf8
Caste System in India
Class System
In a class system the stratification is based on ownership and control of resources and type of work a person does
Boundaries are more vaguely defined
People can move up or down based on education, skills and achievements
Horizontal mobility is when you get a promotion or demotion
but it essentially doesn’t change what class you are in
Vertical mobility is when people you move up or down the class structure (DeCoeur, Rawes & Warecki, 2012)
Social ClassThere are four general social classes – groups divided into wealth and resources - in Canada:
The Upper Class3 to 5% of Canadians Wealth is inheritedChildren go to private schools Exercise great power in business and government positions
Upper-Upper Class One percent belongs to an upper-upper class distinguished primarily by "old money.”
Lower-Upper Class The remaining 2-4% fall into the lower-upper class and depend more on earnings than inherited wealth. They are, for the most part, the "nouveau riche."
Social class
The Middle Class40-50% of the Canadian population Because of its size it has tremendous influence on patterns of North American cultureConsiderable racial and ethnic diversity in this class The top half of this category is termed the "upper-middle" class with family incomes of $50,000 to $100,000 earned from upper managerial or professional fields The rest of the middle class (average middles) typically work in less prestigious white-collar occupations or highly skilled blue-collar jobs
Social Class
The Working Class This class comprises about one-third of the population and has lower incomes than the middle-class and virtually no accumulated wealth. Their jobs provide less personal satisfaction.
Social ClassThe Lower Class
The remaining 20% of our population is identified as the lower class.
In 2001 roughly 15% of the Canadian population were labeled as poor.
Many are supported entirely by welfare payments while others are among the "working poor" whose incomes are insufficient to cover necessities like food, shelter, and clothing.
They typically live in less desirable neighbourhoods — often racially or ethnically distinct — and their children are often resigned to living the same hopeless lives of their parents.
Recent government cut-backs on welfare in some provinces may lead to even greater living constraints for this group of people.
Poverty and Affluence – Theory Application
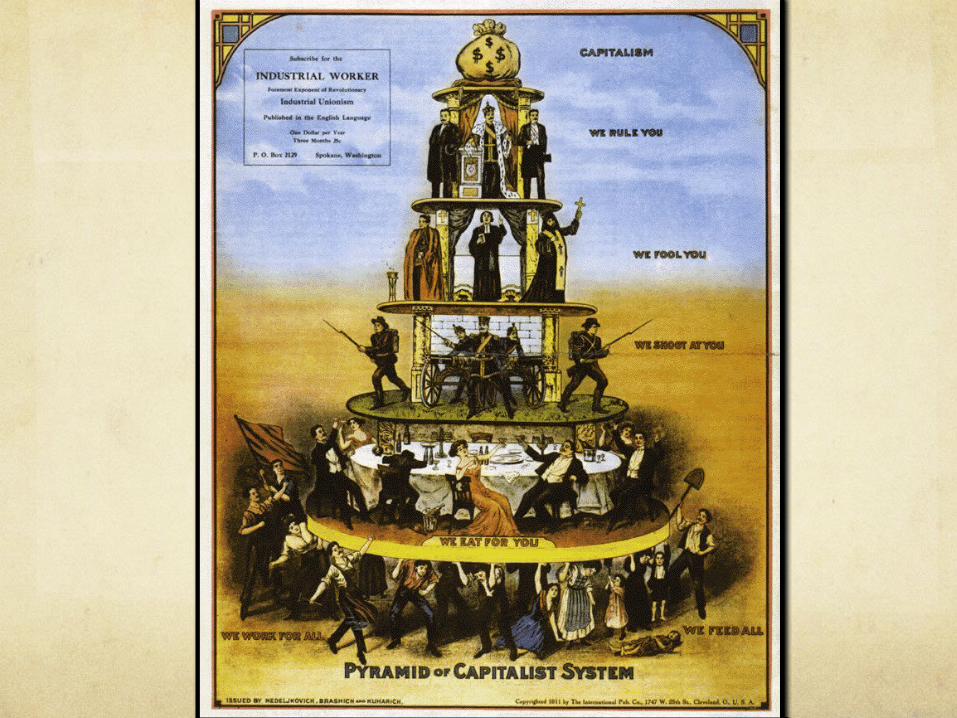
Marx & Weber - Conflict Theory
Conflict Theory holds that inequality is bad, avoidable and unnecessary
A struggle for resources or a share of the pie causes conflict between social groups
Marx… Capitalism is an economic system which favours the rich class who exploit the poor class
Weber…In addition to class – he adds status and power to the mix and essentially states that class, status and power create inequalities
Class refers to money
Status refers to prestige or lifestyle (level of education)
Some jobs are highly revered but not necessarily highly paid such as firefighters or nurses
Power refers to the ability to exercise one’s will over others
How the Conflict Theory Can Apply to Poverty vs. Affluence
in CrimeIt is not clear that poverty truly is the main contributor to crime rates. However, one might make the following argument to say that most crimes are, at least to some extent, caused by poverty.
One could argue, for example, that poverty puts a great deal of stress on people. They often lack material things that they need or want. They might also feel the pressure of being poor in a society that values material possessions and wealth. Both of these might lead to crime.
The desire for material goods might well lead to property crimes. People might steal in order to get money to buy the things they want or need. Or they might simply steal those things directly.
The pressure of feeling like a failure might also lead to crime. It might lead to drinking or drug use, both of which might lead to violent crime. It might lead to feelings of anger which might manifest themselves in the abuse of family members. It might also lead people to join gangs in an attempt to feel valued.
None of this is to say that poverty directly causes crime. However, it is likely that these kinds of pressures make the poor more likely to commit crimes.
Functionalist TheoryInequality is inevitable, necessary & even positive
We are all part of a bigger picture and we all play a role in it
All societies have important tasks that must be accomplished
Some positions are more important than others for our survival and should be filled by the most qualified people
The most talented, trained individuals should be the most rewarded
The most highly rewarded positions should be those many rely on for expertise
So essentially in order to make sure society functions and all needs are met, it is important to reward people appropriately to keep the whole thing running smoothly
Symbolic Interactionism Theory
People make their own interpretations or meanings based on their experiences and interactions with others
We understand things based on what our interactions have taught us (process of socialization where we come to understand what is expected of us so that we will succeed)
People are socialized to accept a stratified structured society and see power as something that is relative and can be negotiated between different people
They understand that they are part of a system and accept their role or expectations that others have for or from them