Embed Size (px)
Citation preview
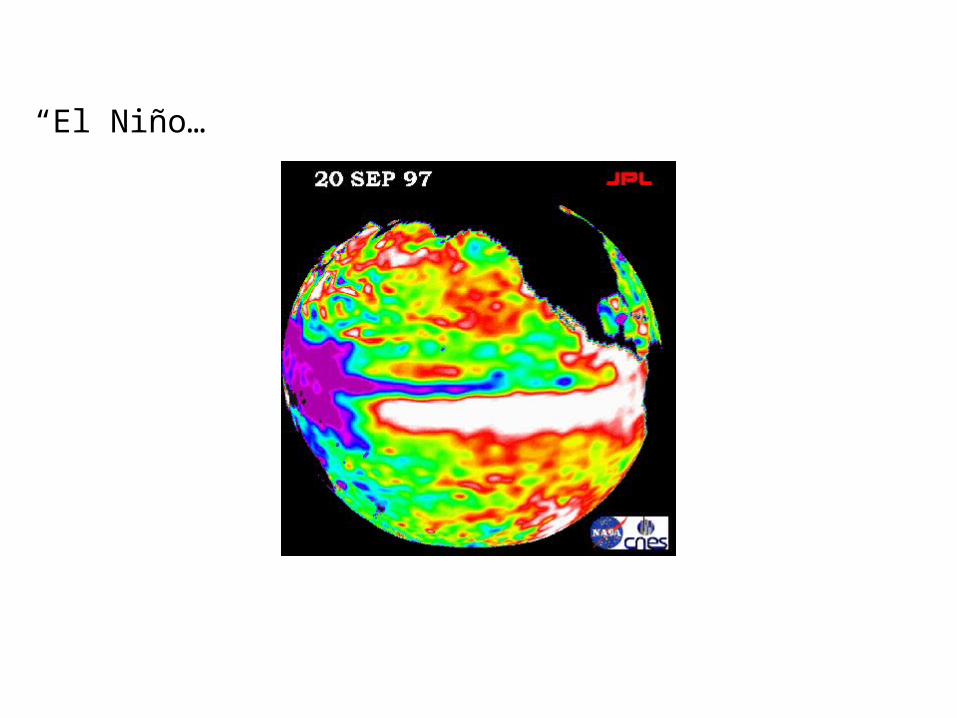
el Niño
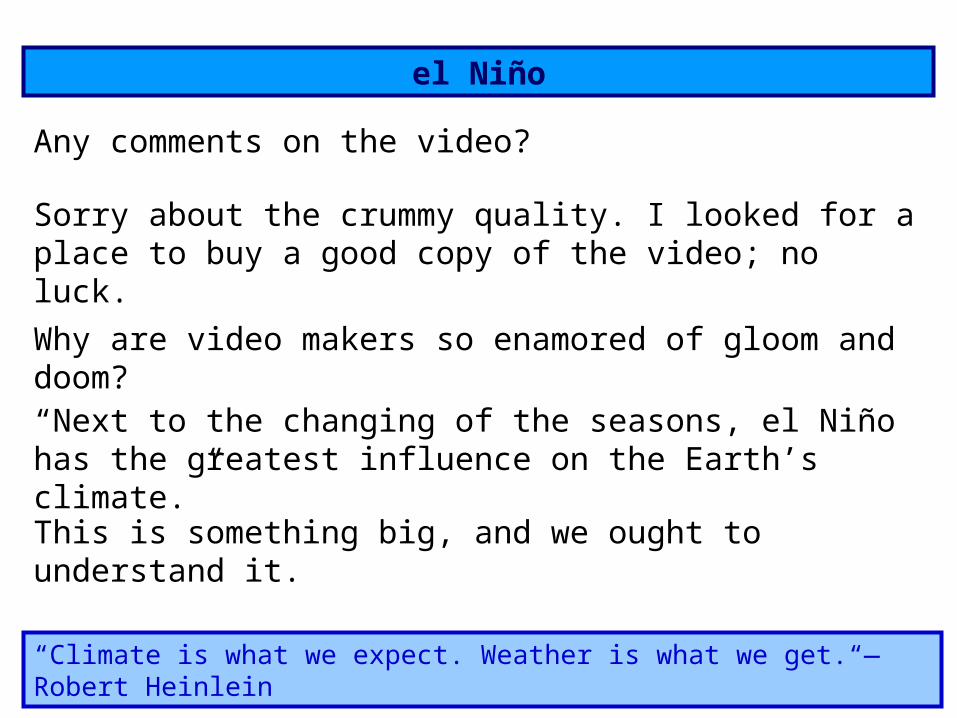
Any comments on the video?
Why are video makers so enamored of gloom and doom?“Next to the changing of the seasons, el Niño has the greatest influence on the Earth’s climate.”
Sorry about the crummy quality. I looked for a place to buy a good copy of the video; no luck.
This is something big, and we ought to understand it.
“Climate is what we expect. Weather is what we get.“—Robert Heinlein
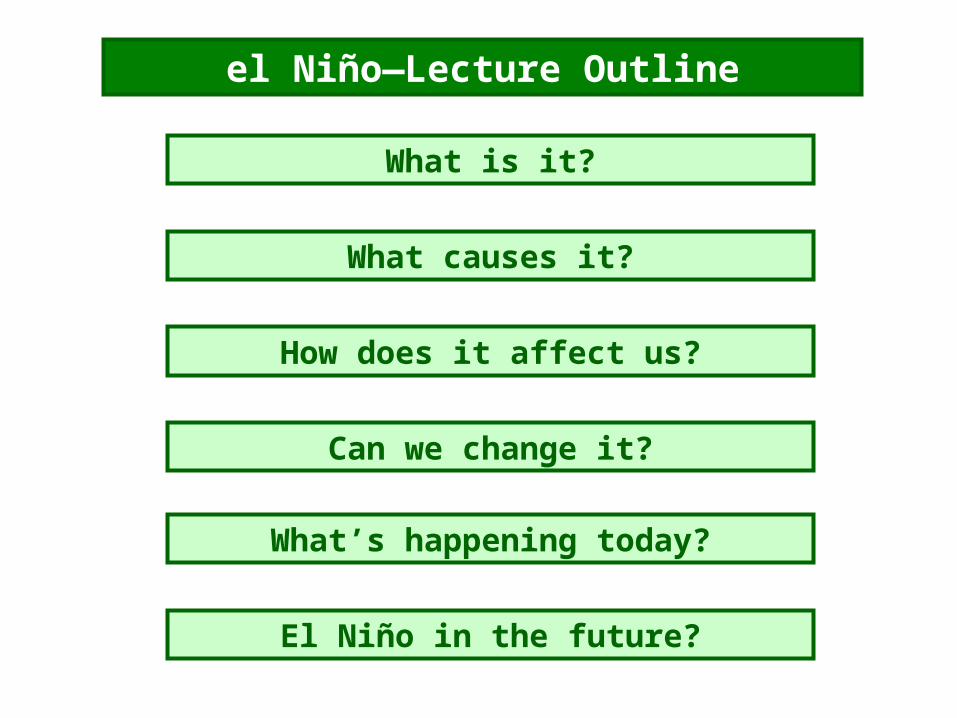
el Niño—Lecture Outline
What causes it?
What is it?
How does it affect us?
Can we change it?
El Niño in the future?
What’s happening today?
el Niño—what is it?
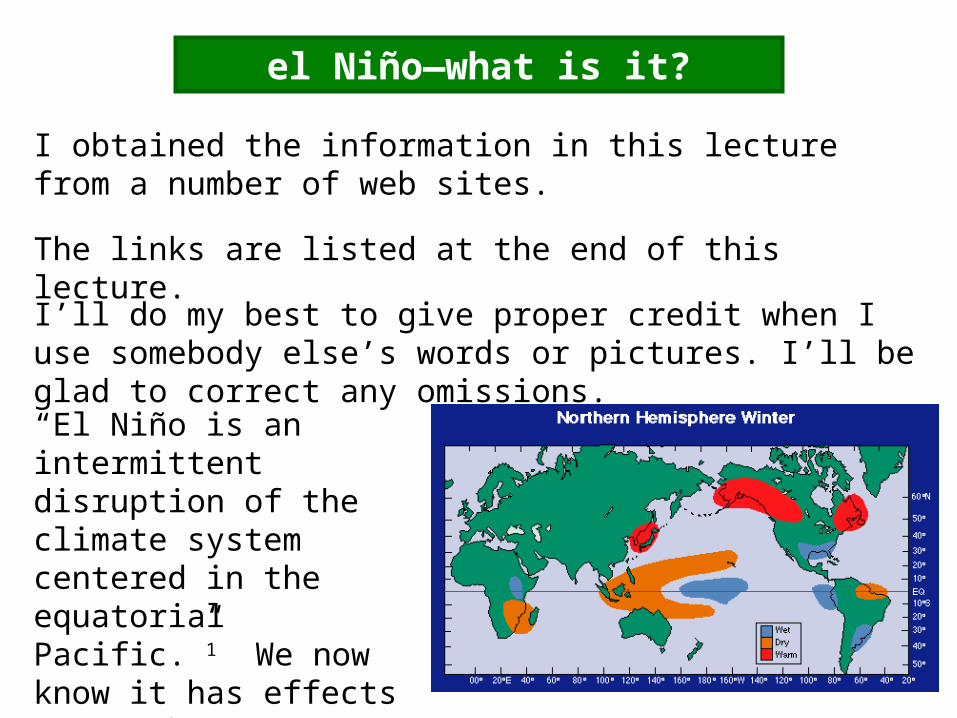
I obtained the information in this lecture from a number of web sites.
“El Niño is an intermittent disruption of the climate system centered in the equatorial Pacific.”1 We now know it has effects on weather across much of the world. maybe skip to slide 9.
The links are listed at the end of this lecture.
I’ll do my best to give proper credit when I use somebody else’s words or pictures. I’ll be glad to correct any omissions.
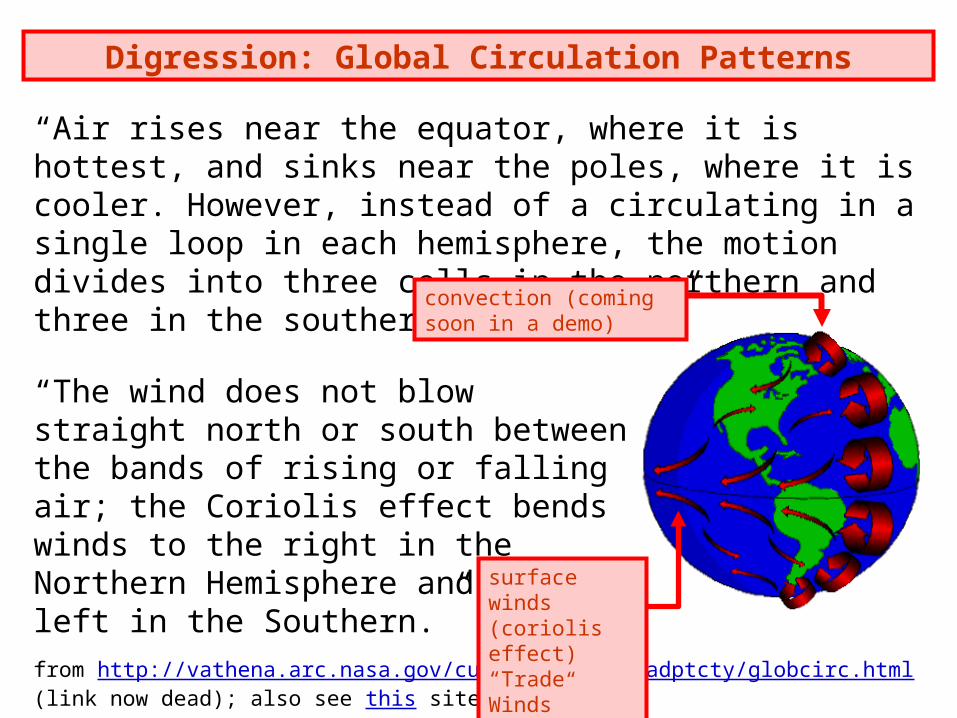
“Air rises near the equator, where it is hottest, and sinks near the poles, where it is cooler. However, instead of a circulating in a single loop in each hemisphere, the motion divides into three cells in the northern and three in the southern hemisphere.”
“The wind does not blow straight north or south between the bands of rising or falling air; the Coriolis effect bends winds to the right in the Northern Hemisphere and to the left in the Southern.”
from http://vathena.arc.nasa.gov/curric/weather/adptcty/globcirc.html (link now dead); also see this site
Digression: Global Circulation Patterns
convection (coming soon in a demo)
surface winds (coriolis effect)“Trade Winds”
Digression: Coriolis “Force”
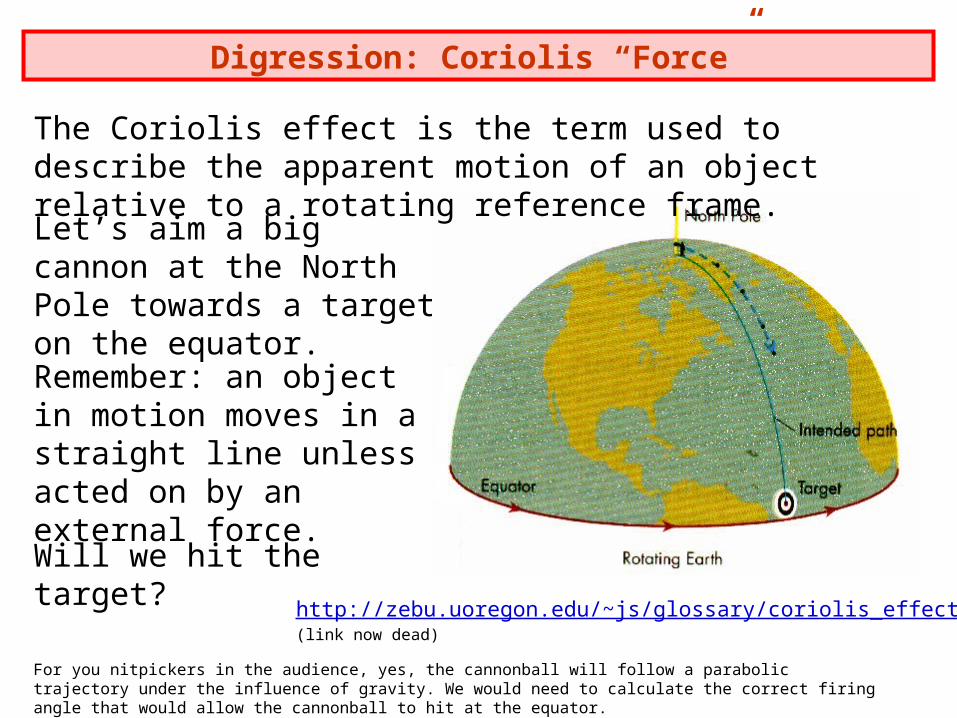
Let’s aim a big cannon at the North Pole towards a target on the equator.Remember: an object in motion moves in a straight line unless acted on by an external force.
Will we hit the target?
http://zebu.uoregon.edu/~js/glossary/coriolis_effect.html (link now dead)
The Coriolis effect is the term used to describe the apparent motion of an object relative to a rotating reference frame.
For you nitpickers in the audience, yes, the cannonball will follow a parabolic trajectory under the influence of gravity. We would need to calculate the correct firing angle that would allow the cannonball to hit at the equator.
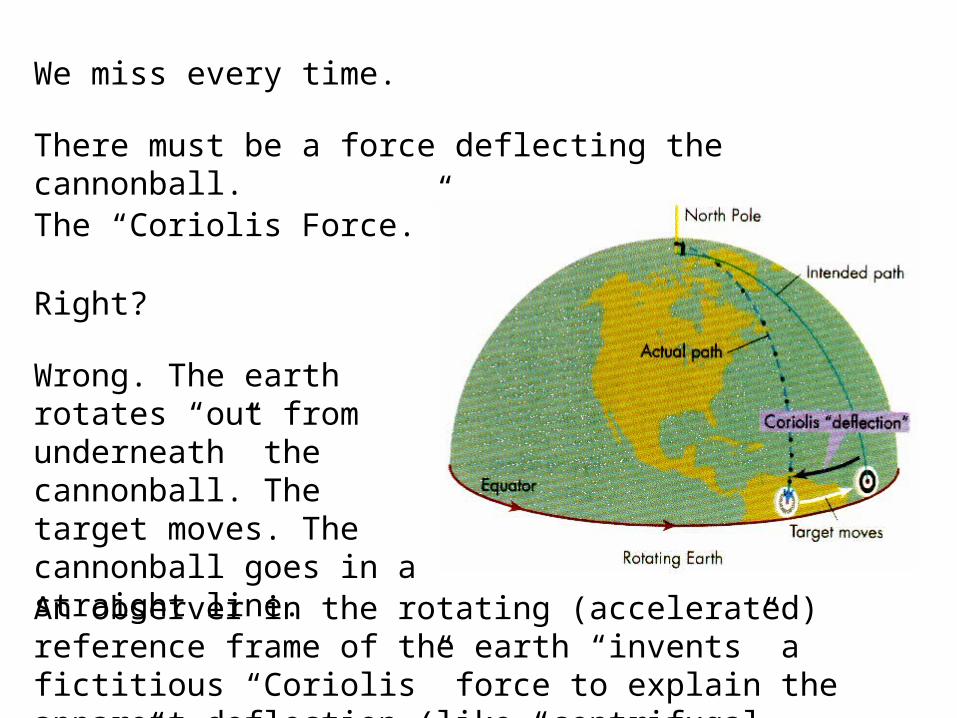
We miss every time.
There must be a force deflecting the cannonball.
The “Coriolis Force.”
Right?
Wrong. The earth rotates “out from underneath” the cannonball. The target moves. The cannonball goes in a straight line.An observer in the rotating (accelerated) reference frame of the earth “invents” a fictitious “Coriolis” force to explain the apparent deflection (like “centrifugal force”).
More technical “stuff” on the Coriolis effect (broken link,
2012).
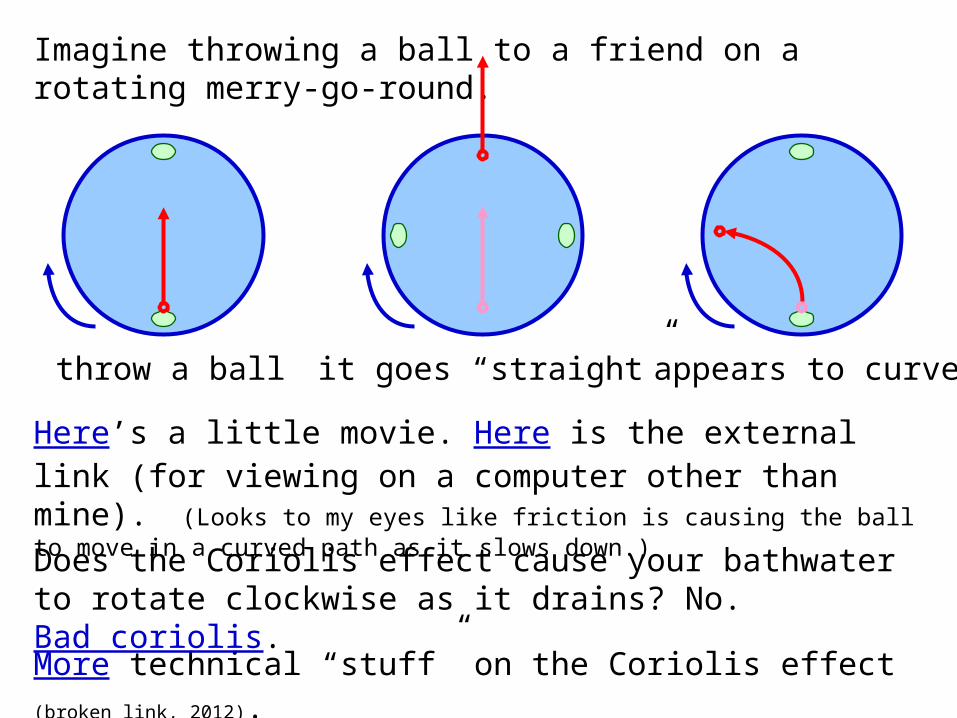
Imagine throwing a ball to a friend on a rotating merry-go-round.
throw a ball it goes “straight” appears to curve
Does the Coriolis effect cause your bathwater to rotate clockwise as it drains? No. Bad coriolis.
Here’s a little movie. Here is the external link (for viewing on a computer other than mine). (Looks to my eyes like friction is causing the ball to move in a curved path as it slows down.)
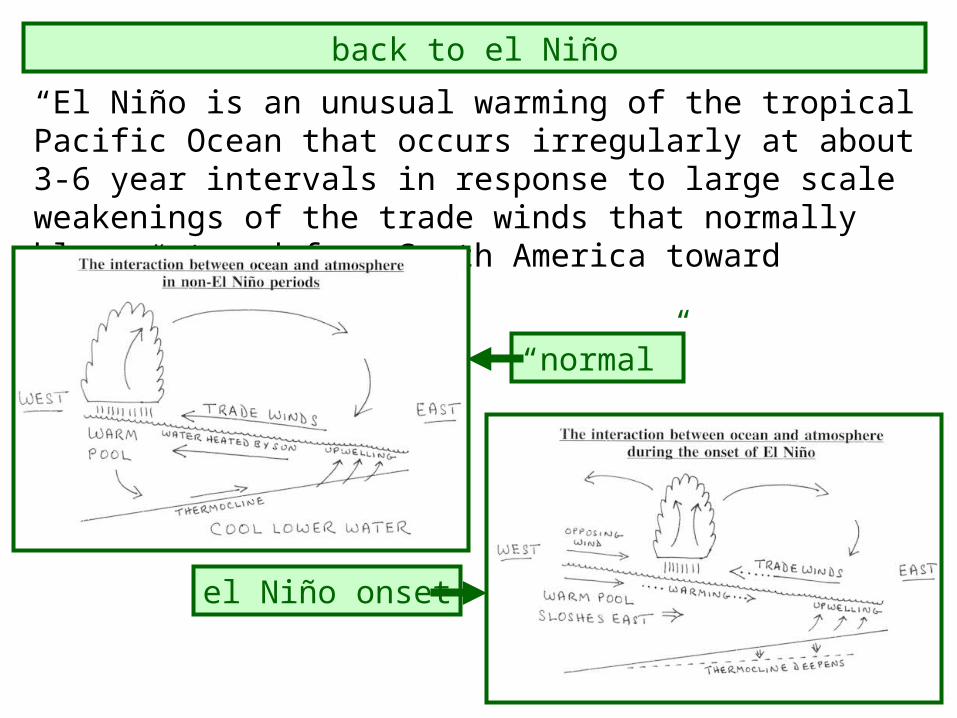
“El Niño is an unusual warming of the tropical Pacific Ocean that occurs irregularly at about 3-6 year intervals in response to large scale weakenings of the trade winds that normally blow westward from South America toward Asia.”2
el Niño onset
“normal”
back to el Niño
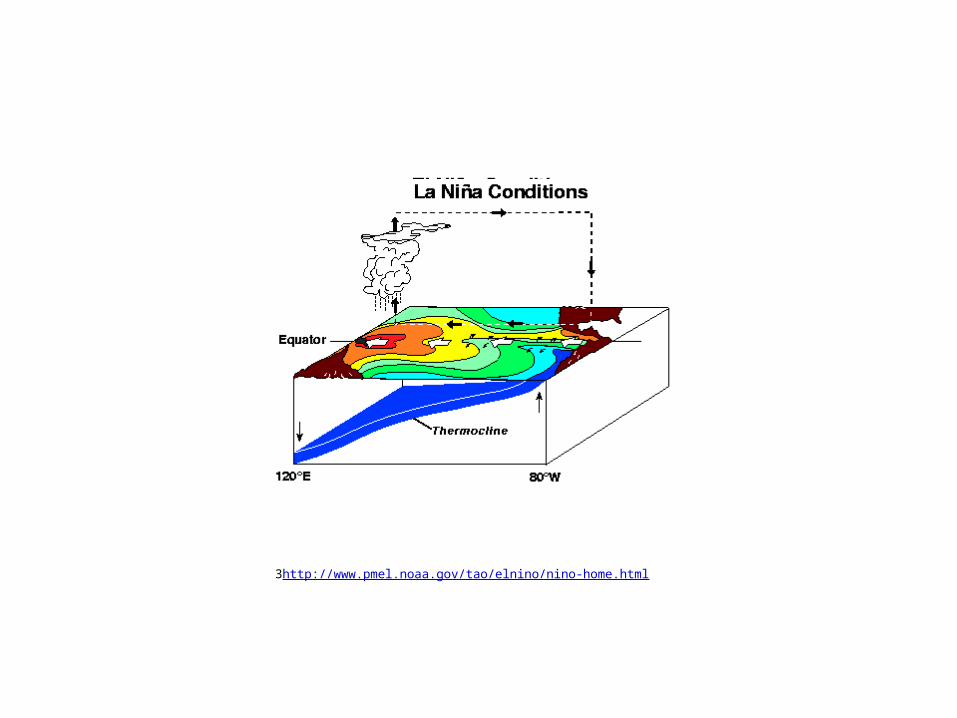
3http://www.pmel.noaa.gov/tao/elnino/nino-home.html
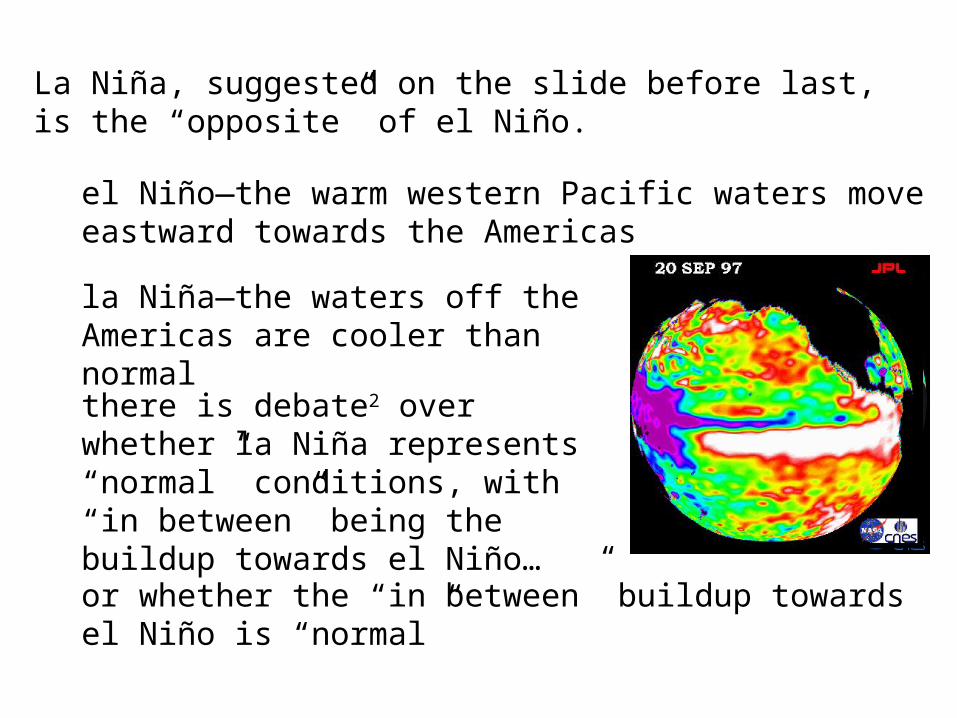
La Niña, suggested on the slide before last, is the “opposite” of el Niño.
el Niño—the warm western Pacific waters move eastward towards the Americas
la Niña—the waters off the Americas are cooler than normal
there is debate2 over whether la Niña represents “normal” conditions, with “in between” being the buildup towards el Niño…or whether the “in between” buildup towards el Niño is “normal”
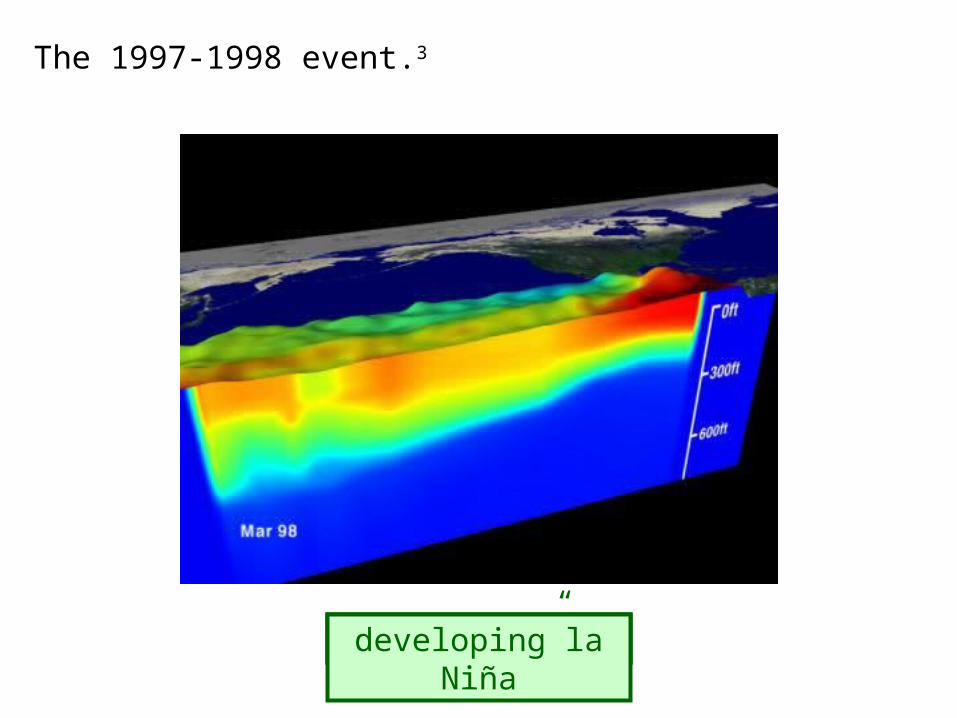
The 1997-1998 event.3
“normal”el Niñodeveloping la Niña
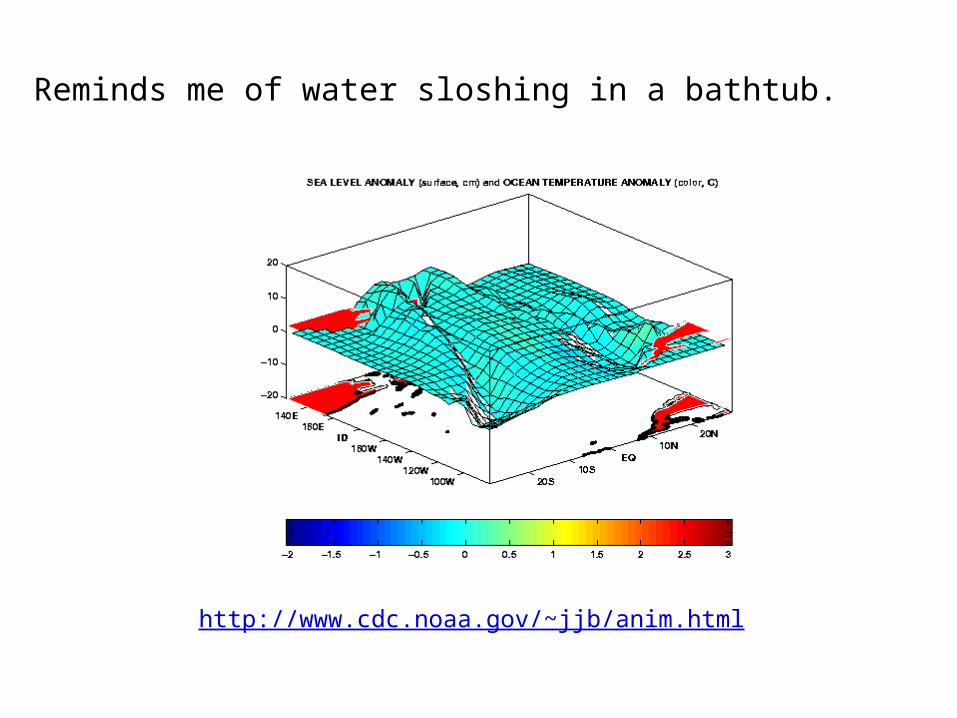
Reminds me of water sloshing in a bathtub.
http://www.cdc.noaa.gov/~jjb/anim.html
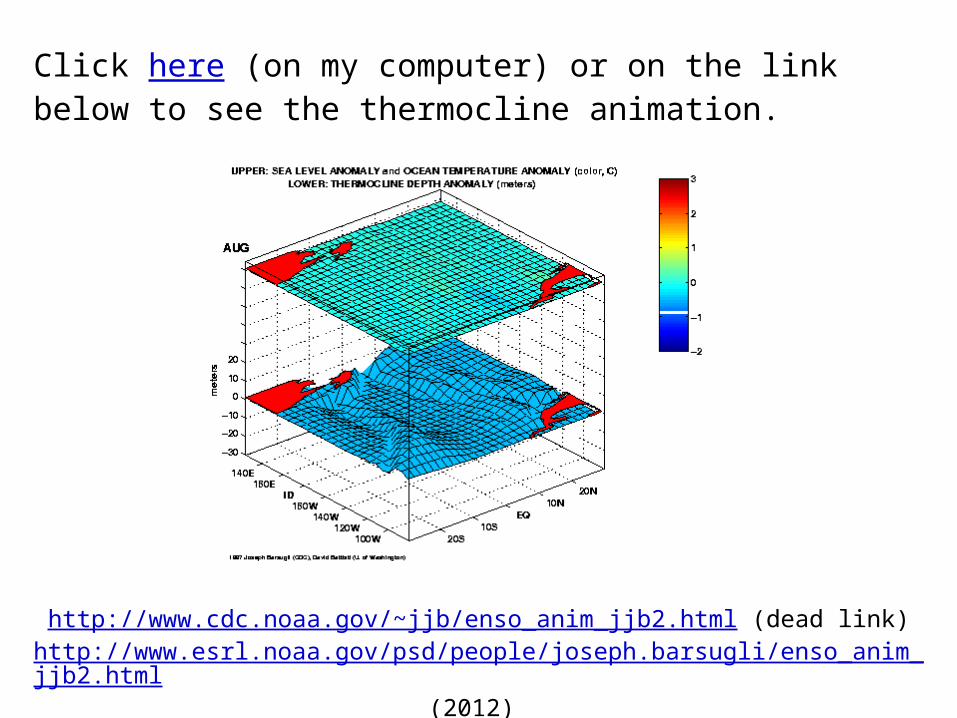
http://www.cdc.noaa.gov/~jjb/enso_anim_jjb2.html (dead link)http://www.esrl.noaa.gov/psd/people/joseph.barsugli/enso_anim_jjb2.html
(2012)
Click here (on my computer) or on the link below to see the thermocline animation.
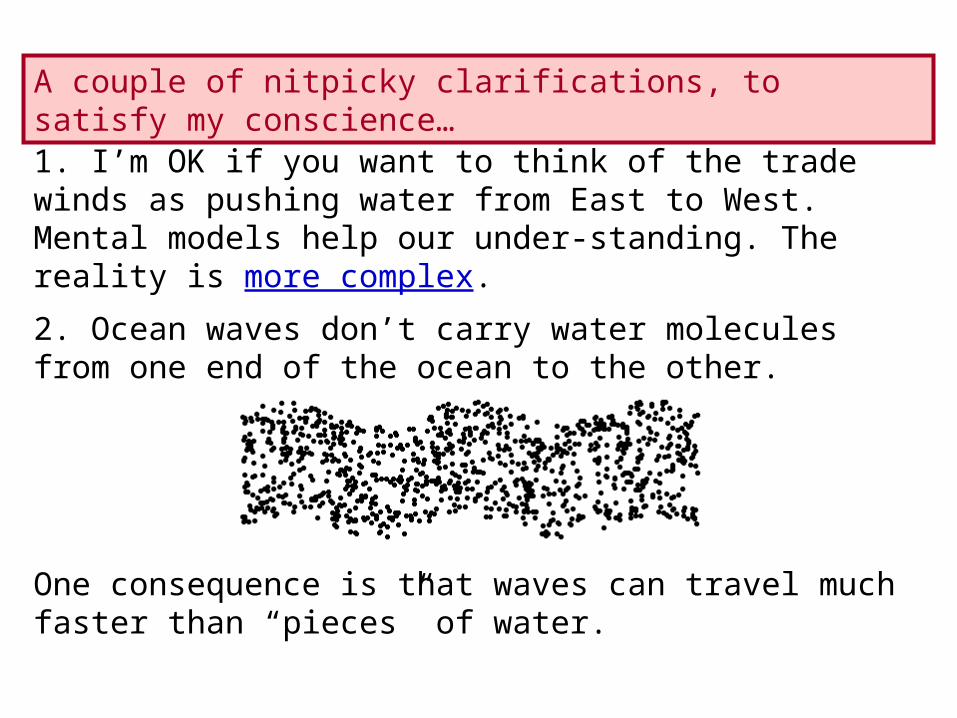
A couple of nitpicky clarifications, to satisfy my conscience…1. I’m OK if you want to think of the trade winds as pushing water from East to West. Mental models help our under-standing. The reality is more complex.
2. Ocean waves don’t carry water molecules from one end of the ocean to the other.
One consequence is that waves can travel much faster than “pieces” of water.
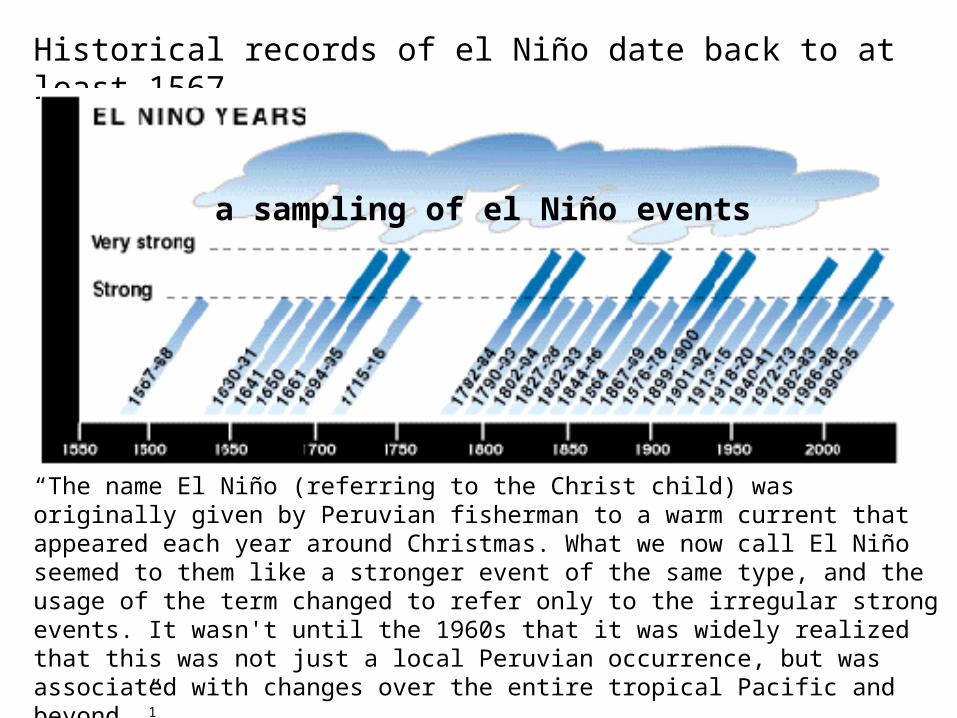
Historical records of el Niño date back to at least 1567.
a sampling of el Niño events
“The name El Niño (referring to the Christ child) was originally given by Peruvian fisherman to a warm current that appeared each year around Christmas. What we now call El Niño seemed to them like a stronger event of the same type, and the usage of the term changed to refer only to the irregular strong events. It wasn't until the 1960s that it was widely realized that this was not just a local Peruvian occurrence, but was associated with changes over the entire tropical Pacific and beyond.”1
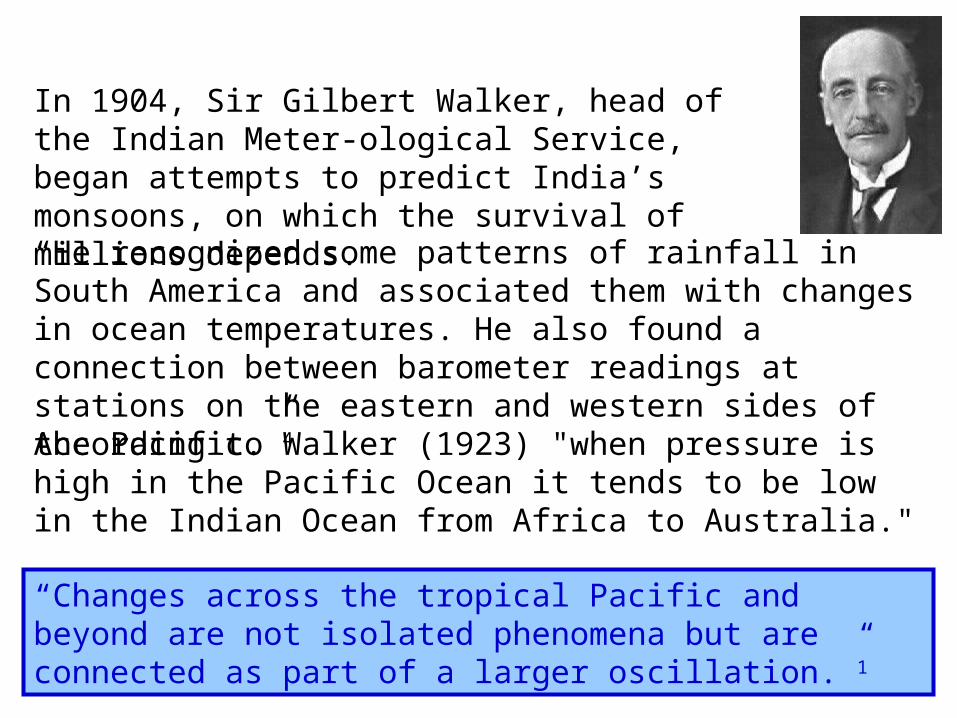
In 1904, Sir Gilbert Walker, head of the Indian Meter-ological Service, began attempts to predict India’s monsoons, on which the survival of millions depends.
According to Walker (1923) "when pressure is high in the Pacific Ocean it tends to be low in the Indian Ocean from Africa to Australia."
“He recognized some patterns of rainfall in South America and associated them with changes in ocean temperatures. He also found a connection between barometer readings at stations on the eastern and western sides of the Pacific.”4
“Changes across the tropical Pacific and beyond are not isolated phenomena but are connected as part of a larger oscillation.”1
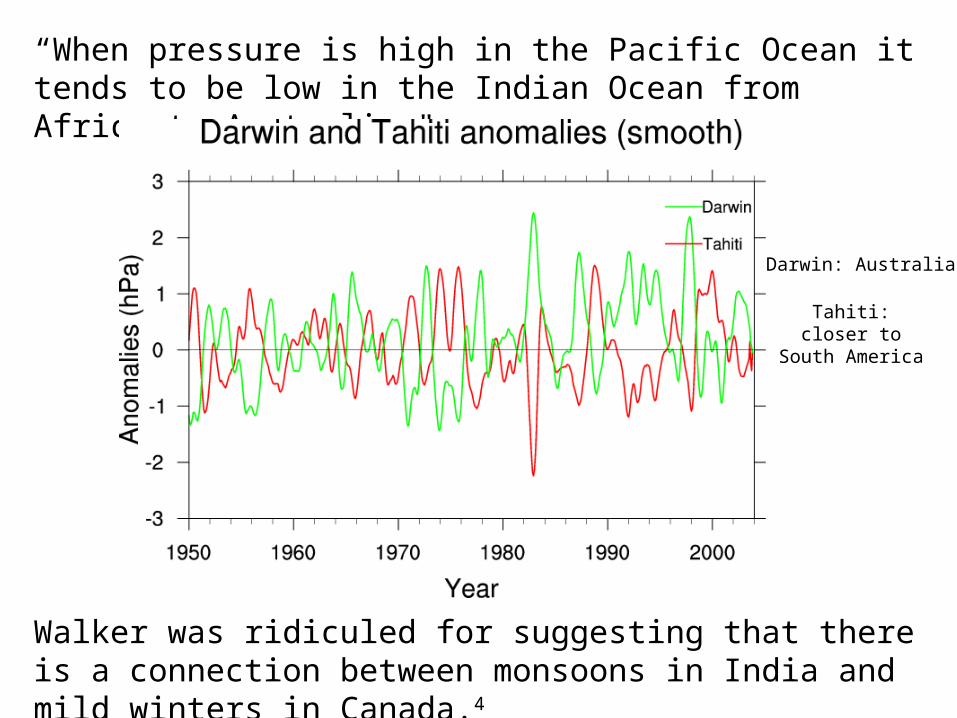
“When pressure is high in the Pacific Ocean it tends to be low in the Indian Ocean from Africa to Australia."
Walker was ridiculed for suggesting that there is a connection between monsoons in India and mild winters in Canada.4
Darwin: Australia
Tahiti: closer to South America
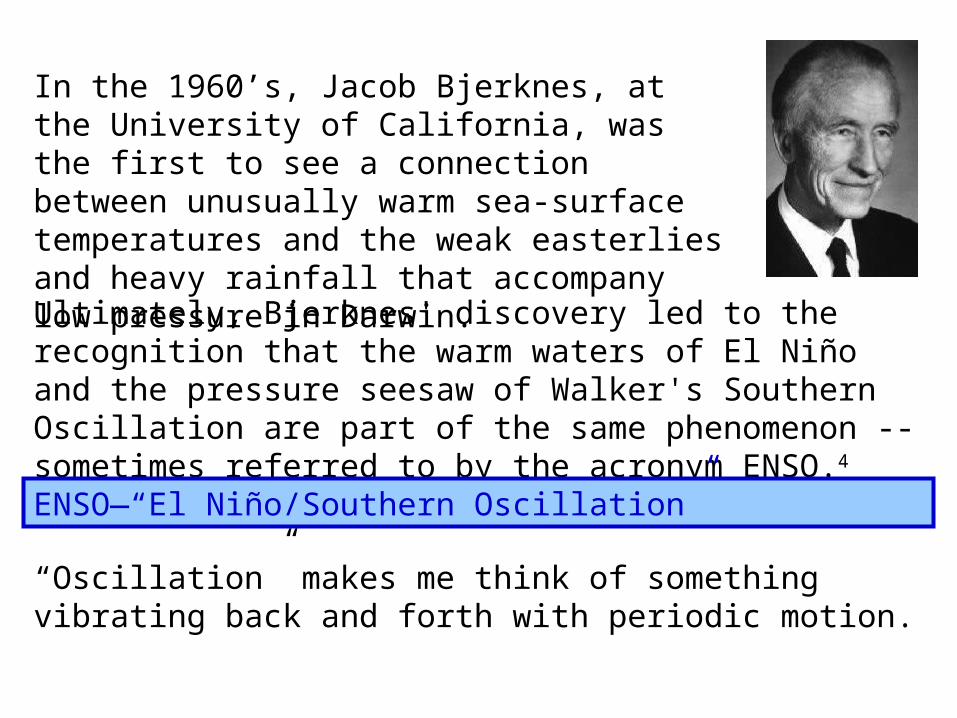
In the 1960’s, Jacob Bjerknes, at the University of California, was the first to see a connection between unusually warm sea-surface temperatures and the weak easterlies and heavy rainfall that accompany low pressure in Darwin.Ultimately, Bjerknes' discovery led to the recognition that the warm waters of El Niño and the pressure seesaw of Walker's Southern Oscillation are part of the same phenomenon -- sometimes referred to by the acronym ENSO.4
ENSO—“El Niño/Southern Oscillation”
“Oscillation” makes me think of something vibrating back and forth with periodic motion.
el Niño—what causes it?
This web page says “el Niño is where the normal circulation patterns of the atmosphere and ocean in the Southern Pacific break down and may even reverse. La Niña on the other hand, is an abnormal strengthening of that normal circulation.”They are the experts, not me, but it seems that the entire el Niño/la Niña cycle is a normal part of the Earth’s “life.”Earlier I wrote that el Niño was a response to weakening of the trade winds.
But why should the trade winds weaken?
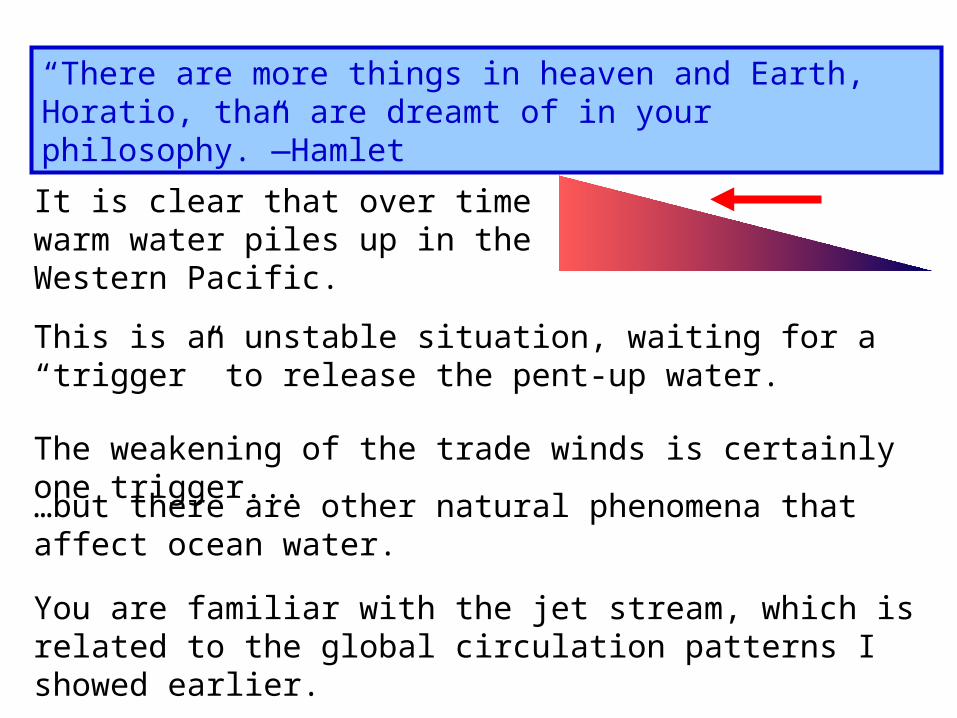
This is an unstable situation, waiting for a “trigger” to release the pent-up water.
“There are more things in heaven and Earth, Horatio, than are dreamt of in your philosophy.”—Hamlet
The weakening of the trade winds is certainly one trigger...…but there are other natural phenomena that affect ocean water.
You are familiar with the jet stream, which is related to the global circulation patterns I showed earlier.
It is clear that over time warm water piles up in the Western Pacific.
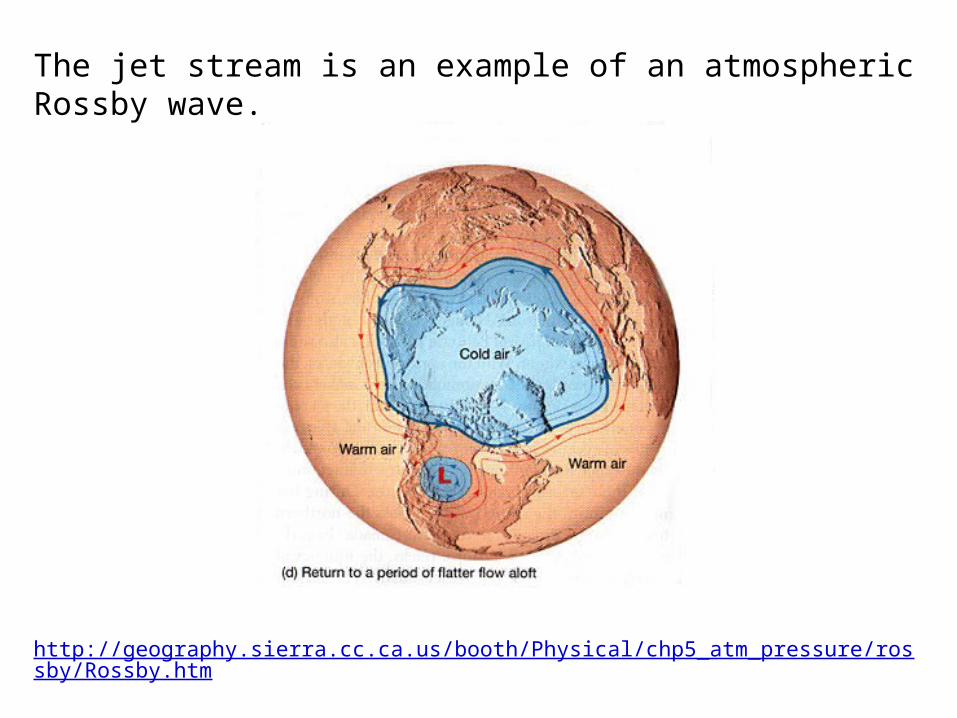
The jet stream is an example of an atmospheric Rossby wave.
http://geography.sierra.cc.ca.us/booth/Physical/chp5_atm_pressure/rossby/Rossby.htm
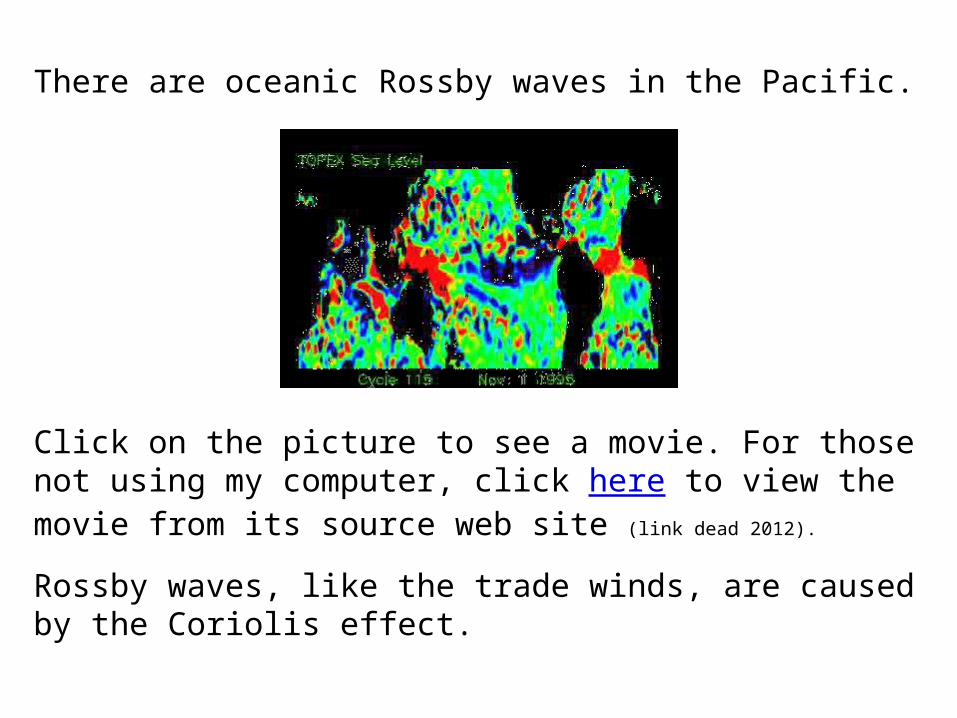
There are oceanic Rossby waves in the Pacific.
Click on the picture to see a movie. For those not using my computer, click here to view the movie from its source web site (link dead 2012).
Rossby waves, like the trade winds, are caused by the Coriolis effect.
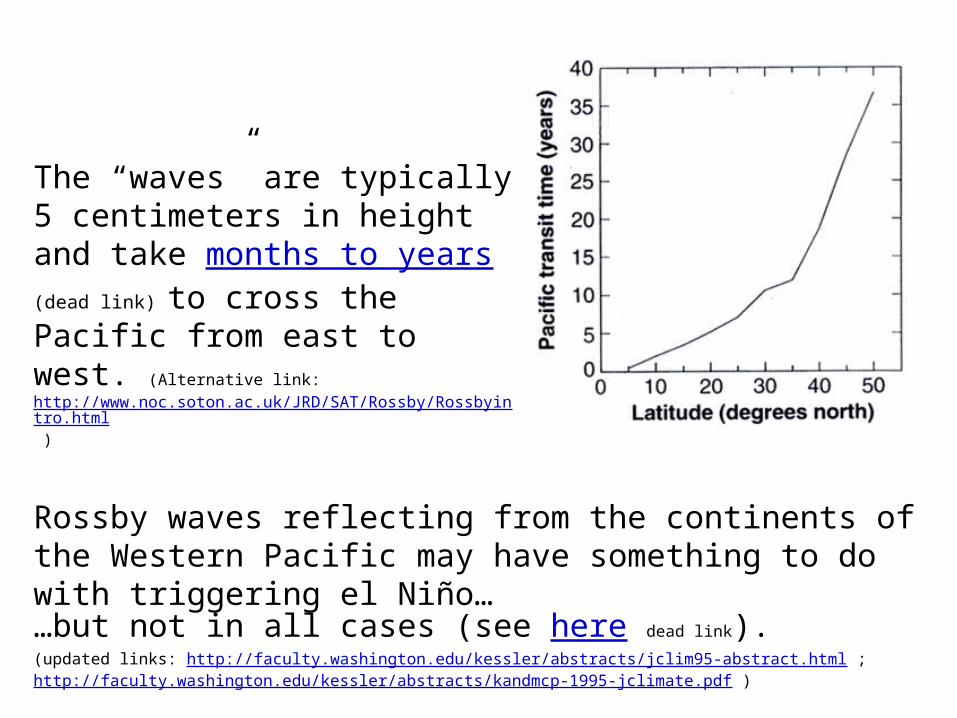
The “waves” are typically 5 centimeters in height and take months to years (dead link)
to cross the Pacific from east to west. (Alternative link: http://www.noc.soton.ac.uk/JRD/SAT/Rossby/Rossbyintro.html )
Rossby waves reflecting from the continents of the Western Pacific may have something to do with triggering el Niño……but not in all cases (see here dead link).(updated links: http://faculty.washington.edu/kessler/abstracts/jclim95-abstract.html ; http://faculty.washington.edu/kessler/abstracts/kandmcp-1995-jclimate.pdf )
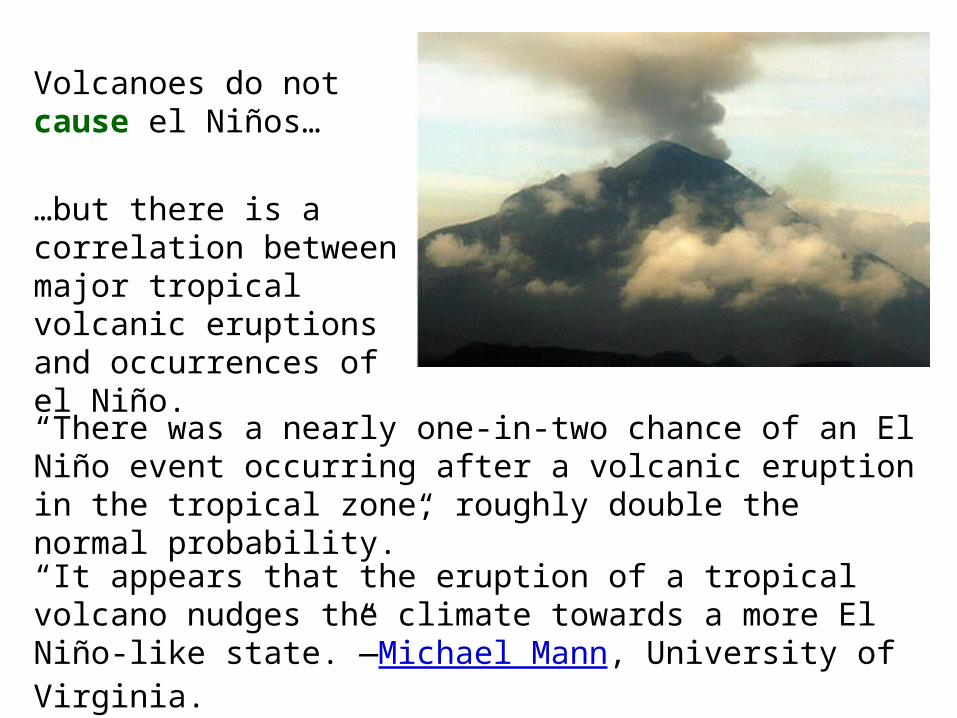
…but there is a correlation between major tropical volcanic eruptions and occurrences of el Niño.
“There was a nearly one-in-two chance of an El Niño event occurring after a volcanic eruption in the tropical zone, roughly double the normal probability.”
“It appears that the eruption of a tropical volcano nudges the climate towards a more El Niño-like state.”—Michael Mann, University of Virginia.
Volcanoes do not cause el Niños…
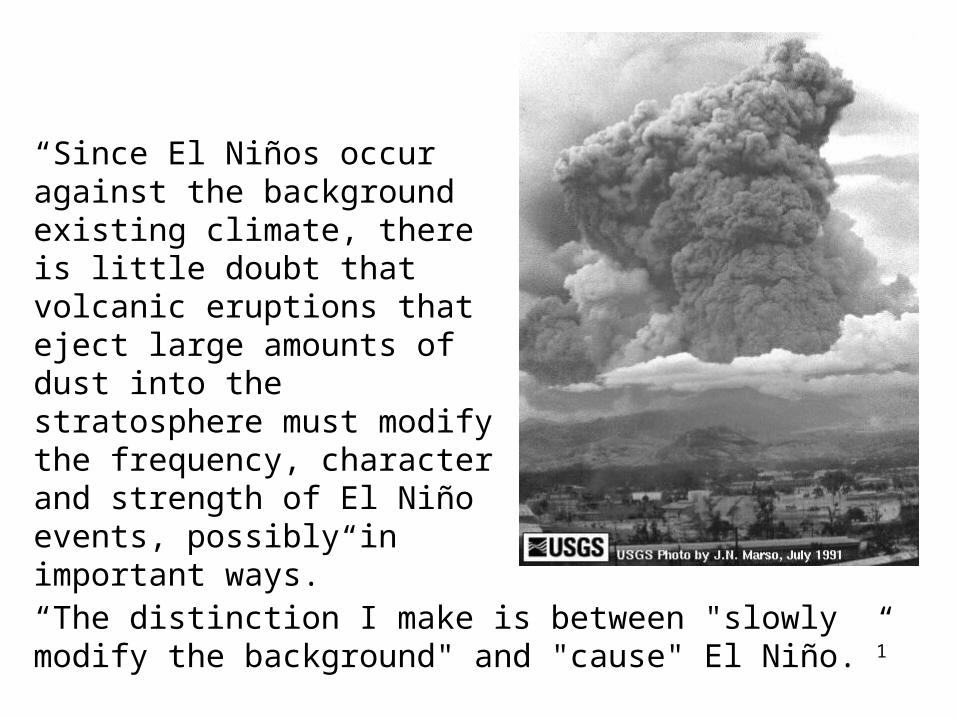
“Since El Niños occur against the background existing climate, there is little doubt that volcanic eruptions that eject large amounts of dust into the stratosphere must modify the frequency, character and strength of El Niño events, possibly in important ways.”
“The distinction I make is between "slowly modify the background" and "cause" El Niño.”1
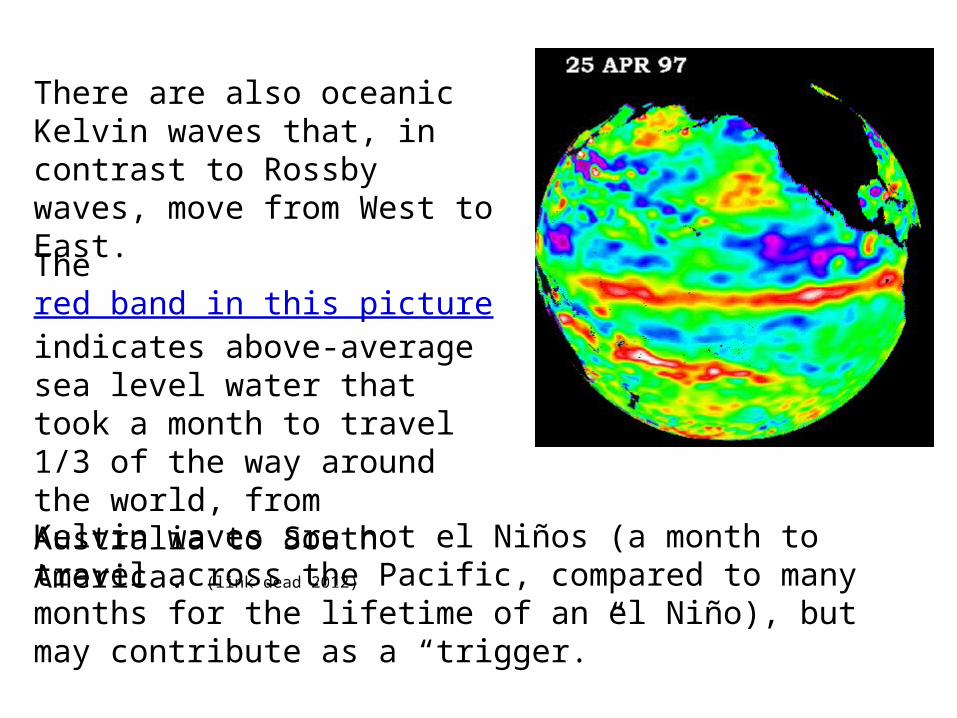
There are also oceanic Kelvin waves that, in contrast to Rossby waves, move from West to East.
Kelvin waves are not el Niños (a month to travel across the Pacific, compared to many months for the lifetime of an el Niño), but may contribute as a “trigger.”
The red band in this picture indicates above-average sea level water that took a month to travel 1/3 of the way around the world, from Australia to South America. (link dead 2012)
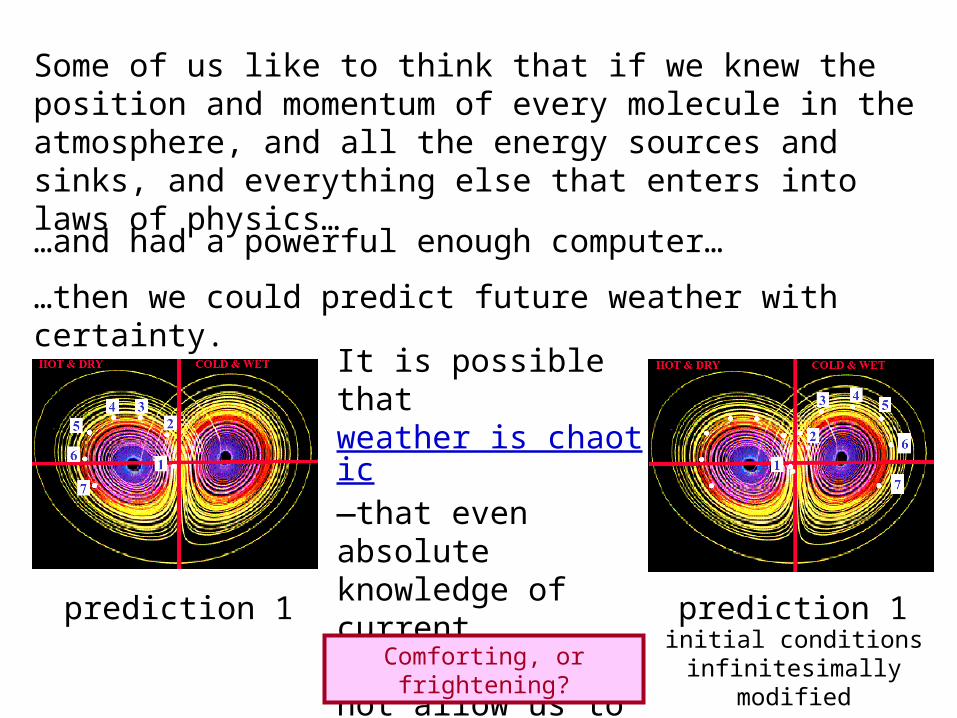
Some of us like to think that if we knew the position and momentum of every molecule in the atmosphere, and all the energy sources and sinks, and everything else that enters into laws of physics…
…and had a powerful enough computer…
…then we could predict future weather with certainty.
It is possible that weather is chaotic—that even absolute knowledge of current conditions would not allow us to predict future weather. (dead link 2012)
prediction 1 prediction 1initial conditions infinitesimally
modified
Comforting, or frightening?
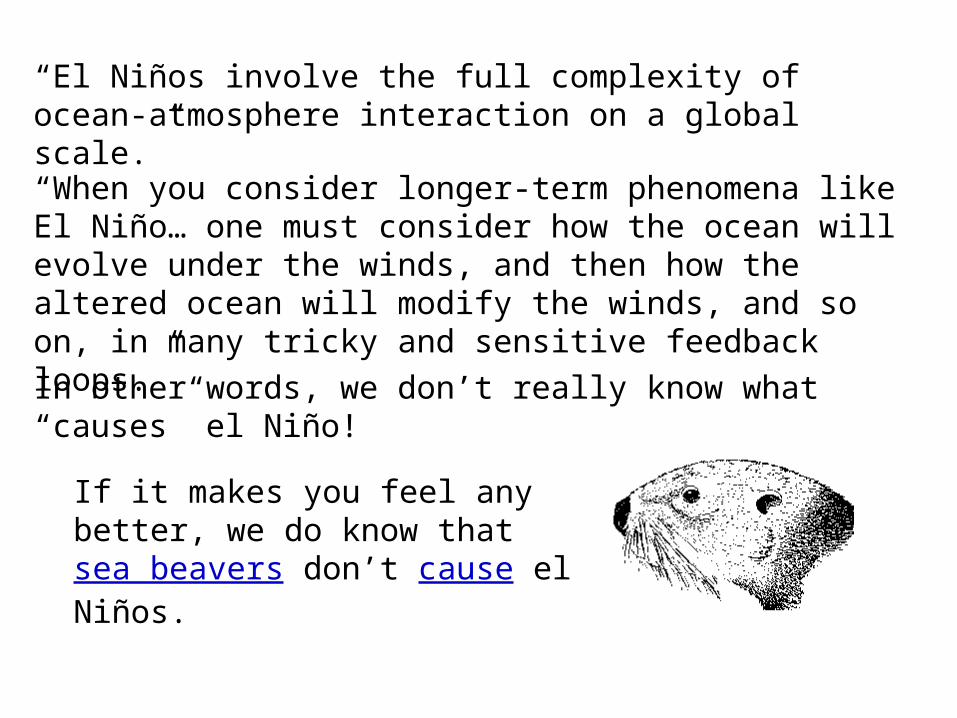
“El Niños involve the full complexity of ocean-atmosphere interaction on a global scale.”
“When you consider longer-term phenomena like El Niño… one must consider how the ocean will evolve under the winds, and then how the altered ocean will modify the winds, and so on, in many tricky and sensitive feedback loops.” In other words, we don’t really know what “causes” el Niño!
If it makes you feel any better, we do know that sea beavers don’t cause el Niños.
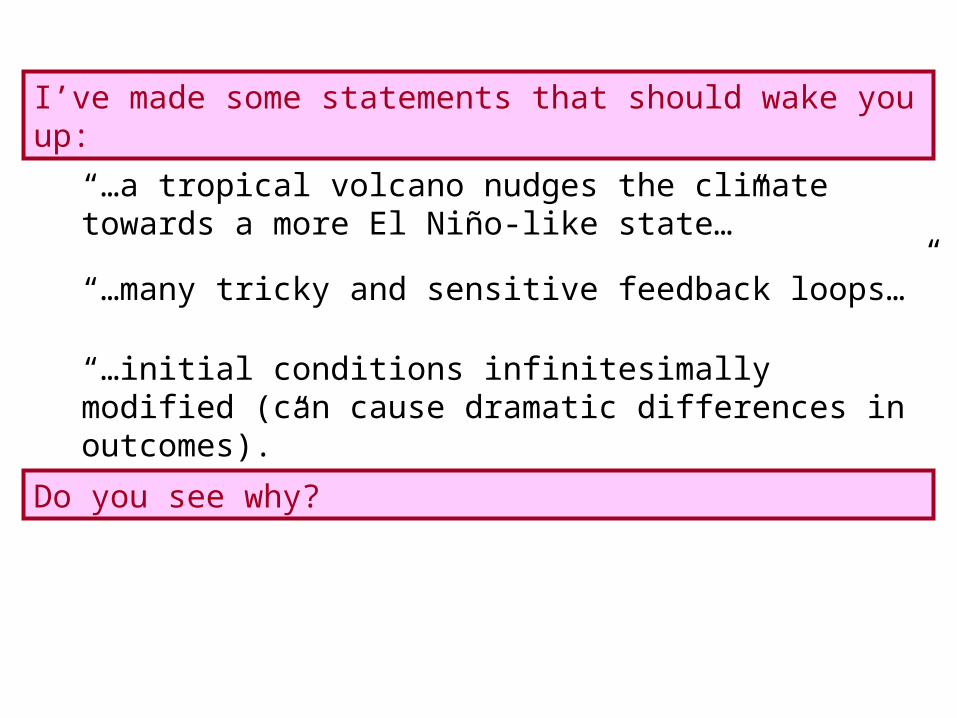
I’ve made some statements that should wake you up:
“…a tropical volcano nudges the climate towards a more El Niño-like state…”
“…many tricky and sensitive feedback loops…”
“…initial conditions infinitesimally modified (can cause dramatic differences in outcomes).”
Do you see why?
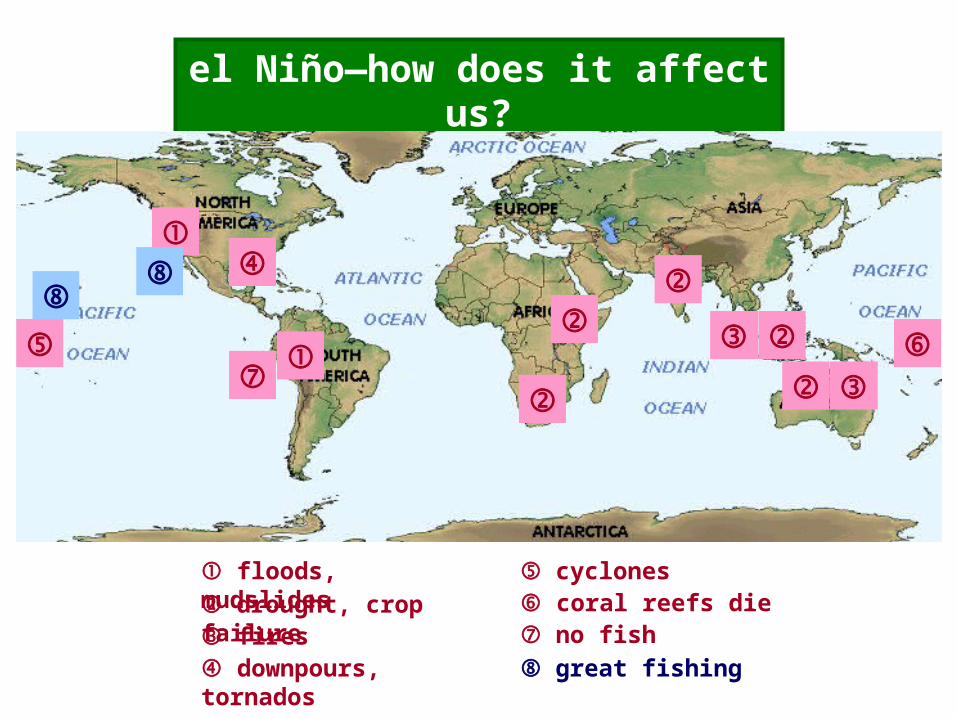
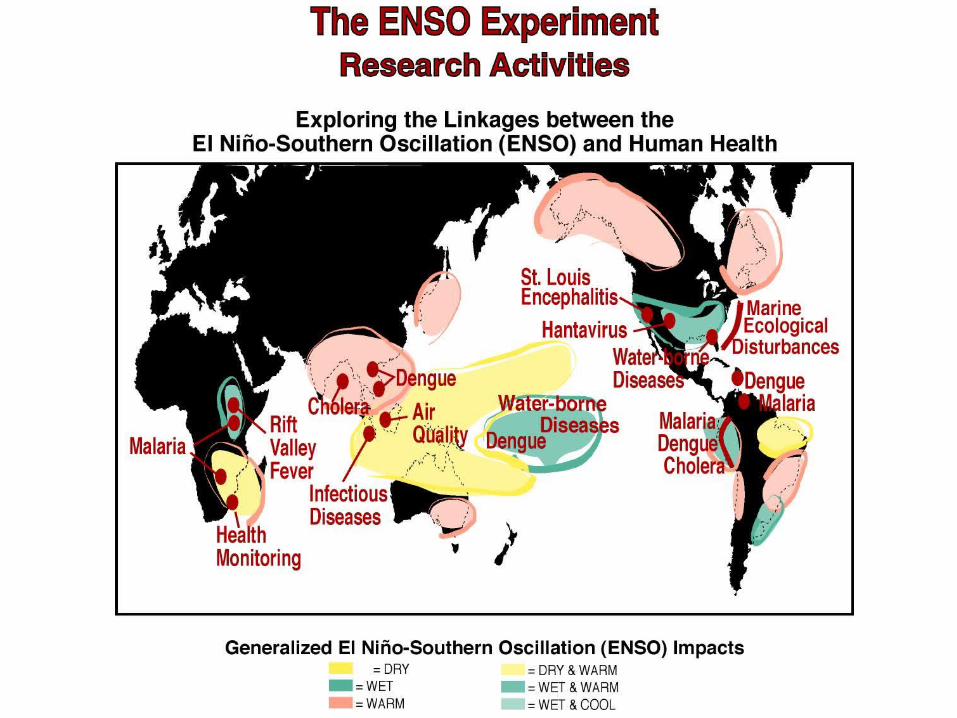
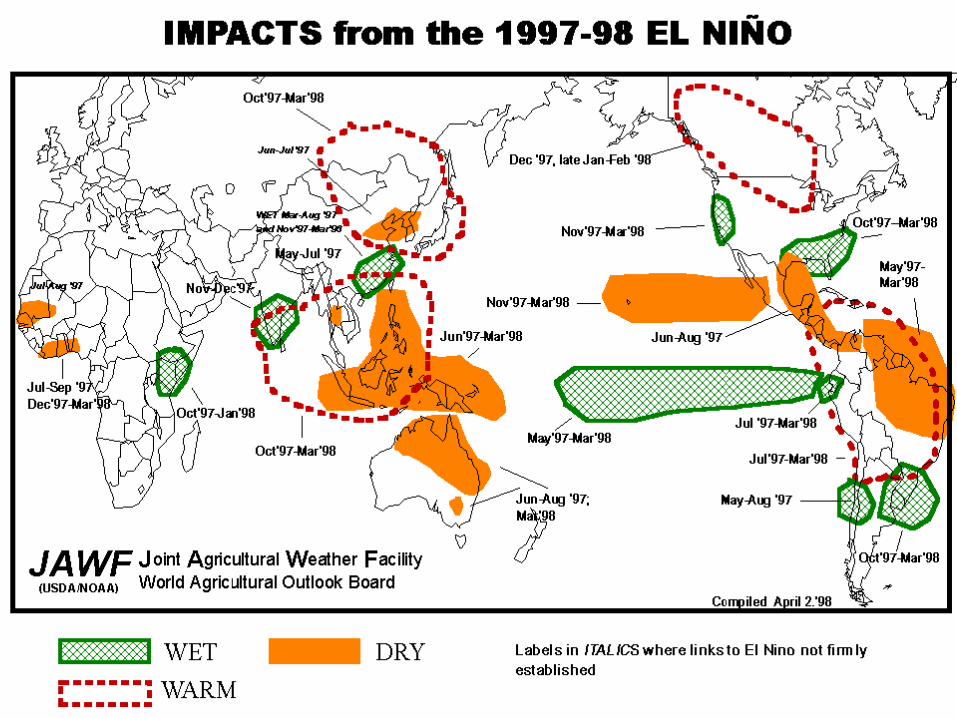
el Niño—how does it affect us?
floods, mudslides
drought, crop failure
fires
downpours, tornados
cyclones
coral reefs die
no fish great fishing
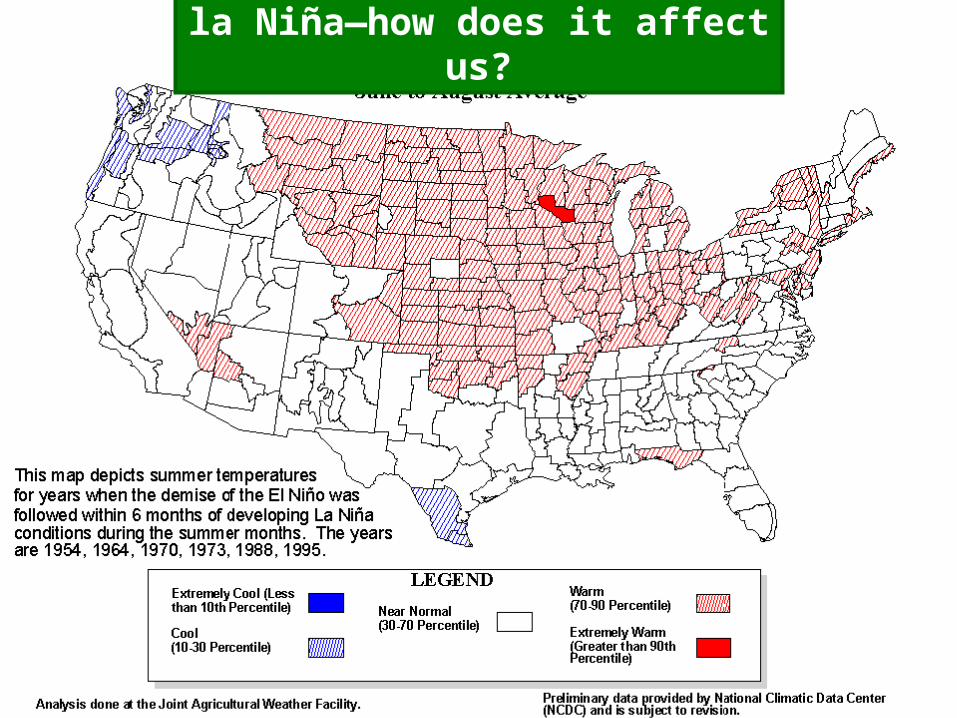
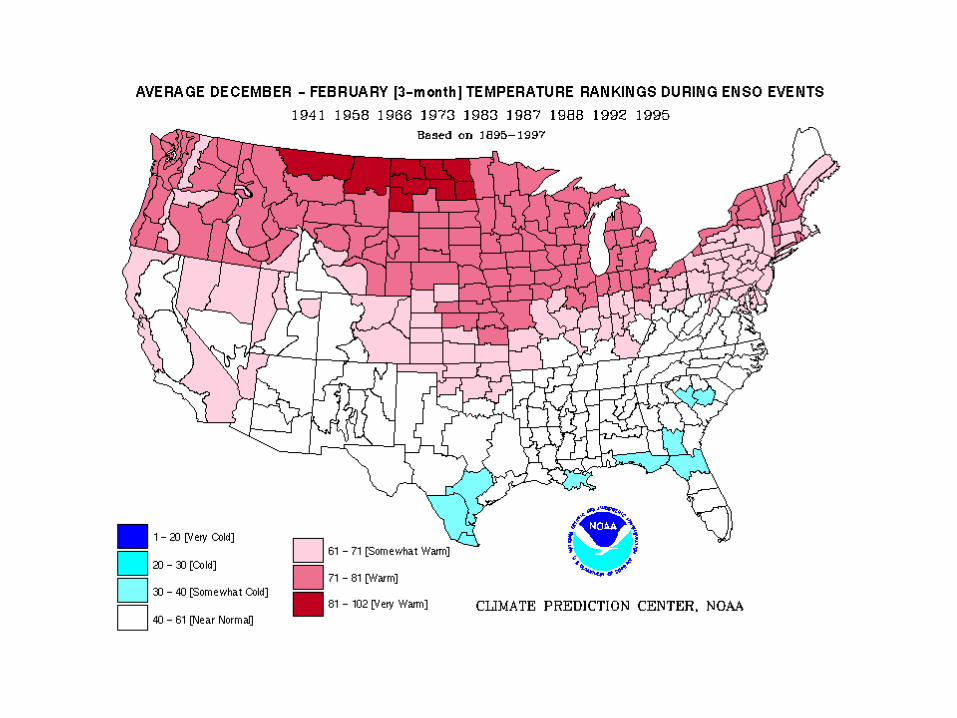
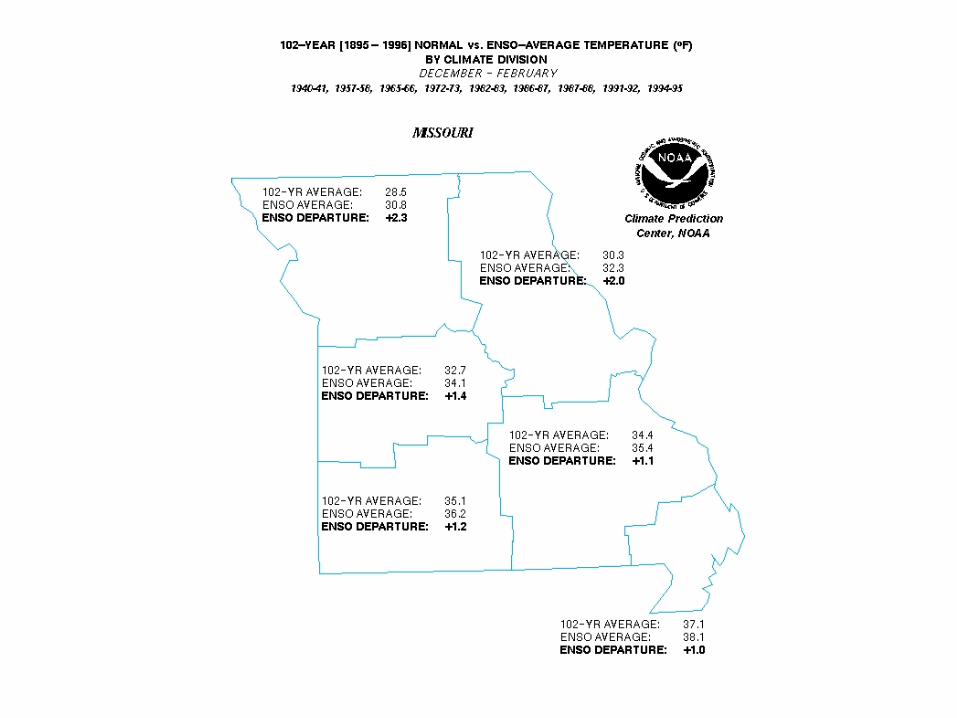
la Niña—how does it affect us?
“La Niña often features drier than normal conditions in the Southwest in late summer through the subsequent winter.
Drier than normal conditions also typically occur in the Central Plains in the fall and in the Southeast in the winter. In contrast, the Pacific Northwest is more likely to be wetter than normal in the late fall and early winter with the presence of a well-established La Niña.
Additionally, on average La Niña winters are warmer than normal in the Southeast and colder than normal in the Northwest.”
http://www.elnino.noaa.gov/lanina_new_faq.html
1997, US:
California suffered more than $1.1 billion in economic losses
midwest and East Coast natural gas and heating oil demand reduced by 10 percent—a savings of about $6.7 billion
retail sales in the US about $5.6 billion higher than normal because of the milder winter
more home construction
fewer transportation delays and less salt used on roads
Not all the effects of el Niño are bad.
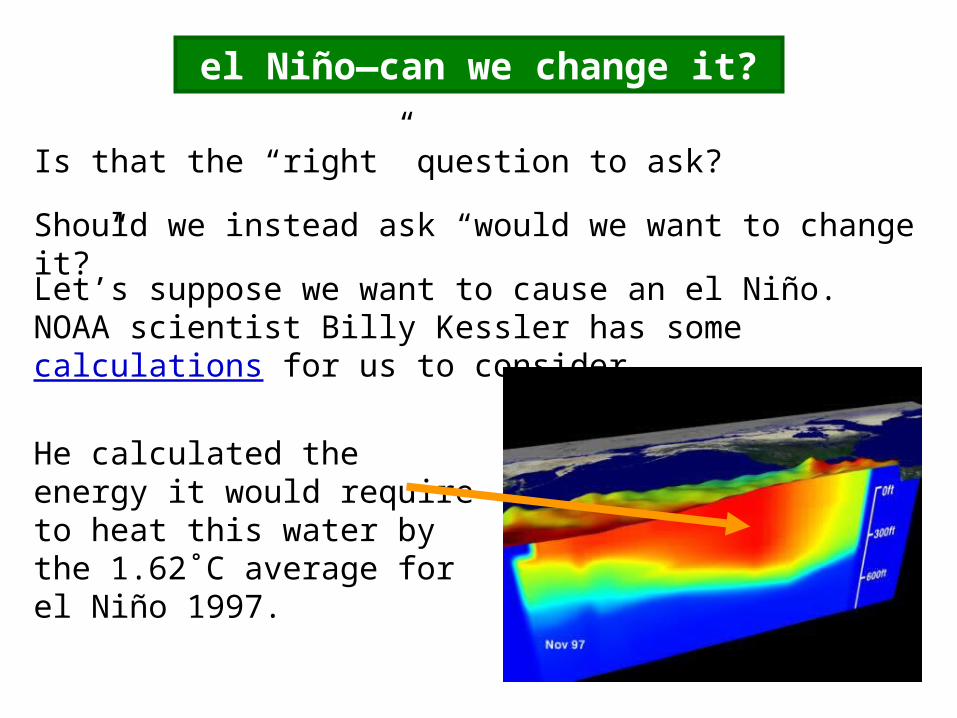
el Niño—can we change it?
Is that the “right” question to ask?
Should we instead ask “would we want to change it?”
Let’s suppose we want to cause an el Niño. NOAA scientist Billy Kessler has some calculations for us to consider.
He calculated the energy it would require to heat this water by the 1.62˚C average for el Niño 1997.
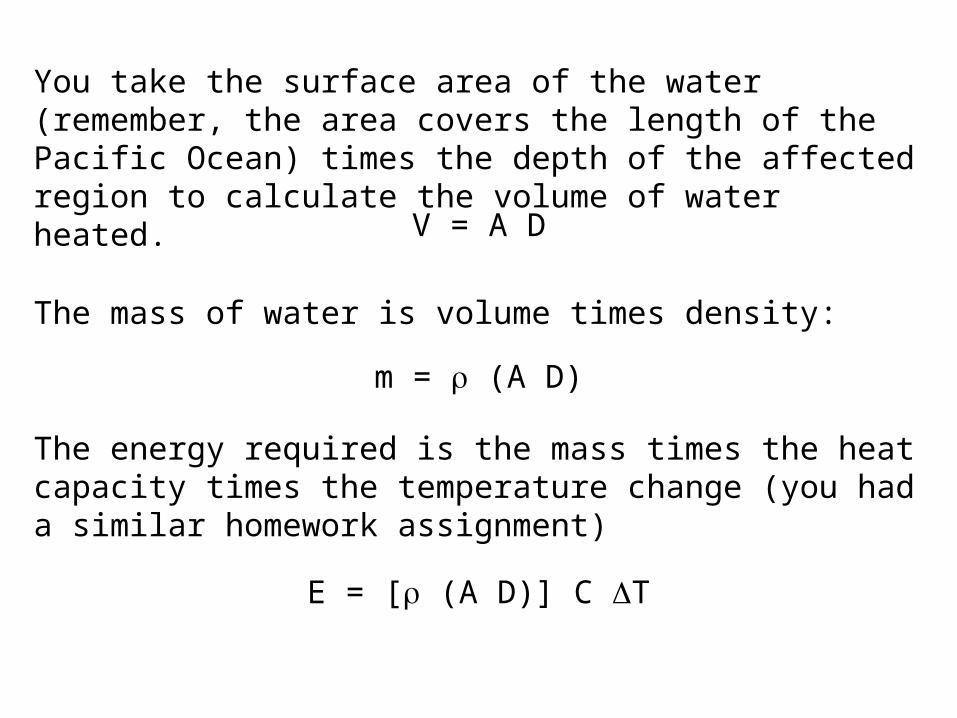
You take the surface area of the water (remember, the area covers the length of the Pacific Ocean) times the depth of the affected region to calculate the volume of water heated.
V = A D
The mass of water is volume times density:
m = (A D)
The energy required is the mass times the heat capacity times the temperature change (you had a similar homework assignment)
E = [ (A D)] C T
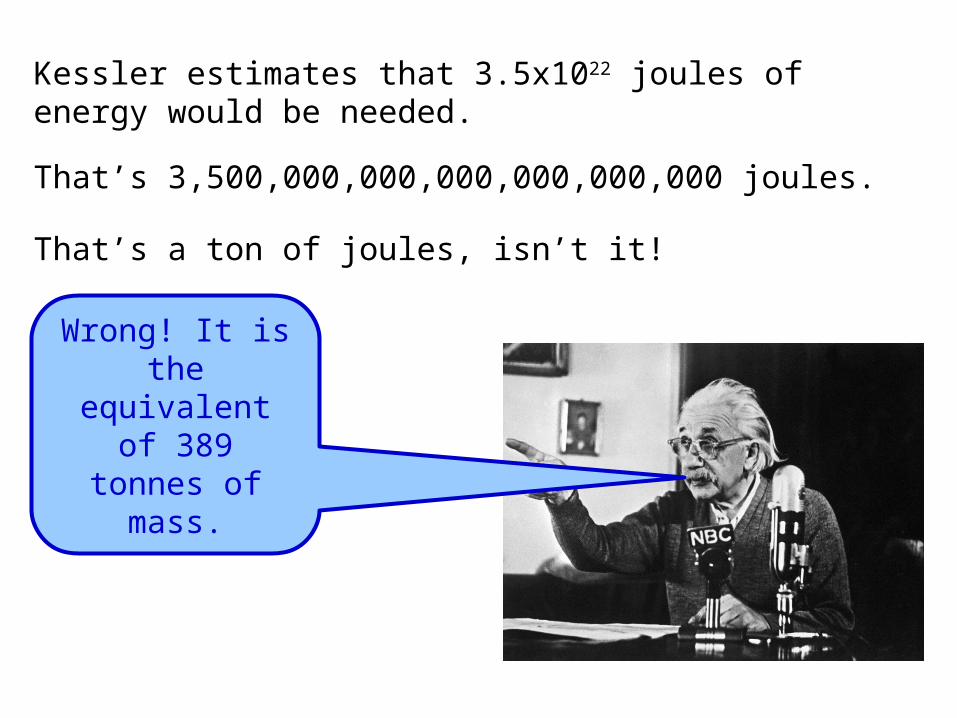
Kessler estimates that 3.5x10²² joules of energy would be needed.
That’s 3,500,000,000,000,000,000,000 joules.
That’s a ton of joules, isn’t it!
Wrong! It is the equivalent of 389 tonnes
of mass.
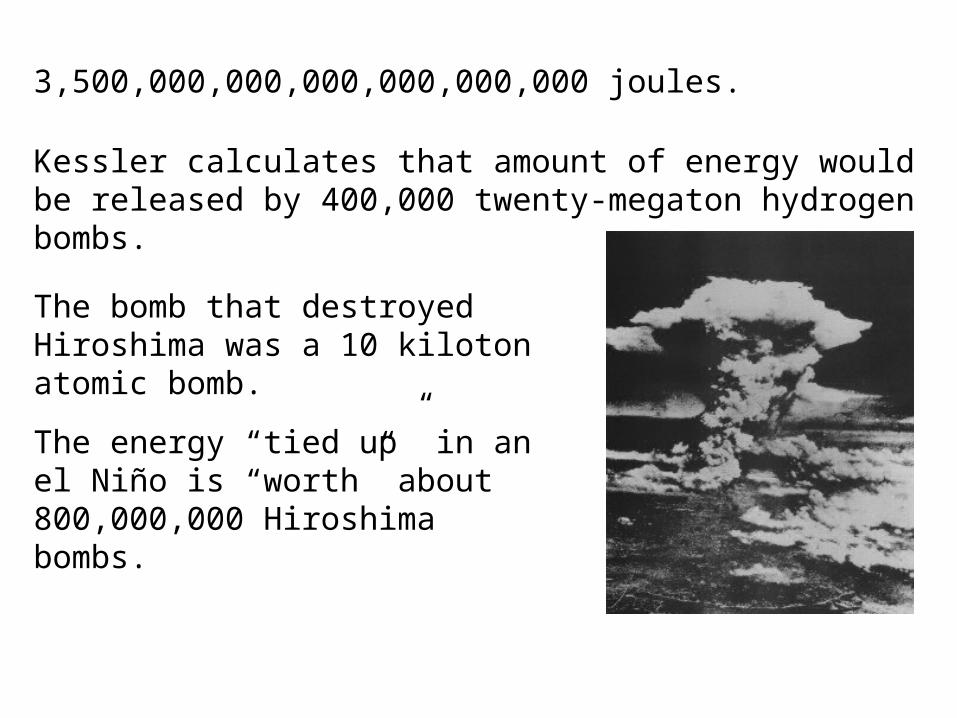
3,500,000,000,000,000,000,000 joules.
Kessler calculates that amount of energy would be released by 400,000 twenty-megaton hydrogen bombs.
The bomb that destroyed Hiroshima was a 10 kiloton atomic bomb.
The energy “tied up” in an el Niño is “worth” about 800,000,000 Hiroshima bombs.
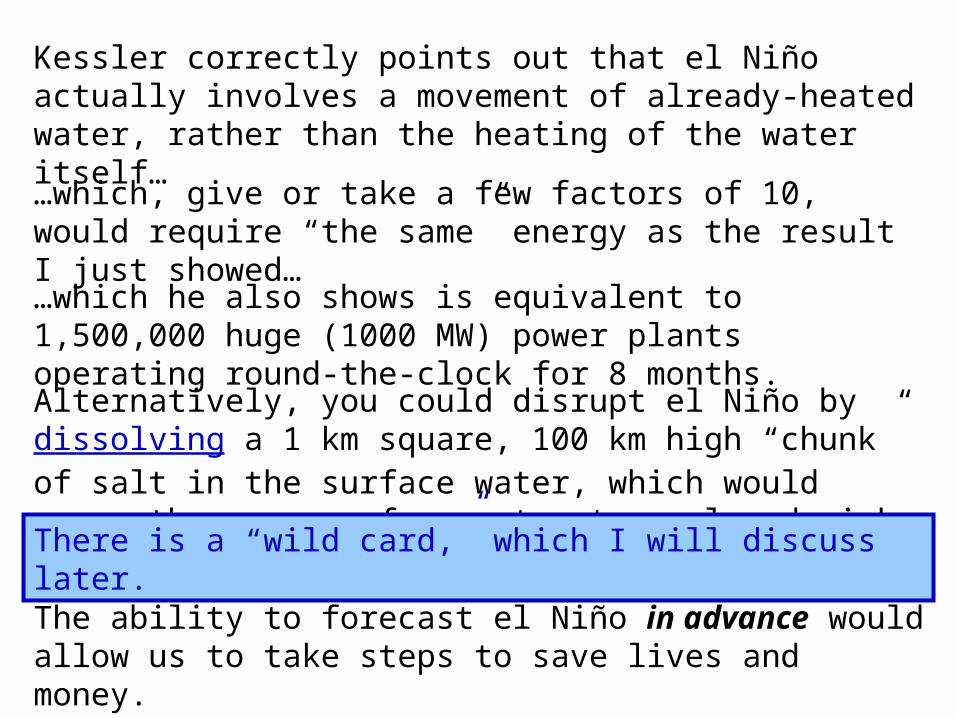
Kessler correctly points out that el Niño actually involves a movement of already-heated water, rather than the heating of the water itself…
…which, give or take a few factors of 10, would require “the same” energy as the result I just showed…
…which he also shows is equivalent to 1,500,000 huge (1000 MW) power plants operating round-the-clock for 8 months.Alternatively, you could disrupt el Niño by dissolving a 1 km square, 100 km high “chunk” of salt in the surface water, which would cause the warm surface water to cool and sink.There is a “wild card,” which I will discuss later.
The ability to forecast el Niño in advance would allow us to take steps to save lives and money.
Actually, we can see that el Niño is coming about 6 months before major changes take place.
That warning could be used for emergency preparations...…except we can’t predict in advance the specific weather events that will cause disasters. And we can’t move thousands of people away from their homes in anticipation of a disaster that is unlikely to happen.
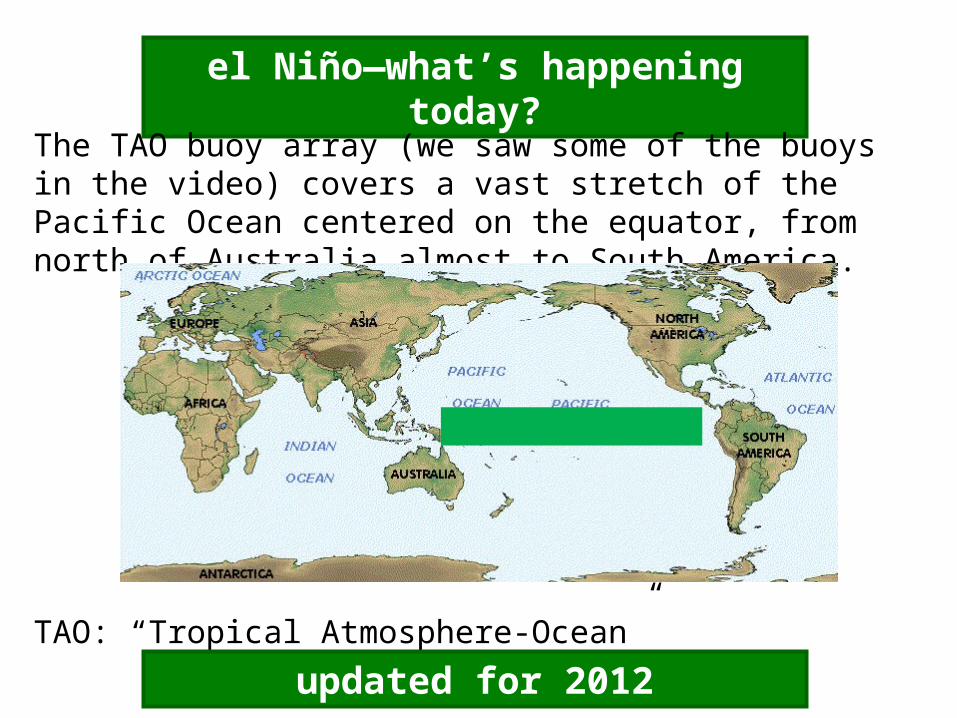
el Niño—what’s happening today?
The TAO buoy array (we saw some of the buoys in the video) covers a vast stretch of the Pacific Ocean centered on the equator, from north of Australia almost to South America.
TAO: “Tropical Atmosphere-Ocean”
updated for 2012
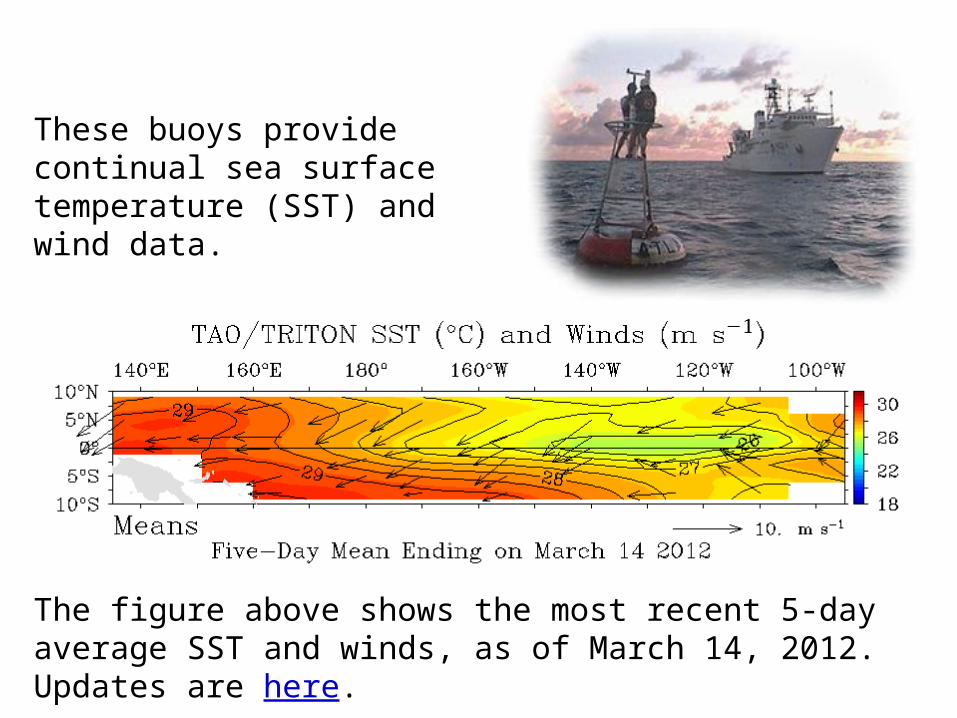
These buoys provide continual sea surface temperature (SST) and wind data.
The figure above shows the most recent 5-day average SST and winds, as of March 14, 2012. Updates are here.
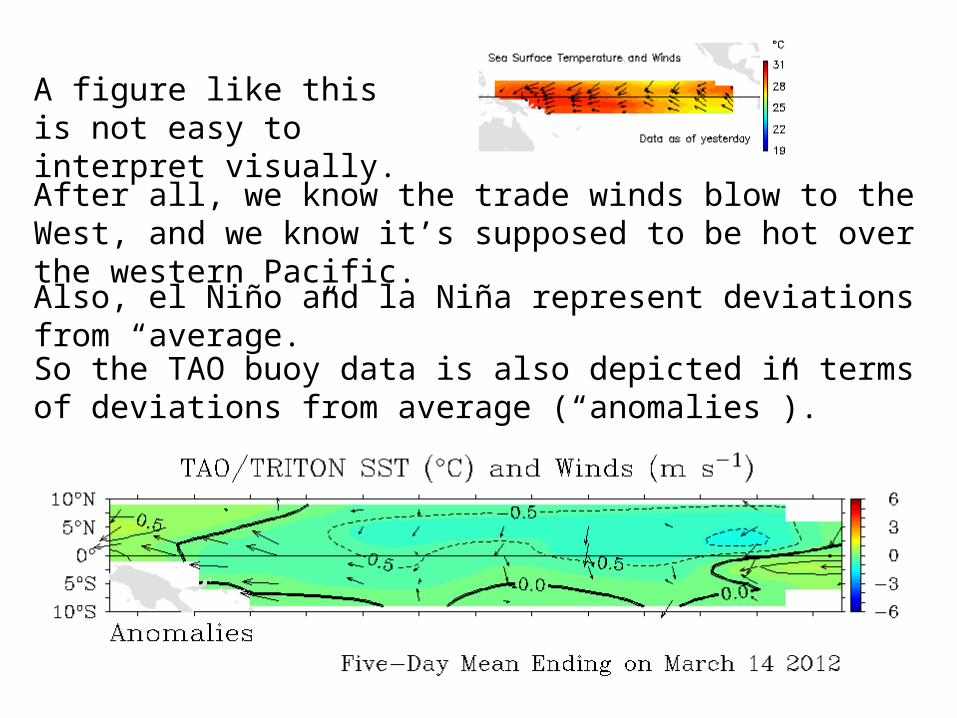
A figure like this is not easy to interpret visually.After all, we know the trade winds blow to the West, and we know it’s supposed to be hot over the western Pacific.Also, el Niño and la Niña represent deviations from “average.”So the TAO buoy data is also depicted in terms of deviations from average (“anomalies”).
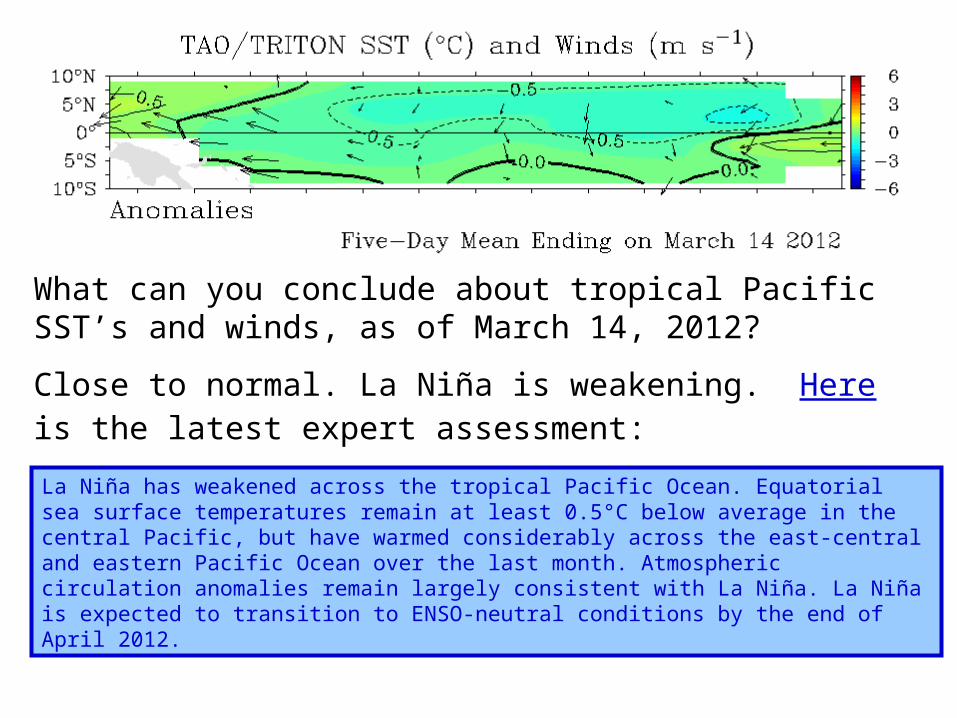
What can you conclude about tropical Pacific SST’s and winds, as of March 14, 2012?
Close to normal. La Niña is weakening. Here is the latest expert assessment:
La Niña has weakened across the tropical Pacific Ocean. Equatorial sea surface temperatures remain at least 0.5°C below average in the central Pacific, but have warmed considerably across the east-central and eastern Pacific Ocean over the last month. Atmospheric circulation anomalies remain largely consistent with La Niña. La Niña is expected to transition to ENSO-neutral conditions by the end of April 2012.
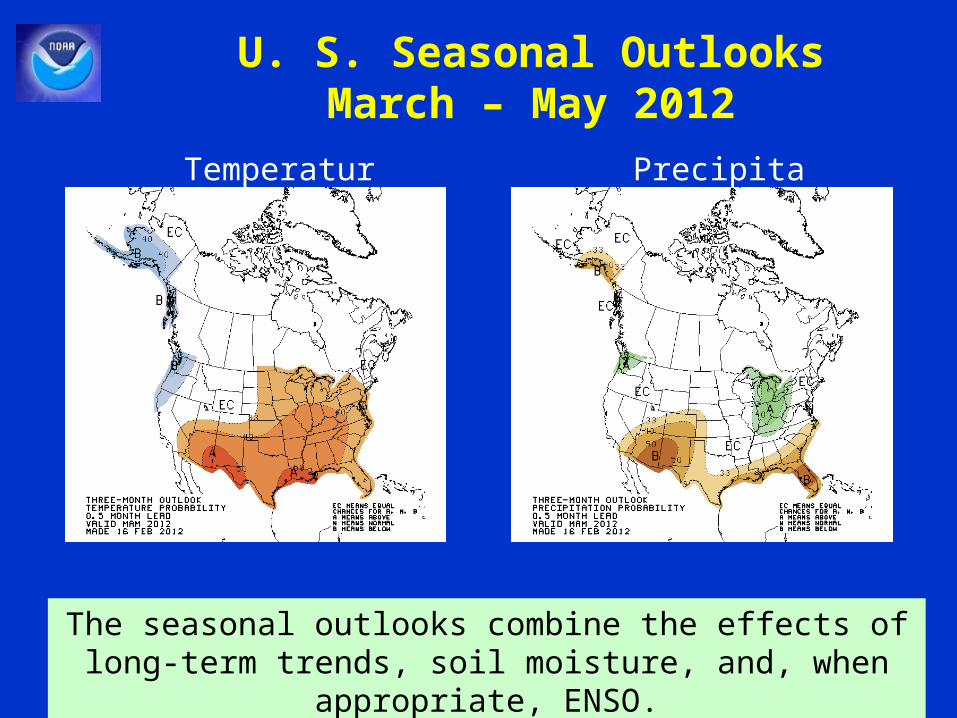
The seasonal outlooks combine the effects of long-term trends, soil moisture, and, when appropriate,
ENSO.
Temperature
Precipitation
U. S. Seasonal OutlooksMarch – May 2012
el Niño—past and future
To predict the future, understand the past.
El Niño is a mechanism for moving excess heat from the tropics to other parts of the Earth.
It is reasonable to ask whether el Niños occurred during the ice ages.
El Niño-like climate patterns during the most recent ice age have been found in New England (bad link).
Traces of el Niño-like climate patterns during the time since the last glacial maximum have been found in the tropical Pacific.
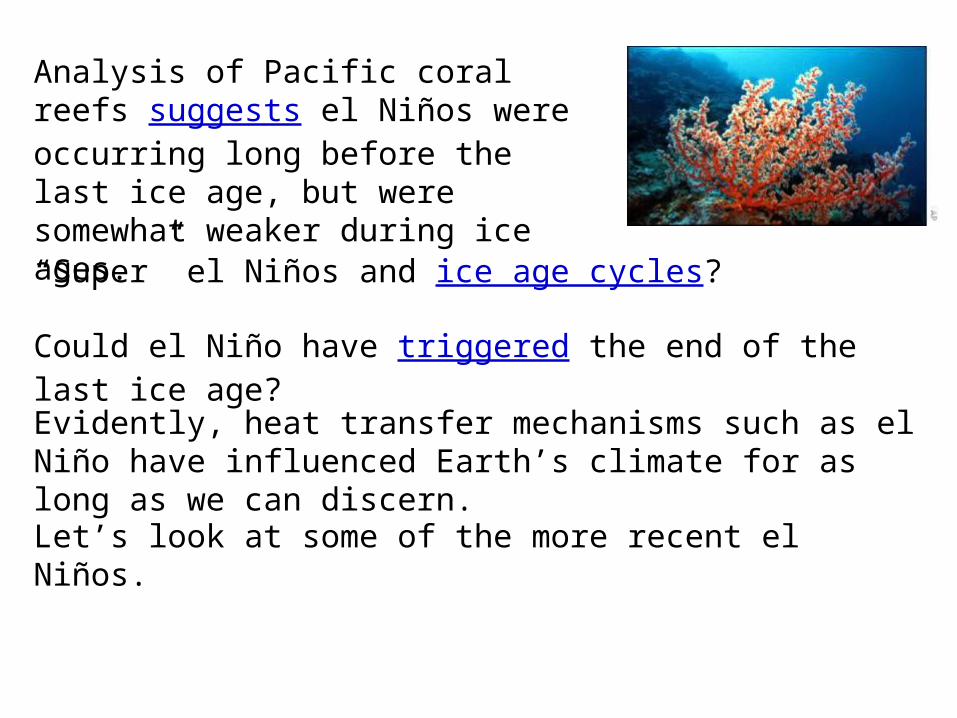
Analysis of Pacific coral reefs suggests el Niños were occurring long before the last ice age, but were somewhat weaker during ice ages.“Super” el Niños and ice age cycles?
Could el Niño have triggered the end of the last ice age?Evidently, heat transfer mechanisms such as el Niño have influenced Earth’s climate for as long as we can discern.Let’s look at some of the more recent el Niños.
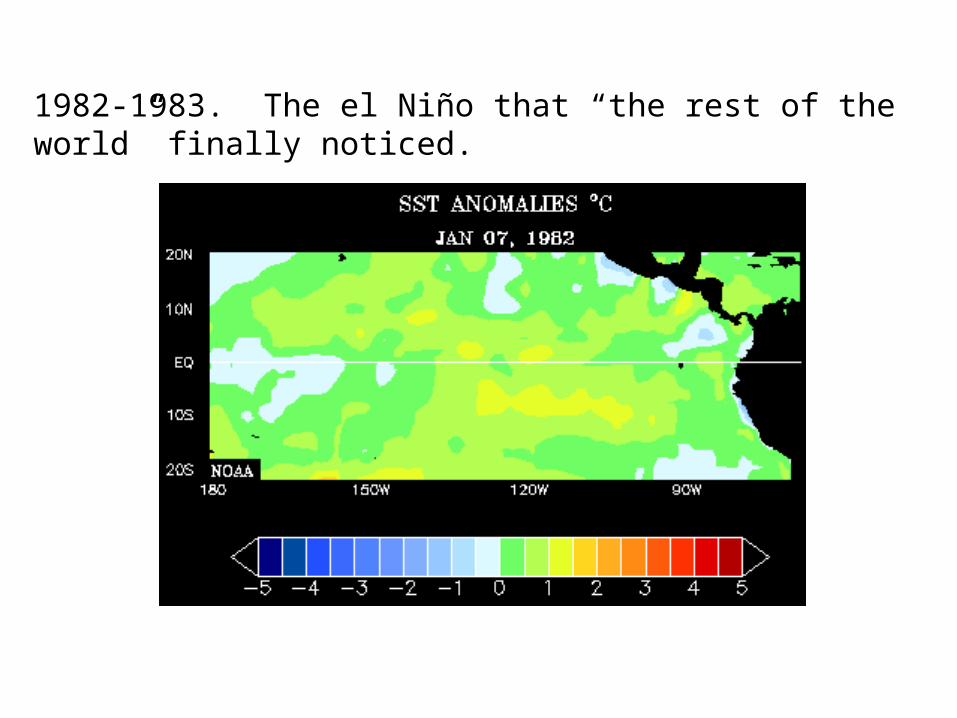
1982-1983. The el Niño that “the rest of the world” finally noticed.
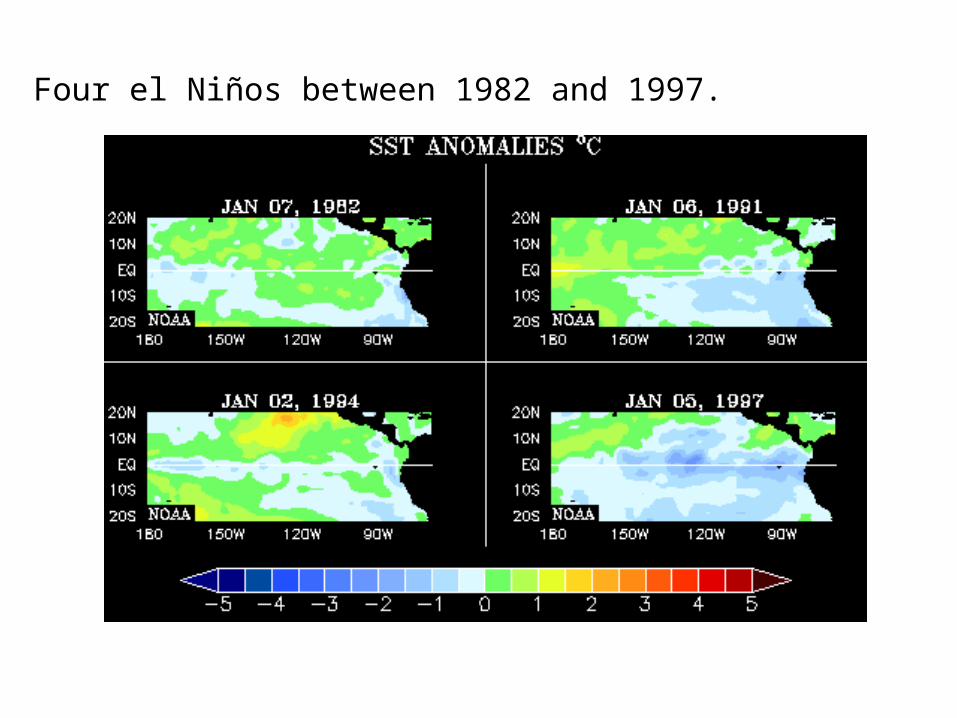
Four el Niños between 1982 and 1997.
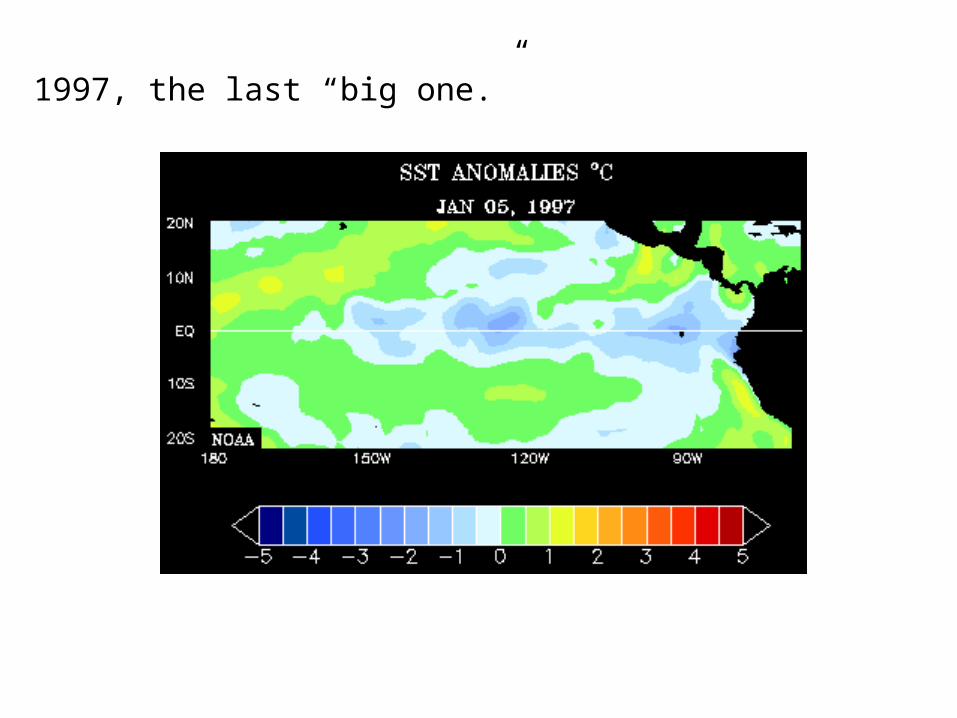
1997, the last “big one.”
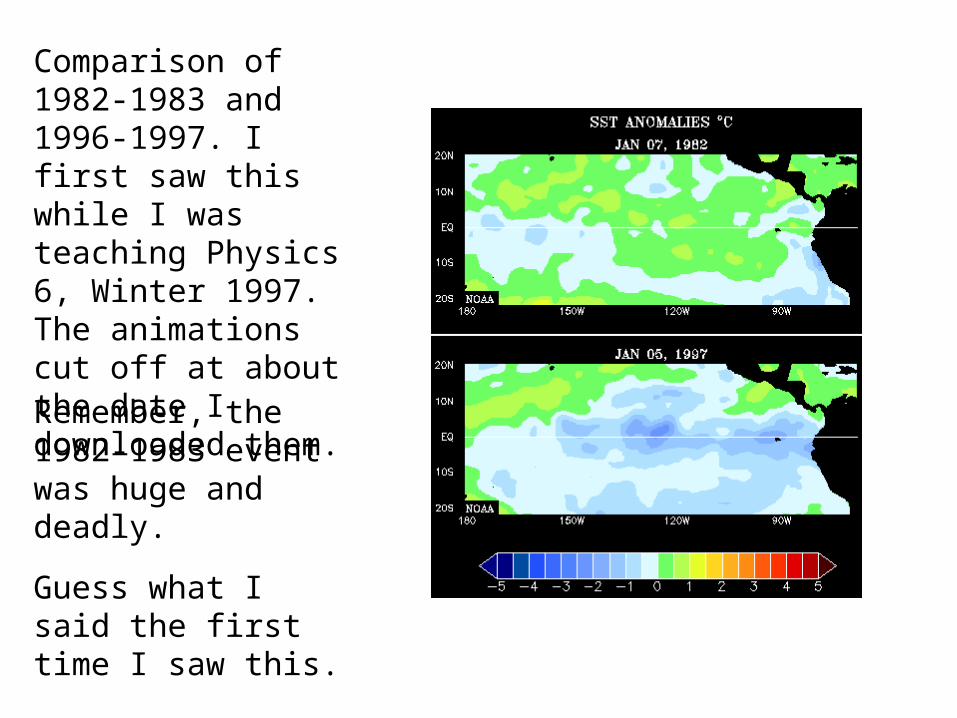
Comparison of 1982-1983 and 1996-1997. I first saw this while I was teaching Physics 6, Winter 1997. The animations cut off at about the date I downloaded them.
Guess what I said the first time I saw this.
Remember, the 1982-1983 event was huge and deadly.
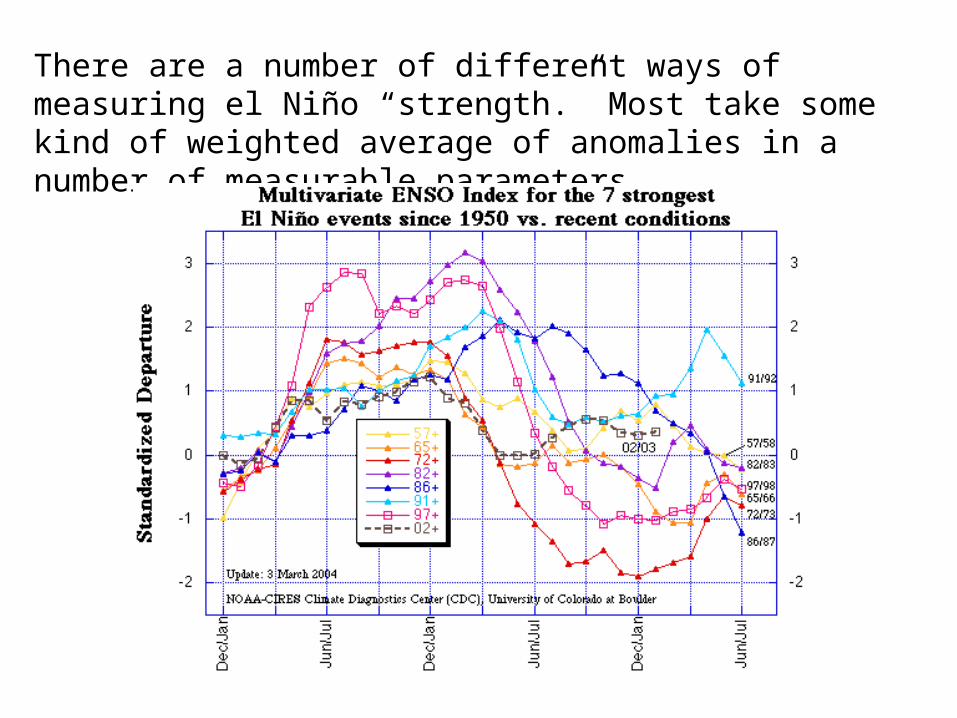
There are a number of different ways of measuring el Niño “strength.” Most take some kind of weighted average of anomalies in a number of measurable parameters.
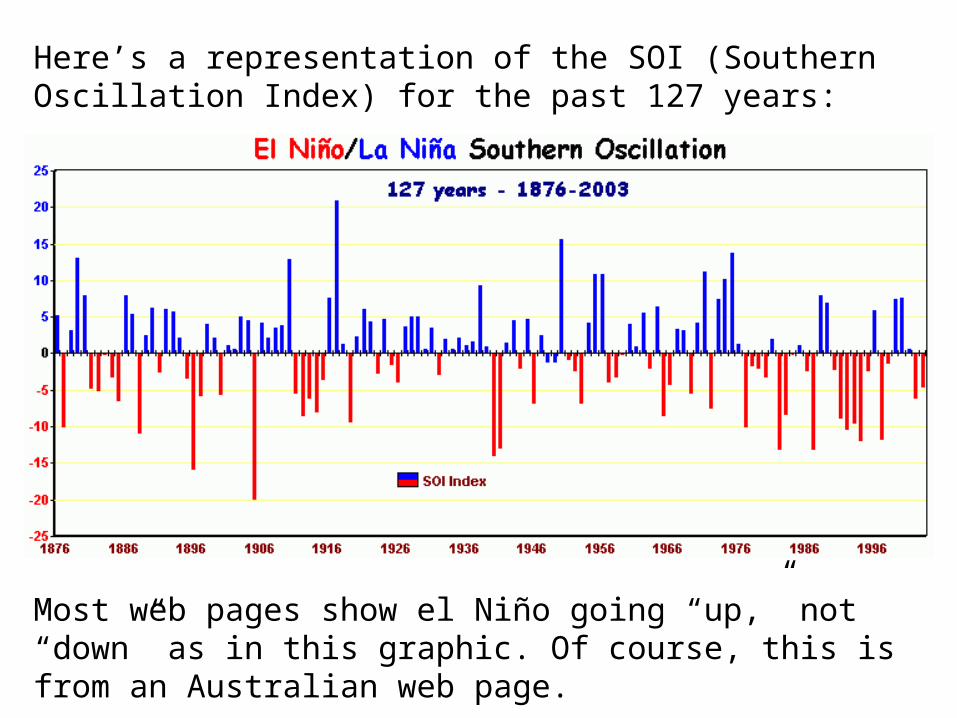
Here’s a representation of the SOI (Southern Oscillation Index) for the past 127 years:
Most web pages show el Niño going “up,” not “down” as in this graphic. Of course, this is from an Australian web page.
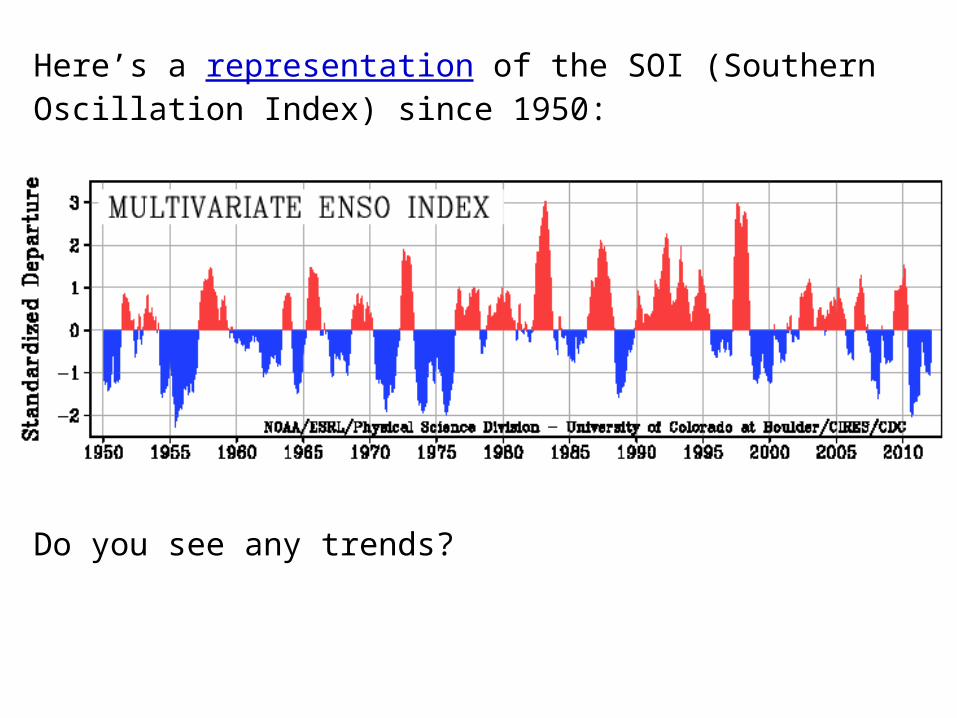
Here’s a representation of the SOI (Southern Oscillation Index) since 1950:
Do you see any trends?
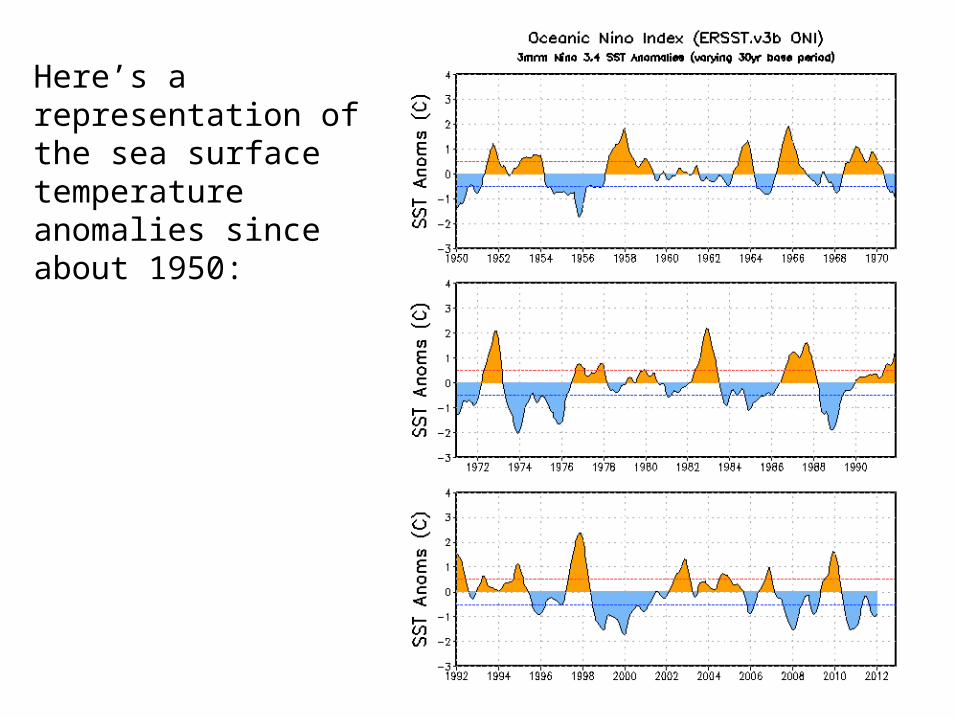
Here’s a representation of the sea surface temperature anomalies since about 1950:
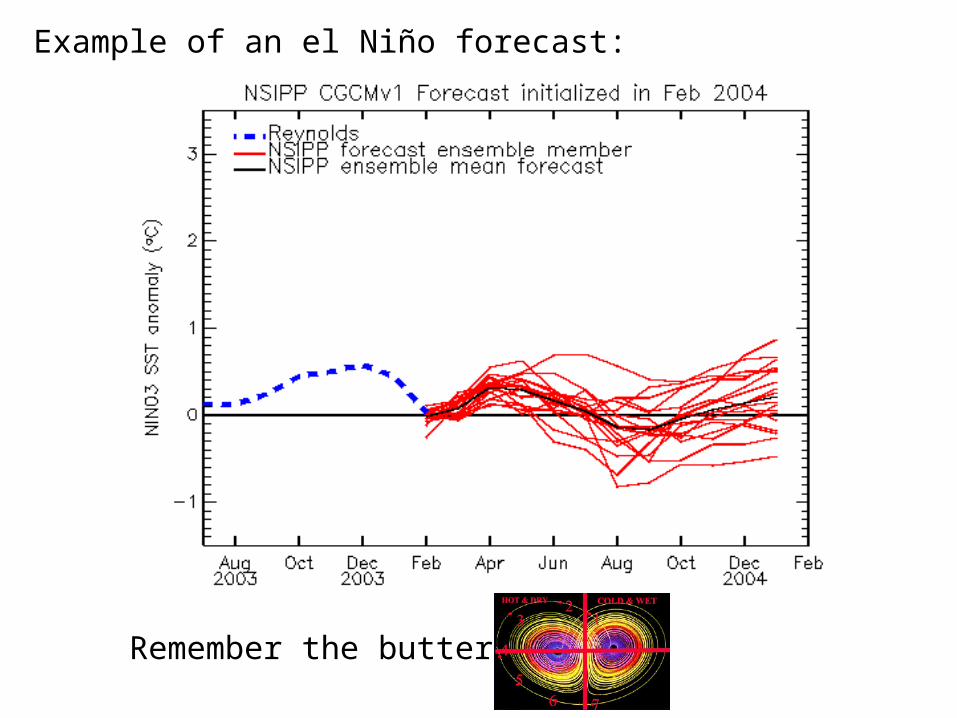
Example of an el Niño forecast:
Remember the butterfly!
On the topic of future el Niños and global warming, the best I can do is summarize information (8-9 years old, but still good) from Kessler:
“Some say that the string of warm events during the 1990s are evidence that a general warming trend is starting to change the weather; others say that these variations are within normal limits.”
“We won't have good statistics about El Niño for another hundred years or so, perhaps even longer if it is truly chaotic.”
“One way that a general global warming could affect El Niño is through the sensitivity of tropical deep convection (organized thunderstorms involving strong upward motion over large regions) to the water temperature beneath.”
“At around 27.5°C (81.5°F) [convection] suddenly becomes much more efficient.”
“Since there are large regions of water with temperature close to 27.5°C (either slightly warmer or slightly cooler), even a small general temperature change could produce large changes in the area in which convection takes place.”“A mere one-half degree uniform increase could therefore produce a significant change in the amount of tropical convection, perhaps making the normal state appear more like El Niño.”
“Tropical convection thus has the potential to amplify the disruption of global climate, perhaps far out of proportion to a seemingly small temperature change.”
“So, while the values of temperature rise proposed in the global warming debate appear small, in the sense that in daily life a 1-2 degree change hardly matters, the danger lies in the reorganization of the large nonlinear systems that regulate the entire weather machine.”“There may well be feedbacks that would damp out some of these influences on the tropical convection process (or possibly amplify them even more). I don't know and I don't think anyone does.”
“No one should argue that because the overall values of temperature change seem small, or that a computer model of the effects of greenhouse warming may be wrong by a significant percentage, the effect on human society could not be drastic.”
This web page is a good source of information about recent Pacific Ocean changes (link dead 2012).
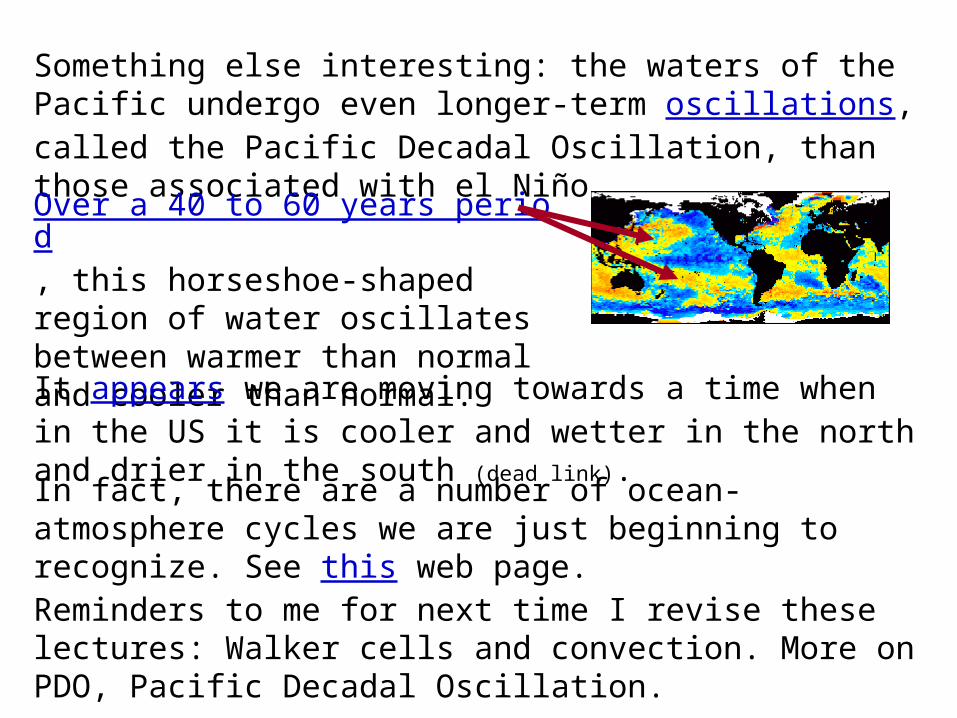
Something else interesting: the waters of the Pacific undergo even longer-term oscillations, called the Pacific Decadal Oscillation, than those associated with el Niño.Over a 40 to 60 years period, this horseshoe-shaped region of water oscillates between warmer than normal and cooler than normal.It appears we are moving towards a time when in the US it is cooler and wetter in the north and drier in the south (dead link).In fact, there are a number of ocean-atmosphere cycles we are just beginning to recognize. See this web page.Reminders to me for next time I revise these lectures: Walker cells and convection. More on PDO, Pacific Decadal Oscillation.
2http://www.aoml.noaa.gov/general/enso_faq/ 1http://www.pmel.noaa.gov/~kessler/occasionally-asked-questions.html
3http://www.pmel.noaa.gov/tao/elnino/nino-home.html
http://www.usatoday.com/weather/resources/askjack/wfaqnino.htm
http://www.elnino.noaa.gov/
http://www.pmel.noaa.gov/tao/elnino/faq.html
http://www.bom.gov.au/lam/climate/levelthree/analclim/elnino.htm
4http://www.enn.com/specialreports/elnino/history.asp
http://gcmd.gsfc.nasa.gov/Resources/FAQs/elnino.html
el Niño FAQ’s
http://sealevel.jpl.nasa.gov/elnino/index.html
http://www.cdc.noaa.gov/ENSO/
http://www.vision.net.au/~daly/elnino.htm
Rossby waves
http://www.oce.orst.edu/po/research/rossby_waves/chelton.html
http://www.bangor.ac.uk/~oss110/oxp2003/lecture9.pdf
http://www.pmel.noaa.gov/~kessler/jclim95-abstract.html
Kelvin waves
http://sealevel.jpl.nasa.gov/elnino/970425.html
http://topex-www.jpl.nasa.gov/aviso/text/general/discover/results/kel_defn.htm