Embed Size (px)
Citation preview

A Research Use Only Validation Report for
HTG EdgeSeq Pan B-Cell Lymphoma Panel

HTG EdgeSeq Pan B-Cell Lymphoma Panel
For Research Use Only. Not for use in diagnostic procedures. All trademarks are the property of HTG Molecular and its subsidiaries unless otherwise specified.
HTG Molecular Diagnostics, Inc. 3430 E Global Loop, Tucson, AZ 85706 www.htgmolecular.com, 877.289.2615
Page 2 of 14 Rev 3: 19-OCT-2020
A Research Use Only Validation Report for HTG EdgeSeq Pan B-Cell Lymphoma Panel Table of Contents
LIST OF DEFINTIONS .................................................................................................................................................................... 3 VALIDATION REPORT PURPOSE.................................................................................................................................................. 3 PRODUCT OVERVIEW .................................................................................................................................................................. 3 PROBE DESIGN QUALITY CONTROL ......................................................................................................................................................... 4 PROBE LINEARITY AND SAMPLE INPUT ...................................................................................................................................... 4 QUALITY CONTROL STUDY ......................................................................................................................................................................... 5 PRECISION STUDY ....................................................................................................................................................................... 8 KIT CONFIGURATION STUDY..................................................................................................................................................... .11 HTG EDGESEQ PAN B-CELL LYMPHOMA PANEL PERFORMANCE SUMMARY ................................................................................ .11
HTG EDGESEQ REVEAL DLBCL CELL OF ORIGIN SIGNATURE VERIFICATION ....................................................................... 12 REFERENCES .............................................................................................................................................................................. 14
List of Tables Table 1. Samples Used for Probe Linearity and Sample Input ............................................................................................................ 4 Table 2. Summary of Lc Values ......................................................................................................................................................... 5 Table 3. QC Metrics Summary ......................................................................................................................................................................... 8 Table 4. Study Design....................................................................................................................................................................... 9 Table 5. Samples.............................................................................................................................................................................. 9 Table 6. Summary of Lc Values for Overall Precision ......................................................................................................................... 9 Table 7. Summary of Lc Values for Intra-Plate Variability .................................................................................................................... 9 Table 8. Summary of Lc Values for Inter-lot Variability ...................................................................................................................... 10 Table 9. Summary of Lc Values for Inter-Processor/ Inter-Operator Variability ................................................................................... 10 Table 10. Summary of Lc Values ..................................................................................................................................................... 11
List of Figures Figure 1. Overview of the HTG EdgeSeq workflow ............................................................................................................................. 3 Figure 2. The Lc values at each sample input level ............................................................................................................................ 5 Figure 3. %POS by sample ............................................................................................................................................................... 6 Figure 4. ICC for sample repeatability related to sample total read depth ............................................................................................ 7 Figure 5. RSD for each sample/ replicate at different EDTA concentrations. ........................................................................................ 8 Figure 6. Probe Precision by %CV .................................................................................................................................................. 11
Figure 7. Verification workflow for development of the HTG EdgeSeq Reveal Cell of Origin Signature ............................................... 12 Figure 8. Accuracy of the HTG EdgeSeq Reveal DLBCL Cell of Origin Signature ............................................................................. 13 Figure 9. Example visual output from the HTG EdgeSeq Reveal DLBCL Cell of Origin Signature ...................................................... 13

HTG EdgeSeq Pan B-Cell Lymphoma Panel
For Research Use Only. Not for use in diagnostic procedures. All trademarks are the property of HTG Molecular and its subsidiaries unless otherwise specified.
HTG Molecular Diagnostics, Inc. 3430 E Global Loop, Tucson, AZ 85706 www.htgmolecular.com, 877.289.2615
Page 3 of 14 Rev 3: 19-OCT-2020
List of Definitions BLAST = Basic Local Alignment Search Tool CI = Confidence interval CPM = counts per million DLBCL = Diffuse Large B-Cell Lymphoma DNA = Deoxyribonucleic acid EDTA = Ethylenediaminetetraacetic acid ERCC = External RNA Controls Consortium FFPE = formalin-fixed, paraffin-embedded ICC = Intra-class correlation coefficient Lc = Lin’s correlation concordance coefficient LBO = Lysis Buffer Only MiSeq = Illumina MiSeq Sequencer mRNA = messenger RNA MTL = Multi-Tissue Lysate NPP = Nuclease Protection Probe POS = Positive Process Control QC = Quality Control qNPA = Quantitative Nuclease Protection Assay qNPS = HTG EdgeSeq qNPA RSD = Relative standard deviation RUO = Research Use Only S1 = S1 nuclease
Validation Report Purpose
The purpose of this report is to describe the five studies performed to establish and validate the performance of the HTG EdgeSeq Pan B-Cell Lymphoma Panel prior to release. These studies included: Probe QC, Probe Linearity and Sample Input, Quality Control Metrics Performance, Precision, and Kit Configuration Equivalency. This report also provides the results of each study that demonstrate the HTG EdgeSeq Pan B-Cell Lymphoma Panel is a robust and repeatable assay for the measurement of gene expression in FFPE samples.
Product Overview
The HTG EdgeSeq Pan B-Cell Lymphoma Panel is a Research Use Only (RUO) assay that was developed to measure mRNA expression levels of B-cell Lymphoma-related genes in FFPE samples within the HTG EdgeSeq system workflow. The HTG EdgeSeq system combines HTG’s proprietary quantitative nuclease protection assay (qNPA) chemistry with a next-generation sequencing (NGS)-based platform to enable the semi-quantitative analysis of a panel of targeted genes in a single assay (Figure 1).
Figure 1. Overview of the HTG EdgeSeq workflow. Functional DNA nuclease protection probes (NPPs) are hybridized to target mRNAs. S1 nuclease is added to digest excess non-hybridized DNA probes and non-hybridized mRNA, leaving only NPPs hybridized to mRNA fully intact and able to be amplified and barcoded. This produces essentially a 1:1 ratio of DNA detection probes to the mRNA initially targeted in the sample. mRNA is digested, and the NPPs are quantified by NGS.
The HTG EdgeSeq Pan B-Cell Lymphoma Panel contains 316 NPPs that measure gene expression counts of target genes, specifically 298 genes, ten internal process control (ERCC) probes, four internal positive controls (POS), and four internal negative controls

HTG EdgeSeq Pan B-Cell Lymphoma Panel
For Research Use Only. Not for use in diagnostic procedures. All trademarks are the property of HTG Molecular and its subsidiaries unless otherwise specified.
HTG Molecular Diagnostics, Inc. 3430 E Global Loop, Tucson, AZ 85706 www.htgmolecular.com, 877.289.2615
Page 4 of 14 Rev 3: 19-OCT-2020
(ANTs). A fully annotated gene list for this assay can be accessed on the support section of our website at https://www.htgmolecular.com/assays/pan-b.
Probe Design Quality Control NPPs were designed using HTG’s proprietary design software as 50-mer DNA sequences. These sequences are targeted to gene transcripts and their specificity assessed in silico by BLASTing the probe sequences against the entire human transcriptome. Subsequently, the probes were synthesized, pooled, purified, and a quality control study was executed using the final probe mix. In this study, the HTG EdgeSeq Pan B-Cell Lymphoma Panel probes were assessed for the presence of all NPPs, correct sequences of all NPPs and alignment, relative concentrations of all NPPs, ability of all NPPs to undergo S1 nuclease digestion, and assessment of highly expressed probes. Probe performance was also assessed within a titration series of a multi-tissue lysate (MTL).
Results for each of the five assessments listed above are as follows:
1. Probe Presence
All 316 probes were detected by the sequencer and were determined to be present in the probe mix.
2. Probe Alignment Percentage A pool of all NPPs was evaluated by aligning counts across the 50-mer NPP sequence, allowing for either zero or two base mismatches. The average relative alignment percentage for the 316 probes in the pool ranged between 77% and 93% (median was 91%). These results demonstrate the high sequencing fidelity of the NPPs in this assay.
3. Relative NPP Concentrations
The relative amount of the probes in the probe solution was estimated via the fitting of a Gaussian mixture model, which revealed a well-balanced probe pool with expected probe concentration distribution.
4. S1 Sensitivity of All NPP
The resistance of each target probe to S1 enzyme digestion was assessed using lysis buffer only (LBO) samples. There are no target probes within the HTG EdgeSeq Pan B-Cell Lymphoma Panel that display significant resistance to S1 nuclease digestion.
5. Assessment of highly expressed probes
Biological samples were utilized to determine if any individual probes were taking up an inordinate number of reads. No NPPs consumed more than 5% of total reads, with the exception of one probe in one sample type that garnered 6.3% of total sample reads.
The results from this study collectively demonstrate that all probes are present in the probe solution and are present in relative equivalent concentrations. All NPPs generated high sequencing fidelity, and no probes were identified as resistant to S1 nuclease digestion. Lastly, no probes were highly expressed at a level which would negatively impact the ability to detect low-expressing genes. Overall, the results of this Probe Design QC study show that the design and performance of the probes in the HTG EdgeSeq Pan B- Cell Lymphoma Panel are robust and suitable for use in this RUO assay.
Probe Linearity and Sample Input Nuclease protection probe response in relation to sample input titration was assessed to confirm probe response linearity. Parsed data from a pooled FFPE titration series (Table 1) were visualized by pairwise scatterplots of log2-transformed probe counts versus log2- transformed sample input. Based on these data, the linear range for all probes was determined to be between sample inputs of 1.5 – 24 mm2 / 35 µL. All probes displayed expected linear performance with decreasing sample input. The probe linearity results suggest that the HTG EdgeSeq Pan B-Cell Lymphoma Panel probes design is robust.
Table 1. Samples Used for Probe Linearity and Sample Input
Sample Type Indications in Pool Sample Input per qNPS Reaction Replicates
FFPE
Diffuse large B-cell lymphoma (3)
0.1875 – 24 μL / 35 μL 4 for each of 8
Titration Points
HTG EdgeSeq Pan B-Cell Lymphoma Panel
For Research Use Only. Not for use in diagnostic procedures. All trademarks are the property of HTG Molecular and its subsidiaries unless otherwise specified.
HTG Molecular Diagnostics, Inc. 3430 E Global Loop, Tucson, AZ 85706 www.htgmolecular.com, 877.289.2615
Page 5 of 14 Rev 3: 19-OCT-2020
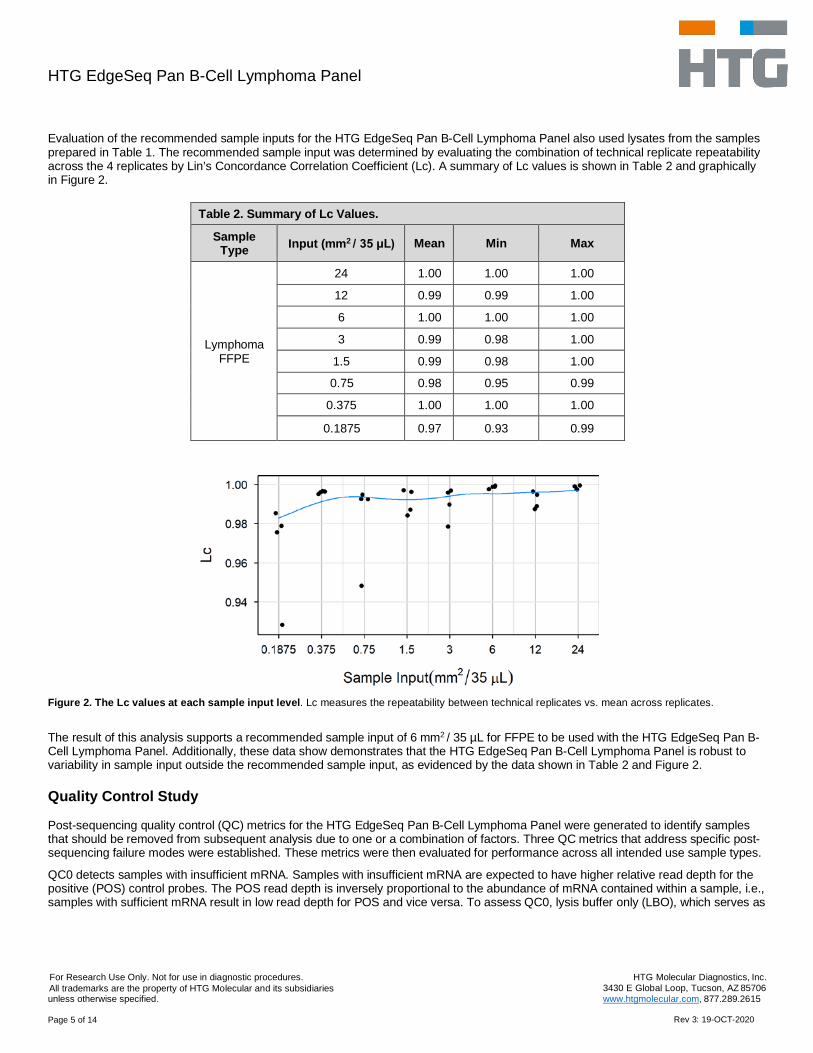
Evaluation of the recommended sample inputs for the HTG EdgeSeq Pan B-Cell Lymphoma Panel also used lysates from the samples prepared in Table 1. The recommended sample input was determined by evaluating the combination of technical replicate repeatability across the 4 replicates by Lin’s Concordance Correlation Coefficient (Lc). A summary of Lc values is shown in Table 2 and graphically in Figure 2.
Table 2. Summary of Lc Values.
Sample Type Input (mm2 / 35 μL) Mean Min Max
Lymphoma FFPE
24 1.00 1.00 1.00
12 0.99 0.99 1.00
6 1.00 1.00 1.00
3 0.99 0.98 1.00
1.5 0.99 0.98 1.00
0.75 0.98 0.95 0.99
0.375 1.00 1.00 1.00
0.1875 0.97 0.93 0.99
Figure 2. The Lc values at each sample input level. Lc measures the repeatability between technical replicates vs. mean across replicates.
The result of this analysis supports a recommended sample input of 6 mm2 / 35 µL for FFPE to be used with the HTG EdgeSeq Pan B- Cell Lymphoma Panel. Additionally, these data show demonstrates that the HTG EdgeSeq Pan B-Cell Lymphoma Panel is robust to variability in sample input outside the recommended sample input, as evidenced by the data shown in Table 2 and Figure 2.
Quality Control Study
Post-sequencing quality control (QC) metrics for the HTG EdgeSeq Pan B-Cell Lymphoma Panel were generated to identify samples that should be removed from subsequent analysis due to one or a combination of factors. Three QC metrics that address specific post- sequencing failure modes were established. These metrics were then evaluated for performance across all intended use sample types.
QC0 detects samples with insufficient mRNA. Samples with insufficient mRNA are expected to have higher relative read depth for the positive (POS) control probes. The POS read depth is inversely proportional to the abundance of mRNA contained within a sample, i.e., samples with sufficient mRNA result in low read depth for POS and vice versa. To assess QC0, lysis buffer only (LBO), which serves as

HTG EdgeSeq Pan B-Cell Lymphoma Panel
For Research Use Only. Not for use in diagnostic procedures. All trademarks are the property of HTG Molecular and its subsidiaries unless otherwise specified.
HTG Molecular Diagnostics, Inc. 3430 E Global Loop, Tucson, AZ 85706 www.htgmolecular.com, 877.289.2615
Page 6 of 14 Rev 3: 19-OCT-2020
an experimental insufficient mRNA sample was added to a number of wells of an HTG EdgeSeq sample plate. These wells have no mRNA and thus have most reads directed to the POS probes.
QC1 detects samples with insufficient read depth, given that total counts per sample vary according to the sample size in each plate. Samples that fail to meet the established read depth requirement are excluded from further analysis. Assessment of QC1 is performed by down-sampling of the post-sequencing parsed data, where the number of reads is computationally reduced to simulate decreasing read depth for a given sample.
QC2 detects samples with low variation of counts across probes not reflective of biological expression variability using relative standard deviation (RSD) of log2-transformed counts of all genes of the Pan B-Cell Lymphoma Panel. The control probes are not included in the calculation of the RSD. The QC2 metric is established by inducing insufficient biological variability through the use of S1 nuclease inhibition by the addition of EDTA.
1. QC0 Establishment The QC0 metric was developed to detect samples with insufficient RNA. Samples with insufficient RNA tend to have little or no real biological signal. Each sample was evaluated by the percentage of read depth allocated to the four positive controls probes (POS) within the sample. Figure 3 addresses percent POS for FFPE samples run at standard sample input along with the LBOs. There is greater spread in percent POS in the LBOs due to higher background in those wells, resulting in more reads being distributed to all genes rather than just to the POS probes. Observations which have been flagged as either QC1 or QC2 failures using this report’s recommended cutoffs are colored a lighter shade and were not considered in the establishment of the QC0 cutoff.
Based on these results, the recommended cutoff is no more than 60% of reads can be allocated to the POS probes. A cutoff of 60% POS results in detection of greater than 99% of LBO samples (with all QC metrics applied) without failing any “true” samples that did not fail other QC metrics. Any sample replicate (well) resulting in greater than or equal to 60% of total reads allocated to POS probes is flagged as a QC0 failure.
Figure 3. %POS by sample. Includes all FFPE observations run at standard sample input and input titrations. The space between the red dotted lines represents the range of %POS cutoffs considered in this study.
2. QC1 Establishment The QC1 metric was developed to detect samples with insufficient read depth. These failures are typically caused by dilution or library pooling errors. FASTQ files were “down-sampled,” or reduced such that they contained a random subset of fewer reads. The result of this down-sampling is a single sample that may be viewed at different read depths. Sequencing data from four FFPE samples, run in triplicate at standard input (6mm2/35µl), were used for this assessment. A range of 10,000 to 400,000 reads per sample was used. After the down-sampling was performed, the resulting FASTQ files were parsed. A

HTG EdgeSeq Pan B-Cell Lymphoma Panel
For Research Use Only. Not for use in diagnostic procedures. All trademarks are the property of HTG Molecular and its subsidiaries unless otherwise specified.
HTG Molecular Diagnostics, Inc. 3430 E Global Loop, Tucson, AZ 85706 www.htgmolecular.com, 877.289.2615
Page 7 of 14 Rev 3: 19-OCT-2020
log2 CPM (Counts Per Million) of the parsed data was used to investigate the effect of the read depth on sample repeatability.
Typically, as the read depth decreases (i.e., fewer reads are allocated to individual probes for a sample), the repeatability decreases. The QC1 cutoff was chosen at the read depth for which acceptable repeatability was observed for probes measuring low expressed (bottom of the range) genes. Probe repeatability was measured by intra-class correlation coefficient (ICC) through a mixed effect model. Sample repeatability was investigated using probes below the 20th, 30th, and 40th expression level percentiles of average expression, as well as all probes. Figure 4 demonstrates that as read depth increases, sample repeatability also increases. However, no additional improvement in repeatability was identified for read depths greater than about 100,000. It should be noted that data at a lower read depth is not necessarily unusable, but repeatability of the measurement of low expressing genes may be impacted. Based on these results, a QC1 cutoff of 100,000 aligned reads is recommended. Any sample well with less than or equal to 100,000 aligned reads is flagged as a QC1 failure.
Figure 4. ICC for sample repeatability related to sample total read depth. Relationship between read depth and repeatability between technical replicates within a sample (measured using ICC) is plotted for 4 FFPE samples. Different bottom percentiles of the 298 target probes (all, 40%, 30%, 20%), which were used for determining ICC, are colored differently.

HTG EdgeSeq Pan B-Cell Lymphoma Panel
For Research Use Only. Not for use in diagnostic procedures. All trademarks are the property of HTG Molecular and its subsidiaries unless otherwise specified.
HTG Molecular Diagnostics, Inc. 3430 E Global Loop, Tucson, AZ 85706 www.htgmolecular.com, 877.289.2615
Page 8 of 14 Rev 3: 19-OCT-2020
3. QC2 Establishment
The QC2 metric detects samples with minimal expression variability across probes. These failures would typically be caused by S1 nuclease failure, processing errors, and under some circumstances, may point to sample related issues. Relative standard deviation (RSD) was used to assess the level of variation in expression throughout a sample. For each sample replicate (well), RSD is computed as:
𝑠𝑠 𝑅𝑅𝑅𝑅𝑅𝑅 = 𝑥𝑥𝑥
where s and 𝑥𝑥𝑥 are the standard deviation and mean of log2(count+2), respectively. Less variation corresponds to a smaller RSD. Small RSD suggests that the level of variability typically seen in a biological specimen is not represented in the sequencing data generated for a sample, and the data likely does not represent true biological expression variability. The QC2 cutoff was chosen at the minimum RSD values at the point that S1 nuclease activity is inhibited.
The addition of EDTA at 6 mM results in a bimodal RSD distribution, relative to samples with lower or no EDTA. These samples exhibit higher RSD values, as shown in Figure 5. This is caused by differences in expression variability – samples with no EDTA or lower EDTA concentrations demonstrate expression variability that is not present in samples with an EDTA concentration of 6 mM due to full inhibition of the S1 nuclease activity. Based on these results, a QC2 cutoff at 0.082 is recommended. Any sample replicate (well) with an RSD value less than or equal to 0.082 is flagged as a QC2 failure.
Figure 5. RSD for each sample/ replicate at different EDTA concentrations. The y-axis has upper bound set to 0.3 to more closely view the RSD region of interest. This excludes several observations which are not pertinent to QC2.
Table 3 summarizes the three post-processing QC metrics for the HTG EdgeSeq Pan B-Cell Lymphoma Panel.
Table 3. QC Metrics Summary Metric Corresponding Failure Mode QC Failure by Cutoff
QC0 Insufficient RNA 60% or more reads allocated to POS
QC1 Insufficient Read Depth 100,000 or less
QC2 Insufficient Expression Variability RSD equal to or lower than 0.082

HTG EdgeSeq Pan B-Cell Lymphoma Panel
For Research Use Only. Not for use in diagnostic procedures. All trademarks are the property of HTG Molecular and its subsidiaries unless otherwise specified.
HTG Molecular Diagnostics, Inc. 3430 E Global Loop, Tucson, AZ 85706 www.htgmolecular.com, 877.289.2615
Page 9 of 14 Rev 3: 19-OCT-2020
Precision Study This study was performed to assess the precision of multiple lots of the HTG EdgeSeq Pan B-Cell Lymphoma Panel, multiple operators and HTG EdgeSeq processors, multiple days, and sample replicates. Five identical plates were run by three different operators on three different HTG EdgeSeq processors with three manufacturing lots of Pan B-Cell Lymphoma Panel probe mix to evaluate the assay’s precision (Table 4).
Table 4. Study Design Plate/Run Operator Processor Lot
1 1 1 1 2 2 2 1 3 3 3 1 4 1 1 2 5 1 1 3
Lc values from 16 separate samples (Table 5) were analyzed with a focus on overall precision, intra-plate variability, inter-lot variability, and inter-processor/inter-operator variability and inter-replicate/within run variability (repeatability).
Table 5. Samples
Sample Type Sample Size (N) Indications Sample Input per qNPS Reaction Replicates/Plate Total
Replicates/Sample
FFPE
9 DLBCL
6 mm2 / 35 µL
5
25 1 Primary Mediastinal B- cell Lymphoma
3 Mantle Cell Lymphoma 3 Burkitt’s Lymphoma
The mean overall Lc value was 0.977 (Table 6).
Table 6. Summary of Lc Values for Overall Precision
Sample Type Mean Minimum Maximum FFPE 0.977 0.580 0.998
The five qNPS plates were processed using the same sample layout. Fresh lysates were prepared for each of the plates. Intra-plate variability displayed a high level of concordance, with an average mean Lc value of 0.985 (Table 7). In general, replicates near a QC cutoff border may result in lower correlation between replicates, as seen in the minimum Lc values for some replicates. These minimum values represent single outliers, as noted by comparison to the high mean values.
Table 7. Summary of Lc Values for Intra-Plate Variability
Plate Mean Minimum Maximum
Plate1 0.990 0.734 0.999
Plate2 0.962 0.590 0.999 Plate3 0.994 0.928 0.999 Plate4 0.993 0.956 0.999
Plate5 0.988 0.900 0.998
Mean = 0.985 95% CI around the overall mean Lc: [0.878, 0.999]

HTG EdgeSeq Pan B-Cell Lymphoma Panel
For Research Use Only. Not for use in diagnostic procedures. All trademarks are the property of HTG Molecular and its subsidiaries unless otherwise specified.
HTG Molecular Diagnostics, Inc. 3430 E Global Loop, Tucson, AZ 85706 www.htgmolecular.com, 877.289.2615
Page 10 of 14 Rev 3: 19-OCT-2020
Three formulation lots of HTG EdgeSeq Pan B-Cell Lymphoma Panel probes were manufactured to measure the variability across multiple lots. Table 8 displays that there is high concordance, and multiple formulation lots produce equivalent results.
Table 8. Summary of Lc Values for Inter-lot Variability
Lot Pair Mean Minimum Maximum
Lot1 vs Lot2 0.994 0.970 0.999
Lot1 vs Lot3 0.992 0.976 0.995
Lot2 vs Lot3 0.993 0.989 0.997
Mean=0.993 with 95% CI around the overall mean Lc: [0.978, 0.998]
Inter-processor and inter-operator variability were analyzed together to assess their contribution to the precision of the assay. Three operators and three processors were utilized, and the results are displayed in Table 9. As above, the minimum values represent single outliers, as noted by comparison to the high mean values.
Table 9. Summary of Lc Values for Inter-Processor/ Inter-Operator Variability
Proc Pair Mean Minimum Maximum Proc1 vs Proc2 0.972 0.798 0.996 Proc1 vs Proc3 0.969 0.921 0.997 Proc2 vs Proc3 0.973 0.818 0.997
Mean=0.972 with 95% CI around the overall mean Lc: [0.836, 0.996] The sum of the results of the precision study demonstrates that there is high overall concordance (Lc=0.977) between assay results generated across multiple plates, probe lots, and operators/processors, and the assay demonstrates acceptable precision across multiple B-cell Lymphoma indications tested.
In addition to the assay repeatability, the probe level precision was analyzed by visualizing the %CV and mean expression for each probe in all 16 samples across all replicates in Figure 6. Probes with median to high expression had less than 20% CV. Only a small

HTG EdgeSeq Pan B-Cell Lymphoma Panel
For Research Use Only. Not for use in diagnostic procedures. All trademarks are the property of HTG Molecular and its subsidiaries unless otherwise specified.
HTG Molecular Diagnostics, Inc. 3430 E Global Loop, Tucson, AZ 85706 www.htgmolecular.com, 877.289.2615
Page 11 of 14 Rev 3: 19-OCT-2020
portion of probes, those with reads less than 5 log2(CPM), had more than 20% CV, indicating that for probes that have adequate signal, the probe-level precision is excellent.
Figure 6. Probe Precision by %CV. The precision of each probe across all 16 samples from the precision study is shown. Probes with very low counts (under 5 log2(CPM)) do show increased variability; however, at higher counts, the precision is excellent.
Kit Configuration Study
The HTG EdgeSeq Pan B-Cell Lymphoma Panel is available in 8-, 24-, and 96-sample configurations. All kit configurations were validated on the Illumina MiSeq sequencer to meet the per sample read depth of 100,000.
To assess the equivalency of results obtained from each configuration, libraries were generated in a 96-well configuration, then were pooled and sequenced in all three configurations. Inter-well comparisons between the libraries run in the 8-well configurations (24 total samples) were compared to the same libraries run in both the 24- and 96-well configurations. Table 10 summarizes the results of the Kit Configuration Study. Mean Lc values range from 0.98 for the 8-well to 96-well comparison to 0.99 to 1 for the 8- to 24- well and 24- to 96- well comparison. The results of this study show that comparable results are obtained on the Illumina MiSeq regardless of the kit configuration used.
Table 10. Summary of Lc Values
Configuration Mean Lc 96 vs 24 0.99 96 vs 8 0.98 24 vs 8 0.99
HTG EdgeSeq Pan B-Cell Lymphoma Panel Performance Summary Development and validation of the HTG EdgeSeq Pan B-Cell Lymphoma Panel consisted of studies designed to address probe performance, recommend sample input, establish quality control metrics, measure assay precision, and validate kit configuration equivalency. The data presented in this assay validation report confirm that the design and performance of the HTG EdgeSeq Pan B- Cell Lymphoma Panel is robust and can reproducibly assess gene expression levels in FFPE samples that have been processed at the recommended sample input.

HTG EdgeSeq Pan B-Cell Lymphoma Panel
For Research Use Only. Not for use in diagnostic procedures. All trademarks are the property of HTG Molecular and its subsidiaries unless otherwise specified.
HTG Molecular Diagnostics, Inc. 3430 E Global Loop, Tucson, AZ 85706 www.htgmolecular.com, 877.289.2615
Page 12 of 14 Rev 3: 19-OCT-2020
HTG EdgeSeq Reveal Cell of Origin Signature Verification Background This section of the report will address the development, verification and implementation of the HTG EdgeSeq Reveal Cell of Origin (COO) Signature, for use with Diffuse Large B-Cell Lymphoma (DLBCL) FFPE tissue samples. DLBCL is the most commonly occurring non-Hodgkin lymphoma, accounting for approximately 30% of cases worldwide1. DLBCL is routinely classified by cell of origin, with germinal center B-cell (GCB) being more common and indicating better prognosis whereas Activated B-cell (ABC) is less common and associated with substantially worse outcome when treated with standard chemotherapy. Because of the differences in outcome to treatment response, a significant portion of research has been focused on understanding the molecular differences between these two DLBCL subtypes. Methodologies currently implemented to determine the cell of origin for DLBCL are immunohistochemistry (IHC) based, which require 3 or more FFPE tissue slides per test. Because of this, there is a need for a tool that researchers can use to understand a sample’s cell of origin while using less sample. Here we introduce the HTG EdgeSeq Reveal DLBCL COO Signature which is based on gene expression profiling. This is a Research Use Only (RUO) signature intended to determine the predicted probability that a sample is a GCB subtype, using data generated from the HTG EdgeSeq Pan B-Cell Lymphoma Panel with less sample input.
Development and Verification of the Signature To verify that the HTG EdgeSeq Reveal DLBCL COO Signature is biologically relevant, it was evaluated for accuracy by comparison to the previously released HTG EdgeSeq DLBCL COO Classifier. The HTG EdgeSeq DLBCL COO Classifier is a previously released CE-IVD product that generates predicted probability scores, which are used to categorize samples as ABC, GCB or unclassified. The HTG EdgeSeq DLBCL COO Classifier was developed and verified using two well documented IHC ‘gold-standard’ tests, the Choi2 and Visco-Young3 algorithms. Comparison of the HTG EdgeSeq DLBCL COO Signature to the Choi and Visco-Young algorithms showed an overall percent agreement of 87.5% and 75.8%, respectively. These findings show good correlation of the Classifier output and are consistent with the literature, that IHC often produces lower than expected agreement to gene expression-based signatures. This is often attributed to several factors including variability in the IHC staining process, reader-to-reader variability, pathology interpretation and smaller total number of analytes.
Ninety-five FFPE tissue samples from patients previously diagnosed with DLBCL were tested on both the HTG EdgeSeq Pan-B Cell Lymphoma Panel and the HTG EdgeSeq DLBCL COO Assay for a direct comparison. As a Research Use Only offering, the new HTG EdgeSeq Reveal DLBCL COO Signature described here will only calculate the predicted probability that a sample is GCB and it will not classify a sample as ABC, GCB or unclassified. Therefore, predicted probability scores were generated, as seed in Figure 7, for both the reference (HTG EdgeSeq DLBCL COO Classifier) and test (HTG EdgeSeq Reveal DLBCL COO Signature).
Figure 7. Verification workflow for development of the HTG EdgeSeq Reveal COO Signature. Reference predicted probability of GCB was generated using the previously released HTG EdgeSeq DLBCL COO Classifier and compared to predicted probability of the HTG EdgeSeq Reveal DLBCL COO Signature.
Lin’s concordance correlation coefficient (Lc) was used to measure concordance and Passing-Bablok (PB) regression was used to evaluate accuracy by estimating constant or proportional biases between the test (PanB Pr) and reference (DLBCL Pr) predicted probability scores. The results show a Lc of 0.99 suggesting a high degree of correlation between the two COO predictors. The estimated PB slope is 0.998 and the estimated intercept is 0.022, as shown in Figure 8. The intercept close to 0 and slope close to 1 suggest there are no constant or proportional biases between the predicted and reference COO scores.

HTG EdgeSeq Pan B-Cell Lymphoma Panel
For Research Use Only. Not for use in diagnostic procedures. All trademarks are the property of HTG Molecular and its subsidiaries unless otherwise specified.
HTG Molecular Diagnostics, Inc. 3430 E Global Loop, Tucson, AZ 85706 www.htgmolecular.com, 877.289.2615
Page 13 of 14 Rev 3: 19-OCT-2020
Figure 8. Concordance of the HTG EdgeSeq Reveal DLBCL Cell of Origin Signature. The scatter plot and Passing Bablok fitting of predicted probabilities from the HTG EdgeSeq DLBCL COO (DLBCL; reference) and HTG EdgeSeq Pan B-cell Lymphoma Panel (PanB; test). The y-axis shows the predicted probability for PanB (PanB Pr) and the x-axis shows the predicted probability for DLBCL (DLBCL Pr).
To ensure the new signature is compatible with the established QC metrics for the HTG EdgeSeq Pan B-Cell Lymphoma Panel, a simulation analysis was executed. This analysis confirmed that existing QC metrics are appropriate for the HTG EdgeSeq DLBCL COO signature for use with the HTG EdgeSeq Pan B-Cell Lymphoma Panel.
Implementation to Reveal The DLBCL COO signature is applied using the HTG EdgeSeq Reveal software. The HTG EdgeSeq Reveal software is a fully integrated web-based data analysis software suite that can analyze data quality, generate publication quality figures and apply the HTG EdgeSeq Reveal DLBCL COO signature. When HTG EdgeSeq Pan B-Cell Lymphoma Panel data are loaded into the Reveal software a new tab will appear, titled ‘DLBCL Cell of Origin.’ Clicking on this tab will generate an interactive table and chart to help visualize the predicted probability scores. Data can also be exported in Excel format to facilitate further data analysis by researchers (Figure 9). The output of the signature is a score from 0 to 1 with 1 representing a 100% probability that a sample is GCB.

HTG EdgeSeq Pan B-Cell Lymphoma Panel
For Research Use Only. Not for use in diagnostic procedures. All trademarks are the property of HTG Molecular and its subsidiaries unless otherwise specified.
HTG Molecular Diagnostics, Inc. 3430 E Global Loop, Tucson, AZ 85706 www.htgmolecular.com, 877.289.2615
Page 14 of 14 Rev 3: 19-OCT-2020
Figure 9. Example visual output from the HTG EdgeSeq Reveal DLBCL Cell of Origin Signature. The HTG EdgeSeq Reveal software generates an interactive table and chart to help visualize the predicted probability scores generated using the HTG EdgeSeq Pan B-Cell Lymphoma Panel data.
Summary This section highlighted the development and verification of the HTG EdgeSeq Reveal DLBCL COO Signature, which uses data generated from the HTG EdgeSeq Pan B-Cell Lymphoma Panel. The reference score used to evaluate the performance of this signature was developed using two well documented IHC ‘gold-standard’ tests. The reference score, the HTG EdgeSeq DLBCL COO Classifier, was then compared to the test HTG EdgeSeq DLBCL COO Signature and the results showed a Lc of 0.99 between the test and reference, suggesting a high degree of correlation between the two COO predictors. The estimated PB has an intercept close to 0 and slope close to 1, suggesting no constant or proportional biases between the predicted and reference COO scores. Overall, the data presented here show the HTG EdgeSeq Reveal DLBCL COO Signature is an accurate predictor of the probability that a sample is GCB.
References 1. Morton LM, Turner JJ, Cerhan JR, Linet MS, Treseler PA, Clarke CA, et al. Proposed classification of lymphoid neoplasms for
epidemiologic research from the Pathology Working Group of the International Lymphoma Epidemiology Consortium (InterLymph). Blood. (2007) 110:695–708.
2. Choi WW, Weisenburger DD, Greiner TC, et al. A new immunostain algorithm classifies diffuse large B-cell lymphoma into molecular subtypes with high accuracy. Clin Cancer Res. 2009;15(17):5494-5502.
3. Visco C, Li Y, Xu-Monette ZY, et al. Comprehensive gene expression profiling and immunohistochemical studies support application of immunophenotypic algorithm for molecular subtype classification in diffuse large B-cell lymphoma: a report from the International DLBCL Rituximab-CHOP Consortium Program Study [published correction appears in Leukemia. 2014 Apr;28(4):980]. Leukemia. 2012;26(9):2103-2113.