Embed Size (px)
Citation preview


HAWAII STATEWIDE TRANSPORTATION PLAN: HAWAII’S MULTI-MODAL AND INTER-MODAL NETWORK
VOLUME 2: ISSUE PAPERS
2011
TABLE OF CONTENTS
Issue Paper #1: Impact of Federal Planning Requirements (Eight Planning
Factors) Issue Paper #2: Climate Change and Sea Level Rise
Issue Paper #3: Aging Population and Transportation
Issue Paper #4 Fuel and Energy Scenarios for Hawai‘i
Issue Paper #5: Land Use Planning
Issue Paper #6: Planning & Design: Context Sensitive Solutions (CSS), Complete Streets, Smart Growth, and Transit Oriented Development (TOD)
Issue Paper #7: Transportation Security
Issue Paper #8: System Preservation and Asset Management
Issue Paper #9: Financial Scenarios
Issue Paper #10: Environmental Coordination


Issue Paper #1 Impact of Federal Planning Requirements
(Eight Planning Factors)
In Preparation for the Hawaii Statewide Transportation Plan Update
Prepared for Department of Transportation
State of Hawaii
Prepared by SSFM International, Inc. With HNTB
2011

Hawaii Statewide Transportation Plan Update Issue Paper on the Impact of Federal Planning Requirements (Eight Planning Factors)
-i-
Table of Contents
Foreword ..................................................................................................................................... 1
Section 1.0 Background .................................................................................................................. 3
Section 2.0 How the 2002 Hawaii Statewide Transportation Plan Treated the Planning Factors ..... 9
Section 3.0 Treatment of the Factors by the Transportation Planning Programs in Other States .. 13
Section 4.0 Consideration of the 8 Planning Factors in the Preparation for the HSTP Update ....... 19
Section 5.0 Implications of the 2010 Census to Statewide Transportation Planning ...................... 23
Section 6.0 Recommendations for Hawaii Statewide Transportation Plan Update ........................ 25
References ................................................................................................................................... 27
Appendices ................................................................................................................................... 29

Hawaii Statewide Transportation Plan Update Issue Paper on the Impact of Federal Planning Requirements (Eight Planning Factors)
-ii-

Hawaii Statewide Transportation Plan Update Issue Paper on the Impact of Federal Planning Requirements (Eight Planning Factors)
-1 -
Foreword The Hawaii state transportation planning process is being supported by the development of a series of issue papers. Task 7 of the contract requires examination of emerging issues that will have major impacts on Hawaii’s transportation future along with preparation of Issue Papers for each subject. The emerging issues for Hawaii’s transportation were selected by the Hawaii Statewide Transportation Plan Team as issues which may have a significant impact on Hawaii’s residents and their transportation needs. Many emerging issues are associated with the Federal Planning Requirements, changing trends, as well as shifts in public perception. This issue paper addresses the issue of the impact of Federal Planning Requirements, also known as the “Eight Planning Factors,” on transportation planning. SSFM is the lead consultant for the Hawaii Statewide Transportation Plan (HSTP) update, and they are supported by a team of consultants. This paper’s lead author is HNTB. This “Issue Paper on the Impact of Federal Planning Requirements (Eight Planning Factors)” includes sections on:
• Discussion on the history of the Planning Factors in federal transportation planning law; • How the 2002 Hawaii Statewide Transportation Plan (2002 HSTP) treated the planning
factors; • A review of other states’ treatment of the eight planning factors in their statewide
transportation plans; • Implications of the 2010 Census to HSTP Planning; and • Recommendations for the HSTP Update
Issue papers in this series include:
Issue Paper #1: Impact of Federal Planning Requirements (Eight Planning Factors) Issue Paper #2: Climate Change and Sea Level Rise Issue Paper #3: Aging Population and Transportation Issue Paper #4 Fuel and Energy Scenarios for Hawaii Issue Paper #5: Land Use Planning Issue Paper #6: Planning & Design: Context Sensitive Solutions (CSS), Complete Streets,
Smart Growth, and Transit Oriented Development (TOD) Issue Paper #7: Transportation Security Issue Paper #8: System Preservation and Asset Management Issue Paper #9: Financial Scenarios Issue Paper #10: Environmental Coordination

Hawaii Statewide Transportation Plan Update Issue Paper on the Impact of Federal Planning Requirements (Eight Planning Factors)
-2 -

Hawaii Statewide Transportation Plan Update Issue Paper on the Impact of Federal Planning Requirements (Eight Planning Factors)
-3 -
Section 1.0 Background The Federal Transportation Law known as the Safe, Accountable, Flexible Efficient Transportation Equity Act: Legacy for Users (SAFETEA-LU) of 2005 requires states to consider eight planning factors in development of their long-range transportation plans. While there are no requirements that these factors have to be evaluated in specific ways, states are expected to demonstrate that the eight planning factors have been taken into account in ways appropriate to the state, current trends, and anticipated conditions. To be clear, no two states have treated the eight planning factors in precisely the same ways, and neither the Federal Highway Administration (FHWA) nor the Federal Transit Administration (FTA) has been prescriptive about how states should treat the planning factors. Rather, the planning factors are intended to ensure that a State plan establishes a robust and resonant policy framework to address current and emerging transportation challenges. Hawai’i’s transportation future will be shaped by a wide range of factors, some of which are more or less in the State’s control (e.g., how to finance improvements) and some of which are outside the State’s control (e.g., sea level rise). The state transportation planning process must consider the wide range of factors simultaneously because the state’s transportation needs and solutions are not established by one, or even a few factors. For example, interaction of the economy, security, and mobility leads to a different and more useful plan than would consideration of only one of those topics. The federal requirement this paper responds to is intended to assure that topics important to all states are considered in the state transportation plan development and any future refinement. The planning factors are listed below in brief terms. A full description of them from the Federal Register is contained in Appendix 1 in this issue paper:
1. Economic vitality 2. Safety 3. Security 4. Accessibility and mobility 5. Enhance the environment, conserve energy, improve quality of life, and promote
consistency between planned growth and economic development 6. Integration and connectivity of transportation 7. Promote efficient system management and operation 8. Preserve the existing transportation system
Since the passage of the interstate highway program in the 1950’s, the federal transportation planning requirements have focused on the “3 C Process.” The 3 C’s are:
• Continuing – Just as conditions, needs, financing, and other topics are not static, the planning process does not end with a single date.

Hawaii Statewide Transportation Plan Update Issue Paper on the Impact of Federal Planning Requirements (Eight Planning Factors)
-4 -
• Cooperative – No single organization or agency is responsible for all transportation and related functions. States, local governments, and regional organizations need to work together to develop workable plans and programs.
• Comprehensive – To understand transportation needs and impacts, a wide view of geography, travelers, impacts, economy, and more need to be considered. This means that the development of a plan must take a comprehensive view of the current conditions and future needs.
While the federal focus began as a highway program, it has evolved to having a surface transportation emphasis (meaning highway, transit, non-motorized and freight). In the late 1950s through the 1960s, the federal requirements focused on establishing the basis for project proposals (e.g., travel forecasting coordinated with population and employment forecasts). With the advent of the Clean Air Act of 1963, and the more rigorous Clean Air Act of 1970, Federal transportation requirements called for determinations of a plan’s effect on emissions and air quality. However, this has been truer of metropolitan transportation plans than of state transportation plans. Similarly, the Civil Rights Act of 1964 established requirements prohibiting discrimination in a wide range of subjects including transportation. The Federal requirements for state transportation planning were clarified further with the passage of the Intermodal Surface Transportation Efficiency Act of 1991 (ISTEA). With that law’s enactment, states were required to develop a state transportation plan that met certain requirements. The USDOT Transportation Planning Capacity Building Program (TPCB) describes the federal requirements for states as including the following:
• Prepare and Maintain a Long-Range Statewide Transportation Plan: Develop and update a long-range transportation plan for the state. Plans vary from state to state and may be broad and policy-oriented, or may contain a specific list of projects.
• Develop a Statewide Transportation Improvement Program (STIP): Develop a program of transportation projects based on the state’s long-range transportation plan and designed to serve the state’s goals, using spending, regulating, operating, management, and financial tools. For metropolitan areas, the STIP incorporates the TIP developed by the Metropolitan Planning Organization (MPO).
• Involve the public: Involve the general public and all of the other affected constituencies in the essential functions listed above. 1
During the 1960s, federal transportation requirements called for metropolitan planning organizations to develop metropolitan or regional transportation plans. These requirements were greatly clarified in the passage of ISTEA and clarified further in later federal transportation laws (notably in SAFETEA-LU passed in 2005). State’s transportation planning must take into account the plans of metropolitan planning organizations. More fundamentally, state transportation improvement programs must
1 See USDOT Transportation Planning Capacity Building Program Website at: http://www.planning.dot.gov/documents/briefingbook/bbook.htm#2BB Last accessed March 2010.

Hawaii Statewide Transportation Plan Update Issue Paper on the Impact of Federal Planning Requirements (Eight Planning Factors)
-5 -
incorporate metropolitan planning organizations’ (regional) transportation improvement programs. This demonstrates the close relationship required between state and metropolitan plans. With the passage of ISTEA and the subsequent passages of TEA-21 and SAFETEA-LU, states were required to demonstrate that seven (and, now, eight) specific factors were considered in the development of the state transportation plans. While there is no federal test of sufficiency for what degree of consideration is required, it is clear that a state has to take the eight factors into account. The chronological order of federal laws with state transportation planning requirements is:
• Intermodal Surface Transportation Efficiency Act of 1991 (ISTEA) [P.L. 102-240] • Transportation Equity Act for the 21st Century of 1998 (TEA-21) [P.L. 105-78] • Safe, Accountable, Flexible Efficient Transportation Equity Act: Legacy for Users of 2005
(SAFETEA-LU) [P.L. 109-59] State and metropolitan transportation planning requirements changed significantly in 1991 with the passage of the Intermodal Surface Transportation Efficiency Act (known as ISTEA) and continued under TEA-21 and SAFETEA-LU. States and metropolitan planning organizations were then required to consider “planning factors” in their work. The intent of the requirement was to assure that topics important to the nation were appropriately and adequately considered in the development of state and metropolitan long-range transportation plans. States took various approaches to demonstrating this consideration. Some developed specific working papers on each topic. Some assured that the individual factors were considered within policy areas, alternatives, and/or evaluations to the extent they were appropriate. SAFETEA-LU and the rules and regulations in the Federal Register do not contain tests of sufficiency for consideration of the planning factors. In fact, the regulations make clear that no judicial action can be based on failure to consider any factor.2 FHWA and/or FTA can, however, provide process certification findings that call for a state to improve its consideration of the planning factors. Nevertheless, the American Association of State Highway and Transportation Officials (AASHTO), the Transportation Research Board (TRB), the Surface Transportation Policy Project (STPP), and others in reviewing best practices on states’ consideration of the planning factors have recommended the following observations:
• Make sure there is evidence that each factor was considered. • Raise the factor wherever it is appropriate to the issue or topic being considered (e.g., when
comparing alternative transit investments, consider their effects on mobility and accessibility).
2 The regulation states: “The failure to consider any factor specified in paragraph (a) of this section shall not be reviewable by any court under title 23 U.S.C., 49 U.S.C. Chapter 53, subchapter II of title 5 U.S.C. Chapter 5, or title 5 U.S.C Chapter 7 in any matter affecting a long-range statewide transportation plan, STIP, project or strategy, or the statewide transportation planning process findings.”

Hawaii Statewide Transportation Plan Update Issue Paper on the Impact of Federal Planning Requirements (Eight Planning Factors)
-6 -
The Eight Planning Factors do represent good planning practice. It is the premise of this Issue Paper that the planning factors, while developed for land transportation planning, represent good planning practice and therefore should also be considered in air, harbor, and intermodal Transportation planning.
• Some factors will be more important than others. Give appropriate consideration given the significance of issues to stakeholders. (For example, if environmental issues appear to be the most important subject in this plan update cycle, it is reasonable to give more emphasis to that issue than to others.)
• Do not be limited by the analysis tools available. If a given topic cannot be measured or forecasts cannot be produced using readily available tools, the factor should be considered by using the best available tools (which may be qualitative assessments or best judgments).
For Airports, there is additional guidance from the Federal Aviation Administration (FAA) in regards to Airports planning. FAA Advisory Circular 150/5070-7, regarding the airport system planning process, provides guidance on the preparation of a state airport system plan. Inter-modal access and airport access are important requirements. In addition, the FAA’s report to Congress on the National Plan of Integrated Airport Systems (NPIAS) for the period of 2011 to 20153 provide FAA direction on the types of planned improvements that are eligible for Airport Improvement Program (AIP) funding. The provisions that have a clear relationship with state transportation planning are:
• Airports should be safe and efficient, located at optimum sites, and developed and maintained to appropriate standards.
• Airports should be affordable to both users and Government, relying primarily on user fees and placing minimal burden on the general revenues of the local, State, and Federal governments.
• Airports should be flexible and expandable, able to meet increased demand and to accommodate new aircraft types.
• Airports should be compatible with surrounding communities, maintaining a balance between the needs of aviation and the requirements of residents in neighboring areas.
• The airport system should be extensive, providing as many people as possible with convenient access to air transportation, typically by having most of the population within 20 miles of a NPIAS airport.
• The airport system should help air transportation contribute to a productive national economy and international competitiveness.
The input to the NPIAS is provided by each state through their airport state system plans. The NPIAS then provides estimates for planned improvements, which are eligible for federal funding under the AIP.
3 The FAA’s latest National Plan of Integrated Airport Systems (NPIAS) can be found here: http://www.faa.gov/airports/planning_capacity/npias/reports/

Hawaii Statewide Transportation Plan Update Issue Paper on the Impact of Federal Planning Requirements (Eight Planning Factors)
-7 -
There is no commonly required aviation element for a state transportation plan. FAA Advisory Circular 150/5070-7, “The Airport System Planning Process,” provides guidance for state agencies in the preparation of a state airport system plan, which is eligible for funding by the FAA. One of the requirements in this advisory circular is consideration for intermodal integration and airport access. FAA described some commonly desirable treatment of airport systems issues at the state and regional levels as follows:
• State System Planning – Practices vary by state but, generally, include development of State Airport Systems Plan covering:
- Database and permitting of airports - Inspection of airports - Funding of capital improvement projects - Match funds for FAA Airport Improvement Program support - Construction funds for airports not on the National Plan of Integrated Airport Systems - Oversight of land use planning
• Regional System Planning – Varies by region but may include:
- System development plan to meet metropolitan area transportation need - Ties airport access in with airport development - Forum for political and public involvement and provides for review of conflicting
interests and local priorities For harbors, there is no Federal Maritime Administration (MARAD) guidance concerning consideration of harbors in state transportation plans. MARAD’s July 2010 report, Improving Marine Container Terminal Productivity: Development of Productivity Measures, Proposed Sources of Data, and Initial Collection of Data from Proposed Sources4, includes a discussion of the intermodal role of highways for the movement of containers. As part of the consideration of Hawaii’s economy, the need to consider major travel origins and destinations, and access to and from major activity centers, it is clear that the State Plans need to give consideration to the roles of harbors, particularly with respect to goods movement.
4 Cargo Handling Cooperative Program. Improving Marine Container Terminal Productivity: Development of Productivity Measures, Proposed Sources of Data, and Initial Collection of Data from Proposed Sources. July 2010. See website at: http://www.marad.dot.gov/documents/070810_Tioga_CHCP_Productivity_Report.pdf

Hawaii Statewide Transportation Plan Update Issue Paper on the Impact of Federal Planning Requirements (Eight Planning Factors)
-8 -

Hawaii Statewide Transportation Plan Update Issue Paper on the Impact of Federal Planning Requirements (Eight Planning Factors)
-9 -
Section 2.0 How the 2002 Hawaii Statewide Transportation Plan Treated the Planning Factors
The 2002 Hawaii Statewide Transportation Plan (2002 HSTP) issued in September 2002 included specific consideration of the seven planning factors that were required at that time. The only difference between the requirements in place in 2002 and those in place now is that the regulations now treat safety and security as two distinct factors, bringing the total to the current eight planning factors. The 2002 HSTP’s description of how to incorporate the planning factors into the plan is outlined in Appendix 2 in this Issue Paper. Each of the seven TEA-21 planning factors is discussed in relation to their applicability in the 2002 HSTP. Appendix 3 in this Issue Paper then goes one step further and gives a summary of how the seven planning factors relate to the 2002 HSTP Goals and Objectives. Causal relationships between factors and other issues (e.g., congestion vs. growth and economic development) are considered in the 2002 HSTP. This acknowledges the inter-relationships of the planning factors; in some cases, there are advantages to working on two or more topics together; and in other cases, improving one factor may complicate action on a different factor. The public involvement and opinion survey elements of the 2002 HSTP involved the public in the planning factors through public comments and opinion survey responses. Table 1 summarizes the 2002 HSTP treatment of the planning factors and public comments received in the telephone survey.
Table 1: How the 2002 HSTP and Accompanying Telephone Survey
Treated Federal Planning Factors
Eight Planning Factors
2002 Hawaii Statewide Transportation Plan Description of Potential Application of Federal Planning Factors (2002 HSTP, page 80)
Sample Comments from the 2002 Plan Telephone Survey (2002 HSTP, Appendix K)
Safety
The ability of the HSTP to satisfy this factor requires the consideration of long-range issues such as community access, transit usage, social equity, and upgrades to systems to accommodate safety and security issues. To ensure that these factors are included in the development of the plan, the project selection should include criteria that benefits across modes, recognizes community integration and impacts on communities, and uses human safety as a means of measuring project effectiveness.
Making sure our transportation system is designed to keep users safe was of utmost importance to residents of Hawaii. Considerations for safety and security in planning transportation in one’s community were very important to 91% of residents, regardless of one’s geographic community. Even when residents’ planning goals are seemingly in conflict, safety was always more important than mobility or protecting the environment.

Hawaii Statewide Transportation Plan Update Issue Paper on the Impact of Federal Planning Requirements (Eight Planning Factors)
-10 -
Eight Planning Factors
2002 Hawaii Statewide Transportation Plan Description of Potential Application of Federal Planning Factors (2002 HSTP, page 80)
Sample Comments from the 2002 Plan Telephone Survey (2002 HSTP, Appendix K)
Security
The ability of the HSTP to satisfy this factor requires the consideration of long-range issues such as community access, transit usage, social equity, and upgrades to systems to accommodate safety and security issues. To ensure that these factors are included in the development of the plan, the project selection should include criteria that benefits across modes, recognizes community integration and impacts on communities, and uses human safety as a means of measuring project effectiveness.
See comment on “safety” above.
Economic vitality
The long-range considerations relative to this factor, i.e., supporting the economic vitality of the metropolitan area, include developing and enhancing inter-modal facilities, increasing access to airport and harbor facilities, and engaging in public/private partnerships that increase efficiency and productivity of the economy. Other long-range considerations relative to this factor include implementing transportation decisions that are consistent with land use policies, considering transportation improvements that are directly related to economic development programs, and creating programs that result in conservation in energy consumption. These policies must all be an integral element of the process. Consideration of these policies into the long-range transportation planning activities can be accomplished by incorporating project selection criteria that are consistent with these objectives. Potential criteria in this category include issues that promote community integration, measures that promote long-term meaningful employment opportunities, means of measuring increases in accessibility, measures to improve modal connectivity, and assurance that impacts on the infrastructure of the community are minimized.
Oahu residents felt the need for transportation planning to support economic development was less of a concern in their communities than for statewide. 65% vs. 71% replied that supporting the economy is very important when thinking about how to improve transportation. On the other hand, Big Islanders, including Puna residents, see a local need to consider economic development planning is greater than the state-wide need (72% vs. 67%).
Integration and connectivity of transportation
Inter-modal transfer facilities, airport and harbor access roads, container policies, and freight policies/needs are the long-range considerations most relevant to this planning factor. Inter-modal connectivity, accessibility for people and freight, congestion relief and improved safety are the project selection criteria that would be most relevant to the process.
Making sure that different areas and transportation systems work together (80%) and making sure there is enough funding to meet transportation needs were also highly valued by residents statewide (78%). Making sure that different areas and transportation systems work together was much more of a concern for the residents of Oahu than neighbor island residents
Accessibility and mobility
Multi-modal considerations, transit accessibility, and level of service provided by public transportation are the key long-range considerations required to address this planning factor. Project selection criteria should include prevention of bottlenecks, prevention of segmentation in project continuity, inter-modal connectivity, and community-based economic development
Overall, residents were least concerned with issues that only affect a limited range of respondents such as a lack of infrastructure (mobility). Mobility, or the ability to get around quickly and easily, was not a concern among many residents except households with seniors.

Hawaii Statewide Transportation Plan Update Issue Paper on the Impact of Federal Planning Requirements (Eight Planning Factors)
-11 -
Eight Planning Factors
2002 Hawaii Statewide Transportation Plan Description of Potential Application of Federal Planning Factors (2002 HSTP, page 80)
Sample Comments from the 2002 Plan Telephone Survey (2002 HSTP, Appendix K)
Enhance the environment, conserve energy, improve quality of life, and promote consistency between planned growth and economic development
Long-range considerations required to ensure that this planning factor is adequately addressed include air and water quality issues; energy consumption in the development of the plan; livability of communities, including social cohesion, physical connections, urban design, and the potential for growth and growth inducement. The identification of transportation projects to be included in plans should address issues related to environmental impacts, emissions reduction, and preservation and conservation of valuable resources.
Residents placed a higher importance on issues that affect their persons directly. Respondents felt issues such as safety and preserving quality of life should receive more attention than public policy issues such as protecting the environment, supporting the economy or public involvement. Protecting the environment was an important concern for many but particularly for the residents of Maui County. In particular, the islands of Maui and Kauai were most adamant about considering the quality of life aspect when developing transportation in a community. In general, respondents consistently wanted planners to address the quality of life. In particular, Maui and Kauai were adamant about considering the quality of life aspect when developing transportation in a community.
Integration and connectivity of transportation
Inter-modal transfer facilities, airport and harbor access roads, container policies, and freight policies/needs are the long-range considerations most relevant to this planning factor. Inter-modal connectivity, accessibility for people and freight, congestion relief and improved safety are the project selection criteria that would be most relevant to the process.
Making sure that different areas and transportation systems work together (80%) and making sure there is enough funding to meet transportation needs were also highly valued by residents statewide (78%). Making sure that different areas and transportation systems work together was much more of a concern for the residents of Oahu than neighbor island residents
Preserve existing transportation system
The long-range considerations that would most serve this factor are maintenance priorities in the preparation of transportation budgets, travel demand reduction strategies, growth assumptions that are less aggressive and more in line with community expectations, and alternative modes in the development of long-range plans. Project selection criteria that enhance this factor include maintenance versus new capacity considerations, reallocation of funds among modes, and consideration of alternatives that reflect planning strategies consistent with preservation as the primary goal.
Participants’ comments on open-ended questions contained several references to the need to eliminate potholes, make the roads better, and to improve road maintenance.

Hawaii Statewide Transportation Plan Update Issue Paper on the Impact of Federal Planning Requirements (Eight Planning Factors)
-12 -

Hawaii Statewide Transportation Plan Update Issue Paper on the Impact of Federal Planning Requirements (Eight Planning Factors)
-13 -
Section 3.0 Treatment of the Factors by the Transportation Planning Programs in Other States
A scan of nine different states is described in this section to explore how each state uses the 8 Planning Factors in their State Plans. This grouping of states was selected either because they are known for best practices, and/or they had tried something new and innovative. Of the nine, Alaska may be the most similar to Hawaii because of its isolation from other states, the importance of harbors and airports in its modes of travel, and having a small and widely dispersed population. Alaska’s agency that is responsible for transportation is the Alaska Department of Transportation and Public Facilities. It serves as the owner/operator for the state highway system, the marine highway (waterborne) system, a railroad, and a wide range of airports except the airports at Anchorage and Fairbanks. This suggests that its treatment of state policies may be instructive and may suggest approaches Hawaii should consider. Other states were included to provide understanding of a range of approaches. For example, Florida, Illinois, and Maryland State Plans explain consideration of the Federal Eight Planning Factors explicitly. The Washington and Pennsylvania examples indicate how those two states chose to give more emphasis to some of the eight factors than to others. Most states’ DOTs focus on their respective state highway systems such as Wisconsin and Pennsylvania. Oregon’s state planning process has given extensive consideration to environmental issues and coordination. That treatment, while entirely consistent with federal transportation planning requirements, stands out as going farther than most states have. The 1995 USDOT-FHWA report, Examples of Statewide Transportation Planning Practices,5 notes the focused approach given transportation, energy, and land use in development of the Oregon Transportation Plan: “The interagency coordination that took place in development of the Oregon Transportation Plan (OTP), the State’s energy plan, the Transportation Planning Rule (TPR), and the Oregon Benchmarks is of most use concerning Oregon’s efforts in addressing socioeconomic and environmental issues.” Some of the approaches reflected in these very brief summaries of the selected states’ planning approaches may offer ideas that would be useful for the Hawaii Statewide Transportation Plan Update. At a minimum, the examples offer insight into the treatment of the required topics by other states.
5 USDOT Federal Highway Administration and Federal Transit Administration. Examples of Statewide Transportation Planning Practices. January 1995. See website at: http://www.fhwa.dot.gov/planning/statewide//stpp.pdf Last Accessed July 2010.

Hawaii Statewide Transportation Plan Update Issue Paper on the Impact of Federal Planning Requirements (Eight Planning Factors)
-14 -
A. State of Alaska (Department of Transportation & Public Facilities: DOT&PF)
• The Alaska Statewide Transportation Plan6 explicitly covers the planning factors in the introduction and explains that these are required to be addressed.
• Policies in the plan address several of the factors as noted in the following policies (underlined emphasis added where it references one of the eight planning factors): - Policy 1: Develop the multimodal transportation system to provide safe, cost-effective, and
energy-efficient accessibility and mobility for people and freight. - Policy 2: Establish statewide strategic priorities for transportation system development
funding. - Policy 3: Apply the best management practices to preserve the existing transportation
system. - Policy 4: Increase understanding of and communicate Alaska DOT & Public Facilities’
responsibilities for system preservation as the owner of highways, airports, harbors, and vessels.
- Policy 5: Ensure the efficient management and operation of the transportation system. - Policy 6: Use technology and Intelligent Transportation Systems where cost-effective to
ensure the efficient operation of the transportation system, accessibility, and customer service.
• While the plan addresses mostly mode-specific findings and recommendations, many of the eight factors are addressed as reasons for investments.
B. State of Florida (FDOT)
• The planning factors are addressed in several of the Florida Transportation Plan’s goals7, among these are (with the selected eight planning factors underlined):
- A safer and more secure transportation system for residents, businesses, and visitors - Enriched quality of life and responsible environmental stewardship - Adequate and cost-efficient maintenance and preservation of transportation assets - A stronger economy through enhanced mobility for people and freight - Sustainable transportation investments for Florida’s future
C. State of Illinois (IDOT)
• The planning factors are explicitly addressed and described in the introduction to the Illinois State Transportation Plan8 and are presented as requirements for the plan.
• The planning factors are covered in the plan’s policies and goals as listed in the following plan policies (with the references to the planning factors underlined): - Target transportation investments to support business and employment, growth, and
enhance the Illinois economy.
6 Alaska Department of Transportation and Public Facilities. Let’s Get Moving 2030, Alaska Statewide Long-Range Transportation Plan. February 2008. 7 Florida Department of Transportation. 2025 Florida Transportation Plan. 2005. 8 Illinois Department of Transportation. Illinois State Transportation Plan. 2007.
Hawaii Statewide Transportation Plan Update Issue Paper on the Impact of Federal Planning Requirements (Eight Planning Factors)
-15 -
- Provide a transportation system that offers a high degree of mobility, accessibility, reliability, and options.
- Preserve and manage the existing transportation system. - Reduce congestion, optimize service and operation efficiency, develop intermodal
connections, and utilize transportation technology advances. - Ensure a compatible interface of the transportation system with environmental, social, and
energy considerations. - Follow a comprehensive transportation planning process and coordination among public
and private sector transportation systems. - Promote stable funding for the public component of the transportation system. - Improve transportation safety. - Provide a secure transportation infrastructure in conjunction with the Office of Homeland
Security – Illinois Terrorism Task Force. • Several of the factors are addressed in the section on transportation challenges faced by the
State of Illinois.
D. State of Maryland (MDOT) • Several of the eight planning factors are covered in the Maryland Transportation Plan’s9 review
of critical issues facing Maryland. These include (and the references to the planning factors are underlined). - Transportation and the Economy - Freight Demand and Infrastructure Capacity - Planning for Development - Transportation and the Environment - Transportation Needs Outpacing Funding Resources - Transportation-Related Fatalities and Injuries
• The eight planning factors are also covered in the plan’s goals as listed below with the references to the planning factors underlined: - Quality of Service: Enhance users’ access to, and positive experience with, all MDOT
transportation services. - Safety & Security: Provide transportation assets that maximize personal safety and security
in all situations. - System Preservation & Performance: Protect Maryland’s investment in its transportation
system through strategies to preserve existing assets and maximize the efficient use of resources and infrastructure.
- Environmental Stewardship: Develop transportation policies and initiatives that protect the natural, community, and historic resources of the State and encourage development in areas that are best able to support growth.
- Connectivity for Daily Life: Support continued economic growth in the State through strategic investments in a balanced, multimodal transportation system.
9 Maryland Department of Transportation. Maryland Transportation Plan. January 2009.

Hawaii Statewide Transportation Plan Update Issue Paper on the Impact of Federal Planning Requirements (Eight Planning Factors)
-16 -
E. State of Michigan (MDOT)
• The planning factors are embedded in several sections of the Michigan Transportation Plan10, including explicit inclusion of several factors in Plan goals and actions. The plan’s goals are listed below along with underlined references to the planning factors: - Stewardship: Preserve transportation system investments, protect the environment, and
utilize public resources in a responsible manner. - System Improvement: Modernize and enhance the transportation system to improve
mobility and accessibility. - Efficient and Effective Operations: Improve the efficiency and effectiveness of the
transportation system and transportation services and expand MDOT’s coordination and collaboration with partners.
- Safety and Security: Continue to improve transportation safety and ensure the security of the transportation system.
• Technical reports summarized in the plan include economic indicators, land use, safety, security, and environmental.
• Policy and strategy recommendations specifically address land use issues due to the State’s view of this as one of the most significant issues in the plan update cycle for 2007.
F. Commonwealth of Pennsylvania (PennDOT)
• The overview of the Pennsylvania Mobility Plan11 discusses selected factors from the federally required eight, i.e., the ones most significant in this plan update.
• The plan’s main message is included in its logo, i.e., PennPlan MOVES which stands for Mobility; Options; a platform for public Voices; Equity; Efficiency; consideration for the Environment, and Economic Development, and Safety. While an acronym, logo, or theme is not necessarily a plan, this does demonstrate the focus on several of the eight planning factors for Pennsylvania. The planning factors are incorporated in the plan’s goals.
• The current statewide LRTP notes the planning factors, citing “Although plans must consider each of these factors, the broad nature of each factor offers great flexibility in determining how these mandates align with regional planning efforts.”
G. State of Washington (WSDOT) • The Washington Transportation Plan12 is developed around five major themes, briefly
summarized as: 1) preservation; 2) safety; 3) economic vitality; 4) mobility; and, 5) environmental quality and health. These correspond with five of the eight planning factors.
• In discussions with the Director of Strategic Planning for Washington State DOT, he said: “The quality of evaluation for the eight factors is always debatable, but when such factors bubble up to be part of the plan’s objectives, it becomes clear that they are important.”
10 Michigan Department of Transportation. Michigan Transportation Plan: Moving Michigan Forward. 2007. 11 Pennsylvania Department of Transportation. Pennsylvania Mobility Plan: Leading Transportation Change, 2006-2030. June 2007. 12 Washington State Transportation Commission and the Washington State Department of Transportation. Washington Transportation Plan 2007-2026. November 14, 2006.

Hawaii Statewide Transportation Plan Update Issue Paper on the Impact of Federal Planning Requirements (Eight Planning Factors)
-17 -
• A USDOT report titled Examples of Statewide Transportation Planning Practices notes: “The Washington experience illustrates how State policy concerning seemingly different topics can be integrated to form one consistent vision.”
H. State of Wisconsin (WisDOT) • Wisconsin Department of Transportation’s Connections 2030 Long Range Multimodal
Transportation Plan13 addresses the TEA-21 seven planning factors as “seven transportation themes.”
• These themes are said to frame the Statewide Transportation Plan, Connections 2030, in an effort to result in “an integrated, multimodal, approach to facilitate transportation decision-making.”
• The WisDOT also acknowledges that while the themes, or policies, are organized separately, many themes may overlap with one another.
• WisDOT also states that each of the seven themes addresses all transportation modes.
13 Wisconsin Department of Transportation. Connections 2030 Long-Range Multimodal Transportation Plan: Executive Summary. October 2009. Page 6.

Hawaii Statewide Transportation Plan Update Issue Paper on the Impact of Federal Planning Requirements (Eight Planning Factors)
-18 -

Hawaii Statewide Transportation Plan Update Issue Paper on the Impact of Federal Planning Requirements (Eight Planning Factors)
-19 -
Section 4.0 Consideration of the 8 Planning Factors in the Preparation for the HSTP Update
The HSTP emerging issues task correlates closely with the 8 Planning Factors. The Issue Papers are a precursor to the development of the HSTP Update’s revised goals and objectives. Table 2 shows how the emerging issues inter-relate with the Planning Factors. When the term, “not likely to be a significant issue,” is used, it means that the indicated planning factor does not appear to be critical to or have a significant impact on the emerging issue it is connected with in Table 2. For example, for the issue of “Aging population and transportation” it does not appear worthwhile to give special consideration to preservation of the transportation system. One could suggest that an aging population may have lesser or greater interest in preservation of the transportation system, but it does not appear to be as important to consider that linkage as it would to assure consideration of the aging population’s need for improved safety.
Table 2: Relationships of the Federal Eight Planning to Emerging Issues
Under Consideration in the HSTP Update
Emerging Issues being addressed in the HSTP Update
Planning Factors
Economy Safety Security Accessibility & Mobility Environment
Integration & Connectivity
System Mgmt & Operations
Preserve System
Climate change and sea level rise
Consider interaction of climate and economy
Consider ocean rise and effects on transport facilities and services
Consider vulnerability and risks that may arise from ocean rise
Consider sites that may be less accessible due to ocean rise; consider highway, ports, and airports that may be affected
Consider impacts of modifying transportation facilities and services affected by ocean rise
Consider sites that may be less accessible due to ocean rise; consider highway, ports, and airports that may be affected
Consider impacts of modifying transportation facilities and services affected by ocean rise
Consider impacts of modifying transportation facilities and services affected by ocean rise
Aging population and transportation
Consider the changing significance of access to sites important to the aging population
Consider transport operations, signing, usage conditions, etc. for aging population
Not likely to be a significant issue
Consider increased need for travel by non-motorized means and by non-drive-alone means; consider need for simpler and larger signs
Not likely to be a significant issue
Consider increased need for connections between modes
Not likely to be a significant issue
Not likely to be a significant issue

Hawaii Statewide Transportation Plan Update Issue Paper on the Impact of Federal Planning Requirements (Eight Planning Factors)
-20 -
Emerging Issues being addressed in the HSTP Update
Planning Factors
Economy Safety Security Accessibility & Mobility Environment
Integration & Connectivity
System Mgmt & Operations
Preserve System
Land use planning
Consider effects of alternative land use scenarios on travel demand, facilities, and services
Consider whether alternative land use patterns could affect transport safety
Consider whether alternative land use patterns could affect transport security
Consider whether alternative land use patterns could create changed needs for mobility and accessibility
Consider whether alternative land use scenarios could have (positive or negative) impacts on transport-related environmental issues
Consider whether alternative land use scenarios cause needs for more, less, and/or different mode, facility, and service connections
Not likely to be a significant issue
Not likely to be a significant issue
Fuel and energy scenarios for Hawaii
Consider effects of energy availability and cost on transport demand, capital, and O&M; consider effects on state revenues
Consider safety issues associated with changing fuel sources and uses
Consider vulnerability and risks that may arise from energy disruptions, changes in costs, and/or changes in sources
Consider effects of changes in vehicle fleet mix (for autos, trucks, aircraft, ships, other) and the implications for transport facilities and services as well as for categories and trends of expenditures
Consider potential gains and risks for emissions, leakage, spills, and other forms of fuel impacts
Consider effects of changes in vehicle fleet mix (for autos, trucks, aircraft, ships, other) and the implications for transport facilities and services as well as for categories and trends of expenditures
Consider effects of changes in vehicle fleet mix (for autos, trucks, aircraft, ships, other) and the implications for transport facilities and services as well as for categories and trends of expenditures; consider potential changes in DOT fleet and facility energy uses
Consider potential changes in DOT fleet and facility energy uses
Environmental coordination (of rules and regulations in transportation planning)
Consider whether changes in transport-related environmental processes could have an effect on the economy
Not likely to be an issue
Not likely to be an issue
Not likely to be an issue
Self evident Not likely to be an issue
Not likely to be an issue
Consider whether changes in transport-related environmental processes could have an effect on system preservation

Hawaii Statewide Transportation Plan Update Issue Paper on the Impact of Federal Planning Requirements (Eight Planning Factors)
-21 -
Emerging Issues being addressed in the HSTP Update
Planning Factors
Economy Safety Security Accessibility & Mobility Environment
Integration & Connectivity
System Mgmt & Operations
Preserve System
Planning and Design: Context Sensitive Solutions, Complete Streets, Smart Growth & Transit Oriented Development
Not likely to be an issue
Consider whether better integration of transport planning and design would have an effect on safety
Consider planning for emergency situations (evacuation planning, emergency information)
Consider whether better integration of transport and design would affect accessibility and mobility
Consider whether better integration of transport and design would have an effect on the environment
Consider whether better integration of transport planning and design could lead to improved system integration and connectivity
Not likely to be an issue
Not likely to be an issue
Transportation Security
Consider whether changes in transport-related security could have an impact on the economy (perhaps by reducing risk)
Consider what changes risk and vulnerability could have an impact on safety
Self-explanatory
Consider whether actions to change transport-related security could affect accessibility and mobility
Not likely to be an issue
Not likely to be an issue
Not likely to be an issue
Consider whether system asset mgmt. could be affected by reduced risk and vulnerability
System preservation and asset management
Consider whether investment in system preservation could reduce overall system costs
Consider whether investment in system preservation could improve safety
Not likely to be an issue
Not likely to be an issue
Consider whether a longer asset lifetime could mean less or delayed impacts of reconstruction or replacement
Not likely to be an issue
Consider whether improved system preservation could demand more maintenance or result in other needs
Self-explanatory
Financial scenarios: for O&M, financial gaps, implications of changes in Federal funding, and alternative funding/ financing techniques
Consider implication of changing financial scenarios and strategies in light of Hawaii’s economy
Not likely to be an issue (except for ability to respond to changing financial priorities)
Not likely to be an issue (except for ability to respond to changing financial priorities)
Not likely to be an issue (except for ability to respond to changing financial priorities)
Not likely to be an issue (except for ability to respond to changing financial priorities)
Not likely to be an issue (except for ability to respond to changing financial priorities)
Consider State’s ability to fund system management and operations under different scenarios
Consider short to medium term implications of an increased emphasis on maint and rehab; consider long-term implications of system preservation (delayed reconstruction)

Hawaii Statewide Transportation Plan Update Issue Paper on the Impact of Federal Planning Requirements (Eight Planning Factors)
-22 -

Hawaii Statewide Transportation Plan Update Issue Paper on the Impact of Federal Planning Requirements (Eight Planning Factors)
-23 -
Section 5.0 Implications of the 2010 Census to Statewide Transportation Planning
Each decennial US Census provides the opportunity for states and MPOs to assess whether past forecasts are on target, whether new trends have arisen, and whether assumptions underlying the planning programs need to be changed. 2010 Census data will not be available in time to be considered for the HSTP Update, however, the American Community Survey (ACS) information is one source that be used to assess trends in topics listed above. A separate HSTP Deliverable, “Data, Trends, and Indicators” discusses these transportation trends and how to access the data to keep it updated. Another HSTP Deliverable, “2035 Population and Socio-Economic Forecasts,” uses data from the State of Hawaii Department of Business, Economic Development and Tourism (DBEDT) and the American Community Survey to make projections to assist transportation planners. When considered in conjunction with the 2010 Census and other sources available to HDOT, the State will be able to consider the ACS to determine whether there are any new assumptions and trends important to transportation planning. The 2010 Census will be particularly important to examine to help assess a range of issues important to Hawaii’s transportation future. Census information that will need to be examined to determine whether the State (and others) should reconsider assumptions and/or deal with new trends includes population and jobs (the totals, the geographic distribution, and the breakdown into subgroups). Considering these factors and the economic downturn of 2008-2009, some issues that will be important to examine will be:
• Changes in population and employment patterns • Household size • Trip making frequency and purposes • Indications of year round or partial year residency changes • Ratio of jobs to adult population (and the differences in that ratio by county) • Changes in the age profile (distribution) of the State’s population • Changes in migration patterns • Changes in mode of travel used and in frequency of use
HDOT can continue its role as a Census Affiliate and collaborate with the Hawaii State DBEDT Data Center, the State’s official liaison with the US Census Bureau, to review the new information in light of the State’s transportation plans. This new data should be available in 2012.

Hawaii Statewide Transportation Plan Update Issue Paper on the Impact of Federal Planning Requirements (Eight Planning Factors)
-24 -

Hawaii Statewide Transportation Plan Update Issue Paper on the Impact of Federal Planning Requirements (Eight Planning Factors)
-25 -
Section 6.0 Recommendations for Hawaii Statewide Transportation Plan Update
Based on the review of federal regulations and the best practices of other states, the following recommendations are made.
1. Continue to apply and review the Eight Planning Factors to all modes: Airports, Harbors, and surface transportation, including the non-motorized modes of transportation such as pedestrian and bikes. Review the Eight Planning Factors in conjunction with each HSTP Update for challenges, accomplishments, and lessons learned.
2. Maintain dialogue and discussions on the Eight Planning Factors, the Factor’s roles, and
updates with both the public and stakeholders in order to improve and enhance the transportation planning process.

Hawaii Statewide Transportation Plan Update Issue Paper on the Impact of Federal Planning Requirements (Eight Planning Factors)
-26 -

Hawaii Statewide Transportation Plan Update Issue Paper on the Impact of Federal Planning Requirements (Eight Planning Factors)
-27 -
References Alaska Department of Transportation and Public Facilities. Let’s Get Moving 2030, Alaska
Statewide Long-Range Transportation Plan. February 2008. Cargo Handling Cooperative Program. Improving Marine Container Terminal Productivity:
Development of Productivity Measures, Proposed Sources of Data, and Initial Collection of Data from Proposed Sources. July 2010.
http://www.marad.dot.gov/documents/070810_Tioga_CHCP_Productivity_Report.pdf Federal Aviation Administration. AC No. 150/5070-17. “The Airport System Planning Process.”
November 2004. Federal Aviation Administration. Report to Congress on National Plan of Integrated Airport
Systems. 2011-2015. Florida Department of Transportation. 2025 Florida Transportation Plan. 2005 Illinois Department of Transportation. Illinois State Transportation Plan. 2007. Michigan Department of Transportation. Michigan Transportation Plan: Moving Michigan
Forward. 2007. Pennsylvania Department of Transportation. Pennsylvania Mobility Plan: Leading
Transportation Change, 2006-2030. June 2007. Safe Accountable Flexible Efficient Transportation Efficiency Act: A Legacy for Users (SAFETEA-
LU). Public Law 109-59 incorporated into Title 23, United States Code. http://www.fhwa.dot.gov/safetealu/legis.htm
U.S. Department of Transportation. Federal Highway Administration and Federal Transit
Administration. Examples of Statewide Transportation Planning Practices. January 1995. Washington State Transportation Commission and the Washington State Department of
Transportation. Washington Transportation Plan 2007-2026. November 14, 2006. Wisconsin Department of Transportation. Connections 2030 Long-Range Multimodal
Transportation Plan: Executive Summary. October 2009. American Association of Port Authorities: Alliance of the Ports of Canada, the Caribbean, Latin
American, and the United States Website: www.aapa-ports.org/home.cfm

-28 -

-29 -
Appendices
Appendix 1: Federal SAFETEA-LU Requirements for
Consideration of the Eight Planning Factors Appendix 2: 2002 Hawaii Statewide Transportation Plan
Consideration of the Eight Required Planning Factors from the Federal Planning Requirements Section
Appendix 3: Summary of Treatment of Planning Factors in the
2002 HSTP in the Goals and Objectives Section

-30 -

-31 -
Appendix 1
Federal SAFETEA-LU Requirements
For Consideration of the Eight Planning Factors

-32 -

-33 -
Appendix 1: Federal SAFETEA-LU Requirements for Consideration of the Eight Planning Factors The requirements as stated in the Federal Register of February 14, 2007 in 23 CFR, Section 450.206 are quoted below:
Ҥ 450.206 Scope of the statewide transportation planning process.
(a) Each State shall carry out a continuing, cooperative, and comprehensive statewide transportation planning process that provides for consideration and implementation of projects, strategies, and services that will address the following factors:
(1) Support the economic vitality of the United States, the States, metropolitan areas, and non-metropolitan areas, especially by enabling global competitiveness, productivity, and efficiency;
(2) Increase the safety of the transportation system for motorized and non-motorized users;
(3) Increase the security of the transportation system for motorized and non-motorized users;
(4) Increase accessibility and mobility of people and freight;
(5) Protect and enhance the environment, promote energy conservation, improve the quality of life, and promote consistency between transportation improvements and State and local planned growth and economic development patterns;
(6) enhance the integration and connectivity of the transportation system, across and between modes throughout the State, for people and freight;
(7) Promote efficient system management and operation; and
(8) Emphasize the preservation of the existing transportation system.
(b) Consideration of the planning factors in paragraph (a) of this section shall be reflected, as appropriate, in the statewide transportation planning process. The degree of consideration and analysis of the factors should be based on the scale and complexity of many issues, including transportation systems development, land use, employment, economic development, human and natural environment, and housing and community development.
(c) The failure to consider any factor specified in paragraph (a) of this section shall not be reviewable by any court under title 23 U.S.C., 49 U.S.C. Chapter 53, subchapter II of title 5 U.S.C. Chapter 5, or title 5 U.S.C Chapter 7 in any matter affecting a long-range statewide transportation plan, STIP, project or strategy, or the statewide transportation planning process findings.

-34 -
(d) Funds provided under 23 U.S.C. 505 and 49 U.S.C. 5305(e) are available to the State to accomplish activities in this subpart. At the State's option, funds provided under 23 U.S.C. 104(b)(1) and (3) and 105 and 49 U.S.C. 5307 may also be used. Statewide transportation planning activities performed with funds provided under title 23 U.S.C. and title 49 U.S.C. Chapter 53 shall be documented in a statewide planning work program in accordance with the provisions of 23 CFR part 420. The work program should include a discussion of the transportation planning priorities facing the State.”

-35 -
Appendix 2
2002 Hawaii Statewide Transportation Plan Consideration of
the Eight Required Planning Factors from the Federal Planning Requirements Section

-36 -

-37 -
Appendix 2: 2002 Hawaii Statewide Transportation Plan Consideration of the Eight Required Planning Factors from the Federal Planning Requirements Section The following section is from the 2002 HSTP (pages 80 to 82) and addresses how that plan addressed the factors. TEA-21 was the applicable federal transportation law at the time of the preparation of the 2002 HSTP report. “The following provides a discussion of the potential application of the TEA-21 planning factors into the development of the Hawaii Statewide Transportation Plan. a. Economic Vitality. The long-range considerations relative to this factor, i.e., supporting the economic vitality of the metropolitan area, include developing and enhancing inter-modal facilities, increasing access to airport and harbor facilities, and engaging in public/private partnerships that increase efficiency and productivity of the economy. Other long-range considerations relative to this factor include implementing transportation decisions that are consistent with land use policies, considering transportation improvements that are directly related to economic development programs, and creating programs that result in conservation in energy consumption. These policies must all be an integral element of the process. Consideration of these policies into the long-range transportation planning activities can be accomplished by incorporating project selection criteria that are consistent with these objectives. Potential criteria in this category include issues that promote community integration, measures that promote long-term meaningful employment opportunities, means of measuring increases in accessibility, measures to improve modal connectivity, and assurance that impacts on the infrastructure of the community are minimized. b. Safety and Security. The ability of the HSTP to satisfy this factor requires the consideration of long-range issues such as community access, transit usage, social equity, and upgrades to systems to accommodate safety and security issues. To ensure that these factors are included in the development of the plan, the project election should include criteria that benefits across modes, recognizes community integration and impacts on communities, and uses human safety as a means of measuring project effectiveness. c. Accessibility and Mobility. Multi-modal considerations, transit accessibility, and level of service provided by public transportation are the key long-range considerations required to address this planning factor. Project selection criteria should include prevention of bottlenecks, prevention of segmentation in project continuity, inter-modal connectivity, and community-based economic development. d. Protect Environment and Conserve Energy. Long-range considerations required to ensure that this planning factor is adequately addressed include air and water quality issues; energy consumption in the development of the plan; livability of communities, including social

-38 -
cohesion, physical connections, urban design, and the potential for growth and growth inducement. The identification of transportation projects to be included in plans should address issues related to environmental impacts, emissions reduction, and preservation and conservation of valuable resources. e. Connectivity of System. Inter-modal transfer facilities, airport and harbor access roads, container policies, and freight policies/needs are the long-range considerations most relevant to this planning factor. Inter-modal connectivity, accessibility for people and freight, congestion relief and improved safety are the project selection criteria that would be most relevant to the process. f. System Management. The long-range considerations most appropriate for this planning factor are life cycle costs, development of inter-modal congestion strategies, and deferral of capacity increases in lieu of measures to better manage existing facilities. Project selection criteria that would best serve this factor include the effectiveness of improving the existing system, congestion impacts, community and natural impacts, and maintenance of existing facilities. g. Preserve Existing System. The long-range considerations that would most serve this factor are maintenance priorities in the preparation of transportation budgets, travel demand reduction strategies, growth assumptions that are less aggressive and more in line with community expectations, and alternative modes in the development of long-range plans. Project selection criteria that enhance this factor include maintenance versus new capacity considerations, reallocation of funds among modes, and consideration of alternatives that reflect planning strategies consistent with preservation as the primary goal.”

-39 -
Appendix 3
Summary of Treatment of Planning Factors
In the 2002 HSTP in the Goals and Objectives Section

-40 -

-41 -
Appendix 3: Summary of Treatment of Planning Factors in the 2002 HSTP In the Goals and Objectives Section Planning Factor Responsible
Agency Integration into 2002 Hawaii Statewide Transportation Plan
Support economic vitality of U.S., State of Hawaii, and metropolitan area in state.
HDOT Statewide Transportation Planning Office and local agencies
Integral part of Hawaii Statewide TransportationPlanning Process Addressed in o Goal IV: Support Hawaii economic vitality. o Objective 1: Provide and operate transportation
system to accommodate economic developments and opportunities.
o Objective 2: Develop transportation system that complements
Increase safety and security. With SAFETEA-LU, this factor is now “Increase safety”
HDOT Statewide Transportation Planning Office and local agencies
Integral part of Hawaii Statewide Transportation Planning Process Addressed in o Goal II: Ensure the safety and security of the air,
land, and water transportation systems. o Objective 1: Enhance safety of transportation
system. o Objective 2: Ensure secure operation and use of
transportation systems. Increase security (separated from safety and security by SAFETEA-LU)
Not required as a separate factor prior to SAFETEA-LU
NA
Increase accessibility and mobility.
Local agencies Oahu: Included in ORTP and General Plan Neighbor Islands: Included in Long-Range Transportation Plans and General Plans Addressed in o Goal I: Achieve an integrated multi-modal
transportation system that provides mobility and accessibility for people and goods.
o Objective 1: Preserve, maintain, and improve transportation system infrastructure and programs with regards to each community's unique characteristics.
o Objective 2: Increase efficiency of transportation systems' operations.
o Objective 3: Promote alternative transportation mode choices.

-42 -
Planning Factor Responsible
Agency Integration into 2002 Hawaii Statewide Transportation Plan
Protect and enhance environment, energy conservation, and quality of life
HDOT Statewide Transportation Planning Office and local agencies
Planning ProcessAddressed in o Goal III: Protect and enhance Hawaii's unique
environment and improve its quality of life. o Objective 1: Provide a transportation system that is
environmentally compatible and sensitive to cultural, historic and natural resources.
o Objective 2: Ensure that the statewide transportation system supports comprehensive land use policies and livability in urban and rural areas.
Enhance connectivity of transportation system
HDOT Statewide Transportation Planning Office and local agencies
Integral part of transportation planning process for each division Addressed in o Goal I: Achieve an integrated multi-modal
transportation system that provides mobility and accessibility for people and goods.
o Objective 2: Increase efficiency of transportation systems' operations
Promote transportation system management
HDOT Statewide Transportation Planning Office and local agencies
Integral part of planning process to develop Hawaii Statewide Transportation Plan. Addressed in o Goal I: Achieve an integrated multi-modal
transportation system that provides mobility and accessibility for people and goods.
o Objective 3: Promote alternative transportation mode choices.
Preservation of existing transportation system.
HDOT Statewide Transportation Planning Office and local agencies
Integral part of planning process to develop Hawaii Statewide Transportation Plan. Addressed in o Goal I: Achieve an integrated multi-modal
transportation system that provides mobility and accessibility for people and goods.
o Objective 1: Preserve, maintain, and improve transportation system infrastructure and programs with regards to each community's unique characteristics.


Issue Paper #2 Climate Change and Sea Level Rise
In Preparation for the Hawaii Statewide Transportation Plan Update
Prepared for Department of Transportation
State of Hawaii
Prepared by SSFM International, Inc.
With Dr. Chip Fletcher, University of Hawaii, School of Ocean and Earth Science and Technology (SOEST)
2011

Hawaii Statewide Transportation Plan Update Issue Paper on Climate Change and Sea Level Rise
i
Table of Contents Foreword ................................................................................................................................................ 1 Section 1.0 Primer on Climate Change and Sea level Rise ........................................................................ 3
Section 1.1 Introduction to Climate Change ........................................................................................ 3 Section 1.2 Description of Climate Change ........................................................................................... 4 Section 1.3 Description of Sea level Rise .............................................................................................. 7
Section 2.0 Other Effects of Climate Change .......................................................................................... 13 Section 2.1 Temperature Extremes .................................................................................................... 13 Section 2.2 Ocean Acidity .................................................................................................................. 14 Section 2.3 Precipitation .................................................................................................................... 15 Section 2.4 Tropical Storms and Hurricanes ....................................................................................... 16
Section 3.0 General Effects of Climate Change on the Transportation System ........................................ 19 Section 3.1 Warming Temperatures ................................................................................................... 19 Section 3.2 Precipitation .................................................................................................................... 19 Section 3.3 Sea level Rise ................................................................................................................... 20 Section 3.4 Tropical Storms................................................................................................................ 20
Section 4.0 Specific Effects on Hawaii and Local Transportation............................................................. 21 Section 4.1 Local Issues...................................................................................................................... 21 Section 4.2 Groundwater ................................................................................................................... 22 Section 4.3 Hurricanes ...................................................................................................................... 23
Section 5.0 Act 234 Hawaii’s Responses to Greenhouse Gas (GHG) Emission Reduction ........................ 25 Section 5.1 Climate Change Task Force, Act 20, Special Session #1, 2009 .......................................... 27
Section 6.0 Climate Change Resources for Transportation Planning ...................................................... 29 Section 6.1 General Clearinghouses for Information on Transportation and Climate Change............. 29 Section 6.2 Resources on Measures to Mitigate GHG Emissions ........................................................ 31 Section 6.3 Resources on Measures to Adapt to Climate Change and Sea Level Rise ......................... 32
Section 7.0 How Other Jurisdictions Handle Climate Change and Global Warming Effects ..................... 35 Section 7.1 California ........................................................................................................................ 35 Section 7.2 Maine ............................................................................................................................. 36 Section 7.3 New England Governors and Eastern Canadian Premiers ................................................. 37 Section 7.4 New York ........................................................................................................................ 37
Section 8.0 Recommendations for HSTP Update ................................................................................... 39 References ............................................................................................................................................ 41 Appendix 1: Hawaii Greenhouse Gas Emission Reduction Task Force Members ..................................... 47

Hawaii Statewide Transportation Plan Update Issue Paper on Climate Change and Sea Level Rise
ii

Hawaii Statewide Transportation Plan Update Issue Paper on Climate Change and Sea Level Rise
1
Foreword The Hawaii state transportation planning process is being supported by the development of a series of issue papers. Each paper explores a different issue that will have a major impact on Hawaii’s transportation future. The emerging issues for Hawaii’s transportation were selected by the Hawaii Statewide Transportation Plan Team as issues which may have significant impact on Hawaii’s residents and their transportation needs. This issue paper addresses global warming, climate change and sea level rise as well as their effects on transportation planning. SSFM is the lead consultant for the Hawaii Statewide Transportation Plan (HSTP) update, and they are supported by a team of consultants. This paper’s lead author for Sections 1.0 and 2.0 describing the science of climate change and sea level rise is Dr. Chip Fletcher, University of Hawaii, School of Ocean and Earth Science and Technology (SOEST). The transportation applications in Hawaii and elsewhere were authored by SSFM staff. This “Issue Paper on Climate Change and Sea Level Rise” includes:
• Primer on Climate Change and Sea Level Rise; • General Effects of Climate Change • Hawaii’s Responses to Greenhouse Gas (GHG) Emission Reduction • Resources for Transportation Planning • Best practices from other states; and, • Proposed guidance to be included in the HSTP Update.
Issue papers in this series include:
Issue Paper #1: Impact of Federal Planning Requirements (Eight Planning Factors) Issue Paper #2: Climate Change and Sea Level Rise Issue Paper #3: Aging Population and Transportation Issue Paper #4: Fuel and Energy Scenarios for Hawaii Issue Paper #5: Land Use Planning Issue Paper #6: Planning & Design: Context Sensitive Solutions (CSS), Complete Streets, Smart
Growth, and Transit Oriented Development (TOD) Issue Paper #7: Transportation Security Issue Paper #8: System Preservation Issue Paper #9: Financial Scenarios Issue Paper #10: Environmental Coordination

Hawaii Statewide Transportation Plan Update Issue Paper on Climate Change and Sea Level Rise
2

Hawaii Statewide Transportation Plan Update Issue Paper on Climate Change and Sea Level Rise
3
Section 1.0 Primer on Climate Change and Sea level Rise This issue paper will discuss climate change, global warming, and sea level rise. The paper will highlight potential impacts on national1 and local scales2, and suggested public policies. Section 1.1 Introduction to Climate Change Earth’s climate is perpetually changing. Climate change may result from human activities that cause the buildup of atmospheric greenhouse gases or from natural factors such as changes in the sun’s intensity, volcanoes, or oceanic circulation. While we cannot control the activity of the sun or changes in ocean circulation, we can take actions to change human activities and therefore reduce the buildup of greenhouse gases. Over the past century, and particularly since the 1970’s, the average global surface temperature has risen sharply.3 There is scientific consensus that this is the result of heat trapped in the atmosphere by excess greenhouse gases produced by human activities.4 The main greenhouse gases resulting from human activity are carbon dioxide (CO2), methane (CH4), and nitrous oxide (N2O). Water vapor (H2O) is in fact the most powerful heat-trapping gas, but has only an average 10 day residency. Water vapor tends to increase in a warmer atmosphere, thus functioning as a positive feedback. With the increase in greenhouse gases (GHG), the heat-trapping capability of earth’s atmosphere grows, causing a rise in surface temperature. According to the U.S. National Academy of Sciences, “A strong, credible body of scientific evidence shows that climate change is occurring, is caused largely by human activities, and poses significant risks for a broad range of human and natural systems...Some scientific conclusions or theories have been so thoroughly examined and tested, and supported by so many independent observations and results, that their likelihood of subsequently being found to be wrong is vanishingly small. Such conclusions and theories are then regarded as settled facts. This is the case for the conclusions that the earth system is warming and that much of this warming is very likely due to human activities.” 5
1 Karl, Thomas R., Melillo, Jerry M., and Peterson, Thomas C., (eds.). Global Climate Change Impacts in the United States. Cambridge University Press. 2009. http://www.globalchange.gov/publications/reports/scientific-assessments/us-impacts 2 Fletcher, C.H. Hawaii's Changing Climate, Briefing Sheet, 2010. University of Hawaii Sea Grant College Program, Center for Island Climate Adaptation and Policy. Honolulu, Hawaii. 2010. (7p). 3 Easterling, D., Wehner, M. Is the climate warming or cooling? Geophysical Research Letters, v 36, L08706. 2009. NASA: http://climate.nasa.gov/news/index.cfm?FuseAction=ShowNews&NewsID=175. 4 National Academy of Sciences (NAS). Advancing the Science of Climate Change. The National Academies Press. Washington, D.C. 2010. http://www.nap.edu/catalog.php?record_id=12782 5 National Academy of Sciences. Chapter 1. (See footnote 4.)
Did You Know? If it were not for naturally occurring greenhouse gases, the Earth would be too cold to support life as we know it. Without the greenhouse effect, the average temperature of the Earth would be about -2°F rather than the 57°F we currently experience. Source: U.S. Energy Information Administration

Hawaii Statewide Transportation Plan Update Issue Paper on Climate Change and Sea Level Rise
4
Section 1.2 Description of Climate Change Global climate change is a consequence of deforestation, industrial agriculture, and burning coal and oil. These activities release carbon dioxide and other types of heat-trapping gases to the atmosphere in quantities that have increased with the rise of the industrial age. There is abundant, convincing, and reproducible scientific evidence that the resulting increase in earth’s surface temperature is having measurable impacts on human communities and natural ecosystems.6 In fact, within the scientific community there is no significant debate about whether climate change is happening, the debate today is about whether climate is changing faster than anticipated.7 Greenhouse gases, most significantly water vapor and carbon dioxide, accumulate in the troposphere (the lower atmosphere) and trap some long wave energy radiating from earth’s surface. To an observer in space, earth will appear to have cooled since the 1970’s (and this has been documented by satellites8) because of heat trapped near the surface by GHG buildup. Approximately half of the sun’s radiation reaches earth’s surface where it may be reflected, or absorbed by land and ocean masses as illustrated in Figure 1. Figure 1 The Greenhouse Effect
About half of the solar radiation that reaches the top of the atmosphere makes it to earth’s surface. When this energy is re-radiated as long wave radiation it may be trapped by greenhouse gasses leading to net warming of the atmosphere.9 Absorbed energy is re-radiated as infrared (long wave) radiation back into the atmosphere where it can be trapped by GHG. The resulting accumulation of heat is the main mechanism of global warming and is called “The Greenhouse Effect.” The more GHG that accumulates, the more heating occurs due to GHG trapping.
Source: Australian Bureau of Meteorology 6 Doran, P.T., and Zimmerman, M.K. Examining the scientific consensus on climate change. EOS. v.90, no.3. 2009. See: http://tigger.uic.edu/~pdoran/012009_Doran_final.pdf. 7 Kerr, R.A. Amid Worrisome Signs of Warming, Climate Fatigue Sets In. Science. v. 326 no. 5955. November 13, 2009. P. 926-928. DOI: 10.1126/science.326.5955.926 8 Harries, J.E., et al. Increases in greenhouse forcing inferred from the outgoing long wave radiation spectra of the Earth in 1970 and 1997. Nature. March 15, 2001. P. 355-357. http://www.nature.com/nature/journal/v410/n6826/abs/410355a0.html. SEE ALSO: Philipona, R., et.al Radiative forcing - measured at Earth’s surface - corroborates the increasing greenhouse effect, Geophysical Research Letters. v. 31, L03202. 2004. doi:10.1029/2003GL018765. 9 Graphic from Australian Bureau of Meteorology: http://www.bom.gov.au/info/climate/change/gallery/7.shtml.

Hawaii Statewide Transportation Plan Update Issue Paper on Climate Change and Sea Level Rise
5
Climate Change or Global Warming? The term climate change is often used interchangeably with the term global warming, but according to the National Academy of Sciences, "the phrase 'climate change' is growing in preferred use to 'global warming' because it helps convey that there are [other] changes in addition to rising temperatures." Source: U.S. Environmental Protection Agency
Since the beginning of the industrial revolution in the early 19th century, the presence of CO2 in the atmosphere has grown 35%. By 2015, the atmospheric CO2 concentration will reach 400 parts per million (ppm)10, growing at an average annual rate of about 2.1 ppm, almost three times the growth rate of the 1990’s.11 This is the highest concentration in earth’s history measured over the past 15 million years.12 It is estimated that 15 million years ago, the sea level was 25 to 40 meters (82 to 131 feet) higher and global temperature was 3 to 6oC (5 to 10oF) warmer. The increase in CO2 is primarily caused by the use of fossil fuels and loss of forests. This boost in the concentration of GHG has led to a complementary rise in average temperature.13 As of this writing, May, 2010 marks the latest in a string of the 12 warmest months in over a century.14 In 2009, the average temperature on earth’s surface was approximately 14.7oC (58.4oF), making that year the second warmest since instrumental temperature records began in 1880. According to federal climate sources, 2009 was only a fraction of a degree cooler than 2005, the warmest year on record, and tied with a cluster of other years — 1998, 2002, 2003, 2006 and 2007— as the second warmest year since recordkeeping began. 15 The ten warmest years on record all occur within the 12-year period of 1997-2008, and the first decade of the 21st century was the warmest decade since instrumental records began. During the past three decades, earth’s surface temperature has trended upward about 0.2°C (0.36°F) per decade. As greenhouse gases accumulate in the atmosphere, the amount of heat they trap also increases. But there are offsetting processes such as changes in cloud cover (in some cases clouds trap heat and produce warming, in other cases clouds reflect sunlight and promote cooling), and the increase of aerosols due to smog and industrial pollution. The overall impact of compounds that alter the balance between radiation entering the atmosphere and that exiting the atmosphere can be assessed as shown in Figure 2.
10 ppm means “parts per million.” It is a measurement of concentration the same way that “percent” means parts per hundred. In this case, ppm means molecules of CO2 per million molecules of air. 11 Kerr. 2009. 12 Tripati, A.K., Roberts, D.R., and Eagle, R.A. Coupling of CO2 and ice sheet stability over major climate transitions of the last 20 million years. Science. Oct. 8, 2009. http://www.sciencemag.org/cgi/content/abstract/1178296. 13 Le Treut, Hervé and Somerville, Richard. Historical Overview of Climate Change. 2007. 14 NASA Surface Temperature Analysis: http://data.giss.nasa.gov/gistemp/ 15 NASA. (See footnote 14.) See also NOAA Climate Services: http://www.climate.gov/#climateWatch.

Hawaii Statewide Transportation Plan Update Issue Paper on Climate Change and Sea Level Rise
6
Figure 2 Principle agents of the radiative forcing of climate change 1750-2005
Researchers use the term “radiative forcing” to describe the change in the balance between radiation coming into the atmosphere and radiation going out. On average, a positive radiative forcing tends to warm earth’s surface, and negative forcing tends to cool the surface. All measurements and theory indicate that because of increasing greenhouse gas, earth is experiencing a positive radiative forcing. Radiative forcing is the net effect of various factors that cool (blue bars) or warm (red bars) the atmosphere. Radiative forcing is measured in watts/m2 (bottom axis).
Source: Ritter, Michael E. The Physical Environment: an Introduction to Physical Geography. 2006.16 The top three-quarters of the box report on human-induced radiative forcing. The lower portion reports on the sun, which is the only persistent natural factor since volcanic and El Niño Southern Oscillation (ENSO) effects are short-lived. The total net effect of human activities is strong warming, and CO2 is the most important human factor.17 In the United States’ economy, transportation activities from the burning of fossil fuels are the second major cause of the increase in GHG in our atmosphere, and most definitely a major source globally. The first major cause of the increase in GHG in our atmosphere is attributed to the electric power industry. The U.S. transportation sector alone produces more GHG than most other nations’ entire economies.18 Ninety-five percent of GHG emissions from transportation are carbon dioxide (CO2).19 Hence, there is a focus on managing CO2 emissions in the transportation sector. While electricity production is responsible for its own portion of GHG emissions, it is not growing as fast as the transportation sector.
16 University of Wisconsin, Steven Point. www.uwsp.edu/geo/faculty/ritter/geog101/textbook/title_page.html 17 Karl et al. 2009. (See footnote 1). 18 Greene, David and Shafer, Andreas. Reducing Greenhouse Gas Emissions from U.S. Transportation: Prepared for the Pew Center on Global Climate Change. May 2003. Pg. 2. 19 Greene and Shafer, Pg. iii. (See footnote 17).

Hawaii Statewide Transportation Plan Update Issue Paper on Climate Change and Sea Level Rise
7
The 2009 report to Congress by the U.S. Global Change Research Program states: “While it is widely recognized that emissions from transportation have a major impact on climate, climate change will also have a major impact on transportation.” 20 The report identifies the following key findings in this study of transportation:
• Sea level rise and storm surge will increase the risk of major coastal impacts, including both temporary and permanent flooding of airports, roads, rail lines, and tunnels.
• Flooding from increasingly intense downpours will increase the risk of disruptions and delays in air, rail, and road transportation, and damage from mudslides in some areas.
• The increase in extreme heat will limit some transportation operations and cause pavement and track damage. Decreased extreme cold will provide some benefits such as reduced snow and ice removal costs.
• Increased intensity of strong hurricanes would lead to more evacuations, infrastructure damage and failure, and transportation interruptions.
In Hawaii, many of these warnings are relevant. Data21 show a rapid rise in air temperature in the past 30 years (averaging 0.3°F per decade), with stronger warming at high elevations (above 2600 feet). The rate of temperature rise at lower elevations, 0.16oF per decade, is less than the global rate (about 0.36°F per decade); however, the rate of warming at high elevations in Hawaii, 0.48oF per decade, is faster than the global rate. Most of the warming is related to a larger increase in minimum temperatures compared to the maximum—a net warming about 3 times as large— causing a reduction of the daily temperature range. This response to global warming is consistent with similar trends22 observed in North America. Between 1958 and 2007, the amount of rain falling in the very heaviest downpours (defined as the heaviest 1% of all events) has increased approximately 12% in Hawaii.23 Heavy rainfall in Hawaii means more than simply getting wet; it is a major challenge for civil defense agencies and emergency responders. Intense rains trigger a domino effect of other impacts including flash flooding, mudslides and debris flows, road and business closure, infrastructure damage, and loss of public services to isolated communities. Section 1.3 Description of Sea level Rise Global average sea level is rising today as shown in Figure 3 and will continue to rise in the centuries ahead.24 Greenhouse-gas-induced global warming leads to warming of the ocean. Warming causes ice to melt and ocean water to expand; these two processes are the main causes of global sea level rise. Coastal communities are subject to flooding by rain storms that are coincident with high tides, accelerated coastal erosion, and saltwater intrusion into streams and other terrestrial ecosystems. Sea
20 Karl et al. 2009. (See footnote 1.) 21 Giambelluca, T. W., Diaz, H. F., and Luke, M. S. A. Secular Temperature Changes in Hawaii. Geophysical Research Letters. 2008. 2008 35:L12702. 22 Meehl, G. A. et al. Relative Increase of Record High Maximum Temperatures Compared to Record Low Minimum Temperatures in the U.S. Geophysical Research Letters. 2009. 36:L23701. 23 Groisman, P. Ya., et al. Contemporary changes of the hydrological cycle over the contiguous United States, trends derived from in situ observations. Journal of Hydrometeorology. 5(1): 64-85. 2004. Cited in: Global Climate Change Impacts in the United States, Karl, T. R.; Melillo, J. M.; Peterson, T. C. (eds.). Cambridge University Press. 2009. 24 NAS. (See footnote 4.)

Hawaii Statewide Transportation Plan Update Issue Paper on Climate Change and Sea Level Rise
8
level rise threatens cities, ports, coastal communities, and other types of economies with passive inundation due to rising waters, and damaging storm surge associated with hurricanes. Because this threat has enormous economic and environmental consequences, it is important to understand how global warming is changing the level of the sea. Figure 3 Global sea level rise as measured by satellite detection of the ocean surface
Source: AVISO: Archiving, Validation and Interpretation of Satellite Oceanographic Data25 Using the time it takes for radar to travel to earth’s surface and back, satellites using altimeters26 can measure the sea surface from space to better than 5 cm (2 inches).27 The TOPEX/Poseidon mission (launched in 1992) and its successors Jason-1 (2001) and Jason-2 (2008) have mapped the sea surface approximately every 10 days for 16 years. These missions have led to major advances in physical oceanography and climate studies.28 Altimeter measurements indicate that global mean sea level has risen about 4.3 cm (1.7 in) from 1993 to 2010 at a mean rate of approximately 3.3 mm/yr (0.13 in/yr).29 However, this rise is not uniform across the oceans. A map of altimeter measurements reveals the rate of sea level change since 1993 on the world’s oceans as shown in Figure 4.
25 Figure from http://www.aviso.oceanobs.com/en/news/ocean-indicators/mean-sea-level/. 26 Satellite altimetry measures the time taken by a radar pulse to travel from a satellite to the surface and back to the satellite receiver. Combined with precise satellite location data, altimetry measurements yield sea-surface heights. See: http://en.wikipedia.org/wiki/TOPEX/Poseidon 27 Leuliette, E. W., et.al. Calibration of TOPEX/Poseidon and Jason altimeter data to construct a continuous record of mean sea level change. Marine Geodesy. v. 27. 2004. P. 79-94. See also, Beckley, B.D., et al. A reassessment of global and regional mean sea level trends from TOPEX and Jason-1 altimetry based on revised reference frame and orbits. Geophysical Research Letters. 34(14), L1-4608. 2007. See also Rising Water: new map pinpoints areas of sea level increase at: http://climate.nasa.gov/news/index.cfm?FuseAction=ShowNews&NewsID=16. 28 Jet Propulsion Laboratory. Ocean surface topography from space. 2009. http://sealevel.jpl.nasa.gov/. 29 See: http://sealevel.colorado.edu/.
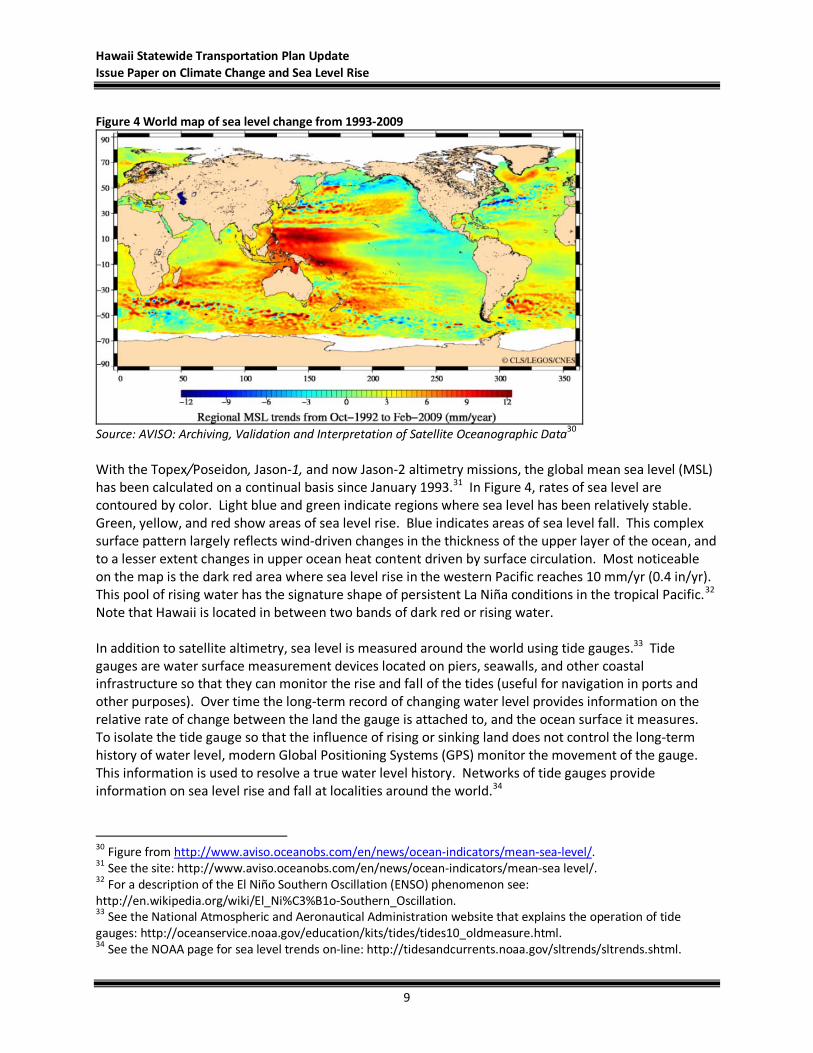
Hawaii Statewide Transportation Plan Update Issue Paper on Climate Change and Sea Level Rise
9
Figure 4 World map of sea level change from 1993-2009
Source: AVISO: Archiving, Validation and Interpretation of Satellite Oceanographic Data30 With the Topex/Poseidon, Jason-1, and now Jason-2 altimetry missions, the global mean sea level (MSL) has been calculated on a continual basis since January 1993.31 In Figure 4, rates of sea level are contoured by color. Light blue and green indicate regions where sea level has been relatively stable. Green, yellow, and red show areas of sea level rise. Blue indicates areas of sea level fall. This complex surface pattern largely reflects wind-driven changes in the thickness of the upper layer of the ocean, and to a lesser extent changes in upper ocean heat content driven by surface circulation. Most noticeable on the map is the dark red area where sea level rise in the western Pacific reaches 10 mm/yr (0.4 in/yr). This pool of rising water has the signature shape of persistent La Niña conditions in the tropical Pacific.32 Note that Hawaii is located in between two bands of dark red or rising water. In addition to satellite altimetry, sea level is measured around the world using tide gauges.33 Tide gauges are water surface measurement devices located on piers, seawalls, and other coastal infrastructure so that they can monitor the rise and fall of the tides (useful for navigation in ports and other purposes). Over time the long-term record of changing water level provides information on the relative rate of change between the land the gauge is attached to, and the ocean surface it measures. To isolate the tide gauge so that the influence of rising or sinking land does not control the long-term history of water level, modern Global Positioning Systems (GPS) monitor the movement of the gauge. This information is used to resolve a true water level history. Networks of tide gauges provide information on sea level rise and fall at localities around the world.34
30 Figure from http://www.aviso.oceanobs.com/en/news/ocean-indicators/mean-sea-level/. 31 See the site: http://www.aviso.oceanobs.com/en/news/ocean-indicators/mean-sea level/. 32 For a description of the El Niño Southern Oscillation (ENSO) phenomenon see: http://en.wikipedia.org/wiki/El_Ni%C3%B1o-Southern_Oscillation. 33 See the National Atmospheric and Aeronautical Administration website that explains the operation of tide gauges: http://oceanservice.noaa.gov/education/kits/tides/tides10_oldmeasure.html. 34 See the NOAA page for sea level trends on-line: http://tidesandcurrents.noaa.gov/sltrends/sltrends.shtml.

Hawaii Statewide Transportation Plan Update Issue Paper on Climate Change and Sea Level Rise
10
Using the global network of tide gauges, one study35 identified acceleration in the global rate of sea level rise that occurred in approximately 1990 as depicted in Figure 5. Figure 5: Global sea level trend, 1962-1990
The study recognized an average global sea level trend over the period 1962–1990 of 1.56 mm/yr (0.06 in/yr). However, after 1990, the global trend increased to a rate of 3.2 mm/yr (0.13 in/yr), matching estimates obtained from satellite measurements. Increased rates in the tropical and southern oceans primarily account for the acceleration. The timing of the global acceleration corresponds to similar trend changes in upper ocean heat content and ice melt. This acceleration provides important confirmation of climate models predicting that sea level rise will accelerate in response to global warming.
Source: Merrifield, et al. Journal of Climate, v. 22. 2009.36 However, further work37 with long tide gauge records Figure 6, Long Tide Gauge Records, 1700-2000 as shown in Figure 6 reveals that sea level acceleration may have started earlier, more than 200 years ago. By reconstructing global mean sea level since 1700 from long tide gauge records researchers concluded that sea level acceleration began at the end of the 18th century. Sea level rose by 6 cm (2.4 in) during the 19th century and 19 cm (7.5 in) in the 20th century. The shaded portion represents the uncertainties of the reconstruction.38 Sea level rise presents challenges to coastal communities and ecosystems. Accordingly, it is desirable to have an estimate of SLR this century to properly design mitigation and adaptation strategies. Source: Figure from Jevrejeva et al. 2008.
35 Merrifield, M.A.; Merrifield, S.T.; and Mitchum, G.T. An anomalous recent acceleration of global sea level rise. Journal of Climate, v. 22. 2009. p. 5772-5781. 36 Figure from Merrifield et al. 2009. 37 Jevrejeva, S., Moore, J.C.; Grinsted, A., and Woodworth, P.L. Recent global sea level acceleration started over 200 years ago? Geophysical Research Letters. v. 35, LO8715. 2008. doi: 10.1029/2008GL033611. 38 Figure from Jevrejeva et al. 2008.

Hawaii Statewide Transportation Plan Update Issue Paper on Climate Change and Sea Level Rise
11
For instance, California has mapped the impact zone of a 1.4 m (4.6 ft) rise in sea level. They have identified the land and development that is vulnerable to inundation39 including: 480,000 people, $100 billion in property, 140 schools, 34 police and fire stations, 55 healthcare facilities, 330 EPA hazardous waste sites, 3500 miles of roads and highways, 280 miles of railroads, 30 power plants, 28 wastewater treatment plants.40 A study published by the National Academy of Sciences in late 200941 predicts sea level by the end of the century using the GHG emission scenarios defined by the Intergovernmental Panel on Climate Change (IPCC)42. Their model projects a sea level rise of 0.75 to 1.90 m (2.5 to 6.2 ft) for the period 1990-2100 as illustrated in Figure 7 and outlined in Table 1. Figure 7: Projection of Sea level Rise from 1990 to 2100 Based on IPCC temperature projections for three different emission scenarios
Source: Vermeer and Rahmstorf. “Global sea level linked to global temperature.” The sea level range projected in the IPCC 2007 AR4 for these scenarios is shown for comparison in the bars on the right of Figure 7. Also shown is the observations-based annual global sea level data noted in red.43 The study authors note that to limit the amount of global sea level rise to a maximum of 1 m (3.3 ft) in the long run, reductions in greenhouse gas emissions would likely have to be deeper than those needed to limit global warming to 2oC (3.6oF), which is the policy goal now supported by many countries.
39 See California Executive Order S-13-08 2008 at: http://gov.ca.gov/executive-order/11036/ 40 See the report by the Pacific Institute at: http://www.pacinst.org/reports/sea_level_rise/index.htm 41 Vermeer, M. and Rahmstorf, S. Global sea level linked to global temperature. Proceedings of the National Academy of Sciences. v106.51: 21527-21532. December 22, 2009. http://www.pnas.org/content/106/51/21527.full 42 IPCC. Climate Change 2007: The Physical Science Basis. Contribution of Working Group I to the Fourth Assessment Report (AR4) of the Intergovernmental Panel on Climate Change. Solomon, S., et al, editors. Cambridge University Press, Cambridge, United Kingdom and New York, NY, USA. 996 pp: http://www.ipcc.ch/pdf/assessment-report/ar4/wg1/ar4-wg1-chapter3.pdf 43 Vermeer and Rahmstorf. 2009.

Hawaii Statewide Transportation Plan Update Issue Paper on Climate Change and Sea Level Rise
12
Source: Vermeer and Rahmstorf. “Global sea level linked to global temperature.” In Hawaii, each island may experience its own rate of vertical land movement. Hence, local relative sea level rise may vary from one place to another. According to the Honolulu tide gauge, sea level has risen at approximately 1.5 mm/yr (0.6 in/decade) over the past century.44 Tide gauges on the Big Island and Maui indicate sea level is rising at a faster rate, and on Kauai the rate is approximately equal to Honolulu. This may not seem like a substantial rate, however, long-term sea level rise, when considered over a century, can lead to chronic coastal erosion, coastal flooding, and drainage problems, all of which are experienced in Hawaii. This long-term trend has increased the impact of short-term fluctuations on coastal sea level45 leading to episodic flooding and erosion along the coast due to extreme tides. Continued sea level rise will increase marine inundation of coastal roads and communities. Salt intrusion will intensify in coastal wetlands and groundwater systems, taro lo‘i, estuaries, and elsewhere. Extreme tides already cause drainage problems in developed areas and communities in Hawaii located at the intersection of intensifying storm runoff and rising ocean waters will endure increased flooding.
44 See the Honolulu tide record at National Oceanographic and Atmospheric Administration, Sea Levels Online: http://tidesandcurrents.noaa.gov/sltrends/sltrends.html; last accessed January 16, 2010. 45 Firing, Y. and Merrifield, M. A. Extreme sea Level Events at Hawai’i: Influence of Mesoscale Eddies. Geophysical Research Letters. 2004. 31:L24306.
Hawaii Statewide Transportation Plan Update Issue Paper on Climate Change and Sea Level Rise
13
Section 2.0 Other Effects of Climate Change Section 2.1 Temperature Extremes The primary effect of climate change is the increase in air temperature. Scientists expect that the average global surface temperature could rise 1.6˚-6.3˚C, or up to 11.34˚F by the end of this century, with significant variations throughout the planet.46 The increasing air temperatures severely affect earth’s environments. For instance, in a warming world it would be expected that the southern line of permanently frozen ground (permafrost) would begin to migrate to the north as warmer climate zones expand in the northern hemisphere. Indeed this is observed taking place in Canada.47 The boundaries of the tropics, defined by temperature, rainfall, wind, and ozone patterns, have shifted poleward by at least 2 degrees latitude in the last 25 years.48 Global warming is also changing the weather. In the decade of 2000 to 2009, the United States experienced twice as many record daily high temperatures as record lows. This means the hotter days are getting hotter and the colder days are getting hotter.49 Since 1970, the United States has seen a steady increase in the number of days over 90˚F. The average number of very hot days is increasing along with the number of heat waves. Six of the years between 1998 and 2007 are among the highest ten percent of hottest years in U.S. history. Along with an increase in hot days, there has also been a trend of a decreased number of frost days and very cold days. The U.S. Global Change Research Program reports that several aspects of climate change may threaten human health:
• There are likely to be increases in the risk of illness and death related to extreme heat and heat waves are very likely; some reduction in the risk of death related to extreme cold is expected.
• Warming is likely to make it more challenging to meet air quality standards necessary to protect public health.
• Extreme weather events cause physical and mental health problems. Some of these events are projected to increase.
• Some diseases transmitted by food, water, and insects are likely to increase. • Rising temperature and carbon dioxide concentration increase pollen production and prolong
the pollen season in a number of plants with highly allergenic pollen, presenting a health risk. • Certain groups, including children, the elderly, and the poor, are most vulnerable to a range of
climate-related health effects. 50 Ecosystem changes are occurring as well: mild winters in British Columbia allow for an infestation of the boring mountain pine beetle51; warming oceans have led to coral bleaching, a problem that is global in
46 U.S. Energy Information Administration 47 Thibault, S., and Payette, S. Recent permafrost degradation in bogs of the James Bay area, northern Quebec, Canada. Permafrost and Periglacial Processes. 20 (4): 383. 2009. DOI: 10.1002/p.660. 48 Seidel D.J., Fu, Q., Randel, W.J., and Reichler, T.J., Widening of the tropical belt in a changing climate. Nature Geoscience. 2008. 1, 21-24. DOI10.1038/ngeo.2007.38 49 Meehl, G. A., et al. The relative increase of record high maximum temperatures compared to record low minimum temperatures in the U.S. Geophysical Research Letters. 2009. doi:10.1029/2009GL040736. 50 Karl et al. 2009. (See footnote 4.)

Hawaii Statewide Transportation Plan Update Issue Paper on Climate Change and Sea Level Rise
14
extent52; and ecosystems, to remain in an area with the same average temperature to which they have evolved, have to migrate an average 0.42 km per year if they are to keep pace with climate change.53 This increase in air temperature is causing a reduction of the world’s ice volume. For instance, satellites have documented accelerating melting on both Greenland and Antarctica as shown in Figure 8.54 Figure 8: Ice loss from (a) Greenland and (b) Antarctic ice sheets during the period April 2002 to February 2009
(a) (b) Source: Velicogna, I. Increasing rates of ice mass loss from the Greenland and Antarctic ice sheets. Section 2.2 Ocean Acidity As rising carbon dioxide in the atmosphere mixes with seawater, the ocean acidifies. Measurements55 at the University of Hawaii oceanographic research site, station ALOHA56 over two decades document that the surface ocean around Hawaii has grown more acidic at exactly the rate expected from chemical equilibration with the atmosphere. Continued acidification may have a host of negative impacts on marine biota, and has the potential to alter the rates of ocean biogeochemical processes. When carbon dioxide reacts with seawater, it reduces the availability of dissolved carbonate. Carbonate (CO3) is vital to shell and skeleton formation in corals, marine plankton, some algae, and shellfish. Ocean acidification could have profound impacts on some of the most fundamental biological and geochemical processes of the sea in coming decades. Plankton is a critical food source that supports the
51 Kurz, W. A., et al. Mountain pine beetle and forest carbon feedback to climate change. Nature, 452, 987-990. 2008. doi: 10.1038/nature06777. 52 Mao-Jones, J., et al. How Microbial Community Composition Regulates Coral Disease Development. 2010. doi:10.1371/journal.pbio.1000345. See also: Hoegh-Guldberg, O., et al. Coral reefs under rapid climate change and ocean acidification. Science, 318 (5857): 1737–42. 2007. doi:10.1126/science.1152509. 53 Loarie, S., et al. The velocity of climate change. Nature 462, 1052-1055. 2009. doi:10.1038/nature08649. 54 Velicogna, I. Increasing rates of ice mass loss from the Greenland and Antarctic ice sheets revealed by GRACE. Geophysical Research Letters 36, L19503. 2009. doi:10.1029/2009GL040222. 55 Dore, J.E. et al. Physical and Biogeochemical Modulation of Ocean Acidification in the Central North Pacific, Proceedings of the U.S. National Academy of Sciences. 2009. 106:12235-12240. See also Byrne, R.H., et al. Direct Observations of Basin-wide Acidification of the North Pacific Ocean. Geophysical Research Letters. 37: L02601. 2007. 56 See: http://www.soest.hawaii.edu/soest_web/2009_news_PDFs/PNAS_Ocean_Acidification_release.pdf; last accessed January 16, 2010.

Hawaii Statewide Transportation Plan Update Issue Paper on Climate Change and Sea Level Rise
15
entire marine food chain. Declining coral reefs will impact coastal communities, tourism, fisheries, and overall marine biodiversity. Abundance of commercially important shellfish species may decline, and negative impacts on finfish may occur. This rapidly emerging scientific issue and its potential ecological impacts have raised concerns across the scientific and fisheries communities. Section 2.3 Precipitation Cloud formation by trade winds is the most reliable and abundant source of water among high Pacific islands such as Hawaii. Although atmospheric circulation in the tropical Pacific has decreased and global warming is identified as the cause, it is not yet clear how the Hawaiian trade winds will change in the future. 57 It also remains unclear how future rainfall will respond to global warming; the results of modeling studies58 have been equivocal, although to some extent they indicate that we should expect decreased rainfall. Indeed, studies of rainfall records in Hawaii confirm this. Rainfall in Hawaii has steadily declined about 15 percent over the past 20 years. 59 Streams are one beneficiary of rain. Rainfall feeds streams in two ways: storm flow and base flow. Storm flow responds very quickly to rainfall, and causes stream levels to rise and stream discharge to increase during and immediately after rainfall. Base flow, on the other hand, is supplied by groundwater discharge and maintains streamflow during periods between rainfall events. Base flow also responds to changes in rainfall over time, but much more slowly than storm flow. Beginning in the early 1940’s, base flow has declined around the state,60 and the cause is likely related to decreased rainfall. In Hawaii, rainfall combines with steep geographic features to produce unique ecosystems that support diverse plants and animals. This pattern is threatened by rising air temperatures, decreased rainfall and stream discharge. Taro farming, a form of wetland agriculture common on low-lying coastal plains, is also tied to stream flow, but vulnerable to sea level rise. Between intruding salt water and declining stream flow, some farmers may be experiencing the impacts of global warming. High islands generate a nearly perpetual band of clouds on their slopes. Scientists infer that rising temperatures in Hawaii could result in a shallower cloud zone because of a possible rise in the lifting condensation level, which controls the bottom of the cloud, and a decline in the height of the trade wind inversion, which controls the top of the cloud. Where clouds intercept the land (forming fog) they deposit water droplets directly on the vegetation and soil. This process is a significant source of water to the mountain ecosystems of Hawaii, especially at windward exposures. With a smaller cloud zone, less cloud water would be available to these important forests. Another concern is changes in the process of “evapotranspiration.” While rainfall and cloud water are the sources of water to the ecosystem, evaporation and transpiration (the emission of water vapor
57 Vecchi, G. A., et al. Weakening of Tropical Pacific Atmospheric Circulation due to Anthropogenic Forcing. Nature. 2006. 441:73–76. 58 Timm, O. and Diaz, H. Synoptic-Statistical Approach to Regional Downscaling of IPCC Twenty-First Century Climate Projections: Seasonal Rainfall over the Hawaiian Islands. Journal of Climate. 2009. 22.16:4261-4280. 59 Chu, P.S. and Chen, H. Interannual and Interdecadal Rainfall Variations in the Hawaiian Islands. Journal of Climate. 2005. 18:4796-4813. See also Diaz, H. F., Chu, P.S., and Eischeid, J. K. Rainfall Changes in Hawai`i during the Last Century. 16th Conference on Climate Variability and Change, American Meteorological Society, Boston, MA. 2005. See also Karl, T.R., Melillo, M., and Peterson, T.C., (eds.). Global Climate Change Impacts in the United States. Cambridge University Press. 2009. 60 Oki, D. Trends in Streamflow Characteristics at Long-term Gauging Stations, Hawaii, U.S. Geological Survey Scientific Investigations Report 2004-5080. 2004.
Hawaii Statewide Transportation Plan Update Issue Paper on Climate Change and Sea Level Rise
16
through the leaves of plants) return water to the atmosphere, thus reducing the amount going into streams and groundwater. Effects of warming on evapotranspiration are as yet unknown, but changes could further impact water resources already being affected by reduced rainfall. Because surface air temperature, cloudiness, and rainfall depend on the trade winds, forecasting Hawaii’s climate is dependent on accurately modeling trade wind changes. Intergovernmental Panel on Climate Change61 models do not agree on these aspects of climate for the region around Hawaii. Other modeling62 has shown that wind and rainfall responses to warming around the Pacific are not uniform and depend strongly on the climate model being used. Skillful projections63 of island climate must take into account the interaction of trade winds with island topography, relying on continued and enhanced monitoring of key climate variables. Extreme heat brings about faster than usual evaporation. When the evaporation rate is faster than precipitation can replenish the surface, drought occurs. Drought has become an increasingly dangerous problem, mostly for the Western United States. Droughts dry out soil and plants, making life almost unsustainable. It also brings about the risk of fire with intense heat 64 thus threatening food production. According to the Pacific Disaster Center, there were 1,291 brush fires in Hawaii between 1972-1999 that burned over 64,000 acres and impacted 43 structures. Because Hawaii’s ecosystem is not adaptive to wildfires, native plants can become extinct, negatively impacting the ecosystem. Wildfires also cause soil erosion. This increases soil runoff into the oceans, a potentially negative stressor to fringing reef ecosystems. Soil erosion and damage from wildfire impact Hawaii’s watersheds, leaving the area without the soil, trees, and plants that act as natural absorbers of precipitation and runoff, thus replenishing natural water reserves.65 Related to this is the documented increase in intense rainfall events in Hawaii. Decreased watershed function promotes runoff damage occurring as a result of heavy precipitation. Section 2.4 Tropical Storms and Hurricanes There has been considerable investigation in the research community concerning whether the characteristics of tropical cyclones have changed or will change in a warming climate — and, if so, how? Reports over the past decade have arrived at conflicting conclusions. The frequency and intensity of storms is highly variable, and the historical record documenting these characteristics is short and not globally robust. This greatly complicates the detection of long-term trends. Equally difficult is assigning trends to the influence of rising levels of atmospheric greenhouse gases or global temperature patterns. Hence, it is uncertain whether climate change is responsible for changes in tropical cyclone activity.
61 IPCC. Climate Change 2007: Synthesis Report. Contribution of Working Groups I, II and III to the Fourth Assessment Report of the Intergovernmental Panel on Climate Change. Pachauri, R.K and Reisinger, A., editors. Geneva, Switzerland. 2007. 62 Xie, S.-P. et al. “Indian Ocean Capacitor Effect on Indo-western Pacific Climate during the Summer Following El Nino.” Journal of Climate. 2009. 22.3: 730–747. 63 Timm and Diaz. See footnote 59. 64 Kunkel, Kenneth, et al. Observed Changes in Weather and Climate Extremes. 2008. 65 Pacific Disaster Center. www.pdc.org/iweb/wildfire_effects.jsp?subg=1

Hawaii Statewide Transportation Plan Update Issue Paper on Climate Change and Sea Level Rise
17
However, there is consensus among a diverse group of hurricane experts66 that warming will cause the globally averaged intensity of tropical cyclones to shift towards stronger storms, with intensity increases of 2–11% by 2100. Existing modeling studies also consistently project decreases in the globally averaged frequency of tropical cyclones, by 6–34%. Balanced against this, higher resolution modeling studies typically project substantial increases in the frequency of the most intense cyclones, and increases of the order of 20% in the precipitation rate within 100 km of the storm centre.
66 Knutson, T.R., et al. Tropical cyclones and climate change. Nature Geoscience 3, 157 – 163. 2009. http://www.nature.com/ngeo/journal/v3/n3/abs/ngeo779.html

Hawaii Statewide Transportation Plan Update Issue Paper on Climate Change and Sea Level Rise
18

Hawaii Statewide Transportation Plan Update Issue Paper on Climate Change and Sea Level Rise
19
Section 3.0 General Effects of Climate Change on the Transportation System Overall, the negative impacts of climate change on the transportation system include:
• damage to infrastructure due to extreme heat • increased incidence of wildfires and drought • increased intense runoff causing surface damage • rising sea level causing coastal erosion and wave impacts • drainage problems in coastal settings due to flash flooding and drainage blocked by high sea
level • changes in tropical storms and the damage they cause
Section 3.1 Warming Temperatures Recent climate change has created secondary effects that bring many challenges for transportation systems. A more direct effect of warmer climates is the deformation of the materials used for construction of roadway facilities. Under hotter conditions, the chemical and physical makeup of some materials can change, leading to the slow disintegration of roads, bridges, and rails. The increase in temperature also makes more roadside areas susceptible to wildfires. In addition to the effects of wildfires discussed earlier, wildfires are extremely dangerous and unpredictable. Access to transportation facilities may be blocked for long periods of time. Roads may become impassable due to the wildfires themselves or due to the space needed by emergency vehicles to fight the wildfire. For air transportation, warmer weather creates a complex problem for airport facilities. Runways at airports near the ocean are also subject to the same degradation as roadways. Aircrafts are also affected because warmer air is less dense, making it more difficult for airplane wings to generate sufficient lift. Especially at high temperatures, this problem can lead to delays and cancellations during extended periods of extremely hot temperatures.67 Section 3.2 Precipitation As described earlier, the frequency of intense rainfall events is increasing. The flooding that results affects transportation near or on the low-lying lands near coastlines, rivers, and lakes. In Hawaii’s short and steep watersheds, intense precipitation can also severely damage roads and other paved surfaces. Culverts and drainage systems become overwhelmed by the increased amount of storm runoff, flooding streets and causing delays in transportation. Also, precipitation erodes and moves sediment while intense periods of precipitation will exacerbate the risk of slope failure of various types. Overall, an increase in intense precipitation demands updates to road designs, road culverts, tunnels, rail lines, and low-lying bridges to provide safety and sustainability during floods and intense rain.68
67 Transportation Research Board (TRB). Special Report 290: Potential Impacts of Climate Change on U.S. Transportation. Prepublication copy. 2008. 68 TRB. Special Report 290.

Hawaii Statewide Transportation Plan Update Issue Paper on Climate Change and Sea Level Rise
20
Hotter temperatures yield higher rates of evaporation for some areas, leaving rivers and lakes dry of their water and boats stranded. Marine cargo shipping along shallow areas may find problems with more severe droughts.69 Section 3.3 Sea level Rise The effects of sea level rise will be felt first by transportation infrastructure in coastal regions. Along with impacts on commercial and residential structures, sea level rise will have a great effect on coastal roads and, harbors and ports. With the rate of sea level rise increasing, harbors and ports are at an increased risk of inundation from extreme tides and eventually from daily high tides. Adding to the problem, increased precipitation intensity amplifies the risk of flash floods. The increase in water activity around ports and harbors also increases the rate of erosion, making it harder to maintain facilities. Airports near coastlines will need to make updated plans to prevent inundation as sea level rises.70 Sea level rise, as described in further detail in the Effects on Hawaii and Local Transportation section, can have far-reaching effects on island communities. Section 3.4 Tropical Storms Every mode of transportation is vulnerable to the increasing intensity of tropical storms. Scientists have observed an increasing trend in the intensity of precipitation, and higher winds will drive greater wave action associated with tropical storms. Each has a major effect on transportation; surface transportation is affected by increased winds, waves, and precipitation. Coastal roadways are especially in danger because of their close vicinity to the shore. Winds can knock down trees, signs, utility poles, and traffic lights causing major delays. Heavy precipitation causes heavy flooding, blocking roadways, and flooding of sewer systems. Large, strong waves can erode and sometimes completely destroy roadways and bridges. Airports near the ocean as well as harbors also face similar risks from intense wave action. As sea levels rise, waves have more access to land, increasing the risk of waves crashing over barriers and onto the adjacent land, known as wave overtopping. Overall, transportation can be delayed and even halted at the will of intense tropical storms and hurricanes, affecting commerce, emergency responsiveness, and general mobility.71
69 TRB. Special Report 290. 70 TRB. Special Report 290. 71 TRB. Special Report 290.

Hawaii Statewide Transportation Plan Update Issue Paper on Climate Change and Sea Level Rise
21
Section 4.0 Specific Effects on Hawaii and Local Transportation Section 4.1 Local Issues Surrounded by the Pacific Ocean, Hawaii’s isolated location and topography make it highly vulnerable to sea level rise. Many of the primary population centers, transportation corridors, and community infrastructure (such as sewage treatment plants, and electricity-generating stations) are situated at low elevation and along the coastline. Portions of Honolulu’s multi-billion dollar rail transit system sit within 1 meter elevation of modern high tide with no discussion of how to climate-proof the system, resorts in Waikiki are investing in expensive renovations without incorporating any adaptation to sea level rise or storm intensity, and coastal armoring continues to be the planning tool of choice without public consideration of retreating from the receding shoreline. Studies indicate that meltwater from Greenland and Antarctica will take several decades to migrate into the north Pacific.72 Hence, short-term sea level rise in Hawaii will be largely driven by thermal expansion of ocean water, changes in currents and winds, and longer term patterns of Pacific climatology that influence these such as the El Niño Southern Oscillation (ENSO). How local winds and currents will change is unknown, and climate models disagree on these effects. Models also disagree in projecting changes to ENSO. The contribution of thermal expansion to global mean sea level rise has more than quadrupled in the past decade and is expected to contribute more than half of the rise in the upcoming century.73 However, no acceleration in the rate of local relative sea level rise has been detected among the Hawaii tide gauge network. In relation to Hawaii’s transportation facilities, sea level rise is a concern. Eighty percent of Hawaii’s goods arrive via state harbors, and these are among the first facilities that will be affected by sea level rise. The effects of sea level rise on transportation facilities such as Hilo and Kawaihae Harbors on the Big Island of Hawaii has been mapped. A 1 meter rise in sea level, predicted to occur by the end of this century, would inundate the Hilo Harbor breakwater. In addition, getting cargo as well as passengers off any ship would be difficult as piers will be partially underwater unless they are raised. Roads leading to and away from harbor yards will be partially inundated, and it is likely that wave surge and other types of wave-generated currents will increase within harbors. All of Hawaii’s international airports are situated near the ocean. A 1 meter sea level rise may impact the reef runway at Honolulu International Airport, where the majority of the state’s visitors and residents arrive and depart. High waves will be increasingly likely to splash onto runway surfaces and the threat of overtopping the rubble mound revetment will increase – especially during high wave and storm events. Many of Hawaii’s state highways run along the coastal regions of each island since population centers are largely coastal. We are currently seeing effects of erosion and impacts to the highways in areas such as Punalu‘u on O‘ahu’s northeastern shore, Honoapiilani Highway at west Maui, on Alii Highway South of Kona, and elsewhere. As the sea level rises, coastal erosion attacks the base of these 2-lane highways, wave overtopping prevents vehicular use, rural communities are cut off from emergency 72 Stammer, D. Response of the global ocean to Greenland and Antarctic ice melting. Journal of Geophysical Research. 2008. v. 113, C06022, doi:10.1029/2006JC004079 73 IPCC. 2007.

Hawaii Statewide Transportation Plan Update Issue Paper on Climate Change and Sea Level Rise
22
access, goods and services are prevented, school bus routes are severed, and commuting arteries are closed. The tsunami warning experienced in February 2010 showed how a rise in the sea level of 1 meter affected an area like Hilo Harbor. Dramatic videos of Hilo Bay wave activity show how Coconut Island was inundated by the tsunami, which was beneath three feet of water in just one wave action. While a sea level rise is certainly more gradual than a tsunami event, the recent experiences of harbor areas from Kaua‘i to the Big Island show how higher water levels can affect shoreline areas. Section 4.2 Groundwater An often overlooked hazard related to sea level rise is the problem of poor drainage. In the coastal zone groundwater system, a lens of freshwater typically sits on saltwater. The level of the water table is approximately located at mean sea level and it rises and falls with the tides and even sets of large waves. After heavy rains, the water table rises, coming closer to the ground surface. Ocean water also diffuses into the land via the coastline, traveling inland based on the area’s permeability. When the water table crops out on the land surface, it forms an impassable wetland. The confluence of sea level rise, a rising water table, low land elevation, and the occurrence of intense precipitation will cause an increase in the incidence of drainage problems. Increased risk of flooding occurs in two ways: 1) rising sea level limits the ground’s capacity to soak up and store rain water. This can be dangerous during heavy rains, especially in areas of landfill and stream channelization where ground permeability is further limited; and 2) sea level rise can be directly seen during high tides where sea water flows out of storm drains, which feed directly into the ocean. During high tides, some low-lying areas, those under sea level and close to the ocean, are flooded as the rising tide fills up drainage systems and spills onto roadways such as pictured in Figure 9. Figure 9 Mapunapuna on O‘ahu at High Tide
Source: Hawaii Sea Grant

Hawaii Statewide Transportation Plan Update Issue Paper on Climate Change and Sea Level Rise
23
Low lying regions experience drainage problems when high tide floods streets via the storm drain system which connects with the ocean.74 This problem can be observed in the Mapunapuna district near Honolulu Airport during monthly high tides. These high water levels occur twice a month corresponding with the full and new moon as rising sea water pours onto paved city streets in the industrial district through the storm drainage system designed to drain, not flood, the streets. With an increase in sea level, the ocean in general will have farther access into land. Wave action will become a growing issue as the coastal plain faces more risk of inundation. In coastal areas, dunes and coral reefs fronting the beach are the only line of defense from large waves. As sea levels rise and coastal plains become beachfront land, waves and high tides will flood and threaten facilities and buildings in low-lying areas. Wave over-topping (run-up) will become more frequent, and evacuation of areas close to the shoreline will have to be considered. The “wave climate” of Hawaii can be described statistically. For example, a 10-year wave can be defined using records from wave buoys maintained by the National Oceanographic and Atmospheric Administration. This is a wave of a certain height and period that has a given probability (say, 95%) of recurring on average once in 10 years. In a presentation given to the DOT Harbors Division to map sea level rise on the Big Island of Hawaii, Dr. Chip Fletcher of the University of Hawaii, School of Ocean and Earth Science and Technology (SOEST) hypothesized that with the rise of sea levels, waves that wash over the coast and into developed areas will become more common. Further, he identified a sea level rise of approximately 0.6 m above present as a potential threshold point where this problem increases significantly in frequency. Among other problems, the dependability of coastal roads will be compromised for emergency vehicles and overall local traffic. The worst case scenario develops when spring high tides coincide with large swells, waves and high winds. Sea level rise affects all modes of transportation of people, goods, and services: roadways will have to adapt to threatened coastal areas and to increasing threats of inundation; drainage systems will need rethinking; consideration should be given to relocating coastal roadways to higher ground; and other creative engineering solutions to inundation and drainage problems will need implementation. At harbors, higher tides need to be considered to retain the system’s mobility and safely continue shipping people and goods. Airports will also be affected by higher sea levels as many airports in the state reside in low-lying areas close to the ocean, such as the Reef Runway at Honolulu International Airport. Also, airports will have to adapt to more frequent incidents of wave over-topping, splash, and drainage problems. Unfortunately, the only technique of total mitigation is avoidance of placing structures near the shoreline, and most of the Hawaii Department of Transportation’s major facilities are on or near the shoreline. Section 4.3 Hurricanes Hawaii lies on the outer edges of both the Western and Eastern Pacific hurricane zones. Because Hawaii is a relatively small target in a large basin and is located out of major storm pathways, there have been a low number of hurricanes strikes or near strikes, especially compared to the rest of the Pacific. Yet, this could change, and storm surge and high wind mitigation should be carefully considered when planning transportation policies.
74 Source: Hawaii Sea Grant, Cover of Honolulu Weekly, October 14, 2009. http://honoluluweekly.com/cover/2009/10/a-rising-tide-2/

Hawaii Statewide Transportation Plan Update Issue Paper on Climate Change and Sea Level Rise
24
An important reason why Hawaii does not experience a high hurricane frequency is due to a body of cold water to the east of the island chain, and the presence of strong winds aloft. Both of these conditions suppress hurricane activity. However, if the effects of global warming change these environmental factors, Hawaii may see a change in hurricane vulnerability.

Hawaii Statewide Transportation Plan Update Issue Paper on Climate Change and Sea Level Rise
25
Section 5.0 Act 234 Hawaii’s Responses to Greenhouse Gas (GHG) Emission Reduction While the 2002 Hawaii Statewide Transportation Plan (HSTP) did not address global warming, climate change or sea level rise, it should be noted that these were not considered the emerging issues that they are today. These topics have been at the forefront in recent years and are the impetus behind Act 234 (Hawaii Session Laws 2007). Act 234, passed by the Hawaii State Legislature in 2007, follows the example set by California, which was discussed earlier in this issue paper, as a tool to reduce GHG emissions to Hawaii’s 1990 levels. The legislation required the development of a 10-member Greenhouse Gas Emission Reduction Task Force (See Appendix 1 in this issue paper for Task Force Membership) and a report to the Hawaii State Legislature by December 2009.75 Following that report, the Department of Health will finalize administrative rulemaking for regulations to go into effect on January 1, 2012. University of Hawaii Economic Research Organization (UHERO) The University of Hawaii Economic Research Organization (UHERO) prepared a paper titled “Energy and Greenhouse Gas Solutions” in 2009.76 The paper states that under a business as usual environment, Hawaii’s 2020 emissions will be between 18 and 34% above 1990 levels. Since 75% of the state’s GHG emissions come from electricity and transportation, a large share of the emission reductions will most likely come from these sectors. Table 2 forecasts GHG emission levels based on GHG emission levels from 1990, which is the target year of GHG Emissions required by Act 234. 2005 emissions levels are displayed next since this is the final year for UHERO emission data. Many proposed Federal policies have used 2005 as the basis for emission targets as well. 2020 is shown with two different projections based on economic growth. The UHERO projection is based on UHERO’s Hawaii economic forecast of 1.6% year average annual growth. The US Energy Information Agency (EIA) predicts the total US economy to grow by 2.5% annually from 2005 to 2020. The table segregates emissions by fuel type and then by sector. Note that total emissions are expressed with and without air transport emissions since these are exempt from Act 234. When considering fuel type, emissions come predominantly from petroleum projects. When looking at emissions by sector, 13% of all GHG emissions covered by Act 234 are covered by the commercial, industrial, and residential sectors, which are all considered non-transportation combustion of fossil fuels. When combined, transportation and electricity sectors account for 75% of all GHG emissions. Depending on which economic model is used, the UHERO economic model would require a 16% reduction in GHG emissions to return to 1990 levels while the EIA model would require a 26% reduction.
75 Greenhouse Gas Emissions Reduction Task Force. Report to the Twenty-Fifth Legislature, State of Hawaii: Work Plan for Greenhouse Gas Emissions Reductions. December 30, 2009. http://lrbhawaii.info/reports/legrpts/dbedt/2010/act234_7_slh07_10.pdf 76 Bernstein, Paul and Konan, Denise Eby. UHERO Energy and Greenhouse Gas Solutions. 2009. www.uhero.hawaii.edu/eggs

Hawaii Statewide Transportation Plan Update Issue Paper on Climate Change and Sea Level Rise
26
Table 2 Emissions forecast under different economic growth rate assumptions77
Source: UHERO Energy and Greenhouse Gas Solutions Legislative Task Force on Greenhouse Gas Emission Reduction Public Workshops (2007-2009) To understand what this means in everyday terms, the Greenhouse Gas Emission Reduction Task Force held a series of public workshops in all four counties prior to submitting its December 2009 report to the Hawaii State Legislature. The following data was presented at the O‘ahu presentation:
• Each Hawaii resident contributes 17 tons of GHG per year. • One gallon of gasoline produces about 20 pounds of GHG. • A typical car produces about one pound of GHG per mile, which is equal to four tons of GHG per
year (at 20 mpg). • One kilowatt hour of electricity produces about two pounds of GHG, so an average home on the
grid produces about 7.5 tons of GHG per year.78 While the Greenhouse Gas Emission Reduction Task Force studied Hawaii State Carbon Taxes, Carbon Tax Modeling and Federal Cap and Trade, not all members of the task force supported these market-based mechanisms. Furthermore, if a Federal Cap and Trade were implemented, it could pre-empt a State-based system, so the funds would not remain in Hawaii to offset the costs of some measures needed for GHG emission reductions.
77 Bernstein and Konan. P. 6. 78Greenhouse Gas Emission Reduction Task Force Public Hearings http://hawaii.gov/dbedt/info/energy/greenhouse/PublicWkspSlides11-24-09.pdf

Hawaii Statewide Transportation Plan Update Issue Paper on Climate Change and Sea Level Rise
27
During the public hearings conducted by the Task Force, many different points of view were expressed. Transportation sector representatives were in opposition to the carbon taxes. Farmers expressed that their main concern was the availability of water to produce biofuels locally. Life of the Land, an environmental community action group, questioned the methodologies used to arrive at the GHG emission counts, citing that biofuels should not be counted as Net Zero or Net Carbon Balance because fossil fuels are used every step of the way to make the biofuels: farm equipment, pesticides, fertilizers, transport and production. While different organizations may arrive at the math in different ways, there appears to be wide agreement that GHG emissions in Hawaii should be reduced. Whether it’s through energy efficiencies, transportation efficiencies, creation of more forests, or alternative energies, most can agree that ultimately, GHG emissions need to be reduced. In order to reach the target of Act 234, the Greenhouse Gas Emission Reduction Task Force recommended a Work Plan where most reductions in GHG could be reached by following the Hawaii Clean Energy Initiative and through developing electricity efficiencies. The Work Plan can be found at the Legislative Reference Bureau or online at: http://lrbhawaii.info/reports/legrpts/dbedt/2010/act234_7_slh07_10.pdf. The Hawaii Clean Energy Initiative was discussed in Fuel and Energy Scenarios, Issue Paper #4, another paper in this series. Section 5.1 Climate Change Task Force, Act 20, Special Session #1, 2009 In Special Session #1 of 2009, the Hawaii State Legislature passed Act 20, “Scope and Impacts of Global Climate Change Trends in the State.”79 This bill further recognized the importance of global warming and its potential adverse effect on Hawaii through such effects as sea level rise damage to marine ecosystems, and extended drought. The legislation called for the convening of a Climate Change Task Force, with the condition that strategies to focus on adaptation be investigated and implemented. Due to the work of the Greenhouse Gas Emission Reduction Task Force and the Hawaii Coastal Zone Management’s Ocean Resources Management Working Group, the Climate Change Task Force was considered a duplicative effort. Therefore, the Office of State Planning did not convene the Climate Change Task Force. The Ocean Resources Management Plan is discussed in the next section.
79 Senate Bill 266, SD2, HD2, CD1, veto override on July 15, 2009 in Special Session #1.

Hawaii Statewide Transportation Plan Update Issue Paper on Climate Change and Sea Level Rise
28

Hawaii Statewide Transportation Plan Update Issue Paper on Climate Change and Sea Level Rise
29
Section 6.0 Climate Change Resources for Transportation Planning There are many resources available for Hawaii state and county transportation planners on the subject of climate change. Planners and engineers need information to:
• Plan for and design a transportation system that will mitigate GHG emissions, in the effort to slow down transportation’s contribution to climate change.
• Plan for and design a transportation system (air, land, and sea) that can adapt to the effects of climate change and sea level rise on transportation infrastructure.
The discussions that follow highlight resources that in turn provide links to a variety of additional resources. Section 6.1 General Clearinghouses for Information on Transportation and Climate Change The following resources are one-stop sources for information on transportation and climate change. Specific resources on minimizing GHG emissions and on adapting to climate change effects are discussed below in Section 6.2 and 6.3 respectively.
• US Department of Transportation (USDOT): The USDOT Center for Climate Change and Environmental Forecasting has developed an extensive Transportation and Climate Change Clearinghouse at: http://climate.dot.gov/index.html. This clearinghouse is a one-stop source of information and climate change issues. The website is organized to give information by mode of transportation, and resources are available for aviation, marine, transit, automobiles, railroads, motor carriers, and bicycle and pedestrian mobility. The website also features examples of state and local plans and policies. It features related federal actions and resources to other sites linked below. The USDOT recognizes the transportation sector as a significant source of greenhouse gas emissions at 28% of the total produced in this country.
• Federal Highway Administration (FHWA): FHWA has a Sustainable Transport and Climate
Change Team and maintains a website on highways and climate change at: http://www.fhwa.dot.gov/hep/climate/index.htm. This site contains some distinct resources with an emphasis on roadways, both for mitigating GHG emissions and also adapting to the effects of climate change. Some of the more recently-added resources included on FHWA’s web site include a review and assessment of State Climate Action Plans: http://www.fhwa.dot.gov/hep/climate/action_plan/index.htm , a study of transportation’s role in reducing GHG emissions: http://www.dot.gov/affairs/2010/dot7510.htm , and a literature review covering Climate Change Vulnerability, Risk Assessment, and Adaptation Approaches, at http://www.fhwa.dot.gov/hep/climate/ccvaraaa.htm. FHWA also provides outreach materials for general readership on reducing climate change and the effects of highways on climate change.
• American Association of State Highway Transportation Officials (AASHTO): AASHTO’s
Transportation and Climate Change Resource Center is found at http://climatechange.transportation.org/. AASHTO’s site emphasizes:

Hawaii Statewide Transportation Plan Update Issue Paper on Climate Change and Sea Level Rise
30
o Federal legislation, such as guidance on evaluating GHG emissions under the National Environmental Policy Act, EPA findings, and executive orders/directives.
o Planning efforts at various levels of government, such as state action plans, State DOT climate mitigation efforts, Metropolitan Planning Organization (MPO) climate plans, local government action plans, and plans from multi-state regions.
o GHG mitigation strategies, including efficient vehicles, low-carbon fuels, VMT reductions, operational efficiency of the system and vehicles and construction, maintenance, and agency operations.
o Adaptation strategies for transportation facilities that will be affected by climate change.
o A database of ongoing research from AASHTO itself, along with resources from the National Cooperative Highway Research Program (NCHRP), the Strategic Highway Research Program (SHRP), Transportation Research Board (TRB) and other research sources.
• Transportation Research Board (TRB): The National Academy of Sciences’ TRB offers an
extensive collection of research reports, policy studies, and research papers on transportation issues in general, and transportation’s effects on climate change (and vice versa) are well-represented. TRB also convenes committees, task forces, and panels on Climate Change, GHG, energy, and the environment. Visit http://www.trb.org/main/SpecialtyPageClimateChange.aspx for more information.
• Environmental Protection Agency (EPA): The US EPA offers resources specific to transportation
and climate change at http://www.epa.gov/otaq/climate/index.htm This site focuses on regulatory initiatives as well as providing tools, analyses and publications on reducing Vehicle Miles Traveled (VMT), alternative/renewable fuels, and vehicle technologies. EPA’s general Climate Change program can be found at http://www.epa.gov/climatechange/index.html. It is less focused on transportation but has, nonetheless, extensive information on the science, regulatory policy, and economics of climate change and GHG.
• Intergovernmental Panel on Climate Change (IPCC): The IPCC is the leading body for the
assessment of climate change. Established by the United Nations Environment Programme and the World Meteorological Organization, it provides a clear scientific view on the state of climate change and potential environmental and socio-economic consequences. IPCC lists a number of important resources, including its fourth Assessment Report on Climate Change, 2007, accessed from http://www.ipcc.ch/publications_and_data/ar4/syr/en/contents.html. This report includes detailed syntheses covering the observed climate change to date, causes, projected changes in climate, measures for adaptation and mitigation, and the long term perspective on issues of concern. A wide range of other IPCC reports can be accessed from: http://www.ipcc.ch/publications_and_data/publications_and_data_reports.htm
• Pew Center on Global Climate Change: This organization brings together business leaders,
policy makers, scientists and other experts to address climate change. Their website, http://www.pewclimate.org/ offers background on global warming, the science behind its impacts, technological advances, and the economics of addressing climate change. It looks at all levels of government as well as the private sector for solutions.

Hawaii Statewide Transportation Plan Update Issue Paper on Climate Change and Sea Level Rise
31
• American Planning Association (APA): APA offers resources to its members, including an Energy and Climate Database for addressing and responding to climate change in communities. APA http://www.planning.org/research/energy/database/ has links to other information sources and also best practices from various communities for increasing sustainability. The database can be filtered down to find information of specific interest.
Section 6.2 Resources on Measures to Mitigate GHG Emissions Research from the National Aeronautics and Space Administration (NASA) has concluded that of all sources, motor vehicles have emerged as the greatest contributor to atmospheric warming now and in the near term.80 NASA proposes these measures to mitigate GHG emissions from transportation sources:
• Improve Vehicle Efficiency • Use Low Carbon Fuels and alternative energy • Reduce vehicle miles traveled (VMT) by encouraging use of alternative modes such as transit,
bicycles, and walking • Plan our communities’ land use to require less travel • Design transportation systems that use less energy in their maintenance, construction and
operation Resources useful for further investigation, strategies, and measures for mitigating GHG Emissions include:
• American Association of State Highway Transportation Officials (AASHTO): In addition to AASHTO’s website mentioned earlier, AASHTO’s Transportation and Climate Change Primer (April 2008), found at http://climatechange.transportation.org/pdf/primer_on_transportation_climate_change_2008.pdf provides a broad overview on the challenges associated with reducing GHG emissions.
• Federal Transit Administration (FTA): FTA provides an analysis, “Public Transportation’s Role in
Responding to Climate Change” at http://www.fta.dot.gov/planning/planning_environment_9051.html. This short document considers the relationship between transit facilities and Transit Oriented Development that encourages compact development patterns and shorter trips. It also looks at alternative fuels and other measures for reducing emissions from transit facilities themselves. FTA maintains a clearinghouse of sustainable best practices for transit agencies around the country. This can be found at http://www.fta.dot.gov/planning/planning_environment_8524.html.
• Center for Climate Strategies: CSS is a non-profit organization that helps state and national
governments and their stakeholders tackle climate change issues. CSS provides guidance for a range of mitigation actions including energy efficiency, clean energy, transportation, forests/farms, waste, and industry. In the area of transportation and land use improvements, CSS has put together a list of state-level GHG-reducing actions and policy options at http://www.climatestrategies.us/Transportation.cfm
80 Goddard Institute of Space Studies. Road Transportation Emerges as Key Driver of Warming. Accessed at http://www.giss.nasa.gov/research/news/20100218a/

Hawaii Statewide Transportation Plan Update Issue Paper on Climate Change and Sea Level Rise
32
• Oak Ridge National Laboratory (ORNL): The Center for Transportation Analysis (CTA) at ORNL
does research in integrated inter-modal transportation solutions, and focuses on transportation energy, environmental concerns, safety, security, planning, policy, systems engineering, military transportation and transit visibility . One focus is climate change, with information on transportation carbon impacts and emissions trading at: http://cta.ornl.gov/cta/research_climate.shtml. All publications are available online, dating back to 1995.
• Better Place Hawaii: Better Place is an innovative private-sector effort to establish a new
network of electric vehicles and the infrastructure to power these vehicles with renewable energy resources. The proposed system would include charging stations and battery-swap centers for longer trips with the objective of providing a convenient, dependable, and economical way for motorists to travel with electric vehicles. Hawaii is one of several locations targeted for early roll-out of the Better Place network. Visit http://www.betterplace.com/global-progress/hawaii for more information.
Section 6.3 Resources on Measures to Adapt to Climate Change and Sea Level Rise Effects on transportation infrastructure that will present challenges in the future include:
1) Adapting to the effects of higher frequencies of hurricanes and other weather events. 2) Dealing with rising sea levels and tidal changes that will potentially inundate transportation
infrastructure in coastal areas. The following resources are available to address these effects:
• The University of Hawaii School of Ocean Earth and Science Technology (UH SOEST): SOEST has done extensive research and modeling on sea level rise throughout the island chain; www.soest.hawaii.edu By pairing up with UH, the Hawaii DOT can take advantage of the university’s technology and subject matter expertise in sea level rise.
• State of Hawaii Multi-Hazard Mitigation Plan, 2007 Update: To meet the requirements of the
Disaster Management Act of 2000 and the planning guidelines of the Federal Emergency Management Agency (FEMA), the State of Hawaii prepared Hazard Mitigation Plans for the state and for each of the four counties. The 2007 update of the 2004 statewide plan can be accessed from http://www.mothernature-hawaii.com/hazmit_planning_toc2007.htm, and separated out the issue of climate change from the wide range of natural and man-made hazards that are also covered. While climate variability, climate change, and sea level rise are not categorized as “hazards” because of their long term nature, the plan considers the risks of these threats, potential losses, and ways to mitigate their effects.

Hawaii Statewide Transportation Plan Update Issue Paper on Climate Change and Sea Level Rise
33
• The Hawaii Ocean Resources Management Plan (ORMP): Coordinated by the Hawaii Coastal Zone Management (CZM) Program within the Office of State Planning, the ORMP is an integrated approach to managing Hawaii’s natural and cultural resources. The ORMP is built upon Native Hawaiian management principles and is coordinated by the Ocean Resources Management Working Group, a broad network of government, academic and community partners. The plan itself is available at: www.state.hi.us/dbedt/czm/ormp/reports/ormp_2006.pdf
• National Oceanic and Atmospheric Administration (NOAA): NOAA offers a Coastal Inundation
Toolkit to help communities learn how to deal with the effects of rising coastal sea levels at http://csc.noaa.gov/digitalcoast/inundation/index.html. One of the resources found at their website is the Proceedings from the Local Sea Level Rise and Inundation Community Workshop. This workshop, sponsored by the National Oceanic and Atmospheric Administration and US Geological Survey in December 2009, looked at how communities will need to respond to sea level rise and inundation, and provided several local case studies of ways coastal communities are addressing this concern. Vulnerability to storms, threats to road infrastructure and interruption of port operations are all considered. This file, along with other coastal inundation resources can be found at http://csc.noaa.gov/digitalcoast/inundation/resources.html.
• TRB Special Report 290, Potential Impacts of Climate Change on U.S. Transportation: This
document, dating from 2008, offers a comprehensive glimpse of the vulnerability of land, marine and air modes of US transportation to climate-change-induced effects, including temperature, rainfall/drought, visibility, storms, and sea level rise. http://onlinepubs.trb.org/onlinepubs/sr/sr290.pdf
• US Climate Change Research Information Office : A synthesis of research on the effects of global
climate change on the Gulf Coast can be found at: http://www.climatescience.gov/Library/sap/sap4-7/final-report/default.htm

Hawaii Statewide Transportation Plan Update Issue Paper on Climate Change and Sea Level Rise
34

Hawaii Statewide Transportation Plan Update Issue Paper on Climate Change and Sea Level Rise
35
Section 7.0 How Other Jurisdictions Handle Climate Change and Global Warming Effects Although the federal government has not formally enacted climate change legislation, AASHTO notes that there is a great deal of climate change activity at the level of states, including state DOTs, Metropolitan Planning Organizations (MPOs) and multi-state regions. For example, as of April 2010, 33 states have enacted state climate action plans, with several others developing plans of their own. Nearly 800 mayors have signed the US conference of Mayors Climate Protection Agreement, to reduce community-wide GHG by 2012 to at least 7 percent below 1990 levels.81 The following programs are highlighted to show the various ways several jurisdictions have instituted policies and programs to tackle climate change and global warming. Section 7.1 California The state of California passed a vehicle global warming standard in 2002, Assembly Bill (AB) 1493, which was introduced by California Assemblymember Fran Pavely. This legislation directed the California Air Resources Board (ARB) to adopt regulations to reduce global warming emissions from passenger vehicles.82 These new ARB regulations, adopted in 2004, have already begun to affect new cars sold in California, beginning with model year 2009. The regulations aim to achieve a 23% reduction in global warming emissions from new vehicles by 2012 and then a 30% reduction for new vehicles by 2016. In 2004, the CO2 equivalent tons per day (tpd) was at 400,000 tpd, with a projection to nearly 600,000 tpd by 2030. The legislation predicts an overall reduction in 2030 to a little over 400,000 tpd of CO2. California standards incorporate four main global warming emissions elements83:
1. Carbon Dioxide (CO2), methane (CH4) and nitrous oxide (N2O) emissions from operation of the vehicle;
2. CO2 emissions from operation of the vehicle’s air conditioning; 3. Refrigerant emissions from the air conditioning system due to leakage or disposal at end of
vehicle’s life; and 4. Upstream emissions associated with the production of the vehicle’s fuel.
The standards were developed so that automakers could use technology available today without requiring radical changes to vehicles. Performance of engines, transmissions and air conditioning systems could be improved while still reducing global warming emissions. Automakers may implement any combination of the technologies, as long as they achieve the prescribed CO2 emission reduction fleet-wide for each year.
81 AASHTO Transportation Climate Change and Resource Center: State/Local/MPO Activities, accessed June 25, 2010 at http://climatechange.transportation.org/state_local_mpo/ 82 California Clean Cars Campaign. How the California Vehicle Global Warming Regulation Works. www.calcleancars.org 83 California Clean Cars Campaign.

Hawaii Statewide Transportation Plan Update Issue Paper on Climate Change and Sea Level Rise
36
When this legislation was implemented, the analysis demonstrated that the increased costs to incorporate the technology would be offset by reduced operating costs. Table 3: Average Increase in Vehicle Price, Lifetime Savings and Payback Time84 Near-term (2012)
Reduced GHG by 23% Mid-term (2016) Reduced GHG by 30%
Increase in vehicle price $326 $1,048Lifetime savings $2,363 $3,253Payback time (years)85 1.2 2.9 As of 2009, thirteen states and the District of Columbia in addition to California have adopted similar regulations, which results in one third of the new vehicles sold in the U.S. meeting more stringent standards for global warming emissions.86 Section 7.2 Maine In 2005, Maine implemented a Cleaner Car program.87 Beginning in 2009, under the Cleaner Car standards, approximately 11% of new cars sold in Maine must either be hybrid gas-electric cars or the cleanest gasoline-powered cars. Maine modeled this partially after California’s Low Emission II Vehicle Program with a desire to join New Jersey, New York, Connecticut, Rhode Island, Massachusetts and Vermont in their quest for cleaner air discussed in Section 7.3. When this legislation was signed into law, there were twenty-seven models that met the new standards, with many more developed in the following years. In addition, Maine also has a Cleaner Cars for Maine Program that was in place beginning in 1999.88 This program developed a Cleaner Cars for Maine label to be affixed to vehicles so that drivers would be able to easily purchase a low-emission, fuel-efficient car.
84 California Clean Cars Campaign. 85 Based on calculations with gas price at $2.30/gallon. With higher gas prices, the payback time is shorter and lifetime savings larger. 86 The thirteen states are: Arizona, Colorado, Connecticut, Florida, Illinois, Iowa, Maine, Maryland, Massachusetts, Minnesota, Montana, New Jersey, New Mexico, New York, North Carolina, Oregon, Pennsylvania, Rhode Island and Utah. http://www.cleancarscampaign.org/web-content/stateaction/stateaction.html Accessed March 2009. 87 Environment Maine. Cleaner Cars, Cleaner Air. www.environmentmaine.org 88 Department of Environmental Protection, Bureau of Air Quality, State of Maine. Cleaner Cars for Maine. www.main.gov/dep/air.mobile/cleancar.htm

Hawaii Statewide Transportation Plan Update Issue Paper on Climate Change and Sea Level Rise
37
Section 7.3 New England Governors and Eastern Canadian Premiers
Table 3: NEG/ECP Membership In 2001, several Northeast states, including Maine, joined Canada to form the New England Governors and Eastern Canadian Premiers (NEG/ECP) organization. This international group of Canadian Provinces and United States New England states has discussed global warming and climate change extensively, using a regional approach to deal with these issues.
In 2001, they announced the Climate Change Action Plan, committing the region to reduce GHG to 10% below 1990 levels by 2020.89 The NEG/ECP created a standing Committee on Transportation and Air Quality, made up of transportation and environment officials from the eleven represented jurisdictions.90 The committee was tasked with setting regional goals for GHC reductions from the transportation sector. Action steps include:
• Develop environmentally-friendly biofuels; • Promote fuel efficiency in all modes of transportation; • Expand alternative transportation and commuter services; • Align infrastructure funding with energy and climate goals, including prioritization of funds for
jurisdictions that employ “smart growth” strategies; • Use life-cycle GHG and CO2 emission analyses to set accurate indicators for policy and project
planning; • Collaborate with private sector to jointly assess opportunities to improve freight movement
efficiency and enhance regional interconnectivity; and • Adopt clean car programs such as those in California.
Section 7.4 New York The New York DOT has an interest in taking action to mitigate the threats posed by Climate Change. The New York State Energy Plan laid out a goal of reducing GHG emissions to 5 percent below 1990 levels by 2010 and 10 percent below 1990 levels by 2020. These could be achieved through Transportation Improvement Programs (TIP) to reduce emissions including Intelligent Transportation Systems (ITS), enhanced bicycle and pedestrian programs, and improved public transit systems. The Air Quality/Asbestos/Energy Section of New York DOT prepares policies that allow the New York DOT to identify and assess air quality effects of its activities.91 With a statewide population of 18 million, including the New York City population of 8 million, New York is home to many multi-modal
89 New England Governors/Eastern Canadian Premiers (NEG/ECP) www.newenglandclimate.org 90 Lyons, William, et al. Integration of Climate Change Considerations in Statewide and Regional Transportation Planning Process. US Department of Transportation, Volpe National Transportation Systems Center. Cambridge, MA. July 2009. P. 5-8. 91 USDOT/Volpe Center. P. 5-4.
U.S. States Canadian ProvincesMaine Quebec Connecticut Nova Scotia Rhode Island New Brunswick Vermont Prince Edward IslandNew Hampshire Newfoundland and LabradorMassachusetts

Hawaii Statewide Transportation Plan Update Issue Paper on Climate Change and Sea Level Rise
38
transportation facilities. Its coastal location includes many of these facilities at or near seal level, giving it a keen interest in the issues of sea level rise and climate change. New York’s 2002 State Energy Plan included fifteen policy recommendations to reduce GHG emissions and increase energy efficiency while emphasizing the use of renewable fuels. New York DOT carried out this statewide directive by becoming the first state to require Metropolitan Planning Organizations (MPOs) to conduct a Greenhouse Gas and energy analysis in their transportation plans. New York articulates that it was initially difficult to get the MPOs to view the Energy Plan requirements as mandatory. Many MPOs in New York State were confused about their role in energy consumption assessment and perceived that they were unable to affect emission reductions. As this initial skepticism was overcome, several lessons learned emerged, including:
• Energy Plan requirements can serve as a model for gaining reductions through transportation planning processes.
• Requirements for analysis of Greenhouse Gas emissions should be seen as an instrumental step to bring climate change considerations into the transportation planning process.
• Recognize the increased burden of creating policy frameworks and plan accordingly. For example, a smaller MPO or DOT will need assistance with measuring and monitoring noncompliance and analyzing the data.
• Guidelines should spell out what the transportation planning organization needs to do, step by step, in order to achieve the goal of reduced GHG emissions.

Hawaii Statewide Transportation Plan Update Issue Paper on Climate Change and Sea Level Rise
39
Section 8.0 Recommendations for HSTP Update Hawaii’s unique relationship with the ocean, coupled with the close proximity of transportation facilities and communities to the ocean, make sea level rise a major issue when adapting to climate change. It is imperative to develop policies and plans to mitigate the impacts of sea level rise as well as consider that sea level rise coupled with ocean surges, higher rainfall, and other extreme weather events will require even greater mitigation. Another major issue in relation to climate change and Hawaii is the reduction of Greenhouse Gas emissions. While Hawaii is a small contributor to the national GHG emission level, any reduction in GHG emissions is the right policy to embrace sustainability. Many of these recommendations tie in with the other issue papers in the HSTP Update, such as “Fuel and Energy Scenarios for Hawaii,” “Integration of Planning and Design,” “Energy Security,” and “Land Use Policies.” It is possible to develop a schedule of rising sea level in Hawaii that reflects local variability of ocean water levels, the tides, seasonal patterns, and the detailed topography of coastal lands. Figure 10 shows a model of sea level rise from which can be described the schedule of exceeding various vertical datums (e.g., 25 cm above present, 2003 high water event). Inundation schedules developed from models such as this are useful in developing management plans. Figure 10 Model of Sea Level in Hawaii Reaching 1 meter Above Present by 2100
Source: Dr. Chip Fletcher, University of Hawaii, School of Ocean and Earth Science and Technology (SOEST)

Hawaii Statewide Transportation Plan Update Issue Paper on Climate Change and Sea Level Rise
40
Policy Practices Relating to Sea Level Rise:
1. Map the detailed topography of Hawai’i’s coastal zone. Develop maps of areas at risk, assets and cost valuation of infrastructure, likely drainage problems, and a schedule of risk based on a model of sea level rise in coming decades.
2. Plan for at least a one meter rise in sea level, which is a conservative benchmark. By the end of the century, it is expected that sea levels will rise one meter with an accelerated rate in the second half of the 21st century. For facilities that have a longer than 100 year life cycle, planning for a two meter sea level rise would be most beneficial.
3. Develop an annual/decadal schedule of sea level rise and analyze risk and vulnerability on this schedule. Develop maps of areas at risk on this schedule.
4. Plan to retrofit coastal roadways in light of changes in wave overtopping, erosion, and storm runoff. Consider raising road beds, redeveloping road sections on pilings and posts, improving drainage, expanding the use of elevated roadways, and other “climate-proofing” steps. Many coastal roads are poorly armored; consider filling the shoulder seaward to create coastal strip parks to increase public access. Simultaneously consider the development of new routes at high elevation (mauka of coastal towns). Base decision-making on updated climate science, consideration of steps being taken in other jurisdictions, and updates to the schedule of local sea level rise developed for each island.
5. Retrofit facilities as part of ongoing maintenance and upgrade in order to handle a rising sea level. Consider elevating or retreating facilities. Refer to Section 6.3, Resources on Measures to Adapt to Climate Change and Sea Level Rise.
Policies Related to Reducing Greenhouse Gas Emissions from Transportation
1. Incorporate the Hawaii Clean Energy Initiative into the HSTP Energy Goals and Objectives. Not only will this assist in meeting the goal of energy security, but it will contribute to overall reduction of Greenhouse Gas Emissions.
2. Require energy efficiency of transportation vehicles on the roadways, thereby reducing GHG produced.
3. Purchase energy efficient vehicles in fleets used in the Department of Transportation and other state agencies.
4. Fuel for cars, transport vehicles, ships, and airplanes should be substituted with alternative energy fuels that are low in carbon.
5. Increase the efficiency with which the transportation systems provide mobility, such as reducing gridlock on the roadways, airways and in harbors.
6. Reduce transportation activity, such as lowering vehicle miles traveled and consolidating shipping cargo and airline trips. One way to achieve this in the Hawaii DOT would be through teleconferencing between divisions and statewide offices.
7. Align infrastructure funding with energy efficiency, such as installing photovoltaic panels at the airports or energy efficient lighting along the roadways.
8. Support transit oriented development in order to maximize the efficiency of a planned community’s development, thereby reducing vehicle trips, improving mobility with transit systems, and reducing GHG.

Hawaii Statewide Transportation Plan Update Issue Paper on Climate Change and Sea Level Rise
41
References Bernstein, Paul and Konan, Denise Eby. UHERO Energy and Greenhouse Gas Solutions. 2009.
www.uhero.hawaii.edu/eggs Bindoff, Nathaniel L. and Jürgen, Willebrand. Observations: Oceanic Climate Change and Sea Level.
Climate Change 2007: The Physical Science Basis. Contribution of Working Group I to the Fourth Assessment Report of the Intergovernmental Panel on Climate Change [Solomon, S., D. Qin, M. Manning, Z. Chen, M. Marquis, K.B. Avery, M. Tignor and H.L. Miller (eds)]. Cambridge University Press, Cambridge, United Kingdom and New York, NY. 2007.
Burbank, Cynthia J. Greenhouse Gas (GHG) and Energy Mitigation for the Transportation Sector,
Recommended Research and Evaluation Program. Paper prepared for the Transportation Research Board. Parsons Brinckerhoff. October 2009.
Burbank, Cynthia J. and Rue, Harrison. Climate Change is Heating Up. Presented to the National
Association of Development Organizations and Association of Metro Planning Organizations (NADO-AMPO) as a Webinar. May 21, 2009. www.ampo.org/assets/811_burbankrue.pdf
Byrne, R.H., et al. Direct Observations of Basin-wide Acidification of the North Pacific Ocean.
Geophysical Research Letters. 37: L02601. 2007. Chu, P.S. and Chen, H. Interannual and Interdecadal Rainfall Variations in the Hawaiian Islands. Journal
of Climate. 2005. 18:4796-4813. Diaz, H. F., Chu, P.S., and Eischeid, J. K. Rainfall Changes in Hawai`i during the Last Century. 16th
Conference on Climate Variability and Change, American Meteorological Society, Boston, MA. 2005. Doran, P.T., and Zimmerman, M.K. Examining the scientific consensus on climate change. EOS. v.90,
no.3. 2009. See: http://tigger.uic.edu/~pdoran/012009_Doran_final.pdf. Dore, J.E. et al. Physical and Biogeochemical Modulation of Ocean Acidification in the Central North
Pacific, Proceedings of the U.S. National Academy of Sciences. 2009. 106:12235-12240. Easterling, D., Wehner, M. Is the climate warming or cooling? Geophysical Research Letters, v 36,
L08706. 2009. NASA: http://climate.nasa.gov/news/index.cfm?FuseAction=ShowNews&NewsID=175.
Firing, Y. and Merrifield, M. A. Extreme sea Level Events at Hawai’i: Influence of Mesoscale Eddies.
Geophysical Research Letters. 2004. 31:L24306. Fletcher, C.H. Hawaii's Changing Climate, Briefing Sheet, 2010. University of Hawaii Sea Grant College
Program, Center for Island Climate Adaptation and Policy. Honolulu, Hawaii. 2010. (7p).

Hawaii Statewide Transportation Plan Update Issue Paper on Climate Change and Sea Level Rise
42
Giambelluca, T. W., Diaz, H. F., and Luke, M. S. A. Secular Temperature Changes in Hawaii. Geophysical
Research Letters. 2008. 2008 35:L12702. Gray, William M. "Viewpoint: Get Off Warming Bandwagon." BBC News. November 16, 2000.
http://news.bbc.co.uk/1/hi/in_depth/sci_tech/2000/climate_change/1023334.stm Greenhouse Gas Emissions Reduction Task Force. Report to the Twenty-Fifth Legislature, State of
Hawaii: Work Plan for Greenhouse Gas Emissions Reductions. December 30, 2009. http://lrbhawaii.info/reports/legrpts/dbedt/2010/act234_7_slh07_10.pdf
Groisman, P. Ya., et al. Contemporary changes of the hydrological cycle over the contiguous United
States, trends derived from in situ observations. Journal of Hydrometeorology. 5(1): 64-85. 2004. Cited in: Global Climate Change Impacts in the United States, Karl, T. R.; Melillo, J. M.; Peterson, T. C. (eds.). Cambridge University Press. 2009.
Harries, J.E., et al. Increases in greenhouse forcing inferred from the outgoing long wave radiation
spectra of the Earth in 1970 and 1997. Nature. March 15, 2001. http://www.nature.com/nature/journal/v410/n6826/abs/410355a0.html
Karl, Thomas R., Melillo, Jerry M., and Peterson, Thomas C., (eds.). Global Climate Change Impacts in
the United States. Cambridge University Press. 2009. http://www.globalchange.gov/publications/reports/scientific-assessments/us-impacts
Kerr, R.A. Amid Worrisome Signs of Warming, Climate Fatigue Sets In. Science. v. 326 no. 5955.
November 13, 2009. DOI: 10.1126/science.326.5955.926. Knutson, T.R., et al. Tropical cyclones and climate change. Nature Geoscience 3, 157 – 163. 2009.
http://www.nature.com/ngeo/journal/v3/n3/abs/ngeo779.html Kunkel, Kenneth, Convening Lead Author. Observed Changes in Weather and Climate Extremes.
Weather and Climate Extremes in a Changing Climate. Regions of Focus: North America, Hawaii, Caribbean, and U.S. Pacific Islands. [T.R. Karl, G.A. Meehl, C.D. Miller, S.J. Hassol, A.M. Waple, and W.L. Murray, editors]. Synthesis and Assessment Product 3.3, A Report by the U.S. Climate Change Science Program and the Subcommittee on Global Change Research. Washington, D.C. February 2008 Draft.
Kurz, W. A., et al. Mountain pine beetle and forest carbon feedback to climate change. Nature, 452,
987-990. 2008. doi: 10.1038/nature06777.

Hawaii Statewide Transportation Plan Update Issue Paper on Climate Change and Sea Level Rise
43
Le Treut, Hervé and Somerville, Richard, Coordinating Lead Authors. Historical Overview of Climate
Change. Climate Change 2007: The Physical Science Basis. Contribution of Working Group I to the Fourth Assessment Report of the Intergovernmental Panel on Climate Change. [Solomon, S., D. Qin, M. Manning, Z. Chen, M. Marquis, K.B. Averyt, M. Tignor and H.L. Miller (eds.)] Cambridge University Press. Cambridge, United Kingdom and New York, NY. 2007.
Loarie, S., et al. The velocity of climate change. Nature 462, 1052-1055. 2009.
doi:10.1038/nature08649. Lyons, William; Rasumussen, Ben; Rainville, Linda; Turchetta, Diane; and Gaber, Mark. Integration of
Climate Change Considerations in Statewide and Regional Transportation Planning Process. US Department of Transportation, Volpe National Transportation Systems Center. Cambridge, MA. July 2009.
Mao-Jones, J., et al. How Microbial Community Composition Regulates Coral Disease Development.
2010. doi:10.1371/journal.pbio.1000345. See also: Hoegh-Guldberg, O., et al. Coral reefs under rapid climate change and ocean acidification. Science, 318 (5857): 1737–42. 2007. doi:10.1126/science.1152509.
Meehl, G. A. et al. Relative Increase of Record High Maximum Temperatures Compared to Record Low
Minimum Temperatures in the U.S. Geophysical Research Letters. 2009. 36:L23701. Merrifield, M.A.; Merrifield, S.T.; and Mitchum, G.T. An anomalous recent acceleration of global sea
level rise. Journal of Climate, v. 22. 2009. National Academy of Sciences (NAS). Advancing the Science of Climate Change. The National
Academies Press. Washington, D.C. 2010. http://www.nap.edu/catalog.php?record_id=12782 Oki, D. Trends in Streamflow Characteristics at Long-term Gauging Stations, Hawaii, U.S. Geological
Survey Scientific Investigations Report 2004-5080. 2004. Philipona, R., et.al Radiative forcing - measured at Earth’s surface - corroborates the increasing
greenhouse effect, Geophysical Research Letters. v. 31, L03202. 2004. doi:10.1029/2003GL018765. Ritter, Michael E. The Physical Environment: an Introduction to Physical Geography. 2006. Last
Accessed June 2010. http://www.uwsp.edu/geo/faculty/ritter/geog101/textbook/title_page.html Seidel, D.J., Fu, Q., Randel, W.J., and Reichler, T.J., Widening of the tropical belt in a changing climate.
Nature Geoscience. 2008. 1, 21-24. DOI10.1038/ngeo.2007.38. Stammer, D. Response of the global ocean to Greenland and Antarctic ice melting. Journal of
Geophysical Research. 2008. v. 113, C06022, doi:10.1029/2006JC004079.

Hawaii Statewide Transportation Plan Update Issue Paper on Climate Change and Sea Level Rise
44
Tans, Peter. Trends in Carbon Dioxide. Earth Systems Research Laboratory. July 2008.
http://www.esrl.noaa.gov/gmd/ccgg/trends/ Thibault, S., and Payette, S. Recent permafrost degradation in bogs of the James Bay area, northern
Quebec, Canada. Permafrost and Periglacial Processes. 20 (4): 383. 2009. DOI: 10.1002/p.660. Timm, O. and Diaz, H. Synoptic-Statistical Approach to Regional Downscaling of IPCC Twenty-First
Century Climate Projections: Seasonal Rainfall over the Hawaiian Islands. Journal of Climate. 2009. 22.16:4261-4280.
Transportation Research Board (TRB). Special Report 290: Potential Impacts of Climate Change on U.S.
Transportation. 2008. Transportation Research Board (TRB). Special Report 299: A Transportation Research Program for
Mitigating and Adapting to Climate Change and Conserving Energy. October 2009. Tripati, A.K., Roberts, D.R., and Eagle, R.A. Coupling of CO2 and ice sheet stability over major climate
transitions of the last 20 million years. Science. Oct. 8, 2009. http://www.sciencemag.org/cgi/content/abstract/1178296
Vecchi, G. A., et al. Weakening of Tropical Pacific Atmospheric Circulation due to Anthropogenic Forcing.
Nature. 2006. 441:73–76. Velicogna, I. Increasing rates of ice mass loss from the Greenland and Antarctic ice sheets revealed by
GRACE. Geophysical Research Letters 36, L19503. 2009. doi:10.1029/2009GL040222. Vermeer, M. and Rahmstorf, S. Global sea level linked to global temperature. Proceedings of the
National Academy of Sciences. v106.51: 21527-21532. December 22, 2009. http://www.pnas.org/content/106/51/21527.full
Wheeler, Stephen M. State and Municipal Climate Change Plans: The First Generation. Journal of the
American Planning Association, Vol. 74, No. 4. American Planning Association. Chicago, IL. Autumn 2008.
Xie, S.-P. et al. “Indian Ocean Capacitor Effect on Indo-western Pacific Climate during the Summer
Following El Nino.” Journal of Climate. 2009. 22.3: 730–747. Websites AASHTO Transportation Climate Change and Resource Center: State/Local/MPO Activities.
http://climatechange.transportation.org/state_local_mpo/

Hawaii Statewide Transportation Plan Update Issue Paper on Climate Change and Sea Level Rise
45
AVISO: Archiving, Validation and Interpretation of Satellite Oceanographic Data
http://www.aviso.oceanobs.com/en/news/ocean-indicators/mean-sea-level/ California Clean Cars Campaign. How the California Vehicle Global Warming Regulation Works.
www.calcleancars.org Environment Maine. Cleaner Cars, Cleaner Air. www.environmentmaine.org National Aeronautics and Space Administration (NASA). “Rising Water: new map pinpoints areas of sea
level increase.” http://climate.nasa.gov/news/index.cfm?FuseAction=ShowNews&NewsID=16. National Oceanic and Atmospheric Administration. "NOAA La Niña Page."
http://www.elnino.noaa.gov/lanina.html New England Governors/Eastern Canadian Premiers (NEG/ECP) www.newenglandclimate.org The Pew Center on Global Climate Change. www.pewclimate.org United States Department of Transportation. “Transportation and Climate Change Clearinghouse.”
http://climate.dot.gov/index.html United States Energy Information Administration, Department of Energy. “Energy Explained,
Greenhouse Gases.” http://tonto.eia.doe.gov/energyexplained/index.cfm?page=environment_about_ghg
United States Environmental Protection Agency Climate Change.
http://epa.gov/climatechange/index.html

Hawaii Statewide Transportation Plan Update Issue Paper on Climate Change and Sea Level Rise
46

Hawaii Statewide Transportation Plan Update Issue Paper on Climate Change and Sea Level Rise
47
Appendix 1:
Hawaii Greenhouse Gas Emission Reduction Task Force Members

Hawaii Statewide Transportation Plan Update Issue Paper on Climate Change and Sea Level Rise
48

Hawaii Statewide Transportation Plan Update Issue Paper on Climate Change and Sea Level Rise
49
Appendix 1: Hawaii Greenhouse Gas Emission Reduction Task Force Members
Name and Title Appointment By(Per SECTION 4., Act 234, SLH 2007)
Mr. Theodore E. Liu Director State of Hawaii Department of Business, Economic Development, and Tourism Task Force Co-Chair
Specified by Act 234, SLH 2007
Mr. Laurence K. Lau Deputy Director of the Environmental Health Administration State of Hawaii Department of Health Task Force Co-Chair
Specified by Act 234, SLH 2007
Mr. Frank Clouse Manager, Refining Tesoro Hawaii Refinery
President of the Senate
Mr. Jeff Mikulina Chapter Director Sierra Club Hawaii Chapter
President of the Senate
Mr. Gareth Sakakida Managing Director Hawaii Transportation Association
President of the Senate
Mr. Robbie Alm Senior Vice President, Public Affairs Hawaiian Electric Company, Inc.
Speaker of the House
Mr. Mark Fox Director, External Affairs The Nature Conservancy
Speaker of the House
Mr. Gary North Senior Vice President – Pacific Matson Navigation Company
Speaker of the House
Dr. Makena Coffman Assistant Professor Department of Urban and Regional Planning University of Hawaii at Manoa
University of Hawaii at Manoa Climate Change Commission
Prof. Maxine Burkett, Associate Professor of Law; Director, Center for Island Climate Adaptation and Policy, University of Hawaii at Manoa
University of Hawaii at Manoa Climate Change Commission


Issue Paper #3 Aging Population and Transportation
In Preparation for the
Hawaii Statewide Transportation Plan Update
Prepared for Department of Transportation
State of Hawaii
Prepared by SSFM International, Inc. With HNTB
2011

Hawaii Statewide Transportation Plan Update Issue Paper on Aging Population and Transportation
- i -
Table of Contents Foreword ...............................................................................................................................1 Section 1.0 Background—The Aging Population in Hawaii ...........................................................3 Section 2.0: Trends .....................................................................................................................7
Section 2.1 Demographics .......................................................................................................7
Section 2.2 Traffic and Pedestrian Accident Rates ...................................................................9
Section 2.3 Elderly Falls and Injury Rates ...............................................................................10 Section 3.0: Efforts to Date to Plan for Hawaii’s Aging Population .............................................11
Section 3.1 Hawaii Statewide Transportation Plan ................................................................11
Section 3.2 Executive Office on Aging: State Plan on Aging 2008-2011 .................................11
Section 3.3 Hawaii Strategic Highway Safety Plan 2007-2012 ...............................................12
Section 3.4 Complete Streets Law ........................................................................................13
Section 3.5 Statewide Pedestrian and Bicycle Master Plans ..................................................14
Section 3.6 Transportation Security Administration and Air Travelers with Disabilities and Medical Conditions ............................................................................................15
Section 3.7 Hawaii Airports Modernization Plan ....................................................................15
Section 3.8 Hawaii Harbors Modernization Plan ....................................................................16 Section 4.0: Best Practices from Other States ...........................................................................17
Section 4.1 Statewide Transportation Plans ..........................................................................17
Section 4.2 Other Initiatives .................................................................................................19 Section 5.0 Recommendations for Hawaii Statewide Transportation Plan Update....................25 Section 6.0 Resources...............................................................................................................27 References .............................................................................................................................29 Appendix 1: Maricopa Association of Governments’ Review of Air Terminal Facility Needs
Relative to the Needs of an Aging Population .......................................................31

Hawaii Statewide Transportation Plan Update Issue Paper on Aging Population and Transportation
- ii -

Hawaii Statewide Transportation Plan Update Issue Paper on Aging Population and Transportation
- 1 -
Foreword The Hawaii state transportation planning process is being supported by the development of a series of issue papers. Each paper explores a different emerging issue that will have a major impact on Hawaii’s transportation future. The emerging issues for Hawaii’s transportation were selected by the Hawaii Statewide Transportation Plan Team as issues which may have significant impact on Hawaii’s residents and their transportation needs. Many emerging issues are associated with the Federal Planning Requirements, changing trends, as well as shifts in public perception. This issue paper addresses the issue of transportation and the state’s aging population. SSFM is the lead consultant for the Hawaii Statewide Transportation Plan (HSTP) Update, and they are supported by a team of consultants. This paper’s lead author is HNTB. This “Issue Paper #3 on Aging Population and Transportation” includes sections on:
• How the 2002 Hawaii Statewide Transportation Plan (2002 HSTP) treated the state’s aging population and transportation;
• Executive Office on Aging: Hawaii State Plan on Aging 2008-2011 • Best practices from other states; and, • Proposed guidance to be included in the Hawaii Statewide Transportation Plan Update
(HSTP Update). Issue papers in this series include:
Issue Paper #1: Impact of Federal Planning Requirements (Eight Planning Factors) Issue Paper #2: Climate Change and Sea Level Rise Issue Paper #3 Aging Population and Transportation Issue Paper #4: Fuel and Energy Scenarios for Hawaii Issue Paper #5: Land Use Planning Issue Paper #6: Planning & Design: Context Sensitive Solutions (CSS), Complete Streets,
Smart Growth, and Transit Oriented Development (TOD) Issue Paper #7: Transportation Security Issue Paper #8: System Preservation and Asset Management Issue Paper #9: Financial Scenarios Issue Paper #10: Environmental Coordination

Hawaii Statewide Transportation Plan Update Issue Paper on Aging Population and Transportation
- 2 -

Hawaii Statewide Transportation Plan Update Issue Paper on Aging Population and Transportation
- 3 -
0 50,000 100,000 150,000 200,000 250,000
0-9
10-19
20-29
30-39
40-49
50-59
60-69
70-79
80 over
20352010
Section 1.0 Background—The Aging Population in Hawaii The United States is seeing an increase in citizens categorized as elderly (i.e. over 65 years of age). Currently, approximately 13% of the United States population is over 65 years of age, with that number projected to jump to approximately 22% by the year 2030.1 In the State of Hawaii things are even more dramatic.
• Hawaii is seeing a dramatic growth in the population that is 65 years and older, that group increasing from 13% of the total population in 2010 to approximately 19% in 2030.2
• In Hawaii, the population of elderly residents is projected to be nearly 400,000 people by the year 2035, or 25% of the total state population as shown graphically in Figure 1.3
• The state’s pedestrian fatality rate from 2001-2005 was over 3 times that of the United States on average.4
• The number of vehicle fatalities per year for those over 65 years of is the highest of all other age groups.5
Figure 1 - State of Hawaii Growth in Aging Population
Source: State of Hawaii Department of Business Economic Development and Tourism, 2008 Forecast
1 US Census Bureau, File 3. Interim State Projections of Population by Single Year of Age: July 1, 2004 to 2030. 2 U.S. Department of Health and Human Services, Administration on Aging. A Profile of Older Americans. 2008. 3 Hawaii Department of Business, Economic Development & Tourism. State of Hawaii Databook. Table 1.29, Projected Resident Population by Age and Sex. 2008. 4 HDOT. Hawaii Strategic Highway Safety Plan 2007-2012. 2007. pg 18 5 HDOT, Crash Statistics, Fatalities by Age Group. http://hawaii.gov/dot/highways/dot-hwys-public-affairs/safecommunities/crashstats/age.htm Last Accessed March 2010.

Hawaii Statewide Transportation Plan Update Issue Paper on Aging Population and Transportation
- 4 -
As the population ages, older drivers and pedestrians are faced with declining cognitive skills, such as memory, selective attention, and difficulties processing speed. While the senior population has the fewest licensed drivers per capita and drives fewer miles per capita, they have a higher likelihood of injury or fatality from an accident than all other age groups. Many still continue to depend on the automobile for meeting their transportation needs. These two facts combined with the mental and physical deterioration associated with aging leads to the conclusion that this population requires special attention in the design and function of transportation systems. This has been recognized by many states, as well as the federal government. For example, in a step toward addressing these special needs, the Federal Highway Administration (FHWA) has released the Highway Design Handbook for Older Drivers and Pedestrians. With the challenges faced by older travelers (not just “drivers”), it is important to consider the whole trip, i.e. from one’s front door to one’s ultimate destination, whatever paths, modes, facilities, and services that trip may entail. The State Transportation Plan workshop on needs of the aging population highlighted the complexity of such trips and the different treatments of these trip parts. With different facility and service operators and different modes used, there is no one party responsible for continuity of the trip-serving elements (e.g., sidewalks, vehicles, roadway, transit vehicles, terminals, airports, harbor terminals, etc.). This stands as one of the most significant challenges in planning and providing transportation for the public as well as standing as a challenge for those individuals with less mobility than most. As of December 31, 2008, there were 128,334 licensed drivers in Hawaii over the age of 65, representing over 14% of all licensed drivers. This number will shift higher as the population ages.6 Multiple studies and plans have been developed for Hawaii that either center on the elderly population or recognize that the continued increase of the elderly population will have an impact on the transportation system. The Hawaii Complete Streets Law was adopted in 2009 as Act 54 and requires that actions be taken to ensure access and mobility on public highways and roadways, whether controlled by State or County, for users of all ages, and this includes bicyclists as well as pedestrians. Issue Paper #6 in this series will specifically address Act 54 and its relevance to the HSTP. Emphasis of these studies and plans has been placed on highway and roadway travel for the aging population. Needs for the elderly for airports or harbors have not been specifically addressed, but need to be. In a July 9, 2009, Hawaii Statewide Transportation Plan workshop held in conjunction with the Sub-Statewide Technical Advisory Committee (Sub-STAC), panelists described challenges older travelers have in getting to, from, and around Hawaii. These included:
• Long travel distances from entry areas into airports to flight gates.
6 Hawaii Department of Business, Economic Development & Tourism. State of Hawaii Databook. 2008. Table 18.16, Hawaii Drivers License In Force, By Age.

Hawaii Statewide Transportation Plan Update Issue Paper on Aging Population and Transportation
- 5 -
• Lack of plane door level exits from planes to the terminal (i.e., no ramps that would allow travelers to avoid steep stairs) in most smaller airports.
• Lack of docks on some islands which means that travelers need go from the shore to the ship by a small boat and board in a manner that is awkward or challenging.
• Insufficient and inadequate signage. • Lack of easily identifiable or near restrooms. • Uneven or missing sidewalks. • Limited facilities (e.g. specialty medical facilities) on one island which necessitates trips
to other islands. In conjunction with the production of the HSTP Update, a statewide phone survey of 1,200 residents was taken in late 2009 and early 2010. Residents were surveyed on all islands, and a cellular phone component was utilized in order to reach a wider sector of the population. In addition, in-depth interviews were conducted with special segments of the population, including those that represent the elderly. This survey exercise found several interesting issues:
• Many neighbor island seniors have no option but to drive, even when they know they shouldn’t.
• Seniors living in areas with unimproved sidewalks or no sidewalks do not have the ease of using electric scooters for transport.
• The application process for special needs transportation can be too onerous for some seniors, for example, those who do not speak English.
Figure 2 – Travel Off-Island Travel for Health Care Perhaps the most stunning statistic from this survey was the number of people in the respondent’s household who needed to travel outside their island for medical care as shown in Figure 2. While the state average was 12%, the neighbor islands showed significantly higher numbers. Of these
Source: HSTP Update Survey, 2010
households that do need to travel, 76% were going to another island, 19% were going to the mainland, and 5% traveled to a country outside the United States.

Hawaii Statewide Transportation Plan Update Issue Paper on Aging Population and Transportation
- 6 -
The following are critical considerations about Hawaii’s elderly for those making improvements to state transportation systems, including highways, airports and harbors, and they should be considered in the HSTP Update:
• The transportation needs of the aging population for airports needs greater consideration. Appendix 1 in this issue paper includes a working paper by the Maricopa Association of Governments (greater Phoenix Arizona) describing airport terminal considerations relative to an aging population. This provides concepts for improving travel through airports for older travelers.
• The transportation needs of the aging population at harbors needs greater consideration. Currently two ports at Kona and Lahaina have piers too small to accommodate cruise liners. The tenders that ferry passengers between the cruise ship and the pier are accessed by stairways, which are not wheelchair accessible. Honolulu, Hilo, and Nāwiliwili Harbors do have a separate access door with a short ramp to the cruise ship pier; however, the ramps are too steep for a wheelchair user to navigate alone.
• Para-transit operators for the Counties will need to consider an increased need for their services based on the growing elderly population.
• The portion of the population that is over 65 will continue to increase as life expectancies continue to rise and the last of the Baby Boomers turns 65 before 2035.
• The deterioration of cognitive, physical, and sensory functions as people age will continue to be an issue for aging adults.
• The passing of the Complete Streets (Act 54, 2009) law contains mandatory policy that requires HDOT and County transportation departments to adopt practices that ensure the mobility and safety for public highway and street users of all ages.
• The increase in the elderly population will have an overall impact to roadway, airport, harbor, transit, para-transit, bicycle, and pedestrian use. Improvements to make traveling, wayfinding, navigating, and walking easier and safer for the elderly will be required to ensure the safety of all persons using the various parts of the transportation system.
• The planned rail system on Oahu will provide an alternative to driving, but the project may lead to an increase in the number of pedestrians and bicyclists within close vicinity of the stations.
This issue paper provides information and background on how the aging population was addressed in the previous HSTP, best practices seen from other state transportation plans, and suggested improvements for the HSTP Update.

Hawaii Statewide Transportation Plan Update Issue Paper on Aging Population and Transportation
- 7 -
Section 2.0: Trends Section 2.1 Demographics
Hawaii and the balance of the United States are seeing an increase in the percentage of older adults within the population. There are three main contributing factors to this increase:
• The oldest of the Baby Boomer generation (those born between 1946 and 1964) are now over 60 years old. This age cohort is larger than those in adjoining age groups and has had a disproportionate effect on travel and other functions, at least until recently.
• Life expectancy for Hawaii residents is increasing and is, in fact, higher than that of the United States as a whole. (See Figure 3)
• The proportion of the population that is female, who have a higher life expectancy than males, is increasing. (See Figure 4)
Figure 3 - Life Expectancy At Birth, Hawaii vs. United States
Source: Hawaii State Department of Business, Economic Development, and Tourism, The State of Hawaii Data Book, A Statistical Abstract. Centers for Disease Control and Prevention, National Center for Health Statistics, National Vital Statistics Reports.
Figure 4 - Life Expectancy at Birth by Gender, Hawaii
Source: Hawaii State Department of Business, Economic Development, and Tourism, The State of Hawaii Data Book, A Statistical Abstract.

Hawaii Statewide Transportation Plan Update Issue Paper on Aging Population and Transportation
- 8 -
Between 1980 and 2000, the older adult (60 years of age or older) population increased by nearly 82% while the total population grew by less than 26%. The growth in the number of adults 85 or older is even more dramatic. Over a 20 year period, the 85+ population increased by 216%. With the aging of the Baby Boomers, projections indicate that by the year 2030 one in four individuals will be an older adult.7 Hawaii is also seeing a higher rate of increase in the older population than in the United States as a whole, as depicted in Table 1 below.
Table 1 - Percentage Population over 65 Years, Hawaii Compared with the United States 2000 2010 2030 Forecast Hawaii 13.3% 14.3% 22.3%United States 12.4% 13.0% 19.7%
Source: U.S. Census Bureau Table 2 from the Hawaii State Plan on Aging 2008-2011, pg II-2, provides a summary of the 60+ and 85+ populations from 1980 and includes forecasts for 2010, 2020, and 2030.
Table 2 - Summary of 60+ and 85+ Population of Hawaii
7 Hawaii Department of Health, Executive Office on Aging. Hawaii State Plan on Aging 2008-2011. 2007. pg viii.

Hawaii Statewide Transportation Plan Update Issue Paper on Aging Population and Transportation
- 9 -
Section 2.2 Traffic and Pedestrian Accident Rates
In the 2001-2005 period, Hawaii had the fifth highest pedestrian fatality rate from traffic crashes in the United States and the highest fatality rate for pedestrians 65 years and older. According to the Hawaii Strategic Highway Safety Plan 2007-2012, the 5-year rate for Hawaii senior-aged pedestrians (40.2 deaths/100,000 senior-aged residents) was nearly 3 times higher than that for the rest of the United States (14.1).8
Traffic fatalities in Hawaii are also highest for persons over 65 years of age, averaging 15.7% of the total fatalities from 1986 to 2001.9
Figure 5 - 2004 Hawaii DOT Safety Marketing Survey Senior Respondents Street Crossing Attitudes During a 2004 State DOT Safety Marketing Survey, some of the questions dealt with seniors and their attitudes about pedestrian safety. Figures 5 and 6 show survey results related to senior attitudes about crossing the street. The numbers at the right in each figure correspond the percentage of respondents age 55 and over to the percentage of the total Hawaii residents who are 55 and over. For example, in Figure 5, 5% of the 55 and over Hawaii residents corresponds to 5,860 elderly residents. Figure 6 - 2004 Hawaii DOT Safety Marketing Survey Senior Respondents Crosswalk Timing
More than half of the respondents age 55 and over believe that crosswalk signals do not allow sufficient time to cross the street. Using the same population correspondence, this translates to more than 80,000 Hawaii residents.
8 Hawaii Strategic Highway Safety Plan. pg 18. 9 HDOT, Crash Statistics, Fatalities by Age Group. http://hawaii.gov/dot/highways/dot-hwys-public-affairs/safecommunities/crashstats/age.htm Last Accessed March 2010.

Hawaii Statewide Transportation Plan Update Issue Paper on Aging Population and Transportation
- 10 -
Section 2.3 Elderly Falls and Injury Rates While there is no specific data available in Hawaii on incidents on falls at airports and cruise ship terminals for any age group, there is the following data available on fall-related injuries for the elderly population in Hawaii and the United States.
• Fall-related deaths and hospitalizations are more than double those for motor vehicle injuries for the population aged 65 years and over in the United States. This translates to an incidence rate of around 5 falls per 100 older persons annually.10 In Hawaii in 2000, this translated to 7,600 falls in the 65+ population.11
• Falls cost Hawaii $10,600 per fall in direct medical and long-term care costs. • Falls account for 68% of hospitalizations for the population aged 65 years and over in
the United States. • Almost half of the falls occur away outside the home in the United States, with nearly
60% of fall injuries among older persons caused by slipping, tripping, or stumbling. 12 • Approximately 43 percent of all fall injuries, indoor and outdoor, occurred at floor or
ground level, meaning the fall did not occur from a height such as a stair or a curb.13 With Hawaii’s growing elderly population, and the recognition that a variation in height is not necessarily the cause of a fall, transportation planners may want to consider working with outreach groups such as the American Association of Retired Persons and the Hawaii Department of Health, Executive Office on Aging on design solutions for all transportation facilities as well as intermodal connections between the different transportation modes.
10 Kochera, Andrew. Falls Among Older Persons and the Role of the Home: An Analysis of Cost, Incidence, and Potential Savings from Home Modification. AARP Public Policy Institute, Issue Brief #56. Washington, D.C. 2002. Page 2. 11 Kochera. Page 3. 12 Kochera, Page 3. Also as presented at the July 9, 2009, Sub-STAC on Aging and Transportation by Jana Lynott of AARP. 13 Kochera, Page 4.
Hawaii Statewide Transportation Plan Update Issue Paper on Aging Population and Transportation
- 11 -
Section 3.0: Efforts to Date to Plan for Hawaii’s Aging Population Section 3.1 Hawaii Statewide Transportation Plan
The 2002 Hawaii Statewide Transportation Plan addressed the aging of the State’s population. That plan specifically listed aging as a demographic trend that will need to be addressed by future updates of the HSTP. That plan recognized that the increased elderly population may require specialized transportation services and may increase the demands on highway and public transportation systems.14 In addition, the elderly and those advocating for the elderly were included in the public involvement and input process when developing the 2002 HSTP. The goals and objectives are designed to be broad enough to address future projects that are not yet defined while still providing meaningful guidance for those seeking to identify specific projects and programs for development. However, improvements for the aging population are not specifically called out within the goals or objectives. Of the five goals, specific needs for the elderly could be addressed under the following two goals:
Goal I: Achieve an integrated multi-modal transportation system that provides mobility and accessibility for people and goods.
Objective 3: To promote alternative air, land, and water transportation mode choices C. Facilitate and provide walking and bicycling options that meet statewide and community needs.15
Goal II: Ensure the safety and security of the air, land, and water transportation systems.
Objective 1: To enhance the safety of the transportation system. A. Provide safe facilities and infrastructure.16
Section 3.2 Executive Office on Aging: State Plan on Aging 2008-2011
The Hawaii Executive Office on Aging (EOA), which is within the State Department of Health, is the designated lead agency in the coordination of a statewide system of aging and caregiver support services. The focus of the EOA is to ensure the health and well-being of the elderly through providing information, outreach, and advocacy. The programs offered for the aging population focus on health topics as well as assisting older adults to remain independent and active. Although transportation is listed as one of the support services, this is geared toward providing pick-up/drop-off services for seniors but does not include support services for seniors who are still driving personal vehicles.
14 2002 HSTP, pg 2 15 2002 HSTP, pg 42 16 2002 HSTP, pg 44

Hawaii Statewide Transportation Plan Update Issue Paper on Aging Population and Transportation
- 12 -
The EOA completed its Hawaii State Plan on Aging in 2007 for the 2008-2011 timeframe and describes the strategies that will be taken for the development of a comprehensive and coordinated system to serve older adults and their caregivers. This document, like the HSTP, recognizes the imminent need to prepare the increasing portion of the population that is categorized as elderly. The plan sets forth six goals to be pursued, with transportation and pedestrian safety for the aging population addressed in Goal 1 under Strategy 1-1:
Goal 1: Hawaii’s communities have the necessary economic, workforce, and physical capacity for an aging society
Strategy 1-1: Partner to prepare for the future.
Transportation17: As the population ages, it is important to help older adults maintain their independence and self sufficiency. The objectives under this section are to assess the types of transportation services are needed and to then provide a range of transportation options by 2011. However, the types of transportation options that are to be assessed are not specified and it is unclear if improvements will include changes in highway design or if it will be specifically geared toward providing transportation services (i.e. pick-up/drop-off services).
Pedestrian Safety18: The first objective under Pedestrian Safety is ensuring the Hawaii Strategic Highway Safety Plan includes strategies to reduce older adult pedestrian casualties. The EOA will also work with HDOT to implement the safety improvements noted in the Hawaii Strategic Highway Safety Plan.
Section 3.3 Hawaii Strategic Highway Safety Plan 2007-2012
The Hawaii Strategic Highway Safety Plan (HSHSP) spans the years from 2007-2012. The strategies outlined in the HSHSP provide overall guidance and direction to help decision makers identify the important steps that must be taken to reduce the traffic fatalities and injuries on Hawaii’s roadways. This document provides seven challenges to be addressed as well as various strategies to aide in addressing each challenge. The stated goal in the HSHSP is to reduce the number of traffic-related fatalities from an average of 135 a year to 100 or fewer per year by 2012. Safety for airports or harbors is not included in this document. Of the seven challenges listed, two are relevant to providing improved pedestrian and transportation environments for the aging population: “Safeguarding Pedestrians and Bicyclists” and “Building Safer Roadways by Design”.
Challenge: Safeguarding Pedestrians and Bicyclists19
As mentioned under the State Plan on Aging, one of the objectives of the EOA was to ensure that strategies to improve safety of older pedestrians are included
17 Hawaii State Plan on Aging 2008-2011, pg IV-8 18 Hawaii State Plan on Aging 2008-2011, pg IV-9 19 Hawaii Strategic Highway Safety Plan 2007-2012, pg 17

Hawaii Statewide Transportation Plan Update Issue Paper on Aging Population and Transportation
- 13 -
in the HSHSP. This objective has been met as multiple strategies are provided in the HSHSP under Safeguarding Pedestrians and Bicyclists. Although the disproportionate fatality and accident rate for older adults in Hawaii is mentioned in this section, the listed strategies do not specifically mention needs for the aging population.
Challenge: Building Safer Roadways by Design20
This section provides a strategy to develop a transportation master plan that emphasizes safety and accommodates all uses, but that is the only location where the specific and unique needs of older drivers could be included.
The Hawaii Strategic Highway Safety Plan also recognizes the need for safer pedestrian and bicycle facilities. As described in the HSHSP:
Recent steps to address pedestrian safety include a law passed in 2005 requiring motorists to stop for pedestrians in crosswalks, and a statewide public awareness campaign that was undertaken to educate the public on the new law. Legislation passed in 2007 includes stricter penalties for crosswalk violators, substantial funding for crosswalk improvements and pedestrian education and enforcement, and funding earmarked for bikeways.21
Section 3.4 Complete Streets Law
States throughout the country, as well as the United States government, are recognizing the need to address safety and access for all transportation options other than just personal vehicles. In addition, the aging Baby Boomer population will require changes in highway, airports, harbor, transit, and pedestrian design to accommodate changes in driving and travel habits for the aging population. To address these concerns, in May 2009, Hawaii adopted the “Complete Streets” bill into State Law. This law, also known as Act 54, requires that HDOT and the County transportation departments adopt a complete streets policy that ensures that the access and mobility for all public highway and street users, including pedestrians, bicyclists, transit users, motorists, and persons of all ages and abilities, are reasonably accommodated. This applies to all new construction, reconstruction, and maintenance, as well as any developments for which planning or design commences on or after January 1, 2010. As part of this bill, a Complete Streets Task Force was established to review existing highway/roadway design standards and guidelines to provide recommendations for changes and additions. The task force provided an interim report to the Hawaii State Legislature in early 2010 and final findings, recommendations, and proposed legislation will be reported to the Hawaii State Legislature in 2011. The Complete Streets Task Force kicked off in February 2010, is strongly supported by AARP and the One
20 Hawaii Strategic Highway Safety Plan 2007-2012, pg 22 21 Hawaii Strategic Highway Safety Plan 2007-2012, pg 17

Hawaii Statewide Transportation Plan Update Issue Paper on Aging Population and Transportation
- 14 -
Bike Plan Hawai‘i Overall Goal:“To establish bicycling as a safe and convenient mode of transportation for residents and visitors throughout the state.”
Voice for Livable Islands, a coalition formed to achieve healthy neighborhood design through advocacy, communication, and mobilization.22 The United States government is also considering steps to require “Complete Streets” design throughout the country. In March 2009, the Complete Streets Act of 2009 was introduced in the United States Congress. This bill follows the principles of the Hawaii Complete Streets bill and requires “each state to have in effect within two years a law, or each state department of transportation and metropolitan planning organization (MPO) an explicit policy statement, that requires all federally-funded transportation projects, with certain exceptions, to accommodate the safety and convenience of all users in accordance with certain complete streets principles.” This bill is currently with the Congressional Committee on Environment and Public Works. Section 3.5 Statewide Pedestrian and Bicycle Master Plans
Hawaii recognizes that walking and bicycling are a fundamental part of the transportation system and has taken planning steps to address pedestrian and bicyclist safety. Hawaii DOT has begun work on the Statewide Pedestrian Master Plan. A Citizen Advisory Committee was formed to provide balanced input on the plan. The draft plan will be presented around the state at a series of meetings between February 2010 and April 2011, with the final Pedestrian Master Plan submitted in later 2011. Goals of the plan include improving pedestrian safety and promoting walking connections to destinations such as transit stops and centers. The plan will also help to identify spending priorities. As a key component of the island community, seniors will be included in the dialogue about making their communities safer for all walkers. The Hawaii DOT released an updated Statewide Bicycle Master Plan in 2003 titled Bike Plan Hawaii. The plan has five objectives easily remembered as the 5 “E”s23:
• Engineering and Planning • Education • Enforcement • Economics • Encouragement
Each objective has a set of recommended actions that are pertinent to aging and transportation. These include:
22 One Voice for Livable Islands at http://www.hbl.org/?q=node/227. The coalition includes AARP Hawaii, Hawaii Bicycling League, Hawaii Public Health Association, Kailua Urban Design Task Force, Kaua‘i Peoples Advocacy for Trails Hawaii, Injury Prevention Advisory Committee, Maui Bicycle Alliance, and Peoples Advocacy for Trails Hawaii (PATH). 23 HDOT. Bike Plan Hawaii. 2003. pg. 4-2.

Hawaii Statewide Transportation Plan Update Issue Paper on Aging Population and Transportation
- 15 -
• Support of bicycle education programs for adults, similar to BikeEd, which is a program for fourth grade students.
• Consider signs or markers that facilitate way-finding. This has been shown to be a key element in making transportation facilities more useful for seniors.
• Expand and improve each island’s network of safe, convenient, and integrated bikeways.
• Educate drivers, bicyclists, pedestrians and any other users to “Share the Road.” This not only ensures safe operation of bicycles, but also makes the road safer overall. More on this issue is discussed within the Complete Streets section and another Issue Paper.24
Section 3.6 Transportation Security Administration and Air Travelers with Disabilities and Medical Conditions
The Transportation Security Administration (TSA) has established a program for screening of persons with disabilities and their associated equipment, mobility aids, and devices. The TSA program covers all categories of disabilities, including mobility, hearing, visual, and hidden disabilities. The TSA established a coalition of over 70 disability-related groups to help the agency understand the concerns and unique needs of persons with disabilities and medical conditions. While not all elderly air travelers are considered disabled, this program may assist those elderly air travelers who cannot participate in the traditional screening process. The TSA program for Travelers with Disabilities and Medical Conditions25 includes permitting of prescription liquid medications and any other liquids needed by persons with disabilities and/or medical conditions. In addition to liquid prescriptions, this program takes into account needed frozen items, liquid nutrition, life-support and life-sustaining liquids such as bone marrow, blood products and transplant organs. In addition, TSA allows disability-related items through the airport security checkpoint. These disability-related items include wheelchairs, scooters, prosthetic devices, Braille note takers, CO2 personal ozygen concentrators, and any other disability-related equipment and associated supplies.26 A Family/Medical Liquids lane has been established for those needing extra care when completing the TSA Screening Process at the airport. Section 3.7 Hawaii Airports Modernization Plan
The Hawaii Airports Modernization Plan currently underway includes many airport improvements that will assist elderly travelers. While this effort was undertaken to improve the security, safety, capacity, and efficiency of Hawaii’s airports, many of the projects underway will benefit elderly travelers. Projects that have been completed or are underway include27:
24 Bike Plan Hawaii. Chapter 4. 25 TSA program for Travelers with Disabilities and Medical Conditions. http://www.tsa.gov/assets/pdf/special_needs_memo.pdf TSA Website Last Accessed June 2010. 26 TSA Website. 27 Hawaii Airports Modernization Plan. http://hawaiiairportsmodernization.com/ Last Accessed June 2010.
Hawaii Statewide Transportation Plan Update Issue Paper on Aging Population and Transportation
- 16 -
• The Flight Information Display has been upgraded at Honolulu International Airport and
it will be upgraded at Kahului Airport. • The passenger loading bridges have been replaced at Honolulu International Airport,
Kahului Airport, and Līhu‘e Airport. • The lobby of the Hilo International Airport has been refurnished to include couches and
larger chairs. • Moving walkways will be installed by 2011 in the International Arrivals corridor at
Honolulu International Airport. • Seating capacity will be increased by 20% in passenger hold rooms at Kahului Airport. • Air conditioned hold rooms will be provided at Kona International Airport, and the air
conditioning systems will continue to be improved at Līhu‘e Airport and Honolulu International Airport.
These airport improvements across the state will assist elderly air travelers on their journeys, and the improvements are required to conform with ADA regulations relating to accessibility. Section 3.8 Hawaii Harbors Modernization Plan
The Harbors Division, working with the Hawaii Harbor Users Group (HHUGS), developed a system-wide Harbor Modernization Program (HMP), which was approved by the Legislature. The HMP is meant to address infrastructure improvements projected through the year 2030. HHUG members voluntarily agreed to a temporary increase in tariff charges, with the increase dedicated with the increase dedicated to HMP projects. Phase I of HMP totals $150 million, and projects underway include:28
• Paving and strengthening improvements and property acquisitions at Kahului Harbor, Kalaeloa Harbor and the former Kapalama Military Reservation for expansion;
• Construction of a Kapalama container deep draft wharf and berthing for two container ships as well as a 70-acre container yard with ancillary off-site improvements, utilities, and a new fuel pier at Kalaeloa West Harbor;
• A new pier and inter-island cargo handling yard at Pier 4 in Hilo plus acquisition of property for a third harbor entrance; expansion and extension of Pier 2 in Kawaihae Harbor; and
• Construction of a new multi-use berth for additional liquid bulk cargo along the existing jetty at Nawiliwili Harbor in Kauai.
Like the Airports Modernization Plan, the Harbors Modernization Plan’s improvements will assist elderly travelers and users on their journeys, and the improvements are required to conform with ADA regulations relating to accessibility.
28 Hawaii Harbors Modernization Plan. http://hawaii.gov/dot/harbors/whats-new/harbors-modernization-plan Last Accessed January 2011.

Hawaii Statewide Transportation Plan Update Issue Paper on Aging Population and Transportation
- 17 -
Section 4.0: Best Practices from Other States Section 4.1 Statewide Transportation Plans
The statewide transportation plans for four states were researched for this paper (California, Oregon, Florida, and Michigan). All provide information on trends and challenges that need to be addressed within the STP and goals to be met. However, the STPs provide different levels of detail on strategies to meet the stated goals. The intent of this review is to illustrate how other recently updated state transportation plans have addressed issues involving an aging population. These states were selected for several reasons, including recency of update, variety of geographic conditions, and variety of modal responsibilities. There is no intent to suggest that Hawaii should adopt specific language or endorse actions of other states just because those other states have established the policies they have. However, it is suggested that Hawaii should observe the plans of others and consider what may be of interest for consideration in its plan update. In addition, this section includes review of a transportation plan of the Irish national government titled “Sectoral Plan for Accessible Transport under the Disability Act 2005.” While not a United States state plan, this document does provide more insight into how a public organization is treating mobility issues for an aging population. Table 3 provides a short comparison of the Statewide Transportation Plans for California, Oregon, Florida, and Michigan. Although some of the Statewide Transportation Plans mention the needs of the aging population in relation to highways and roadways (travel, infrastructure, etc), none of the researched Statewide Transportation Plans specifically mention the needs of the aging population in relation to airports or harbors. While some states’ plans mentioned harbors, most of that treatment was limited to physical harbor capacity, quality, and costs with little treatment of mobility through the port terminals to ships. However, the Irish national government’s plan for accessible transportation does treat the terminal/ship accessibility issue and is reviewed in this section. Table 3 also notes whether the aging population is specifically mentioned as a trend/challenge and if there is a related Statewide Transportation Plan goal. The table also depicts whether the Statewide Transportation Plans provide strategies and persons/entities responsible to implement the stated goals. All four Statewide Transportation Plans researched for this issue paper provided goals to be reached over the time frame of each document. These goals all tended to be generic, such as “ensuring the safety and security of transportation systems” and “enhancing the transportation system to improve mobility and accessibility.” Although the overarching goals are generic, the policies and objectives listed within each Statewide Transportation Plan provide additional detail on the direction and purpose of each goal while each plan provides varying levels of detail.

Hawaii Statewide Transportation Plan Update Issue Paper on Aging Population and Transportation
- 18 -
Table 3 - Summary of Statewide Transportation Plans
SUMMARY OF STATEWIDE TRANSPORTATION PLANS: HOW THE GROWING AGING POPULATION IS ADDRESSED
State Trend/ Challenge
Goal/ Policy
ImplementationHow does the plan address this challenge?
Strategies Responsibilities
California Yes Yes Yes No
Goal 4: Enhance Public Safety and Security Policy: Improve System and User Safety Strategy: Improve transportation system safety for older Californians Multiple items listed under this strategy, including “Establish roadway infrastructure and land use practices that promote safety” Provides performance measures for each goal to follow progress
Oregon Yes Yes Yes No
• Goal 1 - Improve mobility and access Policy 1.2 – Equity, Efficiency and Travel Choices o It is the policy of the State of Oregon to promote
a transportation system with multiple travel choices that are easy to use, reliable, cost-effective, and accessible to all potential users, including the transportation disadvantaged.
• Provides policies
Florida Yes Yes Yes Yes
Goal: A stronger economy through enhanced mobility for people and freight Within Communities
o Long Range Objective: Ensure that the transportation system is accessible to all users, including young, elderly, disabled, and economically disadvantaged persons
• “Sustainable Transportation Investments” is one of the goals, but Statewide Transportation Plan does not provide investment plan
Michigan Yes No Yes No
Improvements for the elderly could be categorized under “System Improvement” and “Safety and Security” Goals. Improving mobility for the elderly is in the conclusion, though not listed specifically under any goals: “The level of investment proposed in this plan will provide the growing elderly population with greater mobility and more options for access to health care, community activities and community services….”
Sources: State of California DOT, “California Transportation Plan, 2025,” 2006, pg 51 State of Oregon DOT, “Oregon Transportation Plan,” 2006, pg 48 State of Florida DOT, “2025 Florida Transportation Plan,” 2005, pg 18 State of Michigan DOT, “Michigan Transportation Plan: Moving Michigan Forward,” 2007, pg 27

Hawaii Statewide Transportation Plan Update Issue Paper on Aging Population and Transportation
- 19 -
Improving transportation for the elderly is not mentioned specifically in the HSTP or the Michigan Statewide Transportation Plan but is mentioned specifically under the goals for the California, Oregon, and Florida Statewide Transportation Plans. Table 3 notes whether each Statewide Transportation Plan mentioned the aging population specifically in the goals and policies. However, with the passing of the Complete Streets Law in 2009 as Act 54, the HSTP Update should consider inclusion of appropriate elements that will help carry that law out. The level of detail that each Statewide Transportation Plan provides for each goal and the ways in which the goals could be reached varied from state to state. All four of the Statewide Transportation Plans researched provided strategies to implement the stated goals, policies, and/or objectives. These strategies range from specifically noting improvements for the elderly to establishing targets to measure progress and performance. These strategies are integral in progressing the policies and objectives for the elderly population as stated in the Statewide Transportation Plans. The Florida Statewide Transportation Plan goes one step further and provides the entities that will be responsible in implementing the Statewide Transportation Plan goals. Additionally, see Appendix 1 in this issue paper, a presentation outlining the Maricopa Association of Governments approach to considering air terminal needs for older travelers. While the information is not from a specific statewide transportation plan, the concepts reviewed in this presentation offer ideas for Hawaii DOT to consider in the update of its HSTP. Section 4.2 Other Initiatives
The following provides additional information on the efforts being made by other states in improving the safety for elderly drivers and pedestrians. Although efforts listed do not include statewide transportation plans, they may provide helpful information for the development of the HSTP Update. California State Highway Safety Plan The California SHSP specifically recognizes that improvements for elderly drivers is an important challenge and provides a specific quantifiable goal to be met by a set date. Various strategies and implementation issues are also provided for each challenge.
Challenge 9: Improve Safety for Older Roadway Users
Goal: By 2010 reduce the number of fatalities attributed to drivers age 65 and older by 10% from 2004 levels.29
In addition, an implementation plan was developed which provides a list of ranked action items that would help implement the goals listed in the California SHSP. For the challenge of improving safety for older roadway users, the implementation plan includes the strategies and
29 California DOT. California State Highway Safety Plan. 2006. pg. 28

Hawaii Statewide Transportation Plan Update Issue Paper on Aging Population and Transportation
- 20 -
implementation issues quoted below. These include efforts aimed at public awareness, training, and physical facility improvements. Strategies California intends to employ the following strategies to reduce older driver crashes. The SHSP Implementation Plan will present specific action items to implement these strategies:
1. Improve driver licensing testing and assessment procedures to more accurately reflect behind-the-wheel capabilities.
2. Create and promote wellness and behavioral strategies for older persons, making it possible for them to drive safely for added years.
3. Enhance law enforcement training to recognize older driver behaviors that may necessitate priority drivers license re-examinations, and provide law enforcement with a broader understanding of older driver sensitivities.
4. Develop public education materials, programs and tactics that clearly explain how the aging process affects driving and what families, friends and the public can do to help seniors (1) drive for more years safely; and (2) transition comfortably to alternate forms of transportation when driving ceases.
5. Explain and encourage older persons’ self-assessment of driving abilities and how to take advantage of that information to make appropriate decisions about driving.
6. Seek the cooperation and coordination of the transit (bus, light rail, etc.) community to make these transportation options more accommodating and practical for older persons who can no longer drive.
7. Implement advancements in highway lighting, striping, signing and engineering practices to make the highway environment safer for older drivers.
8. Leverage the programs and resources of the Older Californian Traffic Safety Task Force to help with accomplishment of stated objectives.
9. Promote the establishment and enhanced capacity of occupational therapy driving evaluation and rehabilitation programs that serve seniors.
10. Improve the ability of health care professionals to provide effective assessment, counseling, and remediation to improve safe mobility of seniors.
Implementation Issues Key issues affecting the implementation of action items to reduce older driver crashes include:
1. Rapid growth in California’s licensed drivers aged 65 and older. 2. Preference of older adults to drive versus ride in a car, walk or take another form of
transportation even when driving may not be safe for them. Florida DOT – Safe Mobility for Life Program The Florida DOT has been working to improve roadway and driving conditions for elderly drivers since 1991. As described on the Florida DOT website, “The primary emphasis was to make roadway improvements, based on the FHWA Highway Design Handbook for Older Drivers and Pedestrians that compensates for the natural effects of aging that apply to driving -

Hawaii Statewide Transportation Plan Update Issue Paper on Aging Population and Transportation
- 21 -
especially visual and decision making.” Starting in 1991, districts began implementing, during their respective maintenance cycles, two improvements given in the FHWA Highway Design Handbook for Older Drivers and Pedestrians: increased pavement markings and reducing the spacing of the raised pavement markings. In addition, other improvements, such as larger lettering for overhead and guide signs, have been implemented by the districts on an as needed basis. For pedestrians, refuge islands and slower walk speeds are also implemented on a case by case basis. In 2004, the Florida DOT expanded and changed the program from focusing only on roadway improvements. The mission of the expanded program, called “Safe Mobility for Life Program,” is to “Improve the safety, access, and mobility of Florida’s growing aging population.” Since 2004, it has been official Florida DOT policy “to provide specific improvements to the State Highway System and to assist local governments with improvements to local systems that accommodate the special needs of elder citizens. These improvements shall include, but are not limited to, roadway, traffic operations, pedestrian and bicycle considerations.”30 In addition, Florida DOT is working on improvements for the pedestrian environment. In 2007, a policy was set to require countdown pedestrian signals to be installed on the State Highway System on all new construction.31 Arizona DOT – Sun City Older Driver Demonstration Project In late 2005, the Arizona DOT began the Sun City Older Driver Demonstration Project which tested the guidelines provided in the FHWA Highway Design Handbook for Older Drivers and Pedestrians. A major intersection was reconstructed in Sun City, a retirement community in the greater Phoenix area, with improvements listed in the FHWA Highway Design Handbook for Older Drivers and Pedestrians. In December 2005, a focus group of eight seniors was assembled to review the pre-construction design. Their identified concerns regarding the intersection were integrated into the intersection improvements. In January 2006, construction began at the intersection and included improvements such as changes to the placement and font of street signs, leveling out of the railroad crossing, modifications to left and right turn lanes, and pedestrian crosswalk enhancements. In April 2006, a post-project mail-out user assessment questionnaire was mailed to 1,000 random Sun City residents to gather feedback on the improvements. On average, the majority of responses found the intersection easier to use with the new modifications. It is noted that although the response to the modifications was positive, the input from the public cannot validate the significance of the improvements. In order to validate the improvements, pre- and post-construction crash data at that intersection would need to be evaluated.32
30 Florida DOT. Safe Mobility for Life Program. Topic No.: 000-750-001-g. 31 Florida DOT. Countdown Pedestrian Signal Applications. Topic No.: 000-750-010. 32 Institute of Transportation Engineers. Involving the Public in Project Evaluation – A Case Study in Arizona. ITE Journal. February 2008.
Hawaii Statewide Transportation Plan Update Issue Paper on Aging Population and Transportation
- 22 -
GrandDriver Program Providing safer driving conditions is only one factor in ensuring the safety of senior drivers. Education for seniors on both driving safely and available resources is also important in ensuring that seniors recognize when they may be unable to continue driving independently. The American Association of Motor Vehicle Administrators has developed a model program called GrandDriver to address the challenges faced by senior drivers, as well as by the government and non-profit agencies who deal with them — and to help them in a coordinated way. This program provides seniors with information on driving safety, such as the signs that driving may be affected, what to do to remain a safe driver and places to turn for assistance as needed. Three states (Florida, Maryland, and Virginia) and the District of Columbia have created their own GrandDriver programs based on this model, and others are considering doing the same thing. 33 Florida GrandDriver, for example, promotes education and awareness through programs that reach out to senior drivers by providing web-based information related to driver-safety courses and alternative transportation. The program also provides training to medical, social service, and transportation professionals on older-driver issues, and sponsors safety talks at senior centers. Florida GrandDriver also holds events to help older drivers determine if they need to make adjustments to better fit into their cars. Irish National Government – Sectoral Plan for Accessible Transport under the Disability Act 200534 The Irish national government has adopted a program to make transport accessible to all in as equal and cost-effect a manner as possible with particular reference to aging and disabled travelers. The Government’s policy for accessibility is:
“The Department of Transport’s high level policy goal for accessibility is the development of accessible public transport services or the greatest number of people with mobility, sensory and cognitive impairments in the shortest possible time, having regard to resource, technical and other constraints.”
Among the elements of what the Irish national government describes as “accessible public transport” are:
• Full unassisted access for wheelchair users (and for prams and buggies) including, where appropriate, accessible toilets and lifts.
• Features to aid people with difficulties in walking, gripping, reaching, or balancing, including slip resistant surfaces, handrails, and handholds.
33 www.granddriver.info/ 34 The Irish National Government’s Sectoral Plan for Accessible Transport under the Disability Act 2005 can be found at http://www.transport.ie/uplaod/general/transport_access.htm

Hawaii Statewide Transportation Plan Update Issue Paper on Aging Population and Transportation
- 23 -
• Facilities to aid people with vision impairments, deafness or hearing loss, and other impairments. These include the consistent use of color contrasts, clear signing and lighting, non-reflective surfaces, audio and visual announcements, tactile and audible guidance surfaces, warning systems, and induction loops.
• Facilities to aid people with learning disabilities or mental health problems. These include clear oral and written information and consistent staff training in recognizing and understanding the needs of people.
Given how little appears to be available in US states’ transportation plans concerning harbor and marine transport issues pertaining to the aging population, it is well to consider Ireland’s maritime passenger transport approach. The situation is similar to that of Hawaii, i.e., the marine vessels are privately owned and operated and the harbor (passenger) terminals are public sector operations. In describing ports of Cork, Dublin, Dun Laoghaire, and Rosslare, the Department of Transport identifies the following as key accessibility features:
• The Cork passenger ferry terminal (at Ringaskiddy) is all on one level and accessible by wheelchair throughout.
• The Dublin port has accessible toilets and an elevator to the upper floor where passengers transfer to ships. All passenger facilities can accommodate wheelchair users.
• The Dun Laoghaire Harbour port provides personal assistance to those with mobility, sensory, and cognitive impairments. The harbor police have been given sensitivity training. Also the emergency evacuation plan incorporates the needs of p people with such impairments.
While these may not seem to be as comprehensive as one might imagine the need to be, these examples illustrate a starting point for such services, and the plan indicates the direction the Irish government plans to go with improving accessibility for all.

Hawaii Statewide Transportation Plan Update Issue Paper on Aging Population and Transportation
- 24 -

Hawaii Statewide Transportation Plan Update Issue Paper on Aging Population and Transportation
- 25 -
Section 5.0 Recommendations for Hawaii Statewide Transportation Plan Update
This review suggests the following issues that could be addressed in the Hawaii Statewide Transportation Plan Update.
1. Specifically recognize that providing safe access and mobility for the elderly to and on the state transportation systems for all modes (airports, highways, harbors, walking, and bicycling) is an important challenge to be addressed.
2. Provide content in the HSTP Goals and Objectives to clarify how the transportation needs of the elderly population will be considered in the HSTP.
3. Recognize that as the number of active and involved seniors grows, more and more seniors are more likely to retain their physical and mental health, and therefore transportation alternatives should be available to help them maintain involvement in their communities.
4. Recognize that transit and pedestrian improvements for the elderly must go beyond physical infrastructure and facilities. Resources must be available for education and assistance.
5. Recognize that transportation planning for the elderly must consider the whole trip from door to door and not just the transportation modes or facilities used.
6. Plan for assessments of challenges the aging population faces in traveling through the islands’ airports, harbors, and other intermodal terminals.
7. Plan for an increase in the State’s elderly population, which is expected to approach 25% of Hawaii’s total population by 2030.

Hawaii Statewide Transportation Plan Update Issue Paper on Aging Population and Transportation
- 26 -

Hawaii Statewide Transportation Plan Update Issue Paper on Aging Population and Transportation
- 27 -
Section 6.0 Resources The following are resources that may be helpful in the development of the HSTP Update and the state’s system plans for Airports, Harbors, Highways, and Transit in reaching goals to improve the transportation system for elderly drivers and pedestrians. Federal Highway Administration - Highway Design Handbook for Older Drivers and Pedestrians First issued in 1998, the FHWA Older Driver Highway Design Handbook sought to “provide highway designers and engineers with a practical information source linking the declining functional capabilities of [the elderly] highway users to design, operational, and traffic engineering enhancements keyed to specific roadway features.” In 2001, the Highway Design Handbook was updated, revised, and expanded, with this updated document incorporating new research findings and feedback from state, county, and municipal engineers. Recommendations geared to highway facilities for pedestrians also receive greater emphasis. This Highway Design Handbook provides recommendations for all highway design elements and includes the rationale and supporting evidence for each recommendation. In addition, FHWA published the Guidelines and Recommendations to Accommodate Older Drivers and Pedestrians which provides recommendations and information on how to apply the information provided in the full Handbook. The handbook’s description of the types of conditions faced by (and, at times, a challenge for) older drivers are described as follows:
“The main body of the Handbook is organized according to five broad site types, each containing one of more specific roadway features with associated design elements. The top priority is at-grade intersections, reflecting older drivers' most serious crash problem area. Next, older driver difficulties with merging/weaving and lane changing operations focus attention on inter-changes (grade separation). Roadway curvature and passing zones plus highway construction/work zones are included for two reasons: (1) heightened tracking (steering) demands may increase the driver's workload, and (2) there is an increased potential for unexpected events requiring a swift driver response. Finally, highway-rail grade crossings are identified as sites where conflicts are rare, and thus unexpected; and where problems of detection (with passive controls) are exaggerated due to sensory losses with advancing age.”
NCHRP Report 500 - Volume 9: A Guide for Addressing Collisions Involving Older Drivers In 1998, the American Association of State Highway and Transportation Officials (AASHTO) published the Strategic Highway Safety Plan with the goal to reduce annual highway fatalities by 5,000 to 7,000. The National Cooperative Highway Research Program (NCHRP) developed a series of guides to assist state and local agencies implement the AASHTO Strategic Highway

Hawaii Statewide Transportation Plan Update Issue Paper on Aging Population and Transportation
- 28 -
Safety Plan. These guides, which correspond to the emphasis areas outlined in the AASHTO plan, are compiled into Report 500: Guidance for Implementation of the AASHTO Strategic Highway Safety Plan. Volume 9 of Report 500 specifically focuses on addressing collisions involving older drivers. Accommodating Aging Population Needs in Airport Terminals The Maricopa Association of Governments’ review of older travelers’ needs relative to air terminals is included as Appendix 1 in this issue paper. This document summarizes the specific requirements and problems the aging population has specifically at airports and provides a summary of changes that accompany aging in respect to functioning within the airport environment. In addition, the document provides suggestions on how to make the airport experience easier for seniors including installation of way finding aids, additional seating in waiting areas, and enhanced lighting.

- 29 -
References
Air Carrier Access Act, 14 CFR Title 14, Part 382. 1986.
Americans with Disabilities Act. 1990 and updated 2008.
American Association of State Highway and Transportation Officials (AASHTO). Strategic Highway Safety Plan. 2005.
Federal Highway Administration. Older Driver Highway Design Handbook. January 1998.
Federal Highway Administration. Guidelines and Recommendations to Accommodate Older Drivers and Pedestrians. Publication No. FHWA-RD-01-051. 2001.
Hawaii Complete Streets Law, HB 920, Act 54 (2009).
Kihl, Mary R.; Kar, Kohinoor. Involving the Public in Project Evaluation – A Case Study in Arizona. Institute of Transportation Engineers. ITE Journal. February 2008.
Kochera, Andrew. Falls Among Older Persons and the Role of the Home: An Analysis of the Cost, Incidence, and Potential Savings from Home Modification. AARP Public Policy Institute, Issue Brief #56. Washington, D.C. 2002. http://assets.aarp.org/rgcenter/il/ib56_falls.pdf
National Transportation Safety Board. “Forum on Safety, Mobility, and the Aging Driver.” November 2010. https://www.ntsb.gov/events/aging-drivers-2010/aging_drivers_forum_day1.pdf https://www.ntsb.gov/events/aging-drivers-2010/aging_drivers_forum_day2.pdf
State of California Department of Transportation. California Transportation Plan 2025. 2006.
State of Florida, Department of Transportation. 2025 Florida Transportation Plan. 2005.
State of Hawaii Department of Transportation. Bike Plan Hawaii. 2003.
State of Hawaii Department of Transportation. Hawaii Statewide Transportation Plan, “Setting the Course.” September 2002.
State of Hawaii Department of Transportation. Strategic Highway Safety Plan 2007-2012. 2007.
State of Hawaii Executive Office on Aging. State Plan on Aging 2008-2011. 2007.
State of Oregon, Department of Transportation. Oregon Transportation Plan. 2006.
State of Michigan, Department of Transportation. Michigan Transportation Plan: Moving Michigan Forward. 2007.
- 30 -
Transportation Research Board of the National Academies. NCHRP Report 500, Guidance for Implementation of the AASHTP Strategic Highway Safety Plan, Volume 9: A Guide for Reducing Collisions Involving Older Drivers. 2004.
Wolfe, Harry P. “Preparing Terminal Facilities for Today’s Aging Population.” Presentation to Association of American Airport Executives Conference by Maricopa Association of Governments. June 24, 2004.
Transportation Safety Administration: http://www.tsa.gov/assets/pdf/special_needs_memo.pdf
State of Florida Safe Mobility for Life Program: http://www.dot.state.fl.us/trafficoperations/Operations/SafetyisGolden.shtm
State of Hawaii Aging and Disability Resource Center: www.hawaiidrc.org
State of Hawaii Executive Office on Aging: Hawaii.gov/health/eoa/index.html

- 31 -
Appendix 1
Maricopa Association of Governments’ Review of Air Terminal
Facility Needs Relative to the Needs of an Aging Population

- 32 -

- 33 -
Appendix 1 Maricopa Association of Governments Review of Air Terminal Facility Needs Relative to the Needs of an Aging Population The following presentation reviews the Phoenix metropolitan planning organization’s approach to consideration of the needs of the aging population relative to air terminals. The paper is instructive in terms of issues raised in the Sub-STAC meeting held in July 2009 and the review of the implications of an aging population for travel in Hawaii. Preparing Terminal Facilities for Today’s Aging Population Presentation AAAE Conference, Las Vegas, Nevada June 24, 2004 Harry P. Wolfe, Senior Project Manager, Maricopa Association of Governments, formerly with Volpe Transportation Center With the aging of Americans, older adults will become a lucrative market niche for airports. Between 2001 and 2025 the number of air trips taken by older adults will more than double to 30 million. However, if we adapt airport terminals to facilitate use by older adults, there is a potential to accommodate as many as 60 million air trips. Why should airports care about making such adaptations? Because by 2025, older adults will offer airports an additional $600 million in revenue annually. Typically, efforts to facilitate air travel for older adults focus on people with disabilities through such accommodations as wheelchair ramps and boarding assistance. But another vital component is accommodating older adults with less severe age-related limitations. Long walking distances, prolonged waiting and difficulties in way finding are particularly onerous to the older adult passenger and airports need to be adapted to address these difficulties. Table 1 identifies the changes that a healthy person experiences as he or she ages and the implications of those changes on terminal design. Table 2 identifies potential terminal enhancements for older adults. It is time for the aviation community and airports in particular to become more fully engaged in the provision of air transportation to older adults. Current research efforts on elderly mobility typically focus upon intra-urban mobility. But the desire of independent-minded Baby Boomers for intercity travel makes adaptations to airports particularly important. We need to broaden the extensive efforts to enhance elderly mobility to include air transportation. This can be done if airports, air transportation providers and government officials support and participate in research projects at universities; initiatives to enhance mobility; and the development of senior friendly airport design standards. This could be accomplished if a multi disciplinary team of experts -- airport and airline personnel, architects, planners, government officials, and geriatric specialists -- meet in a workshop setting to study all aspects of terminal design and function in relation to the travel needs of older adults.

- 34 -
Table 1 Summary of Changes that Accompany Aging, Impacts on Human Functioning and Implications For Airport Design
Description of Change Impacts of Change on Human Functioning Implications of Change on Terminal Design
Description of Change Impacts of Change on Human Functioning Implications of Change on Terminal Design
Description of Change Impacts of Change on Human Functioning Implications of Change on Terminal Design
Decrease in size of eye’s pupil and coloration of lens
A person of 60 requires triple the illumination to see as a 20 year old; it becomes more difficult to distinguish certain colors and color combinations
Color hue, lightness and saturation for signage and maps are important to way finding. Terminal lighting needs enhancements.
Changes in bones in the ear results in greater difficulty in transmitting sound
About 30 percent of seniors may have some hearing loss
Use both audible and text announcements and improve terminal acoustics
Impairment of shoulder joint because of arthritis, occupational trauma and disuse
Reduced range of motion (ROM), lessens grip strength and endurance.
Hauling baggage through terminals and retrieving baggage can be difficult.
Decline in hand functioning from arthritis, neurological impairment, vascular disease and trauma
Reduction in grasp and pinch function
Difficult to use vending machines, haul baggage, and retrieve items for security.
Impairments to gait and balance due to changes in neuromuscular systems
Makes seniors more likely to be susceptible to falls
Moving sidewalks, stairs and escalators pose hazards to seniors.
Loss of brain cells impairs cognitive skills
Takes longer to process information; heightens anxiety associated with the unknown
Terminal signage and “you are here” maps need to be as simple and easy to interpret as possible.
Changes in Cardio-vascular system such as deterioration of heart muscle and hardening of arteries results in reduced blood flow to body
Reduced stamina Makes it more difficult to traverse long distances or to stand for a prolonged period of time.
Reduction in efficiency of respiratory system
Reduced stamina with shortness of breath and fatigue; lack of oxygen can increase anxiety
Makes standing and walking more difficult and makes way finding more anxiety provoking
Change in personality results in increased introspection and greater cautiousness
Unwillingness to venture out and take risks
Makes seniors more sensitive to the complexities of using airport terminals and deters travel
Sources: Mayo Clinic, Rochester, Minnesota; Dr. Andrew Scharlach and Ms. Barrie Robinson, University of California Berkeley; Excerpted from “Accommodating Aging Population Needs in Airport Terminals” by Harry P. Wolfe, Volpe Transportation Center, July 2003.

- 35 -
Table 2 Summary of Enhancements to Airport Terminals by Function Function Enhancement to the Terminal
Function Enhancement to the Terminal
Instructions and Way finding Orient
“You Are Here” Maps with the axis of the environment; select proper color combinations; use text on the map of sufficient size and make maps as simple as possible.
Arrival and Check-In Use shuttle buses that have entryways at curb level or provide a platform to assist in boarding the bus; add more seating to people movers – about 20 – 25% of capacity; add maps and way finding aids within terminal parking garages and parking lots; provide seating curbside and/or immediately inside the terminal for seniors who use curbside check-in; provide seating near ticket counter;
Using Vending Machines Work with manufacturers to consider design features that will standardize boarding pass machines and make them easier to use for seniors, such as the sensitivity of the screen or keyboard to touch; work with manufacturers of other vending machines to consider design features that will address issues such as size of the coin slot, ease of extracting product from the vending machine, and the size of the labels or text designating product choices.
Traveling to the Gate Paint perimeter to steps; use audible announcements at the moving walkways entry and exit points; select electric carts that are easy to board and exit; add benches in concourses as resting points where necessary.
Passing Through Security Provide seats adjacent to security; add larger tables for manipulating personal belongings; provide lifts to facilitate hoisting baggage on security screening conveyor belts or redesign the conveyor belts to enable the baggage to
Waiting and Embarking
Provide seats adjacent to and in full view of the gate area; provideclear instructions for boarding the aircraft; add text messaging to complement audible messages; increase lighting in the boarding bridge.
Arrival at Destination Airport
Add more and improved signs providing direction to baggage claim or ground transportation; add volunteers at gates or use airline personnel to provide directional guidance; consider location of off-airport rental car facilities in locations that will make it easier to access the roadway network.
Baggage Handling
Add seats in the baggage claim area; provide a method for moving baggage from the conveyor belt to the ground to facilitate baggage retrieval.
Exiting the Terminal Mark path to exit door and place numbers on the inside and outside of doors; make maximum reliance of symbols on signs; provide seating near each doorway.
Source: Wolfe, Harry P. “Accommodating Aging Population Needs in Airport Terminals,” Volpe Transportation Center, July 2003.


Issue Paper#4
Fuel and Energy Scenarios for Hawaii
In Preparation for the Hawaii Statewide Transportation Plan Update
Prepared for Department of Transportation
State of Hawaii
Prepared by SSFM International, Inc. With HNTB
2011

Hawaii Statewide Transportation Plan Update Issue Paper on Fuel and Energy Scenarios for Hawaii
-i-
Table of Contents Foreword ....................................................................................................................................1 Section 1.0 Energy and Transportation .......................................................................................3
Section 1.1 Energy Trends and Assumptions ...........................................................................4 Section 1.2 Hawaii DOT Efforts at Energy Reduction in Its Own Facilities ................................7 Section 1.3 State of Hawaii’s Efforts to Create Energy Policy ..................................................8 Section 1.4 Hawaii Clean Energy Initiative ............................................................................10 Section 1.5 Transportation Sector Focus in the Hawaii Clean Energy Initiative ......................11 Section 1.6 Summary: Importance of The Energy Issue
to Transportation Policy and Planning ................................................13 Section 1.7 Other Examples of Areas Where HDOT Facilities Can Reduce Energy Use ...........15
Section 2.0 How the 2002 Hawaii Statewide Transportation Plan Treated Energy ..................17 Section 3.0 Energy and Transportation Planning in Other States ..............................................19 Section 4.0 Recommendations for the Hawaii Statewide Transportation Plan Update .............29 References ................................................................................................................................31 Appendices ...............................................................................................................................33

Hawaii Statewide Transportation Plan Update Issue Paper on Fuel and Energy Scenarios for Hawaii
-ii-

Hawaii Statewide Transportation Plan Update Issue Paper on Fuel and Energy Scenarios for Hawaii
-1-
Foreword The Hawaii state transportation planning process is being supported by the development of a series of issue papers. Task 7 of the contract requires examination of emerging issues that will have major impacts on Hawaii’s transportation future along with preparation of Issue Papers for each subject. The emerging issues for Hawaii’s transportation were selected by the Hawaii Statewide Transportation Plan Team as issues which may have a significant impact on Hawaii’s residents and their transportation needs. Many emerging issues are associated with the Federal Planning Requirements, changing trends, as well as shifts in public perception. This issue paper addresses the issue of fuel and energy scenarios for transportation planning. SSFM is the lead consultant for the Hawaii Statewide Transportation Plan (HSTP) update, and they are supported by a team of consultants. This paper’s lead author is HNTB. This “Issue Paper on Fuel and Energy” includes sections on:
• Discussion on Energy and Transportation; • How the 2002 Hawaii Statewide Transportation Plan (2002 HSTP) treated energy
conservation; • Applicable state and federal laws, rules and regulations; • A review of other states’ treatment of energy and fuel conservation in their
statewide transportation plans; and • How “Options for Transportation Policy” Should be Considered in the Hawaii
Statewide Transportation Plan Update Development Issue papers in this series include:
Issue Paper #1: Impact of Federal Planning Requirements (Eight Planning Factors) Issue Paper #2: Climate Change and Sea Level Rise Issue Paper #3: Aging Population and Transportation Issue Paper #4 Fuel and Energy Scenarios for Hawaii Issue Paper #5: Land Use Planning Issue Paper #6: Planning & Design: Context Sensitive Solutions (CSS), Complete
Streets, Smart Growth, and Transit Oriented Development (TOD) Issue Paper #7: Transportation Security Issue Paper #8: System Preservation and Asset Management Issue Paper #9: Financial Scenarios Issue Paper #10: Environmental Coordination

Hawaii Statewide Transportation Plan Update Issue Paper on Fuel and Energy Scenarios for Hawaii
-2-

Hawaii Statewide Transportation Plan Update Issue Paper on Fuel and Energy Scenarios for Hawaii
-3-
Section 1.0 Energy and Transportation Hawaii’s dependence on fossil fuels, the state’s unique geography, as well as its isolated location present both significant challenges and opportunities. In recognition of those, the State’s public policies put the islands on a path toward reduced use of fossil fuels, greater energy conservation, and increased use of alternative energy sources. The Hawaii Clean Energy Initiative (HCEI) sets the goal of meeting 70% of Hawaii’s energy needs with clean energy by the year 2030. A partnership between the US Department of Energy (US DOE) and the State of Hawaii was formed in 2008, and is seen in Appendix 5 in this issue paper. The HCEI and its accompanying agreements and legislation are discussed throughout this paper, with additional detail in Section 1.4. In essence, the problem is that the principal current energy source (fossil fuel) is limited and subject to both price and availability fluctuations. Rising prices mean changes in the islands’ economies, while disruptions in supply could mean challenges in many of the islands’ operations. Changing the use of fuel type will require adjustments in supply patterns, storage, and, perhaps, switching types of vehicles, planes, or shipping vessels. The State’s airports, harbors, and highways facilities will all see changes, and the State will need to prepare for those changes. Fossil fuels are becoming more expensive, supplies are limited and finite, and fuel is subject to supply disruptions. The International Energy Agency estimates that in order to generate the energy required worldwide by 2030, we would need an additional 1.4 million barrels of oil per day. According to the State Department of Business Economic Development and Tourism (DBEDT), Hawaii currently uses petroleum for 89% of its energy needs. 1 This drives the need for Hawaii to turn to alternative energy sources. Hawaii’s unique location and its absolute necessity for air and water access, as well as its commensurate need to import much of its energy, put the State in a position to be affected more than most states by often volatile changes in fuel price and availability. This is reviewed at length in the state programs and policies in Appendices 1 through 7.
1 DBEDT. “Hawaii Clean Energy Initiative PowerPoint Presentation to Sub-STAC.” September 29, 2009. Pg. 3.

Hawaii Statewide Transportation Plan Update Issue Paper on Fuel and Energy Scenarios for Hawaii
-4-
A look at recent media coverage helps shed light on the challenges Hawai’i faces in addressing the need for changes in the energy situation. These include:
• The State of Hawaii and Better Place formed a public-private partnership in December 2008 to bring an electric car network to the state. The network will include electric vehicles and charging stations.2
• The challenges faced by local governments in supporting and encouraging greater use of electric vehicles was reviewed in the American Planning Association’s magazine, “Planning,” in the March 2010 edition. Important issues include where to site charging stations, how to make them available to users, and how municipal codes may need to be modified.3
• Proposals for photovoltaic and wind farm projects are being scrutinized by utilities to
determine whether the variable amounts of power that can be provided can be handled by the electric power grid without disrupting service reliability or potentially damaging equipment.4
• Changes in the economy led to the inability of a private operator to obtain financing for
a photovoltaic installation that was to have provided power to Hawaiian Electric Company site on Ward Avenue in Honolulu. However, the private operator was able to complete photovoltaic projects on the roofs at seven Hawaii State Department of Transportation Airports.5
These events suggest that the State’s interest in finding alternative energy sources is helping to create a range of opportunities and enterprises, even as some face implementation obstacles. Section 1.1 Energy Trends and Assumptions Hawaii maintains significant data on energy information. Among the wide range of data available from sources such as the Department of Business Economic Development and Tourism (DBEDT) Data Book and the US Department of Energy Fuels Data Center are:
2 Office of the Governor New Release. “Governor Lingle and Better Place Announce Partnership to Offer National Blueprint for Clean Energy in Transportation.” December 2, 2008. http://hawaii.gov/gov/news/releases/2008/governor-lingle-and-better-place-announce/?searchterm=Better%20Place 3 Berkooz, Corry Buckwalter. American Planning Association. Electric Vehicle Infrastructure. Planning. March 2010. 4 Wiles, Greg. Honolulu Advertiser. “Photovoltaic Faces Setback.” December 27, 2009. Pages A31 to A32. 5 Yonan, Jr., Alan. Star Advertiser. “Lights Out for Hoku Solar Project.” July 9, 2010.

Hawaii Statewide Transportation Plan Update Issue Paper on Fuel and Energy Scenarios for Hawaii
-5-
• Consumption of energy by source (1960 through 2005) • Consumption of energy by end use sector (1960 to 2005) • Primary energy consumption by source (1970 to 2006) • Liquid Fuel Tax Base (1958 to 2007)
As is true for the nation, Hawaii’s overall energy use has increased significantly since the 1950s. Figures 1 and 2 illustrate the growth in consumption of aviation fuel, diesel, and gasoline. Figure 1 shows the use of liquid fuels for all purposes, and Figure 2 shows the use of liquid fuels for highway and aviation purposes. Figure 3 shows the use of liquid fuels for marine purposes, and it should be noted that there is actually a decline in this consumption due to the reduction of cruise ships and ferries refueling in the islands as well as the island’s economic slowdown. Figure 4 shows fuel usage for public transit operations from Oahu Transit Services beginning in 1985 and ending in 2009. The historical pattern of liquid fuel use is shown in the following two figures.6 Figure 1 shows the trends in use of liquid fuels for all purposes, including transportation. Gasoline and diesel fuel consumption has exhibited steady growth since the late 1950s. Aviation fuel use has declined from its peak in the early 1990s, but is still significant.
Figure 1: Hawaii Liquid Fuel Use for Transportation and Other Purposes
1958 - 2006
0 200,000 400,000 600,000 800,000
1,000,000 1,200,000 1,400,000
1958
1961
1964
1967
1970
1973
1976
1979
1982
1985
1988
1991
1994
1997
2000
2003
2006
Year
BT
U Aviation fuel
Diesel
Gasoline
Source: Hawaii State Department of Taxation, Tax Research & Planning, “Liquid Fuel Tax Base & Tax Collections,” revised January 29, 2009.
6 Note that figures 1 and 2 use “BTU” as a measure of energy used. A BTU is a British Thermal Unit and is used as a means of quantifying the energy effectiveness of differing types of fuel on a common basis. One BTU is the quantity of heat required to raise the temperature of one pound of water by one degree Fahrenheit.

Hawaii Statewide Transportation Plan Update Issue Paper on Fuel and Energy Scenarios for Hawaii
-6-
Figure 2 depicts the use of liquid fuel for highway and aviation purposes. Diesel fuel use is less significant when considering only highway and aviation uses. However, the overall growth in gasoline use and the rise and decline in use of aviation fuel are shown here, too.
Figure 2: Hawaii Liquid Fuel Used for Highway and Aviation Purposes
1958 to 2006
0 200,000 400,000 600,000 800,000
1,000,000 1,200,000 1,400,000
1958
1961
1964
1967
1970
1973
1976
1979
1982
1985
1988
1991
1994
1997
2000
2003
2006
Year
BT
U
Aviation fuel
Diesel forHwy. use
Gasoline
Source: Hawaii State Department of Taxation, Tax Research & Planning, “Liquid Fuel Tax Base & Tax Collections,” revised January 29, 2009.
Hawaii’s liquid fuel used for marine purposes follows in Figure 3 below. This data from the DOT Harbors Division is captured is for bunker fuel going through DOT’s statewide commercial harbors, and is calculated on an accrual basis. Bunker fuel is defined by DOT Harbors Division as, “fuel for the use of the vessel to which the fuel is delivered.” It is recognized that Figure 3 reports on barrels of fuel whereas the preceding figures reported information in British Thermal Units. While the two sets of information use different measures, the significance is in the trends associated with the information. Both Figures 1 and 2 show a leveling of fuel use (not flatlined but more stable than in preceding years) and Figure 3 (while only focusing on the period from 2005 through 2009) shows a decline followed by an apparent leveling of usage.
Source: Hawaii State Department of Transportation, Harbors Division, 2010

Hawaii Statewide Transportation Plan Update Issue Paper on Fuel and Energy Scenarios for Hawaii
-7-
Oahu’s fuel usage for Public Transit Operations for the years 1985 to 2009 is show in Figure 4 below. This data from Oahu Transit Services (OTS), which operates TheBus and the Handi-Van para-transit, shows fuel usage beginning at 5,449,105 gallons of fuel in 1985 and ending 2009 with a fuel usage of 6,629,777. The highest year of fuel usage was 2008, which happens to also be the only year including fuel for TheBoat at 146,499 gallons. Even without fuel usage for TheBoat, in 2008 OTS still used more fuel than any other calendar year.
Source: Oahu Transit Services, 2010
According to the Public Transit Division of the City and County of Honolulu, this spike in fuel usage for 2008 was linked to bus routes that ran in tandem with TheBoat, which was terminated on June 30, 2009. In addition to these linked bus routes, should TheBoat be canceled due to weather or equipment issues, replacement TheBus routes would be added to accommodate TheBoat riders. Section 1.2 Hawaii DOT Efforts at Energy Reduction in Its Own Facilities The Hawaii State Department of Transportation has taken some important initial steps to reduce energy in its own facilities, leading by example.7 Examples include:
• Honolulu International Airport Diamond Head Concourse Air Conditioning Chiller Plant—part of a planned three concourse air conditioning efficiency project. DOT received a $252,885 rebate check from Hawaiian Electric Company in 2009. The air conditioning
7 Hawaii Airports Modernization Plan. www.hawaiiairportsmodernization.com

Hawaii Statewide Transportation Plan Update Issue Paper on Fuel and Energy Scenarios for Hawaii
-8-
system is 50% more energy efficient and will save the State DOT $885,000 a year in electricity bills. Once the other two concourse chiller plants are completed, the electricity bill savings will be $2.3 million annually, reducing CO₂ emissions by 6,413 tons per year.
• Photovoltaic (PV) Power Systems at seven HDOT facilities across the state—a public-
private partnership with Hoku Solar. Sites with PV systems installed include Līhu‘e Airport, Kona International Airport at Keāhole, Hilo International Airport, Kahului Airport Hangar and Cargo Building, DOT Highways Division Baseyard in Līhu‘e, and the Nāwiliwili Harbor DOT Administration Building. Together, these projects will produce 1.2 million hours of clean, solar energy annually, which is enough to power up to 150 homes. Over the 20-year system lifetime, these systems collectively are targeted to offset 12,000 tons of CO2 emissions, which is equivalent to removing 1,400 cars off the road. The Airports Division is seeking respondents for a second round of photovoltaic development and an Energy Service Company (ESCO).
• Airport Cell Phone Waiting Areas at: Honolulu International Airport, Līhu‘e Airport, Kona
International Airport at Keāhole, Hilo International Airport, and the Kahului Airport. These cell phone waiting areas reduce the amount of driving and traffic congestion around airports and people waiting to pick up airline passengers. It is a very simple example of one way to reduce energy use.
• Daylight Harvesting Ballasts were installed in the perimeter fixtures of the Honolulu International Airport interisland parking structure. This project received recognition with an award from the Illuminating Engineering Society in 2009.
Section 1.3 State of Hawaii’s Efforts to Create Energy Policy Hawaii began proactively addressing energy issues during the energy crises of the 1970s when the State Legislature created the position of Energy Resources Coordinator in 1974. Currently, this position is held by the Director of the Department of Business, Economic Development and Tourism (DBEDT). DBEDT is the State’s lead agency in developing proposals for and carrying out the State’s energy policies. While the Governor and the Legislature have the statutory responsibilities for policy adoption, DBEDT supports those branches in this process. Similarly, other state agencies work with DBEDT in a complementary fashion. For example, Hawai’i DOT is in a position to help carry out the energy policies to the extent is has the power to do so. According to Hawaii’s Energy Resources Coordinator, the State’s energy program has the following objectives:

Hawaii Statewide Transportation Plan Update Issue Paper on Fuel and Energy Scenarios for Hawaii
-9-
• Dependable, efficient and economical statewide energy systems capable of meeting the needs of the people;
• Increased energy self-sufficiency; • Greater energy security; and • Reduction, avoidance, or sequestration of greenhouse gases.
Also according to Hawaii’s Energy Resources Coordinator, the state’s energy policy also requires that the total costs and benefits of all energy options – including efficiency enhancements – need to be compared. Alternative transportation fuels and efficient transportation must also be made part of this deliberation and promoted in place of fossil fuels.8 Hawaii’s abundance of sunshine, wind, geothermal energy, and ocean wave energy presents opportunities for the harnessing and increased use of renewable sources of energy. In addition, using renewable sources of energy would not only reduce the dependency on fossil fuels, but would also reduce greenhouse gases which contribute to climate change. In January 2008, Hawaii entered into a partnership, known as the Hawaii Clean Energy Initiative, with the US Department of Energy, with the goal to “transform Hawaii’s energy economy within a single generation” by attaining 70% clean energy by 2030. See Appendix 5 in this issue paper for the complete Memorandum of Understanding (MOU). The MOU between the entities states (emphases added):
The purpose of this MOU is to establish a long-term partnership between the State of Hawaii and the US Department of Energy that will result in the fundamental and sustained transformation in the way in which renewable energy efficiency resources are planned and used in the State. Successful development and execution of the objectives contemplated in this partnership will provide a replicable global model for achieving similar results.9
To achieve this goal, Hawaii has established a two-pronged approach: 1) increasing reliance upon renewable energy sources; and 2) implementing energy efficiency measures. Preliminary analysis, however, has indicated that achieving this goal (70% clean energy) will be more challenging for the transportation sector (via biofuels and electric vehicles) than for stationary sources (i.e., clean electricity).10 The MOU was designed to accomplish several important efforts:
8 Interview with Hawaii Energy Resources Coordinator, Ted Peck, on July 7, 2009. 9 State of Hawaii and US Department of Energy. “Memorandum of Understanding between the State of Hawaii and the US Department of Energy.” January 28, 2008. Pg 1. 10 Hawaii Energy Policy Forum. State of Hawaii Energy Efficiency in Transportation Strategies, Phase 1. January 15, 2008. Pg. 1.

Hawaii Statewide Transportation Plan Update Issue Paper on Fuel and Energy Scenarios for Hawaii
-10-
• Institutionalize Financial, Policy, and Regulatory Mechanisms Needed to Transition to a Clean Energy Future
• Communicate Goals, Benefits, and Accomplishments of this Partnership with Citizens of Hawaii, the United States, and the Pacific Rim
• Establish Short-, Medium- and Long-Term Clean Energy Deployment Plans11
Hawaii and US DOE plan to establish working groups in each of the energy and cross-cutting focus areas identified below. The objective of these groups will be to define the particular structural, technical, regulatory, financial and other barriers that would prevent the state from achieving – and maintaining – its clean energy potential, as defined in this document. The working groups will be co-chaired by the State and US DOE, with a mandate to produce two-, five- and ten-year operational plans to transform the investment in and use of energy resources in each energy performance area. These plans will include date-specific goals for major actions and mechanisms for leveraging expertise, creativity, and resources of the major stakeholders.12
Energy Performance Working Groups will address:
• End-use efficiency • Electric generation • Energy delivery • Transportation, including the establishment of a long-term, sustainable strategy
for the production, distribution, and use of alternative transportation fuels, thereby accelerating the adoption of advanced vehicle technologies such as plug-in hybrids, and promoting mass transit
Cross-Cutting Issue Working Groups will address:
• Technology integration • Creating sustained sources of financing • Policy and regulatory mechanisms
Section 1.4 Hawaii Clean Energy Initiative The Hawaii Clean Energy Initiative’s (HCEI) goal is to achieve a 70% clean energy economy for the state by 2030, or within a generation. Achievement of the goal would increase Hawaii’s security, capture economic benefits of clean energy for all levels of society, foster innovation, provide jobs, and serve as a model for the US and beyond. Encouraged by the HCEI, the private and public sectors have shown interest in creative and economically viable approaches to increasing supplies and usage of alternative energy sources.
11 State of Hawaii and US Department of Energy. Memorandum of Understanding between the State of Hawaii and the US Department of Energy. January 28, 2008. Appendix, Structure and Time Frames. 12 State of Hawaii and US Department of Energy. pg 5.

Hawaii Statewide Transportation Plan Update Issue Paper on Fuel and Energy Scenarios for Hawaii
-11-
These are seen with the public-private partnerships such as the $15 million Maui Grid Integration Project between the electric companies, First Wind, General Electric, Columbus Electric, Sentech, and the New Mexico Institute of Mining & Technology. Hawaii’s energy supply and storage system presents some unique challenges. Petroleum arrives by ship to Oahu, and the only refinery in the islands is on Oahu. This single point of receipt and refining makes the system very dependent on one harbor—Kalaeloa—and a very limited refining system. In addition, hydroelectric power is generated only on the islands of Hawaii and Kauai, meaning that there is little redundancy in the electrical supply system. Therefore, the first focus is on production of electricity from alternate local sources. The second focus is reducing the use of energy in the transportation sector. Section 1.5 Transportation Sector Focus in the Hawaii Clean Energy Initiative Over 60% of all energy consumed in Hawaii—both fuel and electrical—is used for transportation (half of that for marine and aviation and half for ground transportation). Of the energy consumed as fuel only, Hawaii’s ground transportation sector is responsible for the consumption of about 71% of Hawaii’s transportation fuel use. This includes diesel for highway use (7%) and gasoline for highway use (64%).13 Hawaii is the “most oil-dependent state in America,” relying on imported petroleum for about 90% of its primary energy.14 If Hawaii achieves its plans to have at least 70% of power come from clean energy by 2030, this would lead to the reduction of 72% of Hawaii’s crude oil consumption.15 The Hawaii State Department of Transportation (HDOT) is the second largest electricity consumer in government, right behind the University of Hawaii, consuming nearly $40 million of electricity annually and 25% of the State’s total electricity bill. Part of the reason for this is because all of the department’s modal operations of Airports, Harbors, and Highways run 24 hours a day, every day. Given this dependency, it is clear that the Hawaii Clean Energy Initiative is critical to the State. Options identified for automobiles and aviation include:16
• Higher-efficiency cars and trucks—While fuel-efficiency standards are essentially a federal domain, a number of states also offer rebates or tax incentives for purchase of
13Hawaii Energy Policy Forum, State of Hawaii Energy Efficiency in Transportation Strategies Phase 1, January 15, 2008, Pg. 7. 14 Hawaii Clean Energy Initiative. www.hawaiicleanenergyinitiative.org 15 Hawaii Clean Energy Initiative 16 Hawaii Clean Energy Initiative, Transportation Policy

Hawaii Statewide Transportation Plan Update Issue Paper on Fuel and Energy Scenarios for Hawaii
-12-
alternative-fuel, hybrid, and other fuel-efficient vehicles. Initiatives along that line could have a significant impact on vehicle efficiency in Hawaii.
• Biofuels—While the State of Hawaii already has several policies in place that promote biofuel production, there is no significant biofuel production in Hawaii as yet. Studies and analyses indicate that Hawaii has strong potential for producing ethanol from sugar cane, cellulosic ethanol from sugar cane residue or other biomass, and biodiesel from tropical oilseed crops. The Hawaii Clean Energy Initiative and others are actively pursuing avenues for establishing such industries and are working to identify additional policy initiatives that would support such development. One policy initiative, The Hawaii 2050 Sustainability Plan, encourages production and use of locally produced biofuels.17
• Electric vehicles—Measures similar to those available for encouraging purchase of fuel-efficient or alternative-fuel vehicles can also apply to electric-drive vehicles. In addition, measures affecting utility policies for charging electric vehicles (or possibly drawing power back from their batteries) could go a long way toward fostering use of electricity for automotive transport in Hawaii. The Memorandum of Understanding between Hawaiian Electric Companies and Better Place is a good start for collaboration. Retrofitting developed areas to include electric vehicle charging stations will be important. A systematic and areawide strategy will be needed to incorporate charging stations or methods throughout developed areas of the State. It will be critical for the State to take steps to be prepared for the most common and effective means of providing for electric vehicle charging. If charging stations and battery “swap” approaches are both developed, both means will need to be accommodated. A wider variety of vehicle energy supply means appears to be on the horizon with the local production of biofuels in addition to electric vehicles.
• Aviation—With more than a quarter of its current energy use going to aviation (second only to Alaska and far more than most states), Hawaii faces a relatively unique and difficult challenge. At present, there are no viable alternatives to petroleum-based jet fuel (kerosene). On the other hand, Hawaii may have a relatively unique opportunity to address this issue. One of the most promising technologies for developing less expensive bio-based jet fuels is microalgal oil. Certain microscopic algae have high lipid or oil content and will grow at very rapid rates. That oil can be converted to not only biodiesel, but kerosene substitutes as well. The University of Hawaii and other Hawaii institutions are at the forefront of research on microalgae. Policy measures designed to support that research and foster prospective microalgal oil industry could help Hawaii develop solutions for sustainable aviation energy use.
17 Hawaii Energy Policy Forum. State of Hawaii Energy Efficiency in Transportation Strategies Phase 1. January 15, 2008. Pg. 10.

Hawaii Statewide Transportation Plan Update Issue Paper on Fuel and Energy Scenarios for Hawaii
-13-
It is important to note that there are industry challenges particularly to increasing biofuel production in Hawaii. These include:
• Panelists at the September 29, 2009, HSTP Energy Workshop for the HDOT Sub-STAC stated that to gain significant biofuel production levels, products are needed which would generate higher biofuel yields per acre than are seen today. While algae today can produce 1,200 gallons of biofuel per acre per year, some form of genetically modified organisms would be needed to increase that yield by a factor of three or more.
• There will need to be an increase in facilities and services supporting biofuel feedstock, plant, shipment, and processing.
• Panelists at the same workshop also reported that more sites will be needed for biofuel production and that greater cooperation will be needed between the public sector, private sector, and involved interest groups.
• Biofuel production costs need to be reduced below today’s levels to make their costs competitive with fossil fuels.
Section 1.6 Summary: Importance of The Energy Issue to Transportation Policy and Planning The management and use of energy is an exceptionally important consideration in the Hawaii Statewide Transportation Plan (HSTP) for the following reasons: • Given present trends, transportation will consume more energy in the future than it does
today. While supplies of fossil fuels are ultimately limited, the more significant issue is the rising cost of fossil fuels, greater international competition for fossil fuels, and increasing risks of supply disruptions. This suggests that a combination of reduced fossil fuel use and increased use of alternative sources are needed.
• Hawaii’s dependence on tourism, a driver for the economy, is directly linked to air travel and, to a lesser degree, to marine travel. With both air and marine travel’s very high dependence on fossil fuels, the State’s economy is greatly affected by price and supply.
• The State Department of Transportation is in a position to affect energy policy on a larger scale than most government agencies because it is one of the largest consumers of electricity and also because DOT has 60% of all energy and fuel consumption in areas of its responsibility.
• Hawaii is well-positioned to be a leader in alternative energy, given its unique geography, abundance of renewable energy resources, and leadership. The State’s leaders have made clean energy transformation a top State priority. Transportation Plans need to support that goal.
• The Hawaii 2050 Sustainability Plan encourages production and use of locally produced biofuels.18
• Act 73 of the 2010 Legislative Session19 noted that it is in the State’s best interests to become more self sufficient in both energy and food. The Act established the Hawaii
18 Hawaii Energy Policy Forum.

Hawaii Statewide Transportation Plan Update Issue Paper on Fuel and Energy Scenarios for Hawaii
-14-
Economic Development Task Force to accelerate and support public and private efforts to make Hawaii energy and food self-sufficient. In writing this legislation, the State Legislature recognized that undertaking the task of energy and food security will require both a long-term commitment and investment of financial resources, and a barrel tax was instituted to fund the beginnings of these efforts. Reports will be submitted to the State Legislature addressing both self-sufficiency issues.
• The Hawaii International Conference on System Sciences, held in 2009, included a proceeding on “The Potential of Renewable Energy to Reduce the Dependence of the State of Hawaii on Oil.”20 The proceedings analyzed different crop scenarios for former sugarcane land and production of biomass fuels, while acknowledging the delicate balancing act with keeping agricultural lands important to the State of Hawaii (ALISH) in production for other uses. The proceedings also noted that production of ethanol would still only meet a small portion of the fuel required by the state’s transportation market and that a potential technology that should be quantified is oil production by microscopic algae.
All four counties in the State recognize the need to incorporate the energy issue into their policies, including transportation and planning.
• City and County of Honolulu’s Mayor’s Energy & Sustainability Task Force: Working Towards the 21st Century Ahupua‘a dated December 2009 contains a section on Fuel and Transportation. This document represents the C&C of Honolulu’s public policies on energy and sustainability, and it includes solutions on things the County has done to save energy. For example, all of the City’s primary fueling locations now include biodiesel. Six hybrid vehicles are currently being evaluated as part of the City’s fleet. And the City’s guidelines for usage of City vehicles also includes things like fuel efficient driving techniques and purchasing considerations.21
• The Kauai Energy Sustainability Plan Final Report dated April 2010 includes a section with recommendations to reduce consumption of fossil fuels. These recommendations include the establishment of an Alternative Ground Transportation Modes & Fuels Fund to improve the public transit system, create incentives for hybrid electric vehicles and plug-in hybrid electric vehicles, and support for local small farmers to produce straight vegetable oil for off-road vehicles. The recommendations also include some public policy recommendations to create this fund through a 2% fossil fuel tax while recognizing the legislative measures already passed by the State Legislature, such as Act
19 Act 73, 2010 Legislative Session, HB 2421, HD2, SD2, CD1. 20 National Renewable Energy Laboratory. Arent, Doug, Barnett, Mosey and Wise. “The Potential of Renewable
Energy to Reduce the Dependence of the State of Hawaii on Oil.” Proceedings of the 42nd Hawaii International Conference on System Sciences. 2009.
21 City and County of Honolulu. Mayor’s Energy & Sustainability Task Force: Working Towards the 21st Century Ahupua‘a. December 2009. Pages 25-35.

Hawaii Statewide Transportation Plan Update Issue Paper on Fuel and Energy Scenarios for Hawaii
-15-
240 (SLH 2006) to create an Alternative Fuel Standard for the State, with a goal to provide 20% of the highway fuel demand by 2020.22
• While Maui County does not have a specific Sustainability Plan, it does integrate goals and objectives regarding sustainability in the County of Maui 2030 General Plan Maui Countywide Policy Plan. Objective 3, Policy e. includes “Integrate cultural and environmental values in education, including self-sufficiency and sustainability.” Within the actual ordinance of the Countywide Policy Plan, Chapter 2.80B, amendments were made in 2010 to include definitions of Green buildings, Greenhouse-gas emissions, and use of Agricultural lands, with the recognize that food and energy production could take place entirely within Maui County.23
• Hawaii County funded an Analysis and Recommendations for the Hawaii County Energy Sustainability Plan in 2007, which discusses all the alternative energies that can be developed in Hawaii county, including solar, geothermal, ocean and waste to energy. Recommendations for energy-efficient buildings, both commercial and public sector, as well as residential discuss implementation of the Model Energy Code.
Section 1.7 Other Examples of Areas Where HDOT Facilities Can Reduce Energy Use Great strides have been made by the State and the Hawaii DOT to reduce energy use, saving money and fossil fuels at the same time. In addition to the strategies mentioned in Section 1.0, there are some additional areas the HDOT may want to consider to reduce energy consumption. The Highways Division may want to consider evaluating its street lighting to see if any of the lamps could be de-lamped while still maintaining the required amount of lighting for safety. Another way to save electricity on new Highways Division lighting would be to consider LED lights when replacing or building new street lights. This could also apply to State Airports facilities when installing or replacing lighting. Both the Airports and Harbors Divisions may want to consider facilities at contiguous properties. This would allow for secure transfer of cargo between the two modes while minimizing the energy necessary to transfer cargo between the two modes. A side benefit would be to make it easier for the Transportation Security Administration (TSA) to secure the cargo during the transfer. HDOT Harbors and Airports facilities that could be considered are in Hilo, Kahului or Līhu‘e, where properties could eventually merge. Both the Harbors and Highways Divisions may want to consider integrating their planning, design and construction in order to facilitate the mobility of people and goods. When possible, multiple access points could be constructed in order to provide multiple access routes for vehicles and delivery trucks. 22 Kauai County. Kauai Energy Sustainability Plan Final Report. April 2010. Pages 35-61. 23 County of Maui 2030 General Plan Maui Countywide Policy Plan. 2010. Pages 16 and 53.

Hawaii Statewide Transportation Plan Update Issue Paper on Fuel and Energy Scenarios for Hawaii
-16-
The Harbors Division could consider developing vessel berthing and backup infrastructure that would be conducive to large-batch cargo movement. This would save energy by improving efficiencies. Another thing the Harbors Division could consider is promoting off-dock consolidators to support Hawaii’s small businesses who may be unable to afford full container loads, further promoting the efficient mobility of commerce.

Hawaii Statewide Transportation Plan Update Issue Paper on Fuel and Energy Scenarios for Hawaii
-17-
Section 2.0 How the 2002 Hawaii Statewide Transportation Plan Treated Energy The 2002 Hawaii Statewide Transportation Plan includes references to energy and transportation, much of which needs to be updated in light of advancements in knowledge and in consideration of energy initiatives undertaken since 2002. Transportation and energy-related topics in the 2002 HSTP included discussions on travel demand reduction; alternative fuels; technological improvements; efficiency measures; alternative modes of transportation such as pedestrian and bike use; and transportation system management. Specific references in the 2002 HSTP to fuel and energy include: • Vision Statement: “We see...State-of-the-art electrical systems and innovations will energize
these with improved energy efficiency.”24 • Goal I, Objective 2 (B): “Employ and encourage strategies to reduce transportation
demand.”25 • Goal III, Objective 1 B: “Manage and operate the transportation system in an
environmentally responsible manner. Encourage the use of low-cost, energy efficient, non-polluting means of transportation.”26
• Other goals and objectives in the 2002 HSTP also have significant implications for energy sources and usage, such as improving mobility, increasing use of pedestrian and bicycle travel, and environmental improvement.
From the 2002 HSTP chapter on issues at crossroads and needing further treatment are these discussions: • Mobility & Energy Conservation. Some methods for improving mobility, such as the
addition of highway capacity in high-density areas, promote the use of high-energy transport modes such as single occupant automobiles. As in the discussion of "Congestion and Air Quality" above, a key question asks to what extent trip-making activity would increase regardless of capacity improvements.27
• Mobility & Livable Communities vs. Environmental Protection. Some methods for improving mobility, such as the development of bicycle and pedestrian facilities, reduce the use of high-energy transport modes, such as single occupant automobiles, and thus promote energy conservation.28
24 Hawaii Department of Transportation. Setting the Course, Hawaii Statewide Transportation Plan, 2002. Pg. 41. 25 2002 HSTP. Goal I, Objective 2, B. Pg. 30. 26 2002 HSTP. Goal III, Objective 1 B. Pg. 43. 272002 HSTP. Pg. 19. 28 2002 HSTP.

Hawaii Statewide Transportation Plan Update Issue Paper on Fuel and Energy Scenarios for Hawaii
-18-
Hawaii Statewide Transportation Plan Update Issue Paper on Fuel and Energy Scenarios for Hawaii
-19-
Section 3.0 Energy and Transportation Planning in Other States A review of transportation plans for selected states that have updated their plans since 2006 shows that the more recently adopted plans place a greater emphasis on energy. Hawaii’s policy emphasis on energy management in the last few years generally mirrors the high-level concerns of and actions proposed by other states. The wide range of plans, studies, actions, and legislative commitments undertaken by Hawaii in the past few years demonstrates that the State is taking more aggressive stances on energy than most (if not all) other states. Hawaii has demonstrably increased its emphasis on energy issues since adoption of the 2002 HSTP. Several other states whose plan adoptions are more recent than Hawaii’s current plan have strong plan statements about energy. Hawaii’s recent energy actions allow the Hawaii Statewide Transportation Plan Update to set forth clear, more quantifiable and more aggressive energy-related objectives than those of the 2002 Plan. A review of other states’ transportation plans demonstrates the following:
• State transportation plans reviewed have more specific targets for energy conservation. • Sustainability and use of alternate energy sources is commonly referenced in other
states’ transportation plans. • Other states’ plans point to programs or needs to reduce greenhouse gases.
During preparation of this issue paper, the authors reviewed six other states’ treatment of energy in their state transportation plans. The state plans reviewed were (with the year of plan adoption): Alaska (2008), California (2006), Illinois (2007), Maryland (2009), Oregon (2006), and Washington (2006). Most of the newer state plans reflect the heightened national concern for the relationship between energy and climate change, sea level rise, and greenhouse gas concerns. The intent of the review below is to illustrate how other, more recently updated state transportation plans address energy issues. The states were selected not only because they had a recent plan update, but they also represent a variety of geographic conditions as well as a range of modal responsibilities. It is not meant that Hawaii should adopt specific language or endorse actions of other states just because those other states have established the policies they have. However, it is suggested that Hawaii can observe the plans of others and consider what may be of interest for consideration in its plan update. Climate change, sea level rise, and greenhouse gas emissions are also discussed in greater detail in Issue Paper #2 in this series, Climate Change and Sea Level Rise.
Hawaii Statewide Transportation Plan Update Issue Paper on Fuel and Energy Scenarios for Hawaii
-20-
1) Alaska Transportation Plan (2008)
The Alaska Transportation Plan includes these energy-related objectives: • Protect and enhance the environment, promote energy conservation, improve the quality
of life, and promote consistency between transportation improvements and State and local planned growth and economic development patterns.
• Support energy conservation, specifically in our consumption of fossil fuels, as a matter of national security and to address climate change.
• Address strategies for energy conservation in regional plans, metropolitan plans, and community plans.
• Respond to commodity cost escalation which affects operating costs for the Alaska Marine Highway System (the ferry system), especially for fuel.
• Address operating costs of ferries than highways due to fuel and labor expenditures. Over a life cycle, ferries are generally a much more expensive technology for delivering a surface transportation service than either land-based roads or bridges.
• Make transportation decisions that conserve and optimize non-renewable resources and promote the use of renewable resources (materials, facilities, and sources of energy) and include strategies to decrease greenhouse gases and air pollutants.

Hawaii Statewide Transportation Plan Update Issue Paper on Fuel and Energy Scenarios for Hawaii
-21-
Energy Objectives in the California Transportation Plan (2006) • Expand market share of cleaner vehicles and supporting fuel infrastructure. Expand use of clean fuel transit vehicles. Encourage public entities to continue investing in alternative fuel vehicles to increase market share and
encourage increased production. • Enhance education, planning tools, and performance standards on energy efficiency, air quality, and climate
implications of transportation decision-making. Analyze the cost-effectiveness of transportation options that improve energy efficiency and reduce emissions of
GHGs and criteria air pollutants. Develop tools that improve data collection, analysis, and modeling capabilities for State and local development
planning and projects.
• Solicit institutional support for clean and energy efficient transportation. Seek legislative, regulatory, and policy support to advance clean and efficient transportation, including low-
emission vehicles and the necessary fueling infrastructure. Establish stable and secure funding sources with innovative and effective financing mechanisms for
transportation energy programs. Reduce the costs of product development, testing, and market introduction of advanced transportation and
communication technologies. Mainstream energy efficiency and conservation measures into State, regional, and local transportation
planning, programming and project development.
• Implement measures to lower emissions of GHGs and air pollutants in transportation options. Provide incentives for mass transit use, transportation demand and supply management, and “smart growth”
land use policies. Encourage local governments to incorporate considerations of transportation air emissions and energy
efficiency into general plans. Fund programs to support the purchase and use of low-emission vehicles, including the “greening” of State and
local government fleets. Reduce emissions from the transport of freight and reduce costs through implementation of efficiency
measures. Change some of the fixed costs that travelers face to variable costs, as a means of encouraging decisions that
result in cleaner and more energy efficient transportation. For example, base auto insurance and vehicle license fees on miles driven rather than a flat annual rate. Participate in the Western Governors’ Global Warming Initiative to reduce GHGs through strategies that foster
economic development.
2) California Transportation Plan (2006) The California Transportation Plan includes several objectives and strategies for energy reduction and more fuel efficient transportation systems as noted below.29
The California Plan has a far reaching goal regarding goods movement by heavy duty vehicles and railroads, which address both energy and air pollution. The results are new potential strategies and programs for achieving energy reduction and efficiency that will dramatically change the transportation sector.
29 California Department of Transportation. California Transportation Plan 2025. April 2006. Pg. 61.

Hawaii Statewide Transportation Plan Update Issue Paper on Fuel and Energy Scenarios for Hawaii
-22-
California Transportation Plan (2006) Key Elements
1) Contextual Data “California’s transportation sector consumes 50 percent of all energy used in the State and accounts for nearly 60 percent of all greenhouse gases from fossil fuels. Current trends of increasing travel and greater commuting distances, and the growing popularity of less fuel-efficient vehicles, indicate transportation fuel consumption in the State will increase by approximately 40 percent over the next 20 years…California must begin transitioning from petroleum as its predominant source of transportation energy to an environmentally and economically sustainable source.” (Emphasis added.)
2) Projections “In 2002, California drivers used an estimated 17.6 billion gallons of motor vehicle fuel, with an estimated cost of over $29 billion, and traveled 318 billion miles. If current growth trends continue, gasoline use and related carbon dioxide (CO2) emissions in the State will increase approximately 32 percent over the next 20 years.”
3) References to environmental factors, including air quality and the regulation of greenhouse gas emissions include: “The California Air Resources Board (CARB) adopted regulations early in 2005 to achieve the maximum feasible and cost-effective reduction of greenhouse gas emissions from passenger vehicles and light-duty trucks. CARB conducted public workshops, including workshops in communities with significant exposure to air contaminants and communities with minority or low-income populations. The new standards are expected to result in significant reductions (an estimated 18-24 percent) in greenhouse gases without imposing additional fees or taxes on motor vehicles, fuels, or vehicle miles traveled; banning the sale of any vehicle category; requiring reductions in vehicle weight; setting new speed limits; or limiting vehicle miles traveled.”
4) Institutional Partners A key policy in California’s plan states “Commit to a clean and energy efficient system,” and acknowledges agency partners including the California Energy Commission, California Environmental Protection Agency, California Legislature, US Department of Energy, and US Environmental Protection Agency.
By way of example, the Sacramento Emergency Clean Air and Transportation (SECAT) was launched in November 2000 to reduce emissions from heavy-duty diesel vehicles by three tons per day by 2005. The program makes $70 million available for truck operator-owners in the Sacramento area to replace existing engines with new low-emission diesel engines, buy newer low-emission vehicles, or use cleaner fuels.30 The California Transportation Plan includes several elements not present in the 2002 HSTP including: contextual data, projections, reference to greenhouse gases and the linkage to global warming, and economic factors as noted in the text box to the left.31
30 California Department of Transportation. Pg. 64. 31 California Department of Transportation. Pg. 25.

Hawaii Statewide Transportation Plan Update Issue Paper on Fuel and Energy Scenarios for Hawaii
-23-
3) Illinois State Transportation Plan (2007) The Illinois State Transportation Plan includes several significant energy-related strategies, including: • The promotion of environmental protection, energy conservation, improved quality of life,
and consistency between transportation improvements and land use and economic development.
• A global warming initiative that builds on the steps the state has already taken to reduce greenhouse gas (GHG) emissions such as enhancing the use of wind power, biofuels, and energy efficiency.
• An acknowledgement that the future of transportation is directly linked to the future of world energy markets, particularly petroleum. Despite significant gains in energy efficiency in transportation, consumption is expected to continue to grow, although at a slower rate. Improvements in fuel efficiency are projected to continue, but future gains may be smaller and more expensive to attain. Also, growth in travel demand historically has offset a share of the gains in fuel efficiency and can be expected to do so in the future. Pressure to turn to alternative fuels or reduce vehicle use will intensify to conserve energy and reduce air pollution and congestion. The use of alternative fuels, including gasohol, will continue to reduce the total user-fee revenues available for transportation investments due to the lower tax rates applied.
• Support for the development and use of energy efficient vehicles, including alternative fuel vehicles, to reduce energy consumption and air emissions.
• Consideration of how changes in vehicle technology, vehicle inspection and maintenance programs, and alternative fuels and fuel delivery systems are some of the options available to reduce emissions. While those options will not directly affect mobility, transportation control measures (e.g. increasing use of public transit, passenger rail, car pools, walking and bicycles, traffic flow management, and limiting vehicle-miles- of-travel) have the potential for dramatically changing mobility and travel options.32
4) Maryland Transportation Plan (2009) Maryland includes several energy-specific strategies in its 2009 plan, including:
32 Illinois Department of Transportation. Illinois State Transportation Plan. 2007. Pg. 31.

Hawaii Statewide Transportation Plan Update Issue Paper on Fuel and Energy Scenarios for Hawaii
-24-
Oregon Transportation PlanEnergy-Related Elements
Goal 4 – Sustainability To provide a transportation system that meets present needs without compromising the ability of future generations to meet their needs from the joint perspective of environmental, economic and community objectives. This system is consistent with, yet recognizes differences in, local and regional land use and economic development plans. It is efficient and offers choices among transportation modes. It distributes and burdens fairly and is operated, maintained and improved to be sensitive to both the natural and built environments.1 Key Initiatives C. Integrate transportation, land use, economic development and the environment. Join the energy debate as an advocate for Oregon transportation to assure a reliable, diverse and adequate fuel supply. Develop a contingency plan for dealing with fuel shortages.1 Policy 4.2 – Energy Supply It is the policy of the State of Oregon to support efforts to move to a diversified and cleaner energy supply, promote fuel efficiencies and prepare for possible fuel shortages. Strategy 4.2.1 Support efforts to develop a long range plan for moving toward a diversified and cleaner energy supply. Work with federal, state, regional and local jurisdictions and agencies as well as transportation providers, shippers and the general public. Strategy 4.2.2 Support the conversion of passenger vehicles and public transportation fleets to more fuel efficient and alternative fuel vehicles, especially to those using renewable and cleaner fuels. Review and change the tax credit provisions to encourage these activities as appropriate. Strategy 4.2.3 Work with federal, state, regional and local jurisdictions and agencies as well as transportation providers, shippers and the general public to develop a contingency plan for fuel shortages affecting passenger and freight transportation.
• Maryland DOT uses “energy performance contracting” to develop, install, and finance projects to improve energy efficiency and maintenance costs for facilities.
• Maryland Transit Authority (MTA) will continue fleet vehicle replacement and overhaul that ensures a more energy efficient fleet, including expanding the use of hybrid buses.
• Several agencies are using hybrid and
alternate fuel vehicles in their fleets to minimize gasoline consumption. MTA has purchased hybrid diesel/electric buses for use in the Baltimore transit system
• The Maryland Port Authority (MPA) is using ultra low sulfur/biodiesel fuel for 100 percent of the MPA's fleet vehicles, terminal equipment, and fire protection systems and has implemented a diesel emission reduction program that will install diesel oxidation catalysts on all rubber tired gantry cranes and one ship-to-shore crane by the end of 2008.33
5) Oregon Transportation Plan (2006) The Oregon Transportation Plan (OTP) draws the connections between the environment, transportation and energy. It states, “Sustainability practices that respond to high fuel prices, global warming and other environmental degradation are already being implemented. These include development of alternate fuels, cleaner vehicle emissions, public transit services and communities designed to encourage walking, bicycling, transit and shorter vehicle trips.”34
33 Maryland State Transportation Plan. 2009. Pg. 22

Hawaii Statewide Transportation Plan Update Issue Paper on Fuel and Energy Scenarios for Hawaii
-25-
Oregon Transportation Plan (2006) Response to Peaking of International Oil Supply Oregon’s transportation system will be different in 2030. Technology will improve the way that vehicles and people interact with the transportation system and each other. But the global economy, peaking of world oil supply and global warming will result in unpredictable changes and stresses on the transportation system. Our ability to meet these challenges, or at least respond as effectively as possible, depends on the way we work together to change the way we do things, manage the transportation system, better integrate land use, transportation and economic activities, and fund a sustainable transportation system. Although the timing of the peaking of oil supply is unpredictable, we can anticipate certain changes and develop strategies to ease the effects. Tightening supply and higher demand will increase fuel costs. Higher costs will affect motor vehicles and airplanes more than public transit, rail and barge because fuel is a smaller part of their costs. Any shortage of supply will affect transportation options since alternative fuels may be more readily available to some modes than to others. Responding to potential oil supply disruptions means managing risk. Development of alternative fuel and fuel-efficient vehicles can lessen dependence on oil products. Transportation system plans can support programs that result in businesses, industries and residents shortening trips and using transportation alternatives. Maintenance and expansion of Oregon’s highways and roadways depend on the use of motor fuel taxes. Likewise, airports use aviation fuel taxes for maintenance and preservation of their infrastructure. A tighter oil supply means that fewer gallons will be available to users and they will yield fewer tax dollars for transportation improvements. Alternative means of funding will be required.
Two excerpts from the Oregon Transportation Plan are included in this issue paper. The intent of reviewing them here is to provide an example of how another state is addressing energy within the context of its state transportation plan and to suggest that Hawai’i DOT monitor Oregon’s progress over time. Because of the similarity between Oregon’s and Hawaii’s energy-related approaches (both focused on sustainability and alternate energy sources), there may be worthwhile observations to be gained. Similar to the California Transportation Plan, the impacts of greenhouse gas emissions and global warming are acknowledged and quantified in the Oregon plan: a) Transportation activities are estimated to be the second largest single source of
greenhouse gas emissions and are responsible for 38 percent of Oregon’s carbon dioxide emissions. The Oregon Department of Energy predicts that carbon dioxide emissions in the state will increase by 33 percent from 2000 to 2025 mainly because of increased driving.
b) Two impacts of global warming on transportation facilities in the Pacific Northwest
are rising sea levels and increased wave heights. Both could have severe impacts on Highway 101, coastal ports and other coastal transportation facilities. The Oregon
34 Oregon Transportation Plan. 2006. Pg. 4.
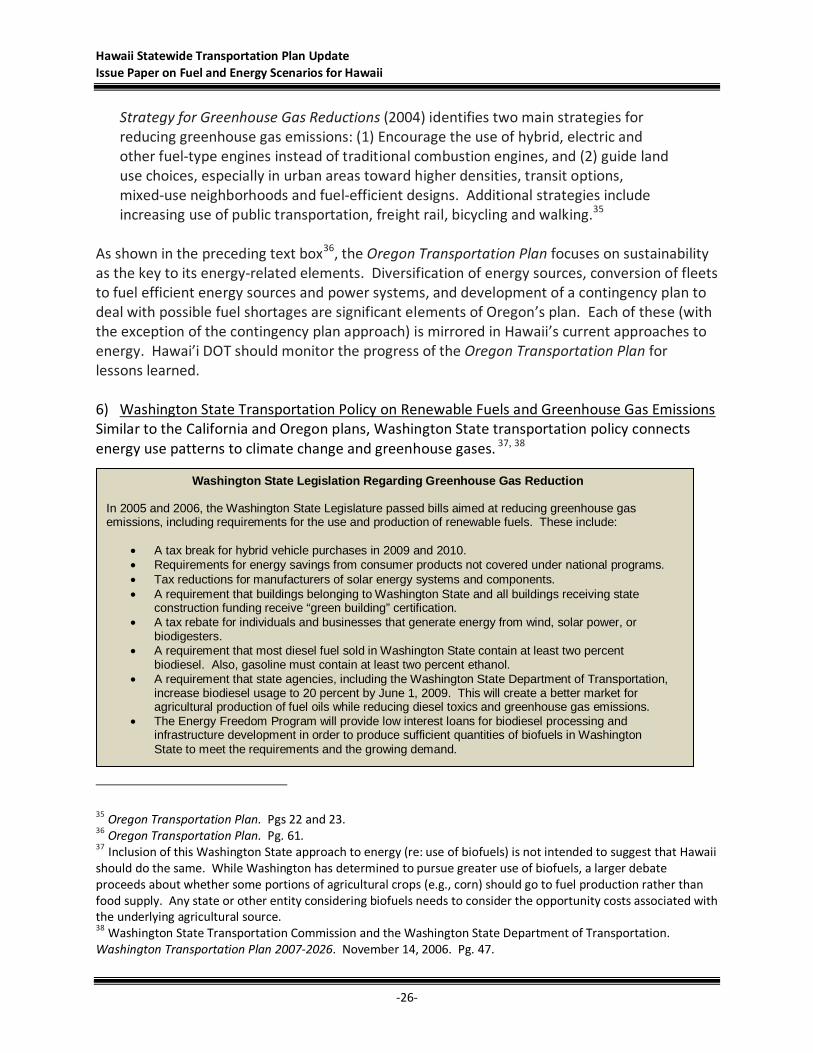
Hawaii Statewide Transportation Plan Update Issue Paper on Fuel and Energy Scenarios for Hawaii
-26-
Washington State Legislation Regarding Greenhouse Gas Reduction In 2005 and 2006, the Washington State Legislature passed bills aimed at reducing greenhouse gas emissions, including requirements for the use and production of renewable fuels. These include:
• A tax break for hybrid vehicle purchases in 2009 and 2010. • Requirements for energy savings from consumer products not covered under national programs. • Tax reductions for manufacturers of solar energy systems and components. • A requirement that buildings belonging to Washington State and all buildings receiving state
construction funding receive “green building” certification. • A tax rebate for individuals and businesses that generate energy from wind, solar power, or
biodigesters. • A requirement that most diesel fuel sold in Washington State contain at least two percent
biodiesel. Also, gasoline must contain at least two percent ethanol. • A requirement that state agencies, including the Washington State Department of Transportation,
increase biodiesel usage to 20 percent by June 1, 2009. This will create a better market for agricultural production of fuel oils while reducing diesel toxics and greenhouse gas emissions.
• The Energy Freedom Program will provide low interest loans for biodiesel processing and infrastructure development in order to produce sufficient quantities of biofuels in Washington State to meet the requirements and the growing demand.
Strategy for Greenhouse Gas Reductions (2004) identifies two main strategies for reducing greenhouse gas emissions: (1) Encourage the use of hybrid, electric and other fuel-type engines instead of traditional combustion engines, and (2) guide land use choices, especially in urban areas toward higher densities, transit options, mixed-use neighborhoods and fuel-efficient designs. Additional strategies include increasing use of public transportation, freight rail, bicycling and walking.35
As shown in the preceding text box36, the Oregon Transportation Plan focuses on sustainability as the key to its energy-related elements. Diversification of energy sources, conversion of fleets to fuel efficient energy sources and power systems, and development of a contingency plan to deal with possible fuel shortages are significant elements of Oregon’s plan. Each of these (with the exception of the contingency plan approach) is mirrored in Hawaii’s current approaches to energy. Hawai’i DOT should monitor the progress of the Oregon Transportation Plan for lessons learned. 6) Washington State Transportation Policy on Renewable Fuels and Greenhouse Gas Emissions Similar to the California and Oregon plans, Washington State transportation policy connects energy use patterns to climate change and greenhouse gases. 37, 38
35 Oregon Transportation Plan. Pgs 22 and 23. 36 Oregon Transportation Plan. Pg. 61. 37 Inclusion of this Washington State approach to energy (re: use of biofuels) is not intended to suggest that Hawaii should do the same. While Washington has determined to pursue greater use of biofuels, a larger debate proceeds about whether some portions of agricultural crops (e.g., corn) should go to fuel production rather than food supply. Any state or other entity considering biofuels needs to consider the opportunity costs associated with the underlying agricultural source. 38 Washington State Transportation Commission and the Washington State Department of Transportation. Washington Transportation Plan 2007-2026. November 14, 2006. Pg. 47.

Hawaii Statewide Transportation Plan Update Issue Paper on Fuel and Energy Scenarios for Hawaii
-27-
Section 3.1 Energy Considerations for Harbors as Elements of State Transportation Plans In the development of this issue paper several sources were reviewed to develop information on how marine or waterborne elements of state transportation plans treated energy. Among these sources were USDOT (particularly the federal Maritime Administration and the Metropolitan Capacity Building Program), the Transportation Research Board, and general internet searches. There are very few examples of states that have addressed energy issues associated with ports and harbors. Where state transportation plans address freight needs, ports and harbors are generally discussed, but energy issues associated with the marine mode are not typically addressed substantively. The State of Washington is responsible for an extensive ferry system and, as such, includes plans for the conversion of the ferry system from an older to a modern fleet. The Washington Transportation Plan does not call out marine-related energy concerns. Section 3.2 Energy Considerations for Aviation as Elements of Other State Transportation Plans As with harbors, few other state departments of transportation have significant aviation responsibilities. Alaska, again, stands out as an exception. California has aviation responsibilities but they are principally associated with general aviation. In reviewing the Federal Aviation Administration’s (FAA) treatment of energy, its focus has been on sustained price increases (for fuel) and the general public policy discussion of alternate fuels. The FAA’s Office of Environment and Energy has focused mostly on the aviation fleets and their operation (and not on airport elements). The fuel demands and efficiency of the aircraft along with flight operations (e.g, ascent and descent patterns) are the focus of the FAA. For example, the FAA Special Airworthiness Information Bulletin CD-07-06 does not recommend using automobile gasoline containing ethanol or methanol for aircraft39. Hawaii’s emphasis on alternate fuels and the commitment to develop algae-based fuel for aircraft are in line with the FAA policy direction. Hawaii’s preparation for the next generation of aircraft (larger, more fuel-efficient, and able to use fuels in addition to the current petroleum-derived jet fuel) is significant and is in line with other states’ and airport authorities’ plans as urged by the FAA. The 2008-2012 FAA Flight Plan states that its ultimate aim is a carbon-neutral aircraft and is currently in partnership with other agencies and the industry to research alternative fuels. 40
39 Federal Aviation Administration. Special Airworthiness Information Bulletin (SAIB), CE-07-06. October 27, 2006. 40 Federal Aviation Administration. 2008-2012 FAA Flight Plan: Charting the Path for the Next Generation. 2007. Page 27.

Hawaii Statewide Transportation Plan Update Issue Paper on Fuel and Energy Scenarios for Hawaii
-28-

Hawaii Statewide Transportation Plan Update Issue Paper on Fuel and Energy Scenarios for Hawaii
-29-
Section 4.0 Recommendations for the Hawaii Statewide Transportation Plan Update This review points out several topics worthy of further development in the Hawaii Statewide Transportation Plan Update. The State of Hawaii has placed a policy emphasis on energy management in the last few years. The wide range of plans, studies, actions, and legislative commitments undertaken by Hawaii’s policy makers demonstrates that the State is taking more aggressive stances on energy conservation and fuel options. Hawaii’s recent energy actions allow the Hawaii Statewide Transportation Plan Update to set forth clear, more quantifiable and more aggressive energy-related objectives than those of the 2002 Plan. The following actions are recommended so that the State will be able to clearly demonstrate that its transportation-related energy actions are being addressed in a manner that helps the State accomplish its overall energy objectives. Recommendations focus on actions needed to clarify benchmarks, modal responsibilities, and the likely effects of changes in fuels and usage. 1. Translate the State’s mandate to attain 70% clean energy by 2030 into a new goal. 2. Support the State’s energy commitments, develop an HDOT energy action program
appropriate for the transportation sector, and define the energy action in relation to sustainability and climate change.
3. Develop performance measures for improving the energy efficiency of Hawaii’s transportation system, in order to monitor change and evaluate progress. Similarly, enhance the data collection and reporting process.
4. Devote attention to the roles public transportation, non-motorized modes of transportation (bicycle/ pedestrian), and land use policy play in energy reduction.
5. Develop energy targets and actions appropriate to the State’s transportation responsibilities for highways, harbors, and airports.
6. Moving forward, transportation planners can begin to examine how the energy issue crosses with the eight planning factors. For example: • Economy
- Consider effects of energy availability and cost on transport demand, capital, and O&M
- Consider effects on state revenues • Safety
- Consider safety issues associated with changing fuel sources and uses • Security
- Consider vulnerability and risks that may arise from energy disruptions, changes in costs, and/or changes in sources
• Accessibility and Mobility - Consider effects of changes in vehicle fleet mix (for autos, trucks, aircraft, ships,
other) and the implications for transport facilities and services as well as for categories and trends of expenditures

Hawaii Statewide Transportation Plan Update Issue Paper on Fuel and Energy Scenarios for Hawaii
-30-
• Environment - Consider potential gains and risks for emissions, leakage, spills, and other forms of
fuel impacts • Integration and Connectivity
- Consider effects of changes in vehicle fleet mix (for autos, trucks, aircraft, ships, other) and the implications for transport facilities and services as well as for categories and trends of expenditures
- Consider land use/transportation coordination approaches and issues • System Preservation and Asset Management
- Consider effects of changes in vehicle fleet mix (for autos, trucks, aircraft, ships, other) and the implications for transport facilities and services as well as for categories and trends of expenditures; consider potential changes in DOT fleet and facility energy uses.
- Consider potential changes in DOT fleet and facility energy uses

-31-
References
Alaska Department of Transportation and Public Facilities. Let’s Get Moving 2030, Alaska Statewide Long-Range Transportation Plan. February 2008.
Berkooz, Corry Buckwalter. American Planning Association. “Electric Vehicle Infrastructure.”
Planning. March 2010. California Department of Transportation. California Transportation Plan 2025. April 2006. Federal Aviation Administration. 2008-2012 FAA Flight Plan: Charting the Path for the Next
Generation. (undated but assumed to be published in 2007) Federal Highway Administration, Transportation Capacity Building Program. The Transportation
Planning Process: Key Issues. (undated). Federal Highway Administration and Federal Transit Administration. Examples of Statewide
Transportation Planning Practices. January 1995. http://www.fhwa.dot.gov/planning/statewide/stpp.pdf
Hawaii Clean Energy Initiative
(www.hawaiicleanenergyinitiative.org) Hawaii Department of Transportation. Setting the Course, Hawaii Statewide Transportation
Plan. 2002. Hawaii Energy Policy Forum. State of Hawaii Energy Efficiency in Transportation Strategies,
Phase 1. University of Hawaii at Mānoa. January 15, 2008. (www.hawaiienergypolicy.hawaii.edu)
Hawaii 2050 Sustainability Task Force. Hawaii 2050 Sustainability Plan: Charting a Course for
Hawaii’s Sustainable Future. January 2008. Illinois Department of Transportation. Illinois State Transportation Plan. 2007. Lyons, William and Noerager, K. Evaluation of Statewide Long-Range Transportation Plans, for
the Federal Highway Administration. Volpe National Transportation Systems Center, Office of Intermodal and Statewide Planning, FHWA. 2002. http://www.fhwa.dot.gov/hep10/state/evalplans.htm
Maryland Department of Transportation. Maryland Transportation Plan. January 2009.

-32-
National Renewable Energy Laboratory. Arent, Doug, Barnett, Mosey and Wise. The Potential of Renewable Energy to Reduce the Dependence of the State of Hawaii on Oil.” Proceedings of the 42nd Hawaii International Conference on System Sciences. 2009.
Oregon Department of Transportation. Oregon Transportation Plan. September 20, 2006. State of Hawaii Department of Business, Economic Development & Tourism. Energy Resources
Coordinator, Annual Report. 2008. State of Hawaii Department of Business, Economic Development & Tourism. Energy Resources
Coordinator, Annual Report. 2009. Washington State Transportation Commission and the Washington State Department of
Transportation. Washington Transportation Plan 2007-2026. November 14, 2006. Wiles, Greg. Honolulu Advertiser. Photovoltaic Faces Setback. December 27, 2009. Yonan, Jr., Alan. Star Advertiser. Lights Out for Hoku Solar Project. July 9, 2010.
-33-
Appendices
Appendix 1: Hawaii Clean Energy Initiative—Transportation Policy Appendix 2: Hawaii Clean Energy Initiative: Options for Transportation Policy with
Respect to Energy Appendix 3: Hawaii State Legislation Concerning Facility Systems and Energy, HRS
Chapter 226-18 Appendix 4: Energy Agreement Between the State of Hawaii and the Hawaiian Electric
Companies. October 20, 2008 Appendix 5: Memorandum of Understanding between State of Hawaii and US DOE on
Energy. January 31, 2008 Appendix 6: Act 156 (2009) Transportation Energy Transformation Grant Fund
Program Appendix 7: HRS 269-92 Renewable Portfolio Standards

-34-

-35-
Appendix 1
Hawaii Clean Energy Initiative—Transportation Policy

-36-

-37-
Appendix 1: Hawaii Transportation Policy Concerning Energy The following section is excerpted from the Hawaii Clean Energy Initiative.41 Transportation Policy
Policies that move Hawaii to efficient and renewable-fueled transportation are key to achieving the goals of the Hawaii Clean Energy Initiative. More than 60% of Hawaii's current energy use is for transportation, and more than half of that is for aviation. Currently, the Hawaii Clean Energy Initiative goal is to use clean energy to supply 70% of Hawaii's ground transportation needs. Partners and working groups are actively monitoring developments in clean energy options, and viable solutions will be incorporated into the initiative's overall goals as they become available. Recent policy initiatives and major policies related to clean energy transportation in Hawaii include the following:
• ACT 156 (09), SB 1202, signed June 25, 2009—The Transportation Energy Initiatives Act (PDF 1.1 MB) seeks to make Hawaii residents more comfortable investing in electric and plug-in hybrid electric vehicles (PHEVs) by fostering development of electric-vehicle infrastructure. The new law requires parking lots to include spaces dedicated to electrically charged vehicles and sets up a grant program for building electric-vehicle infrastructure.
• Ethanol-blended fuel requirement—Hawaii requires at least 85% of unleaded gasoline to contain 10% ethanol.
• Reduced state excise tax for alternative fuels—Hawaii charges a lower state excise tax on ethanol, biodiesel, and other alternative automotive transportation fuel sales than it does on diesel and gasoline sales.
• Ethanol production incentive—Hawaiian law provides for a tax credit for ethanol production facilities through 2017.
For information on additional policy options that would address Hawaii's heavy dependence on imported oil for transportation, see Options for Transportation Policy.
For more on current Hawaii policy relating to efficient and renewable automotive transportation, please see the DOE Alternative Fuels Data Center.
Visit Policy Reports to learn more about energy studies and analyses for the islands.
41 http://www.hawaiicleanenergyinitiative.org/transportation.html

-38-
-39-
Appendix 2
Hawaii Clean Energy Initiative:
Options for Transportation Policy with Respect to Energy

-40-
-41-
Appendix 2: State Options for Transportation Policy with Respect to Energy The following is excerpted from the Hawaii Clean Energy Initiative.42 Options for Transportation Policy
For the 2010 legislative session, the Hawaii Clean Energy Initiative effort will shift its focus to transportation sector energy efficiency and renewable fuels. Currently, policy analysts are estimating policy costs and impacts (e.g., job creation, energy savings, and environmental benefits) of incentives and other policies designed to encourage more efficient fuel use and promote alternative fuel production and use. That information will be delivered to working groups to review and use as background for crafting proposed bills for the upcoming legislative session. The Hawaii Clean Energy Initiative will present its final policy recommendations in late fall 2009.
Policy options for automobiles and for aviation include the following:
• Higher-efficiency cars and trucks—Although fuel-efficiency standards are essentially a federal domain (PDF 75 KB), a number of states do offer rebates or tax incentives for purchase of alternative-fuel, hybrid, and other fuel-efficient vehicles. Initiatives along that line could have a significant impact on vehicle efficiency in Hawaii. Download Adobe Reader.
• Biofuels—Although the state of Hawaii already has several policies in place that promote biofuel production (see Transportation), there is no significant biofuel production in Hawaii as yet. However, studies and analyses indicate that Hawaii has strong potential for producing ethanol from sugar cane, cellulosic ethanol from sugar cane residue or other biomass, and biodiesel from tropical oilseed crops. The Hawaii Clean Energy Initiative and others are actively pursuing avenues for establishing such industries and are working to identify additional policy initiatives that would support such development.
• Electric vehicles—Measures similar to those available for encouraging purchase of fuel-efficient or alternative-fuel vehicles can also apply to electric-drive vehicles. In addition, measures affecting utility policies for charging electric vehicles (or possibly drawing power back from their batteries) could go a long way toward fostering use of electricity for automotive transport in Hawaii.
For more on electric-drive vehicles and their connection to the electrical grid, please see National Renewable Energy Laboratory reports from 2006 (PDF 569 MB) and 2009 (PDF 746 MB) or the April 2009 edition of Solar Today. Download Adobe Reader.
• Aviation—With more than a quarter of its current energy use going to aviation (second only to Alaska and far more than most states), Hawaii faces a relatively unique and difficult challenge. At present, there are no viable alternatives to petroleum-based jet fuel (kerosene). On the other hand, Hawaii may have a relatively unique opportunity to address this issue. One of the most promising technologies for developing less expensive biobased jet fuels is microalgal oil. Certain microscopic algae have high lipid or oil content and will grow at very rapid rates. That oil can be converted to not only biodiesel, but kerosene substitutes as well. The University of
42 http://www.hawaiicleanenergyinitiative.org/transportation_policy.html

-42-
Hawaii and other Hawaii institutions are at the forefront of research on microalgae. Policy measures designed to support that research and foster prospective microalgal oil industry could help Hawaii develop solutions for sustainable aviation energy use.

-43-
Appendix 3
Hawaii State Legislation
Concerning Facility Systems and Energy, HRS Chapter 226-18

-44-
-45-
Appendix 3: Hawaii State Legislation Concerning Facility Systems and Energy HRS Chapter 226-18
The following provision is from HRS Chapter 226. It sets out the direction the state must follow for energy. §226-18 Objectives and policies for facility systems--energy. (a) Planning for the State's facility systems with regard to energy shall be directed toward the achievement of the following objectives, giving due consideration to all: (1) Dependable, efficient, and economical statewide energy systems capable of supporting the needs
of the people; (2) Increased energy self-sufficiency where the ratio of indigenous to imported energy use is
increased; (3) Greater energy security in the face of threats to Hawaii's energy supplies and systems; and (4) Reduction, avoidance, or sequestration of greenhouse gas emissions from energy supply and use. (b) To achieve the energy objectives, it shall be the policy of this State to ensure the provision of adequate, reasonably priced, and dependable energy services to accommodate demand. (c) To further achieve the energy objectives, it shall be the policy of this State to: (1) Support research and development as well as promote the use of renewable energy sources; (2) Ensure that the combination of energy supplies and energy-saving systems is sufficient to support
the demands of growth; (3) Base decisions of least-cost supply-side and demand-side energy resource options on a
comparison of their total costs and benefits when a least-cost is determined by a reasonably comprehensive, quantitative, and qualitative accounting of their long-term, direct and indirect economic, environmental, social, cultural, and public health costs and benefits;
(4) Promote all cost-effective conservation of power and fuel supplies through measures, including: (A) Development of cost-effective demand-side management programs; (B) Education; and (C) Adoption of energy-efficient practices and technologies; (5) Ensure, to the extent that new supply-side resources are needed, that the development or
expansion of energy systems uses the least-cost energy supply option and maximizes efficient technologies;
(6) Support research, development, and demonstration of energy efficiency, load management, and other demand-side management programs, practices, and technologies;
(7) Promote alternate fuels and energy efficiency by encouraging diversification of transportation modes and infrastructure;
(8) Support actions that reduce, avoid, or sequester greenhouse gases in utility, transportation, and industrial sector applications;
(9) Support actions that reduce, avoid, or sequester Hawaii's greenhouse gas emissions through agriculture and forestry initiatives; and
(10) Provide priority handling and processing for all state and county permits required for renewable energy projects. [L 1978, c 100, pt of §2; am L 1986, c 276, §17; am L 1990, c 319, §2; am L 1994, c 96,
§4; am L 2000, c 176, §1; am L 2007, c 205, §6]

-46-

-47-
Appendix 4
Energy Agreement
Between the State of Hawaii and the Hawaiian Electric Companies
October 20, 2008

-48-

-49-
Appendix 4: Energy Agreement Between State of Hawaii and the Hawaiian Electric Companies
The agreement43 is signed by Governor Lingle, the Chairman of the Board of Hawaiian Electric Company, Inc., the Director of the Department of Business Economic Development and Tourism, the Executive Vice President of Hawaiian Electric Company, and the Executive Director of the Davison of Consumer Advocacy in the Department of Commerce and Consumer Affairs. Specific sections of the agreement cover the following topics plus several others:
o Wind power o Renewable energy commitments o Technology of inter-island renewables. o Solar o Biofueling o Coal o Greening transportation o Displacement of fossil fuel energy and “retirements” o Energy efficiency o Demand response programs o Investment in the infrastructure o Greenhouse gas issues
ENERGY AGREEMENT AMONG THE STATE OF HAWAII, DIVISION OF CONSUMER ADVOCACY OF THE DEPARTMENT OF COMMERCE AND CONSUMER AFFAIRS, AND THE HAWAIIAN ELECTRIC COMPANIES The signatories to this agreement are the Governor of the State of Hawaii; the State Department of Business, Economic Development and Tourism; Hawaiian Electric Company, Hawaii Electric Light Company, Maui Electric Company (“Hawaiian Electric Companies”); and the Division of Consumer Advocacy of the Department of Commerce and Consumer Affairs. On behalf of the people of Hawaii, we believe that the future of Hawaii requires that we move more decisively and irreversibly away from imported fossil fuel for electricity and transportation and towards indigenously produced renewable energy and an ethic of energy efficiency. The very future of our land, our economy and our quality of life is at risk if we do not make this move and we do so for the future of Hawaii and of the generations to come. The islands of Hawaii have abundant natural resources, including wind, sunshine, ocean and geothermal sources for electricity generation, and land for energy crops that can be refined into biofuels to address electricity and transportation needs. Economic and culturally sensitive use of natural resources can achieve energy supply security and price stability for the people of Hawaii, as well as significant environmental and economic opportunities and benefits. Successfully developing Hawaii’s energy economy will make the State a global model for achieving a sustainable, clean, flexible, and economically vibrant energy future.
43 The details of the agreement can be found at: Http://Hawaii.gov/dbedt/info/energy/agreement/signed2008oct20.pdf

-50-
We commit to being open and truthful with our community about the investment necessary to transition to a clean energy future, the importance of making it, and the time it will take to be successful. We accept that the transition to this clean energy future will require significant public and private investment with impacts on Hawaii’s ratepayers and taxpayers and, we expect to achieve long-term benefits that outweigh the costs of such investments. As we move from central-station, oil-based firm power to a much more renewable and distributed and intermittent powered system, we accept that the operating risks of the Hawaiian Electric Companies will increase which may potentially affect customers. Thus, we recognize the need to assure that Hawaii preserves a stable electric grid to minimize disruption to service quality and reliability. In addition, we recognize the need for a financially sound electric utility. Both are vital components for our achievement of an independent renewable energy future. We commit to take steps to reduce the demand for electricity and increase the efficiency of energy that we do use both to reduce the costs to the public and to reduce the level of electrical generation. At the same time, we recognize that a system of utility regulation will be needed to assure that Hawaii preserves a stable electric grid and a financially sound electric utility as vital components of our renewable energy future. We will strive to assure that this process to achieve the HCEI goals and objectives will be directed towards providing ratepayer benefits, including long term price stability, and ultimately lower cost than would be incurred using imported fossil fuels. We also commit to incorporate new metrics for measurement and oversight systems that monitor our progress in reducing our use of imported fossil fuel, while increasing our efficiency and our use of renewable energy to meet Hawaii’s electrical energy demand. We commit ourselves to a system of utility regulation that will transform our major utility from a traditional sales-based company to an energy services provider that retains its obligation to serve our public with reliable energy, strives to source and integrate greener and lower cost generation, and moves us to an energy independent future. And finally, we commit to working together in good faith, openness and in the spirit of cooperation and collaboration to achieve the objectives and goals set forth in this agreement. ------------------------------------------------------------------------------------------------------------ The “Greening Transportation” section is particularly applicable for the update of the Statewide Transportation Plan. That section states: 10. Greening Transportation For the Hawaii Clean Energy Initiative to reach its ambitious goal of 70 percent clean, renewable energy for electricity and transportation by 2030, a significant shift in the way we travel around Hawaii, and especially Oahu, is essential. While the State needs to pursue a broad range of solutions for transportation, the parties agree to the following: Addressing transportation issues will require a combination of solutions including:

-51-
1. Increased mass transit (more buses and some kind of fixed guide-way); 2. More fuel-efficient internal combustion vehicles; 3. Alternative fuels for vehicles; 4. Improved personal mobility (e.g., walking and bicycling); and 5. Behavioral changes (tele-commuting, car pool and van pool use, etc). The most promising alternative fuel, by far, available today is electricity. Electrification of transportation can offer consumers a lower-cost alternative to gasoline. It also decreases greenhouse gas emissions from the transportation sector dramatically, while only slightly increasing emissions from the power sector. A variety of electric vehicles are in various stages of use and development. 1, Present hybrids use only gasoline for fuel but run much of the time on electricity generated by the vehicle; 2. Plug-in hybrids will charge from the grid and run most of the time on electricity, seamlessly converting to small gasoline-powered internal combustion engines only as the battery charge runs out; and 3. “Pure” electric vehicles will run exclusively on electricity, either from direct recharging or a combination of recharging and battery swapping to extend their range. Whatever combination of technologies ultimately succeeds, moving from gasoline-fired engines to electric engines makes sense now. Electric utilities have significant idle capacity overnight that could be used to re-charge vehicles (and swappable batteries) during off peak hours. Increasing off-peak loads also can allow greater use of renewable energy during these off-peak times. The impact of pure EV/PHEVs upon the utility girds will be carefully studied, and PHEV adoption strategies will be designed to complement and leverage the utility grids and will not be pushed beyond the point where they become potentially harmful or costly to the electric grid or uneconomic on a pure BTU-in, transportation miles-out basis. Therefore, it is agreed that the parties will make ‘greening’ of ground transportation in Hawaii a priority. Under this agreement, the State will: • Encourage adoption of ‘gas-optional’ electric vehicles (hybrids, PHEVs, and EVs) through a “tool box” of incentives, including but not limited to
o Tax credits and/or deductions; o Preferential parking and HOV lane use; o Waived or reduced registration/license fees; o Incentives/rebates for multi-family buildings to wire or re-wire for electric vehicle charging; o Preferred insurance rates; - o Incentives for rental car fleet conversion to “gas optional” vehicles; and o Support for: Dealer offerings (preferred financing, discounts, rebates); Utility offerings (preferred rates, rebates, new meters); Employer support (stipends, vehicle-sharing, parking); and Web-based information center.
• Assist utilities in making necessary changes (described below) to adapt to a transportation electricity market, including installation of a smart grid and potentially modifying the existing time-of-use rates to

-52-
establish a rate that encourages the recharging of batteries during the off peak periods, thereby enabling the utility to reduce the amount of renewable energy that may be curtailed during such periods, and supporting greenhouse gas measures, which consider the overall decreased greenhouse gas impacts of converting from gasoline-powered vehicles to cleaner gas-optional vehicles (i.e., not penalizing the utility for possible increased electricity generation to help achieve cleaner transportation objectives). • For pure EVs, conduct a study to assess whether the additional charging stations and other custom infrastructure needs dictate that one specific EV program (e.g., A Better Place) must be chosen over others (this does not preclude also supporting hybrid EVs and PHEVs). • Work with all parties to develop charging stations in high traffic areas. • Lead by example and help develop the ‘gas optional’ vehicle market by becoming an early adopter of electric vehicles for its fleets. Similarly, it is the responsibility of the electric utilities to: • Lead by example and help develop the ‘gas optional’ vehicle market by becoming an early adopter of electric vehicles for its fleets. • Speed installation of Advanced Metering Infrastructure including the meters and computerized control technology. • Adopt time-of-use rates to encourage off-peak recharging and the computerized technology to monitor and control such recharging. • Encourage adoption of renewable energy as the primary source of recharging power.
-53-
Appendix 5
Memorandum of Understanding
Between State of Hawaii and US DOE on Energy January 31, 2008

-54-

-55-
Appendix 5: Memorandum of Understanding Between State of Hawaii and US DOE on Energy
January 31, 200844 I. Background The State of Hawaii depends on imported fossil fuels to meet over 90 percent of its energy needs. This dependence leaves Hawaii vulnerable to supply disruptions and high energy prices with estimates showing that every 10 percent increase in world oil prices results in a 0.5 percent reduction in the State’s GDP. At the same time, the islands of Hawaii have abundant natural resources, including wind, sunshine, and geothermal sources for electricity generation, and land for energy crops that can be refined into biofuels to address transportation needs. Economic and culturally sensitive use of natural resources can provide energy supply security and price stability for the people of Hawaii as well as significant environmental benefits and economic growth opportunities. Successfully developing Hawaii’s energy economy will make the State a global model for achieving a sustainable, clean, flexible, and economically vibrant energy future. The State, counties, utilities, private sector, non-governmental organizations, and other entities are taking steps to decrease Statewide energy use through the investment in and utilization of efficiency technologies while also increasing development of renewable energy projects. Projections indicate that current plans and development activities could result in approximately 20 percent of the electric energy supply generated from renewable resources by 2020. However, even achievement of this goal will still leave the State heavily dependent on imported fossil fuels and subject to supply disruptions. It is estimated that Hawaii can potentially meet between 60 and 70 percent of its future energy needs from clean, renewable energy sources. However, achieving this level market of penetration will require substantive transformation of the financial, regulatory, legal, and institutional systems that govern energy planning and delivery within the State. II. Purpose The purpose of this Memorandum of Understanding (MOU) is to establish a long-term partnership between the State of Hawaii and the US Department of Energy (DOE) that will result in a fundamental and sustained transformation in the way in which renewable energy efficiency resources are planned and used in the State. Successful development and execution of the objectives contemplated in this partnership will provide a replicable global model for achieving similar results. DOE-Hawaii Partnership will build upon the dynamic, ongoing work of public and private organizations at the State, county, and grassroots levels in order to achieve several key goals: • To define the structural transformation that will need to occur to transition the State to a clean energy
dominated economy
44 http://hawaii.gov/dbedt/info/energy/hcei/hawaii_mou.pdf

-56-
• To demonstrate and foster innovation in the use of clean energy technologies, financing methodologies, and enabling policies designed to accelerate social, economic and political acceptance of a clean energy dominated economy
• To create opportunity at all levels of society that ensures wide-spread distribution of the benefits
resulting from the transition to a clean, sustainable energy State • To establish an “open source” learning model for others seeking to achieve similar goals • To build the workforce with crosscutting skills to enable and support a clean energy economy. III. Collaboration The State of Hawaii and DOE will each accept the following roles and responsibilities to meet the goals of this MOU to the extent practical and authorized by law to: • Agree on near-term goals that demonstrate the accelerated deployment strategies anticipated herein
and work collaboratively to support the implementation of these goals • Develop a set of intended outcomes and designate working groups to produce long-term clean energy
deployment plans in each of the major energy performance areas articulated in the Appendix to this MOU
• Designate points of contact for overall collaboration, as well as for each of the energy performance
areas listed below • Produce strategic plans for review and comment by the public • Support communications and education campaigns that inform consumers, businesses, and major
stakeholders in Hawaii of the goals and benefits of this initiative.

-57-
(A) DOE • Serve as a conduit between the State of Hawaii and the appropriate organizational entities (such as
DOE national labs, Federal programs, research and development entities, and operations organizations) that can facilitate the strategic planning process and contribute to the execution of core activities within each of the energy performance areas
Designate a lead for each energy performance working group and cross-cutting issue working group
responsible for working with the State to coordinate the activities of the working group • Provide technical assistance to the State for producing the technical and economic tools necessary to
realize the goals of the initiative, as well as coordinate pilot activities to enhance the sustainability of these activities
• Facilitate participation of national, non-governmental entities in the initiative. (B) State of Hawaii • Identify the critical State-based stakeholders needed to participate in the working groups • Establish the State-mandated processes needed to review and ultimately enact the policies,
educational programs, and other provisions of the strategic plans within each of the energy performance areas listed below
• Promote the goals and recommendations of the working groups to consumers, businesses, and other
organizations within the State to ensure that the transformational goals are broadly understood and embraced by the greatest cross section of the State’s population possible
• Develop the technical and economic tools necessary to realize the goals of the initiative. Additional details regarding plans for implementing this MOU are set forth in the attached Appendix, entitled “Structure and Time Frames the DOE-Hawaii Clean Energy Partnership.” The Appendix is hereby incorporated by reference in this MOU and is subject to all terms thereof.
IV. General
(A) This MOU and the attached Appendix are strictly for internal management use of each of the parties.
It is not legally enforceable and shall not be construed to create any legal obligation on the part of either party. This MOU and the attached Appendix shall not be construed to provide a private right or cause of action for or by any person or entity.
(B) This MOU and the attached Appendix can be terminated by either party at any time by providing
notice in writing to the other party. (C) This MOU and the attached Appendix in no way restrict either of the parties from participating in any
activity with other public or private agencies, organizations or individuals.

-58-
(D) This MOU and the attached Appendix are neither fiscal nor funds obligation documents. Nothing in this MOU authorizes or is intended to obligate the parties to expend, exchange, or reimburse funds, services, or supplies, or transfer or receive anything of value.
(E) This MOU and the attached Appendix shall not be construed to impact procurement or financial
assistance activities of either DOE or the State of Hawaii. The Department of Energy enters into this MOU under the authority of section 646 of the Department of Energy Organization Act (Pub. L. 95-91, as amended; 42 U.S.C. § 7256). All agreements herein are subject to, and will be carried out in compliance with, all applicable laws, regulations and other legal requirements. DEPARTMENT OF ENERGY By_____________________________ Print Name:_____________________ Title:____________________________
THE STATE OF HAWAII By______________________________ Print Name:_______________________ Title:_____________________________

-59-
Appendix – Structure and Time Frames for the DOE-Hawaii Clean Energy Partnership The joint actions by Hawaii and DOE under consideration will fall into several categories: 1. Establishment of Short-, Medium- and Long-Term Clean Energy Deployment Plans (2008-on) Hawaii and DOE plan to establish working groups in each of the energy and cross-cutting focus areas identified below. The objective of these groups will be to define, in specific detail, the structural, technical, regulatory, financial and other barriers that would prevent the state from achieving—and maintaining—its clean energy potential, as defined in this document. Energy Performance Working Groups will address: • End-use efficiency, with the ultimate goal of achieving zero net-energy buildings and communities,
and dramatic reductions in other significant end-use areas, including military bases and installations; • Electric generation, including expanding and optimizing the use of renewable energy at central and
remote locations, improving generation efficiency at existing plants, and facilitating the installation of distributed renewable generation across the State;
• Energy delivery, including transmission and distribution improvements, grid management improvements, and energy storage to ensure that the existing and future infrastructure facilitates optimal use of renewable resources and readily adapts to and incorporates new developments in system planning and transmission technologies while maintaining system reliability; and
• Transportation, including the establishment of a long-term, sustainable strategy for the production, distribution, and use of alternative transportation fuels, thereby accelerating the adoption of advanced vehicle technologies such as plug-in hybrids, and promoting mass transit.
Cross-Cutting Issue Working Groups will consider addressing: • Technology integration, including consideration of current clean energy technologies that have
been demonstrated in Hawaii and elsewhere, state of the art technologies that have not yet been demonstrated on the commercial scale, integration of transportation and electricity energy systems, and solutions for technology reliability and economic viability;
• Creating sustained sources of financing, with particular emphasis on developing innovative public and private financing vehicles for alternative energy sources and clean technologies at the state and county levels; and
• Policy and regulatory mechanisms, including design and enactment of comprehensive regulatory mechanisms that provide appropriate incentives for all stakeholders in the energy supply chain to proactively transition to a renewable energy-based future.
The working groups will be co-chaired by the State and DOE, with the mandate to produce two-, five- and ten-year operational plans to transform the investment in and use of energy resources in each energy performance area. These plans will include date-specific goals for major actions and mechanisms for leveraging the expertise, creativity, and resources of the major stakeholders. The planned timeline for producing and executing the strategic plans is as follows: • January 2008: Launch DOE-Hawaii Partnership and establish working groups in each of the working
group areas outlined above. • March 2008: Issue draft strategic implementation plans in each of the working group areas. • June 2008: Issue final strategic implementation plans that include a set of initial actions needed to
jump start activity in each of the energy performance areas, two-, five- and ten-year goals, and specific actions that will be taken to meet the transformational goals required in each of the major areas.

-60-
2. Institutionalization of Financial, Policy, and Regulatory Mechanisms Needed to Transition to a Clean Energy Future (2009-on)
The results of the deployment planning and pilot activities articulated in the first two stages of this initiative should identify a set of financial, regulatory, and policy activities that should pursued in Hawaii over the long-term to ensure a sustainable energy future. In addition, working groups may identify key education and training activities that are needed to develop and maintain well-functioning energy infrastructure on a very large scale in each of the Hawaiian Islands. Through this process, the State and DOE agree to have a standing committee to identify these needs and to promote their adoption by the relevant state and/or federal agencies involved. 3. Communicating the Goals, Benefits, and Accomplishments of this Partnership with Citizens of
Hawaii, the United States, and the Pacific Rim (2007-on) Both parties will seek to work collaboratively to establish multi-stakeholder outreach campaigns that highlight the economic, environmental, security, and other benefits of the transition to a clean energy future in Hawaii. These campaigns should be on-going throughout the process and specifically designed to provide pertinent, actionable information to consumer, trade, education, business, and other groups in Hawaii as well as throughout the U.S., the Pacific Rim, and the world.

-61-
Appendix 6
Act 156 (2009)
Transportation Energy Transformation Grant Fund Program

-62-

-63-

-64-
THE SENATE S.B. NO. 1202 TWENTY-FIFTH LEGISLATURE, 2009 S.D. 2 STATE OF HAWAII H.D. 2 C.D. 1
A BILL FOR AN ACT RELATING TO TRANSPORTATION ENERGY INITIATIVES. BE IT ENACTED BY THE LEGISLATURE OF THE STATE OF HAWAII: SECTION 1. The legislature finds that Hawaii must take bold steps toward reducing its dependence on imported fossil fuels. The State imports ninety-five per cent of its energy, most of which comes from petroleum and coal. Eighty-nine per cent of Hawaii's energy is derived from petroleum and six per cent is derived from coal. Of all the energy consumed in the State, about forty per cent is used for transportation purposes, compared with eight per cent for residential uses, ten per cent for commercial uses, twenty-five per cent for generating electric power, and sixteen per cent for industrial uses. The legislature finds, therefore, that it is essential for the State to aggressively promote and develop alternatives to fossil fuel modes of transportation. Alternative fuel and electric vehicles are a viable solution. Electrification of transportation creates jobs, fosters economic growth, reduces greenhouse gas emissions, and stems the effects of climate change in Hawaii. The legislature also finds that developing an electric vehicle infrastructure is a first and essential step toward the transformation of transportation in Hawaii. With developing technology, along with a push by national and international automakers to expedite the production and supply of electric vehicles, Hawaii must be ready to embrace a new generation of highway transportation. The purpose of this Act is to provide sufficient tools to develop an infrastructure for electric vehicles in Hawaii. Accordingly, this Act requires government agencies to lead the way in the electrification of transportation in the State, providing an aggressive but realistic timetable to replace

-65-
fossil fuel vehicles with electric and alternative fuel vehicles.
PART I PLANNING AND POLICY PRIORITIES
SECTION 2. Section 226-10, Hawaii Revised Statutes, is amended by amending subsection (b) to read as follows: "(b) To achieve the potential growth activity objective, it shall be the policy of this State to: (1) Facilitate investment and employment in economic
activities that have the potential for growth such as diversified agriculture, aquaculture, apparel and textile manufacturing, film and television production, and energy and marine-related industries[.];
(2) Expand Hawaii's capacity to attract and service international programs and activities that generate employment for Hawaii's people[.];
(3) Enhance and promote Hawaii's role as a center for international relations, trade, finance, services, technology, education, culture, and the arts[.];
(4) Accelerate research and development of new energy- related industries based on wind, solar, ocean, and underground resources and solid waste[.];
(5) Promote Hawaii's geographic, environmental, social, and technological advantages to attract new economic activities into the State[.];
(6) Provide public incentives and encourage private initiative to attract new industries that best support Hawaii's social, economic, physical, and environmental objectives[.];
(7) Increase research and the development of ocean-related economic activities such as mining, food production, and scientific research[.];
(8) Develop, promote, and support research and educational and training programs that will enhance Hawaii's ability to attract and develop economic activities of benefit to Hawaii[.];
(9) Foster a broader public recognition and understanding of the potential benefits of new, growth-oriented industry in Hawaii[.];
(10) Encourage the development and implementation of joint federal and state initiatives to attract federal programs and projects that will support Hawaii's social, economic, physical, and environmental objectives[.];
(11) Increase research and development of businesses and services in the telecommunications and information industries[.]; and

-66-
(12) Foster the research and development of nonfossil fuel and energy efficient modes of transportation."
SECTION 3. Section 226-18, Hawaii Revised Statutes, is amended to read as follows: "§226-18 Objectives and policies for facility systems--energy. (a) Planning for the State's facility systems with regard to energy shall be directed toward the achievement of the following objectives, giving due consideration to all: (1) Dependable, efficient, and economical statewide energy
systems capable of supporting the needs of the people; (2) Increased energy self-sufficiency where the ratio of
indigenous to imported energy use is increased; (3) Greater energy security and diversification in the
face of threats to Hawaii's energy supplies and systems; and
(4) Reduction, avoidance, or sequestration of greenhouse gas emissions from energy supply and use.
(b) To achieve the energy objectives, it shall be the policy of this State to ensure the short- and long-term provision of adequate, reasonably priced, and dependable energy services to accommodate demand. (c) To further achieve the energy objectives, it shall be the policy of this State to: (1) Support research and development as well as promote
the use of renewable energy sources; (2) Ensure that the combination of energy supplies and
energy-saving systems is sufficient to support the demands of growth;
(3) Base decisions of least-cost supply-side and demand-side energy resource options on a comparison of their total costs and benefits when a least-cost is determined by a reasonably comprehensive, quantitative, and qualitative accounting of their long-term, direct and indirect economic, environmental, social, cultural, and public health costs and benefits;
(4) Promote all cost-effective conservation of power and fuel supplies through measures, including:
(A) Development of cost-effective demand-side management programs;
(B) Education; and (C) Adoption of energy-efficient practices and
technologies; (5) Ensure, to the extent that new supply-side resources
are needed, that the development or expansion of energy systems uses the least-cost energy supply option and maximizes efficient technologies;

-67-
(6) Support research, development, [and] demonstration, and use of energy efficiency, load management, and other demand-side management programs, practices, and technologies;
(7) Promote alternate fuels and transportation energy efficiency [by encouraging diversification of transportation modes and infrastructure];
(8) Support actions that reduce, avoid, or sequester greenhouse gases in utility, transportation, and industrial sector applications;
(9) Support actions that reduce, avoid, or sequester Hawaii's greenhouse gas emissions through agriculture and forestry initiatives; and
(10) Provide priority handling and processing for all state and county permits required for renewable energy projects."
PART II BUSINESS INCENTIVES AND REQUIREMENTS
SECTION 4. Chapter 291, Hawaii Revised Statutes, is amended by adding two new sections to be appropriately designated and to read as follows: "§291-A Designation of parking spaces for electric vehicles; charging units. All public, private, and government parking facilities that are available for use by the general public and have at least one hundred parking spaces shall designate one per cent of parking spaces exclusively for electric vehicles by December 31, 2011, provided that at least one of the parking spaces designated for electric vehicles is located near the building entrance and is equipped with an electric vehicle charging unit. Spaces shall be designated, clearly marked, and the exclusive designation enforced. The electric vehicle charging units shall meet recognized standards, including SAE J1772 of the Society of Automotive Engineers. Owners of multiple parking lots within the State may designate and electrify fewer parking spaces than required in one or more of their owned properties as long as the scheduled requirement is met for the total number of aggregate spaces on all of their owned properties. When the number of registered electric vehicles in the State reaches five thousand, the spaces designated for electric vehicles shall increase to two per cent of parking spaces. The number of spaces designated for electric vehicles shall continue to increase by one per cent for each additional five thousand electric vehicles registered in the State until the percentage reaches ten per cent of parking spaces.

-68-
For the purposes of this section, "electric vehicle" means an electric vehicle or neighborhood electric vehicle with an electric vehicle license plate. §291-B Parking spaces reserved for electric vehicles; penalties. (a) Beginning January 1, 2012, any person who parks a non-electric vehicle in a space designated and marked as reserved for electric vehicles shall receive a warning. (b) Beginning July 1, 2013, any person who parks a non-electric vehicle in a space designated and marked as reserved for electric vehicles shall be guilty of a traffic infraction under chapter 291D and shall be fined not less than $50 nor more than $100, and shall pay any costs incurred by the court related to assessing the fine. (c) Any citation issued under this section may be mailed to the violator pursuant to section 291C-165(b)." SECTION 5. Section 269-1, Hawaii Revised Statutes, is amended by amending the definition of "public utility" to read as follows: ""Public utility": (1) Includes every person who may own, control, operate,
or manage as owner, lessee, trustee, receiver, or otherwise, whether under a franchise, charter, license, articles of association, or otherwise, any plant or equipment, or any part thereof, directly or indirectly for public use, for the transportation of passengers or freight, or the conveyance or transmission of telecommunications messages, or the furnishing of facilities for the transmission of intelligence by electricity by land or water or air within the State, or between points within the State, or for the production, conveyance, transmission, delivery, or furnishing of light, power, heat, cold, water, gas, or oil, or for the storage or warehousing of goods, or the disposal of sewage; provided that the term shall include:
(A) Any person insofar as that person owns or operates a private sewer company or sewer facility; and
(B) Any telecommunications carrier or telecommunications common carrier;
(2) Shall not include: (A) Any person insofar as that person owns or operates
an aerial transportation enterprise; (B) Persons owning or operating taxicabs, as defined
in this section; (C) Common carriers transporting only freight on the
public highways, unless operating within

-69-
localities or along routes or between points that the public utilities commission finds to be inadequately serviced without regulation under this chapter;
(D) Persons engaged in the business of warehousing or storage unless the commission finds that regulation thereof is necessary in the public interest;
(E) The business of any carrier by water to the extent that the carrier enters into private contracts for towage, salvage, hauling, or carriage between points within the State and the carriage is not pursuant to either an established schedule or an undertaking to perform carriage services on behalf of the public generally;
(F) The business of any carrier by water, substantially engaged in interstate or foreign commerce, transporting passengers on luxury cruises between points within the State or on luxury round-trip cruises returning to the point of departure;
(G) Any person who: (i) Controls, operates, or manages plants or
facilities for the production, transmission, or furnishing of power primarily or entirely from nonfossil fuel sources; and
(ii) Provides, sells, or transmits all of that power, except such power as is used in its own internal operations, directly to a public utility for transmission to the public;
(H) A telecommunications provider only to the extent determined by the commission pursuant to section 269-16.9;
(I) Any person who controls, operates, or manages plants or facilities developed pursuant to chapter 167 for conveying, distributing, and transmitting water for irrigation and such other purposes that shall be held for public use and purpose;
(J) Any person who owns, controls, operates, or manages plants or facilities for the reclamation of wastewater; provided that:
(i) The services of the facility shall be provided pursuant to a service contract between the person and a state or county agency and at least ten per cent of the

-70-
wastewater processed is used directly by the State or county which has entered into the service contract;
(ii) The primary function of the facility shall be the processing of secondary treated wastewater that has been produced by a municipal wastewater treatment facility that is owned by a state or county agency;
(iii) The facility shall not make sales of water to residential customers;
(iv) The facility may distribute and sell recycled or reclaimed water to entities not covered by a state or county service contract; provided that, in the absence of regulatory oversight and direct competition, the distribution and sale of recycled or reclaimed water shall be voluntary and its pricing fair and reasonable. For purposes of this subparagraph, "recycled water" and "reclaimed water" [mean] means treated wastewater that by design is intended or used for a beneficial purpose; and
(v) The facility shall not be engaged, either directly or indirectly, in the processing of food wastes; [and]
(K) Any person who owns, controls, operates, or manages any seawater air conditioning district cooling project; provided that at least fifty per cent of the energy required for the seawater air conditioning district cooling system is provided by a renewable energy resource, such as cold, deep seawater[.]; and
(L) Any person who owns, controls, operates, or manages plants or facilities primarily used to charge or discharge a vehicle battery that provides power for vehicle propulsion.
If the application of this chapter is ordered by the commission in any case provided in paragraphs (2)(C), (2)(D), (2)(H), and (2)(I), the business of any public utility that presents evidence of bona fide operation on the date of the commencement of the proceedings resulting in the order shall be presumed to be necessary to public convenience and necessity, but any certificate issued under this proviso shall nevertheless be subject to such terms and conditions as the commission may prescribe, as provided in sections 269-16.9 and 269-20."
PART III GOVERNMENT AGENCY REQUIREMENTS

-71-
SECTION 6. Section 103D-412, Hawaii Revised Statutes, is amended to read as follows: "§103D-412 [Energy-efficient vehicles.] Light-duty motor vehicle requirements. (a) The procurement policy for all agencies purchasing or leasing light-duty motor vehicles shall be to [obtain energy-efficient vehicles. All covered fleets are directed to procure increasing percentages of energy-efficient vehicles as part of their annual vehicle acquisition plans, which shall be as follows: (1) In the fiscal year beginning July 1, 2006, at least
twenty per cent of newly purchased light-duty vehicles acquired by each covered fleet shall be energy-efficient vehicles;
(2) In the fiscal year beginning July 1, 2007, at least thirty per cent of newly purchased light-duty vehicles acquired by each covered fleet shall be energy-efficient vehicles;
(3) In the fiscal year beginning July 1, 2008, at least forty per cent of newly purchased light-duty vehicles acquired by each covered fleet shall be energy-efficient vehicles; and
(4) For each subsequent fiscal year, the percentage of energy-efficient vehicles newly purchased shall be five percentage points higher than the previous year, until at least seventy-five per cent of each covered fleet's newly purchased, light-duty vehicles are energy-efficient vehicles.]
reduce dependence on petroleum for transportation energy. (b) Beginning January 1, 2010, all state and county entities, when purchasing new vehicles, shall seek vehicles with reduced dependence on petroleum-based fuels that meet the needs of the agency. Priority for selecting vehicles shall be as follows: (1) Electric or plug-in hybrid electric vehicles; (2) Hydrogen or fuel cell vehicles; (3) Other alternative fuel vehicles; (4) Hybrid electric vehicles; and (5) Vehicles that are identified by the United States
Environmental Protection Agency in its annual "Fuel Economy Leaders" report as being among the top performers for fuel economy in their class.
[(b)] (c) For the purposes of this section: "Agency" means a state agency, office, or department. "Alternative fuel" [has the same meaning as contained in 10 Code of Federal Regulations Part 490.] means alcohol fuels, mixtures containing eighty-five per cent or more by volume of alcohols with gasoline or other fuels, natural gas, liquefied
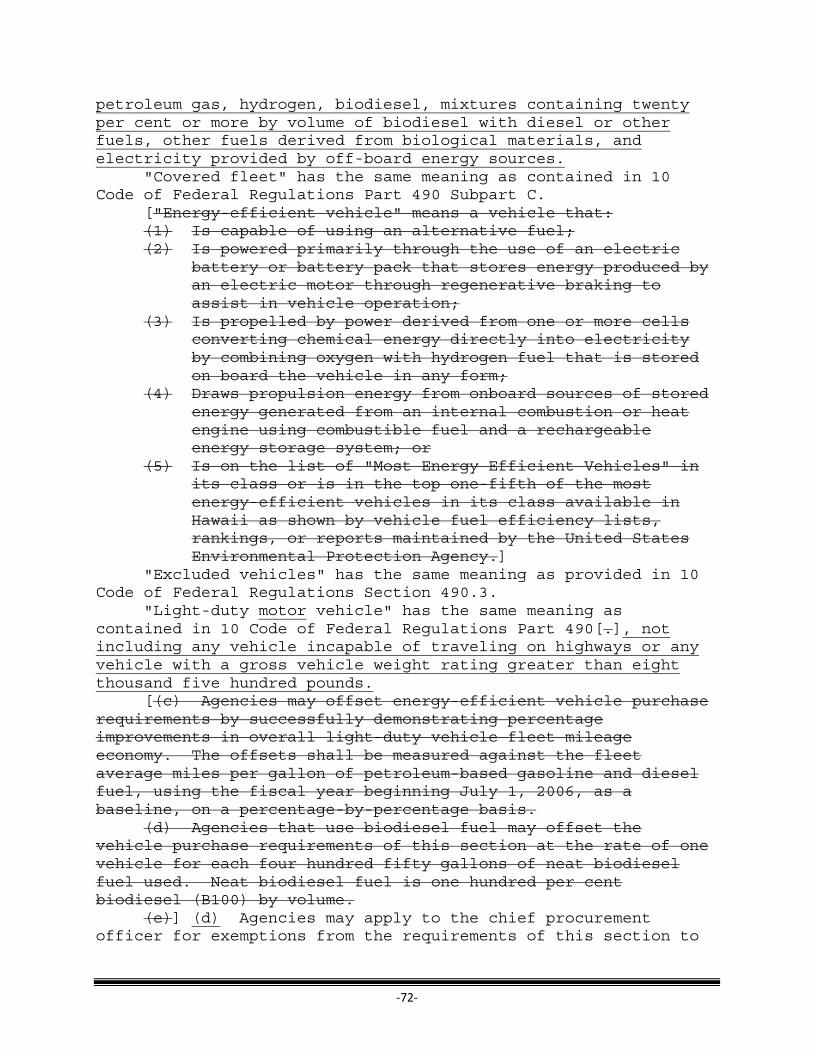
-72-
petroleum gas, hydrogen, biodiesel, mixtures containing twenty per cent or more by volume of biodiesel with diesel or other fuels, other fuels derived from biological materials, and electricity provided by off-board energy sources. "Covered fleet" has the same meaning as contained in 10 Code of Federal Regulations Part 490 Subpart C. ["Energy-efficient vehicle" means a vehicle that: (1) Is capable of using an alternative fuel; (2) Is powered primarily through the use of an electric
battery or battery pack that stores energy produced by an electric motor through regenerative braking to assist in vehicle operation;
(3) Is propelled by power derived from one or more cells converting chemical energy directly into electricity by combining oxygen with hydrogen fuel that is stored on board the vehicle in any form;
(4) Draws propulsion energy from onboard sources of stored energy generated from an internal combustion or heat engine using combustible fuel and a rechargeable energy storage system; or
(5) Is on the list of "Most Energy Efficient Vehicles" in its class or is in the top one-fifth of the most energy-efficient vehicles in its class available in Hawaii as shown by vehicle fuel efficiency lists, rankings, or reports maintained by the United States Environmental Protection Agency.]
"Excluded vehicles" has the same meaning as provided in 10 Code of Federal Regulations Section 490.3. "Light-duty motor vehicle" has the same meaning as contained in 10 Code of Federal Regulations Part 490[.], not including any vehicle incapable of traveling on highways or any vehicle with a gross vehicle weight rating greater than eight thousand five hundred pounds. [(c) Agencies may offset energy-efficient vehicle purchase requirements by successfully demonstrating percentage improvements in overall light-duty vehicle fleet mileage economy. The offsets shall be measured against the fleet average miles per gallon of petroleum-based gasoline and diesel fuel, using the fiscal year beginning July 1, 2006, as a baseline, on a percentage-by-percentage basis. (d) Agencies that use biodiesel fuel may offset the vehicle purchase requirements of this section at the rate of one vehicle for each four hundred fifty gallons of neat biodiesel fuel used. Neat biodiesel fuel is one hundred per cent biodiesel (B100) by volume. (e)] (d) Agencies may apply to the chief procurement officer for exemptions from the requirements of this section to

-73-
the extent that the vehicles required by this section are not available or do not meet the specific needs of the agency[.]; provided that life cycle vehicle and fuel costs may be included in the determination of whether a particular vehicle meets the needs of the agency. Estimates of future fuel costs shall be based on projections from the United States Energy Information Administration. [(f)] (e) Vehicles acquired from another state agency and excluded vehicles are exempt from the requirements of this section. [(g)] (f) Nothing in this section is intended to interfere with [an agency's] the ability of a covered fleet to comply with [federally-imposed] the vehicle purchase mandates [such as those] required by 10 Code of Federal Regulations Part 490 Subpart C." SECTION 7. Section 286-172, Hawaii Revised Statutes, is amended by amending subsection (a) to read as follows: "(a) Subject to authorization granted by the chief justice with respect to the traffic records of the violations bureaus of the district courts and of the circuit courts, the director of transportation shall furnish information contained in the statewide traffic records system in response to: (1) Any request from a state, a political subdivision of a
state, or a federal department or agency, or any other authorized person pursuant to rules adopted by the director of transportation under chapter 91;
(2) Any request from a person having a legitimate reason, as determined by the director, as provided under the rules adopted by the director under paragraph (1), to obtain the information for verification of vehicle ownership, traffic safety programs, or for research or statistical reports; [or]
(3) Any request from a person required or authorized by law to give written notice by mail to owners of vehicles[.]; or
(4) Any request from the energy resources coordinator to track the number and type of vehicles in use and the effectiveness of efforts to increase the efficiency and diversify the fuel needs of Hawaii's transportation sector."
PART IV TRANSPORTATION ENERGY TRANSFORMATION GRANT FUND PROGRAM
SECTION 8. Chapter 201, Hawaii Revised Statutes, is amended by adding a new section to be appropriately designated and to read as follows: "§201- Transportation energy transformation grant fund; electric vehicles. (a) There is established within the state

-74-
treasury the transportation energy transformation grant fund, to be administered and expended by the department, into which shall be deposited: (1) Appropriations made by the legislature; (2) Gifts, grants, and other public and private funds; (3) Any federal funds; and (4) All interest and revenue of receipts derived from the
fund. (b) The moneys in the fund shall be used by the department to: (1) Provide grants for the acquisition of electric
vehicles; (2) Provide grants for the installation of electric
vehicle charging infrastructure that is in compliance with all state laws and capable of being intelligently integrated with the electrical grid;
(3) Provide grants for innovative programs that diversify transportation energy sources or that help coordinate activities that will help to diversify transportation energy sources in the State;
(4) Establish and fill two temporary positions to carry out the purposes of this part; and
(5) Pay for any administrative, operational, training, and marketing costs associated with the transportation energy transformation grant program.
(c) Applications for grants shall be made to the department and shall be for any or all of the following: (1) The acquisition of one or more new electric vehicles
licensed and intended for use on Hawaii's highways; provided that the electric vehicles are:
(A) Intended to be charged primarily by renewable energy sources; or
(B) Able to be integrated intelligently with the electrical grid;
(2) Electric vehicle charging infrastructure; and (3) Innovative programs that diversify transportation
energy sources or that help coordinate activities that will help to diversify transportation energy sources in the State.
(d) A grant may be made to an applicant only if the applicant has: (1) Met the specifications and requirements established by
the director for the grant program; (2) Filed a completed application form, as prescribed by
the director, together with all supporting documentation required by the director;

-75-
(3) Completed the purchase or lease, licensing, and registration of one or more vehicles, prior to applying for one or more electric vehicle grants;
(4) Provided any other information deemed necessary by the director; and
(5) Met any additional requirements of the grant program as determined by the director.
(e) Disbursements from the transportation energy transformation grant fund shall not be subject to chapter 42F. (f) The director shall include information on the transportation energy transformation grant fund, and statistical information on program participation, in the department’s annual report to the governor and the legislature. (g) The director may adopt rules pursuant to chapter 91 to govern all aspects of the transportation energy transformation grant fund program. (h) As used in this section: "Director" means the director of business, economic development, and tourism. "Electric vehicle" has the same meaning as contained in Section 30D of the Internal Revenue Code for "new qualified plug-in electric drive motor vehicle". "Electric vehicle charging infrastructure" means structures, machinery, and equipment necessary to support an electric vehicle, including battery charging stations and battery exchange stations. "Integrated intelligently with the electrical grid" means that the demand of the electric vehicle for electricity from the grid is controlled to enable reduction of the vehicle's electrical demand on the grid during peak demand times and to enable maximum use of renewable energy sources, baseload energy sources, or renewable energy potentially available off peak that would otherwise be curtailed." SECTION 9. There is appropriated out of available and appropriated federal funds the sum of $20,000,000 or so much thereof as may be necessary for fiscal year 2009-2010 and the same sum or so much thereof as may be necessary for fiscal year 2010-2011 to be deposited into the transportation energy transformation grant fund; provided that this section shall only take effect upon a determination by the department of business, economic development, and tourism that federal funds that may be appropriately expended for the purposes of this part are available. SECTION 10. There is appropriated out of the transportation energy transformation grant fund the sum of $20,000,000 or so much thereof as may be necessary for fiscal year 2009-2010 and the same sum or so much thereof as may be

-76-
necessary for fiscal year 2010-2011 for the purposes of this part; provided that this section shall only take effect upon a determination by the department of business, economic development, and tourism that federal funds that may be appropriately expended for the purposes of this part are available. The sums appropriated shall be expended by the department of business, economic development, and tourism for the purposes of this part. SECTION 11. There are established within the department of business, economic development, and tourism two full-time, temporary positions, exempt from chapters 76 and 89, Hawaii Revised Statutes, to carry out the purposes of this part.
PART V MISCELLANEOUS
SECTION 12. In codifying the new sections added by section 4 of this Act, the revisor of statutes shall substitute appropriate section numbers for the letters used in designating the new sections in this Act. SECTION 13. Statutory material to be repealed is bracketed and stricken. New statutory material is underscored. SECTION 14. This Act shall take effect on July 1, 2009; provided that section 8 shall be repealed on June 30, 2013.
Appendix Page -59-
Appendix 7
HRS 269-92 Renewable Portfolio Standards

Appendix Page -60-

Appendix Page -61-
Appendix 7: HRS 269-92 Renewable Portfolio Standards §269-92 Renewable portfolio standards. (a) Each electric utility company that sells electricity for consumption in the State shall establish a
renewable portfolio standard of: (1) Ten per cent of its net electricity sales by December 31, 2010; (2) Fifteen per cent of its net electricity sales by December 31, 2015; (3) Twenty-five per cent of its net electricity sales by December 31, 2020; and (4) Forty per cent of its net electricity sales by December 31, 2030. (b) The public utilities commission may establish standards for each utility that prescribe what
portion of the renewable portfolio standards shall be met by specific types of renewable energy resources; provided that:
(1) Prior to January 1, 2015, at least fifty per cent of the renewable portfolio standards shall be met by electrical energy generated using renewable energy as the source, and after December 31, 2014, the entire renewable portfolio standard shall be met by electrical generation from renewable energy sources;
(2) Beginning January 1, 2015, electrical energy savings shall not count toward renewable energy portfolio standards;
(3) Where electrical energy is generated or displaced by a combination of renewable and nonrenewable means, the proportion attributable to the renewable means shall be credited as renewable energy; and
(4) Where fossil and renewable fuels are co-fired in the same generating unit, the unit shall be considered to generate renewable electrical energy (electricity) in direct proportion to the percentage of the total heat input value represented by the heat input value of the renewable fuels.
(c) If the public utilities commission determines that an electric utility company failed to meet the renewable portfolio standard, after a hearing in accordance with chapter 91, the utility shall be subject to penalties to be established by the public utilities commission; provided that if the commission determines that the electric utility company is unable to meet the renewable portfolio standards due to reasons beyond the reasonable control of an electric utility, as set forth in subsection (d), the commission, in its discretion, may waive in whole or in part any otherwise applicable penalties.
(d) Events or circumstances that are outside of an electric utility company's reasonable control may include, to the extent the event or circumstance could not be reasonably foreseen and ameliorated:
(1) Weather-related damage; (2) Natural disasters; (3) Mechanical or resource failure; (4) Failure of renewable electrical energy producers to meet contractual obligations to the electric
utility company; (5) Labor strikes or lockouts; (6) Actions of governmental authorities that adversely affect the generation, transmission, or
distribution of renewable electrical energy under contract to an electric utility company; (7) Inability to acquire sufficient renewable electrical energy due to lapsing of tax credits related to
renewable energy development; (8) Inability to obtain permits or land use approvals for renewable electrical energy projects; (9) Inability to acquire sufficient cost-effective renewable electrical energy;

Appendix Page -62-
(10) Substantial limitations, restrictions, or prohibitions on utility renewable electrical energy projects; and
(11) Other events and circumstances of a similar nature. [L 2001, c 272, §3; am L 2004, c 95, §5; am L 2006, c 162, §5; am L 2009, c 155, §3]


Issue Paper #5 Land Use Planning
In Preparation for the Hawaii Statewide Transportation Plan Update
Prepared for Department of Transportation
State of Hawaii
Prepared by SSFM International, Inc. With Group 70 International, Inc.
2011

Hawaii Statewide Transportation Plan Update Issue Paper on Land Use Planning
- i –
Table of Contents Foreword ........................................................................................................................................ 1 Section 1.0 Overview .......................................................................................................................... 3 Section 2.0 Hawaii’s Land Use System................................................................................................. 5
Section 2.1 Formation of Hawaii’s Land Planning and Regulatory System ........................................... 5 Section 2.2 Hawaii Land Use Commission & State Land Use Classifications ......................................... 6 Section 2.3 Hawaii State Plan & Functional Plans................................................................................ 7 Section 2.4 State Agency Planning (HDOT, DHHL, OHA, DLNR, OP) ..................................................... 8
Section 3.0 County General Plans, Community Plans and Zoning ........................................................ 9
Section 3.1 Land Use Planning: City and County of Honolulu .............................................................. 9 Section 3.1.1 City and County of Honolulu: Oahu Island Demographic Trends and Infrastructure ..... 9 Section 3.1.2 City and County Honolulu General Plan and Development Plans ............................... 10 Section 3.1.3 Linking Land Use and State Transportation Facilities on Oahu ................................... 12
Section 3.2 Land Use Planning: County of Maui ................................................................................ 14 Section 3.2.1 County of Maui: Demographic Trends and Infrastructure .......................................... 14 Section 3.2.2 County of Maui: General Plan .................................................................................... 16 Section 3.2.3 Maui Countywide Policy Plan ..................................................................................... 17 Section 3.2.4 Maui Community Development Plans ......................................................................... 18
Section 3.3 Land Use Planning: County of Hawaii ............................................................................. 21 Section 3.3.1 County of Hawaii: Demographic Trends and Infrastructure ........................................ 21
Section 3.3.2 County of Hawaii: General Plan. ................................................................................... 22 Section 3.3.3 County of Hawaii: Community Development Plans .................................................... 22
Section 3.4 Land Use Planning: County of Kauai ............................................................................... 26 Section 3.4.1 County of Kauai: Demographic Trends and Infrastructure .......................................... 26 Section 3.4.2 County of Kauai General Plan .................................................................................... 27 Section 3.4.3 County of Kauai Regional Plans .................................................................................. 27
Section 4.0 Examples of Recent Best Practices in Land Use/Transportation Planning ......................................................................................................................... 29
Section 4.1 Coordinating Transportation, The Environment, and Land Use ....................................... 29 Section 4.2 Visioning and Scenario Planning ..................................................................................... 32
Section 5.0 Land Use Recommendations for the Hawaii State Transportation Plan Update .................................................................................................................... 35 References ...................................................................................................................................... 37

Hawaii Statewide Transportation Plan Update Issue Paper on Land Use Planning
- ii –

Hawaii Statewide Transportation Plan Update Issue Paper on Land Use Planning
- 1 –
Foreword The Hawaii state transportation planning process is being supported by the development of a series of issue papers. Task 7 of the contract requires examination of emerging issues that will have major impacts on Hawaii’s transportation future along with preparation of Issue Papers for each subject. The emerging issues for Hawaii’s transportation were selected by the Hawaii Statewide Transportation Plan Team as issues which may have a significant impact on Hawaii’s residents and their transportation needs. Many emerging issues are associated with the Federal Planning Requirements, changing trends, as well as shifts in public perception. This issue paper addresses the emerging issue of land use planning and transportation. SSFM is the lead consultant for the Hawaii Statewide Transportation Plan (HSTP) Update, and they are supported by a team of consultants. This paper’s partner author is Group 70 International, Incorporated. This “Issue Paper #5 on Land Use Planning” includes sections on:
• Overview • Hawaii’s Land Use System • County General Plans, Community Plans, and Zoning • Recent Trends in Land Use Planning • Recommendations on Land Use Planning for the Hawaii Statewide Transportation Plan
Update (HSTP Update). Issue papers in this series include:
Issue Paper #1: Impact of Federal Planning Requirements (Eight Planning Factors) Issue Paper #2: Climate Change and Sea Level Rise Issue Paper #3: Aging Population and Transportation Issue Paper #4: Fuel and Energy Scenarios for Hawaii Issue Paper #5: Land Use Planning Issue Paper #6: Planning & Design: Context Sensitive Solutions (CSS), Complete
Streets, Smart Growth, and Transit Oriented Development (TOD) Issue Paper #7: Transportation Security Issue Paper #8: System Preservation and Asset Management Issue Paper #9: Financial Scenarios Issue Paper #10: Environmental Coordination

Hawaii Statewide Transportation Plan Update Issue Paper on Land Use Planning
- 2 –

Hawaii Statewide Transportation Plan Update Issue Paper on Land Use Planning
- 3 –
Section 1.0 Overview This Land Use Planning issue paper provides a summary of the major State Land Use Plans and County Land Use plans in Hawaii. The paper also describes the statewide directives for land use and planning, and County-level regional and community development plans. The Counties have launched initiatives toward modern trends in smart growth and sustainable development, which are pertinent to future transportation planning and decision-making. Land use planning in Hawaii emerged during a period of tremendous growth in the islands after Hawaii became a State in 1959. Hawaii evolved from a period where the dominant land use and economy was plantation agriculture to a new dominant land use and economy associated with the visitor industry. Growth of urban areas on Oahu and the neighbor islands led to the institution of zoning regulations. Transportation elements supported and at times drove the direction of new growth. Statewide planning and County-level planning took hold in the 1960s. The Federal Highway Act of 1961 [P.L. 87-61] and the National Housing Act of 1962 [P.L. 87-834] had dramatic effects on transportation in Hawaii, with subsidies for highway expansion projects and public housing. With the formation of the State Land Use Commission, Hawaii distinguished itself as the only state to have both State-level and County-level zoning. County General Plans were adopted in the 1970s, establishing Community Plans for regional land use planning. By the 1980s, the Hawaii visitor industry had replaced agriculture as the leading economic sector. Military presence remained important users of land and contributed to the islands’ economies. Urban expansion created new suburban communities to support a growing workforce, with growing commerce and industrial areas on Oahu and the neighbor islands. Table 1 shows the dramatic thirty years of population growth in Hawaii between 1960-1990, following Statehood in 1959. Oahu, with the major employment and commerce centers, has been the center for this growth. But Hawaii’s neighbor islands have also witnessed increased population and growth in their local economies, creating demands for land area and for transportation services. With growth across the state, there became a growing challenge to provide adequate infrastructure to support urban expansion in multiple locations. Even when Hawaii’s growth rate started to slow in the early 1990s, it became apparent that a disconnection existed between growth and the ability to provide transportation facilities. While community design has largely been defined around automobile use, the necessary level of support infrastructure has been in a constant state of catch-up, with “after-the-fact” improvements. Since the late-90s, land planning in Hawaii has sought to direct growth to centers, and to tie growth with infrastructure improvements.

Hawaii Statewide Transportation Plan Update Issue Paper on Land Use Planning
- 4 –
Table 1: State of Hawaii Population by Decade, 1900-2008
Date Population Pop. Increase % Change 1900 154,000 1910 191,874 37,873 2.2% 1920 255,881 64,007 2.9% 1930 368,300 112,419 3.7% 1940 422,770 54,470 1.4% 1950 499,794 77,024 1.7% 1960 632,772 132,978 2.4% 1970 768,561 135,789 2.0% 1980 964,691 196,130 2.3% 1990 1,108,229 143,538 1.4% 2000 1,211,537 103,308 0.9% 2008 1,288,198 76,661 0.6% Source: State of Hawaii, Department of Business, Economic Development and Tourism. 2009 Databook.
Across the U.S., the trend has been to more closely link land use planning with transportation planning. Urban and suburban area planning have adopted land use plans that rely on multi-modal transportation systems, with infill development and redevelopment where support infrastructure exists. The Hawaii State Transportation Plan Update is an opportunity to further the Land Use- Transportation link in Hawaii by integrating important initiatives such as:
• Linking State and County land use planning with transportation system planning, through Integrated Sub-Regional Area Planning (ISAP).
• Applying Smart Growth and sustainable development principles such as multimodal transportation and form-based zoning codes. This dovetails with many of the County Community Development Plans across the state, while also supporting the Hawaii Clean Energy Initiative to meet the state’s energy needs from 70% clean energy by 2030. The Hawaii Clean Energy Initiative is described in Issue Paper #4 in this series, Fuel and Energy.
• Utilizing geospatial technology in community/stakeholder planning to better envision future land use and transportation scenarios.

Hawaii Statewide Transportation Plan Update Issue Paper on Land Use Planning
- 5 –
Section 2.0 Hawaii’s Land Use System Section 2.1 Formation of Hawaii’s Land Planning and Regulatory System Land tenure systems and early County zoning ordinances guided the use of lands in Hawaii prior to the 1950s. The advent of long-haul jet travel and a budding visitor industry fueled a period of growth for resort tourism, support communities, and general commerce in the islands. Land use planning at the State level emerged in the early 1960s following statehood, to manage urban community growth into the plantation agricultural lands. The evolution of stages in Hawaii’s land use planning and regulatory system from pre-statehood is depicted in Figure 1. Land planning at the County level also emerged in the 1960-1970s with the passage of County General Plan ordinances outlining general policies for growth and management. Community Development Plans (CDP) and Sustainable Community Plans (SCP) followed, providing more specific regional guidance to focus the direction of each island’s urban growth and supporting infrastructure. Figure 1: Evolution of Hawaii’s Land Use Planning
Source: Group 70 International Summaries of State and County land use plans are provided in the following section. Implementation of these broad policy directives and regional plans is tied to decision-making by the land use regulatory system at the State and County levels.

Hawaii Statewide Transportation Plan Update Issue Paper on Land Use Planning
- 6 –
The State Land Use Commission must approve any conversion of Agricultural district lands to the State Urban District. The County Planning Commissions and County Councils are responsible for making land use regulatory decisions on government projects and private sector initiatives. This two-tiered system is unique to Hawaii, providing land use “zoning” decision-making at the broad State policy level and at the local County level. The Counties regulate the more detailed community plan amendments, including use permits, shoreline/special management area use, zoning, and subdivisions. This is reflected in Figure 2. Figure 2: Hawaii Land Use Planning System
Source: Group 70 International
Section 2.2 Hawaii Land Use Commission & State Land Use Classifications The State Land Use Law, HRS Chapter 205 (1961), did two important things. It created the Land Use Commission (LUC) to deliberate and determine when lands can change from one land classification to another, and it placed Hawaii’s land into four broad land classification categories of Urban, Agriculture, Conservation, and Rural. According to The State of Hawaii Data Book (2008), the total area of all classified lands, including inland water, is 4,112,388 acres. Table 2: Classification by State Land Use Commission, Estimated Acreage of Land Use Districts
Urban Conservation Agricultural Rural 197,663 1,973,631 1,930,224 10,870
Source: The State of Hawaii Data Book (2008)

Hawaii Statewide Transportation Plan Update Issue Paper on Land Use Planning
- 7 –
The LUC’s primary role is to regulate new growth across the State and the conversion of land classification from the State Agriculture District to State Urban District. Land uses involving the State Conservation District lands became the responsibility of the Department of Land and Natural Resources. Section 2.3 Hawaii State Plan & Functional Plans The Hawaii State Plan, Chapter 226, Hawaii Revised Statutes (HRS), was first prepared in 1978. It serves as a written guide for the future long-range development of the State. The plan establishes a statewide planning system that provides goals, objectives, and policies that detail priority directions and concerns of the State of Hawaii. It is the goal of the State to achieve a strong, viable economy, characterized by stability, diversity, and growth. The plan seeks to retain the beauty, cleanliness, quiet, stable natural systems, and uniqueness of Hawaii’s physical environment. Another plan goal is to create physical, social, and economic well-being for individuals and families.1 The Hawaii State Plan is intended to guide population growth to be consistent with the achievement of these physical, economic, and social goals. The Hawaii State Plan seeks to foster an understanding of Hawaii’s limited capacity to accommodate population needs, and to address concerns resulting from increasing population. The development and availability of land and water resources is to be planned in a coordinated manner to provide for the desired levels of growth in each geographic area. Increased economic activities and employment opportunities on the neighbor islands is one objective for achieving the goal. The State Plan objectives and policies for the planning and provision of transportation facilities is to support distributed growth.2 To further define the Hawaii State Plan objectives, 12 State Functional Plans were prepared in the 1980’s including: Agriculture, Conservation Land, Employment, Energy, Health, Higher Education, Historic Preservation, Housing, Recreation, Tourism, Transportation and Water Resources. The State Office of Planning provides guidelines for the Functional Plans. The Transportation Functional Plan was last updated in 1991. The Statewide Transportation Plan, HRS 279A-2, was modified in 2009 by the State Legislature to require state planning to “comply with county transportation-related plans; county general plans; and all community, development, or community development plans.”3 The previous law only required “consideration;” now it requires “compliance.”
1 Hawaii Revised Statutes, Chapter 226-3. 2 Hawaii Revised Statutes, Chapter 226-17. 3Act 27, Session Laws of 2009, SB 715, HD1. http://www.capitol.hawaii.gov/session2009/bills/GM640_.PDF

Hawaii Statewide Transportation Plan Update Issue Paper on Land Use Planning
- 8 –
Section 2.4 State Agency Planning (HDOT, DHHL, OHA, DLNR, OP) The State of Hawaii owns over 1.495 million acres, divided into public lands (398,000 acres) and lands set aside to government agencies (758,000 acres), with the remaining lands used for the State Department of Hawaiian Homelands and managed for the Federal Government.4 Hawaii’s State agencies with significant land holdings and major facilities each prepare long-range plans to implement their missions, including:
• Department of Hawaiian Homelands (DHHL) has created individual Island Plans, and specific development plans for community development, which total 203,000 acres.
• Office of Hawaiian Affairs (OHA) has prepared strategic plans for its mission focused on advocacy, research, and asset management with a small land base that includes Waimea Falls on the North Shore of Oahu.
• Department of Land and Natural Resources (DLNR) is responsible for managing and regulating Conservation District lands of Hawaii, which total 1,200,000 acres, and may include lands owned by the Federal Government.
• Office of Planning (OP) conducts comprehensive, long-range, and strategic planning to meet the physical, economic, and social needs. OP prepares Special Plans which address State concerns at a regional level. An example is the West Hawaii Plan (1990).
• Hawaii Department of Transportation (HDOT) has this Hawaii Statewide Transportation Plan as well as Long Range Plans for Airports, Harbors, and Highways. The three transportation modal divisions also produce Facility Master Plans that reflect land use plans and needs on the HDOT premises, including right-of-ways, and needs for abutting lands when expansion of the HDOT facility is necessary.
4 Hawaii State Department of Business, Economic Development & Tourism. The State of Hawaii Data Book. 2008

Hawaii Statewide Transportation Plan Update Issue Paper on Land Use Planning
- 9 –
Section 3.0 County General Plans, Community Plans and Zoning During the past 10 years, the decisions for land use planning and specific land use priorities have progressively shifted away from the large-scale regional plans with supporting transportation elements, guided by the State Office of Planning and Land Use Commission. Instead, the responsibility for detailed planning of the sub-regions and growth nodes on each island has shifted to the various County Planning Departments, Planning Commissions, and County Councils. More recently, it has largely been the Counties that have successfully incorporated multi-modal transportation planning as part of community growth and redevelopment. Each County has adopted a General Plan with objectives and policies for directing growth and land uses. Each County also has regional-level Community Plans, which specify areas for community development, agriculture and open space, and preservation. Integration of land use and transportation planning varies by County across the state. The adopted General Plans and Community Development Plans include Transportation objectives and policies. However, the extent of planning guidance for the land use-transportation linkage, and its application in practice, varies between Counties. The sections below provide brief overviews of each County and their land use policy directives for land use planning. It can be seen that the trends are toward a pattern of directed growth and guiding community development in concert with multi-modal transportation. As of 2010, each of the Counties have adopted “smart growth” initiatives to help foster the land use-transportation connection meant to formulate community development that integrates multi-modal transportation elements. Section 3.1 Land Use Planning: City and County of Honolulu Section 3.1.1 City and County of Honolulu: Oahu Island Demographic Trends and Infrastructure The City and County of Honolulu (C&C of Honolulu) is the center of population, commerce, and government in the State of Hawaii. Approximately 905,000 people live on Oahu (US Census, American Community Survey, 2008), an increase of 3.3% since 2000. On Oahu, growth over the past two decades has been directed to Ewa and Central Oahu, with the emergence of Kapolei, Ewa Beach, Waipio, and Mililani as new urban growth boundaries. There is substantial transportation infrastructure supporting Oahu’s population and commerce, including harbors, airports, and major highways. Honolulu Harbor and Kalaeloa Harbor provide critical links to the US mainland and international suppliers of domestic and commercial goods and fuel supply. Honolulu International Airport and Kalaeloa Airport provide air transportation facilities for major passenger and freight aircraft. Oahu hosts a network of freeways and state highways, which serve population centers and commerce across the island. Oahu’s newest roads are located on Kapolei, including North-South Road, Kapolei Parkway, and the widening of Fort Weaver Road.

Hawaii Statewide Transportation Plan Update Issue Paper on Land Use Planning
- 10 –
Section 3.1.2 City and County Honolulu General Plan and Development Plans For planning purposes, Oahu is divided into eight regions, and each region has either a Development Plan (DP) or a Sustainable Community Plan (SCP). As these plans evolved, they became more flexible and conceptual in prescribing transportation plans and projects. The Oahu Metropolitan Planning Organization (OahuMPO) has helped to coordinate State and County transportation plans for three decades. The County plans have established infrastructure policies and maps that guide their transportation facilities planning in the C&C of Honolulu. Growth on Oahu has followed the pattern established under the General Plan (1977, last amended 2002). Since the mid 1990s, the Ewa/Kapolei region has seen tremendous growth, in keeping with the directed growth policy in the General Plan. Growth patterns in Ewa and Central Oahu create a tension between agricultural land preservation and urban growth as lands previously used for agriculture are rezoned/reclassified for residential and commercial uses. In the next 20 years, these areas are anticipated to continue as the growth areas of the island, along with infill development and redevelopment in Honolulu’s urban center. Future growth continues to be directed to the two Development Plan areas in the Ewa District and the Primary Urban Center as well as one Sustainable Community Plan area for Central Oahu. Stable low growth and preservation of rural landscape is planned for the Sustainable Community Plan areas of the North Shore, Koolau Loa, and Koolau Poko. The Sustainable Community Plan area of Waianae will experience moderate growth, and the East Honolulu area will remain largely stable. The North Shore SCP was recently adopted and updated in May 2011. The growth policy for the C&C of Honolulu is continued infill growth within the Primary Urban Center, full growth of the second city at Kapolei, and moderate growth in the Ewa Plain and Central Oahu. The remaining parts of the island are projected for small or no growth, with the idea that the rural open nature of these areas remains intact. Population guidelines and urban growth boundaries delineate the limits of growth. Figure 3 shows all of the Development Plan and Sustainable Community Plan areas on Oahu, along with State Land Use District Boundaries. Future planning for land use on Oahu is anticipated to follow three broad strategies for directing and shaping growth and redevelopment.
1) Increase Density of Urban Areas. The more dense areas of Oahu include the Primary Urban Center in the greater Honolulu region and the major communities in the East Honolulu, Ewa, Central Oahu, and Koolau Poko Districts. Future growth and redevelopment will focus on more dense concentrations of these communities to focus growth in areas where employment, commerce, public facilities, and infrastructure are available.

Hawaii Statewide Transportation Plan Update Issue Paper on Land Use Planning
- 11 –
Figure 3: Oahu Island and the City and County of Honolulu
Source: Group 70, International
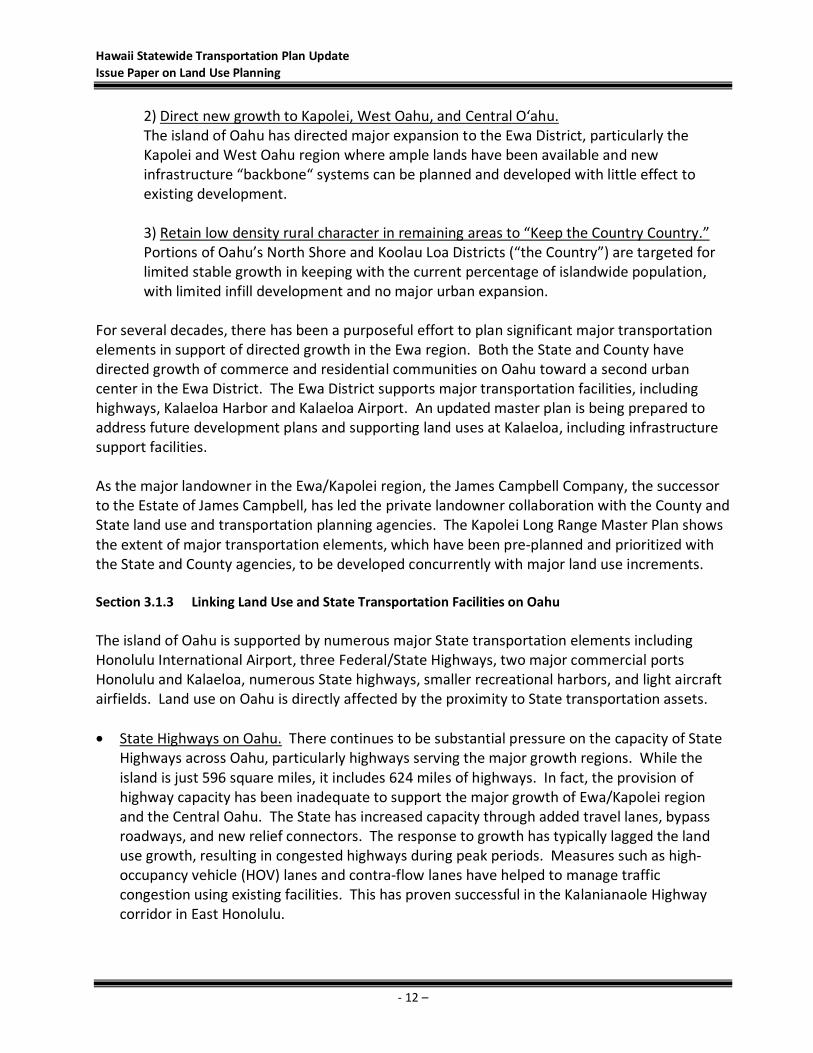
Hawaii Statewide Transportation Plan Update Issue Paper on Land Use Planning
- 12 –
2) Direct new growth to Kapolei, West Oahu, and Central O‘ahu. The island of Oahu has directed major expansion to the Ewa District, particularly the Kapolei and West Oahu region where ample lands have been available and new infrastructure “backbone“ systems can be planned and developed with little effect to existing development. 3) Retain low density rural character in remaining areas to “Keep the Country Country.” Portions of Oahu’s North Shore and Koolau Loa Districts (“the Country”) are targeted for limited stable growth in keeping with the current percentage of islandwide population, with limited infill development and no major urban expansion.
For several decades, there has been a purposeful effort to plan significant major transportation elements in support of directed growth in the Ewa region. Both the State and County have directed growth of commerce and residential communities on Oahu toward a second urban center in the Ewa District. The Ewa District supports major transportation facilities, including highways, Kalaeloa Harbor and Kalaeloa Airport. An updated master plan is being prepared to address future development plans and supporting land uses at Kalaeloa, including infrastructure support facilities. As the major landowner in the Ewa/Kapolei region, the James Campbell Company, the successor to the Estate of James Campbell, has led the private landowner collaboration with the County and State land use and transportation planning agencies. The Kapolei Long Range Master Plan shows the extent of major transportation elements, which have been pre-planned and prioritized with the State and County agencies, to be developed concurrently with major land use increments. Section 3.1.3 Linking Land Use and State Transportation Facilities on Oahu The island of Oahu is supported by numerous major State transportation elements including Honolulu International Airport, three Federal/State Highways, two major commercial ports Honolulu and Kalaeloa, numerous State highways, smaller recreational harbors, and light aircraft airfields. Land use on Oahu is directly affected by the proximity to State transportation assets. • State Highways on Oahu. There continues to be substantial pressure on the capacity of State
Highways across Oahu, particularly highways serving the major growth regions. While the island is just 596 square miles, it includes 624 miles of highways. In fact, the provision of highway capacity has been inadequate to support the major growth of Ewa/Kapolei region and the Central Oahu. The State has increased capacity through added travel lanes, bypass roadways, and new relief connectors. The response to growth has typically lagged the land use growth, resulting in congested highways during peak periods. Measures such as high-occupancy vehicle (HOV) lanes and contra-flow lanes have helped to manage traffic congestion using existing facilities. This has proven successful in the Kalanianaole Highway corridor in East Honolulu.

Hawaii Statewide Transportation Plan Update Issue Paper on Land Use Planning
- 13 –
Over the long-term, new highway capacity will be needed to serve continued growth of the urban centers of Oahu, and the communities feeding traffic into the system. Pressures on State Highways in slow growth/no growth SCP regions of Oahu have been isolated to congestion areas. Specific localized improvements such as bypasses have helped the Haleiwa/North Shore region. A second access route is being considered to relieve highway congestion in Waianae and prevent community isolation when Farrington Highway is impassible due to accidents, water main breaks, or natural disasters. The greatest challenges to highway capacity expansion in urban areas on Oahu is the lack of open land, the high cost of land, and the disruptions to traffic flow caused by major facility upgrades.
• State Airports on Oahu. There are substantial land areas directly related to air transportation on Oahu, particularly surrounding Honolulu International Airport. Encompassing some 2200 acres, the Honolulu International Airport is the largest and busiest airport in the state. The Airport also supports joint use by military aircraft stationed at Joint Base Hickam-Pearl Harbor. The future growth and improvement of facilities at Honolulu International Airport are planned to support the State’s primary passenger and air cargo facilities. The provision of convenient, safe, and efficient passenger jet air travel is one of the essential factors supporting the future of Hawaii’s visitor industry. Lands surrounding the airport are largely light industrial, allowing for much greater density of development. Future growth in passenger and cargo traffic to and from Hawaii can be supported by expanded utilization of the light industrial lands surrounding and nearby the airport. Another consideration for land use planning at all airports statewide is that the land use must be compatible with the noise and hazards resulting from flights landing and taking off from the airport. The Reference section lists several Federal Aviation Administration Advisory Circulars related to land use planning at airports. The Airports Division prepares recommended land use maps for activities that are compatible with airport operations, and these maps are provided to planning agencies in every county so that appropriate zones of development may be designated. Other airports and airfields are primarily related to military installations on Oahu. Kalaeloa Airfield (former NAS Barbers Point) supports the Hawaii Air National Guard, US Coast Guard, and general aviation. Wheeler Army Airfield supports the US Army helicopter group and C-130 aircraft. Marine Corp Base Hawaii Kaneohe is another major military airfield on Oahu that supports a range of mission support aircraft. Dillingham Airfield in Mokuleia is a small airfield used for general aviation, including gliders and parachuting. For the most part, these installations are not planned for expansion beyond their current boundaries. However, the strong military presence on Oahu remains the second most important economic sector on the island.

Hawaii Statewide Transportation Plan Update Issue Paper on Land Use Planning
- 14 –
• State Harbors on Oahu. Lands associated with the major harbors on Oahu are important variables in the future of Hawaii. Honolulu Harbor accommodates the majority of cargo inbound to Hawaii, with trans-shipment to neighbor islands via container barge, handling over 8 million short tons of cargo annually. Honolulu Harbor also services cruise ship stopovers. Honolulu Harbor is located just three miles west of Honolulu International Airport and includes over 200 acres of container yards with 53 piers. The recently approved Harbors Modernization Plan includes development of the former Kapalama Military Reservation (KMR) near Sand Island, which borders Honolulu Harbor. This includes the construction of a Kapalama container deep draft wharf with berthing capacity to accommodate two container ships as well as the development of a new 70-acre container yard at KMR. Kalaeloa Harbor provides for cargo operations, handling energy and agricultural products and is the second busiest harbor in the state. The future expansion of Kalaeloa is important to State plans for reducing Hawaii’s dependence on fossil fuel energy sources. The Harbors Modernization Plan includes construction of a Kalaeloa West Harbor utilities infrastructure and a new dedicated fuel pier. Nearby Pearl Harbor is home to the US Navy Pacific Fleet. Disposition of underutilized lands of the US Navy located around Pearl Harbor also provide opportunities for future growth and redevelopment.
• Public Transit. Oahu has the most developed public transit system in the state, with an
extensive and coordinated bus system (TheBus). The next stage in mass transit is the planned Honolulu Rapid Transit system. After numerous attempts spanning three decades, this project is proceeding with planning and design. Approval was granted in 2008 for the transit route for a fixed rail system extending from Kapolei to Ala Moana Center. Engineering design has started. The timetable for completion of the first phase is 2014, with full system completion by 2023. Transit-Oriented Development (TOD) opportunities along the transit corridor will be extensive, highlighting the linkage of proper planning for land use and other transportation modes tied to the transit stations along with related development.
Section 3.2 Land Use Planning: County of Maui Section 3.2.1 County of Maui: Demographic Trends and Infrastructure Maui County has a population of approximately 143,500 (US Census, American Community Survey, 2008) and has experienced 12% growth since 2000. Maui directed much of its residential growth toward the Wailuku and Kahului regions. Residential Resort growth was directed to
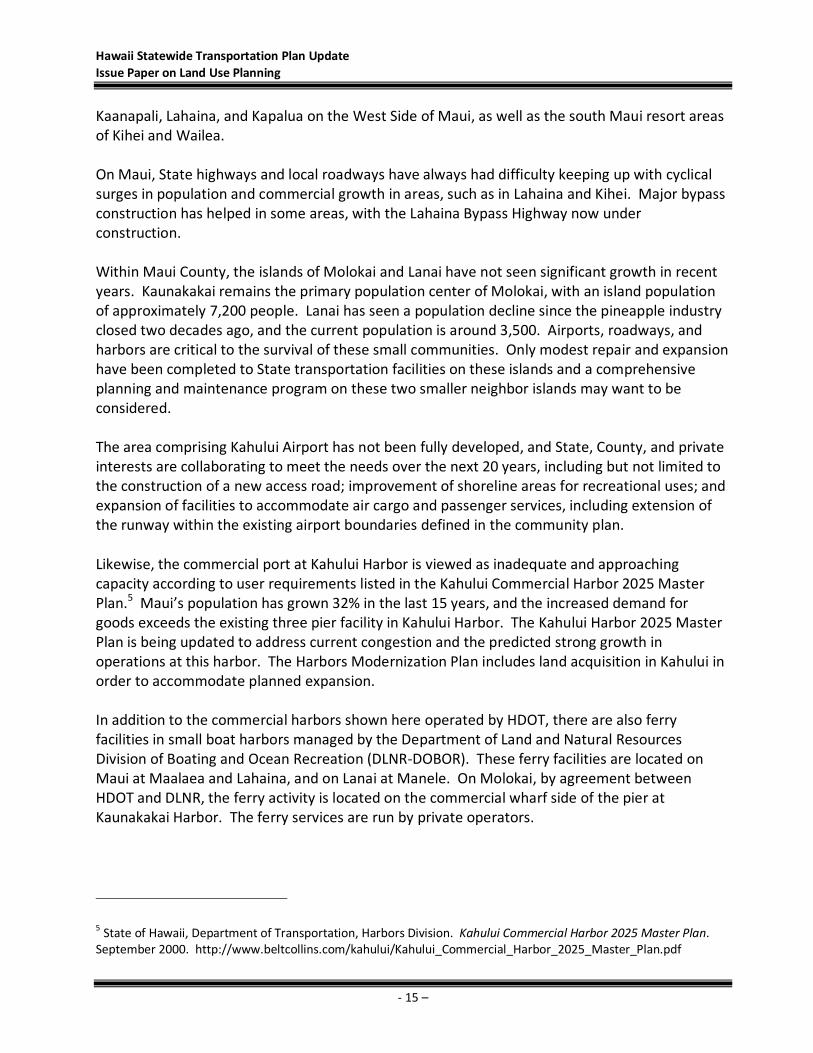
Hawaii Statewide Transportation Plan Update Issue Paper on Land Use Planning
- 15 –
Kaanapali, Lahaina, and Kapalua on the West Side of Maui, as well as the south Maui resort areas of Kihei and Wailea. On Maui, State highways and local roadways have always had difficulty keeping up with cyclical surges in population and commercial growth in areas, such as in Lahaina and Kihei. Major bypass construction has helped in some areas, with the Lahaina Bypass Highway now under construction. Within Maui County, the islands of Molokai and Lanai have not seen significant growth in recent years. Kaunakakai remains the primary population center of Molokai, with an island population of approximately 7,200 people. Lanai has seen a population decline since the pineapple industry closed two decades ago, and the current population is around 3,500. Airports, roadways, and harbors are critical to the survival of these small communities. Only modest repair and expansion have been completed to State transportation facilities on these islands and a comprehensive planning and maintenance program on these two smaller neighbor islands may want to be considered. The area comprising Kahului Airport has not been fully developed, and State, County, and private interests are collaborating to meet the needs over the next 20 years, including but not limited to the construction of a new access road; improvement of shoreline areas for recreational uses; and expansion of facilities to accommodate air cargo and passenger services, including extension of the runway within the existing airport boundaries defined in the community plan. Likewise, the commercial port at Kahului Harbor is viewed as inadequate and approaching capacity according to user requirements listed in the Kahului Commercial Harbor 2025 Master Plan.5 Maui’s population has grown 32% in the last 15 years, and the increased demand for goods exceeds the existing three pier facility in Kahului Harbor. The Kahului Harbor 2025 Master Plan is being updated to address current congestion and the predicted strong growth in operations at this harbor. The Harbors Modernization Plan includes land acquisition in Kahului in order to accommodate planned expansion. In addition to the commercial harbors shown here operated by HDOT, there are also ferry facilities in small boat harbors managed by the Department of Land and Natural Resources Division of Boating and Ocean Recreation (DLNR-DOBOR). These ferry facilities are located on Maui at Maalaea and Lahaina, and on Lanai at Manele. On Molokai, by agreement between HDOT and DLNR, the ferry activity is located on the commercial wharf side of the pier at Kaunakakai Harbor. The ferry services are run by private operators.
5 State of Hawaii, Department of Transportation, Harbors Division. Kahului Commercial Harbor 2025 Master Plan. September 2000. http://www.beltcollins.com/kahului/Kahului_Commercial_Harbor_2025_Master_Plan.pdf

Hawaii Statewide Transportation Plan Update Issue Paper on Land Use Planning
- 16 –
Section 3.2.2 County of Maui: General Plan Maui County's current General Plan was adopted in 1991. The Maui County Charter requires that the General Plan shall recognize and state the major problems and opportunities concerning the needs and the development of the County and the social, economic and environmental effects of such development and shall set forth the desired sequence, patterns, and characteristics of future development. The Maui County General Plan is currently under review for a forecast year of 2030. Maui County defines the General Plan as a term for a bundle of plan documents that guide future growth and policy direction in the County. The Countywide Policy Plan is the first component of the decennial General Plan update. A further component, the Maui Island Plan, provides a guide for the future growth of the island to the year 2030 and is the second component of the decennial General Plan update. The Maui Island Plan establishes a vision and a set of long-range guiding principles, goals, objectives, policies, and maps to guide the growth and development of the island. The Maui Island Plan will also be used to communicate Maui’s policies for its future to the State as a basis for coordinating land use, open space, transportation and other issues.6 The 2030 Maui County General Plan has five major themes, including:
1. Protect Maui County’s Agricultural Land and Rural Identity. 2. Provide a Directed and Managed Growth Plan. 3. Protect Maui County’s Shoreline and Limit Visitor Industry Growth. 4. Maintain a Viable Economy That Offers Diverse Employment Opportunities for Residents. 5. Provide for Needed Residential Housing.
Figure 4 on the following page shows how all the different plan documents integrate into Maui County’s General Plan.
6 Maui County, Planning Department. Director’s Report of Findings. October 2009. http://www.co.maui.hi.us/documents/Planning/Long%20Range%20Division/General%20Plan%202030/Director's%20Report%20Oct%202009/directors%20report.PDF

Hawaii Statewide Transportation Plan Update Issue Paper on Land Use Planning
- 17 –
Figure 4: Maui County General Plan Documents
Source: Maui County General Plan 2030, Countywide Policy Plan, Figure 1
Section 3.2.3 Maui Countywide Policy Plan
The Countywide Policy Plan is the first component of the decennial General Plan update and it was adopted by the Maui County Council on March 19, 2010. The General Plan process was modified to require that the Countywide Policy Plan be prepared first. The Countywide Policy Plan acts as an over-arching values statement and provides a policy framework for the Maui Island Plan and nine Community Plans. This Plan provides broad goals, objectives, policies, and implementing actions that portray the desired direction of the County's future.
This includes: 1. A vision statement and core values for the County to the year 2030; 2. An explanation of the plan-making process;
3. A description and background information regarding Maui County today; 4. Identification of guiding principles; and
5. A list of countywide goals, objectives, policies, and implementing actions related to the following core themes: • Protect the Natural Environment
• Preserve Local Cultures and Traditions • Improve Education
• Strengthen Social and Healthcare Services • Expand Housing Opportunities for Residents
• Strengthen the Local Economy • Improve Parks and Public Facilities
• Diversify Transportation Options • Improve Physical Infrastructure
• Promote Sustainable Land Use and Growth Management • Strive for Good Governance.7
7 County of Maui Planning Department, <www.co.maui.hi.us/index.aspx?NID=420>

Hawaii Statewide Transportation Plan Update Issue Paper on Land Use Planning
- 18 –
Section 3.2.4 Maui Community Development Plans Maui’s nine Community Development Plans (CDPs) provide community plan text and land use matrices adopted by the Maui County Council which address goals, objectives, policies, and implementing actions for each district. The CDPs address Land Use, Environment, Economic Activity, Cultural Resources, Housing, Urban Design, Infrastructure, Social Infrastructure, and Government. The nine CDPs include: Kihei-Makena, Paia-Haiku, Wailuku-Kahului, Makawao-Kula-Pukalani, Hana, West Maui, Lanai, Molokai, and Kahoolawe and are outlined in Figure 5. Maui’s Community Development Plans are scheduled for periodic updates to address the evolving needs of each sector of the island. Community Development Plan updates are completed for the Kihei-Makena, Paia-Haiku, Wailuku-Kahului, Makawao-Pukalani-Kula, Hana, and West Maui Districts. To implement the Community Plan, the County intends to act on recommendations of the Department of Transportation’s Maui Long Range Planning Study: Island-wide Plan and other traffic master plans. Major improvements to the regional roadway network are called for in the Kihei-Wailea District, Makawao-Pukalani-Kula District, and the West Maui District. The CDPs for the growth areas of Maui provide good examples of integrated land use and transportation planning at the county level. Maui County was a leader among neighbor islands in advancing the principles of clustered growth and higher density in centers. The 2002 Wailuku-Kahului CDP provides specific objectives for transportation and land use relationships. Kahului serves as the transportation center of and gateway to the Island of Maui. Kahului Airport is the island’s primary airport facility, while Kahului Harbor serves as the island’s only commercial harbor. Both of these facilities are the economic lifeline to Maui.

Hawaii Statewide Transportation Plan Update Issue Paper on Land Use Planning
- 19 –
Figure 5: County of Maui, Including the Islands of Maui, Molokai, and Lanai
Source: Group 70, International

Hawaii Statewide Transportation Plan Update Issue Paper on Land Use Planning
- 20 –
The roadway system needs to be upgraded for current and future traffic needs. Major problems include the lack of alternate routes between Wailuku and Kahului. It is also noted that the region is too automobile-dependent and that alternative public mass transit needs to be considered. Maui recognized the importance of the island-wide transportation system in the Wailuku-Kahului planning region. Because of the region’s central location, primary commercial harbor, and airport facilities, major commercial, industrial, and public facilities and role as the civic and commercial/industrial hub of Maui Island, Wailuku-Kahului is a major service and employment center for outlying communities. The transportation network that links the Wailuku-Kahului region to outlying regions has major implications on commerce and the qualitative aspects of the region’s urban environment. The Wailuku-Kahului CDP specifies that public facility and county infrastructure improvements should not lag behind development in the region. The Maui County Council adoption of the CDP requires that adequate facilities and infrastructure will be concurrent with future development. Further objectives of the CDP include:
• Support the extension of the Kahului Airport runway, access road improvements, and other related facility improvements, including expansion of the adjacent shoreline area for public park uses;
• Support the expansion of Kahului Harbor, the island’s primary commercial harbor, to accommodate long-term needs;
• Support the investigation of alternative sites for a second commercial harbor facility on the island of Maui;
• Encourage the mitigation of traffic impacts prior to or in conjunction with the Harbor expansion;
• Provide alternative and bypass routes for vehicular traffic, possibly including a direct route to Kahului Airport; and
• Acquire pockets of land for more efficient facility location within Kahului Harbor. In the West Maui District, the Community Development Plan addresses opportunities for Bypass roadways along with connectivity initiatives. The Lahaina Bypass Highway represents a more recent example of collaborative County/State planning to address current and future land use and transportation needs. The Lahaina Bypass will help solve a critical traffic congestion problem in this region, and provide much greater connectivity for mauka lands and logical future community growth. The project has been refined for environmental and community development factors through community planning process. The future interconnections with the County roadway network will help concentrate development density within the designated growth areas in the West Maui region.

Hawaii Statewide Transportation Plan Update Issue Paper on Land Use Planning
- 21 –
Section 3.3 Land Use Planning: County of Hawaii Section 3.3.1 County of Hawaii: Demographic Trends and Infrastructure Hawaii County (“the Big Island”) has grown to support a population of approximately 175,700 (US Census, 2008). It experienced a substantial 18.2% growth rate since 2000. The Kailua-Kona area and the Kona/Kohala Coast resorts have seen the largest growth areas on Hawaii Island along with the Waimea area. West Hawaii development in the Kona area has been mostly a sprawling, scattered pattern, without well-planned roadway interconnections. Hilo remains the primary area of urban concentration on the East side and serves as the seat of County government. Over the last two decades, West Hawaii has seen tremendous growth, including areas from Kealakekua to South Kohala. The Puna district has also seen tremendous growth in population, and more recently, the Hilo area has witnessed some growth. The Big Island is home to 1,578 miles of state and county highways and streets, according to the DOT Highways Division. The current Hawaii Long Range Land Transportation Plan (LRLTP) written in 1998 acknowledges the future growth of Big Island residents and visitors alike and recognizes the need for widening of major highways such as Queen Kaahumanu Highway on the West side of the island and Hawaii Belt Road on the East side of the island. The Hawaii LRLTP is now being updated by the DOT Highways Division. The Big Island has two commercial airports, Hilo International Airport and Kona International Airport, placed on either side of the island. According to the DOT Airports Division, Kona International Airport is the state’s third busiest airport in passengers while the Hilo International Airport is the state’s third busiest airport in terms of cargo. The Hawaii Airports Modernization Program includes parking lot expansions at Kona International Airport and the Keaukaha Homes Noise Attenuation Project adjacent to Hilo International Airport. The island also has two general aviation airports at Waimea-Kohala Airport and Upolu Airport, both located at the Northwest part of the island. Waimea-Kohala Airport is located about one mile Southwest of the town of Kamuela and services commercial flights, air taxis, and military flights. Upolu Airport services less than 800 annual operations and was originally constructed by the Army before being turned over to the Territory of Hawaii in 1930. The Big Island also has two commercial harbors: Hilo Harbor on the East side of the island and Kawaihae Harbor on the West side of the island. A combined master plan for both harbor systems is currently being updated to the year 2035. Both ports bring significant cargo volume to the island, reported at 2.782 million tons in 2008 by the Hawaii State Data Book. Hilo Harbor also brings passenger cruises and visitors to the island, while cruise ships dock outside of Kona and use a tender to shuttle visitors to Kailua-Kona Town. The Master Plan will help to guide the DOT Harbors Division in expanding these two very important ports. The Harbors Modernization

Hawaii Statewide Transportation Plan Update Issue Paper on Land Use Planning
- 22 –
Section 3.3.2 County of Hawaii: General Plan The General Plan (adopted in 2005, as amended) is a policy document for the long-range comprehensive development of the island of Hawaii. The General Plan provides the direction for the future growth of the County. It brings into focus the relationship between residents and their pursuits and institutions, offering policy statements which embody the expressed goals for present and future generations. The General Plan is subject to periodic reviews at approximately 10-year intervals. Included in the General Plan is the Land Use Pattern Allocation Maps (LUPAG), which designates land use. The County’s goals and policies for “Transportation – Roadways” direct the County to integrate planning efforts with the State. Key excerpts include:
• Provide an integrated State and County transportation system so that new major routes will complement and encourage proposed land policies.
• Investigate various methods of funding road improvements, including private sector participation, to meet the growing transportation needs of the island.
• Coordinate with appropriate Federal and State agencies for the funding of transportation projects for areas of anticipated growth.
• Consider the development of alternative means of transportation, such as mass transit, bicycle, and pedestrian systems, as a means to increase arterial capacity.
• Coordinated planning of Federal, State, and County street systems to meet program goals of the other elements such as historic, recreational, environmental quality, and land use.
• Encourage the State Department of Transportation to establish special scenic routes within and between communities.
• Explore means and opportunities to enhance the shared use of the island’s roadways by pedestrians and bicyclists, in coordination with appropriate government agencies and organizations.
• Develop a roadway network circulation plan in cooperation with the State Department of Transportation and affected communities.
• Working with the State to facilitate widening of highways • Developing mid-level connector roadways to spread traffic, service development more
directly, and ease the burden on the State highway facilities.
Section 3.3.3 County of Hawaii: Community Development Plans
The County of Hawaii has been preparing 6 Community Development Plans (CDP). Four of the CDP have been adopted: Kona, North Kohala, South Kohala, and Puna. Planning for the other two moku, Kau and Hamakua, is currently underway.
These regional plans provide greater detail on preferred community development patterns, and provide a guide for transportation planning by including conceptual arterial and collector streets, as well as transit lines, stops, Transit-Oriented Development (TOD) concepts, and other latest trends in good planning practice. Future transportation facilities will use the plans as a baseline for planning.

Hawaii Statewide Transportation Plan Update Issue Paper on Land Use Planning
- 23 –
Figure 6: County of Hawaii, Island of Hawaii
Source: Group 70, International

Hawaii Statewide Transportation Plan Update Issue Paper on Land Use Planning
- 24 –
The Kona Community Development Plan was adopted by the Hawaii County Council in 2008. The Kona CDP provides a policy context for the County to determine how it should distribute funds, pass laws, govern development, provide roads and public facilities, and generally make decisions. The plan reflects a thoughtful and detailed roadmap to address existing deficiencies and proactively support and guide future growth within designated areas and in a sustainable manner honoring the culture and environment of Kona. This is to be accomplished through coordination between the community, government, and developers. The planning process for the development of the Kona CDP provided forums for gathering and articulating the community’s vision for the future development of the Kona area. After well over a hundred small group meetings, charrettes and workshops, the Kona CDP is an articulation of residents’ visions for the community. To achieve this vision, guiding principles were established, including transportation principles (excerpts):
• Direct future growth patterns toward compact villages, preserving Kona's rural, diverse, and historical character.
Compact villages offer increased density and mixture of homes, shops, and places to work. Rural character should be low density, and remain rural, with growth directed around existing villages and towns.
• Provide connectivity and transportation choices. Future growth should connect communities with sidewalks, trails, and bike lanes. A public transportation
system should have comfortable and frequent service to key destinations, along prominent commuter routes, with connections to alternative modes of transportation.
• Provide infrastructure and essential facilities concurrent with growth. Future growth should occur where infrastructure (roads and utilities) and essential facilities (i.e. police, fire,
and schools) are in place.
The Kona CDP introduced Transit-Oriented Development (TOD) to the island of Hawaii. New communities are planned as compact, walkable and mixed-use communities oriented around “pedestrian sheds” roughly equivalent to a five-minute walking radius from core elements, which would integrate housing, employment, shopping, and recreation opportunities. These new communities support the expanded transit system by providing a transit-oriented development centered on bus stops located along major collectors and new mid-level roadways. New communities include a network of interconnected streets and linked pedestrian trails, which are public spaces that enhance quality of life. Hawaii County plans for mid-elevation roadways and a series of TOD villages supporting the long-term growth of the Kona community. The Kona CDP is a new direction for integrated land use/transportation planning. The successful application of the Kona CDP will be replicated in growth corridors across the state. TOD Village Master Plans at Keahuolu and Honokohau are mixed-use developments integrating a wide range of housing densities following form-based code and LEED neighborhood design principles. These projects demonstrate the integration of land use and transportation planning in a neighbor island context. These projects possess multi-modal transportation components along the planned transit corridor (bus system), following smart-growth principles, with a concentration of development density, and links between economic development, community development and transportation.

Hawaii Statewide Transportation Plan Update Issue Paper on Land Use Planning
- 25 –
The Puna CDP was approved in June 2008 and amended in November 2010, with the primary focus on preserving and respecting the natural, historic, and cultural features of Puna. Growth Management addresses how the future pattern of human settlement and land use should be shaped to support the desired quality of life for Puna residents. The goals, objectives, and implementing actions under this theme address the land use pattern; agricultural and economic development; public services, social services and housing; parks and recreation and renewable energy and energy efficiency. Transportation planning for the Puna CDP focuses on sustainable approaches to transportation. The goals, objectives, and implementing actions address mass transit, alternative travel modes, travel demand management, roadway connectivity, and safety. The North Kohala CDP was approved in November 2008, with the major focus being growth management, public access, affordable housing, infrastructure, and public facilities. Planning for transportation infrastructure addresses the need for improvements of many of the roads within the district at the northern tip of Hawaii Island. Deferred maintenance of County Roads needs to be addressed. Of primary concern is the need to open another road around areas that are prone to closure in the event of a natural disaster, such as flooding or a landslide. Specifically, Pratt Road was identified as a possible emergency bypass route around Hawi (Alalae) and Kapaau (Halaula), in the event that Akoni Pule Highway was closed. In addition, the community has identified existing gulch crossings from Halaula to Pololu as needing bypass routes in times of emergency. The North Kohala CDP Action Committee was formed in September 2009 and meets monthly to report on the implementation activities occurring in the community. South Kohala CDP was approved in November 2008. This plan covers the communities of Waimea, Waikoloa, Kawaihae, and Puako as well as major transportation corridors that connect this region. Four issue areas addressed include Preserve Culture/Sense of Place, Transportation, Emergency Preparedness, and Environmental Stewardship/Sustainability. The South Kohala CDP also formed an Action Committee in 2009. The key element of the Waimea Town Plan is a Responsible Growth policy intended to preserve Waimea’s sense of place. In the Waikoloa Village Plan, the key element of the plan calls for the provision of adequate infrastructure and public services for a growing community. The Kawaihae Community Plan calls for a balance of recreational, commercial, residential, and industrial uses around the harbor area and the restoration of marine waters of Pelekane Bay. In the Puako Community Plan, the plan addresses strategies to manage growth, mitigate the impacts of natural disasters to the community, and also to preserve the near shore marine water quality. Current and future road projects include: Parker Ranch Connector Road, Lindsey Road Extension, Lalamilo Connector Road, Waiaka Bridge and Intersection Replacement Project, Lindsey Road Bridge Replacement Project, Waimea Bypass Road, Kawaihae Road Bypass, and Waimea Trails and Greenways.

Hawaii Statewide Transportation Plan Update Issue Paper on Land Use Planning
- 26 –
Section 3.4 Land Use Planning: County of Kauai Section 3.4.1 County of Kauai: Demographic Trends and Infrastructure The County of Kauai supports a population of approximately 63,700 (US Census 2008). The population grew 8.9% since 2000. Kauai’s growth has been tempered by a general preference for slow growth, and centering its population and commercial center in Lihue. Beyond the Lihue-Hanamaulu center, residential growth on Kauai has been limited in the Wailua-Kapaa area and the Poipu-Koloa region. Resort-related growth has also been focused to discrete areas of Poipu, Kapaa, and Princeville. Plantation agriculture shaped the character of Kauai for many generations, and changes have been contentious. Kauai suffered a long period of stress after Hurricane Iniki in 1992, and recovery took almost a decade before things returned to normalcy. The shift into the visitor industry and local service industries has been difficult for Kauai’s economy. Projections into the next 20 years are for continued growth in Līhu‘e as well as the primary resort areas. Conversion of large areas of agricultural lands from sugar plantation is underway, with cultivation of a wide range of diversified crops, seed crops, and biofuel crops. Lihue Airport is the central facility for both passenger and air cargo traffic. The Lihue-Hanamaulu Community Plan supports long-term growth of lands surrounding the Airport for supporting light industrial and commercial uses. Port Allen Airport is a general aviation facility located one mile southwest of the town of Hanapepe, on the south shore. Originally constructed by the Army, it accommodates small aircraft operations, servicing just over 5,000 passengers per year. 8 This airport is near Port Allen Harbor, which was the major port of entry on Kauai until Nawiliwili Harbor was constructed in 1930. Nawiliwili Harbor accommodates cruise ship stopovers and cargo operations. The lands surrounding the harbor are limited for expansion of long-term function of the Harbor for cargo operations and cruise ship visits. Kuhio Highway is the primary State highway serving the island of Kauai, much of it limited to two lanes. From Lihue town, Kuhio Highway extends to the west past Waimea, north to Wailua, Kapaa, Kilauea, and Hanalei. Community Plans address major roadway corridors, including plans for potential new roadways. Bypass highways are planned in several locations to ease the current traffic conditions. Highway capacity improvements serving State Highways on Kauai have lagged the pace of island-wide traffic growth. The worst conditions have developed in the Kapaa-Waialua corridor of Kuhio Highway. A similar highway capacity issue affects the Koloa-Poipu Corridor. Highway widening and Bypass options have been explored, and some modest improvements are currently underway. Bypass roadways have been proposed to relieve congestion; however, land use planning for growth along Bypass roadway corridors has not been fully contemplated. 8 State of Hawaii Department of Transportation. Statewide Airport System Plan, Executive Summary Honolulu, Hawaii. 1997.

Hawaii Statewide Transportation Plan Update Issue Paper on Land Use Planning
- 27 –
Section 3.4.2 County of Kauai General Plan The General Plan for the County of Kauai was last updated in 2000. The General Plan states the County’s vision for Kauai and establishes strategies for achieving that vision. Kauai’s General Plan establishes the policy framework for land use and future growth. Within that framework, enhancing Kauai’s towns and urban centers and directing new development to towns and urban centers are equally as important as maintaining open space between towns. Rather than allowing development to sprawl along Kauai’s main roads, the intent is to focus development in a way that supports Urban Centers and Town Centers, while allowing the existing, outlying Residential Communities and Agricultural Communities to build out. Section 3.4.3 County of Kauai Regional Plans Within the context of the General Plan, the Kauai County has addressed regional growth areas with detailed planning studies. Specific land use maps in the General Plan address Kawaihau (Wailua to Anahola), Koloa (Port Allen to Poipu), Lihue (Puhi to Wailua), West Kauai (Port Allen to Kekaha) and North Shore. The East Kauai 2030 Plan is the most recent program to be undertaken, reflecting the growth pressures along the coastal communities between Lihue Town and Kapaa. The focus of development and growth on Kauai is directed toward the Lihue urban center of the island. In conjunction with long-range plans of Grove Farm, a sustainable urban center Wailani is planned as the next phase of urban development for Lihue. Limited-scale town center growth is focused at other centers on the island, including Princeville resort, Kilauea, Kapaa-Waialua, Koloa-Poipu resort area, Waimea town, and Hanapepe. Infill development and smart growth policies are intended to facilitate compact country-town centers that retain the unique character of Kauai. The Kauai Long-Range Land Transportation Plan (May 1997) addressed road improvements that would be needed under future growth scenarios. New facilities are needed in the Waimea to Port Allen Area, Port Allen to Poipu Area, Poipu to Lihue Area, Lihue Area, and Kapaa Area. General Plan policies concerning rural character, preservation of historic and scenic resources, and scenic roadway corridors are part of the criteria for long-range highway planning and design. The goal of efficient movement of through traffic should be weighed against community goals and policies relating to community character, livability, and natural beauty. The plan calls for reserving corridors for future roadways as shown on the General Plan Land Use Map. The corridors are conceptual only and are subject to environmental assessment and evaluation of alternative alignments. Plans for the expansion of the County’s bus service and bikeways are integrated in the County’s long-term plans for multi-modal transportation.

Hawaii Statewide Transportation Plan Update Issue Paper on Land Use Planning
- 28 –
Figure 7: County of Kauai, Island of Kauai
Source: Group 70, International

Hawaii Statewide Transportation Plan Update Issue Paper on Land Use Planning
- 29 –
Section 4.0 Examples of Recent Best Practices in Land Use/Transportation Planning
In this section, the issue paper examines two best practices for integration of land use and transportation planning models. These two practices that could be of value in Hawaii are:
• Coordinating Transportation, Environment, and Land Use: Integrated Sub-Regional Area Planning (ISAP).
• Visioning and scenario planning using geospatial technologies. The following sections provide summary overview of the essential elements of these examples and highlights their potential application in Hawaii transportation and land use planning. Section 4.1 Coordinating Transportation, The Environment, and Land Use
Other states have been actively developing processes to link transportation, the environment and land use. Two processes are described in Issue Paper #10 in this series, Environmental Coordination of Rules and Regulations. The Linking Planning and the National Environmental Protection Act (NEPA) (LPN) Process in Colorado and the Washington State DOT Program, “Reinventing NEPA,” both demonstrate the value of integrating data analyses and products gathered during the transportation planning process into the project level environmental review process. Colorado’s LPN Process joins its Long Range Plan, State Transportation Improvement Program (STIP), Project Initiation, and NEPA Process. The Long Range Plan and STIP, which are required by Federal Law, set transportation direction and guide decisions. The Long Range Plan describes a vision of the preferred transportation system, and policies for achieving the highest-priority components of the vision. Project Initiation requires entering the environmental assessment (often NEPA). Under LPN, the results of the transportation planning process feed into the NEPA process. Colorado DOT has determined that LPN is very effective in increasing the amount of information available for complex decisions made at the sub-area planning level. A similar integrated environmental and transportation sub-regional area planning process is recommended for Hawaii, and it is termed Integrated Sub-Regional Area Planning or ISAP. ISAP can be especially helpful in areas of high growth and/or with environmentally sensitive areas which have resource constraints. An ISAP area would ideally have the three major modes of transportation: Airports, Harbors, and Highways/Transit, and the planning process would include intermodal connections between all of them. Figure 8 depicts Integrated Sub-Regional Area Planning as a sequential process. Starting at the top of the diagram is the coordination of transportation and land use. Sub-areas are identified for the next step – the visioning process. An impact analysis is then conducted for each sub-area. Finally, mitigation opportunities are identified. The information and analyses from each step in

Hawaii Statewide Transportation Plan Update Issue Paper on Land Use Planning
- 30 –
an ISAP process would then be used in project-specific EA or EIS that contribute towards implementing the vision. Figure 8: Coordinating Transportation and Land Use Through Integrated Sub-Regional Area Planning
Source: Weslin Incorporated
Candidate locations for Integrated Sub-Regional Area Planning in the State of Hawaii include9:
• Lihue Area on Kauai, encompassing Lihue Airport, Nawiliwili Harbor and Kapule Highway. • West Oahu, including Kalaeloa Airport, Kalaeloa Harbor and H-1. • Honolulu Airport and Honolulu Harbor on Oahu, including Sand Island Access Road, from
along Nimitz Highway through Ala Moana Boulevard, and ending at Ward Avenue. • Kahului on Maui, encompassing Kahului Airport, Kahului Harbor, and Hāna Highway. • Kona Area on the Big Island of Hawaii, including Kona International Airport, Kawaihae
Harbor, and Queen Kaahumanu Highway as depicted in Figure 9. • Hilo Area on the Big Island of Hawaii, including Hilo Harbor and Bayfront Highway.
9 These Candidate ISAP locations are discussed in HSTP Volume 1, Chapter IV.
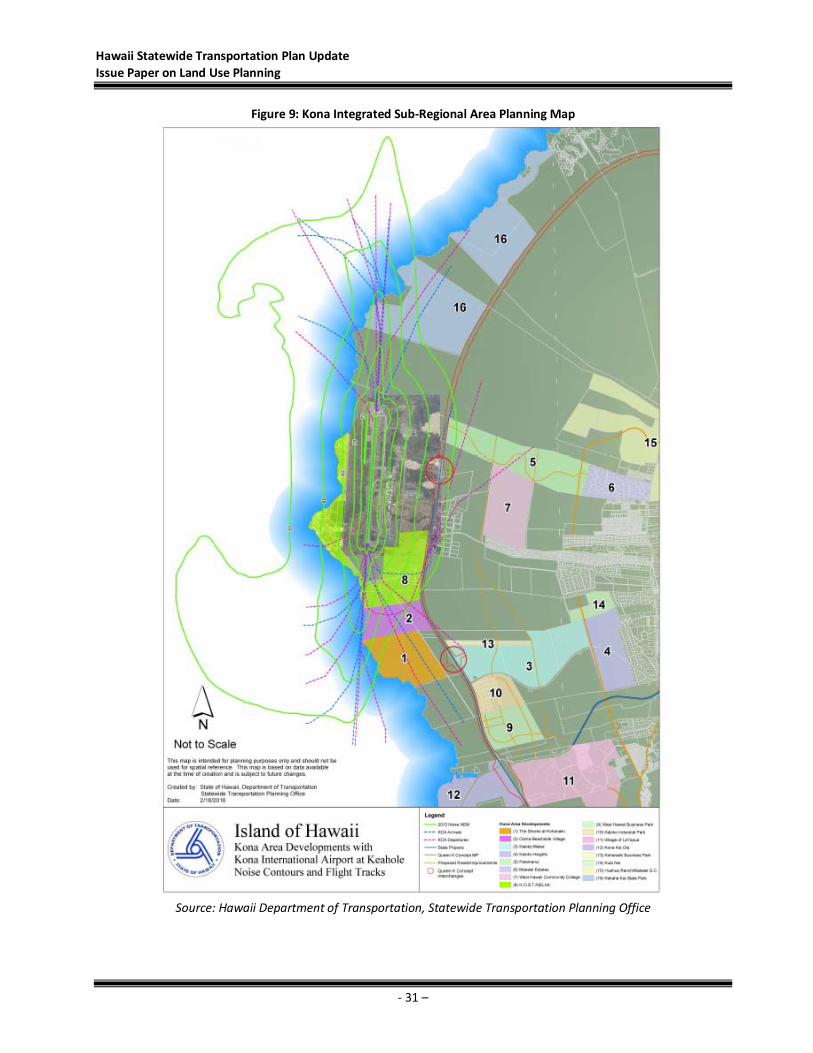
Hawaii Statewide Transportation Plan Update Issue Paper on Land Use Planning
- 31 –
Figure 9: Kona Integrated Sub-Regional Area Planning Map
Source: Hawaii Department of Transportation, Statewide Transportation Planning Office

Hawaii Statewide Transportation Plan Update Issue Paper on Land Use Planning
- 32 –
Section 4.2 Visioning and Scenario Planning Many jurisdictions use a visioning process as part of their stakeholder engagement and decision-making processes. The process for land use and transportation planning can benefit greatly by employing visioning and scenario planning techniques using geospatial technology. Future land use scenarios that result from transportation project options can be shared with agencies, communities, and stakeholder groups in a visually accessible style of presentation. The use of geographic information system tools allows for the integration of aerial photography with area/facility development (or redevelopment) in a three-dimensional simulation. The scale of presentation can range from broad regions to streetscapes. Use of these tools across a broader audience via interactive websites engages stakeholders in a results-driven land and transportation planning process. A diagram of GIS and Geospatial Modeling for Scenario Mapping and Visualization is shown in Figure 10.
Figure 10: Using GIS and Geospatial Modeling
Source: Group 70, International
New Jersey Office of Smart Growth The State of New Jersey adopted a redevelopment plan that follows smart growth policy directives. Using GIS tools to plan future land use outcomes, stakeholders visualized future scenarios in their regions and communities. For regional plan acceptance, municipalities must meet smart growth guidelines. The smart growth locator tool guides public/private project decision-making. Funding is available for communities that partner in transportation projects which link land use and transportation infrastructure capacity and which design new development as compact mixed-use, compatible with transit services, and provide comprehensive parking strategies.

Hawaii Statewide Transportation Plan Update Issue Paper on Land Use Planning
- 33 –
The Visioning Process is fundamentally a public involvement activity. Circles of participants from different perspectives meet to discuss broad matters of concern, with no pre-determined issues or outcomes. Visioning is a dynamic and organic process that in many locations has led to rekindled citizenship, transparent decision-making, consensus, and commitment towards implementation among government, the private sector, and citizens. Visioning processes are helped when they Figure 11: GIS Layer Stack include visual simulation and representations of what is contemplated, versus what now exists. Currently, technology allows creation of a three dimensional (3D) virtual reality. Visual simulation is used with data sets such as Geographic Information Systems (GIS), impact analysis, and operated in a Computer-Aided Design (CAD) environment. Like virtual reality computer animation games, participants can engage in unlimited scenario testing and imagery. Figure 11 shows how GIS Layers are “stacked” on top of one another to form a Multi-Layer Composite map. The GIS Layers can include a variety of data, and in this example we see layers made up of land use, community development boundaries, and transportation facilities. The layers can be presented on a flat map such as in this Issue Paper, or they can be presented in animated form, for visual simulations. Source: Group 70, International Planning and Design Decision Support Systems (PDDDSS) are a planning tool of choice. 10 Several sketch models have emerged that are built on a GIS platform. These include INDES, Place3, and CommunityViz. Each program has a 2D and 3D design and visualization tool. CommunityViz has two components: a scenario construction and tool to design and simulate places in real time 3D and index design tools that are called “Paint the Town” and “Paint the Region.” 10 Kwartler, Michael and Longo, Gianni. Visioning and Visualization: People, Pixels, and Plans. Lincoln Institute of Land Policy. Cambridge, MA. April 2008.

Hawaii Statewide Transportation Plan Update Issue Paper on Land Use Planning
- 34 –
In addition, Google Earth (with Google SketchUp) has opened up access to visual simulation on a wide scale. These tools can help create images using a laptop computer for a group of persons to test alternatives, all in a single meeting, which in the past would have required several weeks. The town of Amherst, Massachusetts, in collaboration with the University of Massachusetts (UMass) Amherst used Google SketchUp and Google Earth to develop realistic, easily accessible 3D building models. This exercise not only allowed people worldwide to get a sense of the town, but it also served as a recruiting tool for UMass Amherst by allowing college applicants to get a feel for the campus. The collaborative project is also used by town officials to make zoning decisions and is helpful for local architects to place their models in a real-world context.11
11 Town of Amherst. http://www.amherstma.gov/index.aspx?NID=715

Hawaii Statewide Transportation Plan Update Issue Paper on Land Use Planning
- 35 –
Section 5.0 Land Use Recommendations for the Hawaii State Transportation Plan Update The Hawaii State Transportation Plan Update contains Goals & Objectives that link land use and transportation infrastructure. The HSTP Update makes recommendations that require continued understanding of the inter-relationship of policies, land use, and transportation, and for using the transportation planning process to advance these understandings. The following recommendations are made to improve the statewide transportation planning process and outcomes:
1. Maintain a planning emphasis on the transportation/land use connection through collaborative planning efforts such as Integrated Sub-Regional Area Planning (ISAP) studies in high growth areas.
2. Continue and enhance participation in statewide land use decision-making at the Land Use Commission level and at the County Council and Planning Commission levels by developing conditions of land use approval for transportation improvements and mitigation measures to protect, preserve, and improve modal, multi-modal, and inter-modal transportation systems.
3. Advance transportation projects and facility planning that are consistent with County General Plans and Community Plans. Use the IPP Forum, the Countywide Transportation Planning Process (CTPP) Policy Committee, TAC, and Stakeholders Committee to identify priorities and links. Consider the need for expansion of Harbors, Airports, and Highways transportation facilities.
4. Continue to develop a data system to include environmentally sensitive areas, the adaptation to sea level rise and climate change. The system can also include HDOT reviews of Environmental Assessments, Environmental Impact Statements, and mitigation measures taken.
5. Be familiar with US Green Building Council (USGBC) standards for Leadership in Energy and Environmental Design (LEED) as it relates to transportation facilities as one means to support the Hawaii Clean Energy Initiative. Use State Transportation Plans to complement and advance Smart Growth policies and multi-modal transportation systems of each County, especially for transit, bicycling and pedestrians.
6. Be familiar with and support the land use and transportation needs for new energy sources, including solar, wind, and biofuels.
7. Understand the relationship of urban form and vehicle miles traveled (VMT), and of density and transit.
8. Actively use geospatial and visioning technology in the transportation planning process to engage stakeholders and the community with tangible simulations of the land use scenarios. Expand the GIS database and participate in the Hawaii Geographic Information Coordinating Council (HIGICC).

Hawaii Statewide Transportation Plan Update Issue Paper on Land Use Planning
- 36 –

Hawaii Statewide Transportation Plan Update Issue Paper on Land Use Planning
- 37 –
References
City and County of Honolulu. The General Plan of the City and County of Honolulu, adopted 1977, last amended 2002.
City and County of Honolulu, Development Plans & Sustainable Communities Plans, (various
dates). Also see: http://honoluludpp.org/planning/DevSustCommPlans.asp County of Hawaii. General Plan. Amended 2005. County of Hawaii. Kona Community Development Plan (CDP), Ordinance 08-131, adopted
September 25, 2008 County of Kauai. The General Plan for the County of Kauai, Chapter 7 of Kauai County Code, 2000
(update). County of Kauai. Community Development Plans, (various dates) County of Maui, General Plan, Ordinance No. 2039, adopted Sep. 27, 1991 County of Maui. General Plan 2030, (draft in review). County of Maui. Maui Countywide Policy Plan, adopted March 19, 2010. Federal Aviation Administration Advisory Circulars Relating to Land Use Planning at Airports:
FAA Advisory Circular 70/7460-1K. Obstruction Marking and Lighting. February 1, 2007. FAA Advisory Circular 150/5000-9A. Sound Insulation of Residences Exposed to Aircraft
Operations. July 2, 1993. FAA Advisory Circular 150/5020-1. Noise Control and Compatibility Planning for Airport. August 5, 1983.
FAA Advisory Circular 150/5020-2. Guidance on the Balanced Approach to Noise Management. September 28, 2004.
FAA Advisory Circular 150/5190-4A A. Model Zoning Ordinance to Limit Height of Objects Around Airports. December 14, 1987.
FAA Advisory Circular 150/5200-33B. Hazardous Wildlife Attractants On or Near Airports. August 28, 2007.
FAA Advisory Circular 150/5200-34A. Construction or Establishment of Landfills Near Airports. January 26, 2006.
Kwartler, Michael and Longo, Gianni. Visioning and Visualization: People, Pixels, and Plans.
Lincoln Institute of Land Policy. Cambridge, MA. April 2008.

Hawaii Statewide Transportation Plan Update Issue Paper on Land Use Planning
- 38 –
State of Hawaii Department of Business, Economic Development & Tourism. Population and Economic Data. 2009.
State of Hawaii, Office of State Planning. West Hawaii Regional Plan. 1989. State of Hawaii. Hawaii State Plan, Chapter 226, Hawaii Revised Statutes (HRS). 1971. State of New Jersey, Department of Community Affairs, Office of Smart Growth. Smart Growth
Locator. 2009.


Issue Paper #6 Integration of Transportation Planning and Design:
Context Sensitive Solutions, Complete Streets, Smart Growth and Transit Oriented Development
A Multi-Modal Perspective
In Preparation for the Hawaii Statewide Transportation Plan Update
Prepared for Department of Transportation
State of Hawaii
Prepared by SSFM International, Inc. With Weslin Consulting Services, Inc.
2011

-i-
Table of Contents Foreword ............................................................................................................................... - 1 -
Section 1.0 Transportation Planning and Design .................................................................... - 3 -
Section 2.0 New Approaches and Tools ................................................................................. - 5 - Section 2.1 Traffic Safety in Hawaii .................................................................................... - 5 - Section 2.2 Complete Streets ............................................................................................. - 7 - Section 2.3 Transit Oriented Development ......................................................................... - 8 - Section 2.4 Livability and Smart Growth ........................................................................... - 12 - Section 2.5 Sustainable Transportation Planning Approaches Around The World ............. - 13 - Section 2.6 Comparing Sustainable Transportation Planning and Policies In the United States,
Canada, and the European Union .................................................................. - 15 - Section 2.7 Best Practices in Sustainable Transportation from Other States ..................... - 19 - Section 2.8 Context Sensitive Solutions ............................................................................ - 20 -
Section 3.0 How 2002 HSTP Treated Planning and Design ................................................... - 25 -
Section 4.0 Sustainability in Hawaii ..................................................................................... - 27 - Section 4.1 Hawaii 2050 Sustainability Plan ...................................................................... - 27 - Section 4.2 Airport, Harbors, and Ports Sustainability ....................................................... - 29 -
Section 5.0 Recommendations For The HSTP Update .......................................................... - 35 -
Resources............................................................................................................................. - 39 -

-ii-

Hawaii Statewide Transportation Plan Update Issue Paper on Integration of Transportation Planning and Design
- 1 -
Foreword The Hawaii state transportation planning process is being supported by the development of a series of issue papers. Each paper explores a different emerging issue that will have a major impact on Hawaii’s transportation future. The emerging issues for Hawaii’s transportation were selected by the Hawaii Statewide Transportation Plan Team as issues which may have significant impact on Hawaii’s residents and their transportation needs. Many emerging issues are associated with the Federal planning requirements, changing trends, as well as shifts in public perception. This issue paper addresses the issue of integrating transportation planning and design. This broad topic area includes such concepts as Context Sensitive Solutions, the Complete Streets Movement, Smart Growth, and Transit Oriented Development. SSFM is the lead consultant for the Hawaii Statewide Transportation Plan (HSTP) Update, and they are supported by a team of consultants. This paper’s lead authors are SSFM International, Inc. and Weslin Consulting Services, Inc. This “Issue Paper #6 on Integration of Transportation Planning and Design” includes sections on:
• Transportation Planning and Design, including best practices from other states; • How the prior Hawaii Statewide Transportation Plan (2002 HSTP) treated the integration
of transportation planning and design; • Applicable state and federal laws, rules and regulations; and, • Proposed guidance to be included in the Hawaii Statewide Transportation Plan Update
(HSTP Update). Issue papers in this series include:
Issue Paper #1: Impact of Federal Planning Requirements (Eight Planning Factors) Issue Paper #2: Climate Change and Sea Level Rise Issue Paper #3: Aging Population and Transportation Issue Paper #4: Fuel and Energy Scenarios for Hawaii Issue Paper #5: Land Use Planning Issue Paper #6 Integration of Transportation Planning and Design Issue Paper #7: Transportation Security Issue Paper #8: System Preservation and Asset Management Issue Paper #9: Financial Scenarios Issue Paper #10: Environmental Coordination

Hawaii Statewide Transportation Plan Update Issue Paper on Integration of Transportation Planning and Design
- 2 -

Hawaii Statewide Transportation Plan Update Issue Paper on Integration of Transportation Planning and Design
- 3 -
Section 1.0 Transportation Planning and Design This issue paper on the integration of transportation planning and design addresses several related topics: sharing the road with bicyclists and pedestrians, living near transit, and sustainability. Much of the literature places the broad concept of “sustainability” as an over-arching theme with Complete Streets, Transit Oriented Development (TOD), Smart Growth, and Context Sensitive Solutions (CSS) as some of the various tools to achieve “sustainability.” Simply stated, sustainable practices mean that any economic or social development should improve, not harm, the environment, using only as many resources as can be replaced for future generations. That is the definition used for “sustainability” and the related topics in this issue paper. Sustainability principles apply to and are useful for air, water, and land transportation systems. This issue paper presents sustainable practices at other airports and harbor ports in the United States, practices used to reduce transportation’s overall carbon footprint. These practices are discussed in Section 4.0. Discussions about sustainability emerged on a wider scale in the global arena at the 1972 UN Conference on the Human Environment.1 Since then, volumes have been produced on sustainability as it applies to transportation.2 Some of them are relevant to the development of the HSTP Update and are referenced in this issue paper. Another design concept relevant to linking planning and design is: “form follows function.”3 The European Union (EU) is attuned to providing transportation that moves people and goods most efficiently and safely. China is quickly making adjustments to their transportation system as they grow their urban areas at rapid rates. Canada and Australia are gradually transitioning from their automobile era practices toward using the models offered by many EU countries. Many best practices in foreign locations are being adopted in the U.S. under the practices discussed in this issue paper, namely Complete Streets, TOD, and Smart Growth. This issue paper seeks to review opportunities for uniting transportation planning and design in Hawaii. It suggests the HSTP Update could be well suited to reflect this orientation through the update of the Goals and Objectives. The Highway Long Range Land Transportation Plan, statewide and for the counties, will need to address Complete Streets, TOD, and similar concepts. But these pertain equally to Air and Water modes, and can be addressed at the Master Plan and Development Plan levels.
1 Newman, Peter and Kentworthy, Jeff. Sustainability and Cities: Overcoming Automobile Dependence. Island Press, Washington, DC. 1999. Page 1. 2 Newman. Page 1. 3 Greenough, Horatio. Form and Function: Remarks on Art. Edited by Harold A. Small, Berkeley, University of California Press. 1947.

Hawaii Statewide Transportation Plan Update Issue Paper on Integration of Transportation Planning and Design
- 4 -
There is a complementary benefit to using these design concepts as a solution to another serious problem being experienced in Hawaii: traffic safety. This issue paper looks at the seriousness of the pedestrian safety problem. Planning and design concepts that have been used to create a safer transportation system and other benefits are reviewed. This is done by using references to information available from transportation research institutions as well as examples of how other states have responded to that research or other policy or legislative initiatives. When President Obama released the Administration’s budget proposal for FY 2011, the budget’s message explained how programs were “reformatted and restructured” to implement new policy recommendations. These changes reflect the Administration’s “priority emphasis on transportation safety, livable communities, and place-based development.” A new “livable communities” category of funding was created. Hawaii can be prepared to take advantage of the federal government’s new programs if acceptable and innovative transportation planning and design concepts are seen in conjunction with transportation problem-solving techniques soon to be eligible for new funding opportunities. The concepts can emphasize the development of transportation design solutions found to be most appealing to the public. An emphasis can also be placed on human safety and comfort. Such concepts have evolved successfully in other countries to address safety and mobility concerns. The emphasis and priority in these locations has been to use an approach that defines traffic as the movement of people and goods. Facility costs and benefits have been analyzed while giving great preference to qualitative measures over quantitative ones. The types of new design approaches addressed by this issue paper are driven by more than urban designers seeking more aesthetically pleasing transportation infrastructure. The attractive “form” offered by complete streets models; transit oriented development examples; sustainability and smart growth interests; and context sensitive solutions are all most appealing when the safest environment possible has been created. That environment is safest when the “function” of transportation corridors has been clearly established such that the travel movements of alternative modes avoid points of conflict.

Hawaii Statewide Transportation Plan Update Issue Paper on Integration of Transportation Planning and Design
- 5 -
Section 2.0 New Approaches and Tools This section begins with a review of Hawaii’s poor record of pedestrian traffic fatalities. The section then discusses tools to address better design, linkage to transportation, and ultimately better safety. Section 2.1 Traffic Safety in Hawaii Dangerous by Design is a report of the Surface Transportation Policy Partnership. 4 Table 1 from the report lists the highest average annual pedestrian traffic fatalities per 100,000 people 65 and older. Hawaii’ is at the top by a wide margin with a rate three times greater than the national average. Table 1: Highest Average Annual Pedestrian Traffic Fatalities Per 100,000 People 65 and Older
Pedestrian fatality rate statistics from the Fatality Analysis Reporting System (FARS) reveal that Hawaii has always been above the National average. Hawaii has been consistently ranked higher than most other states since 1994, the first year such comparative statistics were available. Hawaii’s average national rank during the nine year period from 2000 to 2008 was 7th. From 1994 to 1999, Hawaii’s pedestrian safety record was at an average rank of 17, suggesting things have worsened. Many factors contribute to these rankings. While Hawaii appears worse than other states, Hawaii has a greater than average proportion of its population
over 65; older people in Hawaii make more trips than their counterparts on the mainland; and, more of those trips are as pedestrians.5, 6 Nevertheless, it is unacceptable for Hawaii to have the worst pedestrian traffic safety history in the nation.
Figure 1: Pedestrian Survival Rate by Vehicle Speed
4 Ernst, Michelle and Shoup, Lilly. Dangerous by Design. Surface Transportation Policy Partnership and Transportation For America. 2009. Table 3, page 24. 5 In 2010, Hawaii had the 16th highest proportion of population age 65 and older among all states. Hawaii is projected to be ranked 12th in 2010. March 16, 2010. <http://www.census.gov/population/projections/PressTab3.xls> 6 U.S. Department of Transportation, Bureau of Transportation statistics. National Household Travel Survey 2001 Highlights Report, BTS03-05. Figure 5, page 10 and HAWAII DOT and OahuMPO NHTSA Add-on Program, data files, 2001.

Hawaii Statewide Transportation Plan Update Issue Paper on Integration of Transportation Planning and Design
- 6 -
The Dangerous by Design report makes the point that vehicle speed kills – a pedestrian struck by a vehicle at 20 mph has a 95% chance of surviving. That chance of survival is reduced to just 15% when hit by a vehicle at 40 mph as shown in Figure 1. Vehicle speed is the greatest threat as shown in Figure 1.
Traffic safety in Hawaii can also be viewed from the perspective of our visitors. Many tourists come to Hawaii expecting relief from harsh transportation experiences, not to be involved in one. Consider a visitor from China. Beijing, Shanghai, Wuhan, Chongqing, Hong Kong, and dozens of other major cities in China layer a grade separated pedestrian crossing over every leg of a busy intersection with the types of vehicle volumes found at many intersections throughout Hawaii.
China has been introducing pedestrian zones such as those found in European cities. International locations, especially those oriented to tourism, are placing priority on pedestrians, cycles, and transit while restricting general purpose traffic. Figure 2 provides the results of these types of policies in Europe.
Figure 2 is from the report Performance Driven: A New Vision for U.S. Transportation Policy. The report compared Western Europe, a region of similar size and population to the U.S. The report observes that “The U.S. transportation system continues to fall short with respect to safety: mortality and injury rates – as well as accident-related economic losses – on the nation’s highways are far in excess of those found in most other developed countries.”7
Figure 2: Comparison of U.S. and Western Europe Traffic Fatalities The striking observation was not that the U.S. death toll was higher than Western Europe. It was that Western Europe once had a much higher fatality level than the U.S. but has succeeded in achieving a 59% reduction, compared to a 19% reduction over the same 34-year period in the U.S.
7 National Transportation Policy Project; Bipartisan Policy Center. Performance Driven: A New Vision for U.S. Transportation Policy. June 9, 2009. Page 40.

Hawaii Statewide Transportation Plan Update Issue Paper on Integration of Transportation Planning and Design
- 7 -
China reduced fatalities by 10% in one year, from 2007 to 2008.8 China’s peak traffic fatality total was in 2002 at 109,381. By 2008, the fatality total was down to 73,500. The reduction in China from 2002 to 2008 of 35,881 is a far greater achievement when compared to the U.S. reduction of only 9,991 that took 34 years to attain. Statistics show that international transport safety policies have been much more effective in saving lives than in the U.S. International transport planning recognizes the vulnerability of the pedestrian. The American Association of Retired Persons (AARP) has taken on traffic safety as a crusade. They have endorsed Complete Streets policies that take older pedestrians into account. AARP Hawaii was a key proponent of Act 54, Hawaii’s Complete Street legislation passed in 2009.9 Section 2.2 Complete Streets The Federal Highway Administration (FHWA) has engineering guidelines for older drivers and pedestrians, and new handbook should be coming out in 2010.10 This guidance was an update of work performed in the late 1990’s, relying on research in the early-1990’s, largely based on data from the 1980’s. The report represents rigorous analysis using prudent engineering approaches oriented toward judiciously accommodating the pedestrian while giving preferential treatment to the optimization of vehicle flow. The report attempts to address an aging population’s desire for mobility as pedestrians within the confines of an institutionalized mindset that automatically assumes a U.S. defacto policy directive that streets are for vehicles versus an ever-strengthening and evolving international policy that streets are public rights-of-way available for the highest and best use to serve the public need. Consider the first sentence of the Bipartisan Policy Center’s National Transportation Policy Project (NTPP) report: “National transportation policy has lost direction and a clear sense of purpose, threatening substantial costs to our collective prosperity, security, environment, and quality of life.” 11 Hawaii Act 54 (Session Laws of Hawaii 2009), Complete Streets, was enacted as an addition to Hawaii Revised Statutes (HRS) Chapter 286 now found as HRS Chapter 264. The Complete Streets legislation applies to development for which planning or design commences on or after January 1, 2010. The legislation created a temporary task force to review existing state and
8 Traffic fatalities in China fall to 73,500 in 2008: report; Car Tech; Beijing, China; January 4, 2009. 9 Boland, Jackie. AARP Hawaii Associate State Director Letters to Hawaii House Committee on Finance and Transportation. 2009. 10 Federal Highway Administration. Highway Design Handbook For Older Drivers and Pedestrians. Publication No. FHWA-RD-01-103. May 2001. 11 The NTPP is a project of the Bipartisan Policy Center founded by former Senate majority leaders Howard Baker, George Mitchell, Tom Daschle, and Bob Dole.

Hawaii Statewide Transportation Plan Update Issue Paper on Integration of Transportation Planning and Design
- 8 -
county highway design standards and guidelines. The purpose of the review is to develop standards that can be applied consistently statewide.
Act 54 requires Hawaii DOT and the county transportation departments to adopt a complete streets policy that “seeks to reasonably accommodate convenient access and mobility for all users of the public highways within their respective jurisdictions as described under HRS Section 264-1, including pedestrians, bicyclists, transit users, motorists, and persons of all ages and abilities.” The law, which took effect on January 1, 2010, applies to new
construction, to reconstruction, and to maintenance of highways, roads, streets, ways, and lanes located within urban, suburban, and rural areas, if appropriate for the application of Complete Streets. The law does not apply if: (1) Use of a particular highway, road, street, way, or lane by bicyclists or pedestrians is prohibited by law, including within interstate highway corridors; (2) The costs would be excessively disproportionate to the need or probable use of the particular highway, road, street, way, or lane; (3) There exists a sparseness of population, or there exists other available means, or similar factors indicating an absence of a future need; or (4) The safety of vehicular, pedestrian, or bicycle traffic may be placed at unacceptable risk. This legislation created a temporary task force to review existing state and county highway design standards and guidelines. The purpose of the review is to develop standards that can be applied consistently statewide. The task force is to submit a final report before the 2011 legislative session. Complete Streets is not just about roads, but about integrating the safe movement of people and goods. This includes transitioning between our airports and harbors onto the streets. Many other states and municipalities have also integrated transitioning between public transit and the street as part of their Complete Streets design. The Complete Streets concept can be extended to airports with the external links to parking garages, rental car agency pick-ups, and the internal links and paths within the airport terminals. Section 2.3 Transit Oriented Development Transit Oriented Development considers the transitioning of people between public transit and the streets, whether it is rail, bus, or commuter vehicles such as the Handi-Van on O‘ahu or the Maui Bus-Commuter Service, a concept akin to Complete Streets. Transit Oriented Development (TOD) is a method to coordinate transportation access and land development. It is a strategy used to manage growing populations; to reduce traffic congestion; to create safe access to major transit facilities by multiple modes; and to improve quality of life. The California Statewide TOD Study Technical Advisory Committee adopted the following definition of TOD:
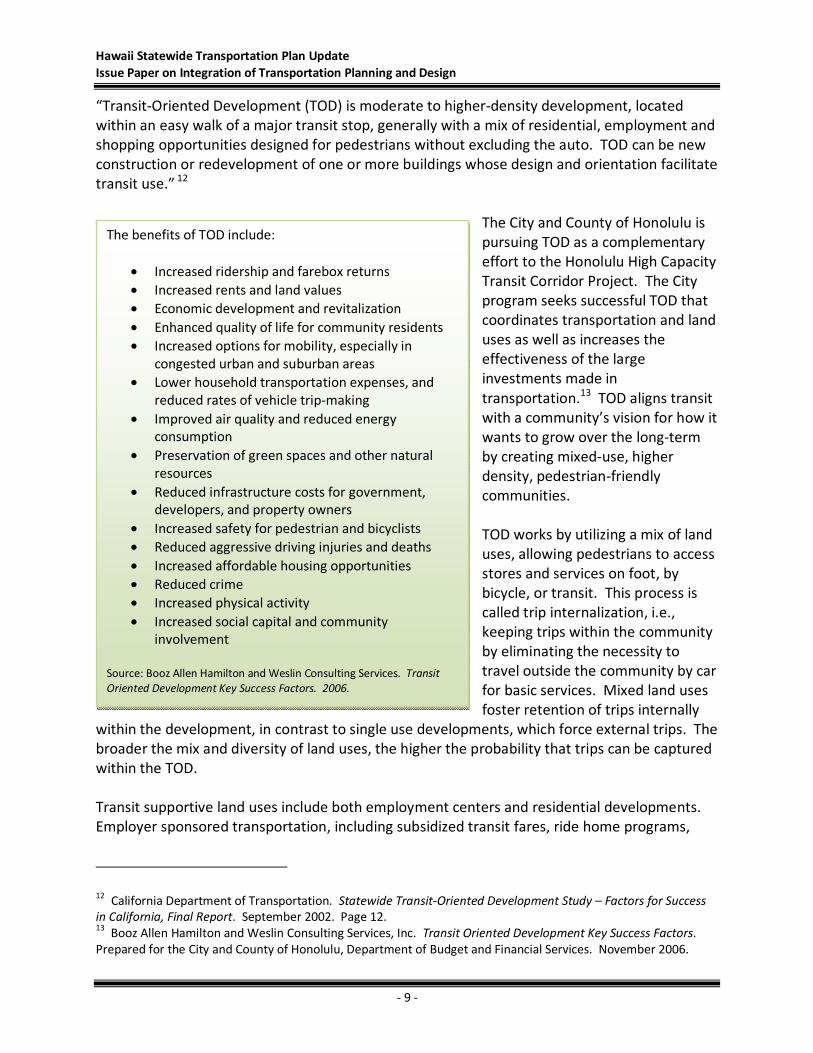
Hawaii Statewide Transportation Plan Update Issue Paper on Integration of Transportation Planning and Design
- 9 -
The benefits of TOD include:
• Increased ridership and farebox returns • Increased rents and land values • Economic development and revitalization • Enhanced quality of life for community residents • Increased options for mobility, especially in
congested urban and suburban areas • Lower household transportation expenses, and
reduced rates of vehicle trip-making • Improved air quality and reduced energy
consumption • Preservation of green spaces and other natural
resources • Reduced infrastructure costs for government,
developers, and property owners • Increased safety for pedestrian and bicyclists • Reduced aggressive driving injuries and deaths • Increased affordable housing opportunities • Reduced crime • Increased physical activity • Increased social capital and community
involvement Source: Booz Allen Hamilton and Weslin Consulting Services. Transit Oriented Development Key Success Factors. 2006.
“Transit-Oriented Development (TOD) is moderate to higher-density development, located within an easy walk of a major transit stop, generally with a mix of residential, employment and shopping opportunities designed for pedestrians without excluding the auto. TOD can be new construction or redevelopment of one or more buildings whose design and orientation facilitate transit use.” 12
The City and County of Honolulu is pursuing TOD as a complementary effort to the Honolulu High Capacity Transit Corridor Project. The City program seeks successful TOD that coordinates transportation and land uses as well as increases the effectiveness of the large investments made in transportation.13 TOD aligns transit with a community’s vision for how it wants to grow over the long-term by creating mixed-use, higher density, pedestrian-friendly communities. TOD works by utilizing a mix of land uses, allowing pedestrians to access stores and services on foot, by bicycle, or transit. This process is called trip internalization, i.e., keeping trips within the community by eliminating the necessity to travel outside the community by car for basic services. Mixed land uses foster retention of trips internally
within the development, in contrast to single use developments, which force external trips. The broader the mix and diversity of land uses, the higher the probability that trips can be captured within the TOD. Transit supportive land uses include both employment centers and residential developments. Employer sponsored transportation, including subsidized transit fares, ride home programs,
12 California Department of Transportation. Statewide Transit-Oriented Development Study – Factors for Success in California, Final Report. September 2002. Page 12. 13 Booz Allen Hamilton and Weslin Consulting Services, Inc. Transit Oriented Development Key Success Factors. Prepared for the City and County of Honolulu, Department of Budget and Financial Services. November 2006.

Hawaii Statewide Transportation Plan Update Issue Paper on Integration of Transportation Planning and Design
- 10 -
company vehicles for personal use, and memberships in a car sharing program can greatly increase transit use. The best TOD designs require a multi-disciplined approach combining transportation planning and urban design. To encourage people to live and work in higher density projects and near transit stations, projects must be attractive, well designed, dense, mixed use developments. This approach is often referred to as the “three Ds”: density, diversity, and design. Without the three Ds, development around transit is simply transit adjacent development. This does not capture the internal trips needed to achieve the benefits of TOD. There is no proven TOD methodology that works across all situations, but there are general best practices that can help move closer to achieving its goals. TOD is a tool that requires different policies in different contexts. Each set of unique characteristics must be identified and evaluated when determining what type of TOD planning is needed, and what type of TOD will work best given the specific market conditions, growth and population trends, transportation needs, and end user demands. The key drivers of TOD include scarcity of land, continued population growth, escalating traffic congestion, and shifting demographics. Together, these increase the attractiveness of sites close to major transit facilities. Rising land values create the economic conditions necessary to help make mixed-use compact development feasible. The City and County of Honolulu (C&C) Department of Planning and Permitting (DPP) is in the process of preparing three Neighborhood TOD Plans in the communities of ‘Aiea-Pearl City, East Kapolei, and Waipahu. These communities are located in the first phase of the C&C Rail Project. TOD addresses the anticipated growth and change around the seven Honolulu Rail Transit Stations in the first phase. Following the planning of these seven Rail Transit Stations, DPP will move into areas in the next three phases, such as 3 Rail Stations near the Honolulu International Airport, 3 Stations in Kalihi, 3 Stations in Downtown Honolulu, and the Ala Moana Shopping Center Station.14 The transportation analysis within these efforts has observed that TOD is not a new concept. The first Honolulu Neighborhood Plan was prepared for Waipahu, a location once served by 28 passenger trains per day.15 Oahu’s development was heavily influenced by streetcars with development clustered near transit by necessity, closely connecting land use with transit function.16
14 C&C DPP TOD Website. Honoluludpp.org/planning/TOD/TOD.pdf 15 Chiddix, Jim and Simpson, MacKinnon. Next Stop Honolulu – The Story of the Oahu Railway & Land Company. September 2004. Page 169. 16 Brizdle, John and Simpson, MacKinnon. Streetcar Days In Honolulu – Breezing Through Paradise. October 2000. Page 71.

Hawaii Statewide Transportation Plan Update Issue Paper on Integration of Transportation Planning and Design
- 11 -
The basic principles for developing around transit stations fell into disuse as accessibility for automobiles became the focus of development. Although Oahu suffered from the same infatuation with auto-oriented development, it did not neglect its transit system. As a result, some excellent proto-typical examples of TOD are found on Oahu -- Waikiki, Ala Moana Center, and Downtown Honolulu—in areas of the island where transit access and service levels are very high. These Honolulu examples epitomize much of what others are trying to achieve when TOD is envisioned.17 The “three Ds” of TOD serve as reminders for communities, designers, and developers who may have forgotten them. This approach of density, diversity, and design can serve as the TOD checklist platform for the development of pedestrian-scale and bicycle-oriented communities suitable for public transportation. The paramount requirement is that superior transit access be developed for each transit station, center, or hub to ensure that the catchment zone for the regional transit system is optimally served. The catchment zone will be much larger than the area covered by TOD plans. The TOD plans can consider the best possible station access for all system patrons, including both those in the TOD area and those accessing Rail from beyond. The TOD form must follow the functional requirements of the overall transportation system. Alternative access modes must be given a priority consideration. In 2009, the City and County of Honolulu enacted an ordinance to set the strategy for TOD planning and implementation.18 The ordinance is a framework for planning and zoning and establishes special districts to foster more livable communities. It also identifies issues to examine such as affordable housing potential, reduced parking, and urban design. TOD is not just an Oahu Rail planning issue. Each of the Neighbor Islands is currently addressing the Land Use and Transportation connection through growing public transit systems to policies encompassing walkable neighborhoods and sustainability. Hawaii County recently embarked on applying Transit Oriented Development to Kona’s Honokohau Village, an 80-acre site that includes the new West Hawaii Civic Center. A multi-day public charette took place in 2009 that includes residents, community leaders, developers, builders and County officials and staff. The charette integrated TOD as a neighborhood development approach, which was incorporated into the recently adopted Kona Community Development Plan. This workshop helped all stakeholders understand the TOD concept and then apply it to actual Village Design Guidelines, which in turn encourages a true neighborhood atmosphere. 17 Weslin Consulting Services, Inc. Waipahu Neighborhood TOD Plan Transportation and Circulation Analysis. Prepared for the City and County of Honolulu Department of Planning and Permitting. June 2008. Page 3. 18 City and County of Honolulu, Revised Ordinances of Honolulu, Section 21-9.100 of the Land Use Ordinance Relating to Transit-Oriented Development.
Hawaii Statewide Transportation Plan Update Issue Paper on Integration of Transportation Planning and Design
- 12 -
Kauai’s General Plan adopted in 1999 includes many of the basic tenets of TOD: promoting compact urban settlements, conserving scenic roadway corridors and enhancing the identity of urban centers and towns. Kauai’s General Plan, “Preserving Kauai’s Rural Character,” focuses on development in a way that supports its Urban and Town Centers while allowing already-existing Residential and Agricultural Communities to build out.19 Maui’s Draft General Plan (2008) addresses island-wide planning issues, including transportation and mobility. This General Plan looks to integrate transportation and land use decisions, a key factor of any TOD. Maui County also looks to expand its multi-modal transportation network in order to provide mobility choices while implementing plans or programs for Transportation Demand Management. All of these policies will help to ensure the continuing development of sustainable island communities. While the counties are taking the lead to develop TOD planning districts, many TOD districts will be located near state transportation facilities which are dominant features near or within those districts, thus providing state interest. The TOD Stations near the Honolulu International Airport are an example of this. Section 2.4 Livability and Smart Growth Prior to the emphasis on sustainability and smart growth, many transportation planners and economists assumed increased motor vehicle mobility costs provided net economic benefits offsetting social and environmental impacts. Research now indicates increased motor vehicle travel has major negative economic impacts.20 Sustainability and smart growth planning both require tradeoffs among economic, social, and environmental objectives.21 Past transportation planning tended to assume that transport progress consisted of advancing newer, faster modes. These displaced older, slower modes. Consequently, there was no harm if increasing automobile traffic caused congestion delay to public transportation or created a barrier to pedestrian travel. It was considered backward to give public transportation or walking priority over automobile travel under this planning approach.22
19 Soon, Cheryl, PhD, FAICP. Transit Oriented Development: What Does It Mean for Hawaii? Presentation to the 2009 Hawaii Congress of Planning Officials (HCPO)/Hawaii Geographic Information Coordinating Council (HIGICC) Conference. September 2009. 20 Boarnet, Marlon G. Highways and Economic Productivity: Interpreting Recent Evidence. University of California Transportation Center Working Paper No. 291. October 1995. Page 26. 21 Litman, Todd and Laube, Felix. Automobile Dependency and Economic Development. Victoria Transport Policy Institute. August 2002. Page 14. 22 Issues In Sustainable Transportation; Global Environmental Issues. Volume 6, Number 2. 2006. Page 335.

Hawaii Statewide Transportation Plan Update Issue Paper on Integration of Transportation Planning and Design
- 13 -
“To increase safety and mobility for walkers and bicyclists, a country must embrace foot and bicycle traffic as transportation modes and consider them as a means to attaining livability and sustainability goals.” Source: “Handy Lessons from Overseas on Walking and Bicycling.” USDOT FHWA, 2010.
“The Partnership for Sustainable Communities” at the federal level has established six livability principles that will act as a foundation for interagency coordination worthy of local consideration:23
1. Provide more transportation choices. Develop safe, reliable, and economical transportation choices to decrease household transportation costs, reduce our nation’s dependence on foreign oil, improve air quality, reduce greenhouse gas emissions, and promote public health.
2. Promote equitable, affordable housing. Expand location- and energy-efficient housing choices for people of all ages, incomes, races, and ethnicities to increase mobility and lower the combined cost of housing and transportation.
3. Enhance economic competitiveness. Improve economic competitiveness through reliable and timely access to employment centers, educational opportunities, services, and other basic needs by workers as well as expanded business access to markets.
4. Support existing communities. Target federal funding toward existing communities – through such strategies as transit-oriented, mixed-use development and land recycling – to increase community revitalization, improve the efficiency of public works investments, and safeguard rural landscapes.
5. Coordinate policies and leverage investment. Align federal policies and funding to remove barriers to collaboration, leverage funding and increase the accountability and effectiveness of all levels of government to plan for future growth, including making smart energy choices such as locally generated renewable energy.
6. Value communities and neighborhoods. Enhance the unique characteristics of all communities by investing in healthy, safe, and walkable neighborhoods – rural, urban, or suburban.
Section 2.5 Sustainable Transportation Planning Approaches Around The World Sustainable transportation planning is widely used abroad. U.S. transportation officials participating in scan tours sponsored by the Federal Highway Administration (FHWA) prepare reports such as “Handy Lessons from Overseas on Walking and Bicycling” (February 2010).24 23 LaHood, Ray, DOT Secretary, HUD Secretary Shaun Donovan and EPA Administrator Lisa Jackson. Interagency Partnership for Sustainable Communities Press Release. June 16, 2009. 24 Rousseau, Gabe. Handy Lessons From Overseas on Walking and Bicycling. Public Roads, US DOT FHWA Online Newsletter. January/February 2010. Volume 73, No. 4.

Hawaii Statewide Transportation Plan Update Issue Paper on Integration of Transportation Planning and Design
- 14 -
Twelve transportation professionals selected by the FHWA and American Association of State Highway and Transportation Officials (AASHTO) conducted an international scan in May 2009, focusing on bicyclist and pedestrian mobility and safety. The team met with transportation officials and visited Denmark, Germany, Sweden, Switzerland and the United Kingdom. Their findings showed that along with pedestrian mobility and safety increases, the bicycling and pedestrian modes of transportation dovetail nicely with sustainability plans. They further found that these countries all link bicycles to transit through policies such as providing large bicycle parking facilities at transit stations and allowing bicycles on trains in Germany.
Figure 3 Bristol, UK Home Zone Shared Space Figure 3 shows the May 2009 Scan Team members examining a Home Zone shared space in Bristol, UK. A Home Zone sign and change in pavement texture are placed to alert drivers to slow down and watch for children playing. Sustainable transport and smart growth strategies are meant to improve walking and cycling, provide more public transportation service, and restrict motor vehicle travel in urban areas with high pedestrian, cycling and public transportation activity. These urban areas are sometimes under the jurisdiction of growth management plans delineating the sustainable development approaches and transport practices applied within an Source: Handy Lessons From Overseas on Walking and Bicycling
associated urban growth boundary. Sustainable transport practices have been articulated in U.S. growth management plans for many decades. Research on sixteen U. S. metropolitan areas with growth management programs compared them to 79 areas without growth management. The growth management areas had a statistically significant improvement in the percent of commuters using transit. The conclusion was that smart growth management efforts can contribute to reducing auto-dependency and promote more sustainable transport.25 Sustainable transport and smart growth best practices are found globally with smart growth development concepts such as Eco-towns and New Growth Points, terms reflecting a high sophistication of coordinated transportation and land use planning in the United Kingdom and other EU countries.26
25 Deal, Brian, et al. Growth Management and Sustainable Transport: Do Growth Management Policies Promote Transit Use? University of Illinois, Journal of Public Transportation. Volume 12, Number 4. 2009. Page 35. 26 Department for Transport, London, UK. Building Sustainable Transport into New Developments: A Menu of Options for Growth Points and Eco-towns. April 2008.

Hawaii Statewide Transportation Plan Update Issue Paper on Integration of Transportation Planning and Design
- 15 -
Canada, like the United States, has struggled with how to best implement sustainable transportation. Transport Action Canada, formerly known as Transport 2000 Canada, reported that “no evidence has been located to demonstrate that even one municipal government in Canada has consistently achieved non-trivial sustainable transport practices under the rubric of smart growth…”27 While this may be true, some Canadian provinces, such as British Columbia, show exemplary sustainable transportation practices in cities like Vancouver and Victoria. For example, the City of Vancouver’s land use bylaws require bicycling parking facilities to be included in certain types of new developments. Many neighborhoods in Victoria were developed as neighborhood centers around streetcars over a century ago, and they still hold that legacy as compact, mixed-use, walkable activity centers. Section 2.6 Comparing Sustainable Transportation Planning and Policies In the United States, Canada, and the European Union Canada, the European Union, and the U.S. represent very different experiences with regard to sustainability and smart growth. Since the mid 1990s, Canada has included the full costs of transportation projects, including social costs. However, more power resides with the provinces than with the national government over transportation, and those provinces have responded differently to planning expectations. Table 2 highlights research results between the EU and the US in relation to sustainable transportation.28 Table 2 shows that typical US behavior does not see an alternative to the car, and political acceptability of sustainable transport is a low priority and high risk.
27 Wellar, Dr. Barry. Sustainable Transport Practices in Canada: Exhortation Overwhelms Demonstration. Transport 2000 Canada. September 2006. Page 26. 28Banister, David, et al. Making Sustainable Transport Politically and Publically Acceptable: Lessons From The EU, USA, and Canada; Institutions and Sustainable Transport: Regulatory Reform in Advanced Economies. University College of London, Rutgers University, and Laval University, Quebec City. 2007. Pages 17-50.

Hawaii Statewide Transportation Plan Update Issue Paper on Integration of Transportation Planning and Design
- 16 -
Table 2: Different Concepts of Political Acceptability of Sustainable Transport in the USA and the EU
Source: Banister, David, et.al.. Making Sustainable Transport Politically and Publically Acceptable: Lessons From The EU, USA, and Canada. What exactly does sustainable travel provide? Some EU countries such as Germany have surprising passenger travel and sustainability statistics as shown in Table 3 and compared to the US.29
29 Buehler, Ralph, et al. Making Transportation Sustainable: Insights from Germany. Brookings Institution Metropolitan Policy Program. April 2009. Table 1, Page 7.
United States European Union
Inte
rest
s
Economic Power Political
Maximum economic growth, accepting the environmental consequences. Major interests from industry, car manufacturers, and energy suppliers. Major influence to realize political preferences and get re-elected.
Strong environmental concerns, moderating economic growth objectives. Major interest from car manufacturers – seen as opportunity for change. Some influence to realize political preferences and get re-elected.
Inst
itutio
ns
Formal Informal
Federal government not seen as having a major interventionist role, but some relevant standard-setting is accepted. Scattered instances of strong state and local commitment. Some public concern on environmental issues.
Environmental policy seen as a major area for EU intervention. Strong public concern on environmental issues.
Beha
vior
Risks
Belief in technological solutions. Culture of freedom and independence – no alternative to the car.
Belief in strong intervention through pricing and regulation – supported by technology – acceptance of restraints on the car.
Sum
mar
y Overall
Local Global
Sustainable transport is low priority and high risk – pessimistic about change. State action on emissions, but little action on pricing. No action on CO2 reductions.
Sustainable transport is a high priority, with EU as a world leader – optimistic about change. Regulations on emissions, emissions trading and pricing. EU and national action on CO2 reductions.

Hawaii Statewide Transportation Plan Update Issue Paper on Integration of Transportation Planning and Design
- 17 -
Table 3: Measures of Travel and Sustainability in the US Versus Germany
United States Germany Car CO2 emissions per capita, in pounds, 2005 8,600 lbs 2,900 lbsMiles per gallon, vehicle fleet, 2005 20 mpg 30 mpgEnergy use per passenger per year, in million British thermal units (BTU), 2004-2005
55 BTU 17 BTU
Energy use per passenger mile, in British thermal units (BTU), 2004-2005
Cars and Light Trucks Average 6,250 BTU 3,050 BTUTransit Bus 6,850 BTU 1,700 BTULight Rail 4,550 BTU 2,000 BTUHeavy Rail 4,100 BTU 2,250 BTUPercent of household budget for transportation, 2003 19% 14% Traffic fatalities per 100,000 population, 2002-2005 14.7 deaths 6.5 deathsCyclist fatalities per 100 million miles of cycling, 2002-2005 18.0 deaths 4.0 deathsPedestrian fatalities per 100 million miles of walking, 2002-2005
8.0 deaths 4.0 deaths
Fatalities per billion miles of car travel, 2002-2005 14.4 deaths 12.5 deathsGovernment transit subsidy as share of public transportation operating budgets, in percent, for all levels of government, 2006
62% 26%
Source: Buehler, Ralph. Making Transportation Sustainable: Insights from Germany. Brookings Institution. 2009.
Table 3 shows not only a reduction in energy use per passenger, but also reductions in car CO2 emissions and a reduction in traffic, cyclist, and pedestrian fatalities in Germany. These sustainable travel performance measures dovetail with Hawaii’s Act 234 from Session Laws of Hawaii 2007, which was established to achieve greenhouse gas emissions reductions and limits at or below 1990 emissions levels by January 1, 2020. Sustainable travel also helps to meet the goals of the Hawaii 2050 Sustainability Plan, namely the first goal, “Living sustainably is part of our daily practice in Hawaii.”30 While the State of Hawaii has this legislation and other efforts on the books, there are other best practices the State can integrate into their action plans. The Making Transportation Sustainable: Insights from Germany paper outlines five lessons learned when making sustainable transportation policy and implementation. These are very instructive and summarized in the text box to follow.
30 Hawaii 2050 Sustainability Task Force. Hawaii 2050 Sustainability Plan Executive Summary. January 2008. Page 3.

Hawaii Statewide Transportation Plan Update Issue Paper on Integration of Transportation Planning and Design
- 18 -
Making Transportation Sustainable: Insights from Germany
Get the Price Right -- Probably the biggest obstacle to sustainable transportation in the United States is the failure to require motorists to pay the true social, economic, and environmental costs of driving. Congestion pricing, higher fuel taxes, and vehicle fees that promote higher fuel efficiency and more environmentally friendly cars are examples of such pricing policies. Charging for at least a portion of the negative externalities generated by car use would create a series of direct and indirect effects. Pricing strategies generate revenue for transportation infrastructure. In Germany, higher car use fees and taxes cover not only highway investments, but also other government spending. Integrate Transit, Cycling, and Walking as Viable Alternatives to the Car -- Providing safe, convenient, and cheaper alternatives to the car is necessary to make any sort of car-restrictive measures publicly and politically feasible. For example, the city of Hanover, Germany introduced an integrated mobility program in 2004. The project creates a service package of all transit services in the greater Hanover region, including taxis, car-sharing services, and rental cars. In addition, users of the program receive 25 percent discounts for long-distance rail travel in Germany and other services such as bicycle maintenance, luggage delivery, and travel information. Fully Coordinate and Integrate Planning for Land Use and Transportation -- The packaging of self-reinforcing land use and transportation policies is perhaps the most important lesson that Germany can offer the United States. Transportation policies in Germany have been effective in promoting a sustainable transportation system precisely because they are integrated with land use policies aimed at discouraging car-dependent sprawl. In Germany, federal, state, and local governments participate in a top-down and bottom-up interactive planning process. At all levels of government, land-use planning is formally connected to transportation and other areas of planning. Public Information and Education to Make Changes Feasible -- Public information and education are crucial components of any sustainable transportation policy. Behavior-changing policies introduce costs, in financial terms or in terms of restrictions. In addition, the costs tend to be immediate while the benefits materialize over the medium or long term. Policymakers need to have an effective communication campaign that emphasizes policy benefits and the end results. Some policies might appeal to the greater good and long term societal goals, but most successful policies provide an individual short term benefit of some sort. For example, everyone benefits from improved air quality, safer travel, and a better quality of life. A relatively immediate positive benefit might be less traffic congestion and more transit services. In Germany, the increase in the gas tax by 75 U.S. cents per gallon between 1999 and 2003 became politically acceptable only when the government promised to use the resulting revenue to lower social security taxes for all employees. Implement Policies in Stages with a Long Term Perspective -- Changes in travel behavior do not happen overnight. The sustainable transportation and land use policies in Germany evolved over several decades. It took considerable time to gather the necessary public and political support and to develop appropriate measures. Policies were implemented initially at a small scale. Successful experiments in a few cities led to their increasing adoption in other cities and eventually nationwide. Non-controversial projects should be implemented first. German cities started to traffic-calm streets and neighborhoods where a majority of citizens agreed on the harmful effects of car use. The positive outcomes, such as improvements in quality of life and traffic safety, helped win public support for the extension of traffic calming schemes. All cities and villages in Germany now have most of their neighborhoods traffic calmed. The environmental tax reform in Germany increased the gasoline price by 15 U.S. cents per gallon each year from 1999 to 2003. This policy was not very popular, but a phased approach made it possible to increase gasoline taxes by a total of 75 U.S. cents per gallon. A one-time gas tax hike of this magnitude would have been doomed to fail. Source: Buehler, Ralph. Making Transportation Sustainable: Insights from Germany. Brookings Institute. 2009.

Hawaii Statewide Transportation Plan Update Issue Paper on Integration of Transportation Planning and Design
- 19 -
Maryland Department of Transportation Sustainable Transportation Measures
Innovative Design – Designing projects reflecting best practices in minimizing energy consumption, supporting efficient movement of people and goods, minimizing impacts on surrounding ecosystems and have low operation costs and maintenance needs. Life Cycle Costing: Basing investment decisions on the full planning, construction and lifetime operating and maintenance costs of a facility, including the societal cost of the financial resources reflecting the opportunity cost of those resources over time in alternative investments. New Technology: Being able to take advantage of technological advancements that can improve travel efficiency via either the vehicles themselves or the management system, resulting in reduced delays, energy consumption and greenhouse gas emissions. Integration with Land Use Decisions: Encouraging land use patterns that support multiple transportation choices and reduce travel distances, VMT, and congestion. Improved Planning Processes: Developing and using advanced planning models and techniques that can reflect complex interactions between transportation, land use and travel behavior, and illustrating tradeoffs among key economic, social, and environmental goals. Strategic Planning, Monitoring and Evaluation: Improving efforts in order to design and evaluate alternatives more strategically and effectively in meeting multiple goals, minimizing negative impacts, and achieving sustainable outcomes. Also includes using performance measures and standards to track results and improve management. Source: Maryland Department of Transportation. Maryland Transportation Plan. January 2009 pages 32-33; and, A Sustainable Transportation Agenda at MDOT (a brochure); Maryland Department of Transportation; page 3.
Section 2.7 Best Practices in Sustainable Transportation from Other States Of course, lessons are available from within the Unites States. Oregon, Vermont, and Maryland are ranked 1, 2, and 3 by the Sierra Club in terms of their land use planning efforts to control sprawl. Florida, Maine, New Jersey, Rhode Island, and Washington are added to this list as states where there is some significant presence of state level growth management policies that include consistency requirements. Others have added Georgia, California, and Hawaii. The degree of planning consistency achievement is subject to variable interpretations since there are various forms of consistency. One form of consistency involves project compliance with state-level objectives and strategies. Another form involves compliance with local-government objectives and strategies. A third involves consistency with district, sub-area, or corridor level objectives and strategies. Most states are placing some emphasis on sustainability. Maryland’s DOT has one of the more impressive programs with a good track record in smart growth achievement. It also has measures under consideration that seem to be responsive to the list of lessons learned from Germany. Those measures guiding Maryland’s future directions for sustainable transportation are highlighted in the text box to follow.

Hawaii Statewide Transportation Plan Update Issue Paper on Integration of Transportation Planning and Design
- 20 -
The Maryland measures focus more on addressing sustainable transport through innovation, design, and technology. Maryland addresses the vehicles and facilities. What are missing from Maryland’s list of measures in comparison to Germany’s list are those measures that change human travel behavior - measures such as travel pricing, and service packaging. Transportation planners can draw from both US and international best practices in sustainable transport and smart growth from those locations with proven success statistics such as demonstrated by Germany. Such an approach will distinguish Hawaii from other states by placing Hawaii in the forefront of sustainability in transportation, and using best practices to achieve measurable results. Section 2.8 Context Sensitive Solutions According to the FHWA, Context Sensitive Solutions (CSS) is a “collaborative, interdisciplinary approach that involves all stakeholders to develop a transportation facility that fits its physical setting and preserves scenic, aesthetic, historic, and environmental resources, while maintaining safety and mobility. CSS is an approach that considers the total context within which a transportation improvement project will exist."31 Others expand the CSS definition to include, “respects design objectives for safety, efficiency, capacity, and maintenance, while integrating community objectives and values relating to compatibility, livability, sense of place, urban design, cost, and environmental impacts.”32 This means that when CSS principles are applied to transportation projects, a much broader range of traffic solutions through collaborative planning, design and development occur. This also means that stakeholders are involved at the beginning of a traffic design process rather than at the end. The Institute of Transportation Engineers (ITE) Proposed Recommended Practice, Context Sensitive Solutions in Designing Major Urban Thoroughfares for Walkable Communities advances the successful use of CSS in the planning and design of major urban thoroughfares for walkable communities. It provides guidance and demonstrates how CSS concepts and principles may be applied in roadway improvement projects that are consistent with their physical settings. Examples are provided showing how the principles of CSS have been applied to support walkable communities. The ITE report takes many of the international best practices identified in earlier reports and translates those successes into U.S. design standards.33
31 Federal Highway Administration. Accessed December 2009. (www.fhwa.dot.gov/csd/index.htm) 32 Atlanta Regional Commission, Urban Design Collaborative. Context Sensitive Street Design. December 2001. Page 4. 33Institute of Transportation Engineers (ITE). Context Sensitive Solutions in Designing Major Urban Thoroughfares for Walkable Communities, An ITE Proposed Recommended Practice. 2006.

Hawaii Statewide Transportation Plan Update Issue Paper on Integration of Transportation Planning and Design
- 21 -
Eight Characteristics of Context Sensitive Solutions 1. Communication with all stakeholders is open, honest, early, and continuous. 2. A multidisciplinary team is established early, with disciplines based on the needs of
the specific project, and with inclusion of the public. 3. A full range of stakeholders is involved with transportation officials in the scoping
phase. The purposes of the project are clearly defined, and consensus on the scope is forged before proceeding.
4. The highway development process is tailored to meet the circumstances. This process should examine multiple alternatives that will result in a consensus of approach methods.
5. A commitment to the process from top Division of Highways officials and local leaders is secured.
6. The public involvement process, which includes informal meetings, is tailored to the project.
7. The landscape, the community, and valued resources are understood before engineering design is started.
8. A full range of tools for communication about project alternatives is used (e.g., visual aids, renderings, etc.).
Source: FHWA Implementing Guidance on SAFETEA-LU
Seven Qualities That Characterize Excellence in Transportation Design
1. The project is a safe facility for both the user and the community. 2. The project is in harmony with the community, and it preserves environmental, 3. Scenic, aesthetic, historic, and natural resource values of the area; i.e., exhibits
context sensitive design. 4. The project exceeds the expectations of both designers and stakeholders and
achieves a level of excellence in people's minds. 5. The project involves efficient and effective use of the resources (time, budget,
community) of all involved parties. 6. The project is designed and built with minimal disruption to the community. 7. The project is seen as having added lasting value to the community.
Source: FHWA Implementing Guidance on SAFETEA-LU
SAFETEA-LU implementing guidance defines CSS by the eight “characteristics of the process that yield excellence” and the seven “qualities that characterize excellence in transportation design.”

Hawaii Statewide Transportation Plan Update Issue Paper on Integration of Transportation Planning and Design
- 22 -
Seven states participated in an FHWA Pilot Project to implement Context Sensitive Street Design.34 Each of these states embraced this design process in ways that integrated best into their existing transportation departments. Examples of how CSS was incorporated into the design process of each of these states include: Connecticut: The Connecticut DOT promoted CSS design through development of a training course for engineers in collaboration with the University of Connecticut’s Engineering Department. Connecticut DOT has viewed CSS as “making the road blend in with the surrounding environment and community”. Designers are allowed to make design decisions based on the impacts to the community, rather than blindly following design criteria. Designers are required to be aware of the environment and the qualities of the area that the community feels are important. This includes preservation of farmland, avoiding historic sites and maintaining scenic areas.35 Kentucky - The Kentucky Transportation Cabinet held extensive training workshops in context sensitive design. These workshops were geared toward all participants in the project development phases. In 2005, Kentucky updated their highway design manual to include new guidance and detail to some areas that had been previously lacking or vague regarding CSS. As a result of Context Sensitive Design principles, Kentucky now directs the designer to be flexible in decision-making. Design decisions should consider equally safety, mobility, while preserving scenic, aesthetic, historic, environmental, and community values. Design criteria shown in AASHTO’s “A Policy on Geometric Design of Highways and Streets” are intended as a guide allowing flexibility to encourage independent designs.36 Maryland – Maryland has been an early and continuous leader in the development of CSS practices for transportation project development.37 In May 1998, The Maryland Department of Transportation, FHWA, and AASHTO organized a workshop titled “Thinking Beyond the Pavement.” This workshop attracted 325 participants from all over the country, and from this a summary of principles and strategic plan was developed. The Maryland DOT State Highway Administration’s “Thinking Beyond The Pavement” guides implementation and shows best practices from: charettes to identify project development processes; a project evaluation instrument; and teams established to review and implement project improvement strategies.38
34 Atlanta Regional Commission, Urban Design Collaborative. Page 29. 35 Bard, Carl, et al. Pathways to the Past. Connecticut Department of Transportation and the Connecticut Commission on Culture and Tourism: The Connecticut Department of Transportation’s “Context Sensitive” Approach to Roadway Design. 2007. Pages 39-42. 36 Kentucky Transportation Cabinet. Highway Design Manual, HD-103. January 2005. Page 5. 37 Maryland State Highway Administration. Context Sensitive Solutions for work on Maryland’s Byways. February 2008. Pages 3 and 9. 38 Maryland State Highway Administration and the University of Maryland. Thinking Beyond The Pavement Conference Brochure. 1998.

Hawaii Statewide Transportation Plan Update Issue Paper on Integration of Transportation Planning and Design
- 23 -
Maryland identifies the hallmark of CSS as being a cooperative working arrangement whereby all of the interested points of view are included from project conception to implementation. Minnesota - The Minnesota DOT is incorporating context sensitive design into all aspects of a transportation project development’s planning, design, construction, and operations. Minnesota views CSS as the art of creating and sustaining transportation public works that satisfy users, stakeholders, and neighboring communities. They do this by integrating and balancing projects with the context and setting in a sensitive manner relying upon broadly-informed planning, consideration of differing values and perspectives, and tailoring of designs and solutions to unique project circumstances. Minnesota uses a collaborative and interdisciplinary approach that includes early and ongoing involvement of key stakeholders to ensure that transportation projects not only perform safely and efficiently, but also in harmony with the natural, social, economic, and cultural environment. Minnesota has developed many implementation resources, including the use of visualization technologies to support CSS.39 Utah - The Utah DOT has been recognized by AASHTO for its “institutionalization” of CSS. Utah has developed a comprehensive approach to implementation of context sensitive design. It is focused on community outreach and project development. Utah’s initiative includes assessment of stakeholder attitudes and internal practices, an implementation and staff training plan, and post-implementation assessment. The agency’s new logo, “UDOT: Connecting Communities” reflects the statewide CSS philosophy.40
New Jersey – The first sentence of “Flexible Design of New Jersey’s Main Streets” observes that 95% of problem solving is properly defining the problem. If the problem is defined as the need to move traffic quickly through a community, it will lead to one set of design solutions. If the problem is defined as the need to preserve livability in the face of growing traffic, it will lead to another set of design solutions. Innovative designs proposed by engineers during New Jersey DOT’s CSS design training course show that different problem definitions lead to very different design solutions. The New Jersey training program for transportation professionals, along with stakeholders in New Jersey host communities, ensures CSS design options and opportunity awareness. The program emphasizes the use of effective public involvement techniques, implementation of design flexibility, and introducing the concept and importance of place making.41 Vermont – Vermont’s Agency of Transportation (VTrans) has emphasized project specific CSS flexibility. During a recent presentation on the Lake Champlain Bridge, project team members
39 Minnesota Department of Transportation, Acting Division Director, Engineering Services. Design Policy- “Design Excellence through Context Sensitive Design Solutions.” October 2006. Page 1. 40 American Association of State Highway and Transportation Officials (AASHTO) Center for Excellence. Best Practices in Context-Sensitive Design, 2005 Competition. 2006. Pages 28-29. 41 New Jersey Department of Transportation. Flexible Design of New Jersey’s Main Streets. Prepared by the Voorhees Transportation Policy Institute, Edward J. Bloustein School of Planning & Public Policy and Rutgers, the State University of New Jersey. 2000. Preface.

Hawaii Statewide Transportation Plan Update Issue Paper on Integration of Transportation Planning and Design
- 24 -
asked the public for input regarding features that should be included in the design, such as sidewalks, bicycle lanes, lighting and materials, as well as the overall style of the new bridge. VTrans, in partnership with the Vermont Arts Council and the Village of Danville, embarked on a multiyear CSS design pilot project to integrate artistic enhancements in the redevelopment of a portion of US 2 through the village center. The goal of the project is to provide a safe, attractive, and comfortable pedestrian environment in the village while respecting the form and function of the setting. Further project goals include enhancing the aesthetic appreciation of the historic, rural townscape while still providing for the mobility needs of this National Historic Society facility.42 Other states recognized for having progressive approaches toward CSS with mission, vision, value, goals or measure statements identifying CSS include Alaska, Arizona, California, Florida, Nebraska, New Mexico, Oregon, Pennsylvania, Virginia and Washington.43 FHWA has strongly advocated CSS and encouraged states not to wait for FHWA and AASHTO to provide guidance before initiating their own programs.44 CSS language was included in SAFETEA-LU in 2005, promoting consideration of CSS in the planning and project development process.45 The State of Hawaii Department of Transportation has used the CSS process in a few transportation planning projects. By involving the community in a Context Sensitive Solutions process, DOT is able to get the community’s educated input into the different alternatives presented. CSS is an inherent part of the federal airport noise regulations and guidelines which seek to involve the nearby residents in airport decision-making to ensure land use compatibility.
42 New York and Vermont Transportation Agencies to hold public meetings regarding the Lake Champlain Bridge. News Release. December 2009. 43 ATR Institute; New Mexico DOT, Research Bureau. Context Sensitive Solutions Performance Measures Literature Review. June 2006. Page 4. 44 Gee, King W., FHWA Associate Administrator for Infrastructure. Sensitive Design/Thinking Beyond The Pavement; CSS memorandum. October 2002. Page 1. 45 Safe, Accountable, Flexible, Efficient Transportation Equity Act: A Legacy for Users (SAFETEA-LU) Section 6008 109 (c) (2) of title 23.

Hawaii Statewide Transportation Plan Update Issue Paper on Integration of Transportation Planning and Design
- 25 -
Section 3.0 How 2002 HSTP Treated Planning and Design Although many of the basic elements of the planning and design concepts addressed within this issue paper have existed for many years and have been principles included within Hawaii DOT projects, the 2002 HSTP did not discuss these planning and design approaches. The following references were made within the plan’s goals and objectives:
2002 HSTP Goal I: Achieve an integrated multi-modal transportation system that provides mobility and accessibility for people and goods. Goal I includes a reference to “smart growth” under Objective 2: To increase the efficiency of the air, land, and water transportation systems’ operations. The statement, “Support ‘smart growth’ initiatives in land use planning” was listed as an example under “Employ and encourage strategies to reduce transportation demand.” 2002 HSTP Goal III: Protect and enhance Hawai’i’s unique environment and improve its quality of life. Goal III includes a reference to sustainability under Objective 1: To provide an air, land, and water transportation system that is environmentally compatible and sensitive to cultural, historic and natural resources. The statement, “Encourage sustainability of natural and human resources and livability of communities in infrastructure development” was listed as an example under “Provide an infrastructure and facilities that are environmentally friendly, safe, and appropriate to each community’s character and scale.” 2002 HSTP Goal III included a reference to CSS under Objective 1. The statement, “Consider adopting flexible design standards and context-sensitive design practices” was listed as an example under “Provide an infrastructure and facilities that are environmentally friendly, safe, and appropriate to each community’s character and scale.”
The inclusion of the reference to CSS in the 2002 HSTP is highly commendable considering the fact that FHWA was still exploring the merits of this best practice at the time the 2002 HSTP was completed. Since then, CSS has been practiced more and has become a high priority within many state DOTs. The 2002 HSTP made no references to complete streets nor transit oriented development.

Hawaii Statewide Transportation Plan Update Issue Paper on Integration of Transportation Planning and Design
- 26 -

Hawaii Statewide Transportation Plan Update Issue Paper on Integration of Transportation Planning and Design
- 27 -
Section 4.0 Sustainability in Hawaii Section 2 discussed the topics of Complete Streets, Transit Oriented Development (TOD), Smart Growth, and Context Sensitive Solutions (CSS). Much of the content in Section 2 related to how these new approaches achieve “sustainability” within the framework of integrating transportation planning and design. This section broadens the discussion to include more emphasis on the topic of sustainability in Hawaii and how sustainability applies to all transportation modes. Section 4.1 Hawaii 2050 Sustainability Plan
Figure 5: Hawaii 2050 Sustainability Plan Goals
The Hawaii 2050 Sustainability Plan provides five over-arching goals to guide county sustainability efforts as shown in Figure 5.46 The shape of a star is used to reflect the equal importance, inter-relationship, and inter-dependence of the five sustainability goals. A report entitled Hawaii 2050 Update, Relating to Sustainability was prepared in response to Act 225, 2008 Session Laws of Hawaii.47
46 Hawaii 2050 Sustainability Task Force. Hawaii 2050 Sustainability Plan, Charting a Course for Hawaii’s Sustainable Future. January 2008. Page 9. 47 University of Hawaii at Mānoa Social Sciences Policy Center. Hawaii 2050 Update, Relating to Sustainability: in response to Act 225, 2008 Session Laws of Hawaii. January 2010.

Hawaii Statewide Transportation Plan Update Issue Paper on Integration of Transportation Planning and Design
- 28 -
The Hawaii 2050 Sustainability Plan defines sustainability as a Hawaii that achieves the following:
• Respects the culture, character, beauty and history of our state’s island communities; • Strikes a balance between economic, social and community, and environmental
priorities; and, • Meets the needs of the present without compromising the ability of future generations
to meet their own needs. The Hawaii 2050 Update released for the 2010 legislative session recommended that the sustainability goals and definition be incorporated as a new section in HRS Chapter 226.48 Legislation to achieve this recommendation did not advance through the 2010 legislative session and will need to be taken up in the 2011 legislation session.49 “Smart Growth” is addressed in the Hawaii 2050 Sustainability Plan, and it is one way to make the Land Use and Transportation connection. Smart Growth is offered as one mechanism to achieve three of the five state sustainability goals: Goal #2: The Economy, Goal #3: Environment and Natural Resources, and Goal #4: Community and Social Well Being. The Hawaii 2050 Sustainability Plan and the Hawaii 2050 Update identify sets of indicators to monitor and measure the success toward becoming a more sustainable Hawaii. Many of these involve transportation performance measures such as:50
• Change in annual vehicle miles traveled (%) • Registered vehicles (#) • Public transportation ridership (#, %) • Use of ridesharing and alternative transportation (%) • Non-motorized trips (%) • Commute time (#)
The Hawaii 2050 Sustainability Plan is referenced as part of the Objectives of the HSTP Update with a direct set of linkages between the Hawaii 2050 Sustainability Plan goals and Performance Measures regarding sustainability. The HSTP Update can offer a multi-modal balance by suggesting performance measures applicable to airports and harbors as well as highways.
48 UH Mānoa Social Sciences Policy Center. Page 2. 49 SB2532 HD1 was last scheduled for a Conference Committee Meeting on April 23, 2010, but did not pass out of Conference Committee. This legislation will need to be taken up in the 2011 Legislative Session. 50 Hawaii 2050 Sustainability Task Force. Page 5. and UH Mānoa Social Sciences Policy Center. Pages 28 and 29.

Hawaii Statewide Transportation Plan Update Issue Paper on Integration of Transportation Planning and Design
- 29 -
Section 4.2 Airport, Harbors, and Ports Sustainability Airport sustainability best practices use the triple bottom line approach referenced in the Hawaii 2050 Sustainability Plan containing the elements of environment, economic and social approaches. The Airport Cooperative Research Program, an arm of the Transportation Research Board (TRB), has released a report titled Airport Sustainability Practices that contains a comprehensive inventory of sustainability practices at a range of both domestic and international airports.51 Airport environmental sustainability practices listed in the Transportation Research Board report include twelve environmental practices currently used at airports worldwide52:
1. Measuring Water Conservation 2. Monitoring Water Conservation 3. Water Quality 4. Climate Change 5. Air Quality 6. Land Use 7. Biodiversity 8. Environmentally Sustainable Materials 9. Waste 10. Noise and Aesthetics 11. Energy 12. Green Buildings
Most airports use an Environmental Management System (EMS) often following the International Organization for Standardization (ISO) 14001 standard. The TRB Report differentiates these standards with, “An EMS is a business management practice that allows an organization to strategically address environmental matters and to outline specific activities for the implementation of an organization’s environmental policy. Several EMS frameworks exist; most are based on the ISO 14001 standard.”53 Globally, more than 130,000 organizations have certified their EMSs to the ISO 14001 standard. Airport economic and social sustainability practices sometimes involve the ISO 14001 standard. For example, contracting sometimes gives preferential treatment toward ISO-compliant businesses. TRB conducted a survey of several airports worldwide, requesting input on an economic sustainability self-assessment and a social sustainability self-assessment, as shown in Table 4. 51 Transportation Research Board. Airport Sustainability Practices; Airport Cooperative Research Program, a synthesis of airport practice, ACRP Synthesis 10. Washington, DC. 2008. 52 Transportation Research Board. ACRP Synthesis 10. Summary, Page 2. 53 Transportation Research Board. ACRP Synthesis 10. Page 18.

Hawaii Statewide Transportation Plan Update Issue Paper on Integration of Transportation Planning and Design
- 30 -
Table 4: Environmental, Economic, and Social Practices in Airport Sustainability Practices
Environmental Practices Economic Practices Social Practices Water Conservation Economic Sustainability Self-
Assessment Social Sustainability Self-Assessment
Water Quality Local and Responsible Economic Practices
Stakeholder Relationships
Air Quality Local Hiring Employee Practices and ProceduresClimate Change Community Contributions Sustainable TransportationLand Use Valuing Sustainability Accessibility Biodiversity Sustainability Research and
Development Local Identity, Culture and Heritage
Environmentally Sustainable Materials
Incentives for Sustainable Behavior Indoor Environmental Quality
Waste Employee Well-Being Noise and Aesthetics Passenger Well-Being Energy Public Awareness and EducationGreen Buildings Alleviating Road CongestionMeasuring and Monitoring
Source: Transportation Research Board. Airport Sustainability Practices, ACRP Synthesis 10, Chapters 6, 7 & 8. The Massachusetts Port Authority, otherwise known as Massport, governs Logan Airport, Hanscom and Worcester Airports, and the Port of Boston. Massport has received recognition for its sustainable efforts. Boston Logan’s Terminal A is the first airport terminal in the world to be LEED-Certified. LEED, which stands for Leadership in Energy & Environmental Design, is an internationally recognized green building certification system developed by the US Green Building Council. Massport also has three ISO 14001 Certified Facilities at Hanscom Field, Conley Terminal, and Logan Airport. Other environmental initiatives at Massport include using “warm mix” asphalt to repave airport runways, and Logan Airport was the first airport in the United States to use this technology. Using warm mix asphalt has saved fuel and decreased emissions by approximately 20%. The Terminal B Garage of Logan Airport now has solar photovoltaic panels on its roof, generating power and LED lighting in the garage to reduce electricity consumption by 40%. The Logan Office Center is also powered by wind turbines. Logan Airport has used Compressed Natural Gas (CNG) buses to shuttle passengers for several years, in service long enough to rack up 13 million “clean air miles.”54 The ISO 14001 standard in sustainability plan development is also used by some harbors such as within Massport. Massport is an independent public authority which develops, promotes, and manages airports, ports, and bridges. Massport uses the triple bottom line approach when integrating planning and design. Sustainability has played a significant role in Massport’s
54 Massport and The Environment. http://www.massport.com/environment/Pages/GreenInitiatives.aspx

Hawaii Statewide Transportation Plan Update Issue Paper on Integration of Transportation Planning and Design
- 31 -
planning and decision-making. Massport has developed EMS for airport, port and bridge facilities and has achieved ISO 14001 certification for all.55 Another example of successful use of the ISO 14001 standard in sustainability plan development is the Port of Los Angeles. When the mayor issued an executive directive in 2007 to transform Los Angeles into the most sustainable large city in the country, the port was able to quickly respond, in part, because they were already ISO certified. ISO participation was one of thirty-two specific programs already in place that responded to the executive policy sustainability directive. The other programs included a green building policy, environmentally preferable purchasing policy, a climate action plan, and a green leasing policy. Altogether, the Port of Los Angeles has thirty sustainability programs, plans, and initiatives all prefaced by their intent: to balance the three categories of economic, social and environmental sustainability using the triple bottom line approach.56 The Sustainability Process Cycle for the Port of Los Angeles is pictured in the figure below.
Figure 6: Sustainability Process Cycle
Source: Port of Los Angeles Sustainability Assessment and Plan Formulation
55 Massachusetts Port Authority Maritime Department. Port Sustainability Progress Report. August 2008. Page 2. 56 Los Angeles Harbor Department. Port of Los Angeles Sustainability Assessment and Plan Formulation. Prepared pursuant to Mayoral Executive Directive #10. 2008. Page 14.

Hawaii Statewide Transportation Plan Update Issue Paper on Integration of Transportation Planning and Design
- 32 -
Figure 7 Alternative Marine Power, Port of Los Angeles
In 2001, with numerous environmental programs already in place, The Port of Los Angeles began researching and developing additional innovative environmental initiatives, such as Alternative Maritime Power (AMP). AMP is a one-of-a-kind air quality program that focuses on reducing emissions from container vessels docked at the Port of Los Angeles. Instead of running on diesel power while at berth, AMP-equipped ships “plug in” to shore side electrical power – literally an alternative power
source for oceangoing vessels. AMP technology is often referred to as “cold ironing” and has been used for naval vessels, Baltic ferries, and cruise ships operating in Alaska. The Port of Los Angeles is the first Port in the world to use AMP technology for in-service container ships. The Port is currently in discussions with several cruise lines to expand this technology to cruise ships.57 HDOT has begun making changes towards becoming more sustainable and taken some important initial steps to reduce energy in its own facilities. For example:58
• Honolulu International Airport Diamond Head Concourse Air Conditioning Chiller Plant—part of a planned three concourse air conditioning efficiency project. DOT received a $252,885 rebate check from Hawaiian Electric Company in 2009. The air conditioning system is 50% more energy efficient and will save the State DOT $885,000 a year in electricity bills. Once the other two concourse chiller plants are completed, the electricity bill savings will be $2.3 million annually, reducing CO₂ emissions by 6,413 tons per year.
• Photovoltaic (PV) Power Systems at seven HDOT facilities across the state—a public-
private partnership with Hoku Solar. Sites with PV systems installed include Līhu‘e Airport, Kona International Airport at Keāhole, Hilo International Airport, Kahului Airport Hangar and Cargo Building, DOT Highways Division Baseyard in Līhu‘e, and the Nāwiliwili Harbor DOT Administration Building. Together, these projects will produce 1.2 million
57 Alternative Marine Power, The Port of Los Angeles. http://www.portoflosangeles.org/environment/alt_maritime_power.asp 58 Hawaii Airports Modernization Plan. www.hawaiiairportsmodernization.com

Hawaii Statewide Transportation Plan Update Issue Paper on Integration of Transportation Planning and Design
- 33 -
hours of clean, solar energy annually, which is enough to power up to 150 homes. Over the 20-year system lifetime, these systems collectively are targeted to offset 12,000 tons of CO2 emissions, which is equivalent to removing 1,400 cars off the road. Figure 8: Photovoltaic Panels at the DOT Highways Division Baseyard in Līhu‘e

Hawaii Statewide Transportation Plan Update Issue Paper on Integration of Transportation Planning and Design
- 34 -

Hawaii Statewide Transportation Plan Update Issue Paper on Integration of Transportation Planning and Design
- 35 -
Section 5.0 Recommendations For The HSTP Update Best Practices in Planning and Design The Hawaii statewide transportation planning process provides an opportunity to consider the increased use of international best practices in planning and design now being adopted by other states and the federal government. The transportation planning process for the HSTP Update can be the mechanism to shape both the level and quality of service of the statewide multi-modal transportation system. The HSTP Update can assist in providing the guidance on how best to solve transportation problems through progressive planning and design approaches such as the examples set forth in this issue paper. Sustainability The HSTP Update can assist in making Hawaii DOT one of the first state agencies to be responsive to state sustainability legislation. The Hawaii DOT can include a direct set of linkages between the Hawaii 2050 Sustainability Plan goals and those of the HSTP Update. The Hawaii DOT can offer substantive assistance in refining the Hawaii 2050 Sustainability Plan indicators when the performance measures are completed as part of the HSTP Update. The HSTP Update can offer a multi-modal balance by suggesting performance measures for addition to the Hawaii 2050 Sustainability Plan applicable to all modes. Throughout the research conducted for this issue paper the triple bottom line approach to evaluating multi-modal transportation sustainability has been prevalent. All three categories of economic, social, and environmental sustainability are considered, balanced and are mutually reinforcing. Transportation’s mission is no longer about just moving people and goods. 59 Transportation fundamentally allows society to achieve economic, social, and environmental sustainability. The HSTP Goals and Objectives can identify the triple bottom line approach as the basis for future planning and design integration. International best practices such as use of an EMS using the ISO 14001 standard can be consulted. The HSTP Update can draw from both U.S. and international best practices in sustainable transport and smart growth from those locations with proven success statistics. Such an approach will distinguish Hawaii from other states who typically limit their efforts to those from other North American experiences which sometimes have merit, but are not with the impressive results achieved by other countries. Policies, programs, and guidelines can be designed with an eye towards changed travel behavior.
59 American Association of State Highway Officials. AASHTO 2009 Emphasis Areas: Authorization, Sustainability, Strategic Freight Plan. 2008.

Hawaii Statewide Transportation Plan Update Issue Paper on Integration of Transportation Planning and Design
- 36 -
Transit Oriented Development While the counties take the lead in developing TOD planning districts, many TOD districts will be located where state transportation facilities are dominant features near or within those districts. A cooperative approach to working with the counties can optimize the results of the TOD planning process. Policies and guidelines can ensure high quality and safe transportation access to TOD planning districts by all modes. Livable Communities Interagency coordination reflecting multi-department cooperation, the Countywide Transportation Planning Process (CTPP), and cooperation occurring at the federal level is proposed through Integrated Sub-Regional Area Planning (ISAP). The HSTP Update can help position Hawaii to be fully and proactively responsive to the joint DOT, HUD and EPA interagency “Partnership for Sustainable Communities” to help improve access to affordable housing, provide more transportation options, and lower transportation costs while protecting the environment. Six guiding “livability principles” can be used to coordinate federal transportation, environmental protection, and housing investments at their respective agencies. The Six Livability Principles are: • Provide more transportation choices. Develop safe, reliable, and economical transportation
choices to decrease household transportation costs, reduce our nation’s dependence on foreign oil, improve air quality, reduce greenhouse gas emissions, and promote public health.
• Promote equitable, affordable housing. Expand location- and energy-efficient housing choices for people of all ages, incomes, races, and ethnicities to increase mobility and lower the combined cost of housing and transportation.
• Enhance economic competitiveness. Improve economic competitiveness through reliable and timely access to employment centers, educational opportunities, services and other basic needs by workers, as well as expanded business access to markets.
• Support existing communities. Target federal funding toward existing communities—through strategies like transit oriented, mixed-use development, and land recycling—to increase community revitalization and the efficiency of public works investments and safeguard rural landscapes.
• Coordinate and leverage federal policies and investment. Align federal policies and funding to remove barriers to collaboration, leverage funding, and increase the accountability and effectiveness of all levels of government to plan for future growth, including making smart energy choices such as locally generated renewable energy

Hawaii Statewide Transportation Plan Update Issue Paper on Integration of Transportation Planning and Design
- 37 -
• Value communities and neighborhoods. Enhance the unique characteristics of all communities by investing in healthy, safe, and walkable neighborhoods—rural, urban, or suburban.60
DOT Secretary LaHood said, “Creating livable communities will result in improved quality of life for all Americans and create a more efficient and more accessible transportation network that serves the needs of individual communities. Fostering the concept of livability in transportation projects and programs will help America’s neighborhoods become safer, healthier, and more vibrant.” One of the first Livable Communities Grants was awarded in October 2010 to the C&C of Honolulu’s Department of Planning and Permitting. 61 $2,383,424 was awarded to assist the C&C with implementing a Transit-Oriented Housing Strategy around the new rail system in the urban core to maintain and promote housing for low and moderate income families. The core partners for the project are the Hawaii Housing Alliance, Kamehameha Schools, Trust for Public Land, O‘ahu Land Trust, Urban Land Institute and the Hawaii Community Development Authority (HCDA). The anticipated project benefits were to increase the number of affordable/workforce housing units along the Honolulu Rail Corridor and decrease time associated with permitting processes for housing projects.
60 HUD-DOT-EPA Partnership for Sustainable Communities. http://www.epa.gov/dced/partnership/index.html#livabilityprinciples 61 http://portal.hud.gov/portal/page/portal/HUD/press/press_releases_media_advisories/2010/HUDNo.10-242

Hawaii Statewide Transportation Plan Update Issue Paper on Integration of Transportation Planning and Design
- 38 -

Hawaii Statewide Transportation Plan Update Issue Paper on Integration of Transportation Planning and Design
- 39 -
Resources
American Association of State Highway Officials. AASHTO 2009 Emphasis Areas: Authorization,
Sustainability, Strategic Freight Plan. 2008. American Association of State Highway and Transportation Officials (AASHTO) Center for
Excellence. Best Practices in Context-Sensitive Design, 2005 Competition. 2006. American Planning Association, Hawaii Chapter. Transit and Transit Oriented Development, An
Issue Paper. August 2007. Atlanta Regional Commission, Urban Design Collaborative. Context Sensitive Street Design.
December 2001. http://www.atlantaregional.com/local-government/local-planning/best-practices/best-practices
ATR Institute; New Mexico DOT, Research Bureau. Context Sensitive Solutions Performance
Measures Literature Review. June 2006. Banister, David, et al. Making Sustainable Transport Politically and Publically Acceptable:
Lessons From The EU, USA and Canada; Institutions and Sustainable Transport: Regulatory Reform in Advanced Economies. University College of London, Rutgers University and Laval University, Quebec City. 2007.
Bard, Carl, et al. Pathways to the Past. Connecticut Department of Transportation and the
Connecticut Commission on Culture and Tourism: The Connecticut Department of Transportation’s “Context Sensitive” Approach to Roadway Design. 2007.
Bipartisan Policy Center National Transportation Policy Project. Performance Driven: A New
Vision for U.S. Transportation Policy. June 9, 2009. Boarnet, Marlon G. Highways and Economic Productivity: Interpreting Recent Evidence.
University of California Transportation Center Working Paper No. 291. October 1995. Booz Allen Hamilton and Weslin Consulting Services, Inc. Transit Oriented Development Key
Success Factors. Prepared for the City and County of Honolulu, Department of Budget and Financial Services. November 2006.
Brizdle, John and Simpson, MacKinnon. Streetcar Days In Honolulu – Breezing Through
Paradise. October 2000. Buehler, Ralph, et al. Making Transportation Sustainable: Insights from Germany. Brookings
Institution Metropolitan Policy Program. April 2009. Table 1, Page 7.

Hawaii Statewide Transportation Plan Update Issue Paper on Integration of Transportation Planning and Design
- 40 -
California Department of Transportation. Statewide Transit-Oriented Development Study –
Factors for Success in California, Final Report. September 2002. Chiddix, Jim and Simpson, MacKinnon. Next Stop Honolulu – The Story of the Oahu Railway &
Land Company. September 2004. City and County of Honolulu Department of Planning and Permitting Transit Oriented
Development Website. www.honoluludpp.org/planning/TOD/TOD.pdf Deal, Brian, et al. Growth Management and Sustainable Transport: Do Growth Management
Policies Promote Transit Use? University of Illinois, Journal of Public Transportation. 2009. Department for Transport, London, UK. Building Sustainable Transport into New Developments:
A Menu of Options for Growth Points and Eco-towns. April 2008. Ernst, Michelle and Shoup, Lilly. Dangerous by Design. Surface Transportation Policy
Partnership and Transportation For America. 2009. Federal Highway Administration. Highway Design Handbook For Older Drivers and Pedestrians.
Publication No. FHWA-RD-01-103. May 2001. Federal Highway Administration. <www.fhwa.dot.gov/csd/index.htm> FHWA International Technology Exchange Program. Geometric Design Practices for European
Roads. June 2001. Gee, King W., FHWA Associate Administrator for Infrastructure. Sensitive Design/Thinking
Beyond The Pavement; CSS memorandum. October 2002. Greenough, Horatio. Form and Function: Remarks on Art. Edited by Harold A. Small, Berkeley,
University of California Press. 1947. Hawaii 2050 Sustainability Task Force. Hawaii 2050 Sustainability Plan, Charting a Course for
Hawaii’s Sustainable Future. January 2008. Hawaii 2050 Sustainability Task Force. Hawaii 2050 Sustainability Plan Executive Summary.
January 2008. Page 3. Hawaii Department of Transportation. Hawaii Statewide Transportation Plan “Setting The
Course.” September 2002. Hawaii Department of Transportation. Hawaii Strategic Highway Safety Plan, 2007 thru 2012.
2006.

Hawaii Statewide Transportation Plan Update Issue Paper on Integration of Transportation Planning and Design
- 41 -
Hawaii Department of Transportation. Interim Progress Report: Complete Streets Task Force.
Report to the Legislature of the State of Hawaii as required under Act 54, Session Laws of Hawaii 2009. <http://lrbhawaii.info/reports/legrpts/dot/2010/act54_slh09.pdf>
HUD-DOT-EPA Partnership for Sustainable Communities.
http://www.epa.gov/dced/partnership/index.html#livabilityprinciples and http://portal.hud.gov/portal/page/portal/HUD/press/press_releases_media_advisories/2010/HUDNo.10-242
Institute of Transportation Engineers (ITE). Bicycling and Walking in The Nineties and Beyond:
Applying Scandinavian Experience to America’s Challenges. ITE. November 1994. Institute of Transportation Engineers (ITE). Context Sensitive Solutions in Designing Major
Urban Thoroughfares for Walkable Communities, An ITE Proposed Recommended Practice. 2006.
Issues In Sustainable Transportation; Global Environmental Issues. Volume 6, Number 2. 2006. Kentucky Transportation Cabinet. Highway Design Manual, HD-103. January 2005. LaHood, Ray, DOT Secretary, HUD Secretary Shaun Donovan and EPA Administrator Lisa
Jackson. Interagency Partnership for Sustainable Communities Press Release. June 16, 2009.
Los Angeles Harbor Department. Port of Los Angeles Sustainability Assessment and Plan
Formulation. Prepared pursuant to Mayoral Executive Directive #10. 2008. Litman, Todd and Laube, Felix. Automobile Dependency and Economic Development. Victoria
Transport Policy Institute. August 2002. Lynott, Jana, et al. Planning Complete Streets For An Aging America. AARP Public Policy
Institute. May 2009. Maryland Department of Transportation. Maryland Transportation Plan. January 2009 Maryland State Highway Administration. Context Sensitive Solutions for work on Maryland’s
Byways. February 2008. Maryland State Highway Administration and the University of Maryland. Thinking Beyond The
Pavement Conference Brochure. 1998. Massachusetts Port Authority Maritime Department. Port Sustainability Progress Report.
August 2008.

Hawaii Statewide Transportation Plan Update Issue Paper on Integration of Transportation Planning and Design
- 42 -
Minnesota Department of Transportation, Acting Division Director, Engineering Services.
Design Policy- “Design Excellence through Context Sensitive Design Solutions.” October 2006.
National Transportation Policy Project; Bipartisan Policy Center. Performance Driven: A New
Vision for U.S. Transportation Policy. June 9, 2009. New Jersey Department of Transportation. Flexible Design of New Jersey’s Main Streets.
Prepared by the Voorhees Transportation Policy Institute, Edward J. Bloustein School of Planning & Public Policy and Rutgers, the State University of New Jersey. 2000.
New York and Vermont Transportation Agencies to hold public meetings regarding the Lake
Champlain Bridge. News Release. December 2009. Newman, Peter and Kentworthy, Jeff. Sustainability and Cities: Overcoming Automobile
Dependence. Island Press, Washington, DC. 1999. Page 1. Norton, Peter. Fighting Traffic – The Dawn of the Motor Age in the American City. 2008. Oregon Department of Transportation. Sustainability Plan, Volume 1: Setting the Context.
September 2008. Powell, Robert E., PhD. The Tangle of Growth: A Dynamic Analysis – Growth, Sprawl,
Transportation, Housing, Farm Policy, and Wages. April 2001. Rousseau, Gabe. Handy Lessons From Overseas on Walking and Bicycling. Public Roads, USDOT
FHWA Online Newsletter. January/February 2010. Soon, Cheryl, PhD, FAICP. Transit Oriented Development: What Does It Mean for Hawaii?
Presentation to the 2009 Hawaii Congress of Planning Officials (HCPO)/Hawaii Geographic Information Coordinating Council (HIGICC) Conference. September 2009. Accessed May 2010. <http://resilientcommunitieshawaii.org/presentations/04%20Honolulu%20Transit%20Oriented%20Development/Soon/Transit%20Oriented%20Development%20What%20Every%20Planner%20Should%20Know.pdf>
Transportation Research Board. Airport Sustainability Practices; Airport Cooperative Research
Program, a synthesis of airport practice, ACRP Synthesis 10. Washington, DC. 2008. University of Hawaii at Mānoa Social Sciences Policy Center. Hawaii 2050 Update, Relating to
Sustainability: in response to Act 225, 2008 Session Laws of Hawaii. January 2010.

Hawaii Statewide Transportation Plan Update Issue Paper on Integration of Transportation Planning and Design
- 43 -
U.S. Department of Transportation, Bureau of Transportation statistics. National Household Travel Survey 2001 Highlights Report, BTS03-05. 2001.
Wellar, Dr. Barry. Sustainable Transport Practices in Canada: Exhortation Overwhelms
Demonstration. Transport 2000 Canada. September 2006. Weslin Consulting Services, Inc. Waipahu Neighborhood TOD Plan Transportation and
Circulation Analysis. Prepared for the City and County of Honolulu Department of Planning and Permitting. June 2008.


Issue Paper #7 Transportation Security
In Preparation for the
Hawaii Statewide Transportation Plan Update
Prepared for Department of Transportation
State of Hawaii
Prepared by SSFM International, Inc. With HNTB
2011

Hawaii Statewide Transportation Plan Update Issue Paper on Transportation Security
- i -
Table of Contents
Foreword .................................................................................................................................1
Section 1.0 Security and the Hawaii Statewide Transportation Plan ...........................................3
Section 1.1 Evolving Definition of Security ...............................................................................3
Section 1.2 Types of Transportation-Related Security Risks .....................................................6
Section 1.3 Security Considerations in Transportation Planning ..............................................6
Section 1.4 Public Infrastructure Security Experience Since September 11, 2001 ....................7
Section 1.5 Government Roles in Security Preparedness .........................................................8
Section 1.6 Planning and Risk ................................................................................................11
Section 2.0 How Security Is Treated in Prior Transportation Plans in Hawaii and Current Plans
in Other States .......................................................................................................17
Section 2.1 Treatment of Security in the 2002 Hawaii Statewide Transportation Plan ...........17
Section 2.2 Treatment of Transportation Security in Other States’ Plans ...............................17
Section 3.0 How Hawaii Department of Transportation Handles Security .................................25
Section 3.1 The Airport System and Security .........................................................................25
Section 3.2 The Harbor System and Security .........................................................................28
Section 3.3 The Highway System and Security .......................................................................29
Section 3.4 The 2011 Asian Pacific Economic Cooperation Leaders’ Meeting ........................31
Section 3.5 The Transportation System and Emergency Preparedness ..................................31
Section 3.6 Biosecurity ..........................................................................................................32
Section 3.7 Transit Security ...................................................................................................33
Section 4.0 Recommendations for The Hawaii Statewide Transportation Plan Update .............35
Section 4.1 Proposed Goals and Objectives for HSTP Update...............................................35
Section 4.2 Recommendations for Hawaii Transportation Planning Regarding Security .........36
References ...............................................................................................................................39

Hawaii Statewide Transportation Plan Update Issue Paper on Transportation Security
- ii -

Hawaii Statewide Transportation Plan Update Issue Paper on Transportation Security
- 1 -
Foreword
The Hawaii state transportation planning process is being supported by the development of a series of issue papers. Task 7 of the contract requires examination of emerging issues that will have major impacts on Hawaii’s transportation future along with preparation of Issue Papers for each subject. The emerging issues for Hawaii’s transportation were selected by the Hawaii Statewide Transportation Plan Team as issues which may have a significant impact on Hawaii’s residents and their transportation needs. Many emerging issues are associated with the Federal Planning Requirements, changing trends, as well as shifts in public perception. This issue paper addresses the emerging issue of transportation security. SSFM is the lead consultant for the Hawaii Statewide Transportation Plan (HSTP) update, and they are supported by a team of consultants. This paper’s lead author is HNTB. This “Issue Paper #7 on Transportation Security” includes sections on:
• How the prior Hawaii Statewide Transportation Plan (2002 HSTP) treated transportation security;
• Treatment of Transportation Security at Airports, Harbors and Highways in Hawaii • Best practices from other states; and, • Proposed guidance to be included in the current Hawaii Statewide Transportation Plan
Update (HSTP Update). Issue papers in this series include:
Issue Paper #1: Impact of Federal Planning Requirements (Eight Planning Factors) Issue Paper #2: Climate Change and Sea Level Rise Issue Paper #3: Aging Population and Transportation Issue Paper #4: Fuel and Energy Scenarios for Hawaii Issue Paper #5: Land Use Planning Issue Paper #6: Planning & Design: Context Sensitive Solutions (CSS), Complete
Streets, Smart Growth, and Transit Oriented Development (TOD) Issue Paper #7: Transportation Security Issue Paper #8: System Preservation and Asset Management Issue Paper #9: Financial Scenarios Issue Paper #10: Environmental Coordination

Hawaii Statewide Transportation Plan Update Issue Paper on Transportation Security
- 2 -

Hawaii Statewide Transportation Plan Update Issue Paper on Transportation Security
- 3 -
Section 1.0 Security and the Hawaii Statewide Transportation Plan
Section 1.1 Evolving Definition of Security
Traditionally, security planning has involved preparation for and responses to natural disasters such as hurricanes, tsunamis, and earthquakes. Due to Hawaii’s geographic isolation as well as dependence on supplies from elsewhere, security during natural disasters means Hawaii needs to be self reliant for two or more weeks. Since September 11, the word “security” has taken on added meaning: concern for terrorist acts. For the purposes of this issue paper, the term security includes both minimizing danger from human purposefully-caused incidents as well as from damage by natural disasters. Hawai’i’s experience with security and transportation mirrors that of several other states; for many years it consisted of a combination of “guns, gates, and guards” along with emergency response plans. In recent years security approaches require greater collaboration with federal and other state agencies, investment in vulnerability and risk assessments, increased use of technology, and reallocation of budgets to address security needs as an ongoing task. The American Association of State Highway and Transportation Officials (AASHTO), in examining security issues involving America’s transportation infrastructure, concluded the following:
“Deadly and unprecedented terror attacks on infrastructure in the United States and Western Europe, including bombings on London’s subway system and Madrid’s commuter rail network, as well as the World Trade Center/Pentagon attacks, have forced state Department of Transportation (DOT) leaders to reassess their agencies’ security needs. Among DOTs, the top priorities that have emerged include better protection of critical transportation infrastructure and ensuring adequacy of emergency management capabilities.” 1
It is commonly accepted that no unit of government can provide perfect protection for all threats against the security of its residents, visitors, and commerce. However, it has become standard practice to identify and protect against the risks and vulnerabilities that pose the greatest threats. Hawaii follows that principle as evidenced by interviews with representatives of the Department of Transportation’s Airports, Harbors, and Highways divisions. Retired U.S. Coast Guard Admiral James Loy said, “Half a fence is no fence at all.” This suggests the need to think of security in systematic and thorough terms. Vulnerability and risk assessments for infrastructure must consider all the ways people and goods move and can
1 AASHTO Special Committee on Transportation Security. Homeland Security and State Departments of Transportation: Maintaining Strategic Direction for Protecting America’s Transportation System. January 2006.
Hawaii Statewide Transportation Plan Update Issue Paper on Transportation Security
- 4 -
move as well as how a terrorist could obtain access, affect, or modify the system to cause damage. Security assessments must continually consider and factor new forms of danger. This requires continued investment in as well as testing of planning and response systems. The implication for budgets, investigations, and ever-improving designs and operations are significant. The prior Hawaii Statewide Transportation Plan (HSTP), adopted in 2002, discusses security. However, in the years since it was adopted, there is a greater understanding of the risks and consequences of terrorism as well as natural disasters, with which Hawaii has much more experience. The HSTP Update needs to consider both the need for protection and the need to plan budgets that provide sufficiently for security. With no commonly accepted standards for approaches to and sufficiency of security, the HSTP Update needs to set a useful direction and framework without defining specific plans, actions, or funding levels. For obvious reasons, details of security planning and operations cannot be public information because if that were to be provided, security would be compromised. It is not the purpose of this issue paper, nor would it be appropriate, to provide an assessment of Hawaii’s transportation security system and processes. However, the experiences of other organizations can help point to useful public policy topics for consideration. With that approach in mind, typical gaps in transportation security identified through AASHTO research and other sources include the following:
• Interagency coordination • Sufficient funding for appropriate facility configuration, technology, staffing, and special
events such as the Asian Pacific Economic Cooperation (APEC) • Organizational structure • Technology • Communications • Training • Information sharing
To understand the Hawaii Department of Transportation’s (HDOT) needs, it is important to consider how risks are identified and how larger public policy issues are assessed relative to those risks. To evaluate risks, it is important to begin with simultaneous consideration of the functions and operations of the transportation infrastructure and how an incident could affect those functions and operations. It is somewhat simpler to consider environment-caused threats in that they follow principles of physics: they function on the basis of wind, gravity, heat, water, and force. Basically, these security threats function in predictable ways although their timing, location, and pattern cannot be predicted far in advance. The documented historic experience of these threats demonstrates that the loss of life and the damage to infrastructure has been greater than that

Hawaii Statewide Transportation Plan Update Issue Paper on Transportation Security
- 5 -
Federally Required Eight Planning Factors (SAFETEA-LU)and Security
1. Economy Consider effects of security vulnerability and risks on the
growth and sustainability of the State’s economy. 2. Safety
Consider safety issues associated with security risks. 3. Security
Consider security issues for motorized and non-motorized users of the system.
4. Accessibility and Mobility Consider whether security actions such as increasing
distances to selected targets or limiting access to certain areas may have an effect on accessibility and mobility. Consider whether certain risks pose threats of interruption or disruption of accessibility and mobility.
5. Environment Consider whether natural hazards and changes in the
environment such as sea level rise may pose short- or long-term risks.
6. Integration and Connectivity Consider whether security actions may make system
connectivity slower or more difficult. 7. System Management and Operations
Consider whether actions taken to manage the transportation system may provide secondary benefits to security such as the ability to monitor the flow of people and goods.
8. Preserve System Consider whether actions taken to improve security may
also have beneficial or negative effects on system preservation.
for human-caused threats to date. Haiti’s apparent loss of over 200,000 lives in one event far exceeds the loss of life from terrorist incidents around the world over the past two decades. Man-made security threats convey a greater sense of uncertainty and fear because perpetrators are thought to be intent on causing fear and widespread damage. While the probabilities of such incidents are small, the real effect of a single event can be significant. It is clearly in the public interest to prevent and defend against such incidents. However, it requires consistency, discipline, investment, and exercises that are “out of the box.” In addition, as evidenced by news stories about the introduction of new screening technologies and techniques, protection against terrorist incidents can cause concerns about whether individual privacy is respected in the process. Public agencies and private service providers such as airlines are continually challenged in their attempts to provide security without unduly affecting travelers and shippers. The public policy issues involved in protection of security while maintaining individual privacy are significant. The HSTP Update will need to recognize this trade-off but will not resolve it as public policy decisions on this issue go beyond one state’s transportation plan. In considering how the HSTP Update should treat security, it is important to understand how public agencies generally prepare for assessments and their corresponding and appropriate follow-up actions. The federal transportation law known as the Safe, Accountable, Flexible Efficient Transportation Equity Act (SAFETEA-LU) requires states to consider eight planning factors in development of their long-range transportation plans. While there are no requirements that these factors have to be evaluated in specific ways, states are expected to demonstrate that the eight planning factors have been taken into account in ways appropriate to the state, current trends, and anticipated conditions. When the planning factors were revised in the SAFETEA-LU legislation, security was separated from safety in recognition of its independent importance as shown in the sidebar.

Hawaii Statewide Transportation Plan Update Issue Paper on Transportation Security
- 6 -
Section 1.2 Types of Transportation-Related Security Risks
The security risks faced by users of the transportation system can be categorized into human-caused and natural environment-caused. For the purposes of this issue paper the focus is on both purposeful man-made threats and on natural environment-caused threats. Purposeful man-made security risks include attacks using one or more of the following means:
• Conventional (e.g., guns, improvised explosive devices) • Biological (e.g., anthrax or invasive alien species) • Chemical (e.g., poisons) • Novel (e.g., combinations of weapons or use of a previously unknown means, secondary
devices) • Nuclear (e.g., nuclear explosive device) • Radiological (e.g., distribution or explosion to scatter radioactive material, such as a
“dirty bomb”) • Cyber Terrorism (e.g. electronic, electro-magnetic, and cyber-disruptions) • Insider Threats • Accidental or unforeseen man-made situations, such as a plane crash or a military
tanker grounded on coral Natural threats caused by the environment include:
• Earthquake • Flood • Hurricane • Landslide • Tsunami
The effects these various threats carry range from loss of life to disruption of the economy. All can include substantial public costs of emergency response, medical care, infrastructure repair, or replacement. While the September 11 images of the destruction at New York’s World Trade Center area and the Pentagon are striking and indelible, less visible are the efforts needed by first responders, emergency medical personnel, fire protection, law enforcement, and for infrastructure repair and replacement. Response costs were not budgeted prior to those events and drew resources away from other planned activities. Loss of life, disruption to the economy, and reallocation of budgets are among the consequences of catastrophic events to be addressed by disaster planners.
Section 1.3 Security Considerations in Transportation Planning In recognition of the critical role that transportation plays in the mobility of people and commerce, there have been extensive reports written about security and transportation

Hawaii Statewide Transportation Plan Update Issue Paper on Transportation Security
- 7 -
planning. Furthermore, transportation is the front-line area of focus in enhancing security. This is no different in Hawaii, where nearly all of Hawaii’s goods are imported via the harbors or airports, and where inter- and intra-state mobility such as carriage of goods on the highways is closely linked with the functions and security of the Hawaii Department of Transportation. HDOT’s Airports and Harbors play an important role as gate keepers to these ports of entry, and work extensively with other state agencies and Federal agencies to control the entry of people, animals, insects, and other undesirable elements transported by aircraft or ships. Several events in the last several years illustrate the Hawaii Department of Transportation’s essential functions in security and transportation planning:
• The September 5, 2006, H-1 closure on Oahu as a result of damage to a freeway overpass caused by a military transport vehicle
• The October 15, 2006, Hawaii Island 6.7 Magnitude Earthquake, resulting in a total power loss on Oahu, Maui, and Hawaii and the temporary suspension of air service to the islands as well as the collapsing of bridges on several major highways
• The February 27, 2010, Tsunami Warning following a powerful earthquake in Chile, which prompted a mandatory evacuation of the tsunami inundation zone on all islands as well as briefly closing highway access to harbors and shoreline airports
Section 1.4 Public Infrastructure Security Experience Since September 11, 2001
A substantial body of assessments, reviews, and studies has been developed by the federal and state governments over the past several years. One helpful source was the several volumes of work produced by the Transportation Research Board under the National Cooperative Highway Research Program (NCHRP). These volumes focus on the concerns addressed by transportation agencies when developing security programs.2 There are many common observations and lessons learned conveyed by this information, and while they were developed for surface transportation, they can be applied to all modes of transportation. Figure 1 highlights the key elements of security. Targets may be selected by those intending to cause damage (most likely focused on gaining publicity, causing spectacular damage, and/or causing significant economic damage). The types of security capabilities considered in reviews of infrastructure agency security capabilities are listed to the right of Figure 1.3 While this specific list was developed for highway programs, the topics apply equally to airports and harbors.
2 NCHRP. http://www4trb.org/crp.nsf/All+Projects/NCHRP+20-59 3 TSA Transportation Sector Network Management Office. Assessment of Highway Mode Security: Corporate Security Review Results. May, 2006.
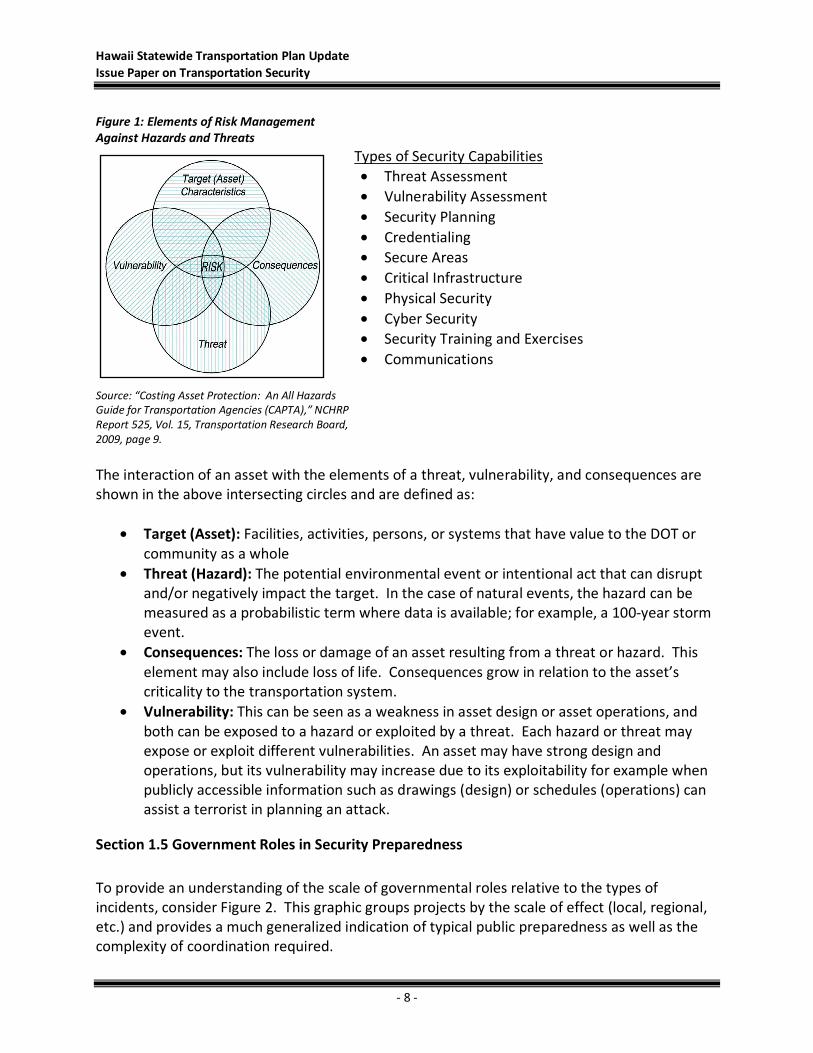
Hawaii Statewide Transportation Plan Update Issue Paper on Transportation Security
- 8 -
Figure 1: Elements of Risk Management Against Hazards and Threats
Types of Security Capabilities • Threat Assessment • Vulnerability Assessment • Security Planning • Credentialing • Secure Areas • Critical Infrastructure • Physical Security • Cyber Security • Security Training and Exercises • Communications
Source: “Costing Asset Protection: An All Hazards Guide for Transportation Agencies (CAPTA),” NCHRP Report 525, Vol. 15, Transportation Research Board, 2009, page 9. The interaction of an asset with the elements of a threat, vulnerability, and consequences are shown in the above intersecting circles and are defined as:
• Target (Asset): Facilities, activities, persons, or systems that have value to the DOT or community as a whole
• Threat (Hazard): The potential environmental event or intentional act that can disrupt and/or negatively impact the target. In the case of natural events, the hazard can be measured as a probabilistic term where data is available; for example, a 100-year storm event.
• Consequences: The loss or damage of an asset resulting from a threat or hazard. This element may also include loss of life. Consequences grow in relation to the asset’s criticality to the transportation system.
• Vulnerability: This can be seen as a weakness in asset design or asset operations, and both can be exposed to a hazard or exploited by a threat. Each hazard or threat may expose or exploit different vulnerabilities. An asset may have strong design and operations, but its vulnerability may increase due to its exploitability for example when publicly accessible information such as drawings (design) or schedules (operations) can assist a terrorist in planning an attack.
Section 1.5 Government Roles in Security Preparedness
To provide an understanding of the scale of governmental roles relative to the types of incidents, consider Figure 2. This graphic groups projects by the scale of effect (local, regional, etc.) and provides a much generalized indication of typical public preparedness as well as the complexity of coordination required.
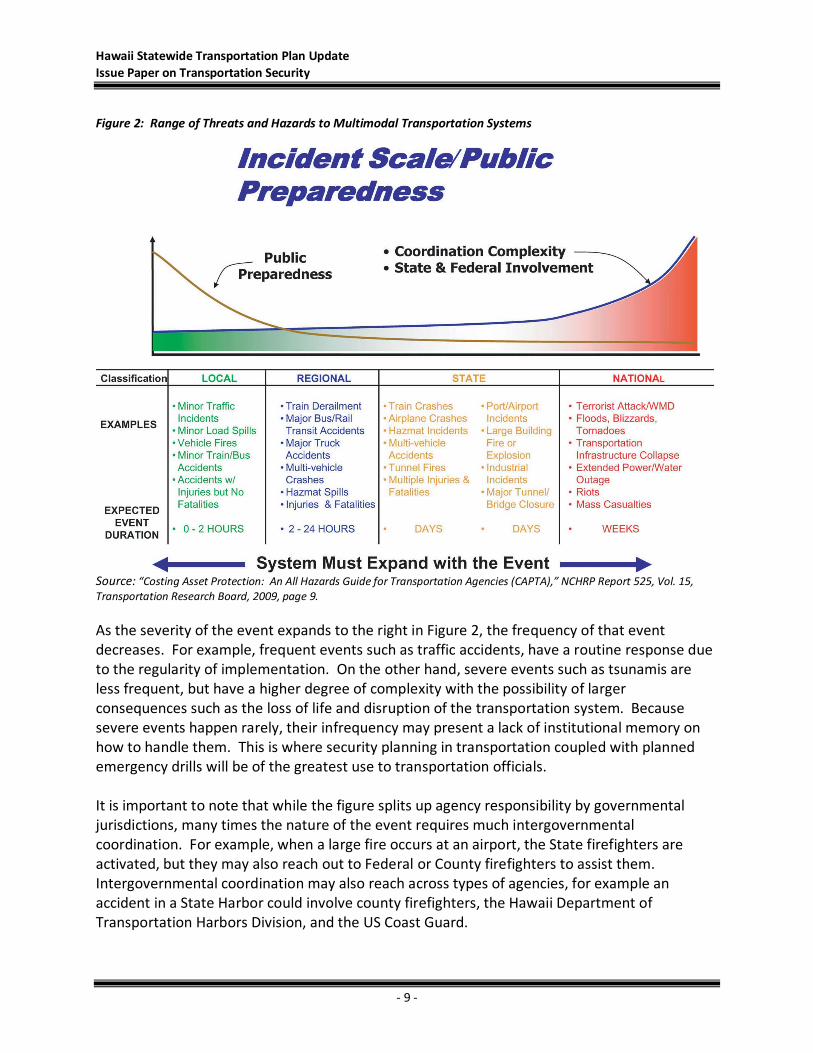
Hawaii Statewide Transportation Plan Update Issue Paper on Transportation Security
- 9 -
Figure 2: Range of Threats and Hazards to Multimodal Transportation Systems
Source: “Costing Asset Protection: An All Hazards Guide for Transportation Agencies (CAPTA),” NCHRP Report 525, Vol. 15, Transportation Research Board, 2009, page 9. As the severity of the event expands to the right in Figure 2, the frequency of that event decreases. For example, frequent events such as traffic accidents, have a routine response due to the regularity of implementation. On the other hand, severe events such as tsunamis are less frequent, but have a higher degree of complexity with the possibility of larger consequences such as the loss of life and disruption of the transportation system. Because severe events happen rarely, their infrequency may present a lack of institutional memory on how to handle them. This is where security planning in transportation coupled with planned emergency drills will be of the greatest use to transportation officials. It is important to note that while the figure splits up agency responsibility by governmental jurisdictions, many times the nature of the event requires much intergovernmental coordination. For example, when a large fire occurs at an airport, the State firefighters are activated, but they may also reach out to Federal or County firefighters to assist them. Intergovernmental coordination may also reach across types of agencies, for example an accident in a State Harbor could involve county firefighters, the Hawaii Department of Transportation Harbors Division, and the US Coast Guard.

Hawaii Statewide Transportation Plan Update Issue Paper on Transportation Security
- 10 -
Also noted in Figure 2 is that as the consequences of the hazard increase, the length of time of the consequences increase. While a fire at an airport may first involve fire departmental responses, it could also involve the Federal Aviation Administration and the US Department of Transportation as time and consequences go on after the initial event. After any large event, many governments review the consequences in order to improve their planning and emergency response. The Post-Katrina Emergency Reform Act of 2006 stipulated major changes to Federal Emergency Management Agency (FEMA) within the Department of Homeland Security (DHS) to improve the agency’s preparedness for and response to catastrophic disasters. The US Government Accountability Office (GAO) reviewed of the 2005 Hurricane Katrina event, providing several critical observations that have applicability to reviews of security for Hawaii. While the review focuses on the coordinated response by FEMA and DHS, many of the same recommendations could apply to the Hawaii Department of Transportation. The GAO analysis of the 2005 Hurricane Katrina response showed improvements were needed within FEMA and DHS in:
• leadership roles and responsibilities; • development of necessary disaster capabilities; and • accountability systems that balance the need for fast, flexible response with the need to
prevent waste, fraud, and abuse. Improved capabilities were needed for catastrophic disasters—particularly in the areas of:
• situational assessment and awareness; • emergency communications; • evacuations; • search and rescue; • logistics; and • mass care and sheltering.
These recommendations could be accomplished by:
• Training in disaster preparedness response; • Planning for disasters; • Clarification of roles, responsibilities and chains of command locally, regionally and
nationally; • Using a risk management approach in making investment decisions; and • Assessing capabilities and utilizing federal grants to enhance those capabilities.4
4 Jenkins, William, O. Homeland Security: Preparing for and Responding to Disasters. Statement of William O. Jenkins, Director, Homeland Security and Justice Issues, before the Subcommittee on Homeland Security, Committee on Appropriations, House of Representatives. Report GAO-07-395T. March 9, 2007. Summary Page.

Hawaii Statewide Transportation Plan Update Issue Paper on Transportation Security
- 11 -
The National Cooperative Highway Research Program (NCHRP) also recognized the importance of the transportation system and security, authoring several different volumes on transportation security. The latest NCHRP Report relating to Surface Transportation Security is Volume 16, A Guide to Emergency Response Planning at State Transportation Agencies. This guide, written in 2010, was designed for use by executive management and emergency response planners at state transportation agencies to assess their respective emergency response plans and identify areas needing improvement. The 2010 Guide reflects accepted practices in emergency response planning while also incorporating advances made in Traffic Incident Management and Emergency Transportation Operations. The NCHRP Guide recognizes that the Department of Homeland Security and the Federal Emergency Management Agency manage a consolidated emergency response process; however, emergency response planning still is an integral part of any state transportation agency’s operations. The NCHRP Guide is National Incident Management System compliant, all-hazards oriented, and multi-modal.
Section 1.6 Planning and Risk
Vulnerability and Risk Assessments need to become routine ongoing planning. A variety of sources were consulted for this issue paper. Two of the most helpful were the Congressional Research Service’s (CRS) report on Homeland Security’s Risk Assessment Methodology and the Government Accountability Office’s (GAO) report on Strengthening the Use of Risk Management Principles in the Department of Homeland Security. The CRS Report begins with an overview of the evolution of risk assessment methodologies from the US Department of Justice from Fiscal Year 2002 to the Department of Homeland Security in Fiscal Year 2007. The CRS Report then presents several risk assessments and related grant programs for congressional consideration. The CRS Report’s Summary states:
“While the practice of risk analysis may be advanced in the insurance and financial industries, it is relatively less developed in the homeland security field. Although there are numerous reasons that account for this dynamic, two primary reasons include (1) the dynamic nature of terrorism and ability of terrorists to adapt to successful countermeasures, and (2) the lack of a rich historical database of terrorist attacks, which necessitates a reliance on intelligence and terrorist experts for probabilistic assessments of types of terrorist attacks against critical assets and/or regions.”5
5 Congressional Research Service. The Department of Homeland Security’s Risk Assessment Methodology: Evolution, Issues, and Options for Congress. February 2, 2007. Summary Page.

Hawaii Statewide Transportation Plan Update Issue Paper on Transportation Security
- 12 -
In 2007, the GAO convened a forum of 25 national and international experts to advance the national dialogue on applying risk management to homeland security and to improve management of homeland security programs. The GAO wrote a report on the Forum, Risk Management and the Department of Homeland Security (2008), which states:
“In addition to helping federal agencies like DHS focus their efforts, risk management principles can help state and local governments and the private sector—which owns over 85 percent of the nation’s critical infrastructure—prioritize their efforts to improve the resiliency of our critical infrastructure and make it easier for the nation to rebound after a catastrophic event. Congress has recognized state and local governments and the private sector as important stakeholders in a national homeland security enterprise and has directed federal agencies to foster better information sharing with these partners. Without effective partnerships, the federal government alone will be unable to meet its responsibilities in protecting and securing the homeland. A shared national approach—among federal, state, and local governments as well as between public and private sectors—is needed to manage homeland security risk.”6
Figure 3: GAO Risk Management Framework
Source: Government Accountability Office7 Figure 3 shows the GAO Risk Management Framework. While the report was written for the US Department of Homeland Security, this risk management framework can be applied to State and Local governments as an approach to risk management.
6 Government Accountability Office (GAO). Risk Management: Strengthening the Use of Risk Management Principles in Homeland Security. GAO-08-904T. 2008. Page 5. 7 Government Accountability Office (GAO). GAO-08-904T. 2008. Page 4.

Hawaii Statewide Transportation Plan Update Issue Paper on Transportation Security
- 13 -
• Learn from previous experience • Share lessons learned with security partners • Identify the most significant threats • Assess vulnerabilities associated with those threats • Prioritize the risks • Identify the means of attacking those points of vulnerability,
including unconventional means • Identify the most effective means of denying an attack or minimizing
damage • Alter facility design or operation as needed • Monitor system integrity and usage through inspections • Coordinate with associated organizations (e.g., law enforcement,
user groups, media, etc.) • Limit access to the most vulnerable locations and processes • Carry out training exercises/drills to determine whether responsible
organizations are prepared • Develop and apply new technologies designed to address specific
needs • Propose and arrange for needed investments
Taking both reports into consideration, as well as a variety of other sources cited within and linked to these reports, several important lessons can be shared in risk planning as shown in the text box:
Source: HNTB, 2010, Research for HSTP Security Issue Paper #7 Transportation planning officials can prepare for security risks during each step of a five-step simplified planning process as presented in the testimony by William O. Jenkins, Director, Homeland Security and Justice Issues, before the Subcommittee on Homeland Security, Committee on Appropriations, House of Representatives.8 Each step gives an illustrative example of how this can be applied to the Hawaii DOT and the HSTP Update.
1. Goal Development The 2002 HSTP already incorporates Security as one of its primary goals, and this HSTP Update develops this goal further. More discussion on this HSTP Goal and its accompanying objectives follows in this paper.
2. Conditions Assessment Development of a database that can identify current conditions as they relate to security, such as share of Hawaii DOT facilities that are secured, proximity to sensitive sites, and critical inter- and intra-modal links. A good use of technology would be to link this database
8 Jenkins, William, O. Page 4.

Hawaii Statewide Transportation Plan Update Issue Paper on Transportation Security
- 14 -
to a GIS Tool, so that each piece of infrastructure is geo-coded with its unique properties, including security considerations. 3. Needs Assessment This process would determine how current trends and forecasts influence the performance of the transportation system. This HSTP Update includes a section on Trends and Forecasts, with annual updates to be provided by the Statewide Transportation Planning Office within Hawaii DOT. This is an example of how planning for security risks can utilize this new tool. 4. Project Identification This step will utilize the knowledge of needs and knowledge of possible solutions to come up with proposed solutions specific to each transportation project. An example of this happening today is the location of the City and County of Honolulu’s Rail Project near Honolulu International Airport, which must consider security matters during the planning stages. Addressing security may be an element of a larger project and/or a project dedicated to security objectives. 5. Project Programming The importance of security in the context of other transportation priorities will be weighed once transportation planners get to the task of selecting specific transportation projects.
The Southeastern Transportation Center breaks security risk down to its simplest terms as an equation.9
Security Risk = Probability of Incident Attempt X Vulnerability X Damage The following table, taken from the work of Steven Polzin of the Southeast Transportation Center, shows how one might relate security risk to a transportation agency’s roles and to transportation planning. Table 1 creates a matrix of three components in security risk—probability of the incident occurring, vulnerability, and damage—and examines how each component might relate to a transportation agency’s various roles. The matrix also examines implications for transportation planning of that component. This exercise could be repeated with any security risk, whether it is a natural disaster or terroristic event.
9 Polzin, Steven E., P.E. Ph.D. Security Considerations in Transportation Planning. Page 20.

Hawaii Statewide Transportation Plan Update Issue Paper on Transportation Security
- 15 -
Table 1: Responsibilities of Transportation Agencies in Influencing Transportation Risks
Security Risk Component Possible Role ofTransportation Agency
Implications forTransportation Planning
Probability of Incident Attempt Presence of individuals who have the motivation to plan and carry out acts of terrorism.
• Utilize regulatory oversight capabilities to help identify/capture or exclude entry of possible terrorists (via licensing, border crossing enforcement, routine traffic enforcement, etc.).
• Carry out responsibilities in a manner that will minimize the prospect that employees, or affected parties (land owners, contractors, system users, etc.) will be motivated to seek revenge through terrorism
• Enhance transportation agency capabilities in the areas of regulation and enforcement.
• Enhance customer interface capabilities of transportation workforce.
Vulnerability Prospect that a transportation target could be successfully terrorized
• Limit the information availability that might influence the choice of transportation as a terroristic target.
• Ensure the transportation workforce is screened and monitored to reduce likelihood of internal terrorism.
• Limit the access to sensitive targets. • Secure critical elements in transportation
system.
• Evaluate Knowledge sharing/dissemination strategies.
• Upgrade employee and contractor screening and control capabilities.
• Explore physical and operational controls on access to sensitive locations.
• Reconsider alignment and service location criteria to include security concerns.
Damage The direct and indirect magnitude of the consequences in personal and economic terms
• Design systems and facilities so as to be resistant to attack.
• Have incident response capability to minimize loss of life and restore functioning of transportation system.
• Provide redundancies to enable system robustness after an incident.
• Evaluate/modify system and facility design standards.
• Consider network robustness in project design and selection.
• Support investments to enable rapid incident response.
Source: Steven Polzin. Security Considerations in Transportation Planning. Page 20.

Hawaii Statewide Transportation Plan Update Issue Paper on Transportation Security
- 16 -

Hawaii Statewide Transportation Plan Update Issue Paper on Transportation Security
- 17 -
Section 2.0 How Security Is Treated in Prior Transportation Plans in Hawaii and Current Plans in Other States
Section 2.1 Treatment of Security in the 2002 Hawaii Statewide Transportation Plan The 2002 HSTP included a goal to “ensure the safety and security of the air, land, and water transportation systems.” The objective for security is stated as: “To ensure the secure operation and use of the transportation system.” The illustrative means for carrying out that objective included:
• Employ various safety and security measures as required. Examples: o Improve air traffic control.
Provide up-to-date air traffic control equipment. Consider restricting areas in which helicopter tours can operate as
appropriate. o Provide transport routes for hazardous materials that ensure the safety of
neighboring communities and vehicles (e.g., cars, cyclists, cruise ships). o Develop hazardous materials accident and spill management strategies. o Identify, evaluate, and eliminate threats to the transportation system.
• Use law enforcement at problem locations. As part of the 2002 HSTP, a survey of over 1,000 Hawaii residents was conducted. In that survey, the highest-ranked goal on each island and statewide was "safety and security, making sure our transportation system is designed to keep users safe.” 91% of survey respondents ranked safety and security as very important while the second highest ranked topic was “transportation systems work together” at 80%. Far and away, safety and security were seen as the most important goals for transportation investments with 93% of respondents indicating that such investments were the most important. Interestingly, this survey was conducted in July 2001, two months before the terrorist attacks of September 11, 2001. Most of the security-related comments from respondents were focused on local safety issues rather than on terrorism, natural hazards, or other larger scale or unpredictable events.
Section 2.2 Treatment of Transportation Security in Other States’ Plans
Recently adopted transportation plans in other states are increasingly focused on how to provide increased security and doing so in collaboration with federal, state, and local law enforcement organizations. Strengthening of facilities, increased monitoring, and a wide variety of strategies have been adopted.

Hawaii Statewide Transportation Plan Update Issue Paper on Transportation Security
- 18 -
A review of other states’ transportation plans demonstrates the following:
• Those states that adopted their most recent State Transportation Plan after September 11, 2001 have more focus on terrorism security threats than do those with a plan adopted closer to or before that date.
• Most states emphasize the security of travelers and the shipment of goods and call for operating within the requirements of the Homeland Security Administration and the Transportation Security Administration.
• Interagency communication, joint monitoring of activities and incidents, and joint training are important to ensure that agencies with similar or overlapping responsibilities know each other well, know their respective roles and responsibilities, and know how to carry out the agreed upon emergency response plans. When unique events occur, this training, communication, and familiarity help determine how best to respond. The experience of the joint agency emergency response program in New York City on September 11, 2001 demonstrated the value of this co-located, joint emergency management experience.
• States, as well as federal and local agencies, place an emphasis on acquiring and using technology to aid in assessments, detection, and response. Two public policy issues associated with the emphasis on technology are: 1) need for sufficient funding for both acquisition and operation; and, 2) need for agreement between agencies on what technologies to use and how to share information.
The following examples show how the six selected states have treated transportation security in their state transportation plans. These states were selected because they were adopted after September 11, 2001, and give examples of best practices in transportation security. Alaska and Washington were selected because of their emphasis on sea transportation and ports, much like Hawaii. Let’s Get Moving 2030: Alaska Statewide Long-Range Transportation Policy Plan Alaska’s transportation needs are similar to Hawaii’s because portions of the state are not connected to one another, requiring interisland transport by sea or air. Alaska, like Hawaii, is geographically isolated from the “lower 48” states. In addition, Alaska’s weather often makes its roads impassable for large periods of time, giving it a high dependence on air travel much like Hawaii. Alaska’s transportation plan sets statewide priorities while attempting to balance different and competing needs. Among its many challenges under the state’s guiding principles and vision, Alaska recognizes new responsibilities for addressing security in their transportation infrastructure as well as the important role that transportation plays in national security, emergency planning, and incident management. In addition, Alaska discusses The Eight Planning Factors and directly addresses the need to increase the security of its transportation system for motorized and non-motorized users.

Hawaii Statewide Transportation Plan Update Issue Paper on Transportation Security
- 19 -
To balance all this, Alaska’s Department of Transportation and Public Facilities (Alaska DOT&PF) set policies in its transportation plan. Specifically speaking to security, Policy 10 states: “Policy 10: Work with federal, local, and state agencies to provide a secure transportation system and emergency preparedness for all modes.”10 The objectives include addressing security of the state’s airports, vessels, and highways in operation plans, manuals, and guidelines. The plan also states that Alaska DOT&PF will address security as part of their emergency preparedness and response planning. Washington Transportation Plan 2007-2026 Washington’s transportation needs are similar to Hawaii’s because much of the state depends on freight to come in and out through their harbors. In addition, Washington’s largest export is food to Asia, so like Hawaii, much of its commerce is linked to its waterways. Like Hawaii, Washington state also has a strong military component. A section of the plan points to Fort Lewis as the only Power Projection Platform on the West Coast. A Power Projection Platform is a military strategic term meaning a base that is able to quickly project military power. This means that in the event of a major conflict, essential equipment and supplies will be sent to Fort Lewis by rail and road then shipped out of the ports of Tacoma, Olympia, and Seattle to support American Troops. The plan recognizes that military traffic will need to surge through two freight systems that are near capacity: the east-west railroad lines and the Interstate 5. In the Washington Transportation Plan, actual recommended projects and capital funding with sources were listed. Many of the listed projects included the requirement for stronger security features in response to their geography and large use of water transportation. Also notable is the directive to develop a plan for timely restoration of freight service in the event of a major security disruption or natural disaster. The plan also states that an increase in highway security projects will prioritize the most vulnerable areas. 2025 Florida Transportation Plan (2005) The Florida Transportation Plan reviews the security topic in terms of “threats and emergencies.” The plan notes recent federal and state legislation that impose requirements. In addition, the plan recognizes the significance of natural disasters and the need to minimize disruptions and provide for emergency response. To support the State’s long-range objective to improve security, the plan seeks to “improve the security of Florida’s transportation system to deter and respond to attacks on transportation facilities or domestic targets, while ensuring mobility for all users.”
10 Alaska DOT&PF. Let’s Get Moving 2030: Alaska Statewide Long-Range Transportation Policy Plan. Page 14. http://www.dot.state.ak.us/stwdplng/areaplans/lrtpp/SWLRTPHome.shtml

Hawaii Statewide Transportation Plan Update Issue Paper on Transportation Security
- 20 -
The coordination needed for security is underscored by the plan’s noting of lead roles being performed by the U.S. Department of Homeland Security, the Transportation Security Administration, and the Florida Department of Law Enforcement. It notes that the Florida Department of Transportation and other partners function in a shared role relative to security. Security strategies in the plan focus on deterrence, protection, awareness, communication, and coordination (particularly with the military). Notable among the strategies are the following:
• Implement security policies and strategies to deter and respond to attacks on the transportation system as well as to deter use of the system to carry out attacks against domestic targets, while maintaining the intended function of the system.
• Increase the use of intelligent transportation systems technology as a tool to improve transportation safety and security.
• Improve compatibility of communications and other critical equipment used by Florida DOT and federal, state, and local safety and security responders.
• Ensure that national security transportation needs involving Florida’s military facilities can be met during normal and elevated security periods in future planning for the Strategic Intermodal System (SIS) and regional and local facilities connecting military facilities to the SIS. SIS is defined as “a statewide network of high-priority transportation facilities that include the state’s largest and most significant commercial service airports, spaceport, deepwater seaports, freight rail terminals, passenger rail and intercity bus terminals, rail corridors, waterways and highways. Emphasis is placed on statewide and interregional systems and corridor-level planning that coordinates multimodal improvements of many types of facilities involving many partners.”11
• Planning for these military needs should occur in coordination with the U.S. Department of Defense and other appropriate partners.
Illinois State Transportation Plan (2007) The Illinois State Transportation Plan includes significant security-related considerations, including:
• A clear emphasis on security in the plan’s overview and descriptions of priorities. • A policy to “provide a secure transportation infrastructure in conjunction with the Office
of Homeland Security – Illinois Terrorism Task Force.” This policy underscores the need for coordination and collaboration reiterated in many State and local government security reviews.
• Security goals stated as: o Assess statewide transportation infrastructure safety, security, and emergency
preparedness, and provide recommendations and proposals.
11 Florida DOT. Directive Topic No.: 525-030-251-a. Development of the Strategic Intermodal System (SIS) Highway Component. May 2010. Pages 3-4. http://www2.dot.state.fl.us/proceduraldocuments/procedures/bin/525030251.pdf

Hawaii Statewide Transportation Plan Update Issue Paper on Transportation Security
- 21 -
o Provide training, education, and reference materials to appropriate public and private organizations on the security of Illinois’ transportation systems.
o Develop regional evacuation plans with input from public and private sectors. Illinois developed a special report in support of its transportation plan titled Global Competitiveness and System Security.12 This report helps to emphasize the State’s view that its transportation infrastructure must afford security for, among other reasons, maintaining, and improving the State’s competitiveness in a global economy. Maryland Transportation Plan (2009) Maryland includes several security-specific issues in its 2009 Maryland Transportation Plan, including a goal “to provide transportation assets that maximize personal safety and security in all situations.” Among the plan’s security-related objectives are these:
• Secure transportation assets for the movement of people and goods. o Explore the use of emerging technologies such as biometrics (i.e., fingerprint
identification/authorization), to maintain safe and secure airport facilities. o Implement Federal mandates for securing bridges, seaports, airports, and
highways. o Prepare actions and outreach to meet the Department of Homeland Security
(DHS) benchmarks as part of the Homeland Security REAL ID Act.13 o Pursue educational initiatives, such as the Maryland Motor Carrier handbook
and Maryland Truckers’ Map, to improve motor carrier safety compliance. • Coordinate and refine emergency response plans and activities.
o Develop a plan to assess the risks to transportation infrastructure, mobility, and emergency management of sea level rise and other climate change impacts, and to identify adaptation options.
o Improve the State’s ability to prepare for and respond to natural disasters and homeland security incidents by completing emergency traffic management and evacuation pans, and by providing National Incident Management System (NIMS) training to key staff.
The Homeland Security REAL ID Act establishes minimum standards for state-issued driver’s licenses and identification cards in accordance with the REAL ID Act of 2005. The standards include: information and security features; proof of identify and lawful status of an applicant;
12 Illinois Department of Transportation. Illinois State Transportation Plan. Special Report: Global Competitiveness and System Security. December 2007. http://www.illinoistransportationplan.org/pdf/draft_plan07_dec/Global%20Competitiveness%20and%20System%20Security%20(December%202007).pdf 13 Note: The title of this Act is not an acronym for anything, but is referred to in Federal Legislation by its Short Title, “REAL ID ACT OF 2005”. http://www.gpo.gov/fdsys/pkg/BILLS-109hr1268enr/pdf/BILLS-109hr1268enr.pdf

Hawaii Statewide Transportation Plan Update Issue Paper on Transportation Security
- 22 -
verification of the source documents provided by the applicant; and security standards for issuing offices. States may seek an additional extension of compliance deadline up to May 22, 2011, once the state had demonstrated material compliance with the core requirements of the Act.14 The Maryland Motor Carrier Handbook and the Maryland Truckers’ Map are both available online at the Maryland.gov website. The Motor Carrier Handbook was recently updated in 2009 as part of its 20th Anniversary Edition and includes Maryland laws and Federal Regulations for commercial vehicles. The Maryland Truckers’ Map is also available for free at weigh stations throughout the state; it includes important phone numbers for truck stops, public rest areas, and all truck routes in Maryland as well as axle rates at toll facilities. The National Incident Management System (NIMS) was developed to coordinate emergency preparedness and incident management among Federal/State/Local agencies. It was instigated in 2003 via the Homeland Security Presidential Directive (HSPD)-5, Management of Domestic Incidents and was developed and now administered by the Secretary of Homeland Security. It consists of an Incident Command System, a Multi-Agency Coordination (MAC) System, and public information systems. Michigan Transportation Plan (2005) The MichiganTransportation Plan: Moving Michigan Forward, 2005-2030 State Long-Range Transportation Plan15 includes coverage of security issues and needs. Safety and security are considered as a common or overlapping topic in the plan. Michigan DOT’s security strategy is summarized as “prevent, respond, and recover.” The plan seeks to balance the competing needs to move travelers without interruption with the need to slow movement to confirm that it is safe to move ahead. Emergency management programs provide the underpinning for the plan’s approach to security. A Transportation Risk Assessment and Protection (TransRAP) Team was formed after September 11, 2001, to provide vulnerability and risk assessments as well as to work through the Michigan Critical infrastructure Protection Committee and the Governor’s Michigan Homeland Protection Board. The focus on teamwork, collaboration, and coordination suggested by these groups underscores a common theme in State transportation approaches to security improvement, i.e., the need to work with partners. The TransRAP Team serves as the Transportation Subcommittee of the Michigan Critical Infrastructure Protection Committee. The Michigan Critical Infrastructure Protection Committee is an advisory panel reporting to the Michigan Homeland Protection Board. The Michigan Homeland Protection Board includes MDOT and the Michigan Departments of
14 Department of Homeland Security. REAL ID Final Rule. http://www.dhs.gov/files/laws/gc_1172765386179.shtm 15 Michigan DOT LRLTP. http://www.michigan.gov/mdot/0,1607,7-151-9621_14807_14809---,00.html

Hawaii Statewide Transportation Plan Update Issue Paper on Transportation Security
- 23 -
Military Affairs, Environmental Quality, Agriculture, State Police, and Community Health. MDOT has worked jointly with these agencies to develop response and recovery plans and regularly participates in emergency training and exercises.16 The first Michigan Critical Infrastructure Protection Conference was held March 2010 and hosted by the Michigan Critical Infrastructure Protection Committee. The Conference brought together owners, operators and public sector agencies responsible for the security of Michigan’s critical infrastructure, including bridges, water supplies, energy, cyber and telecommunications systems equipment, agriculture facilities, banking centers and transportation operations. The conference was seen as an example of collaboration and working towards the Michigan Statewide Homeland Security Strategy.
16 Michigan Department of Transportation. MDOT Long Range Transportation Plan, Security Technical Report. 2005. Page 1.

Hawaii Statewide Transportation Plan Update Issue Paper on Transportation Security
- 24 -

Hawaii Statewide Transportation Plan Update Issue Paper on Transportation Security
- 25 -
Section 3.0 How Hawaii Department of Transportation Handles Security
Section 3.1 The Airport System and Security
Hawaii DOT works with the Transportation Security Administration (TSA), Customs and Border Protection (CBP), the Federal Aviation Administration (FAA), and the U.S. and State Departments of Agriculture (USDA and DOA) on security assessments of the State’s airport system. In addition, after September 11, the National Guard and the Homeland Security Administration performed vulnerability reviews of airport facilities and services. These reviews identified needed improvements in operations, interoperability of communications systems, facility access, passenger screening, baggage screening, and facility design. Hawaii DOT, the airlines, and other partners took action on many of these steps and are continuing to improve security at Hawaii’s airports. These are not detailed for security purposes. The budget for investments at Hawaii’s airports depends on revenue generated by airlines and passengers. According to Sydney Hayakawa, Administrative Services Officer for the Airports Division, no State taxpayer funds go to airport investments. Funds come from Passenger Landing Fees (PFCs), FAA grants, TSA grants, as well as user-generated revenues from airport sites. An airport design and layout feature of Hawaii’s airports is the open air feature. While it provides for reduced facility needs (by needing less enclosed structure space) and takes advantage of Hawaii’s climate, it does make control of passenger access and use of chemical detection systems more challenging. For example, the so-called “puffer” machines that are used to detect trace particles do not work reliably in an open air setting, and the recently installed Advanced Imaging Technology is too large to install at the Inter-Island checkpoints. The airports’ operations and security staff and systems are experienced in dealing with natural disasters such as hurricanes and tsunamis. However, the rapid change to managing security relative to potential man-made dangers has resulted in rapid facility layout changes, substantial increases in in-airport screeners (with a wide range of education, language, and other capabilities), increase in law enforcement and security personnel and equipment, and the need to continually adapt. The TSA views 20 layers of security in order to ensure the security of the traveling public. While the public most associates the TSA with airport checkpoints, the agency recognizes 19 other layers of security that can stop a terrorist attack used alone or working in combination as shown in Figure 4.

Hawaii Statewide Transportation Plan Update Issue Paper on Transportation Security
- 26 -
According to TSA Administrator Kip Hawley, each one of the 20 Layers of Security alone is capable of stopping a terrorist attack.17 When the layers work in combination, their security value is multiplied, creating a stronger system. When a terrorist has to overcome multiple layers of security in order to carry out an attack, that terrorist is more likely to be deterred or to fail during the terroristic attempt. The layers begin with a global view towards aviation security, using intelligence and international partnerships as layers, and end with the passengers themselves as the final layer of deterrent.
Figure 4: 20 Layers of Security at Airports
Source: Transportation Security Administration From interviews conducted with the Airports Division as research for this issue paper, some of the challenges faced by the airport system include:
• Maintaining good passenger flow through the terminals and providing thorough security protection without major disruption to passengers and commerce (especially with changing security issues and practices);
• Facility configurations; • Incorporating new technologies;
17 TSA Administrator Kip Hawley. “Oral Testimony on Improving Aviation Security before The United States House of Representatives Committee On Oversight and Government Reform.” November 15, 2007. http://www.tsa.gov/press/speeches/111507_hawley_house.shtm

Hawaii Statewide Transportation Plan Update Issue Paper on Transportation Security
- 27 -
• Moving to round-the-clock security for all critical functions; • Securing sufficient funding to make the needed improvements and provide for the
needed staffing, including for special events such as APEC; • Communications systems interoperability; and • Sharing of intelligence information with Federal, State, and local law enforcement
agencies. An example of Hawaii making continual improvements in airport security involves Kahului Airport on Maui. While it is commonly understood that security risks involving checked baggage can be decreased with improved screening, the needed equipment is costly and the space available for that equipment is very limited. With Maui Planning Commission approval of a special management area permit for a checked baggage facility, the HDOT Airports Division has invested in an $18 million explosive detection system as well as common use lobbies. The process now provides for three levels of security screening and includes a new explosive trace detection room for inspections, allowing for interoperability for the various air-carriers to use ticket lobbies and reservations systems. The screening process involves not only HDOT Airports Division and the Kahului Airport management but also the airlines, TSA, and local government. This example illustrates the challenge of introducing new technology and new processes into the built environment. It also illustrates both the cooperation needed to modify screening processes and to arrange for needed approvals and funding. To assure alternative electrical energy in the event of a major power outage, a generator is being installed at Honolulu International Airport in partnership with the Hawaii Electric Company. This generator will have to capacity to fully support passenger terminal facility needs. Līhu‘e Airport also has generator capacity capable of supporting both airfield and terminal capabilities. In addition, all airports statewide that service schedule airlines are equipped with standby generators capable of supplying the needs of airfield lighting. The FAA does provide generators for each of their air traffic control towers statewide. The HDOT may want to consider focusing on these three topics relative to airport security:
1. Achieving the level of security needed in light of federal requirements and the ever-changing threats (and recognizing that there can be no single standard for human-caused threats whereas earthquake or tsunami sizes can be used as guides for natural environment-caused threats);
2. Refining the budgeting process to take into account State roles and the roles of Federal and private partners, while keeping current with the Federal Deficit Reduction Commission as it relates to Airports funding;
3. Recognizing that cooperation and collaboration with a wide range of partners, such as TSA, FAA, CBP, USDA, DOA, National Guard, airlines, vendors and other stakeholders, is essential to providing airport security.

Hawaii Statewide Transportation Plan Update Issue Paper on Transportation Security
- 28 -
Section 3.2 The Harbor System and Security
The Hawaii DOT Harbors Division works with the Transportation Security Administration; the U.S. Coast Guard; and the tenants, carriers, and others on security assessments of the State’s harbor system. As is true of other transportation modes, the State’s harbors face security risks from both the natural environment and from man-made incidents, both terrorism and criminal sources. This is heightened by the fact that 80% of Hawaii’s goods are imported from outside the state, the majority of which come in through the harbors. Among the natural environment security risks are the structural integrity of older piers from earthquakes, threats from tsunamis, ocean level rise, and invasive species which could be brought in by ships from other waters. Among the human security risks is terrorism, which has the potential of providing catastrophic damage to Honolulu Harbor or damage to harbor landside ingress/egress facilities, as well as the potential loss of life. Other human security threats to consider are criminal activity such as theft and vandalism as well as threats to human life. Since the events of September 11, 2001, HDOT and its partners have undertaken extensive vulnerability and risk assessments as well as security exercises. A greater percentage of the Harbors Division budget now goes to security than was the case prior to that date. On the land side of the harbors, there is an increased use of personnel to monitor conditions, cameras to observe activity, and sensors to detect potential threats. Fences and gates are more important than before. Recently, new fencing was placed on the water side of Nimitz Highway leading up to the HDOT Harbors Division Office. Other water side improvements include vacuum devices to remove invasive species from ships’ bilge water. The budget for investments at Hawaii’s harbors depends on revenue generated by carriers and is proportional to the numbers of passengers and the cargo tonnage. The program does need Legislative approval but does not involve general funds. This does represent public policy for financing that is more similar to that of the Airports Division than it is to the Highways Division. The constituency of the harbors is first the shippers, carriers, receivers, and related parties. Those who must move people and goods through the harbors need to be satisfied that the needed capital and operational investments are understood and planned well. The Governor and the Legislature need to be assured that the harbors system will provide appropriately for Hawaii’s commerce, tourism, and overall economy. In addition, establishment of State policy for harbors through gubernatorial and legislative action demonstrates that federal funding can be provided to harbors needs consistent with overall State policy. Each Hawaii harbor district has a security plan. The captain of each port works with stakeholders and other federal, state, and local agencies to keep the plan up-to-date and to consider vulnerabilities, risks, and needed improvements.
Hawaii Statewide Transportation Plan Update Issue Paper on Transportation Security
- 29 -
From interviews conducted with the Harbors Division as research for this issue paper, topics the Harbors Division is considering include:
• How to assure that the security function is fully staffed considering the effects of the economy on the State budget and the effects of staffing furloughs as well as the generally increasing need for security monitoring;
• Seeking increased integration of security assessments involving all modes of transportation, which could include more emphasis on the threats along the movement of people and goods coming to, moving through, and leaving each island;
• Acquisition of a ship manifest monitoring system to aid in assuring that cargo is what it is claimed to be. That said, this is a matter of inter- and cross-jurisdictional coordination, inasmuch as the Harbors Division is not the agency responsible for cargo security. This issue principally concerns the U. S. Coast Guard or the TSA clarifying what specific manufactured product is acceptable to put into service.
The HDOT may want to consider focusing on the following security needs with respect to Harbors:
1. Providing for on-going preparedness for known and evolving threats; 2. Assuring that sufficient capability is available and that staff are trained to provide
security on a 24/7 basis; 3. Assuring that the most appropriate technologies are identified, acquired, and operated
to minimize security threats; 4. Continually adapting to and incorporating new federal requirements as well as evolving
understandings of natural environment and human-caused risks.
Section 3.3 The Highway System and Security
The Hawaii DOT Highways Division works with the Federal Highway Administration, the Transportation Security Administration, other State agencies, and a range of law enforcement organizations on security assessments of the State’s highway system. As is true of other transportation modes, the highway system faces security risks from both the natural environment and from human-caused incidents. It is also the transportation mode that the majority of Hawaii’s residents and visitors utilize on a daily basis. Immediately following September 11, 2001, the Highways Division participated in an assessment of the vulnerability and risks associated with the State highways, bridges, and tunnels. Among the early decisions made were the following:
• Access to spaces near highways and underneath bridges was not restricted due to the fact that land under bridges is generally park land and open to the public.

Hawaii Statewide Transportation Plan Update Issue Paper on Transportation Security
- 30 -
• Interested parties are still able to have access to as-built plans for the highway system elements.
• A special case was established limiting access to tunnel operations centers. A national Blue Ribbon Panel (BRP)18 formed in the wake of September 11 to consider the issue of infrastructure security which focused on bridges and tunnels reached the following finding which is relevant and critical to the broader highway system across the United States:
“The success and safety of the transportation system, combined with the perceived number of parallel routes, can lead to the conclusion that the transportation system is so robust that it is not susceptible to significant disruption by terrorist attack. In the opinion of the BRP members, this conclusion is incorrect. In many parts of the country, the transportation system is straining to keep up with the current demands of society and the economy. The actions of terrorists can impose critical damage to some bridges, and, with explosive forces, exert loads that exceed those for which components are currently being designed. Worse yet, in some cases, the loads can be in the opposite direction of the conventional design loads.”
From interviews conducted with the Highways Division as research for this issue paper, among the greatest risks associated with the State highway system are the following:
• Highway closure that eliminates or greatly restricts access to key sites such as a harbor, airport, or an isolated community;
• Injury or loss of life due to destruction of a facility such as what happened in Oakland, California, resulting from the 1989 Loma Prieta Earthquake, when an elevated section of I-880 collapsed;
• Damage to a major facility that necessitates a substantial reallocation of funds otherwise programmed for needed investments such as happened when earthquake-caused damage to the San Francisco-Oakland Bay Bridge led to major expenditures on seismic upgrades for many bridges in that region and a commitment to replace that structure.
The Highway Division is focused on seismic retrofit of structures. That program provides benefits for both environmental threats as well as possible human-caused threats for these critical links.
18 American Association of State Highway and Transportation Officials’ Blue Ribbon Panel on Bridge and Tunnel Security. Recommendations for Bridge and Tunnel Security. September 2003. Page 1.

Hawaii Statewide Transportation Plan Update Issue Paper on Transportation Security
- 31 -
Section 3.4 The 2011 Asian Pacific Economic Cooperation Leaders’ Meeting
The Asian-Pacific Economic Cooperation (APEC) Leaders’ Meeting is an example of sharing of intelligence information with all levels of government to achieve better security. The State of Hawaii submitted a bid in January 2009 to host the 2011 APEC Leaders’ Meeting. President Barack Obama announced the selection of Hawaii to host the 2011 APEC Leaders’ Meeting, scheduled for November 2011 at the Hawaii Convention Center in Honolulu. Hawaii’s selection to host this meeting is an affirmation of Hawaii’s strategic role as a leader in the Asia-Pacific region, which will assist in building a stronger economic foundation for Hawaii’s future. Housing APEC leaders in 2011 will give Hawaii an opportunity to enhance relations with its Asia-Pacific neighbors while building a stronger economic foundation for Hawaii’s future. This will be the first APEC Leader’s Meeting held in the United States since the APEC Meeting convened on Blake Island, Washington, in 1993. This high-level international gathering is expected to attract over 10,000 participants from throughout the Pacific Rim to the State of Hawaii, including leaders from 21 APEC “Member Economies,” senior government officials, business leaders, international economists, Asia-Pacific experts and worldwide media. The meetings will attract the leaders of APEC’s 21 heads of state, 63 ministers of industry and foreign affairs, and more than 16,000 foreign diplomats. President Barack Obama will also attend. The joint effort will continue as Hawaii government leaders, private sector officials, East-West Center administrators, and other community leaders transfer the focus of coordinating the logistics and details of the meeting to the White House, the US State Department, and other agencies. A meeting of this magnitude will be similar to the 2001 Asian Development Bank (ADB) Meeting held May 2011 at the Hawaii Convention Center. The 2001 ADB Meeting was held prior to the events of September 11, 2001, and prior to the establishment of the Department of Homeland Security. Funding for APEC or any other special event is not included in HDOT’s budget. The US Department of Homeland Security designated APEC as a National Security Special Event, but will only provide funding and law enforcement resources for security related initiatives and law enforcement agencies. Section 3.5 The Transportation System and Emergency Preparedness Another example of Hawaii preparing for upgraded security is in its online Hawaii Hazard Information. In conjunction with the National Oceanic and Atmospheric Administration (NOAA) and the State of Hawaii, new tsunami hazard maps have been placed online and updated using scientific techniques and technology. The maps were also created in conjunction with County

Hawaii Statewide Transportation Plan Update Issue Paper on Transportation Security
- 32 -
Public Safety Officials. Broken out by island, tsunami evacuation zones can be searched for each coastal airport as well as harbors and shoreline highways. The latest tsunami bulletins for Hawaii are also posted here: http://tsunami.csc.noaa.gov/ The Hawaii State Civil Defense department has also posted links for Disaster Preparedness, which include natural disasters such as earthquakes and man-made disasters such as weapons of mass destruction. Preparation kits, latest disasters, and links to the Federal Emergency Management Agency’s (FEMA) Ready America are posted here: http://www.scd.hawaii.gov/index.html To meet the requirements of the Disaster Management Act of 2000 [P.L. 106-390] and the planning guidelines of FEMA, the Hawaii State Civil Defense prepared a Multi-Hazard Mitigation Plan for the state and for each of the four counties. The 2010 update of the statewide plan can be accessed from http://www.scd.hawaii.gov/2010_hmp.html. The Plan includes the Hazard Mitigation Planning Process, which can be useful to transportation planners in all modes, and it includes hazards risks and vulnerability assessments for natural disasters as well as homeland security. Section 3.6 Biosecurity Due to Hawaii’s geographic isolation and its year-round tropical climate, the island state has more native species than any other state in the country. The Hawaii Department of Agriculture 2008 Strategic Plan highlighted its new biosecurity program, which consists of preclearance programs, port-of-entry inspections, post-entry rapid response programs, and eradication programs. Specifically, the Department of Agriculture is:
• Establishing a joint use inspection facility at Honolulu International Airport for the inspection of agricultural products and other regulated commodities;
• Establishing an Alien Species Action Plan (ASAP) inspection facility at Kahului Airport, which houses federal and state agencies responsible for receiving and inspecting articles arriving on domestic and foreign flights;
• Establish a system of transitional inspection facilities for sea containers to ensure efficient handling and inspection of cargo arriving in Hawaii from domestic ports;
• Control and reduce disease in feral swine by performing pathological examinations; • Register livestock premises with the National Animal Identification System; and • Conduct statewide surveys to delineate infestations of regulated pests for control or
eradication. These measures should help with protecting agriculture, the environment, and human health. This also parallels the new HSTP Security Goal, which recommends the development of a biosecurity plan and measures to protect against pests and disease.

Hawaii Statewide Transportation Plan Update Issue Paper on Transportation Security
- 33 -
Section 3.7 Transit Security Transportation planners may be interested to know about Transit Watch, a nationwide public awareness outreach campaign. This was launched in 2003 by the Federal Transit Administration (FTA) to encourage active participation of transit passengers and employees in maintaining a safe transit environment. The campaign was also designed to help foster the role of transit as a safe haven in our community. There is an online toolkit containing valuable ideas that could be used as part of a public awareness campaign for each of Hawaii’s transit systems. Information on Transit Watch, as well as the Enhanced 2006 Transit Watch Toolkit are available here: http://transit-safety.volpe.dot.gov/Security/TransitWatch/default.asp The Federal Transit Administration also has an online Security Manpower Planning Model built in Microsoft Excel. The model is a flexible decision support tool created to assist transit security planners with assessing impacts of strategic decisions on resources and staffing. The transportation security planner inputs data, and the model then identifies staffing levels and budgeting. The model can also assist transportation security planners in any transit agency by assessing impacts of various scenarios on resource and development strategies. The FTA Security Manpower Planning Model and instruction manual are both available here: http://transit-safety.volpe.dot.gov/Security/SecurityInitiatives/SMPM/Default.asp The FTA also offers Connecting Communities Training which can be accessed here: http://transit-safety.volpe.dot.gov/training/Archived/EPSSeminarReg/CD/toolkit.htm
Figure 5: FTA Security Manpower Planning Model Website

Hawaii Statewide Transportation Plan Update Issue Paper on Transportation Security
- 34 -

Hawaii Statewide Transportation Plan Update Issue Paper on Transportation Security
- 35 -
Section 4.0 Recommendations for The Hawaii Statewide Transportation Plan Update Hawaii has demonstrated that it is committed to maintaining and improving the security of travelers, residents, and goods. Greater investment in security has been made in airports, harbors, and highways than had been made prior to September 11, 2001. This review suggests several topics worthy of further development in the Hawaii Statewide Transportation Plan Update. The security-related goal and objective in the 2002 HSTP were originally part of the combined safety and security goal. It is proposed that the HSTP Update have a standalone security goal and new objectives:
Section 4.1 Proposed Goals and Objectives for HSTP Update
It is proposed that in keeping with the separation of safety and security in the Federal Eight Planning Factors, the HSTP Update should include a standalone security goal and new objectives as shown below: Goal III: Ensure the secure operation and use of the air, land, and water transportation systems. Objective 1 Minimize risks of disruption of transportation to, from and within Hawaii due to terrorism and other human security threats and events, as well as threats and events from natural causes. Objective 2 Work with Federal, State, and County agencies as well as tenants to conduct vulnerability and risk assessments. Objective 3 Implement security policies and strategies to minimize risks and threats of disruption of or damage to the transportation systems while maintaining the intended function of the system. Objective 4 Provide continuous monitoring of critical infrastructure communications systems to provide for appropriate emergency response capability. Objective 5 Develop a biosecurity plan and measures to protect against pests and disease.

Hawaii Statewide Transportation Plan Update Issue Paper on Transportation Security
- 36 -
Section 4.2 Recommendations for Hawaii Transportation Planning Regarding Security
The State of Hawaii DOT presently conducts many security activities which are important to continue. These activities work across all transportation modes and will assist the department in achieving its Security Goal. The security activities are:
• Training in disaster preparedness response, including emergency drills involving modal division responses to their facilities;
• Planning for disasters; • Clarification of roles, responsibilities, and chains of command locally, regionally, and
nationally • Coordinated emergency drills involving all agencies and entities, including State Civil
Defense, required to carry out a proper response; • Using a risk management approach in making investment decisions; and • Assessing capabilities and utilizing federal grants to enhance those capabilities.
In addition to the security activities, the three modal divisions can also focus on several planning action items to comply with the Security Goal set forth in the HSTP Update. Airports can:
1. Achieve the level of security needed in light of federal requirements and the ever-changing threats, with minimal disruption to passengers and commerce, while recognizing that there can be no single standard for human-caused threats whereas earthquake or tsunami sizes can be used as guides for natural environment-caused threats;
2. Refine the budgeting process to take into account State roles and the roles of Federal and private partners and provide for reserve funding for future special events such as the APEC Leaders’ Meeting in Hawaii’;
3. Recognize that cooperation and collaboration with a wide range of partners, including HSA, TSA, FAA, CBP, USDA, DOA, National Guard, airlines, and vendors, is essential to providing airport security;
4. In collaboration with Harbors, develop a biosecurity plan and measures to protect against pests and disease; and
5. Revise Hawaii Administrative Rules (HAR) Chapter 19 (Airports) to provide an efficient method to adapt to the ever increasing costs of goods and services (i.e., increased costs for badging, security threat assessments, etc.) without having to make changes to the HAR for each and every time an increase in cost occurs.

Hawaii Statewide Transportation Plan Update Issue Paper on Transportation Security
- 37 -
Harbors can:
1. Provide for on-going preparedness for known and evolving threats; 2. Assure that sufficient capability is available and that staff are trained to provide security
on a 24/7 basis; 3. Assure that the most appropriate technologies are identified, acquired, and operated to
minimize security threats; and 4. Continually adapt to and incorporate new federal requirements as well as evolving
understandings of natural environment and human-caused risks. 5. In collaboration with Airports, develop a biosecurity plan and measures to protect
against pests and disease Highways can:
1. Provide for seismic retrofits of highways facilities in areas prone to earthquake disturbances;
2. Conduct emergency planning for closure of major highways in the event of any disaster; and
3. Plan for an alternative to finance unplanned damage to highways facilities in the event of a natural or man-made disaster.
These security activities working in conjunction with specific planning actions will assist Hawaii DOT in achieving its Security Goal.

- 38 -
- 39 -
References Alaska Department of Transportation and Public Facilities. Let’s Get Moving 2030: Alaska
Statewide Long-Range Transportation Policy Plan. February 2008.
American Association of State Highway and Transportation Officials’ Blue Ribbon Panel on Bridge and Tunnel Security. Recommendations for Bridge and Tunnel Security. September 2003
American Association of State Highway and Transportation Officials, Special Committee on Transportation Security. Homeland Security and State Departments of Transportation: Maintaining Strategic Direction for Protecting America’s Transportation System. January 2006.
Congressional Research Service. The Department of Homeland Security’s Risk Assessment Methodology: Evolution, Issues, and Options for Congress. February 2, 2007.
Federal Highways Administration. Emergency Transport Operations. http://ops.fhwa.dot.gov/eto_tim_pse/index.htm.
Federal Transit Administration. Transit Watch. http://transit-safety.volpe.dot.gov/Security/TransitWatch/default.asp
Federal Transit Administration. Security Manpower Planning Model. http://transit-safety.volpe.dot.gov/Security/SecurityInitiatives/SMPM/Default.asp
Illinois Department of Transportation. Illinois State Transportation Plan. 2007.
Illinois Department of Transportation. Illinois State Transportation Plan. Special Report: Global Competitiveness and System Security. December 2007. http://www.illinoistransportationplan.org/pdf/draft_plan07_dec/Global%20Competitiveness%20and%20System%20Security%20(December%202007).pdf
Loy, Admiral James M. and Ross, Captain Robert G. Meeting the Homeland Security Challenge: A Principled Strategy for a Balanced and Practical Response. U.S. Coast Guard. September 2001. http://www.homelandsecurity.org/journal/Articles/Ross_Loy_USCG.htm
Maryland Department of Transportation. 2009 Maryland Transportation Plan. January 2009.
Polzin, Steven E., P.E. Ph.D. Security Considerations in Transportation Planning: A White Paper. Southeastern Transportation Center in cooperation with University of South Florida Center for Urban Transportation Research. 2002.
107th Congress. Public Law 107-296: An Act to Establish the Department of Homeland Security, and for other purposes. Homeland Security Act of 2002. November 25, 2002.
Rand Corporation. Building Community Resilience to Disasters: A Way Forward to Enhance National Health Security. 2011.
http://www.rand.org/content/dam/rand/pubs/technical_reports/2011/RAND_TR915.pdf
State of Florida, Department of Transportation. 2025 Florida Transportation Plan. 2005.
- 40 -
State of Florida, Department of Transportation. Directive Topic No.: 525-030-251-a. Development of the Strategic Intermodal System (SIS) Highway Component. May 2010. Pages 3-4. http://www2.dot.state.fl.us/proceduraldocuments/procedures/bin/525030251.pdf
State of Hawaii. Multi-Hazard Mitigation Plan. 2007.
State of Hawaii, Department of Agriculture. Strategic Plan. Updated December 16, 2008.
State of Hawaii, Department of Agriculture, Plant Industry Division. Report to the Twenty-Fourth Legislature, Regular Session of 2007, Relating to Invasive Species. 2007.
State of Michigan, Department of Transportation. MichiganTransportation Plan: Moving Michigan Forward, 2005-2030 State Long-Range Transportation Plan. 2007.
Transportation Research Board, National Cooperative Highway Research Program. A Guide to Emergency Response Planning at State Transportation Agencies. NCHRP Report 525, Volume 16. 2010.
Transportation Research Board, National Cooperative Highway Research Program. Costing Asset Protection: An All Hazards Guide for Transportation Agencies (CAPTA). NCHRP Report 525, Volume 15. 2009.
Transportation Research Board, Transit Cooperative Research Program. Public Transportation Passenger Security Inspections: A Guide for Policy Decision Makers. TCRP Report 86, Public Transportation Security, Volume 13. 2007.
Transportation Research Board, Transit Cooperative Research Program. Transit Security Update: A Synthesis of Transit Practice. TCRP Synthesis 80. 2009.
Transportation Security Administration. “Layers of Security: What We Do.” http://www.tsa.gov/what_we_do/layers/index.shtm
United States Government Accountability Office. Homeland Security: Preparing for and Responding to Disasters. Statement of William O. Jenkins, Director, Homeland Security and Justice Issues. Testimony before the Subcommittee on Homeland Security, Committee on Appropriations, House of Representatives. Report GAO-07-395T. March 9, 2007.
United States Government Accountability Office. Maritime Security: DHS Progress and Challenges in Key Areas of Port Security. Statement of Stephen L. Caldwell, Director, Homeland Security and Justice Issues. Testimony before the Committee on Commerce, Science, and Transportation, U.S. Senate. Report GAO-10-940T. July 21, 2010.
United States Government Accountability Office. Maritime Security: Responses to Questions for The Record. Stephen L. Caldwell, Director, Homeland Security and Justice Issues. Report GAO-11-140R. October 22, 2010.
United States Government Accountability Office. Risk Management: Strengthening the Use of Risk Management Principles in Homeland Security. GAO-08-904T. Statement of Norman J. Rabkin, Managing Director, Homeland Security and Justice, before the Subcommittee on

- 41 -
Transportation Security and Infrastructure Protection, Homeland Security Committee, House of Representatives. 2008.
United States Government Accountability Office. Transportation Security: Comprehensive Risk Assessments and Stronger Internal Controls Needed to Help Inform TSA Resource Allocation. GAO -09-492. March, 2009
Washington State Transportation Commission and Washington State Department of Transportation. Washington Transportation Plan 2007-2026. November 2006.


Issue Paper #8 System Preservation and Asset Management
In Preparation for the
Hawaii Statewide Transportation Plan Update
Prepared for Department of Transportation
State of Hawaii
Prepared by SSFM International, Inc. With HNTB
2011

Hawaii Statewide Transportation Plan Update Issue Paper on System Preservation and Asset Management
-i-
Table of Contents
Foreword ............................................................................................................................1
Section 1.0 System Preservation and Asset Management Overview .......................................3
Section 2.0 System Preservation and Asset Management Practices ........................................5
Section 3.0 Hawaii DOT Modal Divisions’ Practices in System Preservation and Asset Management ............................................................................................................................9
Section 3.1 Airports .................................................................................................................9 Section 3.2 Harbors ...............................................................................................................11 Section 3.3 Highways.............................................................................................................13 Section 3.4 Funding for System Preservation and Asset Management, All Modes .................15
Section 4.0 System Preservation and Asset Management Practices in Other States .............17
Section 4.1 Florida .................................................................................................................17 Section 4.2 Maryland.............................................................................................................19 Section 4.3 Pennsylvania .......................................................................................................20 Section 4.4 Alaska .................................................................................................................20 Section 4.5 Practices for Highway System Preservation and Asset Management ...................22 Section 4.5 Practices for Airport System Preservation and Asset Management .....................23 Section 4.6 Practices for Harbor System Preservation and Asset Management .....................24
Section 5.0 How the 2002 Hawaii Statewide Transportation Plan Treated System Preservation and Asset Management .................................................................25
Section 6.0 Recommendations for The Hawaii Statewide Transportation Plan Update .........27
References ..........................................................................................................................29

Hawaii Statewide Transportation Plan Update Issue Paper on System Preservation and Asset Management
-ii-
Hawaii Statewide Transportation Plan Update Issue Paper on System Preservation and Asset Management
-1-
Foreword
The Hawaii statewide transportation planning process is being supported by the development of a series of issue papers. Task 7 of the contract requires examination of emerging issues that will have major impacts on Hawaii’s transportation future along with preparation of Issue Papers for each subject. The emerging issues for Hawaii’s transportation were selected by the Hawaii Statewide Transportation Plan Team as issues which may have a significant impact on Hawaii’s residents and their transportation needs. Many emerging issues are associated with the Federal Planning Requirements, changing trends, as well as shifts in public perception. This issue paper addresses the intertwined issues of system preservation and asset management. SSFM is the lead consultant for the Hawaii Statewide Transportation Plan (HSTP) update, and they are supported by a team of consultants. This paper’s lead author is HNTB. This “Issue Paper #8 on System Preservation and Asset Management” includes sections on:
• How the 2002 Hawaii Statewide Transportation Plan (2002 HSTP) treated System Preservation and Asset Management;
• Treatment of System Preservation and Asset Management at Airports, Harbors and Highways in Hawaii
• Best practices from other states; and, • Proposed guidance to be included in the Hawaii Statewide Transportation Plan Update
(HSTP Update). Other issue papers in this series include:
Issue Paper #1: Impact of Federal Planning Requirements (Eight Planning Factors) Issue Paper #2: Climate Change and Sea Level Rise Issue Paper #3: Aging Population and Transportation Issue Paper #4 Fuel and Energy Scenarios for Hawaii Issue Paper #5: Land Use Planning Issue Paper #6: Planning & Design: Context Sensitive Solutions (CSS), Complete
Streets, Smart Growth, and Transit Oriented Development (TOD) Issue Paper #7: Transportation Security Issue Paper #8: System Preservation and Asset Management Issue Paper #9: Financial Scenarios Issue Paper #10: Environmental Coordination

Hawaii Statewide Transportation Plan Update Issue Paper on System Preservation and Asset Management
-2-

Hawaii Statewide Transportation Plan Update Issue Paper on System Preservation and Asset Management
-3-
Section 1.0 System Preservation and Asset Management Overview Owners and operators of transportation infrastructure have a clear and compelling interest in preserving facilities, equipment, and other assets for the longest useful life at the least long term cost. Most also face day-to-day challenges of having the budget or flexibility to invest in maintenance, repair, and rehabilitation needed to minimize long term costs and to avoid unexpected disruptions. Deferred maintenance is as commonly understood by homeowners as it is by the Hawaii Department of Transportation. Whether one discusses repairing a leaky house roof before it fails or old pavement before costly replacement is needed, most readily understand the dilemma. Highways, airports, and harbors are no different. If system assets are continuously maintained throughout their lifecycle, minimal expenditures are necessary for each system element. Contrarily, if pavement—whether on a highway, airport runway, or harbor yard—is not maintained for a long period of time, it will require considerably more money to replace than it would cost for periodic maintenance. In short, system preservation and asset management are about getting the best return on your maintenance investment. The asset management process needs to be an integral element of the Hawaii Statewide Transportation Plan (HSTP). By focusing attention on the current condition of system assets relative to their lifecycle, the HSTP can better inform policy goals and objectives. This can help lead to actions that reduce long term costs which can allow a wider range of investment choices. The most recent trends in system preservation and asset management that are relevant to the Hawaii Department of Transportation are the various means and methods of gathering, processing, and distributing data. A key element of the existing Integrated Transportation Planning and Integrated Transportation Activities processes is an information feedback loop that monitors and evaluates the system. It is this loop that has the most potential to take advantage of system preservation and asset management principles within the existing framework of the Hawaii Department of Transportation. Of course the more relevant the data, and the more direct path of information conveyance, the better the use of the feedback loop. This is discussed further in Section 3.0 of this Issue Paper.

Hawaii Statewide Transportation Plan Update Issue Paper on System Preservation and Asset Management
-4-

Hawaii Statewide Transportation Plan Update Issue Paper on System Preservation and Asset Management
-5-
Section 2.0 System Preservation and Asset Management Practices
The US DOT describes asset management as “a business process and a decision-making framework that covers an extended time horizon, draws from economics as well as engineering, and considers a broad range of assets. The asset management approach incorporates the economic assessment of trade-offs among alternative investment options and uses this information to help make cost-effective investment decisions.” 1
That description goes on to state: “Today's transportation environment is characterized by high user demand, stretched budgets, declining staff resources, and a transportation system that is showing the signs of age. The advent of increasingly powerful computer systems has made the practice of asset management possible. These computer systems not only put sophisticated analytical tools at a highway staff's fingertips, but also allow agency officials to perform ‘what if’ analyses that in turn facilitate discussions with other stakeholders.”
The Federal Highways Administration provides a generic approach to asset management as illustrated in Figure 1 below.2
Figure 1: Asset Management Flow Chart
Source: US DOT FHWA “Asset Management Overview”
1 See http://www.fhwa.dot.gov/infrastructure/asstmgmt/assetman.cfm 2 US DOT FHWA. Asset Management Overview. FHWA-IF-08-008. December 2007. Page 12.

Hawaii Statewide Transportation Plan Update Issue Paper on System Preservation and Asset Management
-6-
All state DOTs want their assets to last as long as they can while still functioning cost-effectively. This requires a keen understanding of how they define the service those assets are to accomplish and how well that is understood by decision-makers. It also requires an understanding of the relationship between the cost of keeping an asset functioning to a state of good repair and the downstream cost of deferred maintenance. US DOT reports that State DOTs commonly raise the following issues and challenges with respect to asset management. These issues were identified in stakeholder workshops and seminars and are outlined below.3
• Technology can serve as an effective driver for advancement of asset management in an agency.
• Organizational culture may be one of the most significant obstacles to advancing asset management in an agency.
• No one particular model can serve as the panacea in moving forward with asset management.
• Agencies that are taking substantive steps to do good asset management differ in their use of the modified approach.
GASB 34 refers to Government Accounting Standards Bureau Statement Number 34, which describes how public agencies can account for the value of their assets in a manner more like the private sector. This accounting standard intends to take short term and long term asset requirements into account while identifying long term budget requirements. The systematic process envisioned by GASB 34 is intended to ensure that an agency has a clear understanding of the near and long term funding requirements needed to keep the existing transportation system in a state of good repair. It may enable an agency to obtain a better bond rating, and therefore lower interest rate, because the rating agencies can conclude that the agency clearly understands the long term costs and can demonstrate that it budgets so as to cover those costs reliably. According to the FHWA Asset Management Overview, asset management practices under GASB 34 have the following elements:4
• An agency is expected to maintain an inventory of all assets • It is expected to complete condition assessments for all assets every three years. • It is expected to report the current cost of preserving infrastructure by describing the
condition at which each specific asset is being maintained. • An asset management system (i.e., defined categories, defined expected conditions,
defined maintenance schedules, regular reporting, etc.) must be used.
3 US DOT FHWA. Asset Management Overview. FHWA-IF-08-008. December 2007. Page 23 4 US DOT FHWA. Pages 7 and 23.

Hawaii Statewide Transportation Plan Update Issue Paper on System Preservation and Asset Management
-7-
Among the challenges in applying GASB 34 are that the process requires an initial investment in time and money that may be difficult to budget, and there are no standards and common monitoring systems for certain kinds of infrastructure. Section 3.0 ahead discusses the asset management systems used by the divisions within HDOT.

Hawaii Statewide Transportation Plan Update Issue Paper on System Preservation and Asset Management
-8-

Hawaii Statewide Transportation Plan Update Issue Paper on System Preservation and Asset Management
-9-
Hawaii DOT Mission Statement To provide a safe, efficient, accessible, and inter-modal transportation system that ensures the mobility of people and goods, and enhances and/or preserves economic prosperity and the quality of life.
Section 3.0 Hawaii DOT Modal Divisions’ Practices in System Preservation and
Asset Management Hawaii DOT’s modal divisions practice system preservation and asset management. High priority is placed on making the facilities, equipment, and other assets function for a long useful life at the lowest reasonable cost. However, each division is challenged by the dual problems of deferred maintenance and of balancing current needs with future needs. The information in this section is based on a series of interviews with Hawaii DOT managers conducted in January and February 2010.
Hawaii DOT recently started modernization programs for Airports and Harbors. These programs focus on improvement of the modal systems, ensuring the public’s needs are served, increasing the system’s capacities, as well as providing for improved system preservation.
Section 3.1 Airports The two principal airports assets Figure 2: Aircraft handstands at HNL for additional aircraft parking
that are monitored and reported on are airfield pavements and runways. The Hawaii DOT Airports Division manages five primary airports and ten secondary airports on six islands. Airfield pavements are monitored and reported consistent with the applicable Federal Aviation Administration (FAA) circular5 on pavement maintenance. This must be adhered to in order to continue eligibility to receive AIP (FAA Airfield Improvement Program) funding.
5 Federal Aviation Administration. AC No. 150/5320-17. Airfield Pavement Surface Evaluation and Rating Manuals. 2004. http://www.faa.gov/arp/150acs.cfm

Hawaii Statewide Transportation Plan Update Issue Paper on System Preservation and Asset Management
-10-
Every five years, Hawaii DOT inspects and reports on airfield pavement for all 15 Hawaii DOT airports. The review looks for signs of distress and uses a standardized rating system. The project needs are prioritized and expenditures planned within the available budget. If more funding is needed to solve particularly important problems, Hawaii DOT seeks additional funds. The Department uses non-destructive testing, pavement impact testing, and other methods to assess current airfield conditions. An automated program developed by the US Army Corps of Engineers is used. Facilities are reviewed in similar manner, but only through a pilot program to date. The pilot program has been completed, and a second phase will get under way when budget is available. The Airports Division uses an asset management software system that considers asset type, condition index, life cycle costs, and prioritization. While these assets discussed are considered what the industry calls “airside,” the Airports Division manages substantial assets that are considered, “landside,” which are the assets that represent the largest part of infrastructure investment. Landside assets refer to public areas before the actual air transit takes place. The Airports Division also releases an Engineer’s Report, which looks at all fifteen airports across the state. The last report was released in May 2010, and it covers an inspection period from October 2009 to April 2010. Overall, the Executive Summary concludes that “the airports in the state system are in generally good to excellent condition. At the larger facilities, most deficiencies were being addressed. At all locations, the Airports Division continues to be challenged by limited resources.”6 The revenue bond covenants require the Airports Division to provide a major maintenance and replacement account to promptly correct any deficiencies of the airport system. As stated in the Engineer’s Report, there are resource constraints to accomplish this. Despite financial challenges, the Airports Division has implemented the Hawaii Airports Modernization Plan to address many of improvements needed to preserve the system. The Airports Modernization Program (AMP) originally announced in 2006 includes $1.3 billion of construction projects that are now underway. The construction includes additional gates and a consolidated car rental facility at Honolulu International Airport, airfield improvements throughout the statewide airport system, security upgrade projects at the major airports, replacement of passenger information systems at the major airports, and projects to preserve and maintain the facilities statewide. In general, Hawaii’s airports make use of natural ventilation. Where mechanical air conditioning is uses, such as at the Honolulu International Airport (HNL), energy efficient options are used. For example, the Airports Modernization Plan was able to fund the HNL
6 Hawaii DOT, Airports Division. Prepared by Bowers + Kubota Consulting. Consulting Engineers Report – 2009: Airport System Facilities Inspection. May 2010. Executive Summary.

Hawaii Statewide Transportation Plan Update Issue Paper on System Preservation and Asset Management
-11-
Diamond Head Concourse Air Conditioning Chiller Plant, creating an air conditioning system that is 50% more energy efficient, and positioning the Kona International Airport at Keāhole (KOA) as the first airport in the world to be cooled by deep ocean water. More projects will take place in the near future to improve baggage handling, expand parking areas, and refurnish facilities with Hawaiian themes throughout the state. Section 3.2 Harbors The Harbors Division manages ten public harbors on six islands. The division’s routine Special Maintenance Program is implemented through the statewide budget process. The intent of the program is to maintain facilities to the design lives for which they were originally constructed. Every six years, the Harbors Division conducts a site visit at each harbor, inspects the facilities, and identifies maintenance and other needs for preserving the key facility elements. In addition, every two years the Harbors Division has a consulting engineer assess the maintenance and related needs for harbors to ensure that the Division is meeting applicable bond covenants. Division staff also review each harbor annually to consider maintenance and capital improvement projects. Annual reviews with users and harbor district managers on each island lead to an annual plan focused on topics such as pavement repair, substructure repair, and routine maintenance. Given how critical the strength and stability of piers are to the long term functioning of the harbors, increased attention is being given to underwater inspection of piers. The DOT Harbors Division, together with the Hawaii Harbor Users Group (HHUG), received Legislative support to begin a comprehensive Harbors Modernization Plan in 2007 to match harbor capacity to current and anticipated needs. HHUG is a non-profit maritime transportation industry group made up the largest shipping interests in Hawaii as well as other waterfront users. The DOT Harbors Division was able to build consensus on projects and priorities by working with their key stakeholder, HHUG, while also working with partner agency Aloha Tower Development Corporation. Starting July 1, 2010, the Aloha Tower Development program was shifted to the DOT Harbors Division Special Projects Group. The Harbors Modernization Plan was developed to ensure that capacity meets demand. Cargo container volume is expected to increase by as much as 66% by 2015 and 93% by 2020 over 2007 numbers.7 Projects are financed by the Harbor Special Revenue Fund and include projects such as the construction of Kalaeloa West Harbor utilities infrastructure on Oahu and acquisition of additional property to expand the east end of Kahului Harbor. The May 30, 2007 Consulting Engineer's Report on Harbors made the following comments with respect to deferred maintenance: 8
7 DOT Harbors Division. “Hawaii Harbors Modernization Plan Fact Sheet.” December 18, 2007. 8 Consulting Engineer's Report on the Public Undertaking - Statewide, Fiscal Year 2005 Job HC 90025. Page 9.

Hawaii Statewide Transportation Plan Update Issue Paper on System Preservation and Asset Management
-12-
• The imperative to cover the ratio of new revenues to harbor revenue bond debt service
requirements coupled with political pressures to not raise tariffs effectively forces DOT-HAR to defer high cost, long term capital maintenance, and improvements year after year.
• The bond coverage requirements and biennial planning and budgeting constraints only serve to reinforce the cycle of deferring maintenance and improvements until they reach a crisis rather than systematically performing preventive maintenance and planned improvements. A quantum change in the structure (i.e. revenues) and program management for capital improvements will be needed if the Hawaii Harbors Users Group (HHUG) vision is to be realized and in order for Harbors to proactively meet the maritime needs of the State.
The Harbors Division reports that many actions have been taken since the 2007 report. A tariff increase began in March 2010—the first tariff increase since 1997. The tariff includes annual increases indexed to inflation. While this increase will help the financial situation, Harbors is in a period of cautious monitoring to ensure that the situation does not worsen while waiting for the economy to rebound. That increase was approved based in part on the assumption that the HHUG and the general public understood that new projects and maintenance of existing assets require additional funding. As the tariff increase takes effect and the economy changes, Harbors will re-evaluate the 2007 Consulting Engineers financial finding. The Harbors Division notes that revenue drives its ability to maintain and improve its system. The Division focuses on maintaining the system within available means. Because the Harbors Division does not receive general funds, the tariff increases were needed to modernize the harbors using a systematic approach. The Division is carrying out an aggressive modernization plan designed in accordance with the planned revenue streams.

Hawaii Statewide Transportation Plan Update Issue Paper on System Preservation and Asset Management
-13-
Figure 3: Site Plan, Kawaihae Harbor
The Division has been able to leverage Federal non-matching dollars to improve the Harbors. In 2005, the State entered into a partnership with the Maritime Administration (MARAD) for the Hawaii Harbors Infrastructure Expansion Program.9 The objective of this program is to stimulate Hawaii’s economy while providing efficiencies in the movement of goods and services. This agreement also expedites projects as a team is already on-board to implement any work orders issued by MARAD. The first project was the Pier 2A Shed Demolition and Yard Improvements at Kawaihae Harbor on the Big Island of Hawaii. The Harbors Division continues looking for other alternative means of financing. They were awarded a $24.5 million TIGER (Transportation Investment Generating Economic Recovery) Grant as part of The American Recovery and Investment Act of 2009 (ARRA or Stimulus) Funds for improvements at Pier 29, Honolulu Harbor. This Federal grant will allow the State to utilize existing cash from its special fund for other projects within the CIP/Maintenance program. TIGER Grants are very competitive with over 1,400 applications submitted and just 50 grants awarded across the US. Section 3.3 Highways Of the many assets monitored by the Highways Division, two principal assets are bridges and pavements. The Highways Division manages over 2,400 miles of paved freeways, highways, and roadways on six islands. The Highways Division looks toward advances being made in road maintenance software as well as best practices by the road and pavement industry to keep abreast of new or better ways to monitor the various highway facilities.
9 This agreement may be found at http://www.marad.dot.gov/ports_landing_page/infra_dev_congestion_mitigation/port_term_infra_dev/pt_infra_dev_hawaii/hawaii.htm

Hawaii Statewide Transportation Plan Update Issue Paper on System Preservation and Asset Management
-14-
The current needs for the routine operation and maintenance of the State Highway System are currently over $115,000,000 per year. Although the State has increased lane miles of the State Highway System, the routine operation and maintenance budget was not increased to properly maintain these additional lane miles. Figure 4: Restriping Wilson Tunnel, Likelike Highway, Oahu
The funding for the routine operation and maintenance is used for maintaining and repairing the pavement and shoulders; bridges and other structures; fencing and walls; traffic signs; guardrails; highway pavement markings and lighting systems; sidewalks and wheelchair ramps; landscaping and irrigation systems; and drainage systems.
In addition, the same operation and maintenance budget also funds restoration of State Highways after landslides, storm damage, traffic accidents, earthquakes, and any other catastrophic events. Operation and maintenance activities on Oahu include a 24-hour, 7-days-a-week schedule, a traffic management center, and managing the National Pollutant Elimination System (NPDES)—Municipal Separate Storm Sewer System (MS4) Program. The Highways Division changed its resurfacing cycle for State Highways from an average of once every 10 years to once every 14 years. Studies have shown that after 10 years, the pavement condition deteriorates at an accelerated rate. The overall condition of the State Highway System has deteriorated because of the reduced Federal Special Maintenance Program (SMP) funding. HDOT continues its best efforts with its resurfacing program. As highway pavement deteriorates, the cost to resurface it increases exponentially. The average cost of preventative maintenance is $183,000 per lane mile, while the average cost for rehabilitation and/or reconstruction increased to $555,000 per lane mile. Bridge maintenance needs are significant considering that many structures are historic and need special care. Bridges on the Big Island of Hawaii require unusual maintenance attention due to their diversity in construction and location.

Hawaii Statewide Transportation Plan Update Issue Paper on System Preservation and Asset Management
-15-
The Highways Division is also responsible for four tunnels. Three tunnels are located on the island of Oahu: Pali Highway (Pali Tunnels—built in 1959); Likelike Highway (Wilson Tunnel—built in 1960); and H-3 (Tetsuo Harano Tunnel—built in 1997). The oldest tunnel in the state, Olowalu Tunnel, was built in 1951 and is located on Honapiilani Highway on the island of Maui. At the time this 315 foot long tunnel was built, it was called, “Operation Puka-in-the-Pali.”10 The operation and maintenance of the tunnel system includes all mechanical, electrical, drainage, ventilation, traffic monitoring, traffic control, and fire control systems in the major tunnels. All four tunnels were reported by the Highways Division to the HSTP consultant team to be maintained well with little or no deferred maintenance. Safety strategies proposed include a mix of highway safety projects on all islands, highway safety programs such as “Safe Routes to School,” and legislative proposals to curb reckless and distracted driving. In recognition of the lengthening Peak Period of travel on the H-1 Freeway, the Division proposed several approaches to reducing traffic congestion such as incident management and the removal of bottlenecks. These approaches were seen as saving time and improving the reliability of commerce. Another effect of reducing traffic congestion would be to save money. Based on the Texas Transportation Institute Model, the Hawaii DOT estimates the annual cost of 20 minutes of delay per person as $1,216.67. Extrapolating out the formula further, the Department estimates an annual savings to HDOT alone at $20-$30 million should 30 minutes of traffic congestion be saved.11
The Hawaii DOT prepares the Strategic Highway Safety Plan (SHSP).12 The SHSP’s main goal is to reduce the number of traffic-related deaths from an annual average of 135 to 100 or fewer within five years. The plan addresses aggressive driving, impaired driving, pedestrian, bicycle, motorcycle and moped safety, roadway design as well as data and management systems. Issue Paper #6 on the Integration of Transportation Planning and Design discusses some of these strategies in greater detail. Section 3.4 Funding for System Preservation and Asset Management, All Modes While each mode does have their own budget and special fund, the costs of system preservation and asset management may sometimes fall outside of these limited funds. Many State DOTs as well as the Hawaii DOT have begun seeking alternative methods to fund system preservation and asset management. As discussed in Section 3.2 on Harbors, funding was leveraged through a TIGER Grant in order to complete a long-awaited project. While this TIGER Grant was not for a specific system preservation or asset management project, the use of
10 Olowalu Town LLC, “History of Travel 1900-1950s” <http://olowalutown.com/index.cfm?fuseaction=ig.page&PageID=132> 11 “State Unveils Comprehensive Six-Year Highways Modernization Plan” Hawaii DOT, January 22, 2009. < http://hawaii.gov/dot/news/state-unveils-comprehensive-six-year-highways> 12 Hawaii Department of Transportation. Hawaii Strategic Highway Safety Plan: 2007-2012. http://hawaii.gov/dot/highways/shsp-1

Hawaii Statewide Transportation Plan Update Issue Paper on System Preservation and Asset Management
-16-
grants to fund system preservation and asset management projects could be helpful to the Hawaii DOT. Another creative funding initiative that will work for some projects is the Partnership for Sustainable Communities, which was initiated in June 2009 by the U.S. Department of Housing and Urban Development (HUD), the U.S. Department of Transportation (DOT), and the U.S. Environmental Protection Agency (EPA).13 These three agencies have pledged to ensure that housing and transportation goals are met while simultaneously protecting the environment, promoting equitable development, and helping to address the challenges of climate change. The following Livability Principles are guiding their work:
• Provide more transportation choices. • Promote equitable, affordable housing. • Enhance economic competitiveness. • Support existing communities. • Coordinate and leverage federal policies and investment. • Value communities and neighborhoods.
A notice from FTA of up to $25.7 million available for alternatives analysis for transit projects (AAs). It was issued in the federal register14 on Friday, May 28, 2010. The funds will be distributed in support of the Department of Transportation’s Livability Initiative. One of the first Livable Communities Grants was awarded in October 2010 to the C&C of Honolulu’s Department of Planning and Permitting. 15 $2,383,424 was awarded to assist the C&C with implementing a Transit-Oriented Housing Strategy around the new rail system in the urban core to maintain and promote housing for low and moderate income families. This could be an opportunity for HDOT to get funding for projects that will contribute to preservation of the transportation system. Other funding initiatives and creative funding opportunities are discussed further in Issue Paper #9 in this series, Financial Scenarios.
13 USDOT Sustainability: http://fta.dot.gov/documents/Sustainable_Communities_Programs_4-26-10.pdf 14 Federal Register / Vol. 75, No. 103 / Friday, May 28, 2010 / Notices 15 http://portal.hud.gov/portal/page/portal/HUD/press/press_releases_media_advisories/2010/HUDNo.10-242

Hawaii Statewide Transportation Plan Update Issue Paper on System Preservation and Asset Management
-17-
Section 4.0 System Preservation and Asset Management Practices in Other States
It is helpful to review the practices of other states for system preservation and asset management. As infrastructure ages, the maintenance and preservation needs grow disproportionately, particularly when deferred maintenance is taken into account. A review of state transportation plans over the last twenty years shows increasing emphasis on what it takes to keep the existing transportation system in a state of good repair. The review shows a common concern for getting sufficient legislative and public attention for increasing maintenance and preservation budgets. Summaries of treatment of system preservation and asset management by selected other states follow. Florida, Maryland, and Pennsylvania were selected as examples of best practices. Alaska was selected because, like Hawaii, it is a non-contiguous state. Section 4.1 Florida Florida was selected as a comparative because it was one of the sites visited in an NCHRP Scan-Tour on Asset Management. The 2025 Florida State Plan’s (FSP) goal is: Adequate and cost-efficient maintenance and preservation of transportation assets. The FSP identifies two issues that bear on preservation: 1) the rising costs of transportation (including the increasing costs for keeping the system functional); and 2) insufficient funding. The FSP describes the transportation system as representing an investment of many billions of dollars. Regular maintenance and preservation of these transportation assets keep them operating efficiently, extend their useful life, and delay the need for costly reconstruction or replacement. Specific Objectives stated in the FSP include:
• Maintain all elements of the transportation system to protect the public’s investment for the future.
• Eliminate the illegal operation of commercial motor vehicles that exceed weight limits on Florida’s public roads and bridges.
• Maximize the use of alternative, non-roadway modes to transport overweight and oversize loads.
Key implementation strategies listed in the FSP include:
• Monitor system condition to ensure that all transportation facilities, including bicycle and pedestrian facilities, are adequately maintained and preserved.
• Emphasize use of state-of-the-art technologies and innovative contracting methods to increase the efficiency of system maintenance.

Hawaii Statewide Transportation Plan Update Issue Paper on System Preservation and Asset Management
-18-
• Create strong cooperative relationships between the state, local governments, and modal partners to minimize pavement impacts of overweight and oversize loads.
• Analyze the process for permitting the transportation of overweight or oversize loads, including the appropriateness of permit fees, and implement any needed improvements.
• Analyze the adequacy of penalties imposed for violations of commercial motor vehicle weight limits and implement any needed improvements.
A Scan-Tour Report prepared for the National Cooperative Highway Research Program looked at Florida’s Asset Management Practices. Florida was chosen for that report because it is one of the fastest growing states in the country, is a major tourist destination, and is projected to have a 92.8% increase in its aging population by the year 2025.16 Figure 5: Florida DOT’s Concept of the Asset Management Process The Scan-Tour Report states that Florida DOT (FDOT) has a strong tradition in multimodal transportation planning and decision-making and has one of the largest investment programs of any state DOT in the country, with a 5-year work program estimated at $31.1 billion. Like Hawaii, The FDOT oversees highways, bridges, aviation facilities, and seaports. The FDOT also oversees fixed-route transit systems and thousands of railway miles. Source: NCHRP Project 20-68, Page 2-5 The primary policy of FDOT is to invest first in projects that enhance safety and system preservation, promote economic competitiveness, and provide mobility. All FDOT maintenance needs are funded first before any capacity expansion projects are programmed.17 Asset management is considered to be the entire process of planning, programming, and system monitoring as seen in Figure 5.18 Funding for the primary intermodal systems, or Strategic Intermodal System (SIS), is a priority, with the SIS projects specifically identified and including commercial service airports, spaceports, seaports, rail freight terminals, rail corridors, and highways. FDOT has also taken the lead to develop new approaches and strategies for linking infrastructure decisions with economic, environmental, and transportation system performance
16 Cambridge Systematics, Inc. NCHRP Project 20-68, Domestic Scan Pilot Program: Best Practices in Transportation Asset Management. February 2007. Page 2-1. 17 NCHRP Project 20-68. Page 2-2. 18 NCHRP Project 20-68. Page 2-5.
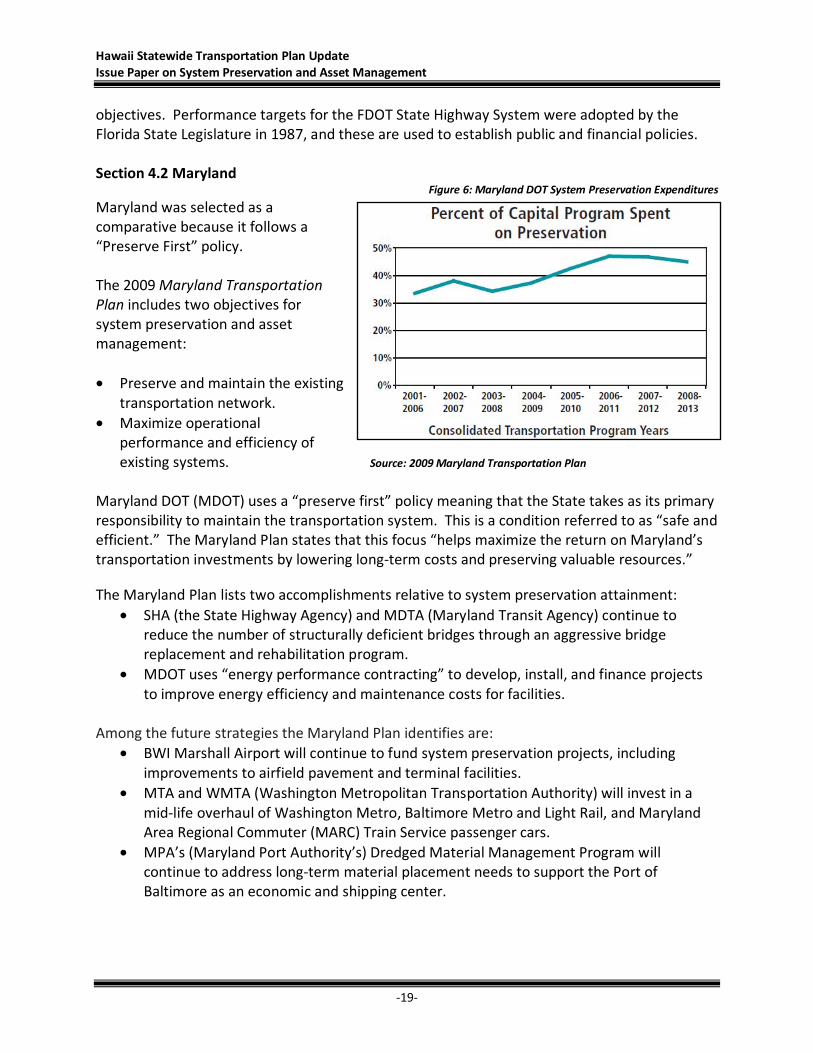
Hawaii Statewide Transportation Plan Update Issue Paper on System Preservation and Asset Management
-19-
objectives. Performance targets for the FDOT State Highway System were adopted by the Florida State Legislature in 1987, and these are used to establish public and financial policies. Section 4.2 Maryland
Figure 6: Maryland DOT System Preservation Expenditures
Maryland was selected as a comparative because it follows a “Preserve First” policy. The 2009 Maryland Transportation Plan includes two objectives for system preservation and asset management: • Preserve and maintain the existing
transportation network. • Maximize operational
performance and efficiency of existing systems. Source: 2009 Maryland Transportation Plan
Maryland DOT (MDOT) uses a “preserve first” policy meaning that the State takes as its primary responsibility to maintain the transportation system. This is a condition referred to as “safe and efficient.” The Maryland Plan states that this focus “helps maximize the return on Maryland’s transportation investments by lowering long-term costs and preserving valuable resources.”
The Maryland Plan lists two accomplishments relative to system preservation attainment: • SHA (the State Highway Agency) and MDTA (Maryland Transit Agency) continue to
reduce the number of structurally deficient bridges through an aggressive bridge replacement and rehabilitation program.
• MDOT uses “energy performance contracting” to develop, install, and finance projects to improve energy efficiency and maintenance costs for facilities.
Among the future strategies the Maryland Plan identifies are:
• BWI Marshall Airport will continue to fund system preservation projects, including improvements to airfield pavement and terminal facilities.
• MTA and WMTA (Washington Metropolitan Transportation Authority) will invest in a mid-life overhaul of Washington Metro, Baltimore Metro and Light Rail, and Maryland Area Regional Commuter (MARC) Train Service passenger cars.
• MPA’s (Maryland Port Authority’s) Dredged Material Management Program will continue to address long-term material placement needs to support the Port of Baltimore as an economic and shipping center.

Hawaii Statewide Transportation Plan Update Issue Paper on System Preservation and Asset Management
-20-
• State Highway Agency and Maryland Transit Agency will continue to maintain State roadway pavements and a rigorous bridge inspection program to ensure that all State roads and bridges open to the public can safely carry legally loaded vehicles.
Section 4.3 Pennsylvania The Pennsylvania Mobility Plan: Leading Transportation Change: 2006-2030, treats system preservation and asset management in a manner similar to that of Maryland. The goals are to:
• Adhere to "maintenance first" policies in the allocation of financial and other resources. • Develop a 50-year facilities management plan.
The plan states that 80% of PennDOT’s resources are expected to be expended on maintenance programs and projects. PennDOT gauges the “state of the system” through a periodic report that includes baseline data and performance indicators that dovetail with the state transportation plan’s objectives. This report assists the department and decision-makers to make appropriate near-term and long—term modifications to allocation of resources. PennDOT is working to identify their core system, which is much like Maryland’s SIS and will include airports, transit, railroads, water ports, and highways. This core system is called the Core PA Transportation System and will be phased in as a focus for developing the department’s modal programs. Section 4.4 Alaska
Figure 7: Alaska Maintenance Funding Versus 1983 Maintenance Funding
The State of Alaska was selected as a comparative because, like Hawaii, it is physically separated from the ‘mainland’ or, in their case, the ‘lower 48,’ and thus faces issues such as geographically remote cities; a reliance on air travel; a large amount of coastal roadways; and a small per capita user base compared to the geographical spread of the transportation system. Alaska has 256 airports (large and small,) 5,595 miles of paved and unpaved roads, and 61 harbors.
Source: Let’s Get Moving 2030: Alaska Statewide Long-Range Transportation Policy Plan

Hawaii Statewide Transportation Plan Update Issue Paper on System Preservation and Asset Management
-21-
Data management areas of focus for the Alaska Business Data Plan include: Data Systems
• Legacy mainframe systems • Geographic information system (GIS) • Asset management system • Pavement Management System (PMS) • Traffic data system • Highway Safety Improvement Program
(HSIP) • Bridge Management System (BMS) • 511 Traveler Information System • Road Weather Information System (RWIS) • Temperature Data Probe (TDP)
Data Infrastructure • Data warehouses / data marts • ITS Architecture ADUS • Spatial geo-database • Data integration, sharing, & linkage • Data access - web and internal network • Communication & networking • Anticipated technologies
Data stewardship • Data collection plans • Inventory processes • Data processing • Data reporting • Data Storage • Metadata • Value-added data programs • National / local best practices
Alaska has a robust system preservation and asset management program to best allocate transportation funding. Figure 7 demonstrates funding gaps (held constant in 1983 dollars). Alaska Department of Transportation and Public Facilities (Alaska DOT&PF) believes that to effectively manage their vast transportation network they have had to embrace asset management and system preservation. Their large transportation network has made funding a critical issue. The State of Alaska has initiated a Business Data Plan for Data Management Programs to overhaul the way information is gathered and transmitted within the Alaska DOT&PF. The core of the Business Data Plan is to perform a reevaluation and system upgrade of its data management systems. The goal of the Business Data Plan is for the State of Alaska to have a data management system “collecting the right data, distributing it to the right people, and applying it at the right time.” The GIS database for Alaska DOT&PF is exemplary because it is so comprehensive. It is organized into individual maintenance districts. Each district can be managed as a regional entity, yet all data can be summarized at the State level. Below are examples of the GIS summaries for the maintenance districts, connected road systems, airports, bridges, and harbor facilities.

Hawaii Statewide Transportation Plan Update Issue Paper on System Preservation and Asset Management
-22-
When taken holistically, the data system, infrastructure, and stewardship review in the text box can be seen as a system of communication supporting the mission of system preservation and asset management which needs the correct communication backbone to be successful.
This system is expressed in the five steps of asset management: 1) Identification of Goals and Objectives; 2) Development of System Performance Measures; 3) Analysis of Alternatives; 4) Decision-making; and 5) Continuous monitoring.
Investment in specific areas that aid in the communication of critical data would provide almost immediate payback and ensure that public funds are best used within the transportation system. Indeed, a clear and open communication summary can bolster public trust in transportation funding, providing a public record of accountability should policy makers decide to make this information available to all. While this data management review is being performed by the Alaska DOT&PF, they are able to utilize an existing database of life-cycle costs for major project elements in their transportation system. The advantage in maintaining such a database from an asset management viewpoint is that there can be maintenance trigger points built into each transportation element type. For example, in the established life span of a specific bridge type, specific maintenance can be planned to occur at specific years, forestalling neglect and potential bridge replacement. Additionally, public availability of transportation element life-cycles and the planned costs to maintain them, reinforce accountability from a policy standpoint. Section 4.5 Practices for Highway System Preservation and Asset Management The National Cooperative and Highway Research Program (NCHRP) 2004 report on the public benefits of Highway System Preservation and Asset Management focused on work that is performed in anticipation of major problems, which included highway system preservation activities and describes several methodological techniques suitable for asset management. These include:
• Least Cost Planning • Life Cycle Costing • Opening Day Cost compared to life of the project. 19
19 National Cooperative Highway Research Program (NCHRP). NCHRP Synthesis 330: Public Benefits of Highway System Preservation and Maintenance. Transportation Research Board. 2004.

Hawaii Statewide Transportation Plan Update Issue Paper on System Preservation and Asset Management
-23-
Computation of a life-cycle cost is the total net cost of providing highway service for a specified period of years that constitutes that facility’s life. Definitions of three methods of conducting this type of analysis are below. Least cost planning for existing assets: The main principle applied in this practice is cost-benefit analysis. This process begins at the earliest planning stages when alternative means of addressing a problem or need are being considered for assets that are already constructed. As suggested by its name, this process looks to the alternatives that will incur the least cost over the long term. This depends on all alternatives being able to accomplish whatever public purpose is being sought. The ones that provide the needed benefits at the least cost would be given preference. This links to asset management by focusing on what it will take to (preserve) keep that asset functioning in a useful manner for the planned life cycle. To carry this practice out rigorously, divisions need to consider risks and what it will take to constrain or address them over time. Analysis of Costs for New Assets: Life cycle costing: This practice requires consideration of not only the capital costs of infrastructure but also the operations, maintenance, rehabilitation, and eventual replacement costs. It takes into account all the costs of acquiring, building, owning and operating an asset before it is built. Opening day versus life-of-the-project costing: Most transportation projects focus in the early decision-making stages on the capital costs. While operations, maintenance, and other downstream costs may be considered, the principal focus is on what it takes to get to opening day, so this only focuses on initial capital costs of new projects or what some call “first costs.” The NCHRP report survey of transportation departments in all 50 states and the District of Columbia showed that most states faced problems with getting funding for system preservation, and this “stems from a lack of appreciation—particularly among public officials, political leaders, and the general public—of the benefits of effective maintenance and the costs of neglecting maintenance.”20 Several DOTs across the US provided anecdotal evidence that marketing or public relations efforts build support for maintenance programs, which translates to favorable legislative outcomes, favorable media coverage, and reduction in the numbers of complaints received.21 This was termed “Marketing of Maintenance.” Section 4.5 Practices for Airport System Preservation and Asset Management In 2008, the Transportation Research Board published a report Applications of Geographic Information System in Airfield Infrastructure System Management and Maintenance.22 The
20 NCHRP Synthesis 330. Page 17. 21 NCHRP Synthesis 330. Page 27. 22 Ho, Chun-Hsing and Romero, Pedro. Applications of Geographic Information System in Airfield Infrastructure System Management and Maintenance. Transportation Research Bureau. 2008.

Hawaii Statewide Transportation Plan Update Issue Paper on System Preservation and Asset Management
-24-
report stated that new GIS applications for airfield infrastructure system management and maintenance present an opportunity to be more efficient. An integrated Geographic Information System (GIS) combined with Geographic Positioning Systems (GPS) provides a powerful tool to assist airport operators and engineers to improve regular airport inspection. The application of GPS and GIS technologies can also assist airports to improve their operation systems and increase aviation safety. Section 4.6 Practices for Harbor System Preservation and Asset Management In 2009, the FHWA Research and Innovative Technology Administration gave a presentation in Honolulu on the Nationwide Differential Global Positioning System (NDGPS)—Capabilities and Potential.23 The NDGPS is a National space-based positioning, navigation and timing (PNT) utility. The NDGPS is operated and managed by the US Coast Guard as a Combined NDGPS for Maritime, DOT, and Army Corps of Engineers sites. The NDGPS system could also be used for land-based systems, such as highways, National Parks Service, and local NOAA offices. For harbors, NDGPS can aid in navigation, underwater surveying, and dredging within a 2 meter accuracy requirement. The US Government is working with non-US spaced-based PNT services so that all information is compatible and interoperable. This not only ensures a level playing field but also keeps all signals from interfering with one another, providing better capabilities and reliability.
23 Klein, Timothy A. “Nationwide Differential Global Positioning System (NGDPS): Capabilities and Potential.” PowerPoint Presentation presented in Honolulu to Civil GPS Service Interface Committee, US States and Local Government Subcommittee. http://ntl.bts.gov/lib/32000/32000/32037/NDGPS_C_P_CGSIC-USSLS_Honolulu_062309.ppt. US DOT Research and Innovative Technology Administration. 2009.

Hawaii Statewide Transportation Plan Update Issue Paper on System Preservation and Asset Management
-25-
Section 5.0 How the 2002 Hawaii Statewide Transportation Plan Treated System Preservation and Asset Management
The 2002 HSTP addressed the need for system preservation and asset management by including specific preservation policies and by discussing how the policies should apply. Figure 8 from the 2002 HSTP shows the integration of system preservation in the planning process. During Program Management, which is located on the bottom tier of the figure, operations and maintenance is tied to the monitoring program – although indirectly. This critical reporting mechanism allows a performance evaluation to cross check the ongoing 6-10 Year Plan as well as the HSTP’s policies and objectives.
Figure8: Integrated Transportation Planning and the HSTP
Source: 2002 Hawaii Statewide Transportation Plan

Hawaii Statewide Transportation Plan Update Issue Paper on System Preservation and Asset Management
-26-
GOAL I: Achieve an integrated multi-modal transportation system that provides mobility and accessibility for people and goods. Objective 1: To preserve, maintain, and improve the air, land, and water transportation system infrastructure and programs with regard to each community's unique characteristics. C. Pursue the maintenance and rehabilitation of the transportation system. Examples:
• Identify existing maintenance deficiencies and resolve or mitigate. • Monitor and evaluate systems performance. • Coordinate state and county maintenance and rehabilitation projects. • Consider the use of life cycle costs in the project design and engineering that could result
in using more durable materials.
Source: 2002 HSTP, Page 42
The 2002 HSTP Goals and Objectives for system preservation fall under Goal I for mobility and accessibility as seen in the following text box.

Hawaii Statewide Transportation Plan Update Issue Paper on System Preservation and Asset Management
-27-
Section 6.0 Recommendations for The Hawaii Statewide Transportation Plan Update
Hawaii has demonstrated that it is committed to preserving the State’s transportation assets and to improving how it monitors the condition of those assets. This review suggests several topics worthy of further development in the Hawaii Statewide Transportation Plan Update. System Preservation and Asset Management are among the key objectives for Goal I, Mobility & Accessibility, and financing them are part of the Objectives in Goal VII, Finance. Another thing that will assist the Department with System Preservation and Asset Management is citizen involvement. As proposed in the HSTP Policy Paper on the Planning Process, new stakeholder and citizen advisory committees could be formulated to advise on appropriate outreach and public involvement. The advisory committee would not be a substitute for a broad program of public involvement, but would give advice to HDOT on methods to better achieve the purposes of meaningful public involvement. In addition, a new ad hoc advisory group on public involvement could be created to advise STP, the Director, and HDOT on public involvement techniques, ways to ensure environmental justice compliances, and to review any Public Involvement Plans for HDOT or specific HDOT planning activities. By involving more citizens and stakeholder, HDOT would be able to inform the greater public about their policies, including the “Marketing of Maintenance” as is proposed in recommendation #4 below. Specific recommendations for the HSTP Update include those for improving the understanding and usefulness of system preservation for transportation in Hawaii and for strengthening the emphasis on asset management:
1. Adopt a policy that Hawaii DOT will establish a “maintenance first” policy similar to Maryland.
2. Adopt a policy that Hawaii DOT will establish the expected life cycles and typical maintenance needs for the more significant assets.
3. Refine the state’s asset management processes to include developing a system of performance measures as seen as a best practice in other states. This would also include periodic public reporting.
4. Provide periodic reporting of the anticipated costs for system preservation along with the consequences of deferred maintenance and/or rehabilitation. The Hawaii DOT can think of it as the NCHRP’s term, Marketing of Maintenance. There are different forms of period public reporting of the trends in what it costs and what it will cost to preserve the transportation system, and these should be explored. Asset management, maintenance, and budgeting processes are typically not topics of great interest to the public. However, the consequences of deferred maintenance and the decreasing share of state budgets available for new facilities are becoming more common stories. As the infrastructure ages and as longer term cost issues increase, some form of public reporting of the systematic consideration of what it takes to preserve the system will gain more widespread interest.

Hawaii Statewide Transportation Plan Update Issue Paper on System Preservation and Asset Management
-28-
5. A Geographic Information System (GIS) would be useful for asset management by providing a record of the location and condition of the assets. Assets can be systematically located, tracked, and monitored. This is also referred to as “geocoding” assets. Data can be accessed by staff in different locations or even different islands. This not only improves accuracy of data for GASB-34 reporting, but also increases efficiency of operations.
6. Hawaii DOT can continue to seek alternative ways of funding, such as through the TIGER Grant recently secured by the Harbors Division.

Hawaii Statewide Transportation Plan Update Issue Paper on System Preservation and Asset Management
-29-
References
American Society of Civil Engineers (ASCE). Guiding Principles for the Nation’s Critical
Infrastructure. 2009. Cambridge Systematics, Inc. National Cooperative Highway Research Program (NCHRP) Project
20-68, Domestic Scan Pilot Program: Best Practices in Transportation Asset Management. Sponsored by American Association of State Highway and Transportation Officials, Federal Highway Administration, and National Cooperative Highway Research Program. February 2007.
Federal Aviation Administration. AC No. 150/5320-17. Airfield Pavement Surface Evaluation
and Rating Manuals. 2004. http://www.faa.gov/arp/150acs.cfm Federal Highways Administration. “What is Asset Management?”
http://www.fhwa.dot.gov/infrastructure/asstmgmt/assetman.cfm Federal Highways Administration. Asset Management Overview. FHWA-IF-08-008. December
2007. Federal Highways Administration. Life Cycle Cost Analysis Primer, Office of Asset Management.
FHWA-IF-02-047. 2002. Hawaii Institute of Public Affairs (HIPA). Report on the State of Physical Infrastructure in
Hawaii. July, 2010. Ho, Chun-Hsing and Romero, Pedro. Applications of Geographic Information System in Airfield
Infrastructure System Management and Maintenance. Transportation Research Bureau. 2008.
Klein, Timothy A. “Nationwide Differential Global Positioning System (NGDPS): Capabilities and
Potential.” PowerPoint Presentation presented in Honolulu to Civil GPS Service Interface Committee, US States, and Local Government Subcommittee. http://ntl.bts.gov/lib/32000/32000/32037/NDGPS_C_P_CGSIC-USSLS_Honolulu_062309.ppt. US DOT Research and Innovative Technology Administration. 2009.
NCHRP. NCHRP Synthesis 330: Public Benefits of Highway System Preservation and
Maintenance. Transportation Research Board. 2004. State of Alaska, Department of Transportation and Public Facilities. Let’s Get Moving 2030:
Alaska Statewide Long-Range Transportation Policy Plan. February 2008.

Hawaii Statewide Transportation Plan Update Issue Paper on System Preservation and Asset Management
-30-
State of Florida, Department of Transportation. 2025 Florida Transportation Plan. 2005. State of Hawaii Department of Transportation. Setting the Course, Hawaii Statewide
Transportation Plan. 2002 State of Hawaii Department of Transportation. Hawaii Strategic Highway Safety Plan: 2007-
2012. 2007. State of Hawaii Department of Transportation, Airports Division. Prepared by Bowers + Kubota
Consulting. Consulting Engineers Report – 2009: Airport System Facilities Inspection. May 2010.
State of Hawaii Department of Transportation, Harbors Division. Consulting Engineer's Report
on the Public Undertaking - Statewide, Fiscal Year 2005 Job HC 90025. State of Maryland, Department of Transportation. Maryland Transportation Plan. 2009. State of Michigan, Department of Transportation. Michigan Transportation Plan: Moving
Michigan Forward. 2007. TRIP. Future Mobility in Hawaii: Meeting the State’s Need for Safe and Efficient Mobility.
September 2009.


Issue Paper #9 Financial Issues
In Preparation for the Hawaii Statewide Transportation Plan Update
Prepared for Department of Transportation
State of Hawaii
Prepared by SSFM International, Inc.
With HNTB
2011

Hawaii Statewide Transportation Plan Update Issue Paper on Financial Issues
-i-
Table of Contents
Foreword .................................................................................................................................... 1
Section 1.0 Introduction ............................................................................................................. 3
Section 2.0 Background .............................................................................................................. 5
Section 3.0 HDOT Airports Division ............................................................................................ 7
Section 3.1 Revenue Overview ............................................................................................................. 7
Section 3.2 Fund Sources ..................................................................................................................... 9
Section 3.3 Expenditures .................................................................................................................... 13
Section 3.4 Capital Improvements ..................................................................................................... 14
Section 3.5 Challenges ....................................................................................................................... 19
Section 4.0 HDOT Harbors Division .......................................................................................... 21
Section 4.1 Revenue Overview ........................................................................................................... 21
Section 4.2 Fund Sources ................................................................................................................... 23
Section 4.3 Expenditures .................................................................................................................... 25
Section 4.4 Capital Improvements Program ....................................................................................... 26
Section 4.5 Challenges ....................................................................................................................... 30
Section 5.0 HDOT Highways Division ........................................................................................ 31
Section 5.1 Revenue Overview ........................................................................................................... 31
Section 5.2 Fund Sources ................................................................................................................... 33
Section 5.3 Expenditures .................................................................................................................... 35
Section 5.4 Capital Improvements Program ....................................................................................... 36
Section 5.5 Challenges ....................................................................................................................... 38
Section 6.0 County Transit Systems .......................................................................................... 39
Section 6.1 Federal Funding Sources .................................................................................................. 39
Section 6.2 Local Funding Sources...................................................................................................... 41
Section 6.3 City and County of Honolulu – Transit .............................................................................. 41 Section 6.31 Division of Transportation Services (DTS) - Public Transit Division ............................................ 41 Section 6.311 Revenue Overview ................................................................................................................. 42 Section 6.312 Operations and Maintenance Expenditures ........................................................................... 43 Section 6.313 Capital Improvements Program ............................................................................................. 43 Section 6.314 Challenges ............................................................................................................................. 44 Section 6.32 DTS Rapid Transit Division (Honolulu High-Capacity Transit Corridor Project) ........................... 45

Hawaii Statewide Transportation Plan Update Issue Paper on Financial Issues
-ii-
Section 6.4 - Kauai County – Kauai Transportation Agency (Kauai Bus) .............................................. 47 Section 6.41 Revenue Overview................................................................................................................... 47 Section 6.42 Operations and Maintenance .................................................................................................. 48 Section 6.43 Capital ..................................................................................................................................... 48 Section 6.44 Challenges ............................................................................................................................... 48
Section 6.5 Hawaii County Mass Transit Agency (Hele-On Bus) .......................................................... 49 Section 6.51 Revenue Overview................................................................................................................... 49 Section 6.52 Operations and Maintenance .................................................................................................. 49 Section 6.53 Capital ..................................................................................................................................... 49 Section 6.54 Challenges ............................................................................................................................... 50
Section 6.6 Maui County Public Bus Transit System (Maui Bus) .......................................................... 51 Section 6.61 Revenue Overview................................................................................................................... 51 Section 6.62 Operations and Maintenance .................................................................................................. 52 Section 6.63 Capital ..................................................................................................................................... 52 Section 6.64 Challenges ............................................................................................................................... 52
Section 7.0 Funding Opportunities ........................................................................................... 53
Section 7.1 Federal Transportation Programs and Revenue Sources ................................................... 53
Section 7.2 Funding Opportunities for All Modes................................................................................ 56 Section 7.21 Livability Initiative - Leveraging the Partnership: DOT, HUD, and EPA Programs ........................ 56 Section 7.22 Economic Recovery Funding .................................................................................................... 57
Section 7.3 Funding Programs by Mode ............................................................................................. 57 Section 7.31 Formula Funding Programs for Transit ..................................................................................... 57 Section 7.32 Funding Programs for Transit Serving Target Populations ......................................................... 60 Section 7.33 Funding Programs by the Federal Highway Administration ....................................................... 61 Section 7.34 Flexible Programs under the Federal Highway Administration .................................................. 63 Section 7.35 Security Grants ........................................................................................................................ 64 Section 7.36 Planning Grants ....................................................................................................................... 64 Section 7.37 Opportunities for Airports ....................................................................................................... 65 Section 7.38 Opportunities for Harbors........................................................................................................ 66
Section 7.4 Leveraging Existing Transportation Assets ....................................................................... 67 Section 7.41 Value Capture Techniques ....................................................................................................... 67 Section 7.42 Tolls and Congestion Pricing .................................................................................................... 68
Section 7.5 Innovative Highway Financing Strategies/Tools ............................................................... 69
Section 8.0 Recommended Approach to Financial Issues in the Hawaii Statewide Transportation Plan Update .....................................................................................................73
References ................................................................................................................................ 75
Appendix 1 Federal Surface Transportation Reauthorization Bill Issues .................................. 77

Hawaii Statewide Transportation Plan Update Issue Paper on Financial Issues
-1-
Foreword The Hawaii state transportation planning process is being supported by the development of a series of issue papers. Task 7 of the contract requires examination of emerging issues that will have major impacts on Hawaii’s transportation future along with preparation of Issue Papers for each subject. The emerging issues for Hawaii’s transportation were selected by the Hawaii Statewide Transportation Plan Team as issues which may have a significant impact on Hawaii’s residents and their transportation needs. Many emerging issues are associated with the Federal Planning Requirements, changing trends, as well as shifts in public perception. This issue paper addresses financial issues associated with transportation planning. Section 1.0 explains the format of this paper and its purpose. SSFM is the lead consultant for the Hawaii Statewide Transportation Plan (HSTP) update, and they are supported by a team of consultants. This paper’s lead author is HNTB. Issue papers in this series include:
Issue Paper #1: Impact of Federal Planning Requirements (Eight Planning Factors) Issue Paper #2: Climate Change and Sea Level Rise Issue Paper #3: Aging Population and Transportation Issue Paper #4: Fuel and Energy Scenarios for Hawaii Issue Paper #5: Land Use Planning Issue Paper #6: Planning & Design: Context Sensitive Solutions (CSS), Complete
Streets, Smart Growth, and Transit Oriented Development (TOD) Issue Paper #7: Transportation Security Issue Paper #8: System Preservation Issue Paper #9: Financial Scenarios Issue Paper #10: Environmental Coordination

Hawaii Statewide Transportation Plan Update Issue Paper on Financial Issues
-2-

Hawaii Statewide Transportation Plan Update Issue Paper on Financial Issues
-3-
Section 1.0 Introduction This paper discusses the financial issues that affect the three HDOT modal divisions (Airports, Harbors, and Highways) and the county transit systems in preparation for the financial component of the Hawaii Department of Transportation (HDOT) Hawaii State Transportation Plan (HSTP) Update. Financial Issues Paper Topics: This paper includes discussions of revenues, fund sources, expenditures, fund opportunities, and challenges. These issues are discussed for the following transportation units:
• HDOT Airports Division • HDOT Harbors Division • HDOT Highways Division • County Transit Systems
o Federal and Local Funding Overview o City and County of Honolulu
Department of Transportation Services (DTS) - Public Transit Division and Oahu Transit Services (OTS)
DTS Rapid Transit Division (Honolulu High-Capacity Transit Corridor Project)
o Kauai County – Kauai Transportation Agency (Kauai Bus) o Hawaii County Mass Transit Agency (Hele-On Bus) o Maui County Public Bus Transit System (Maui Bus)

Hawaii Statewide Transportation Plan Update Issue Paper on Financial Issues
-4-
The paper concludes with a section on a recommended approach to financial issues in the Hawaii Statewide Transportation Plan Update. Appendix 1 in this issue paper includes a discussion of the reauthorization of the surface transportation act, Safe, Accountable, Flexible, Efficient Transportation Equity Act: A Legacy for Users (SAFETEA-LU) of 2005, themes and issues. The financial summary depicts operating and capital revenues and expenditures, beginning in FY2008 and extending annually through FY2035. Assumptions and indicators are shown at the top of the worksheet. These include general and modal-specific economic variables that provide contextual references to revenue and spending assumptions. The financial models developed by HNTB for this project provide templates that can be used to create long range financial planning estimates and scenarios. The financial projections depicted for each transportation organization are based on the best information available at the time this paper was prepared in 2010.

Hawaii Statewide Transportation Plan Update Issue Paper on Financial Issues
-5-
Section 2.0 Background In order to gather the most accurate and up-to-date information, HNTB with SSFM led interviews with the staff at HDOT Divisions and County Transit Divisions who are experts in finance, budgeting, and programming. In-person interviews were held with each HDOT Divisions (Airports, Harbors and Highways), the HDOT Statewide Transportation Planning (STP) office, City and County of Honolulu Department of Transportation Services, and Oahu Transit Services (OTS) on the following dates: July 13-15, 2009, with follow up interviews from September 28-30, 2009. A third meeting was held with HDOT Harbors and HDOT Highways on January 19, 2010, and with HDOT Airports, via conference call, on February 10, 2010. In addition, the consultant team met with Oahu Metropolitan Planning Organization (OahuMPO) staff on September 28, 2009, to discuss OahuMPO’s long range plan assumptions and how those related to the update of the HDOT Hawaii Statewide Transportation Plan. Finally, the Team held a conference call with the Neighbor Island transit systems staff (Hawaii, Kauai, and Maui) with the HDOT STP office on August 18, 2009. The consultant team had several follow-up conference calls with the various HDOT, transit, and OahuMPO representatives to clarify issues and review the financial model assumptions. The interviews were composed of the following segments, customized for each interview:
1) Purpose: The purpose of the interviews was to review the summary of financial issues for each HDOT Division/County transit system for input into the SSFM Team’s Financial Issues paper and to review the financial spreadsheet for the 25-year projection of revenues and expenditures (operations, maintenance, and capital improvement programs) for each Division/County transit system. This was presented by Linda Bohlinger, HNTB and Chris Swanson, HNTB, of the SSFM Team
2) Information for Reaction:
• Draft financial issues by HDOT Division/County transit. • Draft interactive financial spreadsheet for each Division/County with revenues and
expenditures projected for 25 years, updated with information collected from each Division/County.
3) Information Needed from HDOT Divisions/County transit systems:
• Multi-year financial forecast • Budget information for Operations, Maintenance, and Capital Expenditures • Capital Improvement Program (planned capital expenditures)
Hawaii Statewide Transportation Plan Update Issue Paper on Financial Issues
-6-
4) Assumptions for the projection of revenues and expenditures
A. Escalation rate for operating costs and capital expenditures (All) B. Debt service and bond proceeds assumptions beyond the budget year (Harbors and
Airports)
5) Discussion Topics: A. Financial/Funding Issues
a) Review and comment on highlighted Funding/Revenue/Financing Issues affecting capital and/or operating and maintenance programs; and
b) Update key revenue assumptions. B. Draft Financial Model
a) Review of consultant team financial spreadsheet for 25-year projection of revenues and expenditures (operations, maintenance and capital improvement program).
b) Discuss and determine assumptions for annual operations and maintenance revenues and expenditures
i. Revenues ii. Operating expenditures
c) Discuss and determine assumptions for annual CIP needs based on existing CIP program, funding sources:
i. Cash CIP (consistent with budget and multi-year forecast) ii. Bond financed iii. Grant funded iv. Other funding sources
d) Discuss alternative long range scenarios, using the Team’s interactive financial spreadsheet.
The results of these interviews, along with the consultant team research, were used to develop this Financial Issues paper and the financial models shown in Appendix 1 in this issue paper.
Hawaii Statewide Transportation Plan Update Issue Paper on Financial Issues
-7-
Section 3.0 HDOT Airports Division The Airports Division operates and maintains a system of 15 airports throughout the state of Hawaii. Honolulu International Airport on the Island of Oahu is the principal airport in the airports system, providing facilities for interisland, domestic, overseas, and international flights. In 2009, the airports system managed 885,279 aircraft operations, 29.7 million passengers (of which approximately 60%, went through Honolulu International Airport), and revenue landed weights of 21.0 million thousand-pound-units. This reflected decreased activity compared to 2008 of -15%, -11.6%, and -10.3% respectively. Decreased aviation-related commerce is due primarily to the recent global economic recession, increased airline carrier load factors, and the decrease in visitors from Japan.1 For fiscal year 2010, the Airports Division ended the year with increases in total passengers, revenue passenger landings, and deplaning international passengers by 1.6%, 1.9%, and 9.8%, respectively, as compared to fiscal year 2009.2
Section 261-5(a), Hawaii Revised Statutes, requires the Department of Transportation to generate revenues sufficient to meet all of the expenditures of the statewide system of 15 airports.
There are three sources of revenue available to the airports division: 1) Airport Special Fund (consisting of user fees); 2) grants from the federal government through the Federal Aviation Administration; and 3) state revenue bonds. Of these, only the Airport Special fund can be used for operation and maintenance on an ongoing basis. All three can be used for capital improvements. Federal grants can sometimes be used for major non-recurring operations and maintenance expenditures. Section 3.1 Revenue Overview
Airport revenues in FY2009 (Figure 1) totaled $289 million, consisting of:
• Airline revenues ($119 million, or 41%, from landing fees, passenger terminal and non-terminal revenues, rental motor vehicle customer facility charge (CFC), passenger facility charge (PFC), and aviation fuel taxes);
• Duty-free concession and other concession fees ($114 million, or 39%); • Other aeronautical revenues and non-signatory airline revenues ($16 million, or 6%); • Miscellaneous operating and other revenues ($16 million, or 6%); • Interest income ($16 million, or 6%); and • Federal grants ($7 million, or 2%).
1 Department of Transportation Airports Division State of Hawaii. FY 2009 Financial Audit, Management’s Discussion and Analysis. Page 4. 2 Department of Transportation Airports Division State of Hawaii. DRAFT FY 2010 Financial Audit dated March 17, 2011, Management’s Discussion and Analysis. Page 4.

Hawaii Statewide Transportation Plan Update Issue Paper on Financial Issues
-8-
Figure 1: Hawaii Department of Transportation Airports Revenues3
Data Source: HDOT Airports Division, as of March 2010
Terminal, landing, and airfield charges were recently raised and are expected to increase total airline revenues (Figure 2) from $95.5 million in FY2008 to $113.0 million in FY2009, which is an 18% annual increase. By FY2010 revenues are expected to be about $129.0 million, which is a 14% annual increase. Other revenues are expected to decrease due to the effects of the economic recession. As the economy improves, concession and other revenues will increase since they are a function of passenger traffic, which is expected to increase in the years ahead.
3 The HNTB financial model developed for this project was not a detailed forecasting model but rather a high-level summary pro forma model for planning purposes that consolidated already existing multi-year forecasts provided by HDOT agencies, then projected to 2035 based on annual escalation rates of 3-4%, which were escalation rates approved by the respective HDOT Divisions. Only new capital programs already approved by the respective Division commissions and/or state legislature were included in this plan.

Hawaii Statewide Transportation Plan Update Issue Paper on Financial Issues
-9-
Figure 2: Hawaii Department of Transportation Airports Revenues
Data Source: HDOT Airports Division Multi-Year Financial Forecast, as of March 2010
Section 3.2 Fund Sources
Airport Special Fund. The primary source of revenue for the Airport Special Fund is from user-related fees, and no State General Fund monies are used to support the development and operation of the Airport System. Revenues are derived from concession fees, aviation fuel taxes, building space and land rentals, investment income, airport use charges, and landing fees, rental motor vehicle surcharge, and other sources.4 An increase in revenues also reflects the removal of rate mitigation granted to airlines during the most difficult periods. Figure 3 illustrates actual, estimated, and projected operating revenues along with operating and maintenance expenditures for the Airport System, from FY2010 to FY2035.5
4 In the Airports System Strategic Plan (Leigh Fisher Associates. Prepared for HDOT. 2002.), it is stated that the cost per enplaned passenger in the airport system is below the national average. What the airlines consider “affordable” is not consistent with that they are paying at other airports. While the airline rates and charges may be the “predominant source” of airport revenues, revenues from other sources are greater than the airlines contribution. 5 Figure 3 compares total revenues and expenditures based on HDOT Airports Multi-Year Forecast to 2035. The revenues are slightly more than the expenditures. In order to issue bonds, the Division must meet bond coverage ratios requirements, although this planning level analysis does not call out these ratios.
2008A 2009A 2010E 2011E 2012E 2013E 2014E 2015E
Federal Grants $25 $7 $4 $2 $2 $2 $2 $2
Interest $32 $16 $8 $12 $11 $11 $11 $11 Misc Operating $17 $16 $17 $17 $18 $18 $18 $19
Other Aero/Airline $12 $16 $16 $16 $16 $17 $18 $18 Concessions $122 $114 $114 $114 $114 $111 $112 $113
Airline Revenues $93 $119 $123 $142 $181 $225 $256 $267
$ -
$100
$200
$300
$400
$500
AIRPORTS REVENUESIn
$ M
illio
ns

Hawaii Statewide Transportation Plan Update Issue Paper on Financial Issues
-10-
Figure 3 Hawaii DOT Airports 25-Year Forecast
Source: HNTB Financial Model Based on Data from HDOT Airports Division Concession Fees. Concession fees are the rentals or fees imposed by the HDOT on concessions operated by private interests at the airports. The rental or fee paid to the Airports Division usually consists of a minimum monthly guarantee or a percentage of the gross receipts, whichever is greater. Duty free and other concession revenues are a major source of revenue for the Airport System, comprising approximately 40 % of the total estimated revenues in FY2009. Most concession revenues are generated at Honolulu International Airport. Aviation Fuel Tax. The aviation fuel tax is imposed by the Legislature of Hawaii under Section 243-4(a) (2), Hawaii Revised Statutes, on all types of aviation fuel. The tax is two cents per gallon. The estimated fuel tax revenue for FY2009 is $4.5 million. Other Aeronautical Revenues. Other aeronautical revenues consist of rentals, primarily to airlines, for the exclusive use of space in the terminal buildings and for areas at an airport. Other aeronautical revenues are expected to increase from $6.2 million in FY2008 to $9.5 million and $9.6 million in FY2009 and FY2010, respectively.
$-
$200
$400
$600
$800
$1,000
2010E 2015E 2020E 2025E 2030E 2035E
AIRPORTS 25-YEAR FORECAST - In $ MILLIONS
Revenues Expenditures

Hawaii Statewide Transportation Plan Update Issue Paper on Financial Issues
-11-
Investment Income. Investment income totaled $31.7 million in FY2008 and is expected to decrease to $18.5 million and $11.7 million in FY2009 and FY2010, respectively, primarily due to principal drawdown and lower interest rates. Interest earnings are derived from the investment of bond proceeds and of moneys credited to various accounts in the Airport Revenue Fund. Rental Motor Vehicle Customer Facility Charge (CFC). In 2010, the rental motor vehicle customer facility charge increased by one dollar from $3.50 to $4.50. CFC are collected by rental car agencies operating at state airports. The increase is intended to fund construction of consolidated rental car facilities at the State Airports as outlined in the Airports Modernization Program. The CFC was eliminated in the 2011 Legislative Session, and the Rental Motor Vehicle Surcharge replaced it at $7.50, with general obligation bonds to be floated to build a consolidated rental car facility at the Honolulu International Airport. Airport Use Charges and Landing Fees.6The Airport Use Charge is imposed on aircraft revenue landings at all State airports by airlines that have entered into an Airport-Airline Lease Agreement with the HDOT. The lease agreements provide the lessees with the nonexclusive right to use the State's airport system facilities, equipment, improvements and services, in addition to occupying certain premises and facilities. Other users pay a landing fee set according to the Airport Use Charge rate and based upon the aircraft's weight. Passenger facility charges (PFCs). PFC are also collected and used for eligible airport projects. PFCs were recently increased from $3.00 to $4.50, but have been offset by lower passenger (PAX) counts. PFCs are used for capital improvements that benefit the entire airport, not just a specific airline or airport user. Federal Grants-in-Aid The Federal Aviation Administration (FAA) provides grant funding for commercial and general aviation airports in Hawaii, through the FAA Airport Improvement Program (AIP). Federal grants are only available for approved capital project and not for Operations & Maintenance (O&M). The AIP is funded by the Federal Airports & Airways Trust Fund, which receives its revenue from aviation excise taxes on airline tickets, cargo, and general aviation fuel. For purposes of forecasting expected revenue under the federal aviation programs, it is assumed that the level of funding will be similar to current levels for the 25-year projection period of the HSTP. The Airport Improvement Program (AIP) provides grants to public agencies — and, in some cases, to private owners and entities -- for the planning and development of public-use airports that are included in the National Plan of Integrated Airport Systems (NPIAS). For large and 6In the Airports System Strategic Plan, it is stated that the cost per enplaned passenger in the airport system is below the national average. While the airline rates and charges may be the “predominant source” of airport revenues, revenues from other sources are greater than the airlines contribution.
Hawaii Statewide Transportation Plan Update Issue Paper on Financial Issues
-12-
medium primary hub airports, the grant covers 75% of eligible costs (or 80% for noise program implementation). For small primary, reliever, and general aviation airports, the grant covers 95% of eligible costs. AIP grants for planning, development, or noise compatibility projects are at or associated with individual public-use airports (including heliports and seaplane bases). Eligible projects include those improvements related to enhancing airport safety, capacity, security, and environmental concerns. In general, sponsors can use AIP funds on most airfield capital improvements or repairs except those for terminals, hangars, and non-aviation development. Any professional services that are necessary for eligible projects — such as planning, surveying, and design — are eligible as is runway, taxiway, and apron pavement maintenance. Aviation demand at the airport must justify the projects, which must also meet Federal environmental and procurement requirements. Projects related to airport operations and revenue-generating improvements are typically not eligible for funding. Operational costs — such as salaries, maintenance services, equipment, and supplies — are also not eligible for AIP grants. In Federal fiscal year 2009, HDOT Airports Division received the following AIP apportionments, grants and American Recovery and Reinvestment Act (ARRA) awards from the FAA:
• $35.6 million in AIP Entitlements for capital improvements at 7 airports (runway lighting, apron rehabilitation, taxiway construction, noise mitigation, rescue and firefighting capability enhancements, and security enhancements) in the airports system;
• $15.0 million in ARRA funds for apron rehabilitation at Maui’s Kahului Airport; and
• $1.0 million in AIP statewide apportionments. Capital grant revenues have recently been shifted from operations to capital improvements. Operating grants have been used for special maintenance projects. Federal grants reimbursements in FY2008 were $24.9 million. In general, projects which include land acquisition, site work, airfield paving and grading, lighting and electrical work, terminal building holding rooms, utilities, roads, removal of obstructions to air navigation, fencing, and aircraft rescue, firefighting equipment and security are eligible for federal aid. Airport System Revenue Bonds The issuance of airport revenue bonds is authorized by the Legislature for the payment or reimbursement of the cost of acquiring, purchasing, or constructing properties to constitute part of the Airport System or reconstructing, improving, bettering, or extending the Airport System. A large portion of the state’s financing of capital improvement projects is from airport revenue bonds.

Hawaii Statewide Transportation Plan Update Issue Paper on Financial Issues
-13-
These revenue bonds are payable solely from and collateralized solely by the revenues generated by the Airports Division including all aviation fuel taxes levied. Covenants contained in the Certificate of the Director of Transportation, dated May 1, 1969, as supplemented and amended, require that the Airport Division impose, prescribe, and collect revenues that will yield net revenues and taxes at least equal to 1.35 times the total interest, principal, and sinking fund requirements for the ensuing 12 months. The Airports Division is also required to maintain adequate insurance on its properties.
For the purposes of calculating the required amounts to be credited to the interest, serial bond principal, sinking fund, debt service reserve, and major maintenance, renewal and replacement accounts (collectively referred to as revenue bond debt service reserve accounts), the Certificate stipulates that all investments be valued at the lower of their face amount or fair value. At June 30, 2000, amounts credited to the revenue bond debt service reserve accounts were in accordance with applicable provisions of the Certificate.
Section 3.3 Expenditures
Operating expenditures reflect the legislatively-appropriated budget for FY2010-11, and then are projected thereafter. Expenditures include personnel services, debt, maintenance, and other expenses, in addition to a 5% surcharge for central services as well as departmental cost sharing. In addition to existing debt service, the multi-year forecast includes new debt service beginning in FY2012 and FY2013 in connection with issuance of new airport revenue bonds. Total expenditures from FY2008 through FY2015 are shown in Figure 4.

Hawaii Statewide Transportation Plan Update Issue Paper on Financial Issues
-14-
Figure 4 Hawaii DOT Airports Operating Expenditures
2008A 2009A 2010E 2011E 2012E 2013E 2014E 2015E
Other $94 $85 $98 $99 $106 $112 $119 $125
Debt Service $47 $40 $30 $47 $66 $94 $114 $119
Special Maint $33 $22 $18 $18 $18 $18 $18 $18
Personnel $124 $132 $136 $136 $142 $150 $157 $165
$-
$100
$200
$300
$400
$500
In $
Mill
ions
AIRPORT OPERATING EXPENDITURES
Data Source: HDOT Airports Division Multi-Year Financial Forecast, as of March 2010 Section 3.4 Capital Improvements
Capital improvements for airports have historically been financed in three ways: Federal grants-in-aid, long term bond financing, and revenue fund cash outlays. CIP funding is planned with the participation of airlines through the Airlines. Like all budgets, the final CIP budget is approved by the State Legislature and implemented by the Governor. Airport Modernization Program (AMP): The $2.4 billion Airport Modernization Program (AMP) originally announced in 2006 is now in progress, with the first phase totaling $1.3 billion now underway. Estimated capital expenditures over the next 25-years are shown in Figure 5, including the current $1.3 billion commitment, plus projected future special capital spending from operations.

Hawaii Statewide Transportation Plan Update Issue Paper on Financial Issues
-15-
Figure 5 Hawaii DOT Airports 25-Year Forecast CIP Expenditures
$0
$20
$40
$60
$80
$100
$120
$140
$160
2010
2011
2012
2013
2014
2015
2016
2017
2018
2019
2020
2021
2022
2023
2024
2025
2026
2027
2028
2029
2030
2031
2032
2033
2034
2035
$ M
illio
ns
AIRPORTS 25-YEAR CIP AND MODERNIZATION PROGRAM (AMP)
CIP Cash AMP - Phase I AMP - Future
Source: HNTB Financial Model Based on Data from HDOT Airports Division Of the initial $1.3 billion funding commitment for capital improvements, $944 million remained to be spent as of October 2009. Figure 6 illustrates the fund sources and remaining funds, at of the beginning of FY2010, to be spent on the first phase of Airport Modernization Program.7
7 Only lump sum total spending estimates were provided by the Divisions along with general timeframes the money was to be spent. Therefore, lacking annualized and time-phased spending information, assumptions were used to extend the CIP amounts out to the estimated completion dates (years) provided by the Divisions. For the Hawaii State Transportation Plan (HSTP), which is intended to reflect trends and overall funding capacities, this level of detail is satisfactory. However, for the Divisions actual capital planning expenditures, detailed plans must be developed. Those detailed plans were not provided and that level of detail is not required for the HSTP.

Hawaii Statewide Transportation Plan Update Issue Paper on Financial Issues
-16-
Figure 6 Hawaii DOT Airports CIP Remaining Fund Sources
Data Source: HDOT Airports Division
Airport Modernization Program Projects The first phase of the modernization program is focused on the expansion of Honolulu International Airport’s passenger capacity and replace, upgrade and rehabilitate infrastructure throughout the facility. Other capital improvements are also planned or underway at other airports in the system as show below:
• Kahului Airport – Maui: The second busiest airport in the state requires additional gate and holding room space to adequately serve the higher frequency of flights through each gate and the increasing number and frequency of overseas flights, which utilize high capacity aircraft.
• Kona International Airport at Keahole – Hawaii: The airport requires major
improvements to accommodate the current and future mix of domestic, overseas, international, inter-island, commuter and general aviation activities.
• Hilo International Airport – Hawaii: The airport requires maintenance and
improvement projects to provide energy efficient equipment and increased passenger comfort. The modernization effort also includes the installation of equipment to
Bond Proceeds,
$565
Federal (AIP),$177
Federal (TSA), $25
PFCs, $122
Cash, $56
AIRPORTS MODERNIZATION PROGRAM PHASE 1 REMAINING CIP FUND SOURCES-$944 MILLION (as of Oct. 2009)

Hawaii Statewide Transportation Plan Update Issue Paper on Financial Issues
-17-
monitor aircraft noise at six sites close to the airport to help determine needed mitigation measures, as well as establishment of the Keaukaha Subdivision Noise Attenuation Pilot Project to demonstrate the effectiveness of sound attenuation treatment to homes adjacent to the airport.
• Lihue Airport – Kauai: Facilities throughout the airport need to be replaced or
upgraded; and the Terminal Building needs to be expanded to accommodate higher capacity demands.
• Small Airports: Other airports including Molokai, Lanai, Waimea-Kohala, and Upolu also require modernization and improvements to facilities and equipment.
Recent and Budgeted FY2010 Expenditures Figure 7 shows recent and currently budgeted (FY2010) operating and capital expenditures, by airport. This information also provides an historical context for comparing past and future levels of capital spending.

Hawaii Statewide Transportation Plan Update Issue Paper on Financial Issues
-18-
Figure 7 Hawaii DOT Airports Summary of Operating and Capital Outlays
Source: State of Hawaii DOT FY2010 Budget
Hawaii Statewide Transportation Plan Update Issue Paper on Financial Issues
-19-
Section 3.5 Challenges
Over the next 25 years, the airport system will need to generate sufficient revenues and operating income to service existing airport revenue bond debt service, provide for new debt to fund the unfunded portion of the current airport modernization program, and to sustain enough growth to fund subsequent capital improvement programs in the years beyond. However, as Airports Division staff recognize, revenue generation must be conducted in a manner that retains affordable airline rates and charges. Airline rates and charges constitute the predominant source of operating revenues for the airport system. With the current residual rate methodology those fees adjust to the level of expenditures after crediting non-airline revenues. So under the current methodology, airport operating costs and capital projects will be “funded” provided that any required approvals by the airlines for capital expenditures have been complied with. As part of the global economy, the airline industry faces severe financial pressures and must continue to evolve their business model. Recent indicators in 2010 suggest some recovery, and airlines capacity to the islands shows signs of increasing. Hawaii’s airport managers must balance the need to provide facilities to facilitate customer service and future capacity with the affordability of the charges to the airlines serving the airport. The Airports Division regularly reevaluates its capital program and re-scopes, defers, or eliminates projects in order to find a balance.

Hawaii Statewide Transportation Plan Update Issue Paper on Financial Issues
-20-

Hawaii Statewide Transportation Plan Update Issue Paper on Financial Issues
-21-
Section 4.0 HDOT Harbors Division The statewide harbors system consists of ten (10) commercial harbors located at Honolulu, Kalaeloa-Barbers Point, Hilo, Kawaihae, Kahului, Hana, Kaunakakai, Kaumalapau, Nawiliwili, and Port Allen. The major activities of the harbors program are to maintain, repair, and operate the ten commercial harbors which comprise the statewide harbors system; plan, design, and construct harbor facilities; provide program planning and administrative support; manage vessel traffic into, within, and out of harbor facilities; provide for and manage the efficient use of the harbor facilities and lands; and maintain offices and facilities for the conduct of maritime business with the public. As a self sufficient enterprise, revenues for the operation, maintenance, and capital improvements program of the Water Transportation Facilities and Services Program are derived from wharfage, rentals, dockage, port entry fees, mooring charges, demurrage, cleaning, and other harbor fees and charges. Wharfage and rentals are the largest sources of revenues. Financing for the water-related transportation facilities comes from two primary sources. The first source is the Harbors Special Fund which is used to finance the operations and maintenance as well as the capital improvement program for the harbor system. The second source is the use of revenue bonds to fund its capital improvement program. According to the US Maritime Administration (MARAD), total container cargo handled in Honolulu Harbor in 2008 was 58,907 TEUs (twenty-foot equivalent units) compared to 58,622 TEUs in 2007. MARAD also reported a drop in TEUs for Honolulu Harbor in 2009 at 47,313 TEUs. During FY2009, approximately 1.1 million cruise passengers passed through the harbors system statewide, compared to 2.0 million cruise passengers in FY2008, 2.4 million passengers in FY2007, and 1.9 million passengers in FY2006. Section 4.1 Revenue Overview
As seen in Figures 8 and 9, Harbors operating revenue in FY2009 totaled $77 million, down from $92 million in FY 2008, and consists of:
• Cargo-related wharfage revenues (or tariffs) ($40 million, or 52%); • Facilities rentals ($22 million, or 29%); • Interest earnings ($5 million, or 6%); • Ship-related fees ($7 million, or 9%); and • Other miscellaneous revenues ($3 million, or 4%).
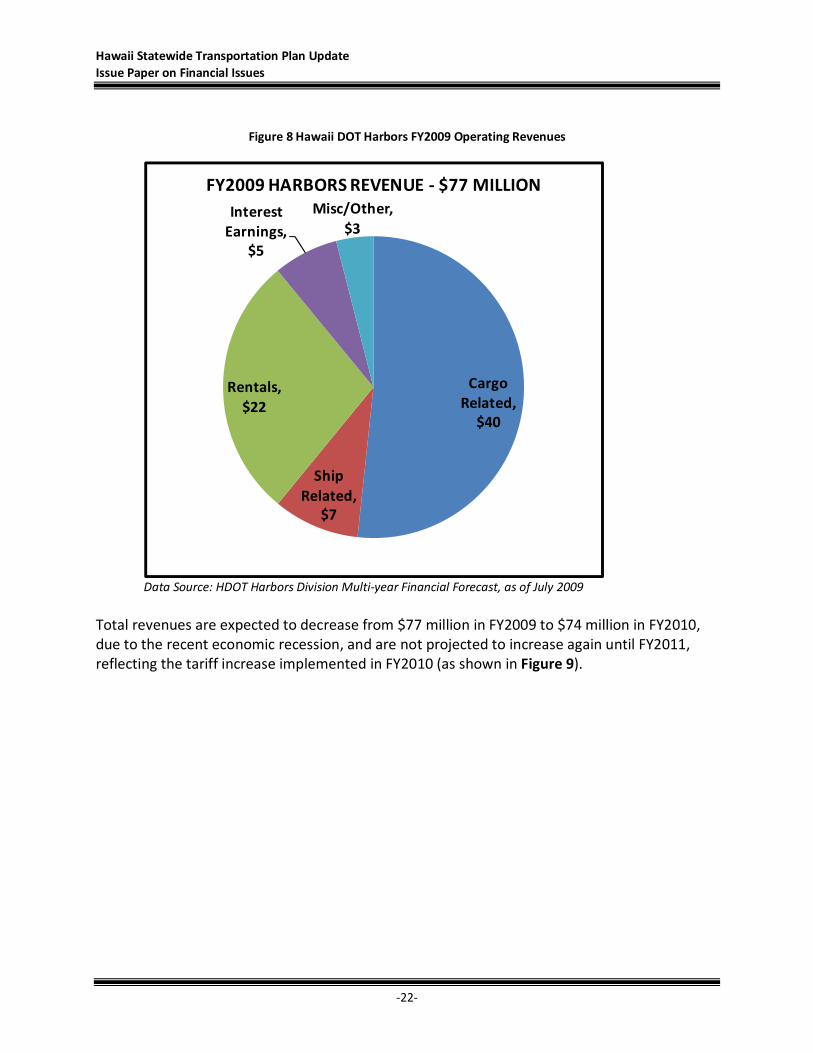
Hawaii Statewide Transportation Plan Update Issue Paper on Financial Issues
-22-
Figure 8 Hawaii DOT Harbors FY2009 Operating Revenues
Cargo Related,
$40
Ship Related,
$7
Rentals, $22
Interest Earnings,
$5
Misc/Other, $3
FY2009 HARBORS REVENUE - $77 MILLION
Data Source: HDOT Harbors Division Multi-year Financial Forecast, as of July 2009 Total revenues are expected to decrease from $77 million in FY2009 to $74 million in FY2010, due to the recent economic recession, and are not projected to increase again until FY2011, reflecting the tariff increase implemented in FY2010 (as shown in Figure 9).

Hawaii Statewide Transportation Plan Update Issue Paper on Financial Issues
-23-
Figure 9 Hawaii DOT Harbors Operating Revenues
2008A 2009A 2010E 2011E 2012E 2013E 2014E 2015E
Miscellaneous $1 $1 $1 $1 $1 $1 $1 $2
Interest Earnings $13 $5 $5 $5 $4 $3 $3 $3
Other Revenues $2 $2 $2 $2 $2 $2 $2 $2
Rentals $21 $22 $22 $22 $22 $23 $23 $24
Ship Related $8 $7 $7 $7 $7 $7 $8 $8
Cargo Related $45 $40 $37 $47 $57 $65 $72 $78
$-
$25
$50
$75
$100
$125
In $
Mill
ions
HARBORS OPERATING REVENUES
Data Source: HDOT Harbors Division Multi-year Financial Forecast, as of July 2009
Section 4.2 Fund Sources
Harbors Special Fund Both the capital improvement program and the operating and maintenance expenditures for the Hawaii Commercial Harbor System are financed through the Harbors Special Fund. Authorized CIP projects are financed either directly from the Special Fund in cash or via Harbor Revenue Bonds where the Special Fund pays the annual debt service. Revenues to the Harbors Special Fund are generated by the collection of fees from wharfage, dockage, port entry, rentals, and other charges on a statewide basis.

Hawaii Statewide Transportation Plan Update Issue Paper on Financial Issues
-24-
Figure 10 illustrates actual, estimated, and projected revenues, operations, and maintenance for the Harbors System from FY2010 to FY2035. Note that the gap between revenues and expenditures is primarily due to exclusion in the chart of Cash CIP funding from operations.
Figure 10 Hawaii DOT Harbors 25-Year Forecast Operating Revenues and Expenditures
$-
$25
$50
$75
$100
$125
$150
$175
$200
$225
2010E 2015E 2020E 2025E 2030E 2035E
In $
Mill
ion
s
HARBORS 25-YEAR FORECAST - $ MILLIONS
Operating Revenues O&M Exp (excl Cash-CIP)
Source: HNTB Financial Model Based on Data from HDOT Harbors Division as of July 2009 Cargo Related Fees (tariffs). Cargo related revenues include wharfage fees and other cargo handling assessments. Cargo related fees accounted for about 49% of the Harbors Special Fund revenues in FY2008 and will continue to decrease until FY2010, at which point new proposed tariffs are expected to take effect in mid-FY2010. Rental Fees. Rental fees include charges for private storage and processing facilities at the commercial harbors. Approximately 23% of the Harbors Special Fund revenue is realized through rental fees. Ship Related Fees. Ship related fees include port entry and dockage charges assessed to calling vessels. These fees are expected to account for an estimated 9% of the projected Fund revenues.

Hawaii Statewide Transportation Plan Update Issue Paper on Financial Issues
-25-
Harbors Revenue Bonds. Pursuant to the authorization from the State Legislature, the Director issued the 1967 “Certificate of the Director of Transportation Providing for the Issuance of State of Hawaii Harbor Capital Improvement Revenue Bonds,” with subsequent Certificates in 1990 and 1997. These Certificates provide for the issuance of bonds at any time and from time to time upon compliance with certain conditions of the respective conditions of the respective Certificates. Collateral for harbor revenue bonds comes from charges and liens on the gross revenues of the program and upon all improvements and funds and securities created in whole or in part from the revenues or from the proceeds of the bonds. The Certificate requires that the Harbors Division impose, prescribe, and collect revenues that will yield net revenues and taxes at least equal to 1.35 times the total interest, principal, and sinking fund requirements for the ensuing 12 months. The Harbors Division is also required to maintain adequate insurance on its properties.
Section 4.3 Expenditures
Operating expenditures (Figure 11) reflect the legislatively-appropriated budget for FY2010-11, and then projected thereafter. Expenditures include personnel services, debt, maintenance, and other expenses, in addition to a 5% surcharge for central services as well departmental cost sharing. In addition to existing debt service, the multi-year forecast includes new debt service beginning in FY2010 in connection with issuance of $120 million in Harbor Modernization Program (HMP) bonds.
Figure 11 Hawaii DOT Harbors Operating and Maintenance Expenditures
2008A 2009A 2010E 2011E 2012E 2013E 2014E 2015E
Other $21 $26 $21 $20 $20 $21 $21 $22
Debt Service $27 $24 $29 $34 $36 $36 $33 $33
Special Maint $8 $11 $15 $15 $15 $15 $15 $15
Personnel $13 $15 $18 $18 $18 $18 $18 $18
$-
$25
$50
$75
$100
In $
Mill
ions
HARBORS OPERATING EXPENDITURES
Data Source: HDOT Harbors Division Multi-year Financial Forecast, as of July 2009

Hawaii Statewide Transportation Plan Update Issue Paper on Financial Issues
-26-
Section 4.4 Capital Improvements Program
The Harbors Division, in partnership with members of the Hawaii Harbor Users Group (HHUG), developed a system-wide Harbor Modernization Program (HMP) which will implement harbor infrastructure improvements to address projected increases in ocean transportation of cargo and passengers through the year 2030. HHUG members also supported tariff increases to generate additional revenues to pay debt service on harbor revenue bonds to finance HMP, which in turn would sustain harbor operations. Harbors covered in the plan include Honolulu and Kalaeloa-Barbers Point Harbors on Oahu, Kahului and Hana Harbors on Maui, Hilo and Kawaihae Harbors on the Big Island, and Nawiliwili Harbor on Kauai. Projected capital expenditures for the HMP were initially estimated to be $842 million. Deferral of some projects occurred due to the recent economic recession and reduction in service by NCL Cruise Lines, and the projected capital expenditures have since been revised downward to $618 million (Figure 12). HMP Phase I totals $150 million and is currently underway. General Funds will not be used for the program. All improvements will be paid for by the Harbors Special Fund. The financial plan will consider additional sources of funding to possibly include harbors revenue bonds, revenue from harbor activities, rentals, leases, and federal sources. The financial plan also includes a combination of scheduled increases in harbor user fees (tariffs) and land leases with minimum annual guarantees.
Figure 12 Hawaii DOT Harbors 25-Year Forecast CIP Expenditures
$-
$10
$20
$30
$40
$50
$60
2010
2011
2012
2013
2014
2015
2016
2017
2018
2019
2020
2021
2022
2023
2024
2025
2026
2027
2028
2029
2030
2031
2032
2033
2034
2035
$ M
illio
ns
HARBORS 25-YEAR CIP AND MODERNIZATION PROGRAM (HMP)
Cash CIP HMP-Phase I HMP-Future
Source: HNTB Financial Model Based on Data from HDOT Harbors Division as of July 2009

Hawaii Statewide Transportation Plan Update Issue Paper on Financial Issues
-27-
The following improvements are planned at various harbors throughout the state: Maui: The Island has two commercial harbors, Kahului and Hana. Kahului Harbor is the third-busiest harbor in the state and the busiest neighbor island commercial harbor. Maui’s population has grown 32% in the last 15 years, and the increased demand for goods exceeds the existing three pier facility in Kahului Harbor. The plan includes the following projects:
• Upgrade Pier 1 fuel line. • Acquire additional property to expand the east end of Kahului Harbor. • Strengthen Pier 2B. • Construct other necessary paving and fencing improvements.
The plan also included Hana Pier Improvements to reconstruct Hana Pier for commercial operations to serve Hana and adjacent remote communities.
The following projects were originally included in the Modernization Program, but were delayed due to the downsizing of cruise ships docking at that harbor:
• A new west harbor breakwater. • A new west harbor ferry/barge slip with terminal building including paving, utilities and
fencing. • A new west harbor cruise terminal. • A new east harbor breakwater.
Oahu: Honolulu Harbor is the hub of the state commercial harbor system. The plan includes the development of the former Kapalama Military Reservation (KMR) near Sand Island. The plan also includes improvements at the Kalaeloa-Barbers Point Harbor. The Harbor Modernization Plan consists of the following projects:
• Construct a Kapalama container deep draft wharf with berthing capacity to accommodate two container ships.
• Develop a new 70-acre container yard at Kapalama with necessary gates, buildings, and off-site improvements with direct connection to the Young Brothers inter-island barge operating yard.
• Construct Kalaeloa West Harbor utilities infrastructure. • Construct a new dedicated fuel pier at Kalaeloa.
Hawaii: The Big Island of Hawaii has two commercial harbors, Hilo and Kawaihae. Hilo handles cargo and passengers, whereas Kawaihae handles cargo only. Both harbors are served by Matson and Young Brothers, as well as bulk barges. The Big Island has experienced a population growth of 31.5 % in the last 15 years. The plan includes the following projects:
• Dredge and construct a new pier and inter-island cargo handling yard through a new Pier 4 barge terminal in Hilo.
Hawaii Statewide Transportation Plan Update Issue Paper on Financial Issues
-28-
• Acquire property to establish a third harbor access at Hilo via Kumao Street, which will allow for traffic separation between commercial and cruise ship activity.
• Expand barge and terminal improvements at Pier 2 at Kawaihae Harbor. • Construct a southern extension of Pier 2 to provide additional overseas operational area
at Kawaihae Harbor. • Construct a new multi-use Pier 4 at Kawaihae Harbor. • Construct site improvements to allow the development of liquid bulk storage facilities at
Kawaihae Harbor. Kauai: The Island’s main commercial harbor is located at Nawiliwili. Kauai’s population has grown 17.1 % over the last 15 years, and increased demand in cargo and passenger space at Nawiliwili’s three piers has grown dramatically. The plan includes constructing a new multi-use berth along the existing jetty to facilitate the establishment of additional liquid bulk infrastructure. Recent and Budgeted FY2010 Expenditures Figure 13 shows recent and currently budgeted (FY2010) operating and capital expenditures, by harbor. This information also provides an historical context for comparing past and future levels of capital spending.

Hawaii Statewide Transportation Plan Update Issue Paper on Financial Issues
-29-
Figure 13 Hawaii DOT Summary of Operating and Capital Outlays
Source: State of Hawaii DOT FY2010 Budget

Hawaii Statewide Transportation Plan Update Issue Paper on Financial Issues
-30-
Section 4.5 Challenges
The Harbors Division has already faced its most immediate financial challenge, which was to increase tariffs to correct a growing structural imbalance between operating revenues and expenditures, exacerbated by the recent economic recession. The administrative rules for the new tariffs were approved by the Governor in February 2010 with implementation on March 1, 2010. The initial program level of $842 million was later reduced to $618 million when NCL Cruise line abruptly cut back its service from three to one line, thus reducing the urgency for making new separate passenger improvements and reducing conflicts with cargo operations. The division has considered the possibility of revising the tariff structure so that future rates will be indexed to annual inflation.

Hawaii Statewide Transportation Plan Update Issue Paper on Financial Issues
-31-
Section 5.0 HDOT Highways Division The mission of the Highways Division is to provide a safe, efficient, and accessible highway system through the utilization of available resources in the maintenance, enhancement, and support of land transportation facilities. The administration of an acceptable highway program requires a sound financial base to permit long-term planning for construction, reconstruction, and maintenance to meet transportation needs with social, economic, and environmental concerns, and to match federal apportionments. Expenditures for surface transportation in Hawaii include both capital and operating expenditures. Funding sources for the program include federal grants, state funds appropriated by the Legislature, fuel taxes, vehicle taxes and fees, interest income, and miscellaneous sources. Section 5.1 Revenue Overview
Highways operating revenue in FY2009 (see Figure 14) totaled $196 million, consisting of:
• Fuel tax revenues ($86 million, or 44%); • Car rental and tour vehicle surcharge ($40 million, or 20%); • Vehicle weight tax ($33 million, or 17%); • Vehicle registration fee ($21 million, or 11%); • Interest earnings ($12 million, or 6%); and • Other miscellaneous revenues ($4 million, or 2%).

Hawaii Statewide Transportation Plan Update Issue Paper on Financial Issues
-32-
Figure 14 Hawaii DOT Highways FY2009 Operating Revenues
Fuel Tax, $86
Vehicle Weight Tax,
$33
Vehicle Registration
Fee, $21
Investment Earnings,
$12
Vehicle Surcharges,
$40
Misc, $4
FY2009 HIGHWAYS REVENUE - $196 MILLION
Data Source: HDOT Highways Division, as of March 2010
Total revenues are expected to remain flat due to the recent economic recession and its impact on state tax and fee revenues, and are not projected to increase appreciably at least through FY2015 (see Figure 15), unless certain rates and fees are increased in connection with the proposed Highways Modernization Program.

Hawaii Statewide Transportation Plan Update Issue Paper on Financial Issues
-33-
Figure 15 Hawaii DOT Highways Operating Revenues
2008A 2009A 2010E 2011E 2012E 2013E 2014E 2015E
Miscellaneous $6 $4 $4 $4 $4 $4 $5 $5
Vehicle Surcharges $49 $40 $40 $40 $31 $30 $30 $31
Investment Earnings $15 $12 $12 $12 $12 $12 $12 $12
Vehicle Registration Fee $21 $21 $21 $21 $22 $22 $22 $22
Vehicle Weight Tax $34 $33 $34 $34 $35 $35 $36 $36
Fuel Tax $88 $86 $87 $87 $88 $89 $89 $90
$-
$50
$100
$150
$200
$250
In $
Mill
ions
HIGHWAYS OPERATING REVENUES
Data Source: HDOT Highways Division Multi-Year Financial Forecast, as of March 2010
Section 5.2 Fund Sources
Federal Revenue Sources – Highways The Federal Highway Trust Fund (HTF) is supported by user-fees on motor fuel, tires, and heavy trucks. Hawaii has historically received more aid from the HTF than it has made in payments, classifying it as a “donee” state. Apportionments for all Federal Highway Administration (FHWA) transportation funding programs have averaged $168.9 million annually for the 5-year period, Federal fiscal years 2005-2009. The 5-year aggregate apportionment for Hawaii is $844.7 million (see Figure 16).

Hawaii Statewide Transportation Plan Update Issue Paper on Financial Issues
-34-
Figure 16 Federal Highways Administration Funding Summary - State of Hawaii
Hawaii State Revenue Sources – Highways State funding for highways accounts for more than 60% of all public support for highways. State sources of funding for highways are derived from the state Highway Special Fund (HSF). The primary sources of revenue for the HSF are indirect user fees in the form of fuel taxes, weight taxes and vehicle registration fees. The fund is required by law to generate revenues necessary to carry out the operations, maintenance, and the capital improvement programs for the Department of Transportation highway programs. State Liquid Fuel Tax. The fuel tax has traditionally been the single largest source of revenue for the Highways Special Fund. For FY2009, the fuel tax of $0.17 per gallon accounted for approximately 41% of the total fund income. State Motor Vehicle Weight Tax. The $20.00 per vehicle registration fee contributed approximately 16% of the projected Special Fund Revenue for FY2009.
State of Hawaii Federal Fiscal Year
USDOT FHWA Program 2005 2006 2007 2008 2009
Interstate Maintenance 8,486,780$ 8,623,472$ 8,762,366$ 8,903,496 $ 9,046,898$ National Highway System 43,963,334 44,671,377 45,390,197 46,121,226 46,864,027 Surface Transportation Program 33,742,677 30,857,302 31,354,195 31,859,088 32,372,111 Bridge Replacement & Rehab 20,868,996 21,205,138 21,546,692 21,893,747 22,246,389 Congestion Mitigation & Air Quality 8,232,073 8,364,628 8,499,317 8,636,175 8,775,237 Recreational Trails 653,669 764,160 819,406 874,652 929,898 Metropolitan Planning 1,469,376 1,448,969 1,472,634 1,496,045 1,519,833 Safety - 5,079,050 5,178,547 5,279,645 5,382,372 Rail Highway Crossings - 1,100,000 1,100,000 1,100,000 1,100,000 Safe Routes to School 1,000,000 1,000,000 1,000,000 1,000,000 1,000,000 High Priority Projects 25,120,000 25,120,000 25,120,000 25,120,000 25,120,000 Equity Bonus 22,554,037 19,276,425 18,686,749 18,065,609 17,412,499 * Total 166,090,941$ 167,510,522$ 168,930,103$ 170,349,683$ 171,769,264$
Annual % Change n/a 0.9% 0.8% 0.8% 0.8%
Rate of Return (see Note) 183% 186% 180% 176% 175%
Note: Rate of Return refers to state fund donor/receiver status as a net contributor/receiver of Federal highway funds. Source: Federal Highways Administration
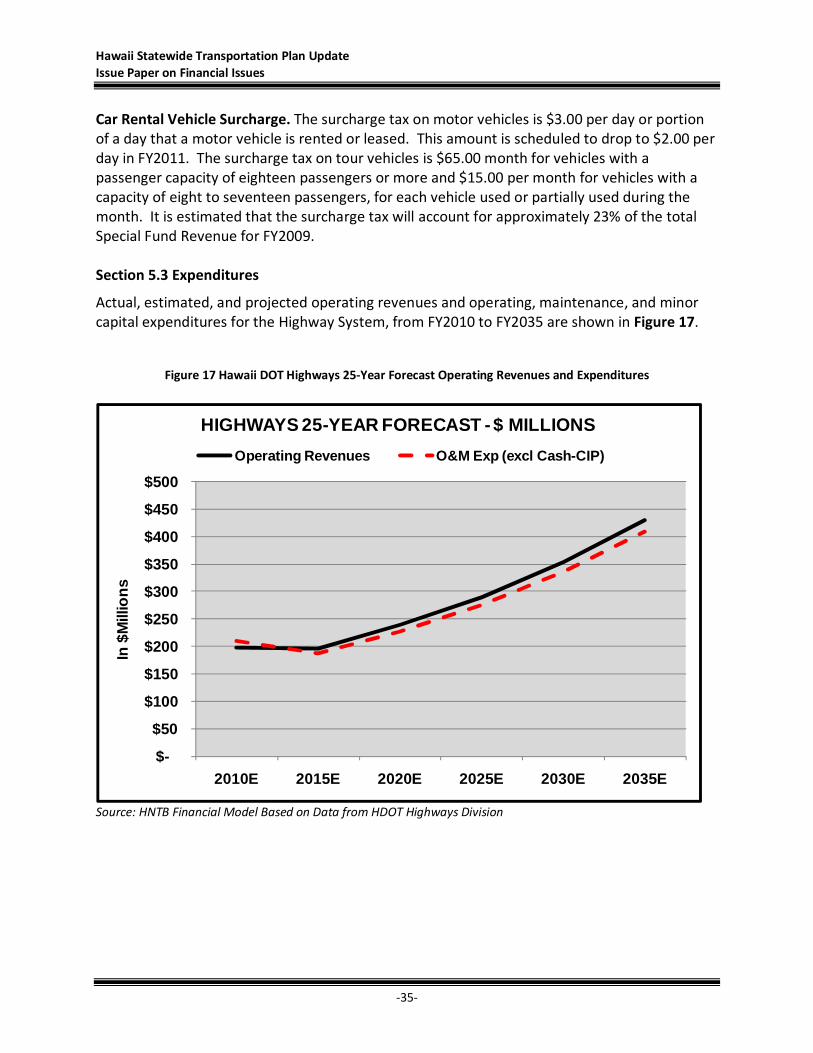
Hawaii Statewide Transportation Plan Update Issue Paper on Financial Issues
-35-
Car Rental Vehicle Surcharge. The surcharge tax on motor vehicles is $3.00 per day or portion of a day that a motor vehicle is rented or leased. This amount is scheduled to drop to $2.00 per day in FY2011. The surcharge tax on tour vehicles is $65.00 month for vehicles with a passenger capacity of eighteen passengers or more and $15.00 per month for vehicles with a capacity of eight to seventeen passengers, for each vehicle used or partially used during the month. It is estimated that the surcharge tax will account for approximately 23% of the total Special Fund Revenue for FY2009. Section 5.3 Expenditures
Actual, estimated, and projected operating revenues and operating, maintenance, and minor capital expenditures for the Highway System, from FY2010 to FY2035 are shown in Figure 17.
Figure 17 Hawaii DOT Highways 25-Year Forecast Operating Revenues and Expenditures
$-
$50
$100
$150
$200
$250
$300
$350
$400
$450
$500
2010E 2015E 2020E 2025E 2030E 2035E
In $
Mill
ion
s
HIGHWAYS 25-YEAR FORECAST - $ MILLIONS
Operating Revenues O&M Exp (excl Cash-CIP)
Source: HNTB Financial Model Based on Data from HDOT Highways Division

Hawaii Statewide Transportation Plan Update Issue Paper on Financial Issues
-36-
Operating expenditures reflect the legislatively-appropriated budget for FY2010-11, and then are projected thereafter. Expenditures include personnel services, debt, maintenance, and other expenses, in addition to a 5% surcharge for central services as well as departmental cost sharing. Total operating, maintenance, and capital expenditures funded from operations totaled $232 million in FY2009 as shown in Figure 18.
Figure 18 Hawaii DOT Highways Operations Expenditures
2008A 2009A 2010E 2011E 2012E 2013E 2014E 2015E
Other $101 $91 $104 $98 $97 $97 $97 $97
Debt Service $45 $45 $47 $52 $55 $57 $60 $64
Special Maint $64 $67 $71 $56 $28 $28 $28 $28
Personnel $38 $39 $27 $30 $30 $30 $30 $30
$-
$50
$100
$150
$200
$250
$300
In $
Mill
ions
HIGHWAYS OPERATIONS EXPENDITURES
Data Source: HDOT Highways Division Multi-Year Financial Forecast, as of March 2010 Section 5.4 Capital Improvements Program
The Highways capital improvement program assumes that current levels of Federal funding remain in place over the 25-year forecast period and that the previously proposed Highway Modernization Plan is not enacted. For purposes of this forecast exercise, Federal grants and capital improvements funded from operations were assumed to grow at an annual rate of 4%, as shown in Figure 19.

Hawaii Statewide Transportation Plan Update Issue Paper on Financial Issues
-37-
Figure 19 Hawaii DOT Highways 25-Year Forecast CIP Fund Sources
$0
$50
$100
$150
$200
$250
2010
2011
2012
2013
2014
2015
2016
2017
2018
2019
2020
2021
2022
2023
2024
2025
2026
2027
2028
2029
2030
2031
2032
2033
2034
2035
$ M
illio
ns
HIGHWAYS 25-YEAR CIP FUND SOURCES
Hwy Rev Bond CIP Cash CIP Federal
Data Source: HNTB Financial Model Based on Data from HDOT Highways Division Multi-Year Financial Forecast

Hawaii Statewide Transportation Plan Update Issue Paper on Financial Issues
-38-
Section 5.5 Challenges
The greatest challenges for the Highways Division are the decreasing availability of Federal program funds and reduced revenue from local sources such as revenue bonds and impact fees. Another challenge is that the federal reauthorization of SAFETEA-LU has been delayed. The current bill has been extended from its expiration on September 20, 2009 through continuing resolutions. This creates a status quo of funding and, in fact, a decrease due to federal mandates to reduce spending levels in all programs. Other challenges include:
• No additional state funding is currently available. In fact, the state has been borrowing from the Highways Special Fund due to increased financial pressures brought about by the recent economic recession. New fund sources will require new legislation and/or a robust economic recovery to generate higher user fees and other public revenues.
• Public/private partnership and other innovative financing are not currently under consideration as a possible financing strategy due to a lack of political support at this time.
• $126 million of Federal stimulus funds are split between counties and HDOT. They are used mostly for O&M preservation and new roads on the neighbor islands and therefore not available for new state highway infrastructure.
• Investment earnings are projected to drop significantly due to principle draw-downs and lower interest rates. In addition, approximately $6 million of interest currently goes to the General Fund.
• Car rental tour/vehicle surcharge are scheduled to decrease approximately 20% in 2012 due to the scheduled decrease in 2011 of the surcharge tax per car, from $3 to $2 per day.8 The Highways Modernization Plan calls for increasing the vehicle surcharge tax to $5 per day or portion of day to generate new revenues for related capital projects.
• Congestion pricing strategies represent a possible means of improving traffic flow and generating new revenues, though currently lacks the requisite political support to seriously consider.
8 Hawaii Revised Statues, §251-2

Hawaii Statewide Transportation Plan Update Issue Paper on Financial Issues
-39-
Section 6.0 County Transit Systems The following is a summary of the transit funding sources and then a summary of each county’s transit system. Section 6.1 Federal Funding Sources
The Federal Transit Administration (FTA) provides assistance funding through various discretionary and formula grant programs to Hawaii transit agencies. Area Formula funds may be transferred and used for highway projects. Funds transferred between agencies carry the rules of the receiving agency. These major programs are as follows:
1. The Urbanized Area Formula Grants program (49 USC Section 5307) provides transit capital and planning assistance to urbanized areas with populations of more than 50,000. Eligible purposes include planning, engineering, design, and evaluation of transit projects and other technical transportation-related studies; capital investments in bus and bus-related activities such as replacement of buses, overhaul of buses, rebuilding of buses, crime prevention and security equipment and construction of maintenance and passenger facilities; and capital investments in new and existing fixed guideway systems including rolling stock, overhaul and rebuilding of vehicles, track, signals, communications, and computer hardware and software. All preventive maintenance and some Americans with Disabilities Act complementary paratransit service costs are considered capital costs.
2. Transit Capital Investment Grants and Loans (49 USC Section 5309) provides transit capital assistance for new fixed guideway systems and extensions to existing fixed guideway systems (New Starts), fixed guideway modernization, and bus and bus-related facilities. Funding for New Starts and bus and bus-related facilities (Bus Capital) are discretionary programs while the Fixed Guideway Modernization Program (FGM) uses a formula apportionment;
3. Formula Grants for Special Needs of Elderly Individuals and Individuals with
Disabilities (49 USC Section 5310) provides funding, through the States, to private and non-profit organizations that provide specialized transportation services to elderly persons and to persons with disabilities; and
4. Formula Grants for Other Than Urbanized Areas (49 USC Section 5311) provides transit
capital and operating assistance, through the states, to non-urbanized areas with populations less than 50,000.
5. Jobs Access and Reverse Commute (JARC) (49 USC Section 5316) assists with the
development and maintenance of transportation services designed to transport welfare recipients and other low income individuals to and from jobs and other job related

Hawaii Statewide Transportation Plan Update Issue Paper on Financial Issues
-40-
activities, and to provide reverse-commute services between central cities and suburban employment locations.
6. New Freedom (49 USC Section 5317) provides new public transportation services and
public transportation alternatives beyond those required by the Americans with Disabilities Act (42 USC 12101, et seq.) that assist individuals with disabilities with transportation.
FTA program apportionments and allocations for Hawaii, totaling $53.9 million in FY2009, are shown below in Figure 20. FTA funds go to Honolulu as a direct grantee. FTA funds to non-urban areas, i.e. Neighbor Islands, are channeled through and programmed by the State.
Figure 20 - Federal Transit Administration FY2009 Funding Summary for State of Hawaii Projects
Source: Federal Transit Administration
State of Hawaii USDOT FTA Program Type FY2009
Notes
Section 5307 & 5340 Urbanized Area Apportionment
Formula $28,580,124 Areas 200,000-999,999 Population: Honolulu, HI
Section 5307 Urbanized Area Formula Program Formula $2,479,241 Areas less than 200,000 Population: Kailua-Kaneohe, HI, Honolulu County
Section 5309 Fixed Guideway Modernization Apportionment
Formula $2,123,719
Section 5309 Bus & Bus Facilities Allocations Earmark $1,900,000 Rural Bus Program for Hawaii, Maui and Kauai
Section 5309 Bus & Bus Facilities Allocations Earmark $1,300,000 Honolulu, HI Bus Facilities
Section 5309 New Starts Allocations Earmark $14,850,000 Alaska and Hawaii Ferry Projects
Section 5309 New Starts Allocations Earmark $19,800,000 Honolulu High Capacity Transit Corridor Project
Section 5311 &5340 Non-Urbanized Apportionments
Formula $1,960,676
Section 5311 (b)(3) Rural Transit Asst. Program (RTAP) Apportionments
Formula $84,132
Section 5310 Special Needs for Elderly Individuals with Disabilities
Formula $665,421
Section 5303 Metropolitan Transportation Planning Program
Formula $374,505
Section 5304 Statewide Transportation Planning Program
Formula $101,472
Section 5316 Job Access & Reverse Commute Apportionment
Formula $396,817 $69,227 $145,707
Honolulu, HI Governor Small Urbanized Areas Governor Non-urbanized Areas
Section 5317 New Freedom Apportionment Formula $248,184 $58,058 $80,557
Honolulu, HI Governor Small Urbanized Areas Governor Non-urbanized Areas
Total
$75,598,110

Hawaii Statewide Transportation Plan Update Issue Paper on Financial Issues
-41-
Funds from the Federal Highway Administration (FHWA) could also be used for mass transit purposes. The Federal Highway and Transit Laws authorize certain funds to be “flexible.” For example, FHWA Surface Transportation Program funds can be transferred from FHWA to FTA for use in transit projects, while FTA Urbanized Area Formula funds may also be available for highway projects. Section 6.2 Local Funding Sources
Local match funding for federal grant programs in public transit varies between 20% and 50%. Local County revenues for these purposes are typically derived from the General Fund, appropriations by each respective City/County Council, and transit operating revenues. Transit operating revenues are almost entirely from bus fare box receipts for those systems that charge fares. For the City and County of Honolulu, major operating revenues include fare box revenues and subsidies from the county’s General and Highway Funds. Capital revenue is usually from general obligation bonds, including the City and County of Honolulu local match.
Section 6.3 City and County of Honolulu – Transit
The City & County of Honolulu's Department of Transportation Services (DTS) consists of five divisions: Traffic Engineering, Transportation Planning, Traffic Signals & Technology, Public Transit, and Rapid Transit. The Public Transit division oversees Honolulu’s bus operations. The Rapid Transit division has responsibility for the new High-Capacity Transit Corridor Project.
Section 6.31 Division of Transportation Services (DTS) - Public Transit Division
The Public Transit Division (PTD) oversees the contractor, Oahu Transit Services, which operates the City and County’s public transit system (TheBus and The Handi-Van), and responds to recommendations, complaints, and questions regarding public transit. PTD also procures new buses and Handi-Vans, plans, designs, constructs, and maintains transit centers, and installs and maintains bus stops and shelters. Key Statistics for Oahu Transit Service:
• 531 buses and 139 Handi-Vans • 93 bus routes • Travels more than 22 million miles per year • 7 million gallons of diesel fuel consumed per year • 4,000 bus stops • TheBus provides for about 22,000 passenger boardings per day, or 69 million per year,
and collects approximately $42 million in annual revenue. • Oahu Transit Services employs 1,753 people.

Hawaii Statewide Transportation Plan Update Issue Paper on Financial Issues
-42-
Section 6.311 Revenue Overview
PTD revenues and sources estimated for FY2010 total $213.6 million, of which $48.7 million represent operating revenues from passenger fares. The balance of funding comes from the City and County of Honolulu Bus Transportation Fund (which receives revenues from the Highway Fund and General Fund) and FTA Section 5307 grants. Operating revenue projections through FY2015 (Figure 21) are based on assumptions of 3.0% annual growth rate. Fare box revenues were recently increased effective in FY2010 with a one-way adult fare at $2.25 and another increase in FY2011 with a one-way adult fare of $2.50. Also, Adult monthly bus passes increased effective in FY2010 to $50.00 per month, with another increase in FY2011 to $60.00 per month.1
Figure 21 Department of Transportation Services Bus Transit Operating Revenues
2008A 2009A 2010E 2011E 2012E 2013E 2014E 2015E
Bus Trans Fund $116 $123 $129 $130 $134 $138 $143 $147
Grants (for Ops) $21 $21 $22 $22 $22 $23 $24 $24
Operating Fares $42 $44 $49 $55 $56 $58 $59 $61
$-
$50
$100
$150
$200
$250
In $
Mill
ions
DTS BUS TRANSIT OPERATING REVENUES
Data Source: City and County of Honolulu, Department of Transportation Services
1 City and County of Honolulu Bill 22 (2009), CD-1, now known as Ordinance 09-17.

Hawaii Statewide Transportation Plan Update Issue Paper on Financial Issues
-43-
Section 6.312 Operations and Maintenance Expenditures
Total operating and maintenance expenditures for Oahu Transit Services totaled $194.6 million in FY2010 ($165.6 million for TheBus and $29.0 million for the paratransit Handi-Van service). Of this amount, $149.8 million represents personnel costs, $23.1 million for diesel fuel, $11.4 million for bus parts, materials, and supplies, and $10.3 million for trust fund contributions, and other non-personnel expenses. Preventative maintenance ($21 million annually) is capitalized and funded by FTA Section 5307 grants.
Section 6.313 Capital Improvements Program
The composition of the bus fleet is expected to change over the next 7 years, with the addition of new 40’ “low floor,” 45’ and 60’ foot vehicles. Capital costs for new buses to be procured through FY 2016 total $145 million, reflecting a net increase in the bus fleet from 531 to 549 buses. DTS and OTS are currently analyzing bus fleet lifecycle replacement and new bus requirements. In addition to the bus fleet, new traffic management and bus support facilities are being planned and will be funded in part by FTA Section 5307, 5309, 5337 and 5340 grants. The FY2011 6-Year Capital Improvements Program is shown in Figure 22.
Figure 22 Summary of Transit-Related Capital Improvement Projects and Funding Sources

Hawaii Statewide Transportation Plan Update Issue Paper on Financial Issues
-44-
Figure 23 Department of Transportation Services Bus Transit 25-Year Forecast CIP Requirements
$0
$50
$100
$150
$200
In $
Mill
ions
BUS TRANSIT 25-YEAR FORECAST CIP REQUIREMENTS
CIP-Current Plan CIP-Future
Source: HNTB Financial Model Based on Data from City and County of Honolulu, Department of Transportation Services Figure 23 shows the total capital requirements projected over the next 25 years of more than $3 billion, including the current plan for new bus facilities and vehicles totaling $467 million for the period, FY 2010 through FY2016.
Section 6.314 Challenges
The current challenge for the C&C bus system is to adjust service to reflect county budget shortfalls and to continue to be able to increase fares and secure additional federal dollars to keep up with the bus replacement schedule.

Hawaii Statewide Transportation Plan Update Issue Paper on Financial Issues
-45-
Section 6.32 DTS Rapid Transit Division (Honolulu High-Capacity Transit Corridor Project)
The Rapid Transit Division (RTD) runs the Honolulu High-Capacity Transit Corridor Project. Duties and responsibilities within RTD include: Planning, Environmental Studies, Design and Construction, Administration, Finance, Public Relations, and Technical Services. RTD manages all consultant services, construction, and other third-party contracts, master agreements, and resources provided through interagency agreements. RTD also interfaces with State of Hawaii, U.S. Department of Transportation, Federal Transit Administration, other relevant regulatory agencies, public and private utilities, the general public, property owners impacted by the project, the media, and the design and construction industry.
Section 6.321 Honolulu High-Capacity Transit Corridor Project
The U.S. Department of Transportation Federal Transit Administration (FTA) and the City and County of Honolulu Department of Transportation Services Rapid Transit Division (RTD) are sponsoring a project that would provide high-capacity transit service (“Rail”) on the Island of Oahu. The corridor extends from Kapolei in the west (the Waianae or Ewa direction) to the University of Hawaii at Manoa (UH Manoa) in the east (the Koko Head direction). This corridor includes the majority of housing and employment on Oahu. Its east-west length is approximately 23 miles, and between Pearl City and Aiea its width is less than one mile between Pearl Harbor and the base of the Koolau Mountains.
Section 6.322 Revenues and Capital Project
According to Final Environmental Impact Statement estimates, the capital cost to build Rail is $5.5 billion. The Hawaii Governor accepted the Final Environmental Impact Statement in December 2009, and the FTA issued a Record of Decision (ROD) for the project in January 2011. The local funding source for the project is a dedicated 0.5% surcharge on the State of Hawaii’s General Excise and Use Tax (GET). This GET surcharge revenue is to be exclusively used for the Project’s capital and/or operating expenditures and is expected to generate $4.1 billion (year-of expenditure dollars) through 2022. The FTA has agreed to consider $1.2 billion (year-of-expenditure dollars) for the Federal contribution to the Project from the New Starts program. The City receives Federal assistance through various funding programs from the FTA for ongoing capital investments to maintain and overhaul its transportation system. The financial analysis performed assumes the City will continue to receive these funds, some of which would increase noticeably after implementation of the Project.

Hawaii Statewide Transportation Plan Update Issue Paper on Financial Issues
-46-
In late 2009, the first of several construction contracts for the city’s Honolulu High-Capacity Transit Corridor Project was awarded. The initial 6.5-mile segment of the transit route will run from Kapolei to Pearl Highlands near Leeward Community College. The winning proposal was determined by the City to be the best value at $482,924,000. This represents a $90 million savings from the project estimate as the design-build contract had been estimated by the City to be approximately $570 million.

Hawaii Statewide Transportation Plan Update Issue Paper on Financial Issues
-47-
Section 6.4 - Kauai County – Kauai Transportation Agency (Kauai Bus)
The Kauai Bus, operated by the Kauai Transportation Agency, operates both a public (fixed route) and a paratransit (door-to-door) bus service from Hanalei to Kekaha daily except on Sundays. The Kauai Bus now provides service to Lihue Airport and limited service to Koloa and Poipu. The Paratransit Service is available for qualified individuals who are registered with the County Transportation Department. The service days and hours are the same as the public transportation and reservations are required 24-hours in advance for door-to-door pickups. Human Service Agencies also contract with the County Transportation Agency to provide transportation service for their program participants. For Americans with Disabilities Act (ADA) customers, individuals must be certified and registered as ADA-eligible for service. Paratransit routes that extend beyond the ADA 3/4 mile corridor will have seats open to the general public on a space available basis. According to the Kauai Transportation Agency, their elderly population continues to increase, as has the demand for transportation services. It appears that as their fixed route system becomes more accessible, the senior citizens are utilizing the fixed-route service. The paratransit trips over the last five-years have actually decreased while the trips on their fixed-route doubled. Many disabled adults now utilize the services of Personal Assistants (PA) whom also provide one-to-one transportation services for these individuals as part of their personalized service.
Section 6.41 Revenue Overview
Fare revenues have increased from $341,000 in FY2009 to $346,000 projected for FY2010, which along with $179,000 in other revenues brings total projected operating revenue in FY2010 to $525,000. The balance of required funding for operations and maintenance comes from the County General Fund (see Figure 24).

Hawaii Statewide Transportation Plan Update Issue Paper on Financial Issues
-48-
Figure 24 Kauai Transportation Agency Revenue Forecast
2008 2009 2010 2011 2012 2013 2014 2015
COUNTY GENL FUND $3,011 $3,910 $4,299 $4,428 $4,561 $4,698 $4,839 $4,984
FED TRANSIT 5311/RTAP $488 $513 $565 $582 $599 $617 $636 $655
$-
$1,000
$2,000
$3,000
$4,000
$5,000
$6,000
$000
'S
KAUAI TRANSIT REVENUES
Source: HNTB Financial Model Based on Data from Both County of Kauai Transportation Agency and Hawaii DOT-STP Office
Section 6.42 Operations and Maintenance
Total operating and maintenance expenditures for the Kauai Transportation Agency total $4.6 million in FY2010 and are funded primarily by the County General Fund and fare revenues from the system ($346,000). Section 6.43 Capital
Capital expenditures on facilities and vehicles are expected to total $2.4 million in FY2010 and will be funded by county and Federal grant funds, including American Recovery and Revitalization Act (ARRA) funds ($978,000), Federal Transit 5309/5310, 5311 and 5311 Rural Transit Assistance Program (RTAP) funds. At a 3 % annual rate of growth, capital expenditures will total more than $90 million over the 25-year forecast period.
Section 6.44 Challenges
The three Neighbor Islands divide the federal transit formula funds by thirds, which results in a known amount each year, but does not necessarily reflect the needs by county. For their major bus purchases, they rely on federal discretionary earmarks. Like the other Neighbor Islands, Kauai County cannot count on earmarks every year, so it is difficult to do long range planning. Also, the growth in the elderly population continues to increase the demand on fixed route and paratransit services.

Hawaii Statewide Transportation Plan Update Issue Paper on Financial Issues
-49-
Section 6.5 Hawaii County Mass Transit Agency (Hele-On Bus)
The Hawaii County Mass Transit Agency provides public transportation around the island on the Hele-On bus. The County manages, maintains, and owns the buses. In addition, the Transit Agency offers a Shared Ride Taxi program which provides door to door transportation for as little as $2.00 within the urbanized area of Hilo. The County of Hawaii currently has 9 buses on order. Five buses are 45-passenger coach type buses, and four are 33-passenger mid size buses. MCI is constructing the coach buses, and El Dorado National is building the mid size buses. All 9 buses are scheduled to be delivered to Hilo by the end of 2010. In addition, a bid is currently out for two additional 45-passenger coach buses. Funding for these bus purchases was obtained through Federal grants received through the efforts of Hawaii’s Congressional Delegation.
Section 6.51 Revenue Overview
There are currently no fare revenues generated by Hele-On Bus—it is fare-free. Other operating revenues are projected to be $260,000 in FY2010. The balance of required funding for operations and maintenance (estimated at $4.5 million in FY2010) comes from the County General Fund.
Section 6.52 Operations and Maintenance
Total operating and maintenance expenditures for Hawaii County Mass Transit Agency total $4.5 million in FY2010 and are funded primarily by the County General Fund.
Section 6.53 Capital
Capital expenditures on facilities and vehicles are expected to total $3.4 million in FY2010 and will be funded by county and Federal grant funds, including American Recovery and Revitalization Act (ARRA) funds ($978 thousand), Federal Transit 5309, 5311 and 5311 Rural Transit Assistance Program (RTAP) funds. At a 3 % annual rate of growth, capital expenditures will total more than $90 million over the 25-year forecast period based on a recurring capital expenditure level of $2.5 million in FY2010. The County is also continually expanding bus fleet. It is adding two more MCI buses by May 2010 from ARRA funds. It is adding a double deck bus in early 2011. Funding for buses come through earmarks.

Hawaii Statewide Transportation Plan Update Issue Paper on Financial Issues
-50-
Other projects are an Island-wide bus stop program, adding additional commuter bus service through Job Access Reverse Commute Grant (JARC), expanding paratransit and additional circulator routes within towns. Hele-On’s bus service expansion plans include increased afterschool transportation island-wide, more service for working commuters, increased frequency within Hilo and Kona, Kau to Kona, – North Kohala to Waimea and Kona, East Hawaii to South Kohala and Lower and Upper Puna to Hilo. Funding for service expansion will come from County General Fund, vehicle weight tax, and FTA Section 5311 funding for non urbanized areas.
Section 6.54 Challenges
The County of Hawaii is an island covering over 4,000 square miles, and the population is about 170,000. The large size of the island coupled with a relatively sparse population creates challenges in providing public transportation. Bus rides have been provided at no cost to riders since October, 2005. This program provides free bus rides for two year terms. Beginning July 1, 2011, Hawai‘i County will begin to charge bus fares to supplement its operations. The three Neighbor Island counties of Kauai, Maui, and Hawaii divide the federal transit formula funds by thirds, which results in a known amount each year, but does not reflect the needs by county. For their major bus purchases, they rely on federal discretionary earmarks. Like the other Neighbor Island Counties, Hawaii County cannot count on earmarks every year, so it is difficult to do long range planning.
Hawaii Statewide Transportation Plan Update Issue Paper on Financial Issues
-51-
Section 6.6 Maui County Public Bus Transit System (Maui Bus)
The County of Maui currently funds a public bus system that provides service in and between various Central, South, West, Haiku, and Upcountry Maui communities. The fare ranges from complimentary to $1.00 per boarding, depending on the route used. Monthly passes are also available. The routes operate seven days a week including all holidays. The Maui Bus Commuter Service is designed for early morning and evening commuters. This service augments the existing Maui Bus service and consists of four commuter routes, all operated by Roberts Hawaii. The routes are the Haiku-Wailea Commuter, Makawao-Kapalua Commuter, Wailuku-Kapalua Commuter, and the Kihei-Kapalua Commuter. The County of Maui Department of Transportation also provides ADA complimentary paratransit service through Roberts Hawaii. Paratransit service is available within corridors whose boundaries extend three-fourths of a mile on each side of each fixed Maui Bus route. Rural shuttles are available to the general public on Maui, Lanai, and Molokai, with minimum service three times a week. They are funded by the County of Maui and are operated by Maui Economic Opportunity (MEO). These services are provided at no cost to the public.
Section 6.61 Revenue Overview
Fare revenues will increase from $1.1 million in FY2009 to $1.2 million projected for FY2010, which, along with $7.8 million in other revenues, brings total projected operating revenue in FY2010 to $9.0 million. The balance of required funding for operations and maintenance comes from the County General Fund (see Figure 25).

Hawaii Statewide Transportation Plan Update Issue Paper on Financial Issues
-52-
Figure 25 Maui Transit Operating Revenues
2008 2009 2010 2011 2012 2013 2014 2015
COUNTY GENL FUND $5,486 $6,550 $7,377 $7,598 $7,826 $8,061 $8,303 $8,552
FED TRANSIT 5311/RTAP $500 $537 $- $565 $582 $599 $617 $636
$-
$1,000
$2,000
$3,000
$4,000
$5,000
$6,000
$7,000
$8,000
$9,000
$10,000
$000
'S
MAUI TRANSIT REVENUES
Source: HNTB Financial Model Based on Data from Both County of Maui Transportation Agency and Hawaii DOT-STP Office
Section 6.62 Operations and Maintenance
Total recurring operating and maintenance expenditures for the Maui County Public Bus Transit System Agency total $11 million in FY2010 and are funded primarily by the County General Fund and fare revenues from the system ($1.2 million).
Section 6.63 Capital
Capital expenditures on facilities and vehicles are expected to total $2.4 million in FY2010 and will be funded by county and Federal grant funds, including American Recovery and Revitalization Act (ARRA) funds ($978 thousand), Federal Transit 5309/5310, 5311 and 5311 Rural Transit Assistance Program (RTAP) funds. At a 3 % annual rate of growth, capital expenditures will total more than 90$ million over the 25-year forecast period.
Section 6.64 Challenges
The three Neighbor Islands divide the federal transit formula funds by thirds, which results in a known amount each year, but does not reflect the needs by county. For their major bus purchases, they rely on federal discretionary earmarks. Like the other Neighbor Islands, Maui County cannot count on earmarks every year, so it is difficult to do long range planning.

Hawaii Statewide Transportation Plan Update Issue Paper on Financial Issues
-53-
Section 7.0 Funding Opportunities This section highlights funding opportunities for the Hawaii DOT and the County transit agencies. The opportunities are organized by:
• Existing federal funding sources; • Funding opportunities for all modes (airports, harbors, highways, transit); • New funding opportunities by mode; • Leveraging existing transportation assets; and • Innovative financing.
Section 7.1 Federal Transportation Programs and Revenue Sources
Table 1 is a summary of the federal programs and revenue sources available for highways, transit, aviation, freight and high speed rail and ports/marine improvements. These funding programs are managed by:
• FHWA: Federal Highway Administration • FTA: Federal Transit Administration • FAA: Federal Aviation Administration • FRA: Federal Railroad Administration • MARAD: Maritime Administration
The funding themes for the reauthorization of the existing federal funding act, SAFETEA-LU, are summarized in Appendix 1 in this issue paper.

Hawaii Statewide Transportation Plan Update Issue Paper on Financial Issues
-54-
Table 1: Federal Transportation Programs and Revenue Sources2 MODE MAJOR TRANSPORTATION
PROGRAMS FEDERAL REVENUE SOURCES
Administered by FHWA • Interstate Maintenance• National Highway System • Highway Bridge Program • Congestion Mitigation and Air Quality Improvement (in air quality non-attainment and maintenance areas) • Surface Transportation Program (includes transportation enhancements and planning funds) • Highway Safety Improvement Program • National Corridor Planning and Development and Coordinated Border Infrastructure • High Priority (Demonstration) Projects • Intelligent Transportation Systems • Equity Bonus • Federal Lands Highway Program • National Scenic Byways Program (discretionary for use on nationally designated routes only) • Recreational Trails
Highway Trust Fund with funds from federal: - Motor Fuel Tax (15.44 cents/gallon of gasoline; varies for other fuel types) - Truck and Trailer Tax - Tire Tax - Heavy Vehicle Use Tax - Tire Tax Quality Improvement
Administered by FTA • Major Capital (Section 5309)
• Urbanized Area Formula (Section 5307) • Other than Urbanized Area Formula (Section 5311) • CMAQ (only when funds flexed from FHWA) • Elderly Individuals and Persons With Disabilities (Section 5310) • Job Access and Reverse Commute Program(JARC) • New Freedom Program •Alternative Transportation in Parks and Public Lands • Clean Fuels Discretionary Grants Program (Section 5308) • Over-the-Road Bus Program • Over-the-Road Bus Accessibility (Rural Trans Accessibility Incentive Program)
• Mass Transit Account of the Highway Trust Fund with funds from motor fuel tax (2 cents/gallon) • General Fund • Interest
2 A modified version of this table is found in Financing the Statewide Plan: A Guidebook, Federal Highway Administration, November 1999: www.fhwa.dot.gov/hep10/state/04703r04.pdf. For more information about FTA funding programs, see www.fta.dot.gov/funding.

Hawaii Statewide Transportation Plan Update Issue Paper on Financial Issues
-55-
MODE MAJOR TRANSPORTATION PROGRAMS
FEDERAL REVENUE SOURCES
Administered by FAA • Federal Airport and Airway Trust Fund, which is the source for airport development grants; airport planning grants • Airport Improvement Program (AIP), a source that provides grants to public agencies for the planning and development of public use airports that are included in the National Plan of Integrated Airport Systems (NPIAS)
•Aviation Fuel Tax •Air Freight Tax • Passenger Ticket Tax • International Departure Tax
Administered by FHWA, FRA
• Federal Railroad Administration Grants (planning, rail service continuation, rehabilitation, provision of substitute service)•
• General Fund
Administered by FRA • High-Speed Rail
• Amtrak • Highway Trust Fund• General Fund • General Fund (relies on specific capital appropriations) • Passenger Fares • Food/Beverage Revenue
Administered by MARAD & FHWA
• Army Corps of Engineers—Construction, operation, and maintenance of waterways, locks and harbors • Construction of Ferry Boats and Terminal Facilities (Note: MARAD has the flexibility to direct surplus federal funds for Hawaii ports)
• Fuel taxes paid by inland water carriers • Ad valorem taxes paid by users of ports • Highway Trust Fund

Hawaii Statewide Transportation Plan Update Issue Paper on Financial Issues
-56-
Section 7.2 Funding Opportunities for All Modes
In addition to the traditional funds that HDOT receives for highway projects and that the counties receive for transit projects, there are new and continuing funding sources that relate to the Federal Livability Initiative. A summary of those opportunities follows.
Section 7.21 Livability Initiative - Leveraging the Partnership: DOT, HUD, and EPA Programs
In June 2009, the Partnership for Sustainable Communities was formed by the U.S. Department of Housing and Urban Development (HUD), the U.S. Department of Transportation (DOT), and the U.S. Environmental Protection Agency (EPA).3 These three agencies have pledged to ensure that housing and transportation goals are met while simultaneously protecting the environment, promoting equitable development, and helping to address the challenges of climate change. The following Livability Principles are guiding their work:
• Provide more transportation choices. • Promote equitable, affordable housing. • Enhance economic competitiveness. • Support existing communities. • Coordinate and leverage federal policies and investment. • Value communities and neighborhoods.
A notice from FTA advertised up to $25.7 million available for alternatives analysis for transit projects (AAs) and was issued in the federal register4 on May 28, 2010. The funds will be distributed in support of the Department of Transportation’s Livability Initiative and give 80% of federal funding. These grants can help to develop local partnerships with business and governmental agencies that share the same federal focus on Transit Livability. One of the first Livable Communities Grants was awarded in October 2010 to the City and County of Honolulu’s Department of Planning and Permitting (DPP). 5 DPP received $2,383,424 to implement a transit-oriented housing strategy along the new rail system corridor in the urban core to maintain and promote housing for low and moderate income families. The core partners for the project are the Hawaii Housing Alliance, Kamehameha Schools, Trust for Public Land, Oahu Land Trust, Urban Land Institute, and the Hawaii Community Development Authority (HCDA). The anticipated project benefits were to increase the number of affordable/workforce housing units along the Honolulu Rail Corridor and decrease time associated with permitting processes for housing projects.
3 USDOT Sustainability: http://fta.dot.gov/documents/Sustainable_Communities_Programs_4-26-10.pdf 4 Federal Register / Vol. 75, No. 103 / Friday, May 28, 2010 / Notices 5 http://portal.hud.gov/portal/page/portal/HUD/press/press_releases_media_advisories/2010/HUDNo.10-242

Hawaii Statewide Transportation Plan Update Issue Paper on Financial Issues
-57-
Section 7.22 Economic Recovery Funding
Transportation Investment Generating Economic Recovery (TIGER)6: The TIGER Discretionary Grant Program was included in the American Recovery and Reinvestment Act (ARRA) to spur a national competition for innovative, multimodal, and multi-jurisdictional transportation projects that promise significant economic and environmental benefits to an entire metropolitan area, a region, or the nation. In February 2010, USDOT selected 51 projects to be funded with the $1.5 billion allocated in the Recovery Act, including improvements to roads, bridges, rail, ports, and transit and intermodal facilities. The HDOT Harbors Division was selected to receive $24.5 Million in TIGER Grant federal stimulus funds to reconstruct Pier 29 at Honolulu Harbor. This project will add approximately 12 acres of upgraded cargo capacity while freeing up state funds previously reserved for this project. The funds once allocated to Pier 29 will now be use to accelerate construction of other projects listed as part of Harbors Modernization Plan. USDOT will be competitively selecting a second round of projects under the TIGER program. Up to $600 million will be funded, including $35 million set aside for planning projects. Section 7.3 Funding Programs by Mode
These programs are available by mode. Many fit the Livability Initiative and others are specific to the mode.
Section 7.31 Formula Funding Programs for Transit
Hawaii New Transit Formula Program: A potential opportunity is a proposed law change through the Hawaii Congressional Delegation that would give the Neighbor Islands a stable annual allocation of Federal Transit Administration capital funds, at least for three years. This would allow the Neighbor Island transit systems to better plan their bus expansion programs. Reauthorization – Increased Transit Funding Potential: Another opportunity is the potential for increased transit funding in the reauthorization of the federal surface transportation act, SAFETEA-LU. Reauthorization has been delayed until after December 31, 2010, but there are strong constituencies for increased funding for transit and other “green” services. See Appendix 1 in this issue paper for a discussion on these federal themes. Urban Circulator Grant: U.S. Transportation Secretary Ray LaHood announced the availability of $280 million for urban circulator projects such as streetcars, buses, and bus facilities to support communities, expand business opportunities, and improve people’s quality of life while also creating jobs.
6 TIGER Grants information: http://www.dot.gov/recovery/

Hawaii Statewide Transportation Plan Update Issue Paper on Financial Issues
-58-
A maximum amount of $25 million per project will be made available from approximately $130 million in unallocated discretionary New Starts/Small Starts Program funds. Eligible projects include streetcars and other urban circulator systems. Priority will be given to projects that connect destinations and foster the redevelopment of communities into walkable, mixed use, high-density environments. A second pot of money totaling $150 million in unallocated discretionary Bus and Bus Facility funds will be available for projects that will foster the preservation and enhancement of urban and rural communities by providing new mobility options which provide access to jobs, healthcare, and education, and/or contribute to the redevelopment of neighborhoods into pedestrian-friendly vibrant environments. Urbanized Areas Formula Grant Program: This program makes federal resources available via formula allocation to transit agencies in urbanized areas over 200,000 in population and to governors for transit capital and operating assistance in urbanized areas between 50,000 and 200,000 in population. Funding can be used for planning, engineering, design, and evaluation of transit projects, and other technical transportation-related studies. Funding can also be used for capital investments in bus and bus-related activities such as replacement, overhaul, and rebuilding of buses. For urbanized areas with populations of 200,000 or more, at least 1% of the funding apportioned to each area must be used for transit enhancement activities such as historic preservation, landscaping, public art, pedestrian access, bicycle access, and enhanced access for persons with disabilities. http://www.fta.dot.gov/funding/grants/grants_financing_3561.html Rail and Fixed Guideway Modernization Formula Program: This program provides funding via formula allocation to transit agencies with a fixed guideway transit system. A “fixed guideway” refers to any transit service that uses exclusive or controlled rights-of-way or rails, entirely, or in part. The term includes heavy rail, commuter rail, light rail, monorail, trolleybus, aerial tramway, inclined plane, cable car, automated guideway transit, ferryboats, that portion of motor bus service operated on exclusive or controlled rights-of-way, and high-occupancy-vehicle (HOV) lanes. Funds can be used to modernize or improve existing fixed guideway systems. http://www.fta.dot.gov/funding/grants/grants_financing_3558.html Rural and Small Urban Area Formula Grant Program: This program provides critical transit access to residents in non-urbanized areas to employment, health, educational, and other important human services and opportunities. Via formula-based funding to states, this program supports public transportation in areas of less than 50,000 in population. Funds may be used for capital, operating, and administrative assistance to state agencies, local public bodies, Indian tribes, nonprofit organizations, and operators of public transportation services. The Intercity Bus program (5311(f)) under this program supports the connection between non-urbanized areas and the larger regional or national system of intercity bus service. http://www.fta.dot.gov/funding/grants/grants_financing_3555.html

Hawaii Statewide Transportation Plan Update Issue Paper on Financial Issues
-59-
Rural Transit Assistance Program (RTAP): RTAP provides funding to assist in the design and implementation of training and technical assistance projects and other support services tailored to meet the needs of transit operators in non-urbanized areas. RTAP has both state and national program components. http://www.fta.dot.gov/funding/grants/grants_financing_3554.html Competitive Funding Programs for Transit Bus and Bus Facilities Discretionary Grant Program: This program provides capital assistance for new and replacement buses, related equipment, and facilities, as well as intermodal transit centers. Funding is available to states for rural and small urban bus and bus facility projects and to transit agencies for projects in urban areas greater than 200,000 in population. While often earmarked by Congress, this program does have competitive opportunities to provide funding for the purchase of bus and bus facilities, which are announced in the Federal Register. http://www.fta.dot.gov/funding/grants/grants_financing_3557.html New Starts/Small Starts Discretionary Grant Program: These discretionary programs are the federal government’s primary financial resource (49 U.S.C. 5309) for supporting the planning, development, and construction of major transit fixed guideway capital projects. New Starts and Small Starts have helped make possible dozens of new or extended transit fixed guideway systems across the country – heavy rail, light rail, commuter rail, bus rapid transit, and ferries. New Starts projects are typically greater than $250 million in total project cost, requesting greater than $75 million in New Starts funding. The Small Starts program supports fixed guideway projects smaller than the New Starts cost thresholds. Participation in the New Starts and Small Starts programs requires completion of a legislatively directed process for planning and project development. http://www.fta.dot.gov/funding/grants/grants_financing_3559.html Transit Investments for Greenhouse Gas and Energy Reduction (TIGGER) Program: TIGGER grants are awarded to public transit agencies for the implementation of new strategies for reducing greenhouse gas emissions or reducing energy usage from their operations. These strategies can be implemented through operational or technological enhancements or innovations. http://www.fta.dot.gov/tigger
Hawaii Statewide Transportation Plan Update Issue Paper on Financial Issues
-60-
Paul S. Sarbanes Transit in the Parks Discretionary Grant Program: This program protects environmentally sensitive national parks, forests, wildlife refuges, and other federal lands while improving visitor experience through funding for public transportation and other alternative transportation. Administered by FTA in partnership with the Department of the Interior and the Forest Service, the program funds capital and planning expenses for alternative transportation systems such as shuttle buses and bicycle trails in national parks and public lands. The goals of the program are to conserve natural, historical, and cultural resources; reduce congestion and pollution; improve visitor mobility and accessibility; enhance visitor experience; and ensure access to all, including persons with disabilities. http://www.fta.dot.gov/funding/grants/grants_financing_6106.html
Section 7.32 Funding Programs for Transit Serving Target Populations
FTA believes that all segments of the population should have safe, reliable access to public transportation. FTA offers several grant programs tailored to target populations such as the elderly, Americans with disabilities, and low -income workers who face particular challenges with access to critical services. FTA programs provide lifeline services through a “mobility management” approach to ensure access for all Americans to public transportation. FTA is also committed to maintaining affordable transportation services for all communities. Transportation for Elderly Persons and Persons with Disabilities: This program provides formula funding to states to help private nonprofit groups meet the transportation needs of the elderly and persons with disabilities when transportation service is unavailable or insufficient. Funds are apportioned based on each state’s share of population for these groups of people. For persons with mobility limitations related to advanced age, persons with disabilities, and persons struggling for self-sufficiency, transportation within and between communities needs to be as available and affordable as possible. http://www.fta.dot.gov/funding/grants/grants_financing_3556.html The Job Access and Reverse Commute Program (JARC): JARC provides low-income workers and students with transportation services to jobs, employment centers, and educational institutions. A recent study of the economic benefits of employment-related transportation services concluded that transportation funded through the JARC program provided access to approximately 43.4 million jobs, including 21.2 million low-wage jobs. http://www.fta.dot.gov/funding/grants/grants_financing_3550.html The New Freedom Formula Grant Program: This program aims to provide additional tools to overcome barriers that Americans with disabilities face when seeking integration into the work force and full participation in society. Lack of adequate transportation is a primary barrier to work for individuals with disabilities. The 2000 Census showed that only 60% of people between the ages of 16 and 64 with disabilities are employed. The New Freedom formula grant program seeks to reduce barriers to transportation services and expand the mobility options

Hawaii Statewide Transportation Plan Update Issue Paper on Financial Issues
-61-
available to people with disabilities beyond the requirements of the Americans with Disabilities Act (ADA) of 1990. http://www.fta.dot.gov/funding/grants/grants_financing_3549.html
Section 7.33 Funding Programs by the Federal Highway Administration7
FHWA has broad responsibility for improving mobility and safety on our nation’s roads and highways through national leadership, innovation, and program delivery. Although state, local, and tribal governments own most of the nation’s highways, FHWA provides financial and technical support to these governments for constructing, improving, and preserving America’s highway system. Its annual budget of more than $30 billion is funded by fuel and motor vehicle excise taxes. The budget is primarily divided between two programs: Federal-aid funding to state and local governments; and Federal Lands Highways funding for national parks, national forests, Indian lands, and other land under federal stewardship. The Federal-Aid Highway Program provides federal financial resources and technical assistance to state and local governments for constructing, preserving, and improving the National Highway System and resources for urban and rural roads that are not on the National Highway System, but that are eligible for federal aid. Below are a few of FHWA’s programs that can be used to promote livable community projects. Pedestrian and Bicycle Safety Program: The goal of this program is to reduce pedestrian and bicyclist fatalities, injuries, and crashes and make the Nation’s roads safer for these vulnerable road users. This is achieved through conducting research and developing guidelines, tools, and safety countermeasures. In addition, program members focus on crash data to identify crash hot spots and determine lower cost measures to improve safety. Part of the effort includes trying to aggressively reduce pedestrian deaths by focusing extra resources on the states (Arizona, California, Florida, Georgia, Hawaii, Illinois, Nevada, New Jersey, New Mexico, New York, North Carolina, Pennsylvania, Texas) and cities (Los Angeles, Phoenix, Chicago, New York City, Washington DC) with the highest pedestrian fatalities and/or fatality rates. http://safety.fhwa.dot.gov/ped_bike/ Recreational Trails Program (RTP): This program provides funds to states to develop and maintain recreational trails and trail-related facilities for both non-motorized and motorized recreational trail uses. Federal transportation funds benefit recreation, including hiking, bicycling, in-line skating, equestrian use, cross-country skiing, snowmobiling, off-road motorcycling, all-terrain vehicle riding, four-wheel driving, or other off-road motorized vehicles. http://www.fhwa.dot.gov/environment/rectrails/
7 http://www.fhwa.dot.gov

Hawaii Statewide Transportation Plan Update Issue Paper on Financial Issues
-62-
Transportation Enhancement (TE) Program: TE activities offer opportunities to help expand transportation choices and enhance the transportation experience through activities related to surface transportation, including pedestrian and bicycle infrastructure and safety programs, scenic and historic highway programs, landscaping and scenic beautification, historic preservation, and environmental mitigation. TE projects must relate to surface transportation and must qualify under one or more of the eligible categories. http://www.fhwa.dot.gov/environment/te Congestion Mitigation and Air Quality Improvement (CMAQ) Program: This program is jointly administered by FHWA and the FTA. Under SAFETEA-LU, the program has provided just under $9 billion in authorizations to State DOTs and MPOs, and their project sponsors for a growing variety of transportation-environmental projects. An apportioned program, each year’s funding is distributed to the states via a statutory formula based on population and the air quality classification as designated by the EPA. http://www.fhwa.dot.gov/environment/air_quality/cmaq/ Context Sensitive Solutions (CSS): While not a funding program, CSS is a collaborative, interdisciplinary approach that involves all stakeholders in developing a transportation facility that fits its physical setting and preserves scenic, aesthetic, historic, and environmental resources while maintaining safety and mobility. CSS considers the total context within which a transportation improvement project will exist. CSS principles include the employment of early, continuous, and meaningful involvement of the public and all stakeholders throughout the project development process. The project is designed and built with minimal disruption to the community. http://www.fhwa.dot.gov/context/ National Scenic Byways Program: Grants and technical assistance are provided to states and Indian tribes to implement projects on highways designated as National Scenic Byways, All-American Roads, America's Byways, and state scenic or Indian tribe scenic byways and to plan, design, and develop a state or Indian tribe scenic byway program. Funds shall be available for an activity related to the planning, design, or development of a state or Indian tribe scenic byway program; development and implementation of a byway corridor management plan; safety improvements to accommodate increased traffic; improvements that enhance access; protection of resources adjacent to the byway; development and implementation of a marketing program; development and provision of tourist infrastructure; and construction of bicycle and pedestrian facilities, interpretive facilities, overlooks, and other enhancements for byway travelers. http://www.fhwa.dot.gov/HEP/byways/index.htm Safe Routes to School Program: For infrastructure-related projects, eligible activities are the planning, design, and construction of projects that will substantially improve the ability of students to walk and bike to school. These include sidewalk improvements, traffic calming and speed reduction improvements, pedestrian and bicycle crossing improvements, on-street

Hawaii Statewide Transportation Plan Update Issue Paper on Financial Issues
-63-
bicycle facilities, off-street bicycle and pedestrian facilities, secure bike parking, and traffic diversion improvements in the vicinity of schools (within approximately two miles). Such projects may be carried out on any public road or any bicycle or pedestrian pathway or trail in the vicinity of schools. Each state must set aside from its Safe Routes to School apportionment not less than 10% and not more than 30% of the funds for non-infrastructure- related activities to encourage walking and bicycling to school. These include public awareness campaigns and outreach to press and community leaders; traffic education and enforcement in the vicinity of schools; student sessions on bicycle and pedestrian safety, health, and environment; and training of volunteers and managers of Safe Routes to School programs. http://safety.fhwa.dot.gov/saferoutes/ Transportation, Community, and System Preservation Program (TCSP): These discretionary funds, usually earmarked by Congress, may be used to carry out eligible projects to integrate transportation, community, and system preservation plans and practices that improve the efficiency of the transportation system of the United States; reduce the impacts of transportation on the environment; reduce the need for costly future investments in public infrastructure; provide efficient access to jobs, services, and centers of trade; examine community development patterns; and identify strategies to encourage private-sector development. http://www.fhwa.dot.gov/tcsp/
Section 7.34 Flexible Programs under the Federal Highway Administration
Many Federal-Aid Highway programs have specific eligible transit activities identified in legislation. In addition, funds from other programs that do not have specific transit eligibility may be transferred by states to other Federal-Aid Highway programs that do have such eligibility. If funds are transferred from one Federal-Aid Highway program to another, those funds then have the same eligibility as the program that they are transferred to. For example, Interstate Maintenance (IM) funds transferred to the Surface Transportation Program (STP) would have the same eligibility as STP funds. To transfer funds from FHWA to FTA, the state department of transportation must request that the funds be transferred, with the concurrence of the MPO if the project is within a metropolitan planning area, in a letter to the FHWA Division Office. Funding transfers are permitted only for projects contained in an approved metropolitan transportation improvement program (TIP) and/or statewide transportation improvement program (STIP). http://www.fta.dot.gov/funding/grants/grants_financing_3545.html

Hawaii Statewide Transportation Plan Update Issue Paper on Financial Issues
-64-
Congestion Mitigation and Air Quality (CMAQ) Program: The CMAQ program supports transportation projects or programs that will improve air quality and relieve congestion in areas that do not meet National Ambient Air Quality Standards. Reducing pollution and other adverse environmental effects of transportation projects and transportation system inefficiency have been long-standing DOT objectives. CMAQ funds may be used to establish new or expanded transportation projects or programs that reduce emissions, including capital investments in transportation infrastructure, congestion relief efforts, and diesel engine retrofits. Other CMAQ projects include operating assistance for new transit services, travel demand management strategies, traffic flow improvement programs that reduce emissions, and bicycle/pedestrian facilities and programs. http://www.fhwa.dot.gov/environment/cmaqpgs/ Surface Transportation Program: The Surface Transportation Program provides flexible funding that may be used by states and localities for projects on any federal-aid highway, including the National Highway System, bridge projects on any public road, transit capital projects, and intracity and intercity bus terminals and facilities. It can be used for a broad array of highway purposes and flexibly used for major transit purposes as well. A few examples include buying buses or rail vehicles or constructing fixed guideway systems like light rail or heavy rail. http://www.fhwa.dot.gov/safetealu/factsheets/stp.htm National Highway System (NHS) Program: The NHS Program provides flexible funding that may be used by states and localities for projects to make improvements to rural and urban roads that are part of the NHS, including the Interstate System and designated connections to major intermodal terminals. NHS Program funds can be used to fund transit improvements in NHS corridors. http://www.fhwa.dot.gov/safetealu/factsheets/nhs.htm
Section 7.35 Security Grants
The Department of Homeland Security has a number of grants for transportation infrastructure. For example, Preparedness Grants (formerly known as the Infrastructure Protection Program) supports specific activities to strengthen security at ports and enhance transit, trucking and intercity bus systems. http://www.dhs.gov/xgovt/grants/index.shtm
Section 7.36 Planning Grants
Federal Transit and Federal Highway Administration have joint program for planning as follows: Transportation Planning Capacity Building Program: This FHWA/FTA comprehensive program provides training, technical assistance, and support to help decision makers, transportation officials, and staff resolve the increasingly complex issues they face when addressing transportation needs in their communities. Resources available through this program address

Hawaii Statewide Transportation Plan Update Issue Paper on Financial Issues
-65-
topics such as land use, scenario planning, transit-oriented development, non-motorized transportation, safety, community impact assessments, operations and management strategies, and analysis methods. This program is targeted to tribal, regional, state, and local governments; transit operators; and community leaders. http://www.planning.dot.gov Metropolitan & Statewide Planning Formula Grant Programs: These programs, jointly administered by FTA and FHWA, provide formula funding to support cooperative, continuous, and comprehensive planning for making transportation investment decisions in metropolitan areas and statewide. Eligible recipients include state departments of transportation and metropolitan planning organizations. http://www.fta.dot.gov/funding/grants/grants_financing_3563.html and http://www.fhwa.dot.gov/planning/
Section 7.37 Opportunities for Airports
In order to mitigate the projected increases in total costs from increases in annual debt service; Other Post-Employment Benefits (OPEB) liabilities such as pensions and retirement; and security expenses, the Airports Division continues to seek out grant funding sources for capital projects and is evaluating the leveraging of passenger facility charges (PFCs) for the payment of debt service for some of the modernization projects. While interest charges are incurred when PFCs are used for debt service, leveraging PFCs allows an airport to use PFC collections for the life of the bonds instead of being restricted to PFC collections prior to and during the construction period. While “less efficient,” this usage better matches the life of the assets being funded. A number of airports across the nation are using PFCs for the payment of debt service as an important part of their program to reduce and provide for gradual increases of airline rates and charges during and following the completion a major capital program in order to provide affordability and attractiveness to air carriers. Concession revenues are also important because they reduce the overall charges to the airlines. It will be important for the Airports Division to collect the current contracted concession revenues and continue to seek out opportunities for increasing commercial concession revenues at the airports.

Hawaii Statewide Transportation Plan Update Issue Paper on Financial Issues
-66-
Section 7.38 Opportunities for Harbors
In addition to implementing the new tariff structure, the Harbors Division will review other revenue sources, including facilities rentals policies to determine whether there is an opportunity to optimize revenues and shipping activity on its properties. The Harbors Division has been working closely with Hawaii’s congressional delegation and federal agencies to explore avenues for federal funding of improvements to the State’s commercial harbors system. In May, 2009, the U.S. Department of Transportation announced the availability of $1.5 billion in grant funds under the Transportation Investment Generating Economic Recovery, or TIGER, grant program. This new grant program, authorized by the American Recovery and Reinvestment Act of 2009 (ARRA), will provide grants on a competitive basis for capital investments, including port infrastructure projects. The division submitted an application for grant funds totaling $95.0 million to construct commercial harbor improvements at Honolulu, Hilo, and Kawaihae Harbors. While the HDOT Harbors Division was selected to receive $25.5 Million in TIGER Grant federal stimulus funds to reconstruct Pier 29 at Honolulu Harbor, they can still resubmit their grant package for the next round of TIGER or ARRA grants if their projects are eligible. As the lead federal agency for the Hawaii Port Infrastructure Expansion Program, MARAD has established a partnership with the State to assist in the modernization of Hawaii’s commercial harbors system.8 MARAD will provide federal oversight and coordination of projects and act as a central procurement organization to leverage federal and non-federal funding resources. The first project under this program has been the Pier 2A Demolition and Yard Improvements at Kawaihae Harbor. Facilities at Kawaihae Harbor’s inter-island barge terminal were improved through the use of surplus Federal Transit Administration (FTA) funds. The $3.0 million project was completed in October 2009 and provided the Division with improvements at no cost to the State. MARAD has also awarded a contract designed to streamline development efforts to modernize Hawaii’s commercial harbor facilities. A seven year program management contract with a maximum value of $400 million was awarded to TEC, Inc. through a competitive procurement process. Initial projects under this program include the design and construction of interior passenger terminal improvements and upgrades inside the existing pier shed as well as vehicular and pedestrian traffic circulation improvements at Hilo Harbor, design and construction of a covered walkway for passengers at Nawiliwili Harbor and design and construction of interior and traffic circulation improvements at the Pier 2 passenger terminal at Honolulu Harbor. 8 Under the authority contained under Chapter 266-1; 266-2, 7(b); 266-19 Hawaii Revised Statutes PL109-59, Title IX, Section 9008, Hawaii Port Infrastructure Expansion Program; Merchant Marine Act of 1936 as amended (46U.S.C. App. 1101 et seq.)
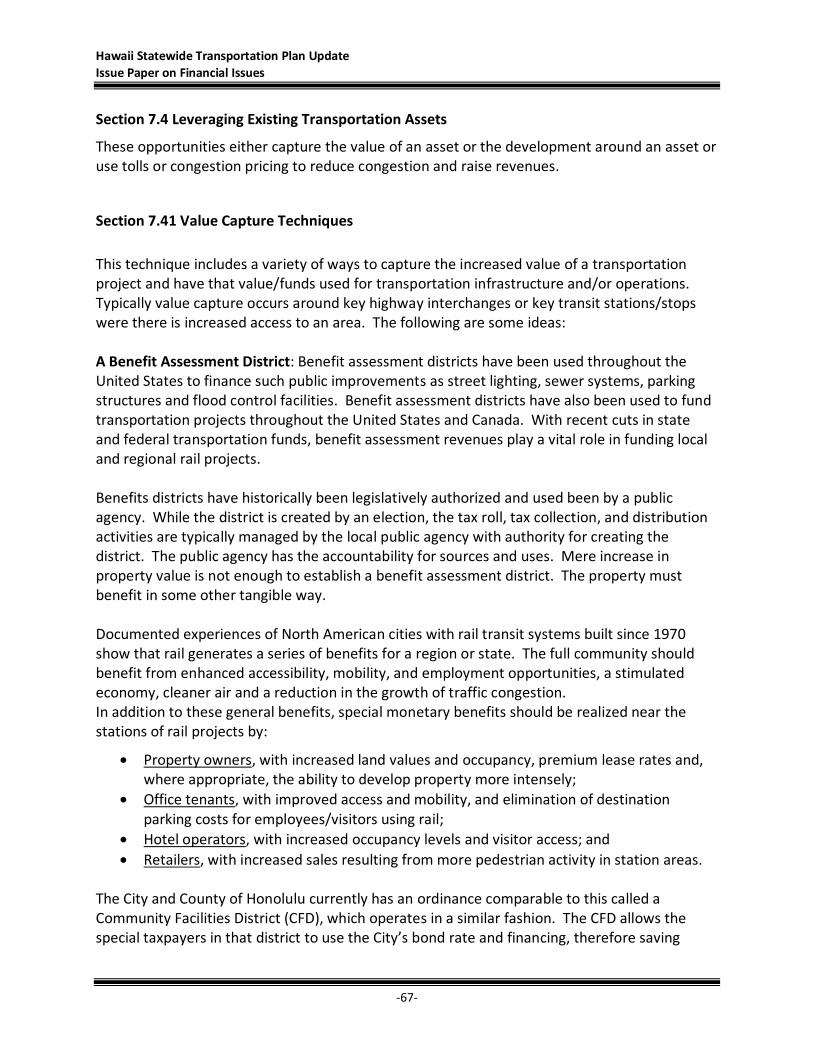
Hawaii Statewide Transportation Plan Update Issue Paper on Financial Issues
-67-
Section 7.4 Leveraging Existing Transportation Assets
These opportunities either capture the value of an asset or the development around an asset or use tolls or congestion pricing to reduce congestion and raise revenues.
Section 7.41 Value Capture Techniques
This technique includes a variety of ways to capture the increased value of a transportation project and have that value/funds used for transportation infrastructure and/or operations. Typically value capture occurs around key highway interchanges or key transit stations/stops were there is increased access to an area. The following are some ideas: A Benefit Assessment District: Benefit assessment districts have been used throughout the United States to finance such public improvements as street lighting, sewer systems, parking structures and flood control facilities. Benefit assessment districts have also been used to fund transportation projects throughout the United States and Canada. With recent cuts in state and federal transportation funds, benefit assessment revenues play a vital role in funding local and regional rail projects. Benefits districts have historically been legislatively authorized and used been by a public agency. While the district is created by an election, the tax roll, tax collection, and distribution activities are typically managed by the local public agency with authority for creating the district. The public agency has the accountability for sources and uses. Mere increase in property value is not enough to establish a benefit assessment district. The property must benefit in some other tangible way. Documented experiences of North American cities with rail transit systems built since 1970 show that rail generates a series of benefits for a region or state. The full community should benefit from enhanced accessibility, mobility, and employment opportunities, a stimulated economy, cleaner air and a reduction in the growth of traffic congestion. In addition to these general benefits, special monetary benefits should be realized near the stations of rail projects by:
• Property owners, with increased land values and occupancy, premium lease rates and, where appropriate, the ability to develop property more intensely;
• Office tenants, with improved access and mobility, and elimination of destination parking costs for employees/visitors using rail;
• Hotel operators, with increased occupancy levels and visitor access; and • Retailers, with increased sales resulting from more pedestrian activity in station areas.
The City and County of Honolulu currently has an ordinance comparable to this called a Community Facilities District (CFD), which operates in a similar fashion. The CFD allows the special taxpayers in that district to use the City’s bond rate and financing, therefore saving

Hawaii Statewide Transportation Plan Update Issue Paper on Financial Issues
-68-
money on interest. However, the other counties and the State of Hawaii do not have similar financing mechanisms. New legislation would have to be passed in order to implement such a program. Joint Development/Transit Oriented Development: Where the state or counties own land around key transportation facilities (e.g., stations, multimodal centers, interchanges), that land can be leased to a private developer for development rights that are compatible with the transportation facility in exchange for lease revenues that the state or counties can use on transportation facilities and/or operations. Transit oriented development often in partnership with private interests creates compatible and synergistic uses of property around stations. The City and County of Honolulu is using this for areas near the Honolulu High Capacity Transit Corridor Station. The County of Hawaii has integrated Transit Oriented Development into its Kona Community Development Plan. The County of Maui is updating its General Plan and considering Transit Oriented Development for its islands.
Section 7.42 Tolls and Congestion Pricing
Tolling an existing facility or tolling a new facility is a way to raise revenue for infrastructure improvements. Currently, the Hawaii Revised Statutes do not allow tolls or congestion pricing, and legislation would need to be enacted to accomplish either of these funding mechanisms. “Congestion Pricing” refers to a category of tools designed to make the best use of a state or local investment in highways, local roads, and parking. While the types of pricing vary, they all share the common characteristic of changing how commuters pay to drive and park. Instead of “free” driving some drivers will pay for expedited trips, for using certain facilities, for entering congested areas, or for parking in high-demand times or areas. The principle is that using any resource in a time of high demand is more costly to all users than in lower demand times and places. Congestion pricing reflects this principle in that some drivers using congested roads in rush hour will pay a fee for doing so, in return for which they obtain an expedited trip or enhanced access – a fee which may be less than their cost of sitting in traffic. Other drivers will choose different times or routes, combine trips, carpool or take transit, and congestion overall is reduced to everyone’s benefit. Both tolls and congestion pricing could be a revenue source for Hawaii transportation infrastructure improvements.

Hawaii Statewide Transportation Plan Update Issue Paper on Financial Issues
-69-
Section 7.5 Innovative Highway Financing Strategies/Tools
These financing strategies are available to states and some for counties as well to better leverage the current funding for infrastructure projects.
Table 2: Innovative Highway Financing Tools and Approaches TOOL APPROACH Cash Flow Approaches Advance Construction Allows states to independently raise
upfront capital required for a project and preserve eligibility for future federal funding for the project. Projects must be designated as advance construction projects to be eligible.
Bond Cost Reimbursement: Grant Anticipation Revenue Vehicle (GARVEE)
State-issued short-term note or long-term bond that uses future federal funds to support payment of principal and interest. Issuance and insurance costs are also eligible. This is generally used in combination with advance construction.
Flexible: Federal Land Management Agency Funds Funds from other federal agencies may count toward the non-federal matching share for recreational trails and transportation enhancement projects.
Flexible: Federal Lands Permits donations of publicly owned property to count toward non-federal match on all federal-aid highway projects.
Flexible: Publicly Owned Land Permits donations of publicly owned property to count toward non-federal match on all federal-aid highway projects.
Partial Conversion of Advance Construction Form of advance construction; state only converts, obligates, or receives reimbursement for part of its funding for an eligible project in a given year. States no longer have to wait until the full amount of obligation authority is available.

Hawaii Statewide Transportation Plan Update Issue Paper on Financial Issues
-70-
TOOL APPROACH Cash Flow Approaches Program Level For STP projects, allows federal share for
funds to be matched across the full program, not on a project-by-project basis.
Tailored (Variable) Match Allows non-federal share to vary over project life, so long as the ultimate matching share is preserved over time.
Tolls and Other Income-Generating Tools Right-of-Way Income
This requires income from right-of-way sales and leases to be used for Title 23 (highway) purposes. States can receive investment credit for certain toll revenue Investment Credits expenditures, which can be applied toward the non-federal matching share of federal-aid highway programs (23 U.S.C. 129).
Leveraging Tools Bonds and Debt Costs, Issuance
Allows states to use federal funds for bond principal, interest “Instrument Financing” costs, and insurance on eligible projects.
Federal Share on Toll Projects
Expanded use of federal funds for toll projects to include construction of new facilities, resurfacing, restoration, and rehabilitation of existing facilities and conversion of free facilities. Private facilities are now also eligible.
Flexible Match
Allows states to apply private donations of materials, labor, or assets and private funds toward the state or local match for federal-aid projects.

Hawaii Statewide Transportation Plan Update Issue Paper on Financial Issues
-71-
TOOL APPROACH Credit Tools Rail Credit Pilot
This provides direct federal loans and loan guarantees for rail and intermodal projects.
State Infrastructure Bank States could allocate up to 10% of their apportionment to capitalize the state bank. Funds can be used to provide loans for projects. This can be structured as a revolving loan fund, where loans are recycled for new projects (23 U.S.C. 190). State infrastructure banks can provide third-party guarantees to projects to ensure that there is sufficient revenue to pay project costs or debt service.
Surface Transportation Credit Program
This provides direct federal loans, loan guarantees, and lines of credit for large surface transportation programs of national significance.
TIFIA (Transportation Infrastructure Finance and Innovation Act of 1998)
A federal credit program under which the U.S. DOT may provide three forms of credit assistance—secured (direct) loans, loan guarantees, and standby lines of credit—for surface transportation projects of national or regional significance. The fundamental goal is to leverage federal funds by attracting substantial private and non-federal co-investment in critical improvements to the nation’s surface transportation system.

Hawaii Statewide Transportation Plan Update Issue Paper on Financial Issues
-72-

Hawaii Statewide Transportation Plan Update Issue Paper on Financial Issues
-73-
Section 8.0 Recommended Approach to Financial Issues in the Hawaii Statewide Transportation Plan Update One of the most critical issues is to create secure, flexible, and sustainable revenues and funding sources for transportation needs. This issue could be a new goal in the Hawaii State Transportation Plan (HSTP) and is supported by the findings in both this issue paper and Issue Paper #8 in this series on Asset Management/System Preservation. There are several objectives that could be proposed to support that goal: Objective 1: Develop a statewide framework for long-range financing forecasting, within the five-year plan update cycle, in order to ensure system sustainability. Distinguish between the system preservation and modernization needs involved in user-financed elements of the system (Harbors and Airports) and the user-tax funded element (Highways and Transit).
• This objective speaks to the need to improve HDOT long-range financial forecasting. • This objective could be supported by efforts to continuously monitor expenditures to
maintain cash flow and ensure sufficient funds, develop projection tools for each modal division and identify ways that HDOT can coordinate and create synergies amongst its Divisions with regards to financial planning and budgeting.
Objective 2: Identify, develop, and secure funding for the needed delivery, maintenance, operation, and rehabilitation, replacement, and expansion of the State’s transportation facilities and services. Include consideration of innovative and non-traditional transportation financing.
• This objective focuses on funding needs. It also includes consideration of innovative and non-traditional transportation financing.
• The Airport Modernization Program, Harbor Modernization Program and (the proposed) Highway Modernization Program are excellent examples of balancing system preservation with expansion needs.
Objective 3: Ensure funding for the safety and security of the State’s transportation facilities and services.
• This objective is a separate emphasis for safety and security and supports the findings made in the SSFM System Preservation issue paper.

Hawaii Statewide Transportation Plan Update Issue Paper on Financial Issues
-74-
Objective 4: Maximize the use of Federal programs and funding for needed transportation infrastructure; and report on project and program achievements on an annual basis.
• This objective reflects the previous HSTP Objective to maximize federal funding. Examples would include: o Seek stable and predictable federal transit formula funding for the County transit
systems. o Support the Federal Authorization of the Surface Transportation Bill.
Objective 5: Achieve project readiness in support of new funding sources as they come available; and report on achievements of project completion on an annual basis.
• This objective focuses on project readiness to take advantage of funding availability • The ARRA and Economic Stimulus programs are excellent examples of maximizing
federal funds through project readiness.

Hawaii Statewide Transportation Plan Update Issue Paper on Financial Issues
-75-
References Bohlinger, Linda, HNTB, in collaboration with Jeffrey Boothe, Holland & Knight, LLP.
Transportation, Legislative Funding and Economic Trends in 18 U.S. States. April 2009 Ewing, Reid, et al. Growing Cooler: The Evidence of Urban Development and Climate Change.
Urban Land Institute. 2008. Federal Highway Administration. Financing the Statewide Plan: A Guidebook. November 1999 Leigh Fisher Associates. Final Report: Airports System Strategic Plan. Prepared for State of
Hawaii, Department of Transportation, Airports Division. November 22, 2002. State of Hawaii Auditor. HDOT Airports Division, An Enterprise Fund of the State of Hawaii,
Financial Statements and Supplemental Schedules, June 30, 2009 and 2008. Prepared by KPMG. March 2, 2010.
State of Hawaii Department of Transportation. Certificate of the Director of Transportation
Providing for the Issuance of State of Hawaii Airports System Revenue Bonds. May 1, 1969, as Supplemented and Amended.
Metropolitan Policy Program, Brookings Institute. The Road…Less Traveled: An Analysis of
Vehicles Miles Traveled Trends in the U.S. December 2008. Metropolitan Policy Program, Brookings Institute. Metro Nation: How the U.S. Metropolitan
Areas Fuel American Prosperity, Blueprint for American Prosperity. 2007. National Surface Transportation Policy and Revenue Study Commission. Transportation for
Tomorrow. December 2007. Transportation Planning Capacity Building Program. Federal Highway Administration. Federal
Transit Administration. The Transportation Planning Process Key Issues: A Briefing book for Transportation Decisionmakers, Officials, and Staff. 2007.

Hawaii Statewide Transportation Plan Update Issue Paper on Financial Issues
-76-
Hawaii Statewide Transportation Plan Update Issue Paper on Financial Issues
-77-
Appendix 1 Federal Surface Transportation Reauthorization Bill Issues9
9 Updated Excerpts from Transportation, Legislative Funding and Economic Trends in 18 U.S. States by Linda Bohlinger, HNTB, in collaboration with Jeffrey Boothe, Holland & Knight, LLP, April 2009.

Hawaii Statewide Transportation Plan Update Issue Paper on Financial Issues
-78-

Hawaii Statewide Transportation Plan Update Issue Paper on Financial Issues
-79-
1.0 Surface Transportation Authorization: The Safe, Accountable, Flexible, Efficient Transportation Equity Act: A Legacy for Users ("SAFETEA-LU") expired on September 30, 2009. The bill was enacted into law in August 2005 after multiple extensions and twenty two months past the expiration date of September 30, 2003. Now the continued extension of SAFETEA-LU beyond its expiration until December 31, 2010, creates a hardship for transportation systems in Hawaii as well as in other states across the nation.
Congressman Oberstar introduced his reauthorization bill in June 2009 but there is no consensus to move it forward. His bill includes the following programs:
• The bill would create a new Office of Intermodalism, which would be charged with implementing projects from a mode-neutral perspective.
• A new office Metropolitan Mobility and Access program would evaluate metropolitan area projects based on population and time travel delay and establish multi-year grant agreements similar to those currently provided under the New Start capital grants process. This program could make it far easier for metropolitan areas to focus their spending on improving transit.
• A Projects of National Significance program would expand an existing federal resource into a series of major competitive discretionary grants that would be awarded to transportation corridors of particularly significance at the national level, not just for a state or region.
• The bill also includes $50 billion for high-speed rail.
• Finally, the Office of Intermodalism would run a new National Infrastructure Bank, which would play a role in funding potentially self-financing projects.
2.0 Continued Delay of the Reauthorization Bill: There are several reasons why the
reauthorization has been delayed, including:
• New Administration Thus, President Obama did not have his team in place to draft legislation that reflects the policies of his Administration until late spring or early summer of 2009. Therefore there was no time to focus on drafting legislation for a new surface transportation authorization bill. For example, the President’s selection of the next Secretary of Transportation, retiring House Member Ray LaHood (R-IL), was not confirmed until spring 2009. The Administrators for the Federal Highway Administration ("FHWA") and Federal Transit Administration ("FTA") were also confirmed later in the year. Moreover, the other high-level HDOT positions were not named or confirmed until late in the 2009 year.

Hawaii Statewide Transportation Plan Update Issue Paper on Financial Issues
-80-
• Highway Trust Fund and Reduced Fuel Tax Revenues The Highway Trust Fund ("HTF") required an additional $8 billion in General Fund support to carry the HTF through FY 2009. However, vehicle miles traveled ("VMT") continue to decline which results in fewer gasoline tax receipts due to less driving. In light of the state of the current economy, the situation could likely get worse before it gets better even as gasoline prices have declined since spring 2008. This situation is exacerbated by increasing fuel economy standards and steady slowing or decline of VMT since 2006 which appears to be unrelated to the price of gasoline.10 Yet, while there is expected to be another need to provide additional funding for the HTF, there appears to be little political will to raise the gasoline tax which has not been raised since 1993 or clear consensus regarding a new funding source to supplement the gasoline tax. Until the funding source is determined and Congress is prepared to adopt it, the policy and programs levels will not fall into place.
• Lack of a Clear Federal Purpose
SAFETEA-LU is remembered for the "Bridge to Nowhere" and the number of project earmarks. Other than project earmarks, there lacked a compelling Federal purpose to grow the program. While there are several candidate issues that may drive the policy for the next surface transportation authorization, none has emerged as the reason that motivates Congress to act on this bill quickly.
3.0 Each of the following, either individually or collectively, could provide a basis for advancing the bill:
• Economic Competitiveness – Surface transportation is essential to the economic health of the nation and the nation faces the prospect of falling behind other nations, such as China, India or Brazil, that are making substantial investments in their infrastructure. Moreover, congestion on the nation's roads, the lack of a freight mobility policy, and the deficiency of the nation's network of bridges, roads, railroads, transit and multi-modal facilities will increase the cost of goods due to delay.
• Climate/Greenhouse Gas Emissions (GHGs) – Surface transportation is responsible for 33% of all GHGs and the bill could be the leading edge of shifting the focus of the surface transportation program to address GHGs. The Brookings Report also shows a shift in travel demand that has a positive impact on GHGs and this shift is due to a change in trip patterns that arises from changing land use and development patterns. There is a successor report to Growing Cooler: The Evidence on Urban Development and
10 Metropolitan Policy Program, Brookings Institute. The Road . . . Less Traveled: An Analysis of Vehicles Miles Traveled Trends in the U.S. December 2008.

Hawaii Statewide Transportation Plan Update Issue Paper on Financial Issues
-81-
Climate Change11 that was published earlier this year which is entitled Going Cooler that further emphasizes the linkages between land use, travel demand and reducing GHGs.
• Metro Areas – The 100 largest metropolitan areas contain 65 % of the nation's population and 68 % of the jobs with the bulk of population growth occurring in the metro areas which emphasizes the importance of metro areas.12 Further, the bulk of congestion occurs in the metro areas. Thus, there is a desire for metro areas to function more efficiently.
• Congestion/Goods Movement – The Transportation for Tomorrow report cites an estimated loss of $78 billion in 2005 due to congestion, a loss of 38 hours travel time, and an additional 26 gallons of fuel due to congestion.13 Moreover, the report highlights a growth in freight traffic of 70 % by 2020 that will further exacerbate congestion if decisions are not made regarding the nation's overall surface transportation network.
4.0 Areas of Consensus: The following are some areas of consensus:
• Metropolitan Mobility Program There is consistent interest in the establishment of a program that focuses on improving mobility in metro areas. This program would address concerns regarding congestion, freight mobility, and importance of metro areas in terms of the nation's economic competitiveness. However, the groups differ on what types of projects should be funded by such a program. The National Surface Transportation Policy and Revenue Commission ("Commission") supports a flexible program for areas above one million in population, the American Association of State Highway and Transportation Officials ("AASHTO") supports the current program while Transportation for America ("T 4 America") would also support a flexible program but after the development of a set of National Transportation Objectives ("NTO's") that would define the outcome measures for new capacity investments. Hawaii’s urbanized area in Oahu would benefit from this program.
• Freight Mobility There is recognition that the nation expects a growing amount of freight traffic and failure to accommodate that growth will affect the nation's competitiveness and cause increasing congestion on the nation's roads. The American Road Builders and Transportation Association ("ARTBA"), AASHTO and the Commission support a federally driven process to select the priority corridors and investments through a merit-based
11 Ewing, Reid, et al. Growing Cooler: The Evidence of Urban Development and Climate Change. Urban Land Institute. 2008. 12 Metropolitan Policy Program, Brookings Institute. Metro Nation: How the U.S. Metropolitan Areas Fuel American Prosperity, Blueprint for American Prosperity. 2007. 13 Report of National Surface Transportation and Revenue Study Commission. Transportation for Tomorrow. December 2007.

Hawaii Statewide Transportation Plan Update Issue Paper on Financial Issues
-82-
approach. T 4 America also supports a focus on freight but would like to see a shift to freight railroads to cut VMT through reduced truck traffic, positively impact oil consumption and cut Greenhouse Gas Emissions (GHGs).
• State of Good Repair
All of the organizations acknowledge that there is a need to maintain the current road and bridge network and most of the organizations support an ongoing effort to maintain the nation's investment in transit systems. Most of the organizations support a consolidation of the Interstate Maintenance, National Highway System, and Bridge programs. Some of the organizations would also include monies currently going towards section 5309 Rail Modernization. AASHTO would also require performance-based measures to assess preservation of road, bridge and transit assets; economic development criteria tied to highway speeds, time necessary to cross borders, bridge clearance for double-stack containers, freight volume; safety; congestion based on hours of delay, travel time index and transit usage and load factors; system operations; and, environmental factors such as storm water management, and transportation-related air quality emissions. These monies would flow by formula to the metro areas and would be flexible monies so that a metro area could determine its priority projects.
• Congestion Mitigation and Air Quality All of the organizations support retaining the Congestion Mitigation and Air Quality Program ("CMAQ") but differ as to the projects that are eligible for funding. While ARTBA supports expansion to single occupant vehicle lanes as long as those projects don't increase criteria pollutants, T 4 America would move in the opposite direction to limit projects to those that reduce air pollution, reduce energy consumption, or for programs that are focused on system management, demand management, or vehicle retrofits.
• Program Funding Many of the groups support increasing the gasoline tax or other funding mechanisms, although no group specifically endorsed the federal Commission's position for a 25-40 cent a gallon increase. There is uniform interest in sustaining the purchasing power of the gasoline tax by indexing it to inflation. There is strong interest in looking to custom taxes, bill of lading fees or container taxes to cover the cost of a freight mobility program. Most organizations also support studying alternative funding mechanisms, such as a weight-mile tax, and most support ensuring that a portion of any revenues generated from climate change legislation are directed to the surface transportation program, but organizations, such as the American Public Transportation Association, wanted to ensure that the monies were in addition to any existing funding sources.
• Tolling and Public-Private Partnerships There is interest in examining expanding the use of tolling as a funding mechanism for the surface transportation program. The Commission and ARTBA support tolling both
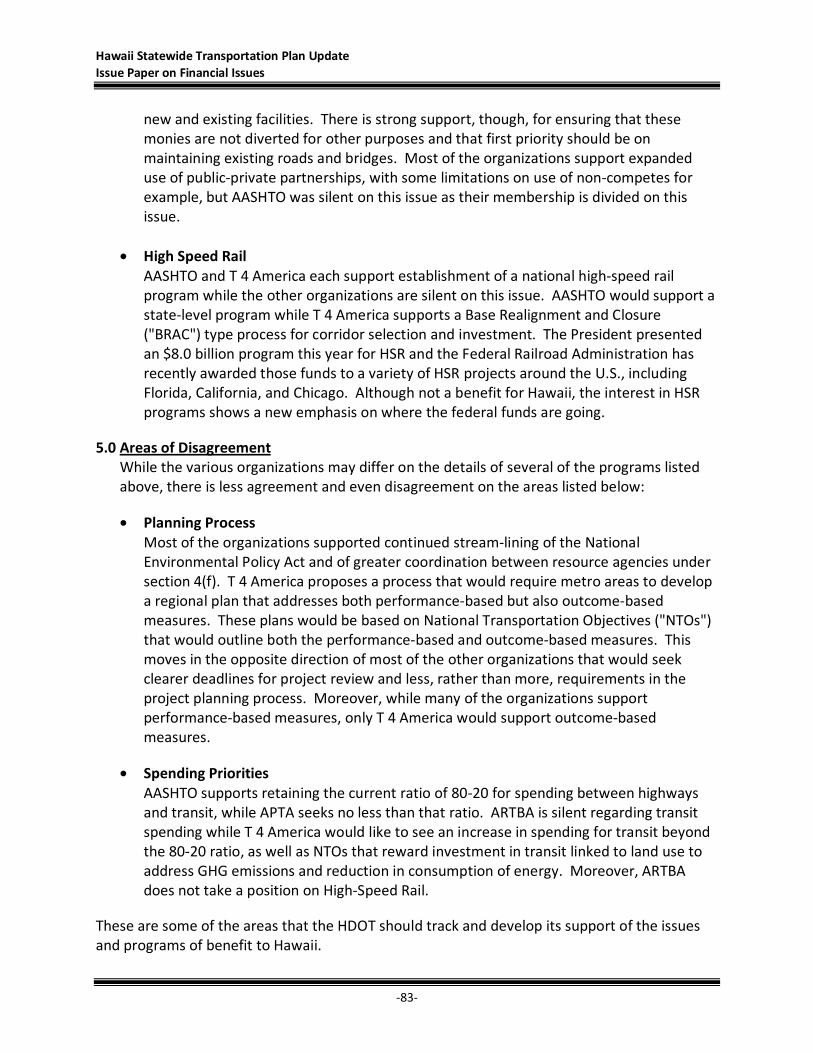
Hawaii Statewide Transportation Plan Update Issue Paper on Financial Issues
-83-
new and existing facilities. There is strong support, though, for ensuring that these monies are not diverted for other purposes and that first priority should be on maintaining existing roads and bridges. Most of the organizations support expanded use of public-private partnerships, with some limitations on use of non-competes for example, but AASHTO was silent on this issue as their membership is divided on this issue.
• High Speed Rail AASHTO and T 4 America each support establishment of a national high-speed rail program while the other organizations are silent on this issue. AASHTO would support a state-level program while T 4 America supports a Base Realignment and Closure ("BRAC") type process for corridor selection and investment. The President presented an $8.0 billion program this year for HSR and the Federal Railroad Administration has recently awarded those funds to a variety of HSR projects around the U.S., including Florida, California, and Chicago. Although not a benefit for Hawaii, the interest in HSR programs shows a new emphasis on where the federal funds are going.
5.0 Areas of Disagreement While the various organizations may differ on the details of several of the programs listed above, there is less agreement and even disagreement on the areas listed below:
• Planning Process Most of the organizations supported continued stream-lining of the National Environmental Policy Act and of greater coordination between resource agencies under section 4(f). T 4 America proposes a process that would require metro areas to develop a regional plan that addresses both performance-based but also outcome-based measures. These plans would be based on National Transportation Objectives ("NTOs") that would outline both the performance-based and outcome-based measures. This moves in the opposite direction of most of the other organizations that would seek clearer deadlines for project review and less, rather than more, requirements in the project planning process. Moreover, while many of the organizations support performance-based measures, only T 4 America would support outcome-based measures.
• Spending Priorities AASHTO supports retaining the current ratio of 80-20 for spending between highways and transit, while APTA seeks no less than that ratio. ARTBA is silent regarding transit spending while T 4 America would like to see an increase in spending for transit beyond the 80-20 ratio, as well as NTOs that reward investment in transit linked to land use to address GHG emissions and reduction in consumption of energy. Moreover, ARTBA does not take a position on High-Speed Rail.
These are some of the areas that the HDOT should track and develop its support of the issues and programs of benefit to Hawaii.

Hawaii Statewide Transportation Plan Update Issue Paper on Financial Issues
-84-


Issue Paper #10 Environmental Coordination:
Linking Planning and Environmental Review
In Preparation for the Hawaii Statewide Transportation Plan Update
Prepared for Department of Transportation
State of Hawaii
Prepared by SSFM International, Inc. With Weslin Consulting Services, Inc.
2011

Hawaii Statewide Transportation Plan Update Issue Paper on Environmental Coordination
-i-
Table of Contents
Foreword ................................................................................................................... 1 Section 1.0 Introduction: Linking Transportation Planning with Environmental Review ................................................................................ 3 Section 2.0 How 2002 HSTP Addressed Environmental Review and Coordination ......... 5 Section 3.0 Hawaii State Laws Related To Planning and Environmental Review ............. 7
Section 3.1 Requirement for Statewide Transportation Planning and for Environmental Review ............................................................................... 7
Section 3.2 Proposed Amendments Regarding EIS Law, Chapter 343 ........................... 7 Section 3.3 Environmental “Significant Effects” Criteria ............................................... 8
Section 4.0 Federal Laws & Regulations Related to Environmental Review and
Coordination ............................................................................................. 11 Section 4.1 National Environmental Protection Act (NEPA) ........................................ 11 Section 4.2 Environmental Laws, Regulations, and Guidance for Land Transportation ................................................................................ 12 Section 4.3 Federal Laws, Regulations, and Guidance for the Airport System ............. 14 Section 4.4 Federal Laws, Regulations, and Advisory Guidance for the Harbors System ............................................................................ 16
Section 5.0 How Environmental Review and Coordination Is Conducted In Other States .............................................................................................. 17
Section 5.1 Colorado Department of Transportation Linking to NEPA ........................ 17 Section 5.2 Colorado DOT Summary: The LPN Approach ............................................ 21 Section 5.3 Washington State DOT Program, “Reinventing NEPA” ............................. 22 Section 5.4 Washington State DOT Summary: Cumulative Effects Guidance .............. 27 Section 5.5 Tennessee Department of Transportation Environmental Evaluation ...... 28
Section 6.0 Environmental Mitigation ........................................................................... 31 Section 7.0 Recommendations for the Hawaii Statewide Transportation Plan (HSTP)
Update ...................................................................................................... 37 References ................................................................................................................. 41 Appendix 1: 2002 HSTP Goal III Statement on Environment and Quality of Life ............. 43

Hawaii Statewide Transportation Plan Update Issue Paper on Environmental Coordination
-ii-

Hawaii Statewide Transportation Plan Update Issue Paper on Environmental Coordination
-1-
Foreword The Hawaii state transportation planning process is being supported by the development of a series of issue papers. Task 7 of the contract requires examination of emerging issues that will have major impacts on Hawaii’s transportation future along with preparation of Issue Papers for each subject. The emerging issues for Hawaii’s transportation were selected by the Hawaii Statewide Transportation Plan Team as issues which may have a significant impact on Hawaii’s residents and their transportation needs. Many emerging issues are associated with the Federal Planning Requirements, changing trends, as well as shifts in public perception. This issue paper addresses the issue of coordinating environmental rules and regulations into transportation planning. SSFM is the lead consultant for the Hawaii Statewide Transportation Plan (HSTP) Update, and they are supported by a team of consultants. This paper’s lead author is Weslin Consulting Services, Inc. This “Issue Paper #10 on Environmental Coordination” includes sections on:
• New Approach to Linking Statewide Transportation Plans and Environmental Compliance
• How the 2002 Hawaii Statewide Transportation Plan (2002 HSTP) treated Environmental Coordination;
• Applicable state and federal laws, rules and regulations; • Best practices from other states; and, • Proposed guidance to be included in the Hawaii Statewide Transportation Plan
Update (HSTP Update). Issue papers in this series include:
Issue Paper #1: Impact of Federal Planning Requirements (Eight Planning Factors)
Issue Paper #2: Climate Change and Sea Level Rise Issue Paper #3: Aging Population and Transportation Issue Paper #4 Fuel and Energy Scenarios for Hawaii Issue Paper #5: Land Use Planning Issue Paper #6: Planning & Design: Context Sensitive Solutions (CSS),
Complete Streets, Smart Growth, and Transit Oriented Development (TOD)
Issue Paper #7: Transportation Security Issue Paper #8: System Preservation and Asset Management Issue Paper #9: Financial Scenarios Issue Paper #8: System Preservation and Asset Management Issue Paper #9: Financial Scenarios Issue Paper #10: Environmental Coordination

Hawaii Statewide Transportation Plan Update Issue Paper on Environmental Coordination
-2-

Hawaii Statewide Transportation Plan Update Issue Paper on Environmental Coordination
-3-
Section 1.0 Introduction: Linking Transportation Planning with Environmental Review Stronger linkages between transportation planning and environmental processes have been sought for some time. In August 2005, when Congress revised the transportation planning laws in SAFETEA-LU (the Federal Safe, Accountable, Flexible, and Efficient Transportation Equity Act – Legacy for Users), it was their intent to encourage changes to 1) embrace environmental factors in planning; 2) consider environmental mitigation activities in state and metropolitan long range transportation plans; and 3) consult with resource and land management agencies regarding conservation plans, maps and resource inventories. These are important and significant changes. The Federal Highway Administration (FHWA) and Federal Transit Administration (FTA) issued their joint final transportation planning regulations implementing these changes in February 2007, providing additional guidance and examples of best practices.1 It is the premise of this Issue Paper that the linkage between the Hawaii Statewide Transportation Plan (HSTP) and environmental compliance is valid and appropriate for all modes, not just Highways or Transit. Airports, Harbors, and Highways face similar issues when satisfying their transportation mission in a manner that ensures environmental protection and compliance with state and federal environmental laws. This issue paper identifies new and improved approaches to environmental compliance, practices that are used elsewhere. Based on actual examples, a new approach is identified for further consideration in Hawaii. The relationship that link planning and the National Environmental Policy Act (NEPA) through consultation with resources agencies is depicted in Figure 1 on the following page, which is borrowed from various training materials.2 Figure 1 is called Linking Planning and NEPA, or LPN. The new approach is a sequential process that starts with the coordination of transportation and land use. Hawaii Department of Transportation (HDOT) is taking environmental coordination seriously. An Environmental Review Training Workshop held August 23-24, 2010, sponsored by HDOT and Hawaii Local Technical Assistance Program (LTAP) brought together over a hundred of HDOT staff; staff from other federal, state, and county
1 United States Department of Transportation. FHWA 23 CFR Parts 450 and 500 and FTA 49 CFR Part 613; Statewide Transportation Planning; Metropolitan Transportation Planning; Appendix A to Part 450 – Linking the Transportation Planning and NEPA Processes. February 14, 2007. 2 Culp, Michael and John Humeston. FHWA, Office of Environment and Planning. AMPO Annual Conference.
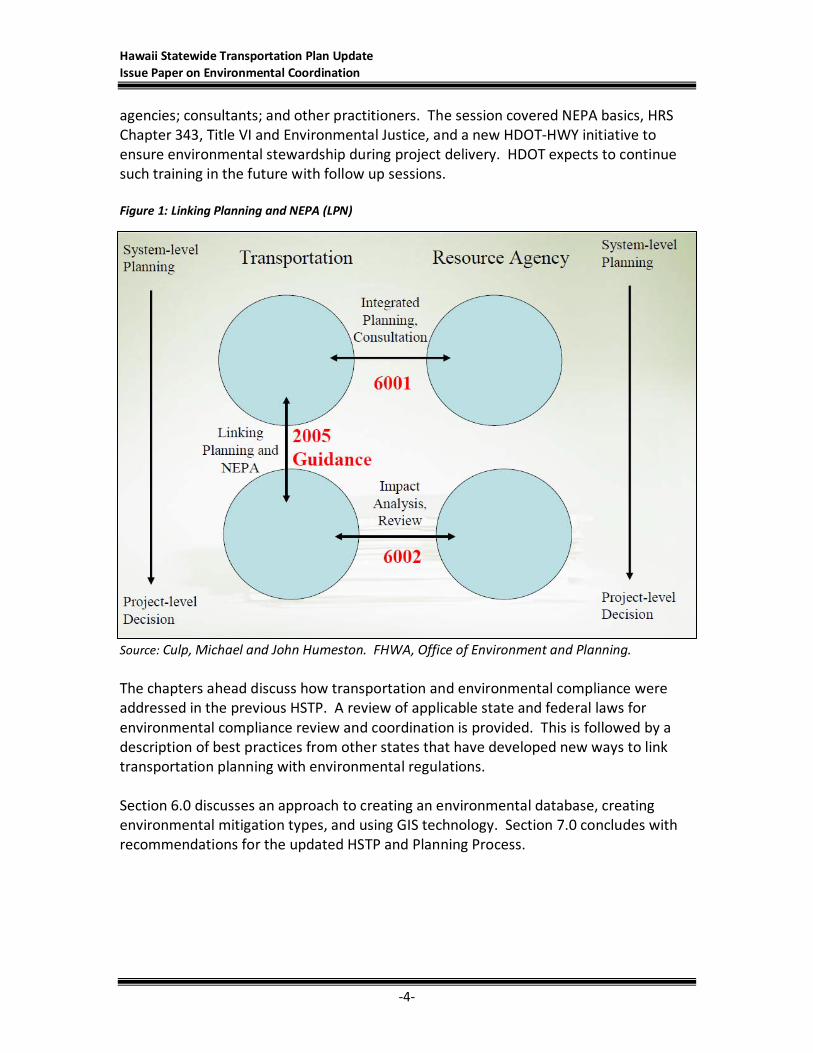
Hawaii Statewide Transportation Plan Update Issue Paper on Environmental Coordination
-4-
agencies; consultants; and other practitioners. The session covered NEPA basics, HRS Chapter 343, Title VI and Environmental Justice, and a new HDOT-HWY initiative to ensure environmental stewardship during project delivery. HDOT expects to continue such training in the future with follow up sessions. Figure 1: Linking Planning and NEPA (LPN)
Source: Culp, Michael and John Humeston. FHWA, Office of Environment and Planning. The chapters ahead discuss how transportation and environmental compliance were addressed in the previous HSTP. A review of applicable state and federal laws for environmental compliance review and coordination is provided. This is followed by a description of best practices from other states that have developed new ways to link transportation planning with environmental regulations. Section 6.0 discusses an approach to creating an environmental database, creating environmental mitigation types, and using GIS technology. Section 7.0 concludes with recommendations for the updated HSTP and Planning Process.

Hawaii Statewide Transportation Plan Update Issue Paper on Environmental Coordination
-5-
Section 2.0 How 2002 HSTP Addressed Environmental Review and Coordination
The Hawaii Statewide Transportation Plan “Setting the Course” issued in 2002 (2002 HSTP) observed that the Federal Transportation Efficiency Act for the 21st Century (TEA-21), its predecessor the Intermodal Surface Transportation Efficiency Act (ISTEA), along with the Clean Air Act amendments have many provisions that discuss content for transportation policies, plans, and programs that are developed and implemented by state and local agencies.3 Federal regulations promulgated to implement TEA-21 required addressing “seven planning factors.” One of the seven requires that the statewide transportation planning process provide for consideration of projects and strategies that will: “Protect and enhance the environment, promote energy conservation, and improve quality of life.” The 2002 HSTP interpreted the requirement as shown in the sidebar.
The 2002 HSTP also treated the “protect environment and conserve energy factor” by adopting the Goal and Objective statements as shown in the sidebar. The complete wording of the 2002 HSTP Goal III may be found in Appendix 1 in this issue paper. The interpretations of the goal and objective statements are a starting point to addressing the environment, but they fall short of the guidance possible from a statewide transportation plan.
3 Hawaii State Department of Transportation. Hawaii Statewide Transportation Plan “Setting The Course.” September 2002. Page 79.
2002 HSTP Interpretation of Federal Planning FactorsD. Federal Planning Requirements
2. Planning Factors d. Protect Environment and Conserve Energy Long-range considerations required to ensure that this planning factor is adequately addressed include air and water quality issues; energy consumption in the development of the plan; livability of communities, including social cohesion, physical connections, urban design, and the potential for growth and growth inducement. The identification of transportation projects to be included in plans should address issues related to environmental impacts, emissions reduction, and preservation and conservation of valuable resources.
Source: 2002 HSTP, Page 81
GOAL III: Protect and enhance Hawaii’s unique environment and improve its quality of life. Objective 1: To provide an air, land, and water transportation system that is environmentally compatible and sensitive to cultural, historic, and natural resources. Objective 2: To ensure that the statewide air, land, and water transportation system supports comprehensive land use policies and livability in urban and rural areas. Source: 2002 HSTP, Pages 45-46

Hawaii Statewide Transportation Plan Update Issue Paper on Environmental Coordination
-6-
Goal III in the 2002 HSTP addresses protection and enhancement of Hawaii’s environment, but there is no clear linkage between the content of the plan, environmental review, and decision making. Addressing this link is important in the next HSTP Update. Integration of transportation planning and the National Environmental Policy Act of 1969 (NEPA) processes was formalized and expanded under SAFETEA-LU and the 2007 FHWA and FTA transportation planning implementation regulations.4 As the 2002 HSTP did not give major attention to planning/NEPA integration, this now needs to be added in the current update. Section 4.0 of this issue paper discusses how SAFETEA-LU has continued making significant changes to the state transportation planning process.
4 USDOT FHWA 23 CFR Parts 450 and 500 and FTA 49 CFR Part 613; Statewide Transportation Planning; Metropolitan Transportation Planning; Appendix A to Part 450 – Linking the Transportation Planning and NEPA Processes. This Appendix is intended to be non-binding and should not be construed as a rule of general applicability.

Hawaii Statewide Transportation Plan Update Issue Paper on Environmental Coordination
-7-
Section 3.0 Hawaii State Laws Related To Planning and Environmental Review Section 3.1 Requirement for Statewide Transportation Planning and for
Environmental Review The state requirement for a Statewide Transportation Plan is found in Hawaii Revised Statutes (HRS) Chapter 279A, Statewide Transportation Planning. The law states, “The plan shall be directed toward the ultimate development of a balanced, multimodal statewide transportation system that serves clearly identified social, economic and environmental objectives,”5 (Emphasis added.) References to environmental considerations applicable to statewide transportation planning may also be found in HRS Chapter 226, Hawaii State Planning Act. This law includes a policy to “Encourage the design and development of transportation systems sensitive to the needs of affected communities and the quality of Hawaii’s natural environment.”6 The Hawaii State Planning Act requires a statewide planning system consisting of state functional plans, including transportation. The Act specifies that the preparing agency shall consider applicable federal laws that impact upon the functional plan area.7 This would imply that federal environmental laws, such as NEPA, should also be considered when preparing any state plan. Hawaii’s policy for environmental coordination is found in HRS Chapters 343 and 344 as well as in Hawaii Administrative Rules (HAR), Title 11, Chapter 200. These laws and implementing regulations establish a system of environmental review to ensure that environmental concerns are given appropriate consideration in decision-making along with economic and technical considerations. Section 3.2 Proposed Amendments Regarding EIS Law, Chapter 343 Amendments to HRS Chapter 343 were proposed by a UH Review Team and introduced during the 2010 regular legislative session in recognition that improvements are needed to Hawaii’s environmental review policy. The review was triggered by Act 1, 2008 Regular Session, which required the Legislative Reference Bureau to contract with the University of Hawaii to conduct a study of the State’s Environmental Review Process.8
5 HRS Chapter 279A-2. 6 HRS Chapter 226-17, Objectives and policies, item (10). 7 HRS Chapter 226-52, Statewide planning system, item (3). 8 Act 1, 2008 Regular Session, HB 2688, HD1 (2008). http://www.capitol.hawaii.gov/session2008/bills/GM444_.PDF

Hawaii Statewide Transportation Plan Update Issue Paper on Environmental Coordination
-8-
Transportation Guidelinesin HRS Chapter 344
(A) Encourage transportation systems in
harmony with the lifestyle of the people and environment of the state;
(B) Adopt guidelines to alleviate environmental degradation caused by motor vehicles;
(C) Encourage public and private vehicles and transportation systems to conserve energy, reduce pollution emission, including noise, and provide safe and convenient accommodations for their users.
The changes proposed in the legislation were deferred to make time for a working group to meet and further deliberate changes.9 A report and revision are expected in the 2011 Legislative Session. Potential issues include: 1) transferring the Office of Environmental Quality Control from the Department of Health to the Department of Land and Natural Resources (DLNR); 2) creating an Environmental Review Special Fund; 3) clarification that the environmental review process is for non-regulatory disclosure to be used by decision-makers when they determine approval, mitigation, or rejection; 4) triggers for when an EIS is rejected; 5) duration or “shelf life” of an EIS; and 6) exclusion of utility or access connections to government-owned roads (current law has a sunset date).10 Section 3.3 Environmental “Significant Effects” Criteria The thirteen significance criteria from HAR Title 11-200-12 used to determine the significance of potential environmental effects are shown on page 9.
The third “significant effect” criteria specifies that an action shall be determined to have a significant effect on the environment when it “conflicts with the state’s long-term environmental policies or goals and guidelines as expressed in Chapter 344, HRS.” Chapter 344 anticipates a transportation system in harmony with the environment, that alleviates degradation caused by motor vehicles, and conserves energy and reduces pollution. Transportation Guidelines from HRS Chapter 344 are highlighted in the sidebar.
9 SB2818 SD2 HD2 Committee on Judiciary report dated March 19, 2010, including written testimony. 10 http://www.capitol.hawaii.gov/session2010/Testimony/SB2818_TESTIMONY_ENE-WTL_02-02-10.pdf

Hawaii Statewide Transportation Plan Update Issue Paper on Environmental Coordination
-9-
Environmental Significant Effects Criteria, HAR Title 11-200 (a) In considering the significance of potential environmental effects, agencies shall consider the sum of
effects on the quality of the environment, and shall evaluate the overall and cumulative effects of an action.
(b) In determining whether an action may have a significant effect on the environment, the agency shall consider every phase of a proposed action, the expected consequences both primary and secondary, and the cumulative as well as the short-term and long-term effects of the action. In most instances, an action shall be determined to have a significant effect on the environment if it:
1) Involves an irrevocable commitment to loss or destruction of any natural or cultural resource; 2) Curtails the range of beneficial uses of the environment; 3) Conflicts with the state’s long-term environmental policies or goals and guidelines as expressed in
Chapter 344, HRS, and any revisions thereof and amendments thereto, court decisions, or executive orders;
4) Substantially affects the economic welfare, social welfare, and cultural practices of the community or State;
5) Substantially affects public health; 6) Involves substantial secondary impacts, such as population changes or effects on public facilities; 7) Involves a substantial degradation of environmental quality; 8) Is individually limited but cumulatively has considerable effect upon the environment or involves a
commitment for larger actions; 9) Substantially affects a rare, threatened, or endangered species, or its habitat; 10) Detrimentally affects air or water quality or ambient noise levels; 11) Affects or is likely to suffer damage by being located in an environmentally sensitive area such as a
flood plain, tsunami zone, beach, erosion-prone area, geologically hazardous land, estuary, fresh water, or coastal waters;
12) Substantially affects scenic vistas and viewplanes identified in county or state plans or studies; or 13) Requires substantial energy consumption. (Eff. 12/6/85; am and comp AUG 31, 1996) (Auth: HRS
343-5, 343-6) (Imp: HRS 343-2, 343-6)

Hawaii Statewide Transportation Plan Update Issue Paper on Environmental Coordination
-10-

Hawaii Statewide Transportation Plan Update Issue Paper on Environmental Coordination
-11-
Classes of Environmental Compliance Actions (Named in NEPA)
• Class I - Environmental Impact Statement (EIS) is
prepared for projects that will cause a significant adverse effect on the environment.
• Class II - Categorical Exclusion (CE) is prepared for projects that cause minimal social, economic or environmental impact;
• Class III - Environmental Assessment (EA) is prepared for larger scale projects that do not meet the requirements for a CE or those for which the significance of the environmental impact is not clearly established. A Finding of No Significant Impact (FONSI) is issued if the environmental analysis and interagency review during the EA process finds a project to have no significant impacts on the quality of the environment. An EIS must be prepared if it is found that the project will have significant impacts.
Section 4.0 Federal Laws & Regulations Related to Environmental Review and Coordination This section of the issue paper identifies federal laws impacting environmental considerations during the statewide transportation planning process. Section 4.1 National Environmental Protection Act (NEPA) NEPA requires federal agencies to consider environmental issues prior to making any major decisions on projects that have federal involvement. NEPA also requires an assessment of environmental impacts and an evaluation of alternatives which avoid or mitigate any identified adverse impacts to the environment. The US Supreme Court has described NEPA as having two major purposes:
• To place upon an agency the obligation of considering every aspect of the environmental impact of a proposed action.
• To ensure that the agency will inform the public that it has considered environmental concerns in its decision-making process.
The three classes of actions determine how compliance with NEPA is attained and documented for transportation projects are shown in the sidebar. The basic tenet of NEPA has remained unchanged since it was signed into law in January 1970. Subsequent environmental laws, Executive Orders, and agency policies and guidelines have been put into place to aid in interpreting the mandates of NEPA and to expand its coverage.

Hawaii Statewide Transportation Plan Update Issue Paper on Environmental Coordination
-12-
Section 4.2 Environmental Laws, Regulations, and Guidance for Land Transportation
The Federal Safe, Accountable, Flexible, and Efficient Transportation Equity Act – Legacy for Users, SAFETEA-LU, passed in 2005. It includes Federal Laws, Regulations, and Guidance for the Highway System as well as provisions intended to enhance the consideration of environmental issues and impacts within the transportation planning process. In particular, SAFETEA-LU requires statewide long-range plans to discuss environmental mitigation opportunities. This mandate imposes a new compliance obligation on statewide plans and provides an opportunity to shift toward a more strategic approach to creating categories for environmental mitigation.11 The environmental discussion now required in a state transportation plan is fundamentally different from the discussion contained in subsequent project level NEPA EA and EIS documents.12 Section 6001 requires “a discussion of types of potential environmental mitigation activities and potential areas to carry out these activities, including activities that may have the greatest potential to restore and maintain the environmental functions affected by the plan.”13
• First, SAFETEA-LU requires that plans “protect and enhance the environment, promote energy conservation and improve quality of life.” At the same time, transportation plans are to “promote consistency between transportation improvements and State and local planned growth and economic development patterns.” These dual factors can be found in the proposed updated Goals and Objectives for the HSTP.
• Second, SAFETEA-LU requires that plans discuss types of potential mitigation
activities and potential areas to carry out activities, “including activities that may have the greatest potential to restore and maintain the environmental functions affected by the plan.” The Statewide Plan must discuss “types” of mitigation activities. It is not necessary to develop specific mitigation measures for individual projects. Instead, the plan should describe, at least in general terms, the approaches that may be used for mitigating impacts. Examples might include wetlands replacement, avoidance of habitat fragmentation, preservation of habitat for endangered species, and other commonly used mitigation methods.14
11 American Association of State Highway and Transportation Officials. AASHTO Practitioner’s Handbook #10, Using the Transportation Planning Process to Support the NEPA Process. February 2008. Page 12. 12 23 C.F.R. § 450.212 (NEPA EIS document as specified in 40 CFR 1502). 13 SAFETEA-LU, Section 6001. 14 23 C.F.R. § 450.104 (“Environmental mitigation activities means strategies, policies, programs, actions, and activities that, over time, will serve to avoid, minimize, or compensate for [by replacing or providing substitute resources] the impacts to or disruption of elements of the human and natural environment associated with the implementation of a long-range statewide transportation plan or metropolitan transportation plan. The human and

Hawaii Statewide Transportation Plan Update Issue Paper on Environmental Coordination
-13-
• Third, SAFETEA-LU requires that these provisions be developed in consultation with “Federal, State and tribal wildlife, land management, and regulatory agencies,” to include comparison of transportation plans to conservation plans on maps as well as to inventories of natural or historic resources.
Section 6002 of SAFETEA-LU concerns environmental review. Best practices for linking planning and NEPA have been identified by the American Association of State Highway and Transportation Officials (AASHTO), a professional organization that provides leadership to State transportation officials. AASHTO Practitioner’s Handbook #10 provides specific guidance on linking planning and the environment.15
AASHTO suggests that a state plan can provide a starting point for projects when defining the purpose and need statement. Examples illustrating some of the ways the statewide transportation planning process can be used to help to define the purpose and need for individual transportation projects follow.16 While these examples relate specifically to linking FTA and FHWA highway modes with the NEPA process, many can be applied to projects by Harbors and Airports.
natural environment includes, for example, neighborhoods and communities, homes and businesses, cultural resources, parks and recreation areas, wetlands and water sources, forested and other natural areas, agricultural areas, endangered and threatened species, and the ambient air. The environmental mitigation strategies and activities are intended to be regional in scope, and may not necessarily address potential project-level impacts.”) 15 AASHTO Practitioner’s Handbook #10. 16 AASHTO Practitioner’s Handbook #10.
AASHTO Illustrative WaysA Strategic Environmental Assessment Approach to Achieve In Planning
Setting System-Wide Performance Goals -- The state planning process can establish performance goals for a specific corridor. These goals can address issues such as reducing congestion, improving safety, increasing transit usage, and reducing fuel consumption. If these goals are identified in the planning process, they can be considered in defining the purpose and need for individual projects. Quantitative targets for congestion, safety, or other factors would help to define the transportation need on facilities that fall short of those targets and define the level of improvement that must be achieved. Making Modal Choices. -- The state planning process can determine the roles for highway, transit, and non-motorized facilities in meeting transportation needs. This overall vision for the network can show where new highway capacity is needed, where new transit capacity is needed, and how the modes complement one another. This can help support the purpose and need for an individual project, by showing how the project fits into the multi-modal vision. If the overall vision and goals are established with good public involvement and interagency consultation, it is reasonable and appropriate for the purpose and need in the NEPA process to focus on a specific mode. Establishing Networks -- The state planning process can define transportation networks consisting of connected transportation facilities that serve a common purpose. For example, some states have begun to develop “high occupancy toll” lane or “strategic highway” connecting major population and employment centers or tourist destinations. If the STP establishes a goal of completing a network, the purpose of an individual project is to implement a portion of that network.
(Continued on Next Page)

Hawaii Statewide Transportation Plan Update Issue Paper on Environmental Coordination
-14-
(Continued) AASHTO Illustrative Ways A Strategic Environmental Assessment Approach to Achieve In Planning
Coordinating Transportation and Land Use Plans -- The state planning process can define how the transportation system will support adopted land use plans and growth objectives. For example, “visioning” or “scenario planning,” can be used to involve the public in considering various possible combinations of transportation and land use choices. This type of process can produce a transportation plan that reflects a community’s vision for both transportation and land use. The plan may reflect a deliberate effort to concentrate future growth in a specific corridor; transportation projects can then be geared toward serving that planned growth. Defining a Role for Non-Motorized Travel --The state planning process can define a role for non-motorized -- pedestrian and bicycle -- travel in meeting transportation needs. For example, if a state or metropolitan area has adopted a plan for a system of recreational trails, the trails plan can help to establish the need to incorporate a trail into a new highway or transit project. This need for a trail can, in turn, provide the justification for any additional impacts associated with including a trail in the project. Establishing a Role for Tolling or Congestion Pricing -- The state planning process can be used to define the role of tolls or congestion pricing in meeting transportation needs, including identification of toll networks and toll corridors or congestion pricing strategies. Tolls and congestion fees can be used to help finance transportation projects and to manage demand. If a state adopts a plan that relies upon tolling as a funding source and/or a demand-management tool, that planning decision can be used as the basis for incorporating tolling into the purpose and need for a specific project. Acceptance in the NEPA Process -- The planning-NEPA linkage guidance specifically addresses the adoption of broad planning goals as the basis for the purpose and need statement for an individual project. If systems-level or other broad objectives or choices from the transportation plan are incorporated into the purpose and need statement for a NEPA document, those should not be revisited to determine whether these are the best objectives or choices among other options. Congress has created the transportation planning process, in statute, as the foundation for Federal transportation investment decisions. Federal agencies need only to review the planning process to ensure that any broad transportation objectives derived from the transportation plan were:
• Based on transportation planning factors established by Federal law;
• Reflect a credible and articulated planning rationale;
• Founded on reliable data; • Developed through a transportation planning process that meets statutory and regulatory
requirements (including public involvement and interagency consultation);
• Documented and included in the NEPA document.
Section 4.3 Federal Laws, Regulations, and Guidance for the Airport System Federal Aviation Administration (FAA) airport grants to state and local agencies started shortly after World War II with the Federal Aid Airport Program. The Airport and Airway Development Act of 1970 established a more comprehensive program. The 1976 act provided grants for airport planning. The Airport and Airway Improvement Act of 1982 established user fees, fuel taxes and other revenue sources to support the Airport
Hawaii Statewide Transportation Plan Update Issue Paper on Environmental Coordination
-15-
Improvement Program which has been continued to this day as a result of several amendments to the original legislation. Grant assurances made part of grant documents include compliance with NEPA as well as consistency with local plans. FAA circulars, such as FAA Advisory Circular 150/5070-6A for Airport Master Plans, provide guidance on significant areas of required compliance. The Airport Environmental Handbook, FAA Order 5050.4A, establishes the instructions and guidance for preparing environmental assessments (EA), findings-of-no-significant-impacts (FONSI) and environmental impact statements (EIS) for proposed federal actions on airport development proposals requiring federal environmental approval. There are over twenty categories of impacts evaluated under this process. FAA maintains databases and publishes forecasts to guide investments. When a state or local agency seeks federal funds for capital projects greater than $5 million, FAA requires a benefit-cost analysis be conducted and NEPA recognizes this approach.17 Regulations make it clear that to assess the adequacy of compliance with section 102(2) (B) of NEPA, non-quantified environmental impacts must also be discussed. Consequently, this approach provides a link between planning and NEPA. The FAA’s plan for the future is called NextGen, The Next Generation Air Transportation System. The plan identifies the goals the FAA has set for technology and program deployment.18 The FAA will undertake a wide-ranging transformation of the entire United States air transportation system. This transformation has the aim of reducing gridlock, both in the sky and at the airports. The FAA already has achieved a number of critical NextGen milestones. They have initiated and expanded satellite-based surveillance, improved airport runway access, increased safety and efficiency on the ground, and enhanced airspace safety and operations. NextGen technologies and procedures, along with airspace redesign, have enabled more direct routes and more efficient operations, which use less fuel and reduce emissions. The FAA uses a strategic Environmental Management System approach to integrate environmental and energy objectives into the planning, decision making and operation of NextGen. The Continuous Lower Emissions, Energy, and Noise Program is managed by the FAA, and it targets partnerships with industry to advance noise and emissions reductions, while improving energy efficiency. The FAA plans to continue to accelerate
17 40 CFR 1502 Sec. 1502.23 Cost-benefit analysis. 18 FAA’s NextGen; Implementation Plan; March 2010; page 5.
Hawaii Statewide Transportation Plan Update Issue Paper on Environmental Coordination
-16-
the certification and implementation of sustainable alternative fuels for use by aircraft fleets, such as the algae fuel being tested in Hawaii. By 2018, NextGen aims to reduce flight delays by about 21 percent, and to provide $22 billion in cumulative benefits. During this same period, they expect to save more than 1.4 billion gallons of fuel from air traffic operations, cut carbon emissions by nearly 14 million tons. Many people are expected to benefit from NextGen. Hawaii Airport Planning should integrate with the environmental goals and programs of NextGen. Section 4.4 Federal Laws, Regulations, and Advisory Guidance for the Harbors System Harbors Division planning must interface with a wide range of federal agencies and programs. Federal involvement in the maritime transportation system is dispersed among more than a dozen agencies and cabinet-level positions. Federal marine law related to protecting the environment predates NEPA. For example, the Oil Pollution Act of 1924 is enforced by the Coast Guard. The Coast Guard’s environmental responsibilities have grown over time commensurate with the growing priority of environmental protection. The National Oceanic and Atmospheric Administration (NOAA) provides the Coast Guard with technical information and scientific expertise. NOAA has an important role in protecting the environment and administering the National Marine Fisheries Service. NOAA provides environmental guidance to ports. The coastlines are managed by the state with financial assistance administered through NOAA’s Coastal Zone Management Program. NOAA must be consulted when actions disrupt coastal wetlands or habitats. The US Army Corps of Engineers is called upon to review proposed projects that can have environmental impacts on navigable waters. Two Federal Regulations deal with environmental permitting. Section 10 of the Rivers and Harbors Act of 1899 requires that a Department of the Army (DA) permit be obtained from the US Army Corps of Engineers (Corps) prior to undertaking any construction, dredging, and other activities occurring in, over, or under navigable waters of the US. Navigable waters in this region are the Pacific Ocean and other waterbodies (or portions thereof) influenced by tides. Work or structures may include, but are not limited to, dredging, breakwaters, bank stabilization, beach nourishment, piers, boat ramps, and mooring buoys. Section 404 of the Clean Water Act (Section 404) of 1972 requires that a DA permit be obtained for the discharge (placement) of dredge and/or fill material into waters of the US, including wetlands. EPA is responsible for NEPA and has other roles involving federal legislation impacting harbors. EPA shares responsibility, or has sole implementing authority, for many other federal acts involving harbors such as the Clean Water Act and the Endangered Species Act.

Hawaii Statewide Transportation Plan Update Issue Paper on Environmental Coordination
-17-
Section 5.0 How Environmental Review and Coordination Is Conducted In Other States Candidate states reviewed for their treatment of environmental coordination were Colorado, Florida, Idaho, Illinois, Louisiana, Minnesota, New York, North Carolina, Oregon, Pennsylvania, Tennessee, Texas, Washington, and Wisconsin. These states were identified because they had been included in previous research papers on environmental coordination, partnerships, planning, process, regulatory or mitigation best practices.19 Colorado and Washington were selected to be addressed by the issue paper because they were the most widely referenced and consistently acclaimed. These states use the best practices in linking environmental policy with planning. Tennessee has been included as an example of a state that has a clear procedure established for review of environmental effects, but with no apparent link to planning. Section 5.1 Colorado Department of Transportation Linking to NEPA The Colorado Department of Transportation (Colorado DOT) has established an environmental coordination program which links planning and NEPA.20 This program is called Linking Planning and NEPA or LPN. Colorado DOT found many benefits to including greater emphasis on environmental considerations at the planning stage. These benefits include reducing time spent in the NEPA process, providing clarity for public input, engaging resource agencies early through the use of one cohesive planning and NEPA process including new environmental mitigation activities and new consultation activities. The Colorado DOT program addresses how data, analyses and products gathered during the transportation planning process can be incorporated into the project-level environmental review processes. The program is intended to address the environmental consultation and mitigation requirements of SAFETEA-LU. Colorado DOT uses a series of conceptual diagrams to illustrate their program seven phased project delivery system. This is diagramed in Figure 2 on the next page. The first two boxes in each line illustrate the Long Range Plan and State Transportation Improvement Program phases required by Federal law to set transportation direction
19 Sources included: 1) AASHTO. Best Practices in Environmental Partnering – Raising the Bar, AASHTO Case Studies. 1999. 2) AASHTO. Environmental Success in Transportation Project Development. 2001. And 3) http://www.environment.fhwa.dot.gov/integ/practices.asp. 20 Colorado Department of Transportation’s interactive “Linking Planning and NEPA Training” website is the source for the description of the program and the graphics depicted in Figures 1, 2 and 3. See: http://www.dot.state.co.us/environmental/Training/NEPA

Hawaii Statewide Transportation Plan Update Issue Paper on Environmental Coordination
-18-
and guide decisions. The plan includes goals that describe a vision of the ideal transportation system. The plan also includes policies for achieving the highest-priority components of the vision. The second set of boxes addresses project initiation and NEPA Phases. Figure 2: Colorado Department of Transportation Linking Planning and NEPA (LPN)
LPN joins these first four phases. The planning process and the environmental assessment required during project development work in tandem with LPN. The results of the transportation planning process feed into the NEPA process. Colorado DOT explains that much of LPN is the effort to increase the amount of information and complexity of decisions being considered at the sub-area planning level.

Hawaii Statewide Transportation Plan Update Issue Paper on Environmental Coordination
-19-
Figure 3 illustrates how the planning process is a continuous cycle. At any given time there are multiple needs or projects at each step in the transportation planning process represented by the inner cycle in the diagram.
Figure 3: Colorado Department of Transportation Linking Planning and NEPA Concept Diagram
The process begins with corridor or sub-area visions and goals, consistent with the long term or strategic plan. Corridors are described, strategies developed, the public consulted and mitigations identified. The outer cycle of the diagram represents the NEPA process. The purpose and need is described, the project area described, a reasonable range of alternatives defined, the public is involved and mitigation strategies are developed. According to Colorado DOT, consideration of environmental factors during planning has typically been very limited. With the passage of SAFETEA-LU requirements for consultation and environmental considerations in the planning process are greatly expanded. Colorado DOT suggests that corridors (or sub-areas) be described in the planning process to better link planning and NEPA. The more robust the sub-area description, the more useful it can be during the NEPA process. Sub-area level planning provides more accurate predictions of impacts, encourages more accurate project budgeting and provides a basis for better determinations of the estimated time required for project development.

Hawaii Statewide Transportation Plan Update Issue Paper on Environmental Coordination
-20-
Colorado DOT suggests that sub-areas may benefit from developing particular strategies that will meet planning goals. Analysis of various strategies for meeting sub-area goals is intended to develop a clearer vision of transportation improvements that may be considered within the sub-area including analysis of modes. Colorado DOT identifies the benefits and risks of linking planning and the NEPA process as a benefit to effective decision-making. This is shown in Figure 4.
Figure 4: Colorado Department of Transportation Effective Decision-Making Concept Diagram
Effective Decision Making is a description of the thought process used while considering complex information for developing solutions to problems by:
• Identifying the problem to be solved; • Identifying the applicable constraints on an appropriate solution; • Identifying and evaluating alternatives; and • Developing the details for a final solution.
This process emphasizes understanding the nature of the problem to be solved and the context of the solution before alternatives are identified strengthening the rationale for the purpose and need of the ultimate project to be identified. Only alternatives which actually address the problem, and which can be implemented given specified criteria, are considered. Figure 4 portrays a model of an effective decision-making process that starts with a divergent thought process, and then seeks out the full range of applicable solutions. Once a full range has been developed, a convergent process, which evaluates the alternatives and identifies the best solution, is used to identify the final decision.

Hawaii Statewide Transportation Plan Update Issue Paper on Environmental Coordination
-21-
Section 5.2 Colorado DOT Summary: The LPN Approach Colorado DOT identifies the following benefits of the LPN approach:
• Long-range planning develops the “purpose and need” and foundation for alternatives analysis required by NEPA. This reduces time spent in the NEPA process. Multiple projects in the sub-area may use the same purpose and need and criteria for screening alternatives.
• Provides clarity for public input in framing purpose and need related criteria for local agencies, planning partners and general public. Engages interested parties on what public involvement is intended to achieve early in the process; enhances public understanding of the overall process; and, keeps public interested in the process.
• Sub-areas at the planning stage include early discussion and involvement that will be useful later in the NEPA process. Engages policy makers and the public early in transportation discussions and reduces potential for later conflicting goals by identifying transportation system deficiencies, identifying transportation functions, developing sub-area strategies and developing mitigation strategies.
• Eliminates duplication of planning and NEPA processes by using environmental data acceptable in the NEPA process, documenting decisions and processes, and engaging resource agencies early through the use of one cohesive planning and NEPA process;
• Supports federal transportation guidance and federal NEPA law that encourage building on decisions and information developed during the planning process.
• Develops a process for meeting new SAFETEA-LU requirements for the planning process, including new environmental mitigation activities and new consultation requirements.
• Encourages environmental stewardship by involving transportation planning groups in environmental stewardship activities and providing early opportunity to avoid potential environmental impacts.
• Identifies fatal flaws early in the process thereby reducing time and money spent on projects where environmental resources may create fatal flaws in project design or implementation.
• Improves project delivery by reducing time spent on project environmental reviews; reducing costs on project environmental reviews and develops more accurate project cost forecasting through the use of better information on potential environmental issues and better information on potential resource agency needs.
• Improves Transportation Management Area regional planning project-oriented process by providing better opportunity for network management as opposed to project list development.

Hawaii Statewide Transportation Plan Update Issue Paper on Environmental Coordination
-22-
Section 5.3 Washington State DOT Program, “Reinventing NEPA” Like Colorado, the Washington State Department of Transportation (Washington DOT) supports conducting planning-level studies that can be relied upon in determining the scope of later NEPA studies.21 Washington DOT has been working with other agencies to make planning studies useful to subsequent NEPA analysis of specific projects. Washington DOT avoids recycling NEPA issues in project development that can be more appropriately dealt with in planning. Examples are: purpose and need for system improvements; general improvement or corridor locations; consistency with transportation, land use and economic development plans; and natural resource protection and management plans. Washington DOT uses corridor or subarea planning studies as the appropriate level of planning to implement linking planning and NEPA. Washington DOT has determined that identifying the transportation needs of a corridor or area in detail should be done in corridor or subarea studies rather than in the statewide transportation policy plan.
Figure 5: Washington Department of Transportation Decision-Making Process for the I-405 Corridor Program
21 Letter to the USDepartment of Transportation from the Washington State Department of Transportation. August 29, 2006. Attachment: Linking Planning and NEPA, page 1.

Hawaii Statewide Transportation Plan Update Issue Paper on Environmental Coordination
-23-
The I-405 Corridor Program was a national pilot study for the “Transportation Decision Making Process Improvement.”22 This pilot decision-making process (typically referred to as “Reinventing NEPA”) was jointly sponsored by Washington DOT, FHWA, and FTA. It involved a comprehensive and independent decision-making process including a Steering Committee, Citizens Committee, Executive Committee, and the public as shown in Figure 5. It was developed to evaluate and improve the application of the NEPA process. The Reinventing NEPA process moves NEPA decision-making to the early stages of long-range planning for transportation projects. It seeks to ensure early participation of affected regulatory agencies and jurisdictions by introducing a series of coordination and consensus points at key milestones and decision dates throughout the environmental analysis, documentation, and review process. These process improvements are expected to provide a longer window within which to resolve environmental issues, the potential for a greater range of environmental solutions, and improved certainty that decisions will not have to be revisited later during project development and permitting. An excellent example of this preferred approach is the I-405 Corridor Program covering the subarea shown in Figures 6 and 7. The I-405 Corridor Program first developed a programmatic EIS which is differentiated from a project-level EIS, which is much more detailed. A programmatic EIS focuses on broad corridor or area-wide issues related to travel mode and transportation system performance. This enables program decisions focusing on mode choice, corridor selection, general location of improvements, and how combinations of improvements may function together as a system to solve regional travel transportation problems. Many project details need not be specified since they are not meaningful in evaluating effects on mobility and environmental quality across a large geographic area. Subsequently, specific design details or precise footprints for each of the nearly 300 individual transportation improvements are determined, so long as they are consistent with the established programmatic objectives. The I-405 Corridor Program EIS examined the broad corridor-wide issues related to mode choice, general location of improvements, and how combinations of improvements may function together as a system to solve corridor-wide transportation problems. Programmatic analysis was appropriate and necessary at the early stage in the transportation planning and decision-making process, when many project-level 22 I-405 Corridor Program Final EIS, Summary, page S-2.

Hawaii Statewide Transportation Plan Update Issue Paper on Environmental Coordination
-24-
design details are not meaningful in evaluating effects on mobility, transportation performance, and environmental quality across such a large area. The I-405 Corridor Program programmatic analysis was consistent with the intent of NEPA, which specifically provides for a broader EIS to be prepared for a program, followed by a subsequent EIS or other environmental assessment prepared for an action included within the overall program.23 This approach may be appropriate for environmental analysis and documentation for different stages of an action.24 In either case, it allows lead agencies to bring focus to the issues that are ripe for decision and to exclude from consideration issues that are premature.
Figure 6: Washington Department of Transportation I-405 Corridor Program Project
The I-405 Corridor Program identified the “best mix” of modal solutions, transportation investments, and demand management which would improve movement of people and goods throughout the I-405 corridor, reduce foreseeable traffic congestion, and thus satisfy the overall program purpose and need.
23 40 CFR 1502.20 24 40 CFR 1508.28

Hawaii Statewide Transportation Plan Update Issue Paper on Environmental Coordination
-25-
Figure 7: Washington Department of Transportation
I-405 Corridor Program Corridor

Hawaii Statewide Transportation Plan Update Issue Paper on Environmental Coordination
-26-
The I-405 Corridor Program range of proposed improvements included: • Implement an enhanced transportation demand management (TDM)
program; • Expand the capacity of the existing local bus transit system; • Implement new bus rapid transit within the corridor; • Implement new fixed-guideway high-capacity transit (HCT) within the
corridor; • Expand the capacity of the existing I-405 freeway; and • Expand the capacity and improve the continuity of the adjacent arterial
network. Implementation of the proposed actions involves a cooperative effort involving over 30 agencies that have responsibilities for planning, regulating, and implementing transportation improvements in the 250+ square-mile corridor. The intent is to reverse the decreasing reliability of the regional transportation system and mobility for users. The central Puget Sound region serves as an important freight gateway to Pacific Rim countries. Automobiles, forest and agricultural products, communications and computer equipment, and hundreds of other items continuously move over the region’s roadways and railroads, to seaports and airports. Products shipped by truck across I-90 from the region’s ports and airport reach points north and south of Seattle via I-405. Substantial delay as a result of transportation system congestion is costing the region’s businesses nearly $700 million a year, according to information from WSDOT. The cost to the freight industry itself is estimated to be around $200 million per year. Success of the cooperative sub-area planning achieved with the I-405 Corridor Program can be partially attributed to 1990 legislation for commute trip reduction. In 1990, Washington became the eleventh state to adopt a program to regulate patterns of urban growth, the Growth Management Act or GMA.25 In 1991, it followed with legislation to regulate existing commuter travel by single occupant vehicles, the Commute Trip Reduction, or CTR law.26 The GMA of Washington relies on the adoption of local comprehensive plans and ordinances to achieve goals. No matter the mechanism, all statewide planning programs in the United States seek to achieve similar goals: control future growth through developing uniform and enforceable goals and priorities; compact development – controlling “sprawl”; consistency among state agencies, regional and local plans, and development regulations; concurrency – ensuring infrastructure is in place concurrent with growth; and, environmental protection.
25 Brian Bigler, WSDOT. “Growth management in Washington State: transportation concurrency, induced growth and Endangered Species Act indirect effects.” Proceedings of the 2003 International Conference on Ecology and Transportation. Page 659. 26 RCW (Revised Code of Washington) 70.94.521-551.

Hawaii Statewide Transportation Plan Update Issue Paper on Environmental Coordination
-27-
Section 5.4 Washington State DOT Summary: Cumulative Effects Guidance There are three types or categories of effect (or impact) that must be considered during the NEPA process: direct, indirect, and cumulative.27 Identifying direct effects is relatively simple and straightforward. Identifying and analyzing indirect effects, which are effects caused by transportation project activities, that occur later in time, at some distance from the project, and are in the chain of cause-and-effect relationships, can be more complex and generate more disagreement. But as complex as indirect effects may be, the cumulative effects analysis generates the most complex and contested issues and is easily the most misunderstood. New guidance was developed jointly by Washington DOT, FHWA, and EPA based on recent cumulative effects guidance issued by Texas DOT (2006) and California DOT (2005). The intent of the new procedures is to improve identification of cumulative effects prior to the start of NEPA using the new SAFETEA-LU expectations in Section 6001 to better link planning and NEPA processes. The 2008 Washington DOT guidance attempts to clarify the requirements for cumulative impact analysis. Cumulative impacts are the summation of impacts on a resource resulting from the incremental impact of the action when added to other past, present, and reasonably foreseeable future actions regardless of what agency (federal or non-federal) or person undertakes those actions. Cumulative impacts can result from individually minor but collectively significant actions taking place over a period of time. This category of effects has generated numerous national legal challenges to transportation projects during the past few years. Therefore, it is important that both indirect and cumulative effect analyses be conducted in an efficient, consistent, legally defensible, and logical manner. This is best achieved by having a strong link between planning and environmental review. The goal of the analyses and documentation is to foster good decisions and enable effective public participation. Washington DOT concluded there is no single formula available for determining the appropriate scope and extent of a cumulative impact analysis. Ultimately, the practitioner must determine the methods and extent of the analysis based on the size and type of the project proposed, its location, potential to affect environmental resources, and the health of any potentially affected resource. However, agreement was reached that potential cumulative impacts should be considered as early as possible. A cumulative impact analysis builds upon information derived from direct and indirect impacts. This makes it tempting to postpone the identification of cumulative impacts 27 40 C.F.R. §1508.25

Hawaii Statewide Transportation Plan Update Issue Paper on Environmental Coordination
-28-
until the direct and indirect impact analyses are well under way. However, early consideration of cumulative impacts may facilitate the design of alternatives to avoid or minimize impacts. Therefore, Washington DOT concludes that consideration of cumulative impacts should occur at the earliest planning stage possible. Like Colorado, Washington DOT concluded that early consideration of cumulative impacts should occur at the earliest planning stages. Section 5.5 Tennessee Department of Transportation Environmental Evaluation The Tennessee Department of Transportation (TDOT) project development approach provides for early and ongoing consideration of the environmental effects of state-funded projects for which NEPA does not apply. State-funded transportation projects that require the acquisition of right-of-way or the construction of roadways and other transportation facilities are subjected to a rigorous environmental review. This review is documented in a Tennessee Environmental Evaluation Report (TEER) that is made available for public review. This approach appears to be comparable to the one recently unveiled by HDOT-HWY. The TDOT approach to evaluating state-funded projects includes early identification and evaluation of potential environmental consequences, consultation with affected agencies and the public, and the development of measures to avoid, minimize, and/or mitigate the adverse effects of state-funded projects on the natural and human environments of Tennessee. Approval of the environmental evaluation rests with the Commissioner of Transportation.28 A TEER is prepared for a state-funded transportation project that meets both of the following criteria:
• Is a transportation route (including a bridge project); and • Requires acquisition or disturbance of at least one acre of new or additional
right-of-way, unless there are special circumstances that would necessitate the preparation of a TEER for a project with less than one acre of property acquisition.
28 The TDOT Environmental Procedures Manual (adopted April 16, 2007) which outlines the NEPA and TEER process is available for viewing and/or download on the TDOT website at: http://www.tdot.state.tn.us/environment/tepm.htm

Hawaii Statewide Transportation Plan Update Issue Paper on Environmental Coordination
-29-
Special circumstances that would result in the need to prepare a TEER under the second criterion listed above include, but are not limited to, the following:
1) Displacement of any commercial or residential occupants;
2) The use of land from a property or district that is listed on or eligible for listing on the National Register of Historic Places or a National Historic Landmark, which would cause an adverse effect to that resource;
3) The use of land from a public park or recreation area, designated forest, or wildlife management area;
4) Work that requires a US Coast Guard construction permit, or an individual Corps of Engineers Section 404 Permit;
5) Construction in, across, or adjacent to a river designated as a component of the National System of Wild and Scenic Rivers or high quality streams, including streams designated as Outstanding National Resource Waters (ONRW), as designated by Tennessee’s water quality standard;
6) Work encroaching on a regulatory floodway or work affecting the base floodplain (100-year flood) elevation of a water course or lake;
7) Work in wetlands;
8) Change in access control;
9) A known hazardous materials site within the proposed right-of-way;
10) An adverse effect to federal or state designated threatened or endangered species or their critical habitat; or
11) A formal request for the preparation of a TEER is received from a local citizen, group, or organization, and the request is based on identified environmental concerns.
Once it is determined that a TEER is necessary, there are a series of steps that are required to conduct the evaluation. The length of time and the number of steps required to conduct the environmental review process are dictated by the size or complexity of the project, the level of controversy and the amount of coordination necessary. Early coordination with other federal, state and local agencies and with the public is an essential ingredient in the project development process for transportation projects in Tennessee, whether they are federally or state-funded. Early coordination is helpful in developing the project’s purpose and need, determining alternatives, and identifying issues of concern, the scope of the environmental resources that would be affected by the project, permit requirements, possible mitigation measures, and opportunities for environmental enhancements.

Hawaii Statewide Transportation Plan Update Issue Paper on Environmental Coordination
-30-
For major TEER projects, TDOT incorporates the process outlined in the Tennessee Environmental Streamlining Agreement. This includes the development and implementation of a project coordination plan to identify lead agency responsibilities and the process for providing the public and other agencies opportunities for input. Much of the information that needs to be gathered and analyzed for a state-funded transportation project and to complete the TEER documentation is similar to the information needed to complete a NEPA document. However, there appears to be no requirement to link project development at the TEER stage with any state planning requirements or practices.

Hawaii Statewide Transportation Plan Update Issue Paper on Environmental Coordination
-31-
Section 6.0 Environmental Mitigation Federal law now requires that environmental mitigation opportunities must be discussed in statewide plans. This mandate provides an opportunity to shift toward a more strategic approach to identifying environmental mitigation measures. SAFETEA-LU’s requirement for a discussion of the types of potential environmental mitigation activities and potential areas to carry out these activities is one that requires research on environmentally sensitive areas with agencies such as the Department of Land Use and Natural Resources Division of Forestry and Wildlife, the Department of the Interior’s US Fish & Wildlife Service, Army Corps of Engineers, and others. While traditionally a strong preference has existed for environmental impact statements with an “on-site, in-kind” approach to mitigation, a shift is occurring toward a more strategic environmental assessment approach. Mitigation sites for a watershed or ecosystem have been endorsed by FHWA and several other Federal agencies for use in transportation projects.29 Initial steps include identifying the natural resources, environmental constraints, habitat, and other special features. The Island of Hawaii is used as an illustrative example. 30 The threatened and endangered plant classification zones on the Island of Hawaii are shown in Figure 8. Figure 9 shows known critical plant and animal habitats on the island while Figure 10 shows aquatic areas. The major HDOT airport, harbor, and highway facilities are overlaid on the same maps. Maps such as those presented in Figures 8, 9, and 10 for the Island of Hawaii can be used to match with possible types of mitigation activities.31 These might include strategies, policies, programs, actions, and activities to avoid, minimize, or compensate for the impacts to the human and natural environment. The environmental mitigation strategies and activities would be regional in scope and may not address all potential project impacts. 32 Example mitigation measures might include wetlands replacement, avoidance of habitat fragmentation or preservation of habitat for endangered species.33 Unique native ecosystems which may not have listed species, freshwater stream systems on all Islands that have a native component that could be affected. For 29 Brown, Janice W. An Ecosystem Approach to Developing Infrastructure Projects. April 2006. 30 See: Hawaii Statewide Transportation Plan Work Task 4.5, GIS Layers for Transportation, July 2010 for further information on sources, applications and benefits. 31 Two wetland layers are available for aquatic resources from Fish & Wildlife dated 1992 using data from the National Wetland Inventory. The metadata consists of one data line layer (i.e. streams or drainages) and a second polygon layer (i.e. wetlands, ponds). Data from http://www.fws.gov/wetlands/ may be used for planning purposes. 32 See: Environmental Mitigation In Transportation Planning; FHWA; October 2009; page 6 and NCHRP 25-22; 2000; for different technologies to improve environmental considerations in transportation planning. 33 The Pacific Islands Fish and Wildlife Office is using data from the Hawaii Biodiversity Mapping Program. http://hbmp.hawaii.edu/hbmp/.

Hawaii Statewide Transportation Plan Update Issue Paper on Environmental Coordination
-32-
example, cave systems on the Islands of Hawaii and Kauai and anchialine pool systems on the Islands of Hawaii, Maui and Oahu are areas that could be included for potential environmental mitigation. Environmental constraint and mitigation lends itself well to using GIS Technology. A project may use GIS to identify appropriate native vegetation to use in re-vegetation mitigation or to identify where projects might have a greater propensity to attract species of concern, or to identify and map seasonal restrictions on construction lighting. Clean Water Act MOU on Mitigation in Hawaii The Clean Water Act, Section 404, requires a NEPA integration process. In Hawaii, a 1994 Memorandum of Understanding (MOU), covering surface transportation projects was signed by US Fish and Wildlife Service, NOAA, National Marine Fishers Administration, Army Corps of Engineers and EPA along with HDOT and OahuMPO.34 The Section 404 MOU covers all actions that involve discharge, dredging, or fill in waters of the US. A discharge permit is required to ensure the “Least Environmentally Damaging Practicable Alternative” (LEDPA) is used. Clean Water Act mitigation requirements include:
• All aquatic resources are subject to mitigation • Avoidance and minimization first, then compensation for unavoidable impacts • Require compensation commensurate with amount and type of impacts • Mitigation types include: Restoration, Enhancement, Establishment, and
Preservation The mitigation preference hierarchy includes:
• Mitigation bank credits • In-lieu fee program credits • Permittee response for watershed approach • On site – in-kind mitigation • Off site-out-of-kind mitigation
Twelve components of a mitigation plan:
1) Objectives 7) Monitoring 2) Site protection instrument 8) Financial Assurances 3) Baseline info 9) Site Selection Factors 4) Work Plan 10) Credit Determination 5) Maintenance Plan 11) Long Term Management Plan 6) Performance Plan 12) Adaptive Management Plan
34 USDOT FHWA “Memorandum of Understanding, NEPA, Clean Water Act Section 404 Integration Process for Surface Transportation Projects in the State of Hawaii.” http://www.fhwa.dot.gov/agreements/divisions/hidiv02agr.htm

Hawaii Statewide Transportation Plan Update Issue Paper on Environmental Coordination
-33-
Figure 8: Threatened & Endangered Plant Classification Zones
For the County of Hawaii
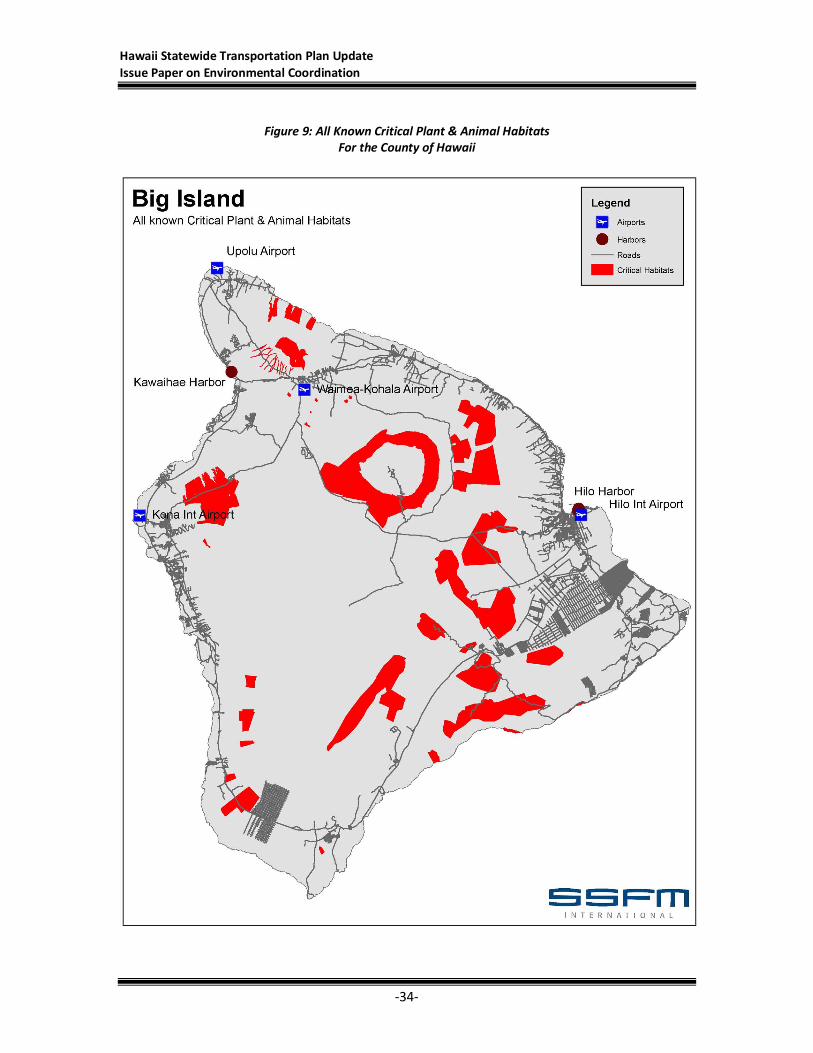
Hawaii Statewide Transportation Plan Update Issue Paper on Environmental Coordination
-34-
Figure 9: All Known Critical Plant & Animal Habitats
For the County of Hawaii

Hawaii Statewide Transportation Plan Update Issue Paper on Environmental Coordination
-35-
Figure 10: Aquatic Considerations
For the County of Hawaii

Hawaii Statewide Transportation Plan Update Issue Paper on Environmental Coordination
-36-

Hawaii Statewide Transportation Plan Update Issue Paper on Environmental Coordination
-37-
Section 7.0 Recommendations for the Hawaii Statewide Transportation Plan (HSTP) Update
The Hawaii Statewide Transportation Plan Update provides an opportunity to consider new ways to implement strategic environmental assessment, resulting in more efficient and effective mitigation measures for transportation projects. This approach provides a framework through which agencies can meet the SAFETEA-LU requirement related to identifying “activities that may have the greatest potential to restore and maintain the environmental functions.”35 The transportation system planning process can shape the purpose and need of a project. It can specify a range of reasonable alternatives. By selecting sub-areas, modes and funding sources in the planning process, key environmental information can be identified and incorporated into subsequent environmental studies. Hawaii can strengthen the relationship between planning and environmental review in some of the following ways:
1. Create and implement Integrated Sub-Area Regional Planning (ISAP) that links strategic planning to project implementation for all modes through a visioning process. Include the ISAP System in the planning framework of the HSTP. Model this after the Colorado LPN System.
2. Identify important statewide sub-areas and name these in the HSTP. Under the
ISAP Program, identify data and resources for each sub-area. Inventory candidate modes and funding sources for each statewide sub-area, thereby shaping the purpose and need and range of reasonable alternatives.
3. Identify categories of environmental mitigation and include them in the HSTP.
4. Identify guidelines to alleviate environmental degradation both at the project
and statewide levels.
5. Set system-wide Performance Goals for the environment.
6. Make greater use of Programmatic Environmental Impact Statements. This recommendation is consistent with practices in other states, such as Colorado and Washington, where there are strong and long standing links between statewide transportation planning and the environment review processes. HDOT should continue its Environmental Review Training. HDOT should continue to participate in the upcoming HRS 343 Review in the 2011 Hawaii Legislative Session.
35 SAFETEA-LU, Section 6001.

Hawaii Statewide Transportation Plan Update Issue Paper on Environmental Coordination
-38-
Four strategic action items are listed to formulate a new approach to linking transportation planning and the environment.
1. Indirect and Cumulative Impact Analysis − Establish Geographic Information System (GIS) overlays of past, current and
predicted future conditions of the natural and built environments. − Describe airsheds, watersheds, conservation areas and other
environmentally sensitive areas. − Centralize information on population, employment, and demographic trends
and forecasts. − Identify local land use, growth management, and development plans.
2. Environmental Mitigation Opportunities − Describe, in general terms, “types” of mitigation activities that can be used
for mitigating impacts. This might include: wetland replacement, avoidance of habitat fragmentation, preservation of habitat for endangered species and other methods.
− Discuss specific geographic areas, such as conservation areas or refuges, where protection and restoration is advised by environmental agencies.
− Consider an ecosystem or watershed approach to mitigation.
3. Goals for the Environment and the Transportation System − The goal for a multi-modal system that supports the State’s economic,
environment, and quality of life goals should serve as a platform for project specific goals and a purpose and need statement.
− System planning level objectives can be incorporated into modal level long range plans and project level documents.
− Create Performance Measures for transportation and the environment.

Hawaii Statewide Transportation Plan Update Issue Paper on Environmental Coordination
-39-
4. Coordinate Transportation, The Environment, and Land Use through Integrated Sub-Regional Area Planning - Undertake Integrated Sub-Regional Area Planning (ISAP) in areas of
statewide interest or concern, in environmentally sensitive areas, and/or in high growth areas. The ISAP would look at environment and resource constraints. It would involve all modes as well as a wide array of state, county agencies in addition to other major stakeholders.
- Identify critical geographic areas that would benefit from ISAP. Initiate the first effort towards a visioning process for one of these areas.
- The responsibility for initiating and conducting ISAP should rest with the STP Office as described in the planning framework paper.
Figure 11 depicts this new approach as a sequential process starting at the top of the diagram with the coordination of transportation and land use. Sub-regional areas are identified for the next step – the visioning process. An impact analysis is conducted for each sub-regional area. Next, mitigation opportunities are identified. The results are then tested against performance measures and adjustments made if required. ISAP is discussed in more detail in Issue Paper #5 in this series, relating to Land Use.
Figure 11: Integrated Sub-Regional Area Planning

Hawaii Statewide Transportation Plan Update Issue Paper on Environmental Coordination
-40-

Hawaii Statewide Transportation Plan Update Issue Paper on Environmental Coordination
-41-
References American Association of State Highway and Transportation Officials. AASHTO
Practitioner’s Handbook #10: Using The Transportation Planning Process to Support the NEPA Process. February 2008.
American Association of State Highway and Transportation Officials. Best Practices in
Environmental Partnering – Raising the Bar, AASHTO Case Studies. 1999. American Association of State Highway and Transportation Officials. Environmental
Success in Transportation Project Development. 2001. Bigler, Brian. Washington State Department of Transportation (Washington DOT).
“Growth Management in Washington State: Transportation Concurrency, Induced Growth and Endangered Species Act Indirect Effects.” In Proceedings of the 2003 International Conference on Ecology and Transportation.
Brown, Janice W. Eco-Logical: An Ecosystem Approach to Developing Infrastructure
Projects. US Department of Transportation, Research and Innovative Technology Administration, Volpe National Transportation Systems Center. April 2006.
Colorado Department of Transportation. “Linking Planning and NEPA Training” website.
This is the source for the description of the program and the graphics depicted in Figures 1, 2 and 3. See: http://www.dot.state.co.us/environmental/Training/NEPA
Federal Aviation Administration. FAA’s NextGen Implementation Plan. March 2010. Federal Highway Administration. FHWA Peer Exchange on Using Corridor Planning to
Inform NEPA. December 31, 2009. Federal Highway Administration. Environmental Mitigation in Transportation Planning.
October 2009. Hawaii Administrative Rules. Title 11, Chapter 200, Environmental Impact Statement
Rules. Hawaii Revised Statutes. Chapter 343, Environmental Impact Statements. Hawaii Revised Statutes. Chapter 344, State Environmental Policy. Hawaii Act 1, 2008 Regular Session, HB 2688, HD1 (2008).
http://www.capitol.hawaii.gov/session2008/bills/GM444_.PDF

Hawaii Statewide Transportation Plan Update Issue Paper on Environmental Coordination
-42-
Hawaii State Department of Transportation. Hawaii Statewide Transportation Plan “Setting The Course.” September 2002.
Tennessee Department of Transportation. TDOT Environmental Procedures Manual.
April 16, 2007. Transportation Research Board. The Marine Transportation System and the Federal Role
– Measuring Performance, Targeting Improvement. TRB Special Report 279. 2004. The National Environmental Policy Act of 1969, as amended. (Pub. L. 91-190, 42 USC.
4321-4347, January 1, 1970, as amended by Pub. L. 94-52, July 3, 1975, Pub. L. 94-83, August 9, 1975, and Pub. L. 97-258, § 4(b), Sept. 13, 1982).
United States Department of Transportation. FHWA 23 CFR Parts 450 and 500 and FTA
49 CFR Part 613; Statewide Transportation Planning; Metropolitan Transportation Planning; Appendix A to Part 450 – Linking the Transportation Planning and NEPA Processes. February 14, 2007.
United States Department of Transportation. “FHWA Memorandum of Understanding,
NEPA and Clean Water Act Integration Process for Surface Transportation Projects in the State of Hawaii.” http://www.fhwa.dot.gov/agreements/divisions/hidiv02agr.htm
Washington State Department of Transportation. I-405 Corridor Program Final EIS.
June 2002.

-43-
Appendix 1
2002 HSTP Goal III Statement on Environment and Quality of Life

-44-

-45-
2002 HSTP Goal III Statement on Environment and Quality of Life GOAL III: Protect and enhance Hawaii’s unique environment and improve its quality of life. Objective 1: To provide an air, land, and water transportation system that is environmentally compatible and sensitive to cultural, historic, and natural resources.
A. Provide an infrastructure and facilities that are environmentally friendly, safe, and appropriate to each community's character and scale.
Examples:
• Develop and maintain a built environment that is aesthetically beautiful and
culturally responsible. • Encourage sustainability of natural and human resources and livability of
communities in infrastructure development. • Consider adopting flexible design standards and context sensitive design
practices. • Consider a reasonable range of design alternatives. • Provide bike and pedestrian facilities. • Ensure access to shoreline and cultural resources.
B. Manage and operate the transportation system in an environmentally responsible manner.
Examples:
• Encourage the use of TDM strategies and actions. • Encourage the use of low-cost, energy efficient, non-polluting means of
transportation. • Develop monitoring programs to ensure compliance with noise, air, and
water quality standards, effectiveness of mitigations, and improved facilities.
C. Support environmentally responsible programs and activities.
Examples:
• Promote ‘Adopt-a-Highway’ program. • Promote rideshare programs. • Promote bicycling and walking. • Support the prevention of unwanted alien species introduction.

-46-
Objective 2: To ensure that the statewide air, land and, water transportation system supports comprehensive land use policies and livability in urban and rural areas.
A. Provide a transportation system that supports and enhances quality of life.
Examples:
• Provide noise abatement measures. • Comply with air, noise, and water quality standards. • Encourage smart transportation infrastructure development that is sensitive
to Hawaii’s unique environment, its historic and cultural heritage, its diverse communities, and its Ahupua’a concept of integrated watershed management.
B. Encourage the use of non-motorized transportation modes.
Examples:
• Provide safe and continuous bicycle and pedestrian routes. • Establish programs to protect scenic, historic, and heritage transportation
corridors.
C. Minimize disruption of existing neighborhoods due to transportation.
Examples:
• Schedule construction activities to minimize local impacts. • Schedule construction activities during off-peak hours when possible to
minimize traffic impacts. • Protect and preserve existing rights-of-way to allow for potential future
roadway expansion.