Embed Size (px)
Citation preview
Annual Report Haas Socially Responsible Investment Fund
Haas Socially Responsible Investment Fund
2018 - 2019 Annual Report
Table of Contents
HSRIF 2018-2019 Annual Letters from the Faculty Advisors and Student Co-Leads 4
Portfolio Performance 8
Strategic Initiatives 14
Asset Allocation 14
Environmental, Social and Governance Standards 15
Fundamental Research 16
Risk & Performance 17
Stakeholder Relations 19
Stewardship, Engagement & Proxy Voting 20
Key Decision Descriptions & Rationale 21
Sell Facebook (FB) 21
Sell Hanesbrands (HBI) 21
Increase Prudential (PRU) 21
Decrease Starbucks (SBUX) 22
Pass on MINDBODY (MB) 22
Wait to buy Prologis (PLD) 23
Holding Company Evaluations 24
Alphabet, Inc. 24
AMN Healthcare Services 25
American Water Works Company 28
Bright Horizons Family Solutions 30
Canadian National Railway Company 32
First Solar Inc. 34
Gilead Sciences Inc. 37
Mastercard Inc. 39
Microsoft Corporation 40
PayPal Inc. 42
Prudential Financial Inc. 45
Southwest Airlines 47
Square 48
Starbucks Corporation 49
Toyota Motor Corporation 52
2 | Page
Annual Report Haas Socially Responsible Investment Fund
Unilever NV 53
Visa Inc. 55
Walt Disney Company 57
Haas Socially Responsible Investment Fund Class of 2019 Principals 60
Appendix: 61
ESG Matrix 61
Fundamental Research Template 63
HSRIF Fall 2018 Weekly Syllabus 64
3 | Page
Annual Report Haas Socially Responsible Investment Fund
HSRIF 2018-2019 Annual Letters from the Faculty Advisors and Student Co-Leads
The 2018-2019 academic year marked the 11th year of the HSRIF. For a review of the evolution of the HSRIF over time,
please refer to the annual reports published since inception:
https://responsiblebusiness.haas.berkeley.edu/curriculum/hsrif.html
Applied Innovation
Sound “sustainable investing” must first be sound investing, and a combination of practitioner and theoretical
knowledge are important components to a curriculum for students in the area of sustainable finance.
The HSRIF has been grounded in bottom-up fundamental active investing, and as such HSRIF Principals have focused on
company specific analysis as foundational to their investment approach and role as asset owners and fiduciaries. The
following HSRIF Objectives were initially set forth in the 2016, and elaborated upon in the 2018 Syllabus (see Appendix):
1) Investment Framework & Philosophy
2) Corporate Reporting, Accounting & Communication
3) Governance: Owner Rights and Accountability to Stakeholders
4) Business in Society: “External Rate of Return”
5) Asset Owner Objectives
Market Environment and Mainstreaming of ESG and Sustainable Investing
As the 2018-2019 academic year draws to a close, equity markets are hitting new all-time highs, following a 10-year bull
market since the lows of March 2009. The HSRIF has enjoyed double-digit compounded returns, while the Principals
have proactively and deliberately reduced risk through asset mix and investment actions since Spring 2017.
Current capital markets activity reflects market sentiment on both 1) elevated risk appetite and 2) broad awareness as
to the relevance of ESG. IPO activity is currently elevated, and includes purpose-driven commitments from the likes of
Levi Strauss (drawing on an authentic heritage of corporate responsibility) and Uber (led by new management which
recognizes the business urgency of social license to operate issues and the necessity of authenticity in improved ESG
practices).
Risk appetite will change cyclically, and markets will go up and down--even by the time this report goes to press.
However, mainstream recognition that material ESG issues impact business prospects, and therefore matter to
investment decisions, will prove to be enduring. As a marker of the mainstreaming of ESG investing, and the recognition
that investment activity impacts the real economy, Howard Marks’ latest memo explores the issue of populism, and
concludes “Capitalism is the most dependable route to prosperity. And it has to be responsible capitalism.” 1
Acknowledgements
As the mainstreaming of ESG and Sustainable Investing continues, the HSRIF remains a unique learning tool and point of
distinction for Haas. I am excited to watch the HSRIF continue to evolve.
1 Howard Marks: Growing the Pie, April 1, 2019: https://www.oaktreecapital.com/docs/default-source/memos/growing-the-pie.pdf
4 | Page
Annual Report Haas Socially Responsible Investment Fund
Thank you to Sam Olesky for joining me as co-instructor this past year, your expertise in Applied Innovation is an asset to
Haas and the HSRIF. I have served as faculty advisor to the HSRIF since 2016, and it is with enthusiasm for the HSRIF that
I pass the baton and welcome the new team of Julia Sze and Adair Morse as co-instructors with Sam in the fall.
Thank you to the HSRIF Principals for your commitment to advancing the fund, and thank you to the HSRIF Advisory
Committee, supporters of the HSRIF, class assistant Katie Chiou, and the CRB.
Dan Hanson
Co-Instructor/Faculty Advisor, HSRIF 2018-2019
HSRIF stakeholders,
This academic year the HSRIF has well met its purpose of providing a rich, uncommon learning experience and delivering
prudent funding for our Center for Responsible Business.
The Principals have made impressive progress to determine how the HSRIF will be run like a professional ESG investment
organization in future years. More specifically, we have made progress on practical concerns like proxy voting, asset
allocation, rebalancing, performance analytics, risk analytics, fundamental analysis and ESG specific analysis. Small
groups of principals have done the majority of the work to develop and advance these essential HSRIF functions with the
discussion, use, advice and ultimate approval by the entire group of principals.
We have engaged in numerous deliberations on the financial and ESG aspects of many companies in many industries.
The Principals begin the HSRIF course with different degrees of experience and comfort in analyzing businesses from any
perspective. They also maintain different values and opinions about the most important financial and ESG qualities to
seek and avoid within our investments. These open-minded discussions and remarkable cooperation by the Principals
inside and outside of our classroom have strengthened all the Principals this year. I believe that each of the Principals
will finish the HSRIF course with a much better practical understanding of ESG portfolio management and the modern
integration of financial and ESG analysis.
On a personal level, it has been uniquely fulfilling for me to work with this year’s Principals as a group and individually. It
seems to me that we were beyond fortunate to have such a kind, supportive and sincere group of people in our team
this year. It has also been my pleasure to work with my co-instructor, Dan Hanson, and learn from his great depth of
experience and knowledge about ESG oriented investing. Many thanks to Katie Chiou, our course assistant, for her
constant support. A giant thank you to Seren Pendleton-Knoll for all of her efforts and support for the HSRIF course and
Principals. Thank you to Robert Strand, Laura Tyson and Scott Pinkus for their attention and guidance.
Next academic year, the HSRIF will add two new co-instructors, Julia Sze and Adair Morse. Julia has lengthy experience
first as a fundamental manager of long only funds and long/short hedge funds and most recently, ten years as a
dedicated impact investment manager. Adair is our Soloman P. Lee Chair in Business Ethics. She teaches Impact
Investing and serves on several MBA committees supporting impact investing, sustainable finance and gender equity.
Adair’s research spans multiple areas of finance with a unifying theme of topics useful for leveling economic playing
5 | Page
Annual Report Haas Socially Responsible Investment Fund
fields.I look forward to learning from them and collaborating with them to produce the best practical ESG investment
course imaginable.
Last, I have also taken great pleasure from seeing some of my best students from past years remain connected with the
HSRIF, dedicating time and efforts to teach the current Principals. It is my hope that this year’s graduating Principals
remain involved and teach the Principals of the HSRIF in future years.
Sincerely,
Sam Olesky
Co-Instructor/Faculty Advisor, HSRIF 2018-2019
Advisors and Community,
Thank you for reading the 2019 Haas Socially Responsible Investment Fund (HSRIF) Annual Report, a collective share out
by the eleventh group of Berkeley HSRIF Principals. The Class of 2019 Principals is grateful for a year of growth and
learnings, and this opportunity to share how we tackled investing on behalf of the Berkeley Haas Center for Responsible
Business.
This report includes key decisions and initiatives organized by area of focus. This year we adopted a committee structure
to encourage each principal to deep dive into key aspects of running an SRI fund. Committees brought key learnings to
the full group around topics such as ESG Standards, Fundamental Research, Performance and Risk, Asset Allocation, and
Stakeholder Relations. This structure allowed us to elevate Principals’ diverse talents and interests in the service of
maximizing the in-class experience.
The year consisted of an immense amount of learning, five key portfolio decisions, and engaging speakers from the
industry. Notably, we sold the HSRIF stake in Facebook as ongoing news disconfirmed our thesis on governance
improvements and responsible management practices. Our active portfolio added no new names and sold two, equating
to portfolio turnover of twelve percent. This metric reflects the HSRIF long-term view. This outcome also aligns with the
long-term objectives of the Center for Responsible Business regarding returns and limited volatility.
Lastly, this year we discussed ESG standards and impact thoroughly, and what that means in the context of HSRIF. We
learned about team structures and integrated reporting from industry professionals at Parnassus and Novo Nordisk, a
leader in this space. In summary, this semester was chock full of lively company specific debates, peer teaching via
committees share-outs, and sustainability. We are incredibly impressed by our classmates and eternally grateful for each
person’s contribution to our collective experience; media features of Jake Wamala and Melissa Hulme serve as great
examples!
We hope you enjoy reading about our year. We greatly appreciate your support.
Go Bears,
Jake & Laura
6 | Page
Annual Report Haas Socially Responsible Investment Fund
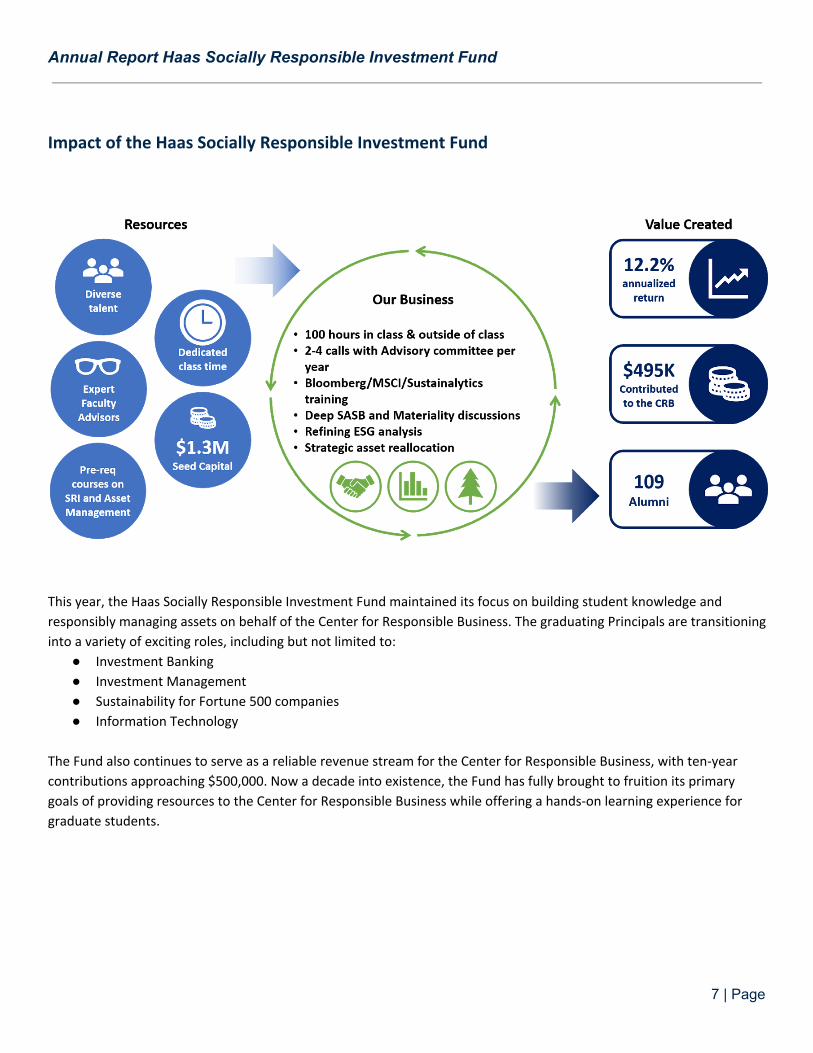
Impact of the Haas Socially Responsible Investment Fund
This year, the Haas Socially Responsible Investment Fund maintained its focus on building student knowledge and
responsibly managing assets on behalf of the Center for Responsible Business. The graduating Principals are transitioning
into a variety of exciting roles, including but not limited to:
● Investment Banking
● Investment Management
● Sustainability for Fortune 500 companies
● Information Technology
The Fund also continues to serve as a reliable revenue stream for the Center for Responsible Business, with ten-year
contributions approaching $500,000. Now a decade into existence, the Fund has fully brought to fruition its primary
goals of providing resources to the Center for Responsible Business while offering a hands-on learning experience for
graduate students.
7 | Page
Annual Report Haas Socially Responsible Investment Fund
Portfolio Performance
Overall Performance
The HSRIF portfolio contains a mix of investments into direct equities, funds and cash. As of 04/26/2019, the portfolio
had an allocation of 38.90% to direct equities, 57.51% to funds and 3.59% to cash and money market funds. On the
other hand, the portfolio had an exposure to 80.2% to equities (through direct equity and fund positions) and 19.80% to
fixed income (through fixed income funds).
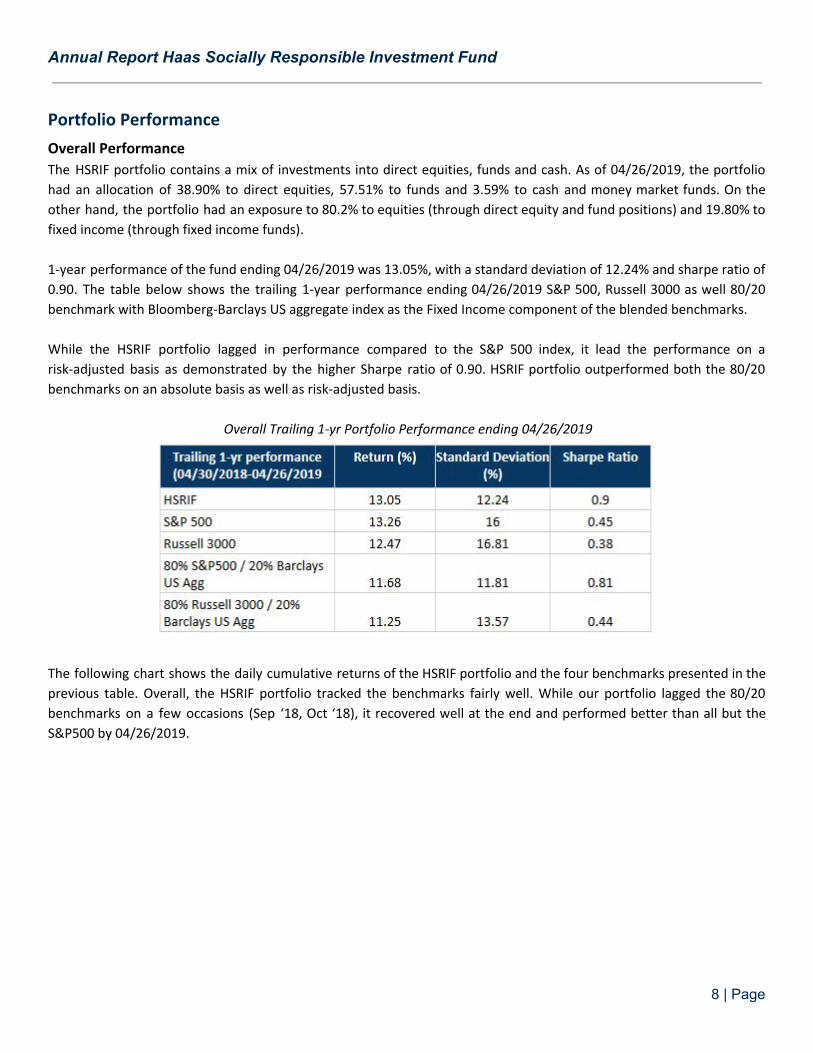
1-year performance of the fund ending 04/26/2019 was 13.05%, with a standard deviation of 12.24% and sharpe ratio of
0.90. The table below shows the trailing 1-year performance ending 04/26/2019 S&P 500, Russell 3000 as well 80/20
benchmark with Bloomberg-Barclays US aggregate index as the Fixed Income component of the blended benchmarks.
While the HSRIF portfolio lagged in performance compared to the S&P 500 index, it lead the performance on a
risk-adjusted basis as demonstrated by the higher Sharpe ratio of 0.90. HSRIF portfolio outperformed both the 80/20
benchmarks on an absolute basis as well as risk-adjusted basis.
Overall Trailing 1-yr Portfolio Performance ending 04/26/2019
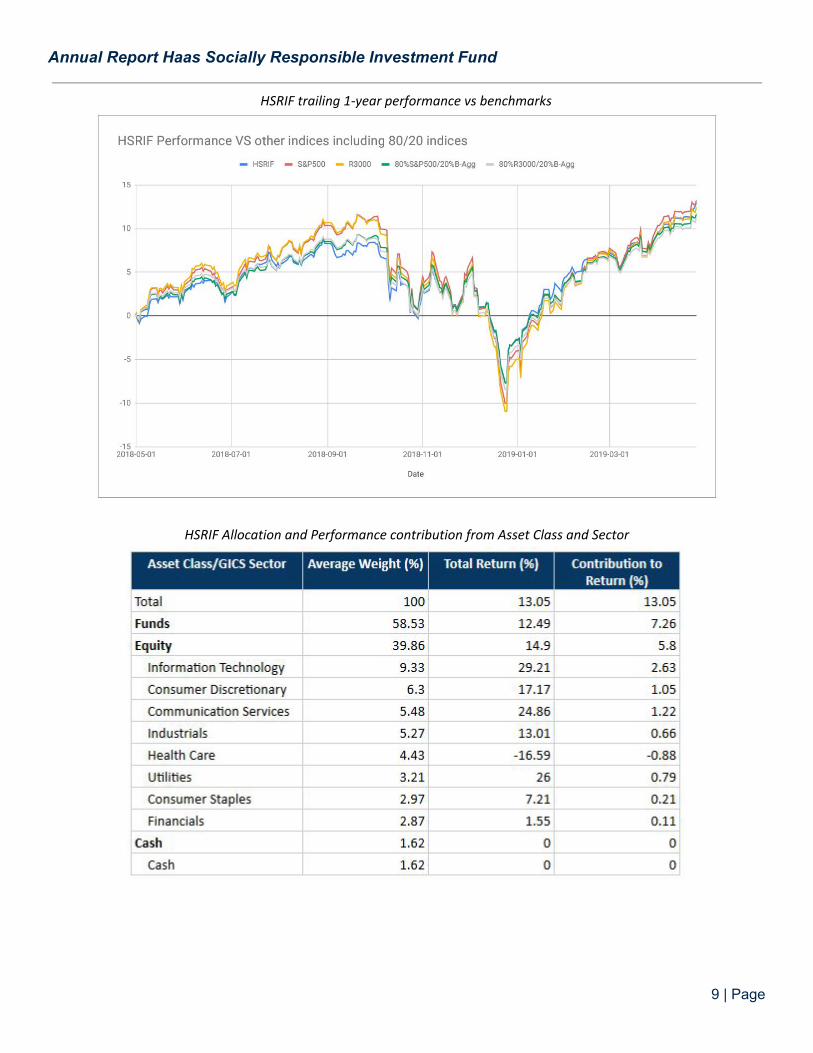
The following chart shows the daily cumulative returns of the HSRIF portfolio and the four benchmarks presented in the
previous table. Overall, the HSRIF portfolio tracked the benchmarks fairly well. While our portfolio lagged the 80/20
benchmarks on a few occasions (Sep ‘18, Oct ‘18), it recovered well at the end and performed better than all but the
S&P500 by 04/26/2019.
8 | Page
Annual Report Haas Socially Responsible Investment Fund
HSRIF trailing 1-year performance vs benchmarks
HSRIF Allocation and Performance contribution from Asset Class and Sector
9 | Page
Annual Report Haas Socially Responsible Investment Fund
As shown in the table above, direct equity holdings had a total return of 14.9% and a contribution to the total portfolio
return of 5.8%. The funds portion of the portfolio had a return of 12.49% and a contribution of 7.26%.
Within direct equity segment of the portfolio, Information Technology had the highest exposure (9.33%) and also had
the largest return (29.21%) within this 1-yr reporting window, driven by the stellar performance of four payment stocks -
Paypal, Square, Mastercard and Visa. Microsoft also did quite well within Information Technology. The Communication
Services followed Information Technology with 24.86% return and 1.22% contribution to the portfolio return, driven by
Walt Disney and Alphabet.
The largest detractor to performance was Healthcare with -16.59% return and -0.88% return contribution, driven by
negative performance by AMN Healthcare and Gilead Sciences.
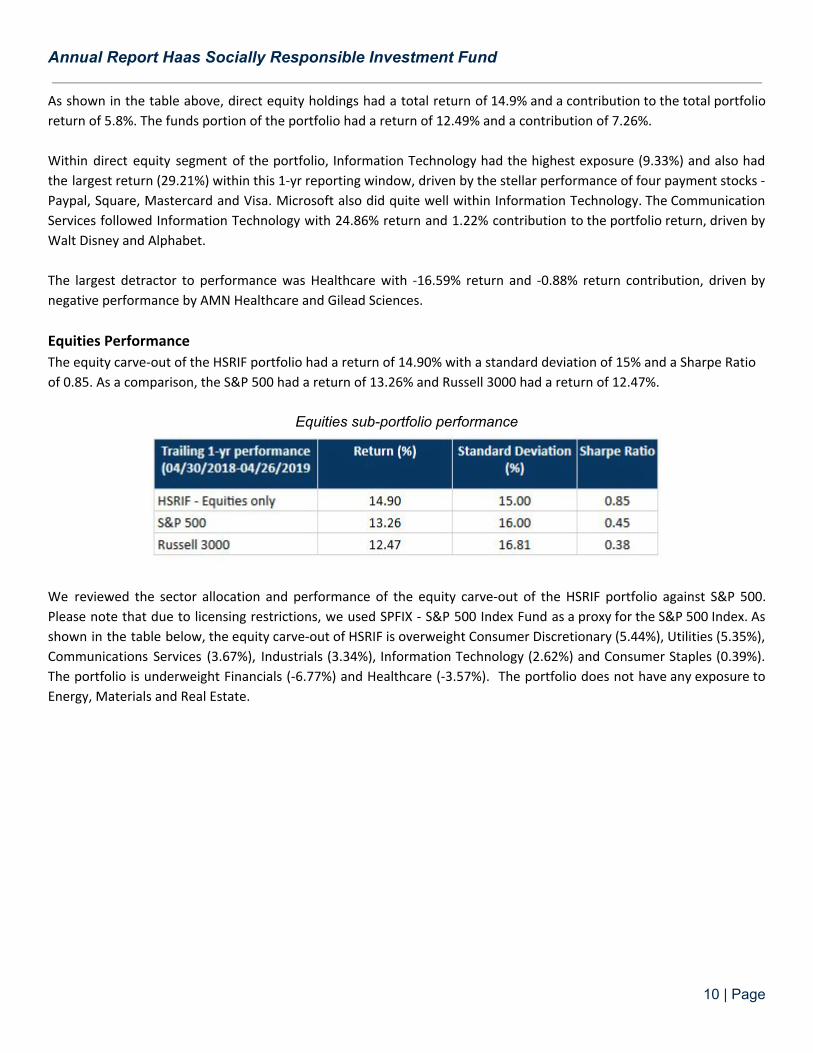
Equities Performance
The equity carve-out of the HSRIF portfolio had a return of 14.90% with a standard deviation of 15% and a Sharpe Ratio
of 0.85. As a comparison, the S&P 500 had a return of 13.26% and Russell 3000 had a return of 12.47%.
Equities sub-portfolio performance
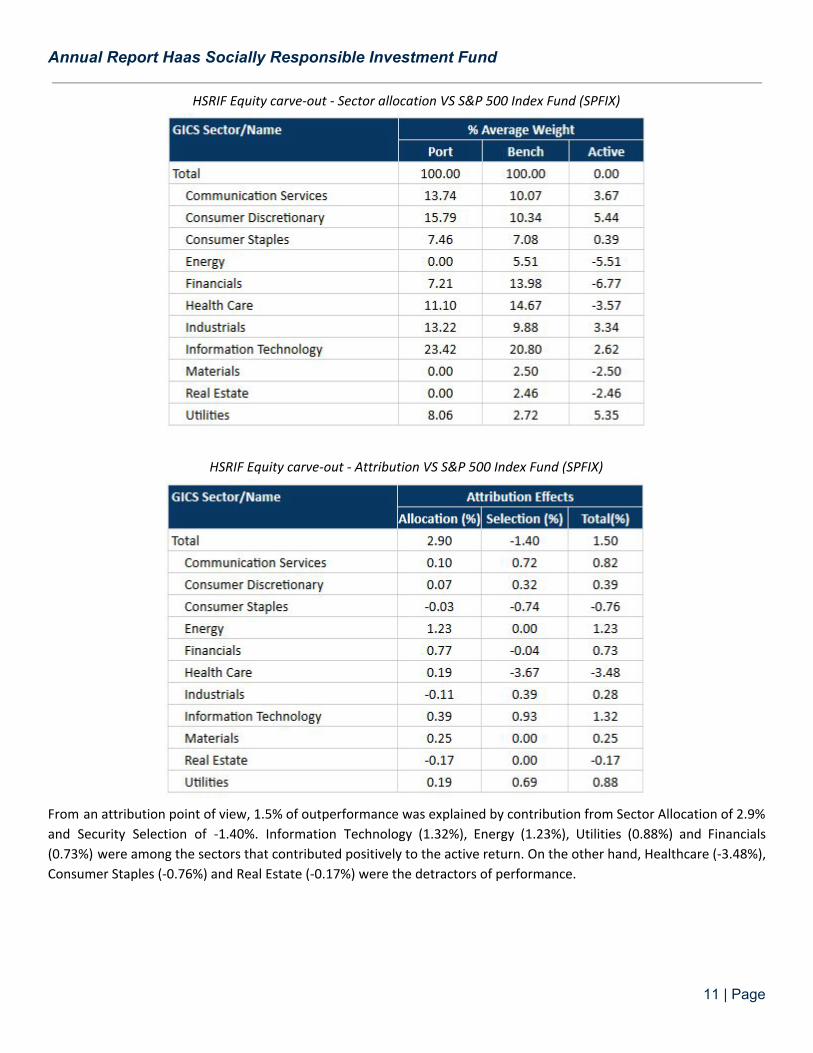
We reviewed the sector allocation and performance of the equity carve-out of the HSRIF portfolio against S&P 500.
Please note that due to licensing restrictions, we used SPFIX - S&P 500 Index Fund as a proxy for the S&P 500 Index. As
shown in the table below, the equity carve-out of HSRIF is overweight Consumer Discretionary (5.44%), Utilities (5.35%),
Communications Services (3.67%), Industrials (3.34%), Information Technology (2.62%) and Consumer Staples (0.39%).
The portfolio is underweight Financials (-6.77%) and Healthcare (-3.57%). The portfolio does not have any exposure to
Energy, Materials and Real Estate.
10 | Page
Annual Report Haas Socially Responsible Investment Fund
HSRIF Equity carve-out - Sector allocation VS S&P 500 Index Fund (SPFIX)
HSRIF Equity carve-out - Attribution VS S&P 500 Index Fund (SPFIX)
From an attribution point of view, 1.5% of outperformance was explained by contribution from Sector Allocation of 2.9%
and Security Selection of -1.40%. Information Technology (1.32%), Energy (1.23%), Utilities (0.88%) and Financials
(0.73%) were among the sectors that contributed positively to the active return. On the other hand, Healthcare (-3.48%),
Consumer Staples (-0.76%) and Real Estate (-0.17%) were the detractors of performance.
11 | Page
Annual Report Haas Socially Responsible Investment Fund
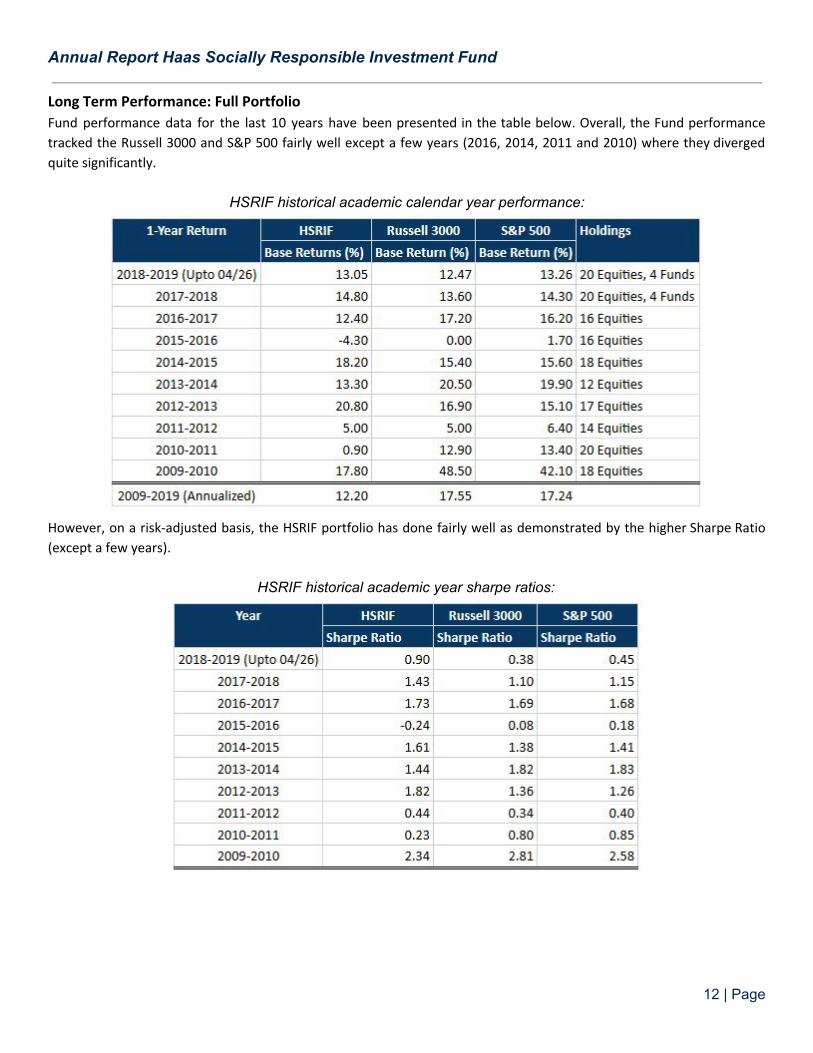
Long Term Performance: Full Portfolio
Fund performance data for the last 10 years have been presented in the table below. Overall, the Fund performance
tracked the Russell 3000 and S&P 500 fairly well except a few years (2016, 2014, 2011 and 2010) where they diverged
quite significantly.
HSRIF historical academic calendar year performance:
However, on a risk-adjusted basis, the HSRIF portfolio has done fairly well as demonstrated by the higher Sharpe Ratio
(except a few years).
HSRIF historical academic year sharpe ratios:
12 | Page
Annual Report Haas Socially Responsible Investment Fund
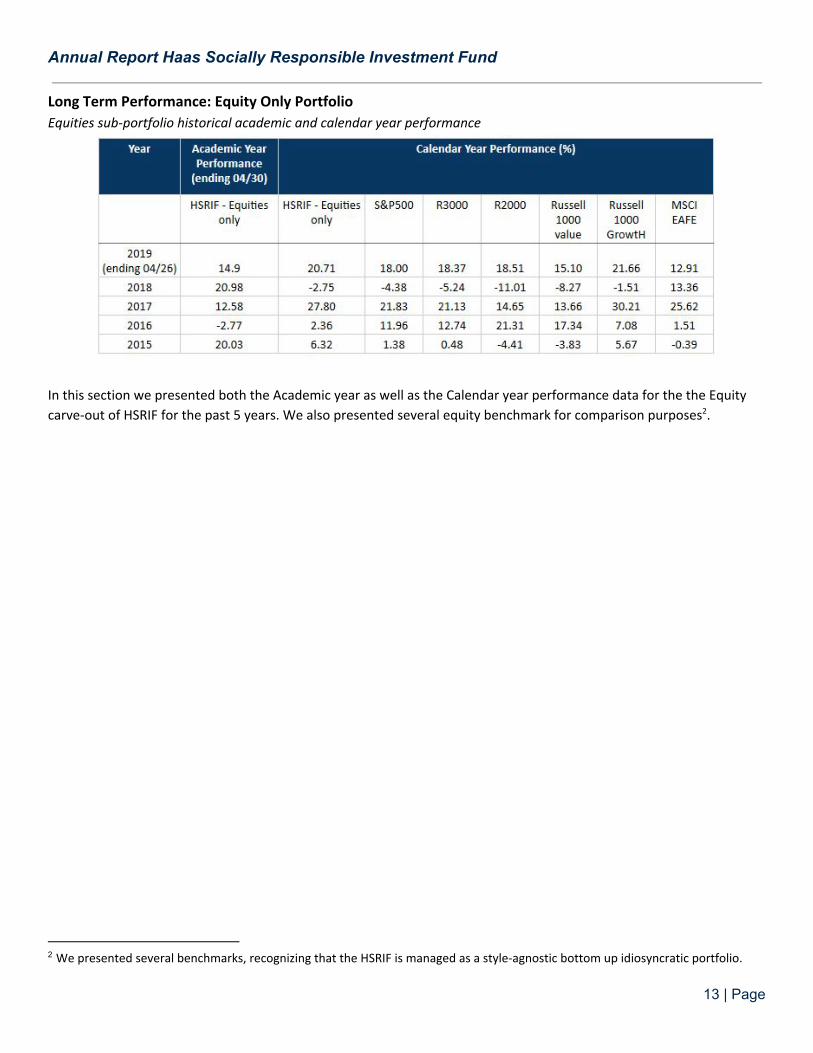
Long Term Performance: Equity Only Portfolio
Equities sub-portfolio historical academic and calendar year performance
In this section we presented both the Academic year as well as the Calendar year performance data for the the Equity
carve-out of HSRIF for the past 5 years. We also presented several equity benchmark for comparison purposes . 2
2 We presented several benchmarks, recognizing that the HSRIF is managed as a style-agnostic bottom up idiosyncratic portfolio.
13 | Page
Annual Report Haas Socially Responsible Investment Fund
Strategic Initiatives
Asset Allocation
Melissa Hulme, Roi Matalon, Jesse Rau, Jeremy Scheier
Fall 2018 recap:
Our committee’s primary focus in our first semester was to understand HSRIF’s portfolio exposures and begin to lay the
groundwork to develop a steady-state asset allocation policy.
The initial decision to diversify away from equities and into fixed income occurred in 2017 when HSRIF developed a
40/20/20 combination of a concentrated equity portfolio + equity indices + fixed income allocation to preserve the
long-term stability of the fund. Our committee revisited this decision and applied a rigorous lens to the asset allocation
mix decision.
Towards the end of the fall, we met with HSRIF Advisory Board members Wendy Walker, Nick Shea, and Mike Pearce
from Cambridge, as well as Scott Pinkus. These meetings were invaluable to prioritize our work as a committee and to
understand the process that they use with clients to help them determine an appropriate asset allocation policy.
Following this meeting, we put together a due diligence plan to inform our asset allocation recommendation.
Spring 2019 highlights:
At the start of spring semester, we met with the CRB to understand their risk tolerance as HSRIF manages the competing
priorities of (1) providing consistent support to the CRB’s operating budget and (2) maximizing the long-term growth of
the fund. We sought to better understand the role of HSRIF in relation to the CRB’s budget, and the CRB’s tolerance for
volatility and potential drawdowns, to inform the ideal mix of equities vs. fixed income securities. HSRIF contributes
~10% of CRB’s budget and is valued as a very consistent source of funds for the department. Given HSRIF’s inception in
2008, the fund has yet to be truly tested in a downturn, but we also discussed how a higher fixed income allocation
might protect against adverse behavioral tendencies in the case of a recession.
We then worked with Cambridge Associates to quantitatively evaluate the distribution of possible outcomes assuming
different allocations towards U.S. equities, international equities and fixed income through a Monte Carlo analysis (using
each asset class’ historical returns, volatility and correlation as inputs). We also evaluated current valuation levels and
the impact that a “return to normal” might have on go-forward returns using a Case Shiller-type approach. The Monte
Carlo analysis highlighted the greater risks and rewards inherent in a portfolio with a higher equity weighting, and the
improvement in returns and risk that could be achieved through greater international diversification. The “Return to
Normal” analysis underscored the benefit of international equities, given their relative valuations are lower relative to
historic valuations.
Finally, we also considered the learning experience of the Principals and performed a peer analysis to evaluate similar
institutions’ asset allocation policies. All of our work culminated in the recommendation to adopt a steady-state 70%
equity / 30% fixed income asset allocation, with a 20% steady-state allocation to international equities. For our equity
allocation, we proposed maintaining the 50/50 concentrated equity portfolio + equity index exposure. We also proposed
14 | Page
Annual Report Haas Socially Responsible Investment Fund
establishing a time-based rebalancing policy of every 6 months with bands set at +/-5% of target asset allocation. All of
these proposals have passed, and we plan to execute on these proposals before the Spring semester ends.
Looking ahead:
2019-20 principals may want to consider the following items:
● Establish an Investment Policy Statement.
● Revisit HSRIF’s fixed income manager choice. Cambridge has done work on socially responsible fixed income
managers and suggested speaking with Breckenridge, who could likely offer a separate account with a
customizable mandate. This would provide the class the opportunity to set parameters around ESG, duration,
risk levels, etc. Breckenridge would also likely charge a fee that is significantly less than TIAA-CREF’s retail share
class.
● Evaluate actively managed international funds (either as an alternative, or in addition to, our ETF
recommendation). Also consider reducing the international index exposure as more direct international
investments are made.
● Revisit HSRIF’s spending policy. In particular, consider a constant growth policy (with a market value based
collar) vs. the current spending policy that is based purely off of market values. The benefit to a constant growth
policy is that it reduces volatility in budget contributions. The downside is that HSRIF might eat into the principal
of the fund more when market returns are poor, thereby jeopardizing the growth of the pool.
● Work with the asset allocation committee and identify appropriate blended benchmark for risk and performance
reporting.
Environmental, Social and Governance Standards
Daniel Clayton, Tess Peppers, Ben Vickery, Praniti Maini
Fall 2018 Recap:
Our committee’s primary focus in our first semester was to review the previous class’ ESG matrix and determine
whether any changes should be made. After broaching the topic with our classmates, disseminating a brief survey
among our fellow Principals, and holding several committee meetings, we came to the conclusion that the existing ESG
framework was falling short in a couple ways.
First, the “matrix” was more of a checklist, which meant it was easy to go through the motions without identifying the
broader ESG thesis for any given position. Second, it failed to address the fact that every company is different, or that
companies in different sectors have different “material” ESG-related issues. We wanted to incorporate these elements,
but also not entirely adopt the rating system of a single research provider (e.g. SASB, MSCI, or Sustainalytics).
With these insights, our committee made two primary changes to the existing ESG matrix. First, we added a general
“ESG Thesis” field to the top of the matrix. This section is aimed at challenging principals to distill why we think the
company is a strong ESG buy into a few short sentences. Second, we added space to the end of the matrix for three or
more material ESG issues. We believe the SASB “Materiality Map” is best in class and recommend leveraging their
framework heavily for this portion of the matrix. Lastly, we kept the existing ESG categories from the previous version of
15 | Page
Annual Report Haas Socially Responsible Investment Fund
the matrix intact. Our fellow Principals have agreed that these categories warrant a close evaluation regardless of
whether or not they are considered “material.”
Spring 2019 Highlights:
Heading into the spring semester, we sought to gather feedback from Principals who had used the new ESG Matrix in
their stock analysis. Out of this feedback, we made two additional improvements to the matrix; (i) we included a range
of scores with guidance on high and low marks, and (ii) we added a link to to the SASB materiality map.
With the ESG matrix fully refined, we had each of the Principals fill out the ESG matrix for all existing positions in the
portfolio. These matrices can now be reviewed on the drive.
Looking Ahead:
In the weeks that remain, there are two items we hope to accomplish:
● Identify changes on the newly released SASB framework and present/discuss with class
○ What material changes occurred
○ Do we believe this framework is still a good guide for our process
○ Do we want to expand on the framework already in place
● Coordinate a class speaker from SASB (likely our EWMBA classmate who works for them)
○ Inviting SASB speakers will give principals a better understanding of how the current framework was
developed and how we can best apply it critically and thoroughly
Fundamental Research Edgar Asajavicius, Thomas Prufer, Jake Wamala
Fall 2018 recap:
The Fundamental Research Committee’s primary challenge was to help principals with their fundamental analysis.
To that end, we built a repeatable process to analyze companies on a fundamental basis. Given the
extensive coverage of our portfolio companies and pitches on Prudential and MindBody in September,
our fund had several examples of fundamental research to examine.
The Fundamental Research Committee used HanesBrands (HBI) one-page update as a critique of what we’d like to see in
our research process. During class time, we presented the pros and cons of the research note. We especially highlighted
what we believe should be included when analyzing whether a company warrants an investment. Here are a few of the
key elements:
● Thesis: What does the principal think about the company? Where does the stock go and why?
● Business Overview: Brief description of the company, business model, and key products.
● Valuation: What are we willing to pay for this company and what is its intrinsic value?
● Management Assessment: What do we think of the management team? How are governance and management
decisions impacting the company direction?
16 | Page
Annual Report Haas Socially Responsible Investment Fund
● Explanation of revenue drivers: What unit economics or key performance indicators (KPIs) are the best
predictors of future revenues, profits, and free cash flow?
● Competitive dynamics: What is the company’s economic moat? Is pricing power increasing or decreasing in this
industry or for this company?
● Risks: How bad can it get? How much money can we reasonably lose in a downside scenario?
● Catalysts: Are there key milestones of which we need to be aware of? Are these milestones good or bad?
● ESG Assessment: What are the environmental and social issues that are most likely to influence the stock price?
In addition to the discussion on fundamentals, we left room for discussion on whatever the principal believes is most
important. This space provides freedom for the analyst to focus on the key drivers of the company and stock in the
short, medium, and long term. This method guides to more prose coalescing salient thoughts and ideas. In summary, the
objective of research notes provided to the fund is to drive insights rather than describe what happened or consensus.
Spring 2019 highlights:
Early on in the semester, we worked with the Principals on refining our investment process and understanding of
businesses. We adapted the templates we’ve been using so far and streamlined the output.
In addition to creating the template, we did another case study with one of our holdings, AMN Healthcare. All analysts
used the template, and we had a constructive conversation on the company and template. We’ve incorporated feedback
and continually evolve the document with the objective of passing on the template to future principals.
Over the past two months, we finalized the templates and put them into practice. The final template we developed
offers adequate flexibility while still drilling down on the most important aspects of an investment idea. It also includes
sources at the end, helping people who may be just learning the research process. Following up the AMN Healthcare
case study, we did another similar exercise with a new potential holding ProLogis (PLD). We were able to invite a real
estate expert in our class from the Hines Corporation to join in the discussion as well. We had a very constructive
conversation on the company and its investment merits in the context of our portfolio.
Looking ahead:
2019-20 principals may want to consider the following items:
● Our hope is that the fundamental analysis template can be a living document that the principals can continue to
iterate on and continue to evolve.
● Ideally, the ESG analysis and fundamental analysis are intertwined, with the key material ESG issues tied to the
fundamental analysis of the company, particularly in the context of risk management.
Risk & Performance
Michelle Levinson, Solenn Seguillon, Rubaiyat Khan
Fall 2018 recap:
The primary tasks for the risk and performance committee were to generate monthly risk and performance reports and
to work with different stakeholders to formalize the report generation process. We met with the faculty advisor early in
fall in order to identify our goals and expectations.
17 | Page
Annual Report Haas Socially Responsible Investment Fund
To that end, our first course of action was to log-in to the Bloomberg terminal and update the terminal’s portfolio
information to reflect all the changes that were made to our investment portfolio by the previous year’s principals.
Initially we faced a steep learning curve as we grappled with the different modules within the Bloomberg terminal that
are essential for updating the portfolio and generating reports. Once we were comfortable with the application, we
created a new portfolio that contains all the historical positions as well as all trades that were made in 2018. All
subsequent risk and performance attribution reports were generated using this portfolio.
Following this groundwork, we generated monthly reports for the September, October and November month-end
reporting cycles. We gathered feedback on these monthly reports to continue honing and improving the template. We
met with one of the HSRIF advisory board members and presented some preliminary risk and performance data during
the advisory board meeting in October.
Spring 2019 highlights:
At the start of the Spring semester, we instituted a weekly performance report that was made available to the entire
class right before each week’s session. The goal of this weekly performance report was to monitor the performance of
the individual stock holdings more proactively and to enable discussion in class in the event that any of the stocks had
major activity during the week. The faculty advisors suggested the report and we worked with them to format a draft
before generating the first report. We subsequently made some minor updates to the weekly performance reports and
made the updated reports available prior to each week’s session.
We also updated the portfolio in Bloomberg to capture the trades that were made by our class in December. Once those
were done, we generated the December month-end and January month-end reports.
While working on those reports, we realized that the current report generation process was quite manual, error prone,
and time-consuming. To that end, we met with the faculty advisor to figure out a way to simplify the reports. With this
goal in mind, the risk and performance committee managed to create custom report templates in Bloomberg that help
eliminate bulk of the manual tasks for generating monthly risk and performance reports. We also made updates to the
portfolio to reflect the trades that were made in February and March.
Another principle contribution is the how-to document for generating monthly risk and performance reports in
Bloomberg that we created. We hope is that this document will help next year’s principals get up-to-speed quickly and
continue to make further improvements to the risk and performance reporting and monitoring process so that this can
become an integral part of the decision-making process.
Looking ahead:
2019-20 principals may want to consider the following items:
● Use the “How-to” document in order to get up-to-speed with risk and performance reporting
● Work with the asset allocation committee and identify appropriate blended benchmark for risk and performance
reporting
● Build on the initial version of the “custom” report template and add additional views that will be useful in
portfolio management and decision making
18 | Page
Annual Report Haas Socially Responsible Investment Fund
● Consider opportunities to include ESG issues and ESG metrics as components of risk and performance tracking.
We experimented with climate transition risk assessment but there is significant room for further exploration in
this and other areas.
Stakeholder Relations
Isabella Martin and Laura Andersen
Fall 2018 Highlights
Coming into the year, relationships with the Advisory Board were the focus of the committee’s work. The Advisory Board
convened twice in the fall, with sessions designed to invite Board members into dilemmas and discussions occurring
within the Fund. This approach opened the door for meaningful collaboration with Advisory Board members throughout
the year, leveraging their passion and expertise to help Principals achieve better results on various initiatives covered in
committee summaries. The Fund also added two seats to the Advisory Board for young alumni to maintain connection to
recent Principals and incorporate their institutional knowledge.
On the student experience side, we shifted the bid point allocation for students allowed incoming Principals greater
flexibility in their spring elective selection. Following the reduction in bid points deducted for HSRIF prerequisite courses,
incoming Principals were able to bid more competitively for other high-demand electives. This shift ensures that future
HSRIF Principals will enjoy an excellent experience in the Fund, as well as the other quality course offerings available
across Berkeley Haas during their short time in the program. In the long run, we believe this will ensure that HSRIF is an
attractive option for students who face competing pressures on their short academic time here.
Spring 2019 Highlights
It is with great gratitude to previous professors and incoming professors that HSRIF announces curricular updates to
build core skills that are specific to HSRIF. Moving forward, each Principal will prepare for HSRIF by taking Financial
Information Analysis and a Sustainable Investing course taught by Finance Professor Adair Morse. These two
prerequisite courses will focus on fundamental stock analysis and building a shared understanding of SRI portfolio
design. After the completion of prerequisite courses in Spring of their first year, Principals will leverage their collective
experiences to think critically about broader asset management and socially responsible investing topics related to the
Fund throughout their second year at Berkeley Haas. This realignment will create a cohesive 18-month learning
experience for future HSRIF Principals.
Concerning the Annual Report, we explored the possibility of building a more Integrative Report. We hosted Suzanne
Stormer, Executive Vice President of Corporate Sustainability, from Novo Nordisk to explain in detail their process of
reporting. As a result, we revisited the Annual Report structure, building in an emphasis on the Fund’s long-term impact
and integrated sustainability principles. Additionally, we adjusted the structure of the report to include more focus on
the performance of the fund and impact of strategic initiatives.
On May 2nd, current Principals convened the HSRIF community to celebrate more than ten years of learning and
contributions to the Center for Responsible Business. The relationships that we have built over the course of the year
are the heart of the Fund, and we look forward to attending the next gathering to celebrate twenty!
19 | Page
Annual Report Haas Socially Responsible Investment Fund
Looking Ahead
● Increase the knowledge bank and diversity of Advisory Board to aid the new classes of HSRIF principals,
leveraging the wide range of skills and backgrounds of growing HSRIF alumni.
● Consider increasing the number of young alumni on the board to four positions, to maintain connection with
recent graduates and guarantee valuable contributions from these young professionals.
● Incorporate the Advisory Board Statement of Purpose into the selection process for new Principals, and to build
alignment between new additions and long-standing advisors to the Fund.
● Maintain convenings, two per semester, of the student Principals and the Advisory Board to ensure effective
communications and continuous contribution from the board.
● Start exploring the process of Integrated Reporting at the beginning of Fall semester so that a more
comprehensive, integrated report can be produced in Spring.
Stewardship, Engagement & Proxy Voting
Daniel Clayton, Vanessa Danziger, Jessica Lui, Abby O'Reilly
Highlights from the past one year:
The Committee developed an official set of proxy voting guidelines for HSRIF in collaboration with the faculty advisors
and consistent with referenced guidelines published by widely-recognized institutions and adopted by many investors,
such as ISS Proxy Voting Guidelines. These guidelines have been codified as HSRIF Proxy Voting Process, presented to
and adopted by the 2018-2019 HSRIF Principals.
The creation of these guidelines has enabled a consistent process for Principals to engage in proxy voting for portfolio
companies and to consistently record the Fund’s voting decisions. All voting decisions are recorded in a standardized
way, using the HSRIF Proxy Voting Record File.
For the proxy voting season of 2019, the HSRIF Principals have casted votes for the following portfolio companies:
Disney (DIS), Starbucks (SBUX), Hanesbrands (HBI), AMN Healthcare (AMN), Unilever (UN) and Canadian National
Railway (CNI), and will cast votes for the following portfolio companies before passing the responsibilities over to the
incoming Principals: Gilead Sciences (GILD), American Water Works (AWK), Southwest Airlines (LUV), Prudential
Financial (PRU), Bright Horizons (BFAM).
Looking ahead:
The 2019-20 Principals will continue to maintain (and refine as needed) the HSRIF Proxy Voting Process that the
Committee owns. In addition, the incoming Principals may wish to expand the Committee’s functions and involve HSRIF
in more engagement and stewardship activities, such as developing a corporate engagement process and joining
investor groups in engagement campaigns. It’s becoming more and more common for small investors to team up, in
order to exert more influence on the company management. The Committee can identify when these group efforts are
occurring as well as the ones that are suitable for HSRIF to participate in.
20 | Page
Annual Report Haas Socially Responsible Investment Fund
Key Decision Descriptions & Rationale
Sell Facebook (FB)
The HSRIF’s position in Facebook, taken in March 2018, reflected the “Student’s Always” principle and the opportunity
to improve ESG characteristics through activist engagement. Improvements in “S” and “G” have not been observed since
the HSRIF initiated their activist campaign through the “Open Letter to the CEOs of Facebook’s Largest Institutional
Shareholders.”
Facebook has strong business fundamentals, wide moat, market growth, and an attractive valuation, but greatly
increased risk. The key areas of material concern include consumer trust, data privacy and security, human rights,
diversity, corporate governance, key man risk, and regulatory risk. Furthermore, we did not think it was realistic to
expect a successful activist campaign given Facebook’s ownership concentration and the small size of HSRIF’s position.
After an open and frank discussion with the Advisory Board in November, the HSRIF decided to remove Facebook from
the portfolio.
Sell Hanesbrands (HBI)
The decision to sell the fund’s position in Hanesbrands (HBI) was recommended by the covering analyst on 2/11/2019,
and sold on 2/28/2019 after a majority vote of the principals. In a stock update presented on 2/11/2019, the covering
analyst identified significant macroeconomic and competitive risks to the company’s prospects going forward. On the
ESG front, HBI continues to be very active and transparent on environmental impact, with proactive efforts to reduce
water, energy, and carbon emissions. They have active community engagement, but lack diversity in leadership. They
perform well on governance with 8/11 independent directors and disclosed executive pay.
When considering the decision to sell, these risk factors represented significant downside risk for the fund. First,
Hanesbrands is facing increasing competition from multiple points. Their large customers, such as Target and Walmart,
are developing private labels to compete. As a result, they will aim to decrease their purchases to make room for their
own products. As an example of this impact, Hanesbrands announced in August 2018 that Target would not be renewing
their contract with C9 by Champion when it expires in January 2020. In addition, athletic apparel companies are dipping
into athleisure, increasing competition with Champion. Second, their competitive moat is weak. Their moderate brand
power is offset by low switching costs for consumers and the shift to private label. Third, in a challenging retail
environment shifting from physical to digital, they are not well positioned for the shift. Their traditional customers (e.g.
Sears) are negatively impacted, and they need to ramp up online and D2C channels to compete.
Increase Prudential (PRU)
In Fall 2018, the fund decided to increase the fund’s position in Prudential (PRU) from approximately 2.5% position to a
3% position. In August, the covering analyst presented rationale for adding to the position. Namely, Prudential Financial,
the second largest publicly traded life insurance company, benefits from positive tailwinds while trading at a discount
reflecting overblown risks. life insurance companies trade at a discount to the market because of in trenched
uncertainties in the business model, namely that costs of goods sold are estimated and margins are realized over a
several decades when the policies begin to pay out claims and benefits. Two large risks, long-term care and variable
annuities capital reform provide unwarranted overhangs for Prudential’s stock performance.
21 | Page
Annual Report Haas Socially Responsible Investment Fund
In a rising and stabilized rate environment, HSRIF would benefit from exposure to life insurance companies because of
the positive market tailwinds as net investment spreads widen, increasing the gap between what the company pays out
on fixed contracts and earns on premiums collected. This was a good opportunity to add to our position in the premier
life insurance company with a strong management and stellar workplace. The company boasts several accolades
regarding workplace culture and ESG. It was named Forbes most admired company in Insurance: Life and Health 2017
and 2018 (back to back), Top Green Companies, U.S. 500 and Global 500 by Newsweek,100 Most Sustainable Companies
by Barron’s, and Top 50 Companies for Diversity by Diversity Inc. among many other awards.
Decrease Starbucks (SBUX)
The weight of Starbucks (NYSE:SBUX) in the HSRIF portfolio was reduced by 75bps to ~1%, following the
recommendation of the covering analyst on Mar 5, 2019 and the result of a majority vote of the Principals afterwards.
The rationales behind this decision include:
1) the stock price has hiked nearly 50% since late June 2018, after the company delivered stronger-than-expected
performance for 2 consecutive quarters, the price has hit both the target price of the covering analyst and the average
target price of the street, which creates an opportunity to take profit; 2) based on our research and discussion, the
Principals think that Starbucks is transitioning from a high-growth company to a relatively mature company, there’s a
lack of drivers that will allow the company to grow as fast as in the past decade and to constantly beat the market
consensus by a large margin;
3) however, the Principals also recognize that, as the industry leader, Starbucks’ economic moat remains big, the
company’s management is highly competent in implementing strategies that keep the company’s performance on track,
and the market has been gradually accepting and rewarding the company’s new growth profile, we remain invested in
the company, based on the above considerations plus the dividend yields that are getting more attractive.
Given that, we are aware of the challenges and uncertainties that the company is facing, especially in its China market,
as well as the ESG controversies that the company was and will potentially be involved in, such as recycling management
and employee management. We actively monitor news and updates about the company, and should anything happen
that we consider financially material for the company, we will adjust our view and position accordingly.
Pass on MINDBODY (MB)
In the fall of 2018, the Principals considered a proposal to add MINDBODY Inc. (NASDAQ: MB) to the portfolio.
MINDBODY provides cloud-based business management software serving the “wellness industry.” Their primary
customers are boutique fitness studios, integrated health offerings, and salons and spas. The software facilitates
scheduling, online booking, payment processing, and various other business management services.
MINDBODY stood to benefit from a continued trend away from traditional gyms and health clubs, and towards boutique
fitness. Whether it be SoulCycle, CrossFit, or Barry’s Bootcamp, we observed fanatical participation in these fitness
offerings, particular among our millennial peers. Further, we appreciated the strong, “internally fit” business model that
generated revenue not just from recurring subscription revenue, but also through payment processing. In our view, the
addition of payment processing to the traditional SaaS business model served to align incentives nicely between
MINDBODY and their small-business customers.
22 | Page
Annual Report Haas Socially Responsible Investment Fund
While the Principals were more or less aligned on the attractiveness of the business, we questioned the ESG thesis. The
relatively small company did not stand out from an ESG perspective. While supporting wellness-related businesses
seemed vaguely positive, we ultimately questioned whether the fact that MINDBODY enabled the sale of expensive
workout classes (primarily to affluent, urban consumers) was enough of a reason to own the stock. Further, in the midst
of our debate, the stock weathered an approximately 32% decrease in price after the troubled acquisition/integration of
competitor, Booker Software.
We ultimately voted to pass on MINDBODY at the December 4th, 2018 share price of $26.70. Precisely three weeks
later, it was announced that Vista Equity would be acquiring the company and taking it private at a 68% premium to the
current share price (then $21.72). Naturally, we questioned whether we had made the right decision. In our
post-mortem discussion, we concluded that a private takeout of the company was outside our investment thesis and
virtually impossible to foresee, giving us confidence that we had made the right decision given the information available
to us at the time.
Wait to buy Prologis (PLD) In March 2019, the Principals were called on to submit stock recommendations to potentially be added to our portfolio.
The recommendations were collected and then voted on by each Principal, with the goal to narrow the list down to a
single name. Of the 13 names submitted, the most votes were cast for Prologis Inc. (NYSE: PLD). Prologis is an industrial
REIT that owns, manages, and develops warehouses and distribution centers for customers in the retail, e-commerce,
and supply chain sectors.
We strengthened our conviction in the company through initial diligence, where we found a warehousing industry
experiencing a fundamental shift. Globalization has made supply chains more complex, urbanization has increased the
need for affordable last-mile delivery solutions, and the rise of e-commerce has stressed the entire system. As a result,
demand for warehouses and distributions centers is at an all time high, vacancy rates are at their lowest levels in 20
years, and warehouse rents have never been higher.
We believe Prologis is well-positioned to capitalize on current trends. They have an attractive portfolio in key markets
and are building high-tech facilities capable of handling sophisticated customers who are looking to outfit their
distribution centers with technology that makes same-day delivery (even 2-hour delivery) not only feasible, but
affordable. Further, the company recently launched Prologis Labs, a mock warehouse where they can test new
technology that they may one day be able to offer their customers. This activity supported our view that Prologis would
continue to lead the industry in technology for the foreseeable future.
From an ESG perspective, the company is hyper focused on sustainability. They have a AA rating from MSCI and the
largest “green portfolio” of real estate in the sector. Further, the ability to offer energy-efficient facilities to customers is
serving as a competitive advantage, as retailers look to reduce their carbon footprint while controlling costs.
Looking ahead, we are interested in investing in Prologis, particularly given the lack of real estate exposure currently in
the portfolio. We believe the company is best-in-class and stands to benefit from a continuing secular trend
(e-commerce growth) while serving as a hedge against inflation. That said, we believe the stock is currently overvalued.
What is now an ideal environment for industrial real estate could quickly reverse in a recession, leading to a significant
23 | Page
Annual Report Haas Socially Responsible Investment Fund
sell-off. We will continue to monitor the company for a buying opportunity and encourage next year’s Principal’s to
expand on our work.
Holding Company Evaluations
Alphabet, Inc.
Thesis
● Stability of growth: “A company this big, has never grown this fast” Google revenues of $137 billion in 2018
represents growth of 23% year over year and has had minor fluctuations in Net Income with a strong balance
sheet
● Strong economic moat: Alphabet dominates the digital ad market with its closest competitor being Facebook. It
benefits from a strong brand and network effects, which it strategically developed (the word “Google” is a
synonym for searching the web)
● Fairly priced: EV/ Operating Income of ~32 and ROCE of ~15%
● Risks: Increased scrutiny about user data privacy among tech companies could jeopardize brand if breached;
Google also faces high competition in Cloud and increasing pressure on margins
Business Overview
Alphabet is a collection of businesses—the largest of which, Google, has business across 5 lines: Search, Advertising,
Consumer Products, Business Platforms, and Hardware. It also includes non-Google businesses (1% of revenues)
collectively referred to as “Other Bets” on its 10-K: Access, Calico, CapitalG, GV, Nest, Verily, Waymo, and X.
Management Assessment
● Tri-Class Shares: Larry, Sergey, & Eric own 56.5% of common stock voting power
● Human Capital: Consistently rated among “Best Places to Work”; strong diverse leadership team (26% women
and 4% ethnic minorities in leadership roles)
● Life insurance policies for executives: None
Revenue Drivers
● User base: With over 1 billion monthly active users on each of Google’s core products (Android, Chrome, Gmail,
Drive, Maps, Search, and YouTube), the brand is one of the most recognized in the world
● Transition to Mobile: With the increase of mobile device usage, people are consuming more online content than
ever, with Google serving as a dominant vehicle across both hardware and software
Competitive Dynamics
● Network Effect: Synonymous with searching the internet, “Google” continues to amass an ever-larger user base,
attracting increased ad revenue (~37% of 2018 domestic digital advertising revenues), nearly double its closest
competitor: FB.
● Rapidly Moving Industry: Core to its industry is an ability to deliver innovation that provides value to users
across an enormous diversity of products. Google has a first mover advantage across many, and deep pockets,
but faces intense competition.
● Currency Hedging: Accounting for 54% of consolidated revenues, international revenues are hedged against
currency fluctuations. ~70% of NI was hedged in 2018.
24 | Page
Annual Report Haas Socially Responsible Investment Fund
Risks:
● Regulation of Privacy and Security Technology: Compliance with evolving laws is costly, decreasing margins,
but also an opportunity to differentiate as an ESG leader.
● Changes in Search Query Trends: Alternative platforms for accessing online content (e-commerce, social media,
etc.) could draw users away, reducing digital ad revenue.
● Supply Chain: 3rd parties that manufacture/ assemble Google’s finished products & distribute services,
including cellular networks, abide by Supplier Code of Conduct.
● Interference with IT systems: Google is subject to daily cybersecurity attacks which could damage its reputation,
leak private data, or interrupt service.
Catalysts
● Backstory: Alphabet’s cybersecurity division’s first product to manage security real time
● Dragonfly: controversial censored search product for China criticized by shareholders
● Wearable Devices: global market estimated to grow at a CAGR of 25% by 2025
● Nest: Google omitted including a “secret” microphone in tech specifications
Valuation
● Valuation: At a $908 price target, GOOGL is overvalued trading at $1,169 on 3/5/19
● EV/ Operating Income: 33x
● ROCE: 15%
AMN Healthcare Services
Thesis
● Industry Tailwinds: Healthcare spending accounts for 20% of US GDP. The aging population drives increasing
healthcare utilization and staffing needs. Labor is the greatest share of a healthcare provider’s total cost. In the
next decade, some of the fastest growing jobs will be in healthcare and elderly assistance, and the entire
healthcare sector is projected to account for a third of all new employment. The global healthcare staffing
market is projected to grow at a 6% CAGR by 2025.
● Moderate Moat: AMN’s economic moat varies by segment. Some of their business segments are highly
competitive and fragmented, such as locum tenens. Recent loss of market share in this segment is evidence of a
weak moat. On the other hand, workforce solutions such as Managed Service Programs (MSP) have a wider
moat with larger switching costs and bigger network effects and provide AMN with a greater ability to cross-sell,
to address various client pain points, to drive more recurring revenue, and to decrease sensitivity to economic
cycles. Since 2008, AMN has evolved from traditional healthcare staffing to providing comprehensive workforce
solutions. In 2008 workforce solutions comprised 4% of the revenue mix while in 2018 they represent 63% of
revenue.
● Slightly underpriced: After taking a dip in share price following below-expectation 2018Q4 results caused by
poor performance in the locum tenens segment, the stock price appears to be slightly undervalued. A
comparable company analysis implies a share price ranging from $47.05 to $68.05.
25 | Page
Annual Report Haas Socially Responsible Investment Fund
● Risks: Recovery of the locum tenens segment, customer concentration, consolidation in healthcare, sensitivity to
macroeconomic scenario, antitrust potential, disruption by new entrants and technology innovation, and
challenges in an M&A-driven strategy.
● ESG: AMN is strong in terms of Gender Equity and Governance. AMN’s CEO Susan Salka is a champion of gender
equality. AMN achieved a 95% rating on the 2018 HRC Corporate Equality Index and was named to the
Bloomberg Gender-Equality Index for 2018 and 2019. Board governance appears to follow best practices:
independent board directors and chairperson, balanced skillset, and open and transparent disclosures of
executive pay and governance practices.
Business Overview
AMN Healthcare provides healthcare workforce solutions and staffing services in the United States. They help hospitals
and medical groups find medical talent (nurses, doctors, an even executives) while providing analytics and other services
that help hospitals run smoothly. In short, their aim is to take over much of the human resources and operational
responsibilities of hospitals so that doctors are free to focus their time on patient care, as opposed to staffing and HR.
Further, they aim to help hospitals manage their workforce more efficiently, increasing profitability for the hospitals
with which they work.
AMN’s services include travel nurse staffing, rapid response nurse staffing and labor disruption services, Local (or per
diem) staffing, locum tenens staffing, allied staffing, physician permanent placement services, interim leadership staffing
and executive search services, managed services programs, vendor management systems, recruitment process
outsourcing, workforce optimization services, and health information management.
Management Assessment:
Susan Salka (CEO) has a long career in the healthcare industry and has held several different executive positions within
AMN, including; CFO, COO and SVP of Business Development. This experience makes her particularly well-suited for the
CEO role, which she has now held for 13 years. Ms. Salka has also made a point to be a public spokesperson, not just for
the company, but for gender equality in the workplace. She also serves on the board of directors of McKesson.
The majority of the c-suite has been with AMN for 10+ years, making clear they promote from within culture. The board
of directors is similarly tenured, with the exception of Daphne Jones, who joined just last year.
The strategic approach from management in recent years appears to be acquire as many companies as possible in order
to increase scale and widen the suite of services offered to clients.
One potential red flag is the lack of a medical doctor in the company’s senior leadership. However, AMN’s Chief Clinical
Officer Dr. Cole Edmonson received the award of AONE Fellow this year, recognizing him for his contributions to the
specialty of nursing leadership and commitment to service and influence in shaping healthcare.
Revenue Drivers:
● Healthcare spending accounts for 20% of US GDP.
● Aging population and corresponding increase in healthcare utilization.
● Public support makes healthcare employment resilient to downturns.
26 | Page
Annual Report Haas Socially Responsible Investment Fund
● Shortage of healthcare professionals (physicians, nurses, and technicians)
● Of the 10 jobs that the Bureau of Labor Statistics projects will see the fastest percent growth in the next decade,
five are in health care and elderly assistance. The entire health-care sector is projected to account for a third of
all new employment.
● Labor is the largest portion of a healthcare provider’s total cost (typically 50% of a hospital budget).
● Healthcare is resistant to two of the most destabilizing forces in labor: globalization and automation.
● Global healthcare staffing market size is likely to reach $44.65 billion by 2025, exhibiting a CAGR of 6%. Locum
tenens is projected to experience the fastest growth because of cost-effectiveness for employers and increase in
the number of physicians choosing to work as locum tenens.
Competitive Dynamics:
● AMN’s economic moat ranges from weak to moderately strong, depending on the segment.
● Locum tenens is a super-competitive marketplace with low barriers to entry, low switching costs, and moderate
network effects.
● MSP has larger switching costs, greater network effects, greater ability to cross sell and address various client
pain points, drive more recurring revenue, and decrease sensitivity to economic cycles.
● MSP contracts are typically exclusive, but outside of MSP, clients are free to offer temporary staffing
assignments to competitors.
● In the nurse and allied segment, there are a few national competitors together with numerous smaller, regional
and local companies, particularly in the per diem business.
● The closest publicly traded comparable is Cross Country Healthcare. It is not performing well at all, and it is an
order of magnitude smaller than AMN.
Risks:
● Customer concentration: Kaiser represents approximately 13% of consolidated revenue and 18% of nursing and
allied solutions segment’s revenue. Further success in MSP could lead to even greater client concentration.
● Consolidation in the healthcare space could both exacerbate client concentration and increase the negotiating
power of clients.
● Macro scenario: An economic slowdown would decrease the employment rate, which would lower the demand
for staffing services in general. Economic downturns also lead to lower hospitalization rates, which would
negatively impact demand for staffing.
● Antitrust: Although far from a monopoly, AMN is the biggest player in numerous segments and has been subject
to antitrust litigation in the past.
● Disruption by new entrants: AMN has no R&D, but has pursued an acquisition-based strategy to expand the
breadth of their offerings and keep up technologically.
● Recovery of Locum Tenens segment: Whether management can recover the Locum Tenens segment is still a
source of uncertainty
● M&A: Whether management has been overpaying for recent M&A and their ability to integrate acquisitions is
still a source of uncertainty.
Catalysts
27 | Page
Annual Report Haas Socially Responsible Investment Fund
● Completion of systems overhaul in locum tenens group has hit the business harder than expected (taking a lot of
time to train and implement, meaning sales people are less focused on selling). It should be wrapped up by late
Q1 2019, early Q2. We should continue to monitor this.
● Many of acquisitions need to be integrated, keep an eye on this.
Valuation
● Based on comparable companies, the median valuation multiples for the comp set are the following: EV/Sales of
1.25, EV/EBITDA of 11.82, EV/FCF of 18.11.
● The stock price implied by this set of multiples using the latest company results is in the $47.05 to $64.41 range.
● Using a selection of forward-looking analyst estimates for EBITDA and Sales, the implied valuation is in the
$47.31 to 56.85 range for 2019 and $51.13 to $68.05 range for 2020.
● Comparable companies were chosen based on the peer set used by the compensation committee. They include
peers from healthcare, commercial and professional services industries, companies in the healthcare and
employment services, healthcare technology and diversified support services sectors.
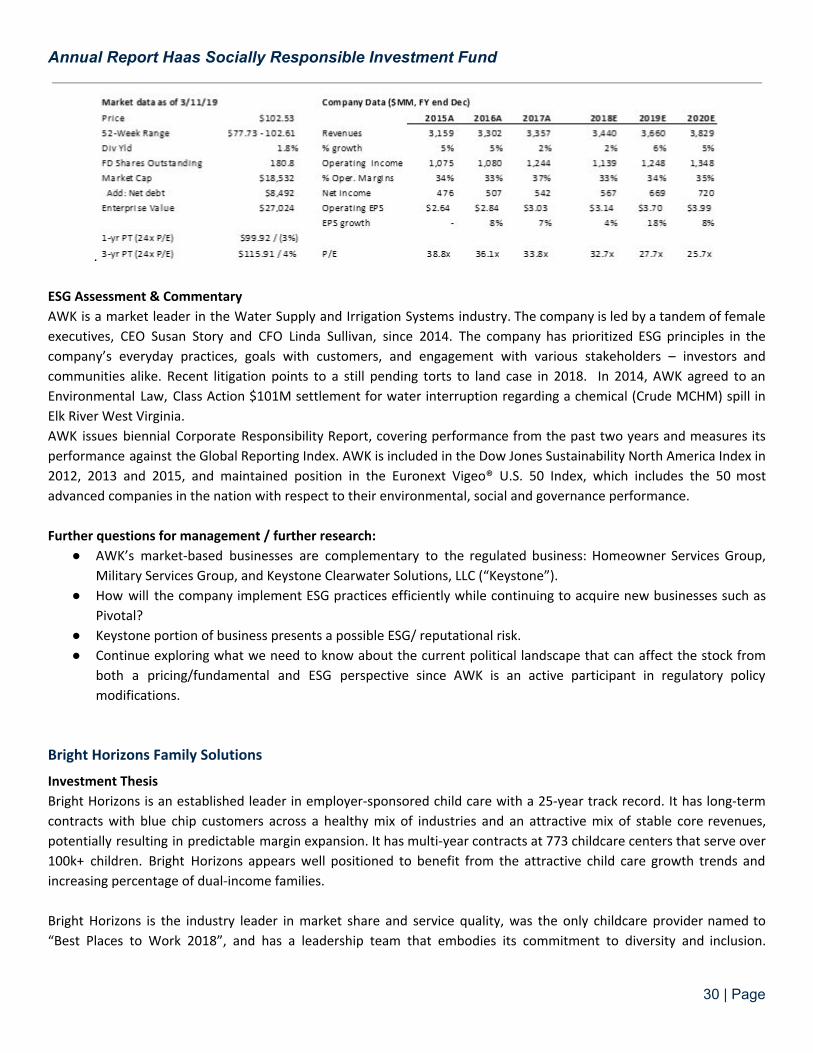
American Water Works Company
Investment Thesis
AWK is well positioned to capitalize on favorable regulatory dynamics, industry trends, and M&A activity, leading to
above average rate base, EPS and DPS growth. AWK’s EPS (7-10%) and dividend (9%) growth prospects as well as
management team best in class for the water industry and utilities in general are expected to fuel attractive total
returns, driven by investment in water infrastructure, improving operating margins, enhanced recovery mechanisms,
acquisition opportunities, and growth in its non-regulated businesses. Effective cost controls and constructive regulatory
outcomes have improved operational efficiency and higher earned ROEs support increasing EPS expectations.
As the largest investor-owned U.S. water and wastewater utility, serving approximately 3.4 million customers in 16
states, AWK has the opportunity to be the leader in sustainability practices for utilities. The company’s environmental
impact is most relevant to the company’s bottom line and an integral part of operations. The management team and
board take ESG practices very seriously as evidenced by their CSR Report and proxy. HSRIF should continue to own this
name as AWK remains committed to industry leading efforts in water quality, sustainable innovation, and environmental
stewardship.
Business Overview
Founded in 1886, American Water Works is the largest investor-owned U.S. water and wastewater utility, serving
approximately 3.4 million customers in 16 states. It provides water and wastewater services to residential, commercial,
and industrial customers, and operates predominantly in regulated markets, which account for ~90% of earnings. Its
non-regulated market-based businesses provide wastewater management operations for military bases, municipalities,
oil and gas exploration and production companies, and other industrial customers.
Industry Dynamics
28 | Page
Annual Report Haas Socially Responsible Investment Fund
There are roughly 54,000 providers of water service in the country (the majority of these service provides serve fewer
than 3,000 connections) and 84% of those are government entities. There are eight publicly-traded water utilities in the
U.S. which make up roughly the 16% balance of the sector with AWK and WTR being the largest by market cap.
● Per capita water consumption is expected to decrease; however, prices are expected to rise.
● The privatization of water supply infrastructure has facilitated profit margin growth.
● The persistent trend of mergers and acquisitions in the industry during the previous five-year period is expected
to continue over the next five years, suppressing the number of new operators
Investment Positives
● Earnings & Dividend Growth: Investors expect EPS and dividend growth to average approximately 10% annually
over the next five years
● Economies of scale: The size of AWK is an advantage in pursuing new customers and acquisitions in the coming
years. Tuck-ins to existing systems are a cheap source of growth if the price is reasonable
● Capex Investment Opportunities: Much of AWK infrastructure is old and will require significant investment over
the coming decades, allowing the company to increase its rate base and earnings for many years to come.
Investment Risks
● Infrastructure plans present execution risk. Rising rates for water may meet push back.
● Conservation is biting into weather-adjusted usage across American Water's territories, requiring higher rates to
maintain returns.
● Regulatory Risks: AWK’s NY subsidiary is under investigation by the PSC related to billing issues in their service
territory; the PSC has also previously been critical of company’s record keeping.
● Regulated Utility Risks: (1) rate case risk, (2) lower/higher capex outlook, and (3) decline/increase in allowed
ROEs.
Valuation
AWK is relatively expensive compared to comparable companies. However, the premium is justified based on the strong
management team, execution, and inorganic growth opportunities. AWK also benefits from scale, regulatory tailwinds,
and projected earnings growth. If the company drops below 25x P/E, there is an opportunity to add to the position over
time.
My price target is $116 price target equates to ~27x 2020 EPS estimate. At approximately $100 per share, $116/share PT
represents a 4% IRR over a 3-year period, a conserve estimate based on the company’s regulatory guidelines, history of
FCF generation, 10% ROE authorization and prudent balance sheet.
AWK trades at the lowest PEG ratio of its peers (2.7x vs peers at 3.6x–5.4x), despite having the highest EPS growth rate
(8.3% vs. peers at 5.3%–6.3%). However, I caution that water utilities as a group are trading at nearly a 70% premium to
the S&P 500 (FY1 P/E), compared to the historical average premium of ~40%
29 | Page
Annual Report Haas Socially Responsible Investment Fund
.
ESG Assessment & Commentary
AWK is a market leader in the Water Supply and Irrigation Systems industry. The company is led by a tandem of female
executives, CEO Susan Story and CFO Linda Sullivan, since 2014. The company has prioritized ESG principles in the
company’s everyday practices, goals with customers, and engagement with various stakeholders – investors and
communities alike. Recent litigation points to a still pending torts to land case in 2018. In 2014, AWK agreed to an
Environmental Law, Class Action $101M settlement for water interruption regarding a chemical (Crude MCHM) spill in
Elk River West Virginia.
AWK issues biennial Corporate Responsibility Report, covering performance from the past two years and measures its
performance against the Global Reporting Index. AWK is included in the Dow Jones Sustainability North America Index in
2012, 2013 and 2015, and maintained position in the Euronext Vigeo® U.S. 50 Index, which includes the 50 most
advanced companies in the nation with respect to their environmental, social and governance performance.
Further questions for management / further research:
● AWK’s market-based businesses are complementary to the regulated business: Homeowner Services Group,
Military Services Group, and Keystone Clearwater Solutions, LLC (“Keystone”).
● How will the company implement ESG practices efficiently while continuing to acquire new businesses such as
Pivotal?
● Keystone portion of business presents a possible ESG/ reputational risk.
● Continue exploring what we need to know about the current political landscape that can affect the stock from
both a pricing/fundamental and ESG perspective since AWK is an active participant in regulatory policy
modifications.
Bright Horizons Family Solutions
Investment Thesis
Bright Horizons is an established leader in employer-sponsored child care with a 25-year track record. It has long-term
contracts with blue chip customers across a healthy mix of industries and an attractive mix of stable core revenues,
potentially resulting in predictable margin expansion. It has multi-year contracts at 773 childcare centers that serve over
100k+ children. Bright Horizons appears well positioned to benefit from the attractive child care growth trends and
increasing percentage of dual-income families.
Bright Horizons is the industry leader in market share and service quality, was the only childcare provider named to
“Best Places to Work 2018”, and has a leadership team that embodies its commitment to diversity and inclusion.
30 | Page
Annual Report Haas Socially Responsible Investment Fund
Creating efficiencies in the labor-intensive industry of early childhood care will increase access and meet the changing
demands of working parents and guardians.
Business Overview
Bright Horizons operates childcare centers for employed, affluent parents in communities with robust third-party
financial assistance, either via employers or the government. Key contracts to operate child care centers for leading
companies propelled it to industry leadership with revenue more than 6x that of its closest competitor. Two
complementary offerings, which are considered growth segments, focus on backup childcare services and college
advisory services (13.7% and 4% of revenue respectively). Currently 22% of customers use more than one product, a
number that grows at a rate of about 1% per year. In 2018, Bright Horizons launched a tuition assistance program to
reduce up-front costs for degree-seeking employees, primarily in response to increasing higher education requirements
for providers of early childcare.
Management Assessment
The Board of Directors has a solid mixture of long-standing BFAM employees and new talent that bringing enterprise
experience from various sectors and new energy. The executive team has deep knowledge of the education industry,
including CEO Stephen Kramer who founded the tuition assistance company acquired by BFAM. While three board
members still have close ties to Bain Capital, previous principals’ concern around the outsized influence were quieted
when Bain exited its position as Bright Horizons’ largest shareholder. Bright Horizons is in an industry that is
predominantly female, so the ongoing gender diversity of the board is key. There is a notable disparity between the
racial diversity of its employees and its predominantly white-identifying board, a disconnect that must be monitored
especially regarding the design and ethics of its new talent retention programs.
Revenue Drivers
Bright Horizons is reaping the benefits of technology and talent investments, a steady customer base, and ongoing
enrollment and tuition increases. BFAM made investments in technology throughout the company, such as
improvements to the parent experience, and is now focused on securing quality talent via its tuition assistance program.
Large investments are behind BFAM as seen in COGS/Revenue and Sales & Marketing/Revenue trending down. Analysts
estimate that full-service corporate childcare is only ~10% penetrated and BFAM has a target penetration rate of 25%,
leaving room for ample growth. BFAM attributes its organic growth to steady referrals via HR executives in blue chip
corporations. The increasing presence of women in the workplace and war for talent continue to support internal
employee demand for such policies. Modern family structures including increasing rates of pregnancy over age 35 and
dual-income households reinforce this trend, though women still exit the workforce at higher rates. As it grows, BFAM
continues to search for the ceiling on revenue potential of existing programs via annual tuition increases, filling existing
centers to capacity (especially new leased consortium centers), and closure of under-enrolled centers.
Competitive Dynamics
BFAM grows via acquisition of smaller childcare providers, so competition is limited to other large networks including
Knowledge Learning, Learning Care Group, and Care.com. Bright Horizons is still six times the size of the #2 provider,
Care.com, which recently won the bid to be the childcare provider for Starbucks but has faced negative press regarding
its caregiver screening processes. Analysts expect ongoing M&A to complement organic growth for 7-8% YoY growth in
the next three years and do not foresee any significant change in the competitive landscape.
31 | Page
Annual Report Haas Socially Responsible Investment Fund
Risks
The expected economic downturn and already declining growth of the company are concerning for investors, given the
strong peak that the company experienced during the bull market. Related, Bright Horizons’ expansion into lease
consortium centers has yielded strong growth but these new customers lack employer sponsorship and could have a
higher rate of attrition in a downturn. Finally, although they do not face similarly large competitors, Bright Horizons does
maintain a higher price point and could lose customers to lower-cost alternatives during economic uncertainty. (Average
cost is $1900/month for infants down to $1400/month for preschool-aged children.)
Catalysts
In an attempt to cut costs over the next decade, Bright Horizons is looking to its primary cost driver, employee
recruitment and retention, through education benefits in an industry that increasingly demands a two- or four-year
degree. Bright Horizons offers employees upfront tuition assistance for three partner universities. This ties employees to
tuition repayment plans to Bright Horizons within a key period of employee retention; the ‘Social’ rating of this policy
rests on the quality of experience for teachers, long-term financial returns to teachers on this investment, and
portability of the degree across the early childcare market. Executives have assured analysts that the impact of the
upfront investment on BFAM’s financials is minimal.
BFAM will also pursue additional acquisitions of local networks of childcare providers throughout the US and the UK.
While unlikely in the near term, there are opportunities for international expansion where government and
employer-supported childcare is prominent. Executives have been hesitant to comment, only confirming the names of
countries that do have third-party subsidies for childcare on quarterly earnings calls. Similar to the UK and Netherlands,
expansion would primarily driven via acquisitions.
Valuation
As of April 25, BFAM’s stock was $128.05 per share, in the upper end of its 52-week range of $91.29 - $129.32. It was on
target with the average analyst target price, and is expected to post quarterly earnings of $0.79 per share in its
upcoming report, which represents a year-over-year change of +9.7%. Revenues are expected to be $497.41 million, up
7.3% and a reflection of the steady growth expectations set by the executive team. The recommendation is to hold this
position and actively monitor the impact of its core business and tuition assistance program to determine whether it is
“ESG Good.”
Canadian National Railway Company
Investment Thesis
CNI is one of a kind railroad operator, equipped with a unique rail network and healthy margins that would protect the
company in the case of downturns in the economy or other headwinds. In addition, the adoption of new technologies in
locomotive and transportation logistics, CNI is considered a leader in environmental impact and worker safety within the
industry. CNI’s continued business success will be directly tied to its energy and environmental efforts, which also
highlights this investment as an ESG risk. For example, routing protocols facilitating the movement of customer
shipments in the most efficient way or collaborating with ports to minimize dwell times would drive economic and
energy efficiencies.
Transportation accounts for 28% per cent of Canada’s GHG emissions, with railways generating 5% of that, or 1% of the
country’s emissions. While the transportation industry as a whole is carbon intensive, it is indispensable and rail is the
32 | Page
Annual Report Haas Socially Responsible Investment Fund
most sustainable choice. CNI, North America’s largest railway, leads the industry with fuel consumption ~15% below the
industry average.
Dow Jones Sustainability World Index (DJSI) has listed CNI for 7 consecutive years on its World Index and CNI is the only
Canadian company listed in the Transportation and Transportation Infrastructure sector. CNI has been recognized as one
of Canada’s Best Diversity Employers for a third consecutive year. 3
Business Overview
Canadian National Railway is a Class 1 freight railway headquartered in Montreal, Quebec that operates a network of 4 5
approximately 20,000 route miles of track serving Canada and the Mid-America, connecting three coasts: the Atlantic,
the Pacific and the Gulf of Mexico. The Company manages its rail operations in Canada and the U.S. as one business
segment. From a geographic standpoint, 16% of revenues relate to U.S. domestic traffic, 33% transborder traffic, 17%
Canadian domestic traffic and 34% overseas traffic.
Management Assessment
There are minimal governance concerns, with depth and breadth of experience on the board; board tenure is in excess
of 20 years. There is reasonable gender diversity, with 5 out of the 13 directors women. Most recent senior
appointments have been from within.
Revenue Drivers
CNI handles over $250 billion worth of goods annually and carries over 300 million tons of cargo, serving exporters,
importers, retailers, farmers and manufacturers. Its services include rail, intermodal container, and trucking services as
well as supply chain solutions, including warehousing and distribution. The Company's freight includes seven commodity
groups representing a portfolio of goods, including petroleum and chemicals, metals and minerals, forest products, coal,
grain and fertilizers, intermodal and automotive.
Competitive Dynamics
Operating Margins: CNI has historically had very strong ORs due to the characteristics of its network. However, this
long-standing position as the ‘highest margin railroad’ seems to have been challenged. While the company has been able
to eke out efficiency gains and has consistently been ahead of competitors in this metric, Canadian Pacific and others
have been narrowing the distance, so the question of whether CNI will be able to continue to lead on this metric
remains. For example, CNI’s OR was at 58.2% in the last quarter of 2018; for 2017, CNI and CP were at par at 57.4% - the
first time in more than 20 years that Canadian National hadn’t topped its Calgary-based rival.
Reach: Canadian National has been around for almost 100 years and is the only transcontinental railway that has built a
unique three-coast, T-shaped network.
Barriers to Entry: Class I railroads have in place networks of assets and rights of way that typically span tens of thousands
of miles, making entry to the market cost prohibitive. Replicating such access would mean massive capital investments
and overcoming myriad regulatory barriers.
3 https://www.canadastop100.com/diversity/ 4 In the United States, railroads are designated as Class I, II, or III, according to size criteria. 5 Nearly 40% of all freight in the U.S. is transported by rail, which is a significant portion of the economy.
33 | Page
Annual Report Haas Socially Responsible Investment Fund
Risks
The Company is exposed to commodity price risk related to purchases of fuel and the potential reduction in net income
due to increases in prices (which it offsets through a customer surcharge program). Despite client and commodity
diversification, most industries served (automotive, coal, grain and petroleum) all highly dependent on general state of
economy and similar cyclicality.
Although CNI reports its earnings in Canadian dollars, a large portion of its revenues and expenses is denominated in
U.S. dollars. The fluctuation of the Canadian dollar relative to the U.S. dollar affects the conversion of the Company's
U.S.-dollar-denominated revenues and expenses. The estimated annual impact on net income of a one-cent change in
the Canadian dollar relative to the US dollar is approximately $30 million.
CNI has been fined multiple times in the past couple of years and also been added to the ‘Federal Environmental
Offenders Lists’. Sustainalytics Data also rates CN below competitors on environmental factors, despite an overall A from
MSCI.
Catalysts
CNI spent ~25% of its revenue on expansion in 2018, and estimated to be in the range of 23%-25% for 2019. Some of the
expansions announced in the first quarter of 2019 are:
- Acquired Winnipeg-based The TransX Group of Companies, one of Canada’s largest and oldest transportation
companies; long term supply chain partner
- Laid out $615 million capital plan for Eastern Provinces
- Investing $320 million to expand and strengthen Ontario’s rail infrastructure
- Investing $245 million to expand and strengthen Saskatchewan’s rail infrastructure
- Investing $345 million to expand and strengthen British Columbia’s rail infrastructure
- Investing $120 million to expand and strengthen Manitoba’s rail infrastructure
- Investing $245 million in Quebec’s rail infrastructure and in technology
- Investing $45 million in New Brunswick’s rail infrastructure
Valuation
As of April 5, CNI’s stock was $90.63 per share, in the upper end of its 52 week range of $70.36 - $91.90. It had crossed
the average analyst 12-month target price of $88.02, changing hands for $88.38/share.
The average annual EPS growth rate is of 9.1%, driven by continued share repurchases; Board of Directors approved an
18% dividend increase for 2019 and approved a share buyback program of up to 22 million shares for an amount of $1.7
billion. The 2018 Q4 EPS of $1.49, beating the Thomson Reuters' consensus estimate of $1.11.
First Solar Inc.
Investment Thesis
Energy sector and solar stocks in particular went through an extremely volatile year in 2018. The vast growth that the
solar companies enjoyed prior to Q2 2018 was halted by China’s decision to stop the domestic subsidy program in May
2018. The trade war between the US and China that ensued further dampened the prospects of the industry as it put
34 | Page
Annual Report Haas Socially Responsible Investment Fund
significant pressures on raw materials and flow of related products. The significant uncertainty regarding the oversupply
and diminished demand for the industry slashed prices across the sector and put a significant number of market
participants in distress. First Solar weathered the storm as it largely avoided the negative effects of imposed tariffs due
to favorable exemptions and significant revenue concentration in the U.S. market.
Solar stocks have had a strong start in 2019 (Solar Sector (TAN) is up ~30% (FSLR up ~32%) vs. ~15% gain for S&P).
Sentiment towards renewable energy and solar in particular has been trending in the right direction and the solar stocks
have adequately captured renewed interest. Utilities and even the oil majors are directing their focus towards
renewables and the sector is poised to recover from the 2018 slump. As the tariff talks are easing and, at the very least,
the industries are learning to cope with the international regulatory headwinds better, the solar industry stands to gain a
lot of ground. In 2018, utility industry signed 13.2GW of power-purchase agreements, creating the largest pipeline of
contracted projects in history. Utility-scale solar market growth is expected to continue to grow at a compounded rate of
40% through 2020. First Solar is the undisputed leader in the field and as the industry puts the 2018 behind, FSLR is well
positioned to strengthen and extend its lead in the sector. We strongly believe that FSLR presents a sound growth
opportunity going forward.
Business Overview
First Solar, Inc. designs and manufactures solar modules with an advanced thin film semiconductor technology that is
one of the lowest costs in the world. First Solar objective is to reduce the cost of solar electricity to levels that compete
on a non-subsidized basis with the price of retail electricity in key markets throughout the world. From raw material
sourcing through end-of-life module recycling, First Solar's renewable energy systems protect and enhance the
environment. By enabling clean renewable electricity at affordable prices, First Solar provides an economic alternative to
peak conventional electricity and the related fossil fuel dependence, greenhouse gas emissions and peak time grid
constraints.
Management Assessment
For a decade (2000-2009) FSLR was helmed by Michael Ahearn, who led the development and
expansion of First Solar from a small privately-held company to a successful multinational
industry-leading public company. He stepped down from the post in 2016, and currently serves
as a Non-Executive chairman of the board. Mr. Ahearn currently serves as a member of the
Global Advisory Board of Beijing Climate Policy Initiative.
In 2016, Mr. Ahearn transitioned the post to then CFO, Mark Widmar, who has been in the post
since. The CFO vacancy at the time was filled by Alexander Bradley who served as the company’s
treasurer at the time. The aforementioned tandem have significant experience in accounting,
investment banking and M&A. Such is evident by FSLR’s successes in acquisition-based growth
and above average capacity to integrate.
Revenue Drivers
- Contracted solar assets
- Series 6 panel development
- Strong and improving public sentiment towards alternative energy
35 | Page
Annual Report Haas Socially Responsible Investment Fund
Competitive Dynamics
FSLR is well positioned among the peers as the manufacturers at large were significantly hit by China’s halt of the
domestic subsidies, ensuing oversupply of the solar panels in the market, and, among other setbacks, U.S. and China
trade war that significantly impacted raw material procurement and imports to the U.S. FSLR withstood the volatility in
the market and continued to develop it’s newest panel (series 6 model). With series 6 on-track for Q4 2019, FSLR will
continue to outpace the competition that is currently suffering through a price war due to significant oversupply of the
panels in the markets outside the U.S.
Risks
2018 presented a prime example of how dependent the industry is on policy decisions. FSLR benefited from being on the
“right” side of the battle between the U.S. and China, but FSLR’s stock performance is a clear indicator of how volatile
the environment outside the company’s control is.
It is worth noting that FY 2018 and Q4’18 results and forward looking guidance reported by the company in February
2019 pointed to potential difficulties ahead. FSLR’s guidance was updated to reflect lower expected operating expenses,
primarily associated with a decrease in expected production start-up, and gross margin guidance was lowered because
of expected increases in ramp costs. The latter is worth inspecting further as the aforementioned oversupply in the
industry has pushed it into the price competition stage and FSLR’s ability to outpace the competition on innovation while
maintaining the cost function in check is the primary factor distinguishing FSLR from the rest of the industry. The margin
contraction points to the Company’s latest panel model “Series-6” ramp challenges, which the company plans to address
in 2H19. Moreover, the company’s fixed contracted module prices are unlikely to benefit from near-term sector demand
improvement.
Catalysts
While China posed significant threats to the industry as a whole in 2018, now that the market has weathered the storm,
China is likely a positive catalyst in terms of policy. Further, the turbulence in fossil fuel markets is further pushing
populations and businesses to reconsider energy dependence and the sentiment towards alternative cleaner energy is
expected to strengthen.
Valuation
While the FY 2018 results indicated potential headwinds ahead, the Series 6 progress in 2019 continues to be
encouraging with the start of production at a fourth factory and ongoing improvements in throughput and efficiency at
FSLR’s existing facilities. The company continues to see good demand for Series 6, and the pipeline of contracted
shipments positions it well for the year. Given that the margins are currently suffering from the initial ramp-up of
production and that the novelty of the product is still posing issues for achievable streamlining of the operations, we
expect the unit economics of Series 6 to improve over the FY2019, which will further improve FSLR’s leading position in
the industry. Due to the aforementioned turbulence in the industry during FY2018, it is unlikely that the struggling
competitors would be able to capitalize on this short-term hiccup. Such has been further evident in the company’s
performance so far in the 2019. The company is up 45% YTD and put it’s efforts behind the improvement plans since the
FY 2018 results announcement and guidance revisions (up ~18% since Feb ‘19). Current stock price is in-line with the
HSRIF valuation model.
36 | Page
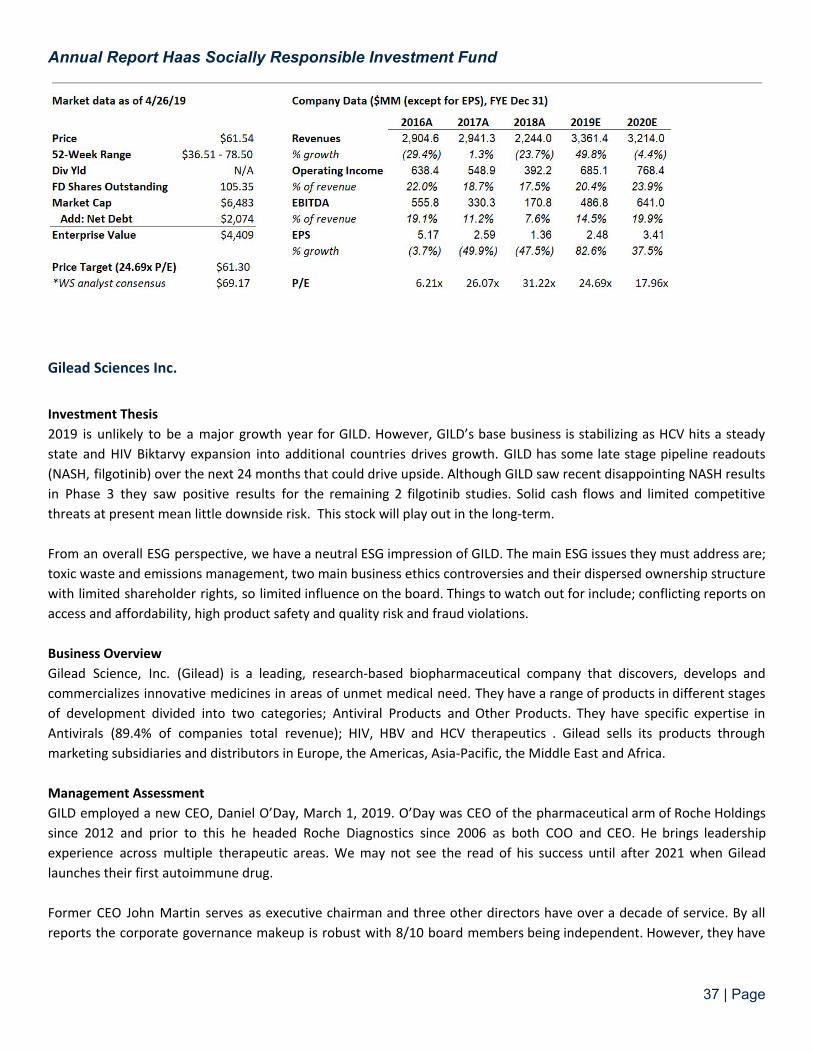
Annual Report Haas Socially Responsible Investment Fund
Gilead Sciences Inc.
Investment Thesis
2019 is unlikely to be a major growth year for GILD. However, GILD’s base business is stabilizing as HCV hits a steady
state and HIV Biktarvy expansion into additional countries drives growth. GILD has some late stage pipeline readouts
(NASH, filgotinib) over the next 24 months that could drive upside. Although GILD saw recent disappointing NASH results
in Phase 3 they saw positive results for the remaining 2 filgotinib studies. Solid cash flows and limited competitive
threats at present mean little downside risk. This stock will play out in the long-term.
From an overall ESG perspective, we have a neutral ESG impression of GILD. The main ESG issues they must address are;
toxic waste and emissions management, two main business ethics controversies and their dispersed ownership structure
with limited shareholder rights, so limited influence on the board. Things to watch out for include; conflicting reports on
access and affordability, high product safety and quality risk and fraud violations.
Business Overview
Gilead Science, Inc. (Gilead) is a leading, research-based biopharmaceutical company that discovers, develops and
commercializes innovative medicines in areas of unmet medical need. They have a range of products in different stages
of development divided into two categories; Antiviral Products and Other Products. They have specific expertise in
Antivirals (89.4% of companies total revenue); HIV, HBV and HCV therapeutics . Gilead sells its products through
marketing subsidiaries and distributors in Europe, the Americas, Asia-Pacific, the Middle East and Africa.
Management Assessment
GILD employed a new CEO, Daniel O’Day, March 1, 2019. O’Day was CEO of the pharmaceutical arm of Roche Holdings
since 2012 and prior to this he headed Roche Diagnostics since 2006 as both COO and CEO. He brings leadership
experience across multiple therapeutic areas. We may not see the read of his success until after 2021 when Gilead
launches their first autoimmune drug.
Former CEO John Martin serves as executive chairman and three other directors have over a decade of service. By all
reports the corporate governance makeup is robust with 8/10 board members being independent. However, they have
37 | Page
Annual Report Haas Socially Responsible Investment Fund
diversity issues on their board, with only 3/10 being female, and on their senior management team, with 4/10 being
female.
Revenue Drivers
GILD’s revenue drivers to watch are; HIV and HCV product revenues, cell immunotherapy advancements and
development of products in pipeline. In 2018 GILD saw an increase in sales of their other products which was positive as
there was a 15.9% decline in Antiviral Products. Additionally, they have 241 active drug programs in their pipeline. In
April this year they received a 60% Freshness (proportion of revenue generated from drugs approved in the past 5 years)
Index rating, more than twice its nearest rivals and an average across the top 30 companies of just 11%.
Their drug, Biktarvy (part of the HIV franchise), was approved in 2018 in the US and could counteract some of the
product revenue declines. Following this it has been approved in many countries around the world including most
recently in Japan in March this year. It will continue to provide stiff competition to GlaxoSmith’s existing therapies,
Tivicay and Triumeq. It is expected to overtake Genvoya as the most successful launch in HIV history. GILD is also making
a move into “authorized” generics of 2/3 HCV drugs through subsidiary Asegua Therapeutics in an attempt to come out
ahead of other generics and lower prices.
Furthermore, GILD USD$11.9bn acquisition of Kite Pharma Inc. (pioneer in cell therapy) in 2017 has given them an
advantage in the development of cancer immunotherapy products. This enables Gilead to strengthen their position in
oncology and cell therapy, two key markets of growth.
Competitive Dynamics
GILD has a moat in HIV and HCV markets due to historical leadership in oral, antiviral therapeutics. In April this year GILD
topped the Pharmaceutical Innovation Index for the First time due to their new antiviral therapy which significantly
strengthened one of their key therapy area portfolio strategies. Additionally, they are expanding operations into other
drugs and could see moats develop in those areas.
However, they operate in a competitive segment of pharmaceuticals and biotech. Their key products face competition
from a variety of companies depending on the product. For example, the HCV franchise saw a decline in sales in the last
3-4 years due to competition from AbbVie, Inc. To counteract this competitive pressure GILD has extensive Research and
Development Initiatives, which enable them to attain key patents for compound and technologies, spending USD$3,374
million in 2017.
Risks
GILD faces several industry risks. A number of their drug patents will expire soon. Thus, the long-term financials of GILD
rely on a heavy investment in R&D and drug innovation. Another major risk for the industry is the clinical and regulatory
risk for additional key pipeline candidates.
Additionally, a substantial portion of revenues are derived from the sale of products to treat HCV and HIV. These sales
could decline because of; patient decreases, competition from new or generic products. HCV product sales were $902
million for the third quarter of 2018 compared to $2.2 billion for the same period in 2017. This was a faster than
anticipated decline due to increased competition. This decline could be remedied for the moment by the huge growth of
38 | Page
Annual Report Haas Socially Responsible Investment Fund
Biktravy. Additionally, in March this year the Phase 3 DISCOVER data (for the Descovy treatment of HIV) is supportive of
expanding the label for PrEP. All of which could lead to increased product revenue.
Another risk is the slower than expected commercialization of Yescarta, CAR T Therapy for Non-Hodgkin Lymphoma. This
could be remedied by the fact that in January NICE recommended its use for treatment of 2 types of lymphoma.
Catalysts
The main catalysts for GILD at present are the approval of Filgotinib and the development of NASH. The Filgotinib, a drug
used to treat Crohn’s disease and arthritis, regulatory path is evolving. A MANTA tox study could be a limiting step in
FDA approval, however they expecting a 2021 approval. On March 28 this year Gilead and Galapagos reported top-line
results from FINCH-1 and FINCH-3, the second and third of three Phase III studies.
The other main catalyst is the results of the NASH STELLAR 4 trial for non-alcoholic steatohepatitis. NASH has no current
treatment and is expected to become the leading cause of liver transplants in the next decade. The company was
expecting successful readout for phase 3 but as of February 12 it didn’t meet its primary endpoint, pending proof of
concept.
Valuation
As of April 24 GILD’s stock price was $62.82, near its low 52 week range of $60.32- $79.61.
GILD’s P/E ratio is estimated to decrease to 2021 and is below the mean of competitors currently at 9.93 to 13.17.
However, their EPS is estimated to increase to 2021 to 7.41 and right now is exceeding competitors at 6.67 to 6.60. In
the medical/biomedical companies it has the 2nd highest total assets and 2nd highest revenues. Within its sector GILD
has a strong relative ROE of 25.4% and ROA of 8.6%.
Additionally, it is believed that GILD will continue to have a flat year in 2019 (16% Y/Y growth), with an expected return
to growth in 2020. GILD appears capable of compensating for HCV trends so we do not expect continued declines in
revenues. Due to these projected cash flow GILD is undervalued. The average analyst valuation for GILD on Thomson
One is $80.43.
Mastercard Inc.
Investment Thesis
Mastercard is a strong business with globally distributed revenue sources. This is a highly profitable business that is still
growing at double-digits. As more and more financial transactions are moving to digital, there is still room for growth in
this industry going forward especially in emerging markets. The barrier to entry is high and the market is dominated by a
handful of players. However, this industry is primed for disruption. So, we will have to constantly monitor this company
and make assessment accordingly.
MA is one of the top performing stocks of 2018 with 25.32% return compared to a -3.35% return for S&P 500. HSRIF
portfolio position in MA is 1.14% . The business fundamentals for Mastercard is strong. So, my recommendation for MA
is a “Hold”. However, given the strength of the payment sector, I would recommend reviewing the asset allocation of
the payment sector and increasing the allocation to this sector as a whole and spread the increase across Mastercard,
Paypal and Visa.
39 | Page
Annual Report Haas Socially Responsible Investment Fund
Business Overview
Mastercard is a technology company in the global payments industry that connects consumers, financial institutions,
merchants, governments, digital partners, businesses and other organizations worldwide, enabling them to use
electronic forms of payment instead of cash and checks. Mastercard facilitate payments using a family of brands,
Mastercard®, Maestro®, Cirrus® and Masterpass®. They also recently acquired VocaLink Holdings Limited (“Vocalink”),
that has allowed them to expand their capabilities to process automated clearing house (“ACH”) transactions.
Industry Dynamics
The barrier to entry is high and the market is dominated by a handful of players. However, this industry may be primed
for disruption, particularly with the emergence of Crypto currency and BlockChain technologies. So, we will have to
constantly monitor this company and make assessment accordingly.
Investment Positives
● Industry with potential for additional growth: As more payments are becoming digitized, the industry is
growing. Mastercard will need to effectively monetize on this growth and the past few years’ financial reflects
this.
● Impressive operating margin: Operating margin is consistent at around 55%. This is a very profitable business
Investment Risks
● Regulation: Added regulation could incur additional cost for Mastercard.
● Data security: Reputational damage to any potential customer data breach.
● Competition: While there are only a handful of competitors in this industry, it is possible that a disruption can
occur from a new technology
Valuation
As of Friday, April 26, Mastercard stock was trading at $246.68 per share, up 31% since the start of 2019 as compared to
a return of 18% for S&P 500. We have a HOLD recommendation for Mastercard with a 1-yr price target of 269.54 (P/W
30x times 2020 EPS of 8.94). Analysis consensus recommendation is a Buy with an average price target of $253. Analyst
target price ranged from $231 to $278.
ESG Assessment & Commentary
Mastercard seems to be committed to ESG. They explain it as “doing well by doing good”. They are committed to
providing technological innovations and help small businesses grow, bring financial services to more people that are now
excluded, ensuring gender equity and equal pay across all locations resulting in an inspired workforce and sourcing
renewable energy for 100% of its global operations. So, overall, they have a very strong track record in ESG.
Microsoft Corporation
Investment Thesis
MSFT continues to position itself well as the “non-AWS” platform of choice for cloud computing, gaining market share
on the industry leader. It’s revenue diversification by vertical along with strong economics associated with subscription
40 | Page
Annual Report Haas Socially Responsible Investment Fund
service (software / gaming) indicate continued performance for the stock and a positive outlook for its future. A
well-aligned management team with ~100 years of experience at MSFT provides stable leadership to drive synergies
across multiple product lines, further entrenching MSFT’s position.
In terms of ESG, MSFT utilizes its leadership in several product types to create change for social good. Materially, it
leverages its White Space Television program to generate market space for its cloud and subscription-based software
companies. Interacting with non-profits, either directly or through employee programs, builds brand loyalty and further
entrenches the Microsoft ecosystem for customers. While the numbers have moved, more effort is required to combat
weak URM and female workforce demographics.
Business Overview
Microsoft is a global provider of software, hardware, and services. Its business is organized into three segments:
productivity and business processes (including Microsoft Office and Dynamics), intelligent cloud (including Azure,
Windows Server OS, and SQL Server), and more personal computing (including Windows Client, Xbox, Surface, phones,
and Bing search advertising).
Industry Dynamics
Due to its breath of revenue streams, there is no one industry dynamic for MSFT to compete against. Breaking down the
business units provides insight on individual competitive trends that meld together into a MSFT dynamic.
Productivity and business processes focus on competitors to both its office products (e.g. GSuite) as well as the
marketing and CRM space (e.g. Salesforce.) Both of these sub-verticales are defined by one or two major players and a
healthy developer ecosystem that rewards platform developers. Additional tailwinds to the space is the continued
development of cloud deployment.
Intelligent Cloud is the second product line for Microsoft. As mentioned, the entire space enjoys strong tailwinds.
Amazon enjoyed a first mover advantage to grab significant market share initially, but both MSFT and Google Cloud are
gaining share quarter over quarter by focusing on additional capability sets (either software or hardware infrastructure.)
MSFT’s final product set, “more personal computing” involves many legacy products, such as its operating system and
hardware products. This segment is the most diverse in dynamics ranging from MSFT being a segment leader with an
entrenched position (Windows operating system) to a highly competitive segment driven by product life cycles (such as
the Surface Pro or Xbox gaming system).
Investment Positives
● Strategic partnerships: MSFT leverages key partnerships, such as with Adobe, to compliment its existing
ecosystem of business software. This allows it to build out its customer base without first investing time /
money to compete directly with largest competitors (i.e. Salesforce)
● Cloud tailwinds: Taking advantage of industry wide tailwinds in cloud computing, MSFT has successfully
positioned itself as the non-AWS platform. This allows for synergies both internal to its own products (through
the “365” Saas concept) as well as general cloud computing needs for Amazon’s direct competitors.
41 | Page
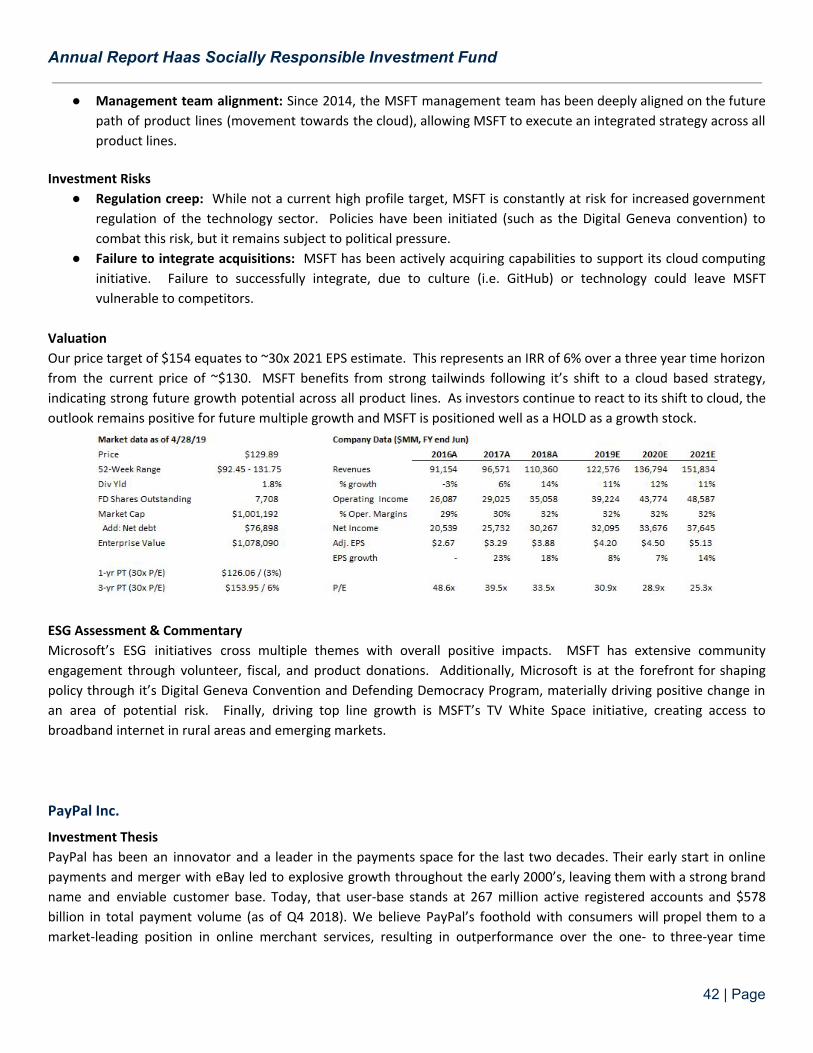
Annual Report Haas Socially Responsible Investment Fund
● Management team alignment: Since 2014, the MSFT management team has been deeply aligned on the future
path of product lines (movement towards the cloud), allowing MSFT to execute an integrated strategy across all
product lines.
Investment Risks
● Regulation creep: While not a current high profile target, MSFT is constantly at risk for increased government
regulation of the technology sector. Policies have been initiated (such as the Digital Geneva convention) to
combat this risk, but it remains subject to political pressure.
● Failure to integrate acquisitions: MSFT has been actively acquiring capabilities to support its cloud computing
initiative. Failure to successfully integrate, due to culture (i.e. GitHub) or technology could leave MSFT
vulnerable to competitors.
Valuation
Our price target of $154 equates to ~30x 2021 EPS estimate. This represents an IRR of 6% over a three year time horizon
from the current price of ~$130. MSFT benefits from strong tailwinds following it’s shift to a cloud based strategy,
indicating strong future growth potential across all product lines. As investors continue to react to its shift to cloud, the
outlook remains positive for future multiple growth and MSFT is positioned well as a HOLD as a growth stock.
ESG Assessment & Commentary
Microsoft’s ESG initiatives cross multiple themes with overall positive impacts. MSFT has extensive community
engagement through volunteer, fiscal, and product donations. Additionally, Microsoft is at the forefront for shaping
policy through it’s Digital Geneva Convention and Defending Democracy Program, materially driving positive change in
an area of potential risk. Finally, driving top line growth is MSFT’s TV White Space initiative, creating access to
broadband internet in rural areas and emerging markets.
PayPal Inc.
Investment Thesis
PayPal has been an innovator and a leader in the payments space for the last two decades. Their early start in online
payments and merger with eBay led to explosive growth throughout the early 2000’s, leaving them with a strong brand
name and enviable customer base. Today, that user-base stands at 267 million active registered accounts and $578
billion in total payment volume (as of Q4 2018). We believe PayPal’s foothold with consumers will propel them to a
market-leading position in online merchant services, resulting in outperformance over the one- to three-year time
42 | Page
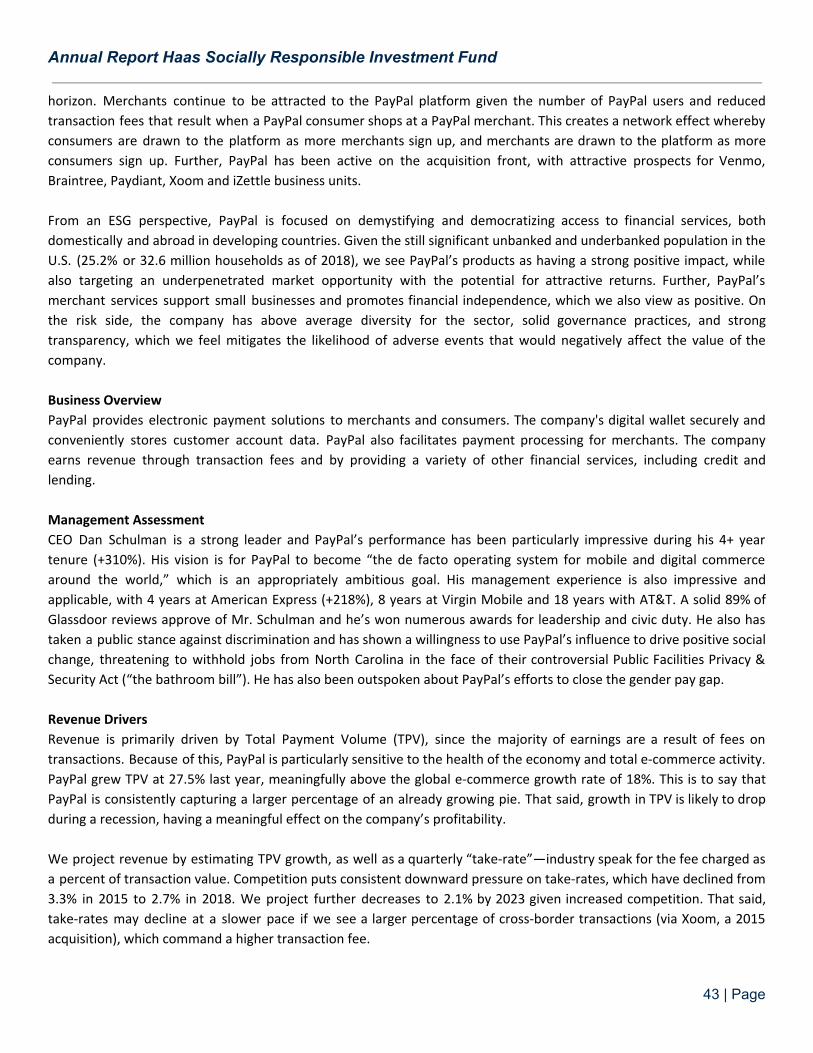
Annual Report Haas Socially Responsible Investment Fund
horizon. Merchants continue to be attracted to the PayPal platform given the number of PayPal users and reduced
transaction fees that result when a PayPal consumer shops at a PayPal merchant. This creates a network effect whereby
consumers are drawn to the platform as more merchants sign up, and merchants are drawn to the platform as more
consumers sign up. Further, PayPal has been active on the acquisition front, with attractive prospects for Venmo,
Braintree, Paydiant, Xoom and iZettle business units.
From an ESG perspective, PayPal is focused on demystifying and democratizing access to financial services, both
domestically and abroad in developing countries. Given the still significant unbanked and underbanked population in the
U.S. (25.2% or 32.6 million households as of 2018), we see PayPal’s products as having a strong positive impact, while
also targeting an underpenetrated market opportunity with the potential for attractive returns. Further, PayPal’s
merchant services support small businesses and promotes financial independence, which we also view as positive. On
the risk side, the company has above average diversity for the sector, solid governance practices, and strong
transparency, which we feel mitigates the likelihood of adverse events that would negatively affect the value of the
company.
Business Overview
PayPal provides electronic payment solutions to merchants and consumers. The company's digital wallet securely and
conveniently stores customer account data. PayPal also facilitates payment processing for merchants. The company
earns revenue through transaction fees and by providing a variety of other financial services, including credit and
lending.
Management Assessment
CEO Dan Schulman is a strong leader and PayPal’s performance has been particularly impressive during his 4+ year
tenure (+310%). His vision is for PayPal to become “the de facto operating system for mobile and digital commerce
around the world,” which is an appropriately ambitious goal. His management experience is also impressive and
applicable, with 4 years at American Express (+218%), 8 years at Virgin Mobile and 18 years with AT&T. A solid 89% of
Glassdoor reviews approve of Mr. Schulman and he’s won numerous awards for leadership and civic duty. He also has
taken a public stance against discrimination and has shown a willingness to use PayPal’s influence to drive positive social
change, threatening to withhold jobs from North Carolina in the face of their controversial Public Facilities Privacy &
Security Act (“the bathroom bill”). He has also been outspoken about PayPal’s efforts to close the gender pay gap.
Revenue Drivers
Revenue is primarily driven by Total Payment Volume (TPV), since the majority of earnings are a result of fees on
transactions. Because of this, PayPal is particularly sensitive to the health of the economy and total e-commerce activity.
PayPal grew TPV at 27.5% last year, meaningfully above the global e-commerce growth rate of 18%. This is to say that
PayPal is consistently capturing a larger percentage of an already growing pie. That said, growth in TPV is likely to drop
during a recession, having a meaningful effect on the company’s profitability.
We project revenue by estimating TPV growth, as well as a quarterly “take-rate”—industry speak for the fee charged as
a percent of transaction value. Competition puts consistent downward pressure on take-rates, which have declined from
3.3% in 2015 to 2.7% in 2018. We project further decreases to 2.1% by 2023 given increased competition. That said,
take-rates may decline at a slower pace if we see a larger percentage of cross-border transactions (via Xoom, a 2015
acquisition), which command a higher transaction fee.
43 | Page
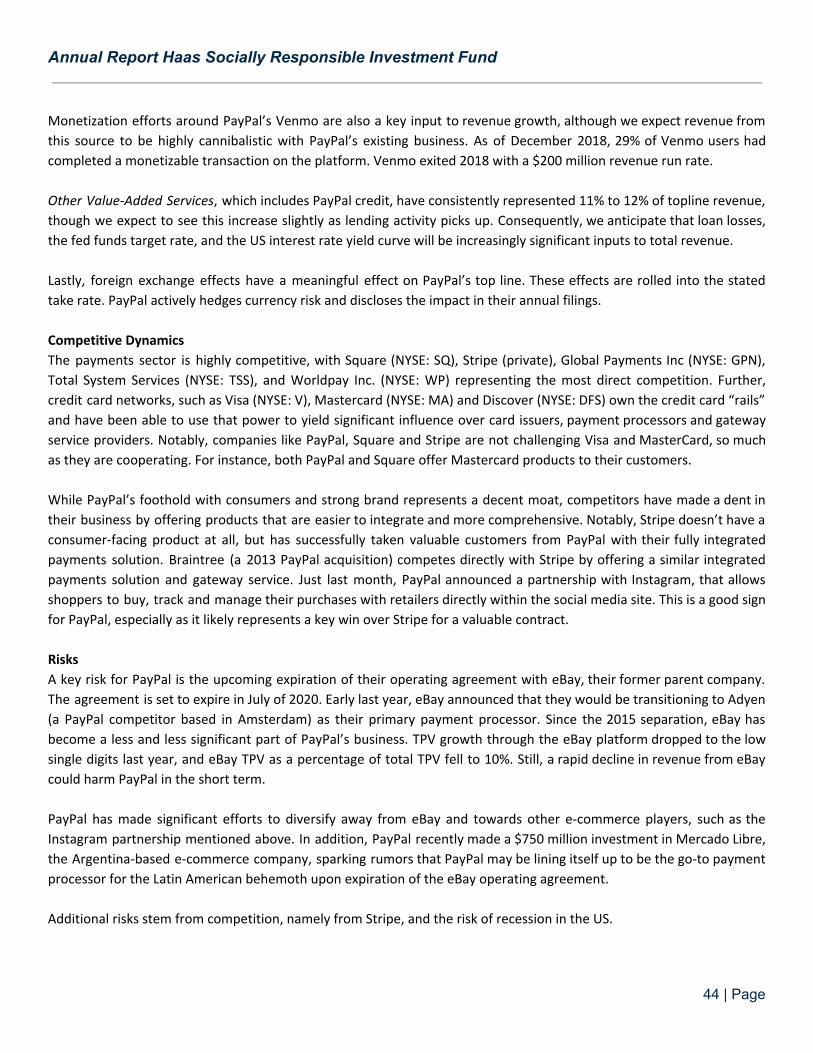
Annual Report Haas Socially Responsible Investment Fund
Monetization efforts around PayPal’s Venmo are also a key input to revenue growth, although we expect revenue from
this source to be highly cannibalistic with PayPal’s existing business. As of December 2018, 29% of Venmo users had
completed a monetizable transaction on the platform. Venmo exited 2018 with a $200 million revenue run rate.
Other Value-Added Services, which includes PayPal credit, have consistently represented 11% to 12% of topline revenue,
though we expect to see this increase slightly as lending activity picks up. Consequently, we anticipate that loan losses,
the fed funds target rate, and the US interest rate yield curve will be increasingly significant inputs to total revenue.
Lastly, foreign exchange effects have a meaningful effect on PayPal’s top line. These effects are rolled into the stated
take rate. PayPal actively hedges currency risk and discloses the impact in their annual filings.
Competitive Dynamics
The payments sector is highly competitive, with Square (NYSE: SQ), Stripe (private), Global Payments Inc (NYSE: GPN),
Total System Services (NYSE: TSS), and Worldpay Inc. (NYSE: WP) representing the most direct competition. Further,
credit card networks, such as Visa (NYSE: V), Mastercard (NYSE: MA) and Discover (NYSE: DFS) own the credit card “rails”
and have been able to use that power to yield significant influence over card issuers, payment processors and gateway
service providers. Notably, companies like PayPal, Square and Stripe are not challenging Visa and MasterCard, so much
as they are cooperating. For instance, both PayPal and Square offer Mastercard products to their customers.
While PayPal’s foothold with consumers and strong brand represents a decent moat, competitors have made a dent in
their business by offering products that are easier to integrate and more comprehensive. Notably, Stripe doesn’t have a
consumer-facing product at all, but has successfully taken valuable customers from PayPal with their fully integrated
payments solution. Braintree (a 2013 PayPal acquisition) competes directly with Stripe by offering a similar integrated
payments solution and gateway service. Just last month, PayPal announced a partnership with Instagram, that allows
shoppers to buy, track and manage their purchases with retailers directly within the social media site. This is a good sign
for PayPal, especially as it likely represents a key win over Stripe for a valuable contract.
Risks
A key risk for PayPal is the upcoming expiration of their operating agreement with eBay, their former parent company.
The agreement is set to expire in July of 2020. Early last year, eBay announced that they would be transitioning to Adyen
(a PayPal competitor based in Amsterdam) as their primary payment processor. Since the 2015 separation, eBay has
become a less and less significant part of PayPal’s business. TPV growth through the eBay platform dropped to the low
single digits last year, and eBay TPV as a percentage of total TPV fell to 10%. Still, a rapid decline in revenue from eBay
could harm PayPal in the short term.
PayPal has made significant efforts to diversify away from eBay and towards other e-commerce players, such as the
Instagram partnership mentioned above. In addition, PayPal recently made a $750 million investment in Mercado Libre,
the Argentina-based e-commerce company, sparking rumors that PayPal may be lining itself up to be the go-to payment
processor for the Latin American behemoth upon expiration of the eBay operating agreement.
Additional risks stem from competition, namely from Stripe, and the risk of recession in the US.
44 | Page
Annual Report Haas Socially Responsible Investment Fund
Valuation
We are issuing a Hold recommendation for PayPal with a price target of $102 per share. Analyst consensus through early
April 2019 is largely positive, with an average price target of $106 and a range of $86 to $120 per share. We believe
PayPal is fully priced today, but represents an attractive opportunity for further growth.
Prudential Financial Inc.
Investment Thesis
In the life insurance industry with high barriers to entry and high benefits to scale, Prudential Financial is a well-managed
and diversified company with strong market share and history of returning capital to shareholders. With a diverse set of
business offerings across products and services, market segments (individual and institutional), geographic markets
(domestic and international), and types of risks (insurance and asset management), Prudential is well positioned to
adapt to market trends and provide integrated financial offerings. Using its scale, Prudential is one of a few companies
capable of providing PRT to large enterprises, a growth area for insurance going forward.
Prudential has a demonstrated track record of environmental impact, workplace culture and diversity, and community
involvement. The company publishes its progress in their yearly Sustainability Report. On the environmental front,
Prudential actively invests in opportunities to mitigate climate change. The company has $4.3B portfolio as of the end of
2017 across solar, wind, hydroelectric, geothermal, and biomass. On the social front, Prudential has a stated goal of
building a $1B impact investing portfolio by 2020 and has made $250 million in impact investments as of 2017. In grants
and donations, Prudential has made $49.9 million in grants to nonprofit organizations and matching gifts through The
Prudential Foundation and $23 million in corporate contributions to nonprofit organizations. Prudential has an A IVA
rating and has earned several awards for their corporate culture and ESG, such as Forbes most admired company in
Insurance: Life and Health in 2017 and 2018, Top Green Companies, U.S. 500 and Global 500 by Newsweek, 100 Most
Sustainable Companies by Barron’s, and Top 50 Companies for Diversity by Diversity Inc.
Business Overview
Founded in 1875, Prudential Financial is a large, diversified insurance company that engages in the provision of financial
products and services including life insurance, annuities, mutual funds, and investment management to both individual
and institutional customers. The company is the second-largest life insurance company in the U.S. with $1.4T in assets
under management. While it operates in several countries, most of revenue is generated in the United States and Japan.
It has over 50,000 employees worldwide and headquartered in Newark, NJ.
45 | Page
Annual Report Haas Socially Responsible Investment Fund
Industry Dynamics
In the insurance industry, firms have difficulty exhibiting differentiation. Products are indistinguishable and highly
commoditized. At the same time, the industry has extremely high barriers to entry. Insurance companies face
complicated regulations to operate in the United States. Firms benefit from scale. In this environment, Prudential is in a
favorable position as a market leader offering a diverse range of products to consumers and enterprises. They can
leverage their scale to sell integrated offerings.
Investment Positives
● Market leader with diverse sources of earnings: Prudential generates profits across a diverse set of products
and services, customers, and geographies. With 40% of their earnings coming from Japan, they are insulated
from US market headwinds and well-positioned to shift to growth areas
● Tailwind from pension risk transfer (PRT) market: As a large, diversified life insurance provider, Prudential
stands to benefit from the momentum in this area. As pension obligations balloon, Prudential is one of a few
players positioned to take on and manage that risk
● History of balancing investing in growth and returning capital to shareholders: The current management has
prioritized long-term sustainable growth through integrated solutions and scale, while returning capital to
shareholders.
Investment Risks
● Risks of credit losses if credit conditions worsen: Prudential’s bond portfolio has significant exposure to
corporate debt, and a rise in corporate defaults would hurt the portfolio
● Interest rate uncertainty: Interest rate decreases can hurt the spread life insurance companies earn
● Unfavorable regulation and political climate: As a life insurance provider, Prudential is subject to heavy
regulations. Changes and instability can impact profitability
● Currency risks: Prudential generates a large amount of operating profit in local currency and invest in local
currency denominated securities
Valuation
PRU trades in line on a relative basis when compared to peers in the life insurance industry today and its historical
values. PRU currently trades at 8.9x NTM P/E, slightly lower than the median of the comparable peers of 10.3x and
higher than the 3-year average of 8.6x. On Book Value, PRU currently trades at 1.1x NTM P/BVPS, slightly higher than
the median of the comparable peers of 1.0x and in line with its 3-year average.
Based on a combination of P/E and P/BV multiples, I have a 1-year price target of $108/share. With a seasoned
management team with a successful track record, strong competitive market position, diverse sources of profits, and
potential growth area in its PRT transfer, PRU is well-positioned for the future.
46 | Page
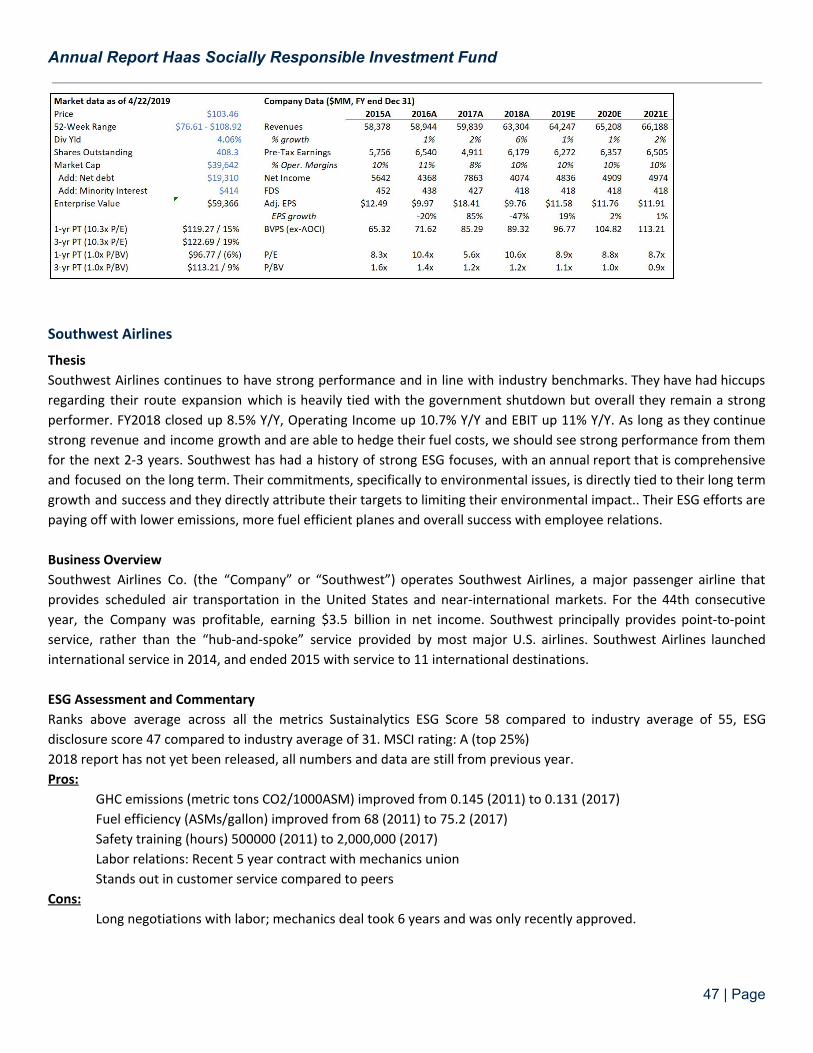
Annual Report Haas Socially Responsible Investment Fund
Southwest Airlines
Thesis
Southwest Airlines continues to have strong performance and in line with industry benchmarks. They have had hiccups
regarding their route expansion which is heavily tied with the government shutdown but overall they remain a strong
performer. FY2018 closed up 8.5% Y/Y, Operating Income up 10.7% Y/Y and EBIT up 11% Y/Y. As long as they continue
strong revenue and income growth and are able to hedge their fuel costs, we should see strong performance from them
for the next 2-3 years. Southwest has had a history of strong ESG focuses, with an annual report that is comprehensive
and focused on the long term. Their commitments, specifically to environmental issues, is directly tied to their long term
growth and success and they directly attribute their targets to limiting their environmental impact.. Their ESG efforts are
paying off with lower emissions, more fuel efficient planes and overall success with employee relations.
Business Overview
Southwest Airlines Co. (the “Company” or “Southwest”) operates Southwest Airlines, a major passenger airline that
provides scheduled air transportation in the United States and near-international markets. For the 44th consecutive
year, the Company was profitable, earning $3.5 billion in net income. Southwest principally provides point-to-point
service, rather than the “hub-and-spoke” service provided by most major U.S. airlines. Southwest Airlines launched
international service in 2014, and ended 2015 with service to 11 international destinations.
ESG Assessment and Commentary
Ranks above average across all the metrics Sustainalytics ESG Score 58 compared to industry average of 55, ESG
disclosure score 47 compared to industry average of 31. MSCI rating: A (top 25%)
2018 report has not yet been released, all numbers and data are still from previous year.
Pros:
GHC emissions (metric tons CO2/1000ASM) improved from 0.145 (2011) to 0.131 (2017)
Fuel efficiency (ASMs/gallon) improved from 68 (2011) to 75.2 (2017)
Safety training (hours) 500000 (2011) to 2,000,000 (2017)
Labor relations: Recent 5 year contract with mechanics union
Stands out in customer service compared to peers
Cons:
Long negotiations with labor; mechanics deal took 6 years and was only recently approved.
47 | Page
Annual Report Haas Socially Responsible Investment Fund
Product safety and quality: April 2018 - engine failure and death of passenger, Feb 2017- clips wings with
another airline, 2016 – 2 emergency landings – cabin pressure loss and cockpit smoke hazard
Square
Thesis: With its history of volatility and its high P/E ratio, it is difficult to make a case to hold on to SQ in the HSRIF
portfolio. However, other analysts believe SQ is not a payments company but one of the most comprehensive and
integrated data companies on the market. I hope to have more information on this by the May 2019 update and a
stronger recommendation for our portfolio.
Square’s business model is directly tied to a strong ESG focus: facilitating easier payments for small businesses and those
with smaller credit lines, thereby increasing financial inclusion. Square still has a lot of work to do for some ESG metrics
(such as diversity and inclusion and customer welfare), but this mission alignment makes its ESG performance stronger
than other companies in the HSRIF portfolio.
In the News (Jan - Apr ‘19):
● Square continues to serve the underbanked by extending credit through Square Capital (CNBC) ● Strong Q4: adjusted revenue increased by 64% YOY and adjusted EBITDA increased by 97%. Gross payment
volume increased by 28% (Motley Fool) ● Co-founder Tristan O’Tierney, who built the first mobile app, died after battling addiction (Forbes) ● Jack Dorsey Wants Square and Twitter ‘Decentralized’ From S.F. Headquarters (Bloomberg) ● Square will offer its new crypto employees payment in Bitcoin (Engadget) ● Square Partners with Washington Nationals to Enable Order-Ahead and In-Seat Card Payments at D.C.’s
Nationals Park (AP News) ● Jack Dorsey is recruiting his own personal bitcoin posse (Mashable)
Business Overview: Square, Inc. (SQ) provides payment and point-of-sale solutions in the United States and
internationally. The company's commerce ecosystem includes point-of-sale software and hardware that enables sellers
to turn mobile and computing devices into payment and point-of-sale solutions. SQ was founded in 2009 and is
headquartered in San Francisco, California.
Management Assessment: SQ is run by Jack Dorsey, Chairman and CEO. Dorsey is also CEO and co-founder of Twitter.
Twitter has come under increasing scrutiny as a platform for online bullying and its role in the spreading of fake news
leading up to US elections. There is growing concern among investors that Dorsey should not continue his role as CEO of
two companies.
Revenue Drivers: Products: Hardware
● Magstripe reader: enables swiped transactions of magnetic stripe cards ● Contactless and chip reader: accepts Europay, MasterCard, and Visa (EMV) chip cards and Near Field
Communication payments ● Chip card reader: accepts EMV chip cards and enables swiped transactions of magnetic stripe cards ● Square Stand: enables an iPad to be used as a payment terminal or full point of sale solution
48 | Page
Annual Report Haas Socially Responsible Investment Fund
● Square Register: combines its hardware, point-of-sale software, and payments technology, as well as managed payments solutions
Products: Software
● Square Point of Sale software ● Cash App: provides access to the financial system, which allows customers to electronically send, store, and
spend money ● Caviar, a food ordering platform for restaurants to offer food ordering, pickup and delivery, to their customers ● Square Capital: facilitates loans to sellers based on real-time payment and point-of-sale data
Competitive Dynamics: SQ is in the payments and fintech space, though some would argue it is also in the data space.
Its biggest competitors in fintech are Stripe, PayPal, Revel, WePay, Venmo (owned by PayPal). It also competes with
credit card companies like MasterCard, Visa, American Express, and Discover.
SQ’s market cap is $31.49B, compared to Mastercard ($223.68B), Visa ($281.8B), and PayPal ($107.78B). “What makes Square's data even more valuable is that it also has a network of small businesses all looking to get in front of customers. That means Square could be only a few steps away from building an advertising platform for its merchants with highly targeted ads.Not only that, but Square is uniquely positioned to track the effectiveness of those advertisements from ad impression all the way to completed purchase based on its unique position of having touch points with both the consumer's and the merchant's financial data. Square could even offer merchants the opportunity to only pay for advertisements as they convert by taking the cost out of each card swipe, like it does with Square Capital. Google and Facebook can't compete with that....With tens of billions of dollars spent on advertising in the United States alone, that's an even bigger opportunity than the $26 billion addressable market. Building out consumer profiles and merchant profiles and matching them with each other is a major opportunity for Square, and that's what makes it more than just a payments company.” (The Motley Fool)
Risks: The biggest risk for SQ is a potential credit crunch, which could happen in 2019.
Catalysts: Square, Inc. is expected* to report earnings on 05/01/2019 after market close. The report will be for the fiscal
quarter ending March 2019.
Valuation: As of Friday, April 5, SQ’s stock was trading $75.03 per share, down from $77.34 per share at the beginning of
February. It has fallen from its all-time high of $101.15 in October 2018 but is nearly double its share value from Feb
2018, when SQ was $43.61 per share. Overall, SQ stock is valued at a little less than $30 billion, and the company has
total assets of nearly $4 billion, total liabilities of $2.8 billion, and less than $1 billion of total debt. EV/EBITDA is
1,682.53, compared to PYPL (42.24) and Mastercard (27.00)
Starbucks Corporation Covering Analyst - Jessica Lui
Investment thesis: The stock was trading at $77.45 as EOB on Apr 26, +8.2% since our last stock update in early Mar.
The stock price has hiked nearly 60% from $49 in late June 2018. The much stronger-than-expected performances
49 | Page
Annual Report Haas Socially Responsible Investment Fund
during 18Q4 and 19Q1 have been the major driver of the price hike. The most recent quarter (19Q2) result is a mix of
better-than-expected comp and slightly-missing-consensus revenue growth, and the market has been reacting
moderately to this result. Based on the latest guidance, our model yields a target price of $70.20 (P/E Multiple) and
$74.40 (DCF), showing that the stock remains fully priced.
Recommendation: HOLD. We reduced our holding in the stock by 75bps in Mar (see Page 22 of this Annual Report for
details). We remain convicted of the company’s economic moat and the effectiveness of the company’s strategic
initiatives, but we still think that near-term pull-back is possible given the current price, and uncertainties in the China
market remains.
Business Overview: Starbucks Corp., together with its subsidiaries, operates as a roaster, marketer, and retailer of
specialty coffee worldwide. The company operates in four segments: Americas; China/Asia Pacific; Europe, Middle
East, and Africa; and Channel Development. Its stores offer coffee and tea beverages, roasted whole bean and ground
coffees, single-serve and ready-to-drink coffee and tea products, and food and snacks; and various food products, such
as pastries, breakfast sandwiches, and lunch items. The company also licenses its trademarks through licensed stores,
and grocery and foodservice accounts. Starbucks was founded in 1971 and is based in Seattle, Washington.
Management Assessment: The company’s management team has demonstrated competency to implement effective
initiatives to “turn around” the company’s growth performance, has remained engaged and transparent with
stakeholders, and has been able to provide clear and consistent outlook about the company. One major change
recently in the management team is the change of CFO - Patrick Grismer has succeeded Scott Maw on Nov 30, 2018 as
Scott retired. Patrick has quite some restaurant industry experience before. It remains to see if he is going to affect any
new initiatives at Starbucks.
Revenue Drivers:
Market Major Drivers
US The company relies on organic growth in its US market, hence the comp is the key performance measurement, which has been entirely driven by ticket size increase over the past quarters. The major initiatives driving the comp incl. - enhancement of in-store experience to attract more customers to the stores; - digitalization and monetization of customer relationships, within the company’s 75mn customer base in the US, there’re ~16mn Starbucks Rewards members and ~13mn Starbucks Digital members as of now, the goal is to bring the remaining part of the customer base onto the company’s digital platform as well; - drink innovation, the company has been constantly inventing new drinks that cater to the customer demands for healthier beverages
China The company is playing a long-term game in China, with a current focus on aggressive expansion. Rather than looking at the comp, the company’s management has repeatedly stated that the total transaction growth is what they care the most about in China. The major initiatives driving total transactions incl. - opening of new stores, which contribute 80% of the total transaction growth; - set-up of delivery platform in collaboration with Alibaba, which right now contributes
50 | Page
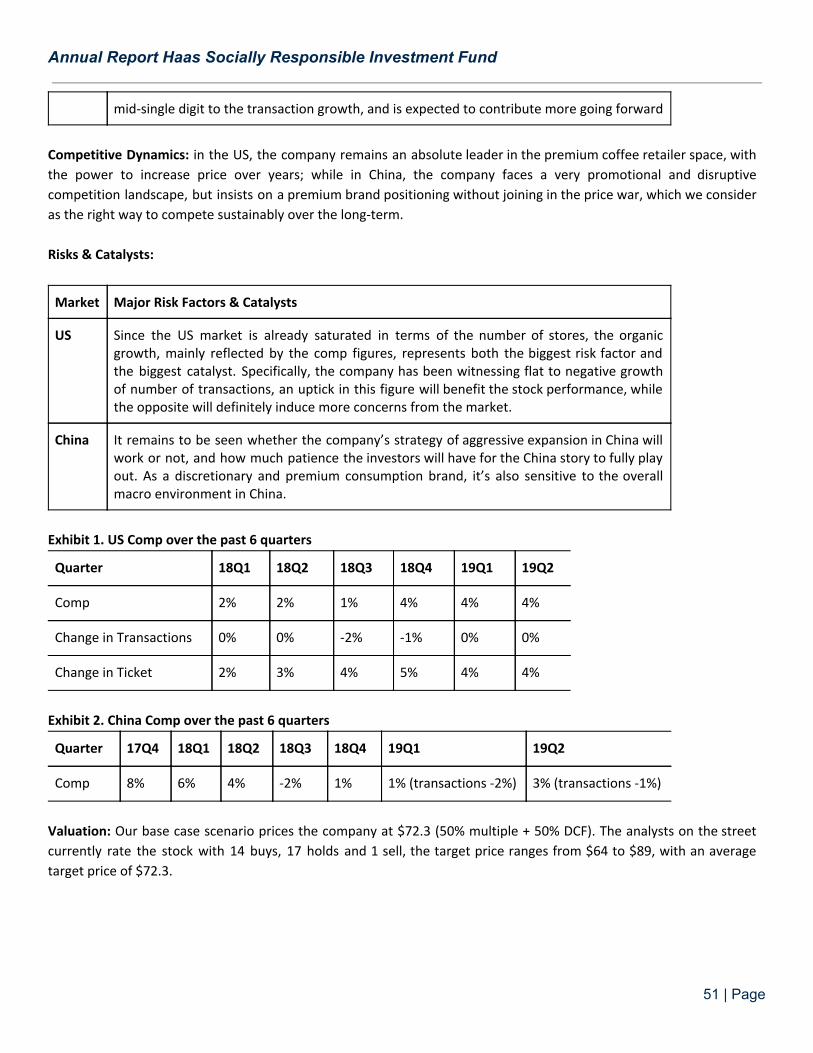
Annual Report Haas Socially Responsible Investment Fund
mid-single digit to the transaction growth, and is expected to contribute more going forward
Competitive Dynamics: in the US, the company remains an absolute leader in the premium coffee retailer space, with
the power to increase price over years; while in China, the company faces a very promotional and disruptive
competition landscape, but insists on a premium brand positioning without joining in the price war, which we consider
as the right way to compete sustainably over the long-term.
Risks & Catalysts:
Market Major Risk Factors & Catalysts
US Since the US market is already saturated in terms of the number of stores, the organic growth, mainly reflected by the comp figures, represents both the biggest risk factor and the biggest catalyst. Specifically, the company has been witnessing flat to negative growth of number of transactions, an uptick in this figure will benefit the stock performance, while the opposite will definitely induce more concerns from the market.
China It remains to be seen whether the company’s strategy of aggressive expansion in China will work or not, and how much patience the investors will have for the China story to fully play out. As a discretionary and premium consumption brand, it’s also sensitive to the overall macro environment in China.
Exhibit 1. US Comp over the past 6 quarters
Quarter 18Q1 18Q2 18Q3 18Q4 19Q1 19Q2
Comp 2% 2% 1% 4% 4% 4%
Change in Transactions 0% 0% -2% -1% 0% 0%
Change in Ticket 2% 3% 4% 5% 4% 4%
Exhibit 2. China Comp over the past 6 quarters
Quarter 17Q4 18Q1 18Q2 18Q3 18Q4 19Q1 19Q2
Comp 8% 6% 4% -2% 1% 1% (transactions -2%) 3% (transactions -1%)
Valuation: Our base case scenario prices the company at $72.3 (50% multiple + 50% DCF). The analysts on the street
currently rate the stock with 14 buys, 17 holds and 1 sell, the target price ranges from $64 to $89, with an average
target price of $72.3.
51 | Page
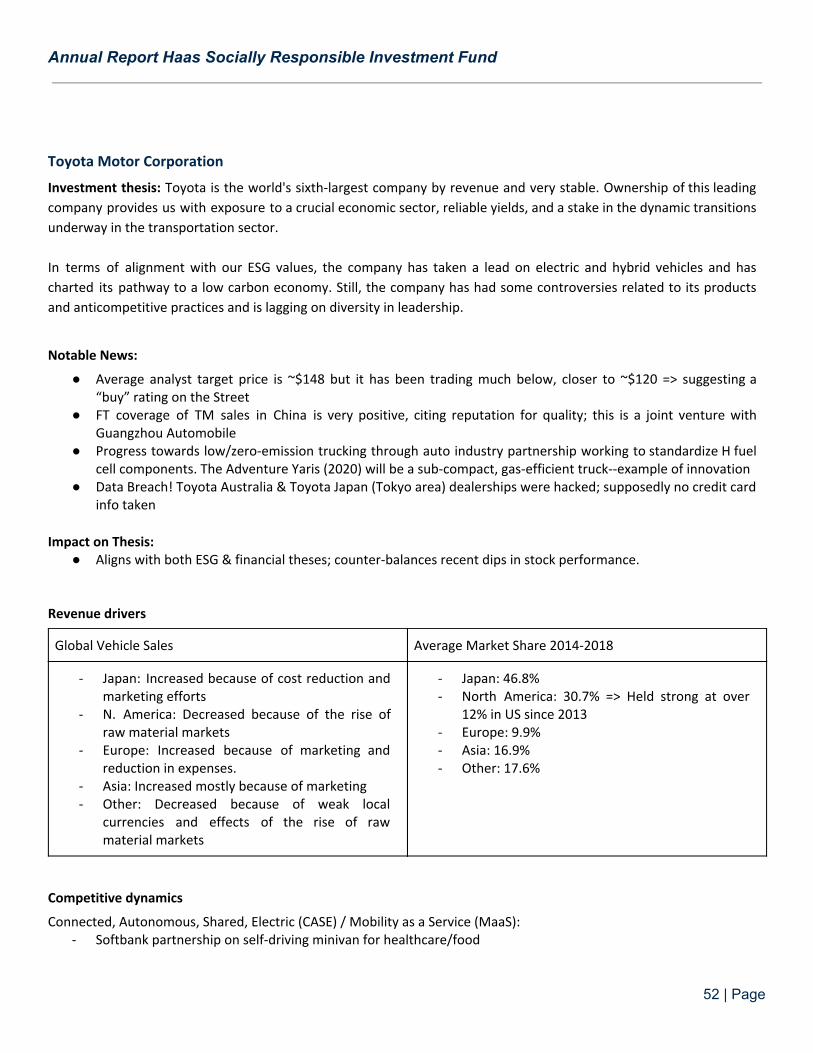
Annual Report Haas Socially Responsible Investment Fund
Toyota Motor Corporation
Investment thesis: Toyota is the world's sixth-largest company by revenue and very stable. Ownership of this leading
company provides us with exposure to a crucial economic sector, reliable yields, and a stake in the dynamic transitions
underway in the transportation sector.
In terms of alignment with our ESG values, the company has taken a lead on electric and hybrid vehicles and has
charted its pathway to a low carbon economy. Still, the company has had some controversies related to its products
and anticompetitive practices and is lagging on diversity in leadership.
Notable News:
● Average analyst target price is ~$148 but it has been trading much below, closer to ~$120 => suggesting a “buy” rating on the Street
● FT coverage of TM sales in China is very positive, citing reputation for quality; this is a joint venture with Guangzhou Automobile
● Progress towards low/zero-emission trucking through auto industry partnership working to standardize H fuel cell components. The Adventure Yaris (2020) will be a sub-compact, gas-efficient truck--example of innovation
● Data Breach! Toyota Australia & Toyota Japan (Tokyo area) dealerships were hacked; supposedly no credit card info taken
Impact on Thesis:
● Aligns with both ESG & financial theses; counter-balances recent dips in stock performance.
Revenue drivers
Global Vehicle Sales Average Market Share 2014-2018
- Japan: Increased because of cost reduction and marketing efforts
- N. America: Decreased because of the rise of raw material markets
- Europe: Increased because of marketing and reduction in expenses.
- Asia: Increased mostly because of marketing - Other: Decreased because of weak local
currencies and effects of the rise of raw material markets
- Japan: 46.8% - North America: 30.7% => Held strong at over
12% in US since 2013 - Europe: 9.9% - Asia: 16.9% - Other: 17.6%
Competitive dynamics
Connected, Autonomous, Shared, Electric (CASE) / Mobility as a Service (MaaS): - Softbank partnership on self-driving minivan for healthcare/food
52 | Page
Annual Report Haas Socially Responsible Investment Fund
- Uber partnership for autonomous Low-carbon transition:
- Toyota is well positioned relative to competitors & industry projections → Transition Pathways Initiative Vulnerability to Tariffs and Non-Tariffs barriers:
- Steel and aluminum Tariffs - Quota on auto imports into the U.S
Risks
- Limits on access to raw materials, most notably cobalt for batteries - Significant changes in consumer behaviors (CASE) - Regulatory risks
Catalysts
- Sales volumes or market shares change dramatically - Breakthrough in production capabilities of newer, electric automakers (TSLA)
Valuation
As of April 26th, the price was $123.62, in the middle of its 52-week range of $111.12 - $138.68. This is slightly above
the modeled valuation of $121.00, and is coupled with comparable EPS to other industry leaders as well as solid
revenue trends.
Unilever NV
Thesis
Unilever enjoys a stable and defensible market position, and is poised to capture growth in emerging markets. The company’s brands are staple purchases for many households, with thirteen of the world’s top 50 brands owned by Unilever (the nearest competitor owns five). , The Unilever logo is the most used logo in the world. Further, Unilever is
6 7 8
one of the most important suppliers to retailers, globally, differentiating it from narrow competitors with smaller product portfolios and enabling it to capture critical shelf space and distribution capacity. The management team has achieved high and consistent ROIC – 19% over the past five years and 20% over the past 10 years.
From an ESG perspective, Unilever is well positioned to capture value from the transition to sustainable business. Unilever’s Sustainable Living Plan (USLP) guides the company’s strategic direction in alignment with long-term sustainability. Its leadership position in sustainability enables Unilever to attract and retain talent, cultivate goodwill with customers, and build resilience into its supply chain. In 2016, 18 of UN’s top 40 brands qualified as Sustainable Living brands, growing 50% faster than the rest of the business, while delivering more than 60% of Unilever’s growth. UN is planning to transition all its brands to Sustainable Living.
Business Overview
6 https://www.fool.co.uk/investing/2017/08/29/why-i-believe-you-can-safely-own-unilever-plc-until-2030/ 7 https://www.unilever.com/Images/unilever-annual-report-and-accounts-2017_tcm244-516456_en.pdf 8 https://www.fastcompany.com/3051498/why-unilever-is-betting-big-on-sustainability
53 | Page
Annual Report Haas Socially Responsible Investment Fund
Unilever (UN) is a leading consumer goods company, making and selling more than 400 brands in over 190 countries. Unilever operates across three divisions – personal care, foods and refreshment, and home care. Its personal care division (46% of operating profit) has leading global positions in hair, skin cleansing and deodorants, with brands including Axe, Dove, Lux, Rexona, and Sunsilk. The foods and refreshment division (41% of operating profit) includes brands Knorr, Hellmann’s, Heartbrand, Magnum, Lipton, and Ben & Jerry’s. Finally, the home care division (13% of operating profit) provides products including powders, liquids and capsules, and various cleaning products.
9
Unilever operates in more than 190 countries. By geography, its operating profits are distributed among Asia, Africa, Middle East, Turkey, Russia, Ukraine, and Belarus (43%), the Americas (35%), Europe (22%).
10
Unilever prioritizes sustainability to a degree that few other large multinational companies do. The company has consistently dominated Globescan’s Sustainability Leaders Survey. Priorities for 2019 include “sustainable business and
11
brands with purpose.” 12
Competitive Dynamics
Unilever’s economic moat includes its power over the supply chain of retailers. The company’s broad portfolio of products across multiple categories makes Unilever one of the most important suppliers to retailers globally. It also differentiates Unilever from narrow-moat competitors with smaller product portfolios.
13
Additionally, Unilever’s size and breadth enable it to maintain cost advantage over its competitors in the marketplace. Finally, Unilever owns recognizable consumer brands. Its brand power enables Unilever to raise prices with inflation and maintain customer loyalty. Product demand is sticky.
14
Investment Risks
Key longer-term risks include:
● Changing customer relationships and buying patterns – UN needs to maintain strong relationships with existing customers, even as they introduce unbranded, competitive products. Further, UN needs to continue developing new technology enabled business models to serve changing shopper habits so that brands are consistently well presented to consumers and available for purchase at all times.
● Changing consumer preferences – Unilever is modernizing its portfolio to respond to changing consumer preferences, especially in the food and refreshments segment. However, there is a risk that UN cannot modernize quick enough. UN needs to continue prioritizing fast-growing segments such as organic, natural, vegan, health and wellness.
● Commoditization – UN’s products may face the risk of commoditization if the company cannot maintain differentiated value
Valuation
We are issuing a Hold recommendation for Unilever with a one-year price target of $66 per share. This is consistent with analysis consensus. We believe Unilever offers a stable (Beta = 0.43), attractive opportunity for further growth.
9 https://www.unilever.com/Images/unilever-annual-report-and-accounts-2017_tcm244-516456_en.pdf 10 https://www.unilever.com/Images/unilever-annual-report-and-accounts-2017_tcm244-516456_en.pdf 11 https://www.fastcompany.com/3051498/why-unilever-is-betting-big-on-sustainability 12 https://www.unilever.com/Images/unilever-full-year-results-2018-presentation_tcm244-530392_en.pdf 13 Morningstar Analyst Report, Philip Gorham 14 https://seekingalpha.com/article/4214262-unilever-quality-company-mediocre-stock
54 | Page
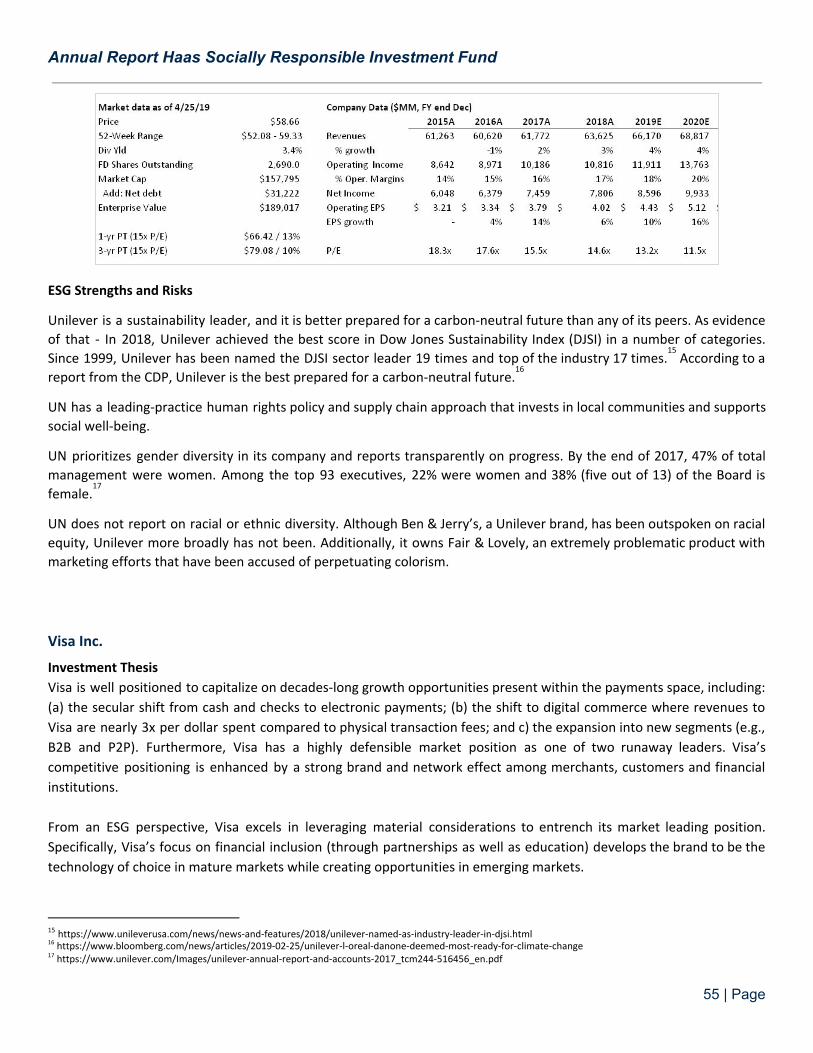
Annual Report Haas Socially Responsible Investment Fund
ESG Strengths and Risks
Unilever is a sustainability leader, and it is better prepared for a carbon-neutral future than any of its peers. As evidence of that - In 2018, Unilever achieved the best score in Dow Jones Sustainability Index (DJSI) in a number of categories. Since 1999, Unilever has been named the DJSI sector leader 19 times and top of the industry 17 times. According to a
15
report from the CDP, Unilever is the best prepared for a carbon-neutral future. 16
UN has a leading-practice human rights policy and supply chain approach that invests in local communities and supports social well-being.
UN prioritizes gender diversity in its company and reports transparently on progress. By the end of 2017, 47% of total management were women. Among the top 93 executives, 22% were women and 38% (five out of 13) of the Board is female.
17
UN does not report on racial or ethnic diversity. Although Ben & Jerry’s, a Unilever brand, has been outspoken on racial equity, Unilever more broadly has not been. Additionally, it owns Fair & Lovely, an extremely problematic product with marketing efforts that have been accused of perpetuating colorism.
Visa Inc.
Investment Thesis
Visa is well positioned to capitalize on decades-long growth opportunities present within the payments space, including:
(a) the secular shift from cash and checks to electronic payments; (b) the shift to digital commerce where revenues to
Visa are nearly 3x per dollar spent compared to physical transaction fees; and c) the expansion into new segments (e.g.,
B2B and P2P). Furthermore, Visa has a highly defensible market position as one of two runaway leaders. Visa’s
competitive positioning is enhanced by a strong brand and network effect among merchants, customers and financial
institutions.
From an ESG perspective, Visa excels in leveraging material considerations to entrench its market leading position.
Specifically, Visa’s focus on financial inclusion (through partnerships as well as education) develops the brand to be the
technology of choice in mature markets while creating opportunities in emerging markets.
15 https://www.unileverusa.com/news/news-and-features/2018/unilever-named-as-industry-leader-in-djsi.html 16 https://www.bloomberg.com/news/articles/2019-02-25/unilever-l-oreal-danone-deemed-most-ready-for-climate-change 17 https://www.unilever.com/Images/unilever-annual-report-and-accounts-2017_tcm244-516456_en.pdf
55 | Page
Annual Report Haas Socially Responsible Investment Fund
Business Overview
Visa is a global payments technology company that enables fast, secure and reliable electronic payments across more
than 200 countries and territories. Visa facilitates global commerce through the transfer of value and information among
a global network of consumers, merchants, financial institutions, businesses, strategic partners, and government
entities. The Company’s advanced transaction processing network, VisaNet, enables authorization, clearing, and
settlement of payment transactions and allows Visa to provide financial institutions and merchant clients with a wide
range of products, platforms, and value-added services.
Management Assessment
Visa’s management team brings substantial experience from the global transactions space, although several members of
the management team (including the CEO Al Kelly) have joined over the last several years. Al took the role of CEO in
December 2016 after serving on Visa’s board for over two years. Although Al is new to Visa, he is a veteran within the
payments industry, having spent 23 years at American Express where he served as President and head of the Global
Consumer and Consumer Card Services groups. A solid 92% of Glassdoor reviews approve of Al Kelly, who is reputed to
be very engaged with the people, customers and market and pushing the company to continue to innovate and evolve.
Revenue Drivers
Visa generates revenue when users present Visa products for purchased goods and services. Revenues are primarily
generated from payment volumes and the number of transactions. Visa itself does not maintain cardholder balances,
but instead acts as an intermediary to facilitate payments. This grants them protection from default risk of cardholders
but does not allow them to benefit from the high interest rates for those carrying balances on their credit card.
Visa has three primary sources of revenues. First, Visa earns Service Revenues, which include fees earned from banks for
the right to participate in the Visa payment network. Second, Visa earns Data Processing Revenues, which consist of
revenues earned for clearing, authorization, settlement and network access. For a given $100 transaction, the merchant
typically keeps $97.50, and the remaining $2.50 is split among the merchant acquirer ($0.45), the merchant processor
($0.10), the card issuer ($1.75, although much of that is passed onto the card holder in the form or rewards), and the
network ($0.20). Finally, Visa earns International Transaction Revenues for cross-border processing and currency
conversion. These revenues are more complex but also more profitable (and more influenced by macro factors).
Competitive Dynamics
Visa has a substantial competitive edge as one of two runaway leaders, accounting for about half of all credit card
transactions and an even greater percentage of debit card transactions. Visa has a large moat given the network effects
present in the payments industry. For a payment method to be useful, it must be accepted by multiple merchants.
Conversely, merchants have little incentive to accept a payment method used by only a handful of customers.
Furthermore, network providers must also maintain a network of relationships with thousands of financial institutions,
which comes with regulatory hurdles (e.g, even firms like PayPal are partnering with incumbents and Apple Pay uses
existing networks to process payments). Due to this dynamic, only a few network providers exist, with Visa and
Mastercard dominating the space with an effective duopoly.
Despite its strong competitive positioning, Visa does face competitive threats from fintech startups; mobile payment
technologies that use Visa today but may not in the future; traditional competitors (MasterCard, American Express);
merchant alliances formed to offer new payment solutions to reduce their fees; cryptocurrencies / blockchain; and
competitors who may bypass traditional banks altogether, as Alipay has done in China.
56 | Page
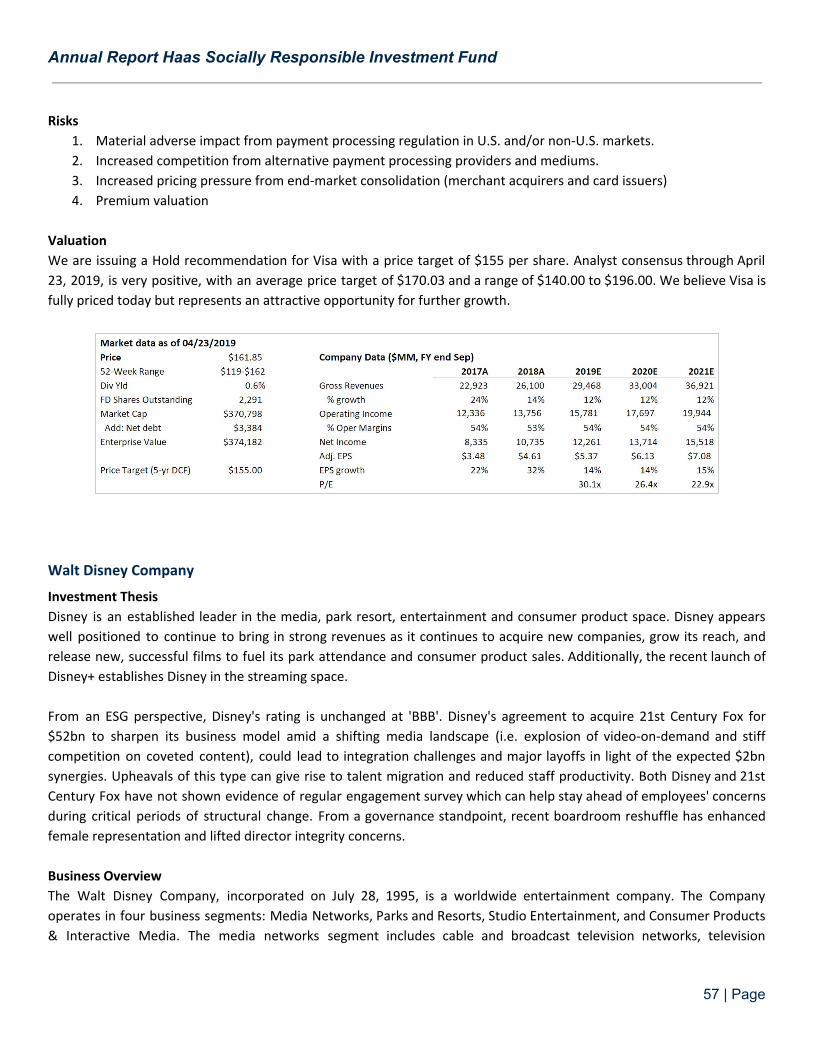
Annual Report Haas Socially Responsible Investment Fund
Risks
1. Material adverse impact from payment processing regulation in U.S. and/or non-U.S. markets.
2. Increased competition from alternative payment processing providers and mediums.
3. Increased pricing pressure from end-market consolidation (merchant acquirers and card issuers)
4. Premium valuation
Valuation
We are issuing a Hold recommendation for Visa with a price target of $155 per share. Analyst consensus through April
23, 2019, is very positive, with an average price target of $170.03 and a range of $140.00 to $196.00. We believe Visa is
fully priced today but represents an attractive opportunity for further growth.
Walt Disney Company
Investment Thesis
Disney is an established leader in the media, park resort, entertainment and consumer product space. Disney appears
well positioned to continue to bring in strong revenues as it continues to acquire new companies, grow its reach, and
release new, successful films to fuel its park attendance and consumer product sales. Additionally, the recent launch of
Disney+ establishes Disney in the streaming space.
From an ESG perspective, Disney's rating is unchanged at 'BBB'. Disney's agreement to acquire 21st Century Fox for
$52bn to sharpen its business model amid a shifting media landscape (i.e. explosion of video-on-demand and stiff
competition on coveted content), could lead to integration challenges and major layoffs in light of the expected $2bn
synergies. Upheavals of this type can give rise to talent migration and reduced staff productivity. Both Disney and 21st
Century Fox have not shown evidence of regular engagement survey which can help stay ahead of employees' concerns
during critical periods of structural change. From a governance standpoint, recent boardroom reshuffle has enhanced
female representation and lifted director integrity concerns.
Business Overview
The Walt Disney Company, incorporated on July 28, 1995, is a worldwide entertainment company. The Company
operates in four business segments: Media Networks, Parks and Resorts, Studio Entertainment, and Consumer Products
& Interactive Media. The media networks segment includes cable and broadcast television networks, television
57 | Page
Annual Report Haas Socially Responsible Investment Fund
production and distribution operations, domestic television stations, and radio networks and stations. The Company's
Walt Disney Imagineering unit designs and develops new theme park concepts and attractions, as well as resort
properties. The studio entertainment segment produces and acquires live-action and animated motion pictures,
direct-to-video content, musical recordings and live stage plays. The Company also develops and publishes games,
primarily for mobile platforms, books, magazines and comic books.
Management Assessment
Disney’s Chairman and CEO is Bob Iger. Before Disney, Iger served as the President/COO of ABC Television from 1994-94,
and as President/COO of Capital Cities/ABC Inc., from 1995 until Disney’s acquisition of the company in 1996. Named
President and COO of Disney in 2000 and later succeeded Michael Eisner as CEO in 2005, after a successful effort by Roy
E. Disney to shake up the management of the company. Under Iger, Disney has experienced increases in revenue across
its various divisions, with the company’s market cap value increasing from $48.4 billion to $163 billion over a period of
eleven years. Iger sits on Apple’s board.
Revenue Drivers
In FY2018, Disney produced $10B in free cash flow and a net income of $12.6 billion. Disney has exceeded earnings
estimates in three out of the last four quarters. In its most recent, it had an EPS of $1.84 versus the estimated $1.55.
In 2018, Disney's largest revenue streams, Media Networks and Parks, Experiences & Consumer Products were,
respectively, up 7% to $5.9B and 5% to $6.8B. Disney's theme parks are now its biggest source of revenue and profit.
Competitive Dynamics
Parks: Disney dominates the amusement park space with Disneyland in California, Disneyworld in Florida, and multiple
international parks (Hong Kong, Shanghai, Paris, etc.) – unphased by small competitors like Six Flags or Ocean Park.
Eventually, Disney will be selling a movie ticket, a streaming service, an amusement park ride, a dining experience, hotel
room, a toy, and so much more.
Entertainment: Main competitors are Time Warner and CBS but they pale in comparison. Disney has carved out a
seemingly untouchable hold in IP with Disney, Pixar, Fox, Marvel, LucasFilms, ESPN and ABC. Disney capitalizes on its
content for decades whether it be through new attractions, games, or toys.
Risks
● Future of Disney+: The launch of Disney’s streaming service (Disney+) was met with great success in the stock
market but the future and profitability of the service is still yet to be seen. In it’s fiscal 2018, Disney lost over
$1billion in streaming from Hulu and ESPN+. Disney+ is seen by many investors as a risky, costly move but only
time will tell.
● Economic Turbulence: The expected economic downturn and already steep prices to attend parks/resorts may
lead to lower attendance, and losses for Disney.
Valuation
As of 4/29/2019, Disney stock is trading at $142.20/share. Applying a P/E of 15.3x based on comparable companies, we
have a price target of $108.30, (5%) below its current value. Using an EV/EBITDA of 12.0x, we have a price target of
$135.56. Using the DCF approach, we have a price target of $130.04. For the exit value, we average the results of
58 | Page

Annual Report Haas Socially Responsible Investment Fund
applying an EBITDA exit multiple of 12.0x with using a 1.5% perpetuity growth rate. Based on these results, we believe
that Disney stock is fairly priced. While the EV/EBITDA multiple implies a higher share price, increasing interest expenses
from the company’s debt obligation as it prepares to acquire 21st Century Fox have inflated that value. For this reason,
we maintain a hold rating.
59 | Page
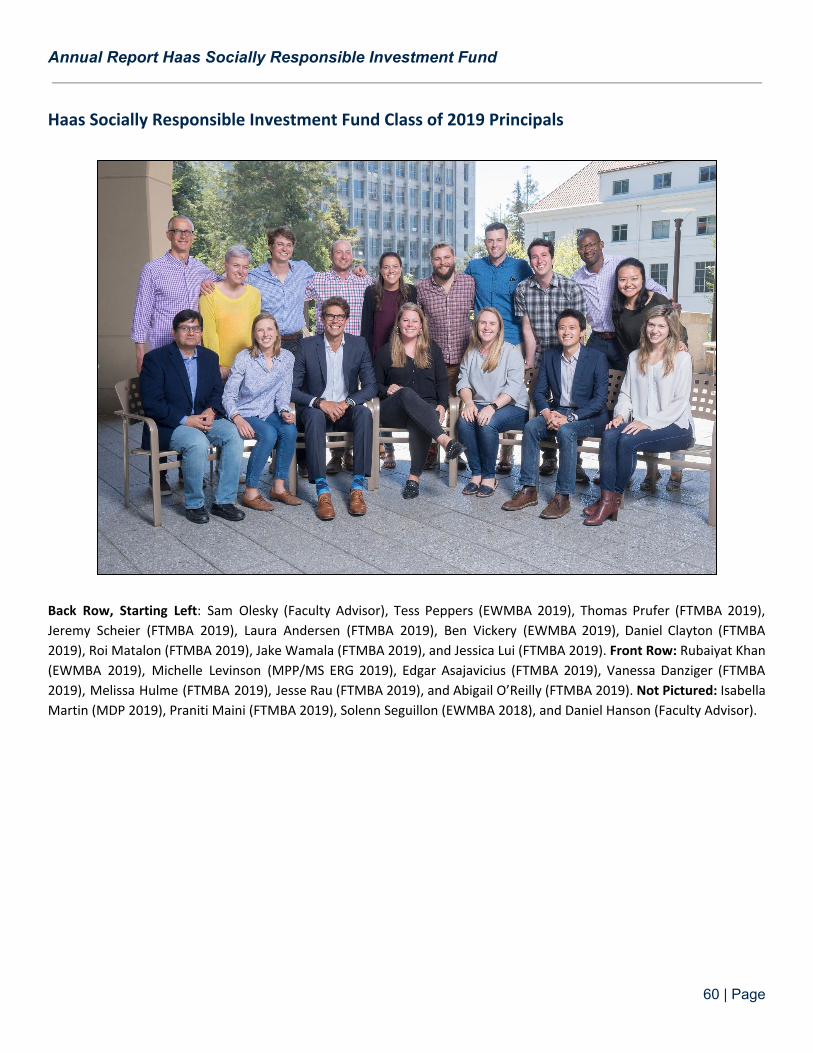
Annual Report Haas Socially Responsible Investment Fund
Haas Socially Responsible Investment Fund Class of 2019 Principals
Back Row, Starting Left: Sam Olesky (Faculty Advisor), Tess Peppers (EWMBA 2019), Thomas Prufer (FTMBA 2019),
Jeremy Scheier (FTMBA 2019), Laura Andersen (FTMBA 2019), Ben Vickery (EWMBA 2019), Daniel Clayton (FTMBA
2019), Roi Matalon (FTMBA 2019), Jake Wamala (FTMBA 2019), and Jessica Lui (FTMBA 2019). Front Row: Rubaiyat Khan
(EWMBA 2019), Michelle Levinson (MPP/MS ERG 2019), Edgar Asajavicius (FTMBA 2019), Vanessa Danziger (FTMBA
2019), Melissa Hulme (FTMBA 2019), Jesse Rau (FTMBA 2019), and Abigail O’Reilly (FTMBA 2019). Not Pictured: Isabella
Martin (MDP 2019), Praniti Maini (FTMBA 2019), Solenn Seguillon (EWMBA 2018), and Daniel Hanson (Faculty Advisor).
60 | Page
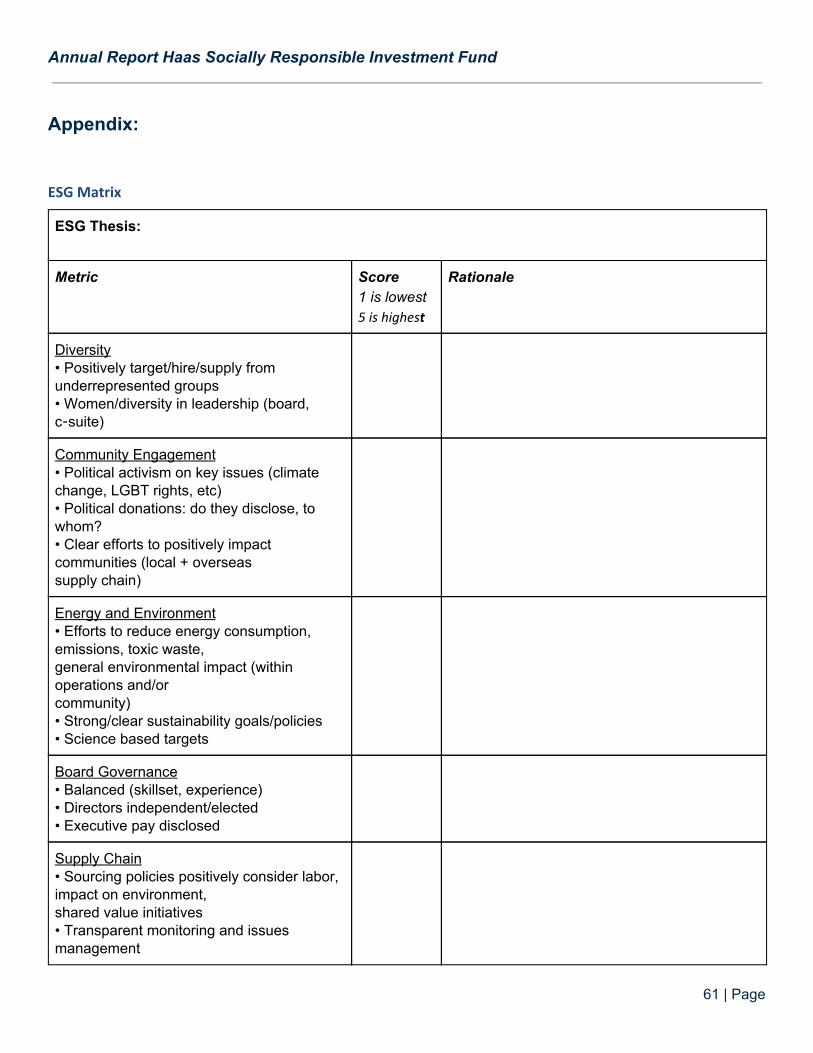
Annual Report Haas Socially Responsible Investment Fund
Appendix:
ESG Matrix
ESG Thesis:
Metric Score 1 is lowest 5 is highest
Rationale
Diversity • Positively target/hire/supply from underrepresented groups • Women/diversity in leadership (board, c-suite)
Community Engagement • Political activism on key issues (climate change, LGBT rights, etc) • Political donations: do they disclose, to whom? • Clear efforts to positively impact communities (local + overseas supply chain)
Energy and Environment • Efforts to reduce energy consumption, emissions, toxic waste, general environmental impact (within operations and/or community) • Strong/clear sustainability goals/policies • Science based targets
Board Governance • Balanced (skillset, experience) • Directors independent/elected • Executive pay disclosed
Supply Chain • Sourcing policies positively consider labor, impact on environment, shared value initiatives • Transparent monitoring and issues management
61 | Page
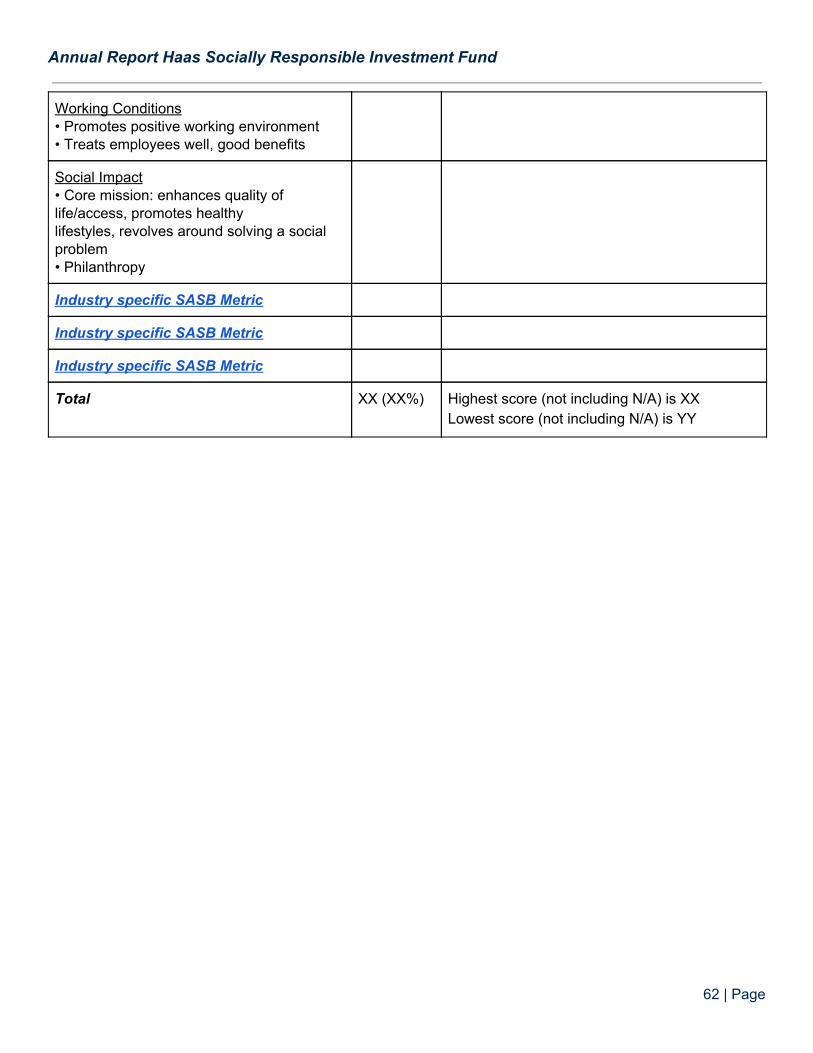
Annual Report Haas Socially Responsible Investment Fund
Working Conditions • Promotes positive working environment • Treats employees well, good benefits
Social Impact • Core mission: enhances quality of life/access, promotes healthy lifestyles, revolves around solving a social problem • Philanthropy
Industry specific SASB Metric
Industry specific SASB Metric
Industry specific SASB Metric
Total XX (XX%) Highest score (not including N/A) is XX Lowest score (not including N/A) is YY
62 | Page
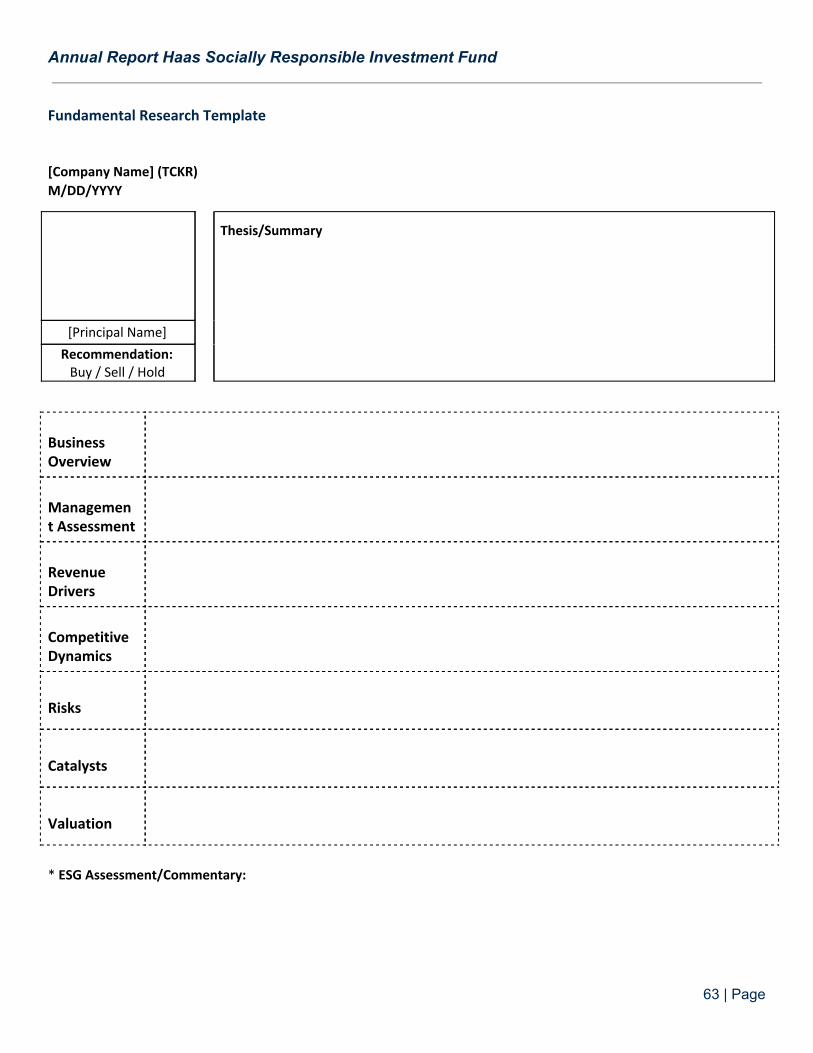
Annual Report Haas Socially Responsible Investment Fund
Fundamental Research Template
[Company Name] (TCKR) M/DD/YYYY
Thesis/Summary
[Principal Name]
Recommendation: Buy / Sell / Hold
Business Overview
Management Assessment
Revenue Drivers
Competitive Dynamics
Risks
Catalysts
Valuation
* ESG Assessment/Commentary:
63 | Page
Annual Report Haas Socially Responsible Investment Fund
HSRIF Fall 2018 Weekly Syllabus MBA/EWMBA 292 Haas Socially Responsible Investment Fund Fall 2018 Syllabus ______________________________________________________________________ Instructors: Dan Hanson [email protected] Sam Olesky [email protected] Office hours : By appointment + typically 1 hour before class _____________________________________________________________________ Room Chou N270, Thursdays, 12:30pm-2pm + special events The zoom: https://berkeley.zoom.us/j/415583192 Or call: US: +16465588656,,415583192# Meeting ID: 415 583 192 Course Overview The HSRIF is an important component of Haas’s leadership role in sustainable investing, and we together have the opportunity to contribute to maintaining and advancing that leadership. The increased interest and relevance of sustainability in financial markets creates an opportunity for Haas graduates to make an increasingly meaningful and differentiated impact. The founding documents of the HSRIF show that the fund aspires to be innovative: “The Fund is a mechanism to generate new ideas that will ultimately contribute to the field of Socially Responsible Investing.” The fund Principals are urged to reject conventionality and pursue “creative thinking”. That creates both an opportunity and a challenge, as the objectives of creativity, innovation and experimentation need to be balanced with the responsibility and risks inherent in fund management. Sound “sustainable investing” must first be sound investing, and a combination of practitioner and theoretical knowledge are important components to a curriculum for students in the area of sustainable finance. Fundamental investing is a multidisciplinary field, and that is likewise true for the evolving area of sustainable investing (a/k/a/ known as SRI, ESG, CSR, RI, impact investing). As an Applied Innovation course, the HSRIF will combine the “science” and “art” of “book smarts” and “street smarts”. A number of projects will allow the HSRIF to build and institutionalize frameworks for
64 | Page
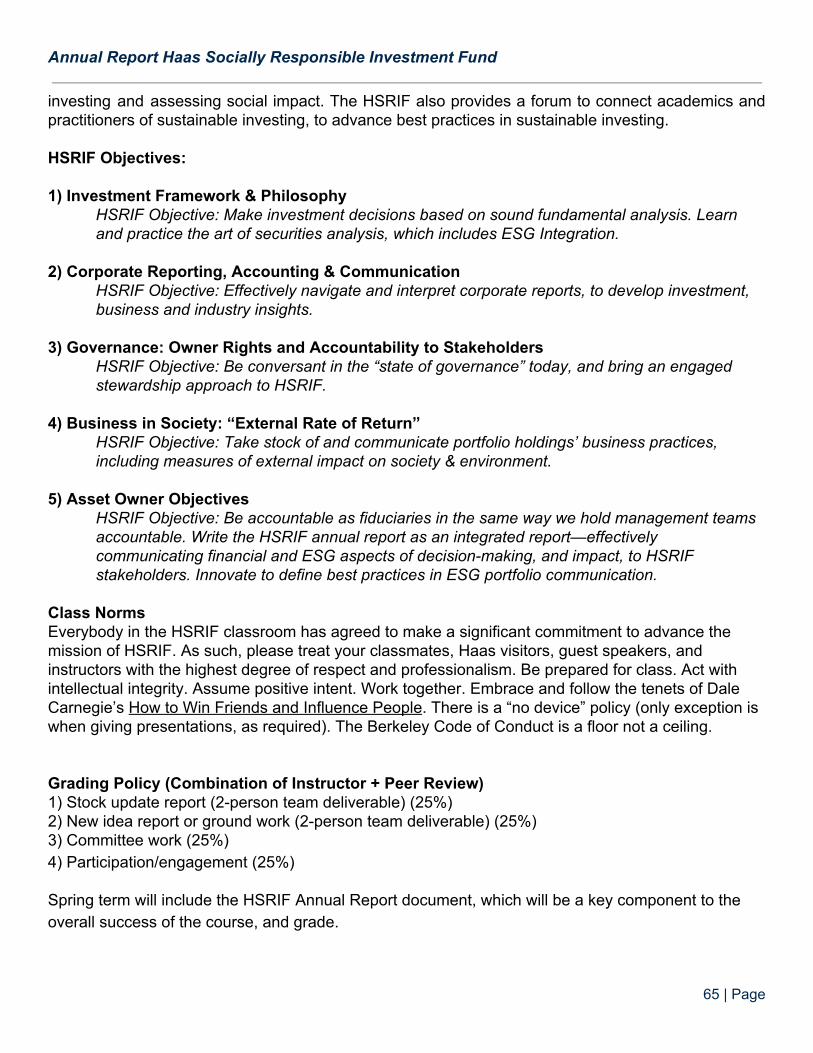
Annual Report Haas Socially Responsible Investment Fund
investing and assessing social impact. The HSRIF also provides a forum to connect academics and practitioners of sustainable investing, to advance best practices in sustainable investing. HSRIF Objectives: 1) Investment Framework & Philosophy
HSRIF Objective: Make investment decisions based on sound fundamental analysis. Learn and practice the art of securities analysis, which includes ESG Integration.
2) Corporate Reporting, Accounting & Communication
HSRIF Objective: Effectively navigate and interpret corporate reports, to develop investment, business and industry insights.
3) Governance: Owner Rights and Accountability to Stakeholders
HSRIF Objective: Be conversant in the “state of governance” today, and bring an engaged stewardship approach to HSRIF.
4) Business in Society: “External Rate of Return” HSRIF Objective: Take stock of and communicate portfolio holdings’ business practices, including measures of external impact on society & environment.
5) Asset Owner Objectives
HSRIF Objective: Be accountable as fiduciaries in the same way we hold management teams accountable. Write the HSRIF annual report as an integrated report—effectively communicating financial and ESG aspects of decision-making, and impact, to HSRIF stakeholders. Innovate to define best practices in ESG portfolio communication.
Class Norms Everybody in the HSRIF classroom has agreed to make a significant commitment to advance the mission of HSRIF. As such, please treat your classmates, Haas visitors, guest speakers, and instructors with the highest degree of respect and professionalism. Be prepared for class. Act with intellectual integrity. Assume positive intent. Work together. Embrace and follow the tenets of Dale Carnegie’s How to Win Friends and Influence People. There is a “no device” policy (only exception is when giving presentations, as required). The Berkeley Code of Conduct is a floor not a ceiling. Grading Policy (Combination of Instructor + Peer Review) 1) Stock update report (2-person team deliverable) (25%) 2) New idea report or ground work (2-person team deliverable) (25%) 3) Committee work (25%) 4) Participation/engagement (25%) Spring term will include the HSRIF Annual Report document, which will be a key component to the overall success of the course, and grade.
65 | Page
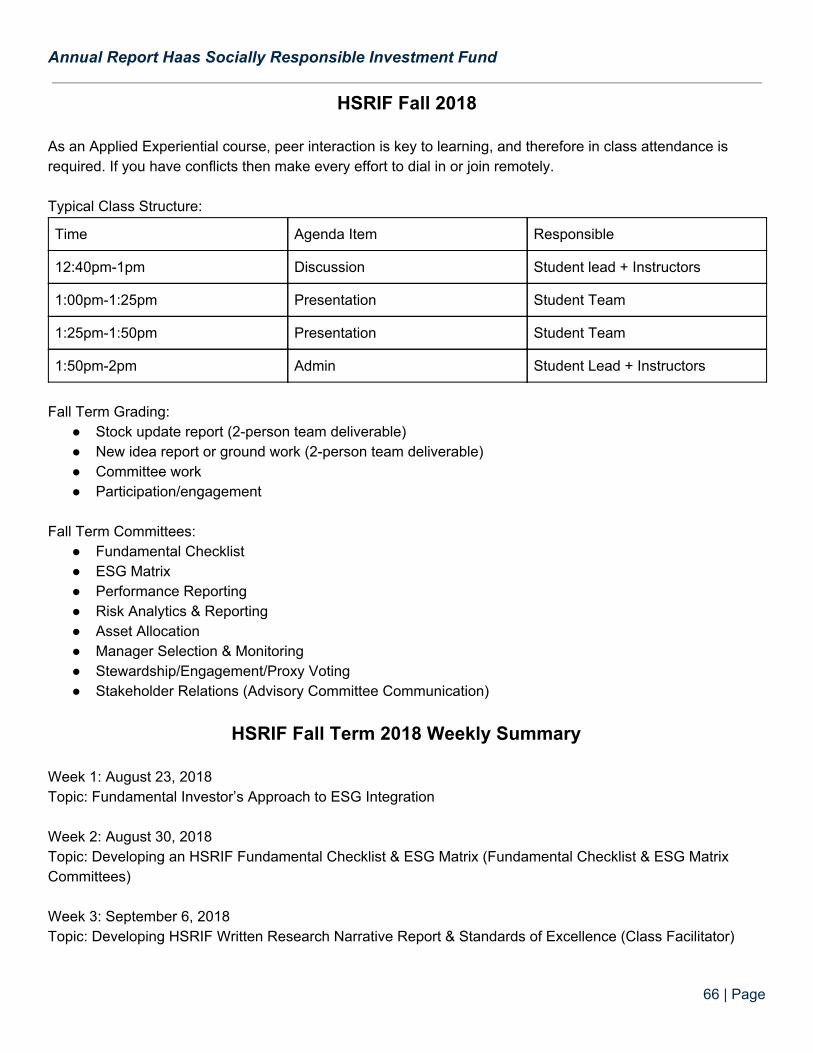
Annual Report Haas Socially Responsible Investment Fund
HSRIF Fall 2018 As an Applied Experiential course, peer interaction is key to learning, and therefore in class attendance is required. If you have conflicts then make every effort to dial in or join remotely. Typical Class Structure:
Time Agenda Item Responsible
12:40pm-1pm Discussion Student lead + Instructors
1:00pm-1:25pm Presentation Student Team
1:25pm-1:50pm Presentation Student Team
1:50pm-2pm Admin Student Lead + Instructors
Fall Term Grading:
● Stock update report (2-person team deliverable) ● New idea report or ground work (2-person team deliverable) ● Committee work ● Participation/engagement
Fall Term Committees:
● Fundamental Checklist ● ESG Matrix ● Performance Reporting ● Risk Analytics & Reporting ● Asset Allocation ● Manager Selection & Monitoring ● Stewardship/Engagement/Proxy Voting ● Stakeholder Relations (Advisory Committee Communication)
HSRIF Fall Term 2018 Weekly Summary
Week 1: August 23, 2018 Topic: Fundamental Investor’s Approach to ESG Integration Week 2: August 30, 2018 Topic: Developing an HSRIF Fundamental Checklist & ESG Matrix (Fundamental Checklist & ESG Matrix Committees) Week 3: September 6, 2018 Topic: Developing HSRIF Written Research Narrative Report & Standards of Excellence (Class Facilitator)
66 | Page
Annual Report Haas Socially Responsible Investment Fund
Week 4: September 13, 2018 Topic of the week: ESG “Scores” are not factors--"The KPI Zoo" Presentation (Class Facilitator) Week 5: September 20, 2018 Topic: Recap of “PRI in Person” Conference (by HSRIF attendees + Class Facilitator) Week 6: September 27, 2018 Topic: ESG Materiality (ESG Matrix Committee + Class Facilitator) Week 7: October 4, 2018 Topic: SASB Materiality Framework (ESG Matrix Committee + Class Facilitator) Week 8: October 11, 2018 Topic: Advisory Committee to Join via Dial-In: Review Portfolio & Investment Ideas (Stakeholder Relations Committee + Class Facilitator) Week 9: October 18, 2018 Topic: Corporate Communication--What to look for in annual reports, CSR reports, etc. (Class Facilitator) Week 10: October 25, 2018 Topic: State Street SHE ETF Case Study (Class Facilitator) Week 11: November 1, 2018 Topic: Introduction to Engagement/Stewardship/Proxy Voting (Stewardship/Engagement/Proxy Voting Committee Instructors + Class Facilitator) Week 12: November 8, 2018 Topic: Students attend 2018 Berkeley Sustainable Business & Investment Forum (BSBIF) November 8-9 Week 13: November 15, 2018 Topic: Recap BSBIF, Committee Updates & Prepare for 11/29 Advisory Board Update (Committees + Class Facilitator) November 22, 2018: Thanksgiving Holiday--no class Week 14: November 29, 2018 (final class) Topic: Advisory Board Semiannual Meeting (Stakeholder Relations Committee) __________________________________________________________________________ Week 1: August 23, 2018 12:40pm-1:40pm
67 | Page
Annual Report Haas Socially Responsible Investment Fund
Introductions: ● 22 students: <2 minutes, background and objectives
Fall Term Calendar Signups:
● Student “Class facilitator” for each week ● 2 student stock presentations per week ● Fall term committee signups (join at least 1 committee) ● Bloomberg training at Bloomberg Embarcadero Pier 3 Office
Topic: Fundamental Investor’s Approach to ESG Integration
● ESG CFA Keynote - April 2017, Final Haas Version Essential Reference Reading:
● ESG in Graham & Doddsville Additional Reference Reading:
● The Little Book that Beats the Market (Joel Greenblatt) ● The Little Book that Builds Wealth (Pat Dorsey)
__________________________________________________________________________ Week 2: August 30, 2018 Topic: Developing an HSRIF Fundamental Checklist & ESG Matrix (Fundamental Checklist & ESG Matrix Committees) Essential Reference Readings:
● HSRIF Analyst Checklists (10+ examples) ● Business Practice Scorecard ● ESG Matrix
Additional Reference Reading:
● Prior HSRIF Annual Reports (note ESG Matrix & Investment Beliefs): ● Common Stocks & Uncommon Profits (Phil Fisher) ● The Checklist Manifesto (Atul Gawande)
__________________________________________________________________________ Week 3: September 6, 2018 Topic: Developing HSRIF Written Research Narrative Report & Standards of Excellence (Class Facilitator) Essential Reference Reading:
● Bezos on a culture of excellence and banning Powerpoint in favor of 6-page memos ● "Equity Analysis Primer", a nice practical summary discussion of financial statement analysis and
valuation
68 | Page
Annual Report Haas Socially Responsible Investment Fund
● Ingredients to a thorough investment report. Business Description including "what matters" (refer to Aug 30th checklists) as described in "Research Report Template":
Additional Reference Readings:
● Principals: as you come upon good & “best in class” examples of written research, please share with the class (Katie will post). Producing our own HSRIF library of “best in class” ESG integrated investment analysis is a key objective for 2018-2019.
● Valuation (ideally a view on intrinsic value per share based on a basic DCF (with sensitivity table of key drivers), comparable trading values, and M&A comps. DCF example output
● Highlights of how Sell Side research is flawed, with ok examples of comparables and M&A comps __________________________________________________________________________ Week 4: September 13, 2018 Topic of the week: ESG “Scores” are not factors--"The KPI Zoo" Presentation (Class Facilitator) Required Readings:
● Finding Smart Beta in the Factor Zoo ● GPIF on ESG index selection, Page 11 ● "Putting the S in ESG" report ● The Science and Art of High Quality Investing ● Corporate Lobbying Viewpoint: “Ratings That Don’t Rate: The Subjective World of ESG Ratings
Agencies” ● The Main Street Investors Coalition is an Industry-Funded Effort to Cut Off Shareholder Oversight
Additional (Optional) Readings:
● “Science & Art” summary ● MFE Project Summary Presentation ● MFE Project Paper ● Your Complete Guide to Factor-Based Investing: The Way Smart Money Invests Today (Berkin,
Swendroe) ● Hitchhikers Guide (Kurtz)
__________________________________________________________________________ Week 5: September 20, 2018 Topic: Recap of “PRI in Person” Conference (by HSRIF attendees + Class Facilitator) Reference Reading:
● PRI In Person Agenda ● About PRI
69 | Page
Annual Report Haas Socially Responsible Investment Fund
● The guide for business action on the UN SDGs Additional Reference Readings:
● PRI Guide to ESG Integration ● SDG Compass
__________________________________________________________________________ Week 6: September 27, 2018 Topic: ESG Materiality (ESG Matrix Committee + Class Facilitator) Essential Reference Reading:
● Russell Study--Materiality matters: Targeting the ESG issues that can impact performance - the material ESG score
● SASB Materiality Map, click on "launch materiality map" Additional Reference Readings:
● CS ESG Materiality Report ● Material Sustainability Information and Stock Price Informativeness ● Grewal, Jyothika and Hauptmann, Clarissa and Serafeim, George, Material Sustainability Information
and Stock Price Informativeness (November 28, 2017). Harvard Business School Working Paper. Available at SSRN: https://ssrn.com/abstract=2966144 or http://dx.doi.org/10.2139/ssrn.2966144
● Corporate Sustainability: First Evidence on Materiality(Serafeim et al) __________________________________________________________________________ Week 7: October 4, 2018 Topic: SASB Materiality Framework (ESG Matrix Committee + Class Facilitator) Essential Reference Reading:
● SASB Engagement Guide (industry specific ESG considerations when doing company analysis) https://drive.google.com/open?id=0BxFHmUttWK_2aGpFQlRpU2tuNGFteW9GV0tSSGFPVVB6bHAw
● SASB Industry Standards Field Guide https://drive.google.com/open?id=0BxFHmUttWK_2RTU3dE5DbUZvMTgyVGQwMmh1b1V4emFLUVBn
● SASB Materiality Map, click on "launch materiality map" Additional Reference Readings:
● JetBlue SASB CSR Report __________________________________________________________________________ Week 8: October 11, 2018
70 | Page
Annual Report Haas Socially Responsible Investment Fund
Topic: Advisory Committee to Join via Dial-In: Review Portfolio & Investment Ideas (Stakeholder Relations Committee + Class Facilitator) Deliverable: Document to Review Portfolio Performance, Risk Analysis & Investment Ideas __________________________________________________________________________ Week 9: October 18, 2018 Topic: An analyst view on corporate reporting & communication--What to look for in annual reports, CSR reports, and management communication. (Class Facilitator) Essential Reference Reading: Summary of Investing Between the Lines (Laura Rittenhouse)
● Why we Praise Meaningless Jargon and Fail to Realize the Emperor has No Clothes ● Book Summary
Additional Reference Reading/Class Discussion Topics: ● Investing Between the Lines (Laura Rittenhouse) ● Markup both CEO letter and CSR in a manner as discussed in Investing Between the Lines
(Rittenhouse). Are the reports authentic, credible, candid? Why or why not? ○ Q&A: Introduction to Candor Analytics (13 min) ○ Introduction to Candor Analytics (37 min)
● Please note, a CEO letter is not mandated, so companies just do a formal 10-K filing, without the additional "Annual Report" (which is typically a CEO letter, and 10-20 pages of business commentary, exhibits etc, plus the formal 10-K).
● If there is not CEO letter or “Annual Report”, read/listen to the earnings call and review the other investor statements/publications. Also, note that some companies do not have CSR's, or in some cases have CSR websites but not PDF reports.
● In any event, the objective is to assess--using whatever reports and information is available--how management communicates. If management is leading in a candid fashion that can be a positive indicator of corporate culture.
● ESG scores can be influenced by inauthentic PR initiatives. __________________________________________________________________________ Week 10: October 25, 2018 Topic: State Street SHE ETF Case Study (Class Facilitator) Essential Reference Reading:
● HBS Case Study: SHE https://drive.google.com/open?id=1h0_lFimbXkmHrv-g-XxGGbaRpkxOSzmL Additional Reference Reading:
● JUST ETF ● Drucker Institute Rankings
__________________________________________________________________________
71 | Page
Annual Report Haas Socially Responsible Investment Fund
Week 11: November 1, 2018 Topic: Introduction to Engagement/Stewardship/Proxy Voting (Stewardship/Engagement/Proxy Voting Committee + Class Facilitator) Essential Reference Reading:
● Keep Politics Out of the Boardroom ● Politics Have Already Entered the Boardroom ● Shareholder Rights Under Attack: The Importance of SEC Rule 14a-8 ● The Proxy Advisers’ Veto ● It's time to put the shareholder value myth in the grave. America will be better off
Additional Reference Reading:
● ICCR 2018 Proxy Resolutions and Voting Guide ● Political, Social, and Environmental Shareholder Resolutions: Do They Create or Destroy Shareholder
Value? (National Assn of Manufacturers) ● The Conflicted Role of Proxy Advisors
Note: Moskowitz Prize to be presented at “SRI in the Rockies” Conference Nov 1-Nov 4. https://www.sriconference.com/. Student scholarship to attend conference may be available through CRB.
● Moskowitz Prize ● The Proof Is In The Profits: America’s Happiest Companies Make More Money
__________________________________________________________________________ Week 12: November 8, 2018 Students to attend 2018 Berkeley Sustainable Business & Investment Forum (BSBIF) sessions November 8-9. Content and networking.
● BSBIF 2018 __________________________________________________________________________ Week 13: November 15, 2018 Topic: Recap BSBIF, Committee Updates & Prepare for 11/29 Advisory Board Update (Committees + Class Facilitator) __________________________________________________________________________ November 22, 2018: Thanksgiving Holiday--no class __________________________________________________________________________ Week 14: November 29, 2018 (final class) Topic: Advisory Board Semiannual Meeting (Stakeholder Relations Committee) Deliverable: Semiannual report with summary of performance, risk, asset allocation, investment holdings & ideas.
72 | Page
Annual Report Haas Socially Responsible Investment Fund
Haas Socially Responsible Investment Fund (HSRIF) Additional Resources
Investment Framework
Pat Dorsey. The little book that builds wealth : Morningstar’s knockout formula for finding great investments. Exhibit 11.1: The Moats Process. Hoboken, New Jersey: John Wiley & Sons, Inc., 2008, p. 145. url: https://www.youtube.com/watch?v=YFS5JBgz1Xc.
Benjamin Graham. The intelligent investor : a book of practical counsel with a new preface and appendix by Warren E. Buffett. 4th ed. Chapter 8 : The investor and market fluctuations, Chapter 20 : “Margin of safety” as the central concept of investing, Appendix 1 : The superinvestors of Graham-and-Doddsville. New York: HarperBusiness, 1973.
Joel Greenblatt. The little book that still beats the market. Hoboken, New Jersey: J. Wiley & Sons, 2010.
Dan Hanson. “ESG investing in Graham & Doddsville”. In: Journal of Applied Corporate Finance 25.3 (Sept. 2013), pp. 20–31.
L. J. Rittenhouse. Investing between the lines : how to make smarter investment decisions by decoding CEO communications. New York: McGraw-Hill, 2013.
Warren E. Buffett and Lawrence A. Cunningham. The essays of Warren Buffett : lessons for corporate America. Ed. by Lawrence A. Cunningham. 4th ed. Durham, North Carolina: The Cunningham Group and Carolina Academic Press, 2015.
James C. Collins. Good to great : why some companies make the leap ... and others don’t. New York: HarperBusiness, 2001. url: http://www.jimcollins.com/tools/diagnostic- tool.pdf.
Lawrence A. Cunningham, Torkell T. Eide, and Patrick Hargreaves. Quality investing : owning the best companies for the long term. Petersfield, Hampshire: Harriman House Ltd, 2016.
Pat Dorsey. Dorsey Asset Management publications & commentary. url: http://dorseyasset.com/pubs.html.
Philip A. Fisher. Common stocks and uncommon profits and other writings by Philip A. Fisher. New York: Wiley, 2003.
Peter Lynch and John Rothchild. Beating the street. New York: Simon & Schuster, 1993.
Philip M. Rosenzweig. The halo effect– and the eight other business delusions that deceive managers. New York: Free Press, 2007.
Peter J. Tanous. Investment gurus : a road map to wealth from the world’s best money managers. New York: New York Institute of Finance, 1997, pp. 167, 213.
William Thorndike. The outsiders : eight unconventional CEOs and their radically rational blueprint for
73 | Page
Annual Report Haas Socially Responsible Investment Fund
success. Boston, Massachusetts: Harvard Business Review Press, 2012.
Fundamental Analysis & Reporting
David Nincic. Fundamental equity analysis : a primer. 1999. url: http : / / www . fusioninvesting . com / Files / reading / equity - analysis- primer- wharton.pdf.
Adam Calamar. Return on equity : a compelling case for investors. Apr. 15, 2016. url: https://www.jenseninvestment.com/wp- content/blogs.dir/1/files_mf/1460992868WP23v4.pdf.
Atul Gawande. The checklist manifesto : how to get things right. New York: Metropolitan Books, 2010.
David Owen Robinson. Annual reports RIP. June 28, 1998. url: http://faculty.haas.berkeley.edu/robinson/NYTAR.htm.
SASB engagement guide for asset owners & asset managers. 1.0. Sustainability Accounting Standards Board. 1045 Sansome Street, Suite 450, San Francisco, CA 94111, July 2016. url: http://using.sasb.org/wp- content/uploads/2016/07/SASB- EngagementGuide.pdf?submissionGuid=c6a99341- 70b9- 48c3- 927a- e8972b36452c.
Jason Zweig. 16 favorite annual letters from an investor who’s read more than 1,000. Apr. 1, 2016. url: http://blogs.wsj.com/ moneybeat/2016/04/01/16- favorite- annual- letters- from- an- investor- whos- read- more- than- 1000/.
Jason Zweig. It’s time for investors to re-learn the lost art of reading. Apr. 1, 2016. url: http://blogs.wsj.com/moneybeat/ 2016/04/01/its- time- for- investors- to- re- learn- the- lost- art- of- reading/.
Jason Zweig. The best annual letters from an investor who read nearly 3,000 of them. July 11, 2016. url: http://blogs.wsj.com/ moneybeat/2016/07/11/the- best- annual- letters- from- an- investor- who- read- nearly- 3000- of- them/.
Reporting and Accounting
Dan Hanson and Rohan Dhanuka. “The “science” and “art” of high quality investing”. In: Journal of Applied Corporate Finance 27.2 (June 2015), pp. 73–86.
John Doerr, Measure What Matters: How Google, Bono, and the Gates Foundation Rock the World with OKRs. New York: Portfolio/Penguin, 2018 Jean Rogers. Re: concept release on business and financial disclosure required by Regulation S-K. Sustainability Accounting Standards Board. July 1, 2016. url: https://www.sec.gov/comments/s7- 06- 16/s70616- 25.pdf.
Governance
Jeff Gramm. Dear chairman : boardroom battles and the rise of shareholder activism. Chapter 5 :
74 | Page
Annual Report Haas Socially Responsible Investment Fund
Ross Perot versus General Motors: The Unmaking of the Modern Corporation. New York: Harper Business, 2015.
David F. Larcker and Brian Tayan. Corporate governance matters : a closer look at organizational choices and their consequences. 2nd ed. Indianapolis, Indiana: Pearson, 2015.
Keith Ambachtsheer. “The case for long-termism”. In: Rotman International Journal of Pension Management 7.2 (2014). url: http://papers.ssrn.com/sol3/papers.cfm?abstract_id= 2497508.
James Hawley, Keith Johnson, and Edward Waitzer. Re-thinking fiduciary duty in a 21st century context. Mar. 30, 2012. url: http://www.law.harvard.edu/programs/lwp/pensions/ conferences / pensions3 _ 12 / HAWLEY % 20JOHNSON % 20WAITZER . pdf.
Eric Jackson. How many photo ops does it take to cut a stock in half? bringing Viacom back. Jan. 15, 2016. url: https://assets. documentcloud.org/documents/2693288/Activist- Investor- s- Report- on- Viacom.pdf.
Matt Levine. T. Rowe Price voted for the Dell buyout by accident. May 13, 2016. url: https : / / www . bloomberg . com / view / articles/2016- 05- 13/t- rowe- price- voted- for- the- dell- buyout- by- accident.
James S. Riepe. “Best practices in corporate governance”. In: Global perspectives on investment management : learning from the leaders. Vol. 2006. 1. CFA Institute, 2006. url: http://www. cfapubs.org/doi/pdf/10.2469/op.v2006.n1.4377.
Steven Davidoff Solomon. Another Hershey Deal May Come Unwrapped. Maybe It Should. July 5, 2016. url: http://www. nytimes . com / 2016 / 07 / 06 / business / dealbook / another - hershey- deal- may- come- unwrapped- maybe- it- should.html.
Howard Buffett & William Eimicke. Social Value Investing: A Management Framework for Effective Partnerships. New York, Columbia University Press, 2018.
Business History
Bill Birchard. Merchants of Virtue: Herman Miller and the Making of a Sustainable Company. Palgrave, 2011
John Brooks. Business adventures: twelve classic tales from the world of Wall Street. New York: Weybright and Talley, 1969. url: http : / / www . openroadmedia . com / ebook / business - adventures/.
Steve Coll. Private empire : ExxonMobil and American power. New York: Penguin Press, 2012.
Timothy J Mohin. Changing Business from the Inside Out: A Tree-Hugger's Guide to Working in Corporations, Greenleaf Publishing, 2011 Walton, Sam, and John Huey. Sam Walton, Made in America: My Story. New York: Doubleday, 1992
75 | Page
Annual Report Haas Socially Responsible Investment Fund
Developing a Fundamental Stock Analyst Mindset: Reading Guidelines
The Little Book that (Still) Beats the Market (Joel Greenblatt)
● How can the formula still work 10 years after publication (and launch of www.magicformulainvesting.com etc.)?
● Is the magic formula "factor betting"? ● How else could "Value" and "Quality" attributes be defined? ● What other attributes (or "factors") drive long term business and investment results? ● What is a value trap? ● Do "screens" (or factor investing approaches) increase the risk of identifying value traps? ● How to do the opposite? ("always invert")
The Little Book that Builds Wealth (Pat Dorsey)
● What is an "economic moat"? ● What are common attributes of moats? Are these outcomes or drivers? ● Can a business with a sustainable competitive advantage not have a high ROIC? ● What are some examples of successful (& unsuccessful) companies with:
○ Great products; ○ Strong market share; ○ Great execution; and ○ Great management.
● What are some examples of successful (& unsuccessful) companies with: ○ Intangible assets; ○ Customer switching costs; ○ Network effects; ○ Cost advantages.
Having done the above:
For your examples,
● Are these “successful” companies likely to be good investments? ○ How would you think about determining? ○ Remember, whether you like a “company” is distinct from liking a “security” as an
investment. ● How relevant were ESG issues in your appraisal?
○ How would you think about determining? ○ How do you think about what might be “material”? ○ How does management communicate? How can you measure ESG issues? ○ Are these issues “priced in” to the stock?
76 | Page