Embed Size (px)
Citation preview
1
Welcome to the October 2005 & March 2006
HSPA Score Interpretation TrainingONLINE!
(Updated 12-14-05)
2
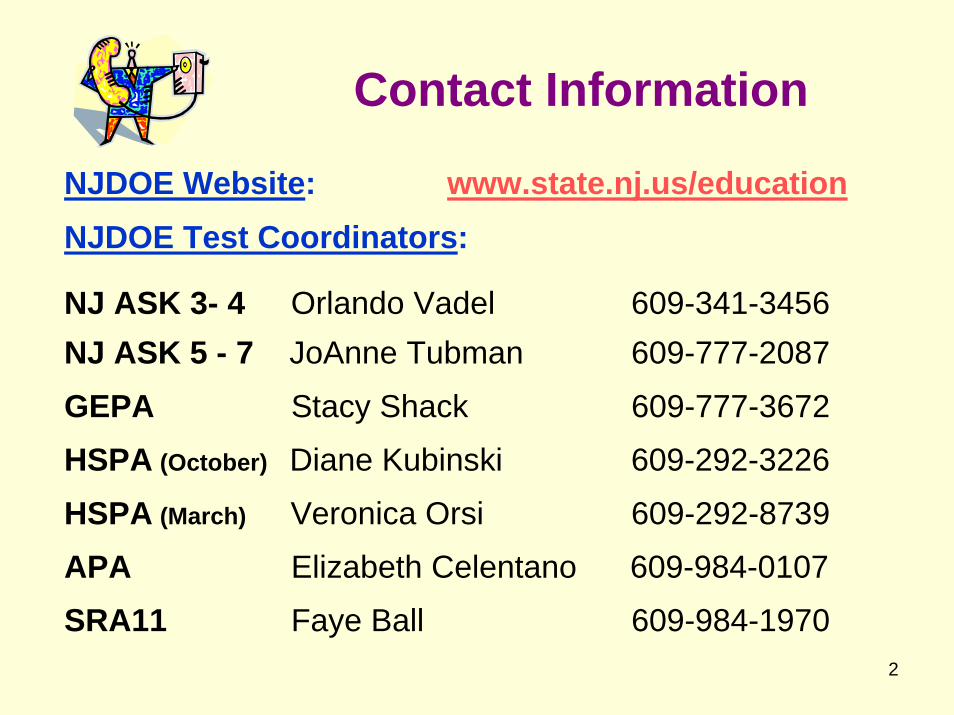
NJDOE Website: www.state.nj.us/educationNJDOE Test Coordinators:
NJ ASK 3- 4 Orlando Vadel 609-341-3456NJ ASK 5 - 7 JoAnne Tubman 609-777-2087
GEPA Stacy Shack 609-777-3672
HSPA (October) Diane Kubinski 609-292-3226
HSPA (March) Veronica Orsi 609-292-8739
APA Elizabeth Celentano 609-984-0107
SRA11 Faye Ball 609-984-1970
Contact Information
3
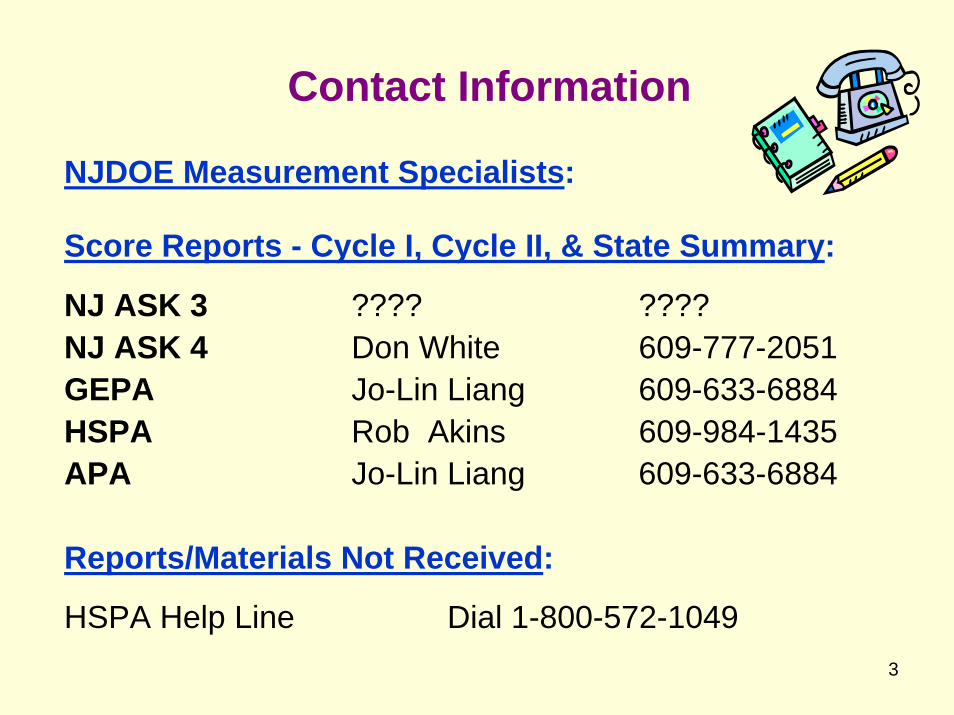
NJDOE Measurement Specialists:
Score Reports - Cycle I, Cycle II, & State Summary:
NJ ASK 3 ???? ????NJ ASK 4 Don White 609-777-2051GEPA Jo-Lin Liang 609-633-6884HSPA Rob Akins 609-984-1435APA Jo-Lin Liang 609-633-6884
Reports/Materials Not Received:
HSPA Help Line Dial 1-800-572-1049
Contact Information
4
Point ValuesThe following slides, for each content area, outline for each cluster and skill set:
– the raw score points possible– the Just Proficient Means– total raw score points possible
5
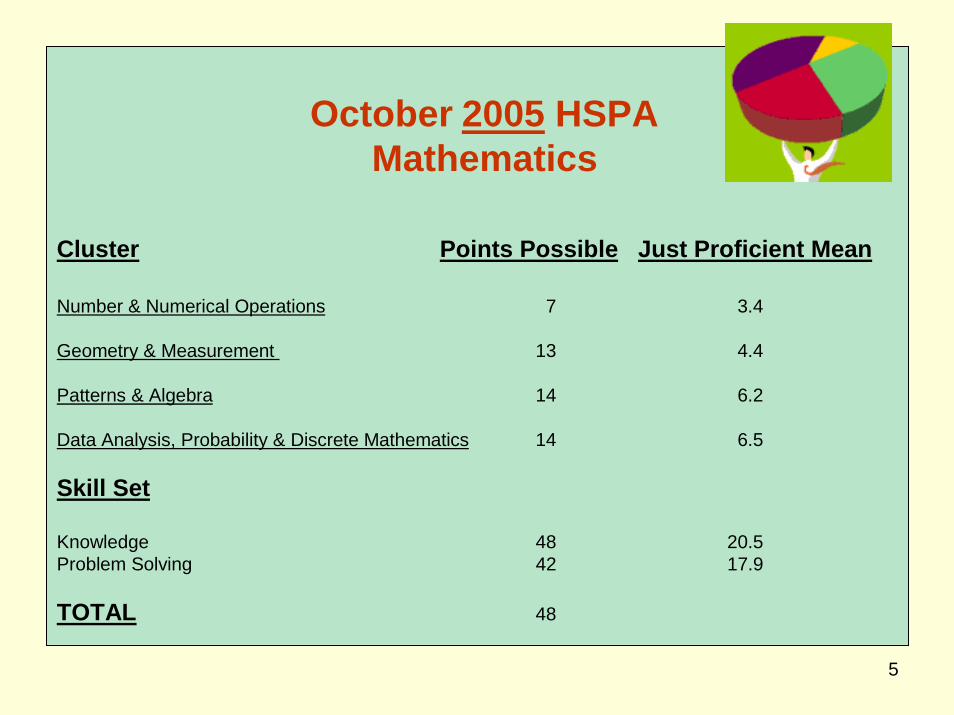
October 2005 HSPAMathematics
Cluster Points Possible Just Proficient Mean
Number & Numerical Operations 7 3.4
Geometry & Measurement 13 4.4
Patterns & Algebra 14 6.2
Data Analysis, Probability & Discrete Mathematics 14 6.5
Skill Set
Knowledge 48 20.5Problem Solving 42 17.9
TOTAL 48
6
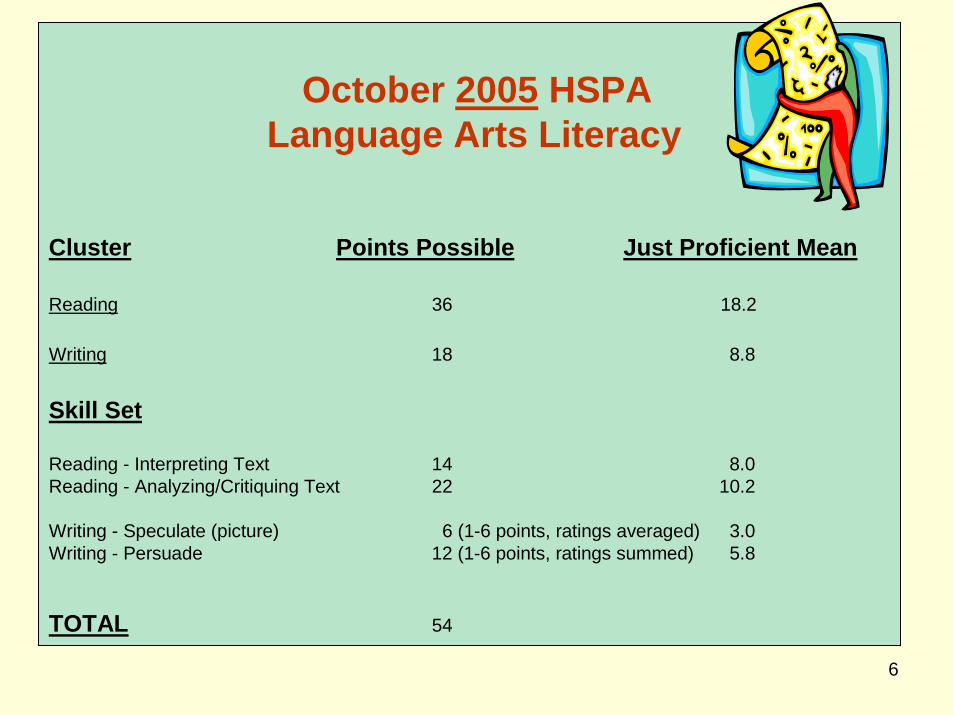
October 2005 HSPALanguage Arts Literacy
Cluster Points Possible Just Proficient Mean
Reading 36 18.2
Writing 18 8.8
Skill Set
Reading - Interpreting Text 14 8.0Reading - Analyzing/Critiquing Text 22 10.2
Writing - Speculate (picture) 6 (1-6 points, ratings averaged) 3.0Writing - Persuade 12 (1-6 points, ratings summed) 5.8
TOTAL 54
7
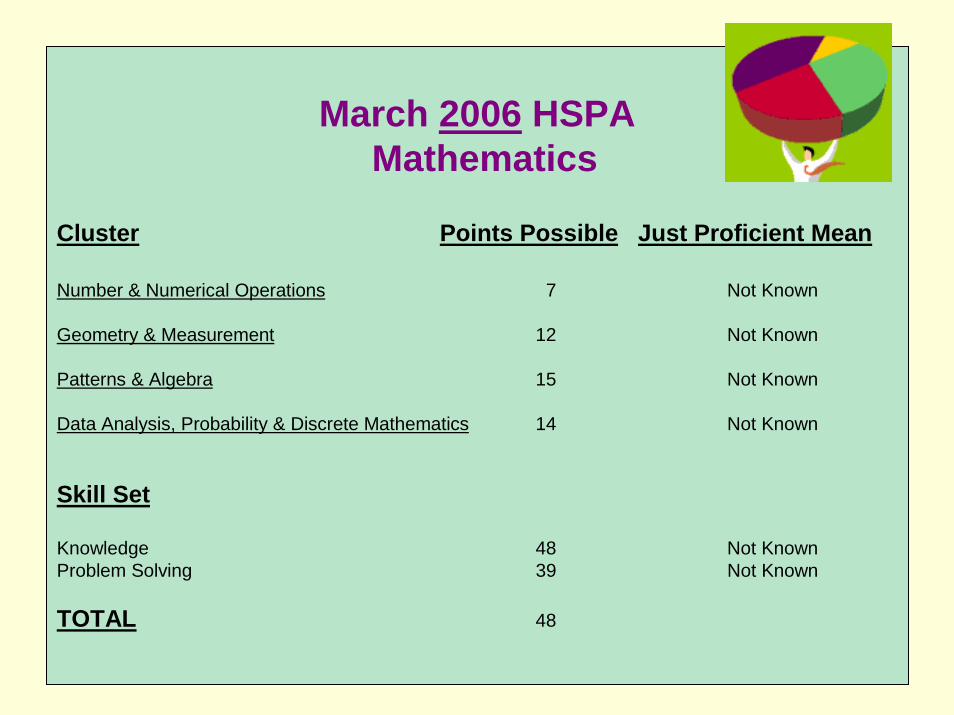
March 2006 HSPAMathematics
Cluster Points Possible Just Proficient Mean
Number & Numerical Operations 7 Not Known
Geometry & Measurement 12 Not Known
Patterns & Algebra 15 Not Known
Data Analysis, Probability & Discrete Mathematics 14 Not Known
Skill Set
Knowledge 48 Not KnownProblem Solving 39 Not Known
TOTAL 48
8
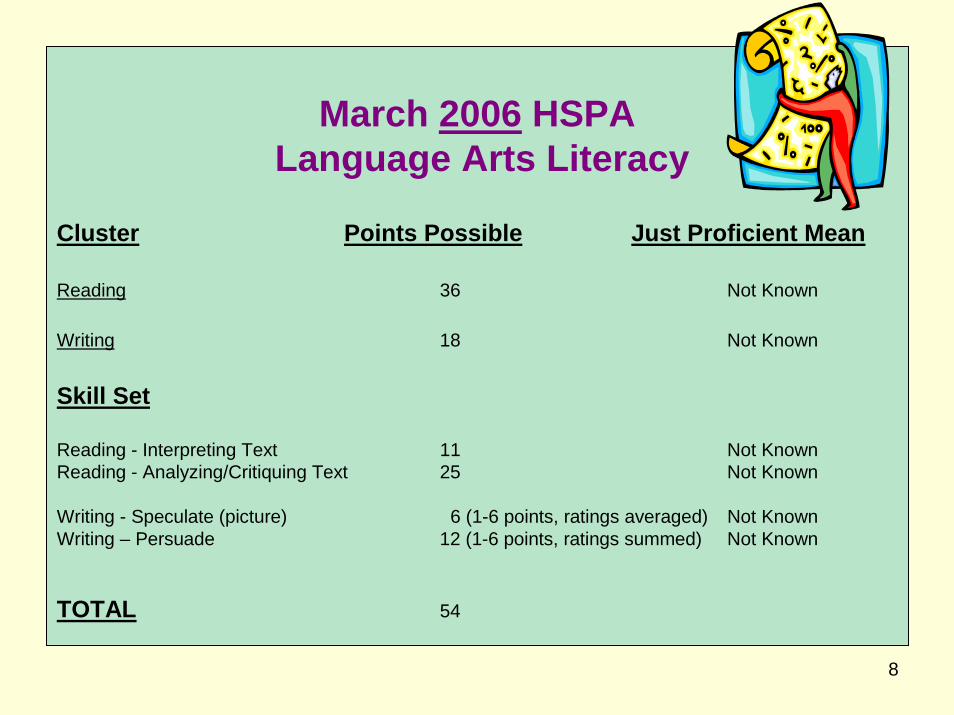
March 2006 HSPALanguage Arts Literacy
Cluster Points Possible Just Proficient Mean
Reading 36 Not Known
Writing 18 Not Known
Skill Set
Reading - Interpreting Text 11 Not KnownReading - Analyzing/Critiquing Text 25 Not Known
Writing - Speculate (picture) 6 (1-6 points, ratings averaged) Not KnownWriting – Persuade 12 (1-6 points, ratings summed) Not Known
TOTAL 54
9
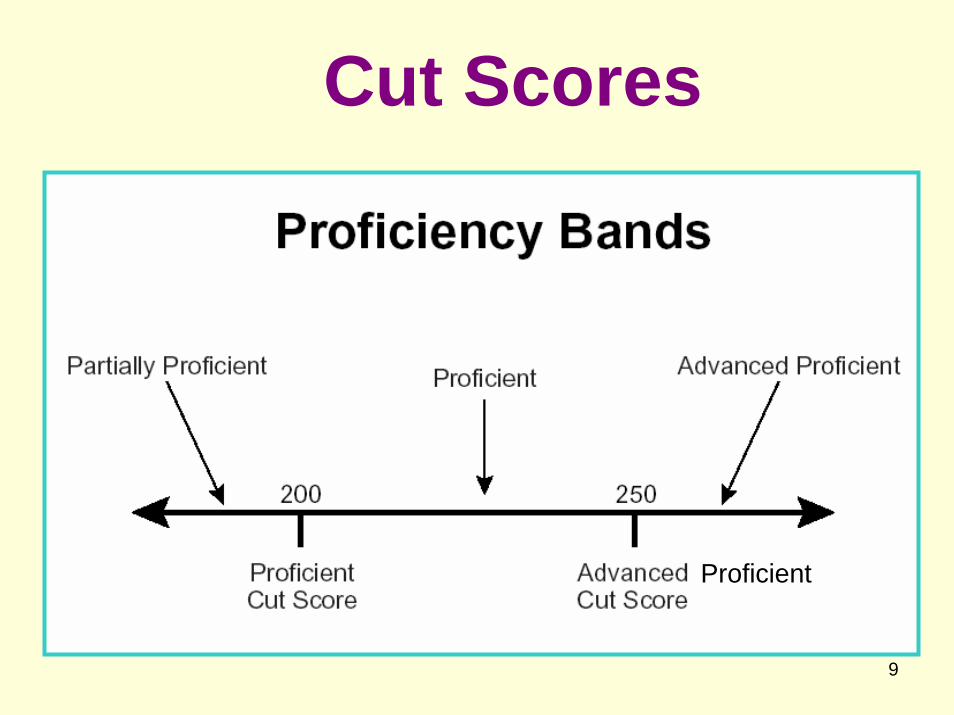
Cut Scores
Proficient
10
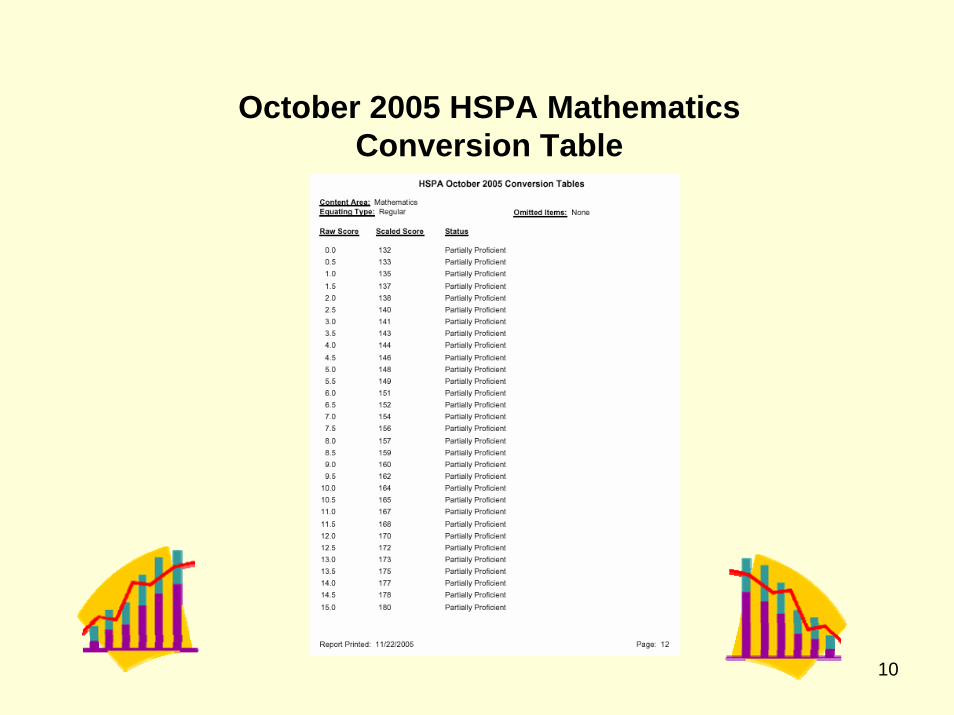
October 2005 HSPA MathematicsConversion Table
11
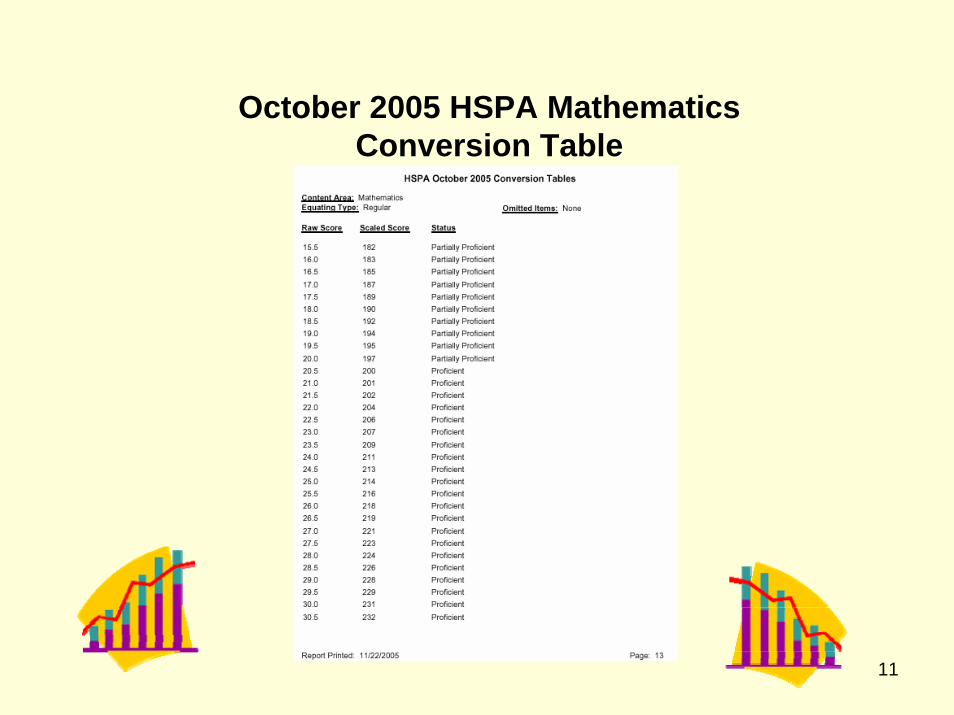
October 2005 HSPA MathematicsConversion Table
12
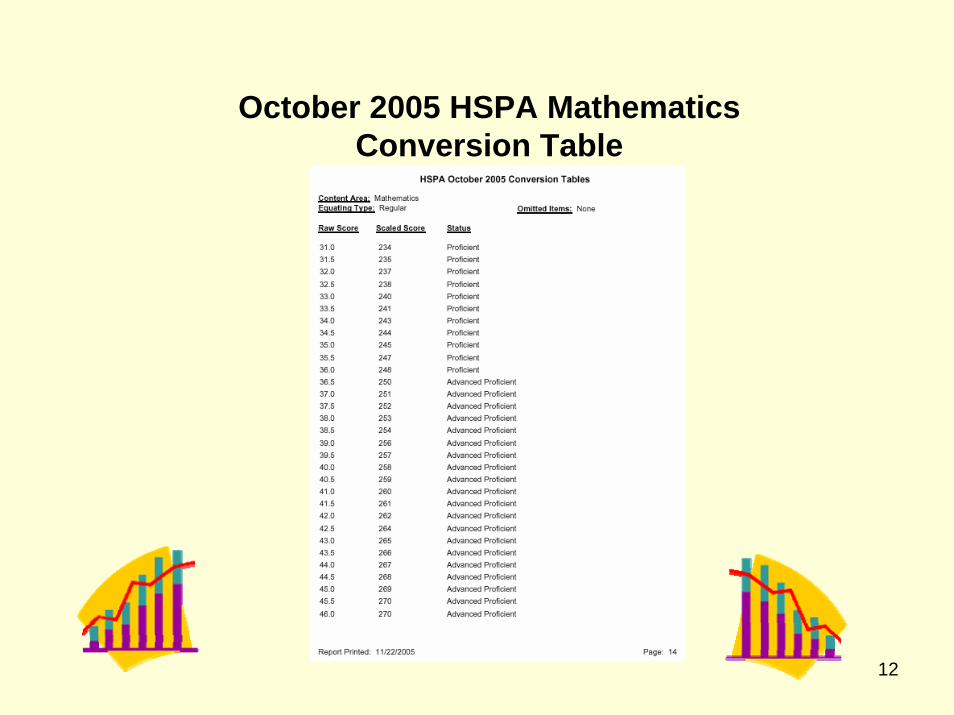
October 2005 HSPA MathematicsConversion Table
13
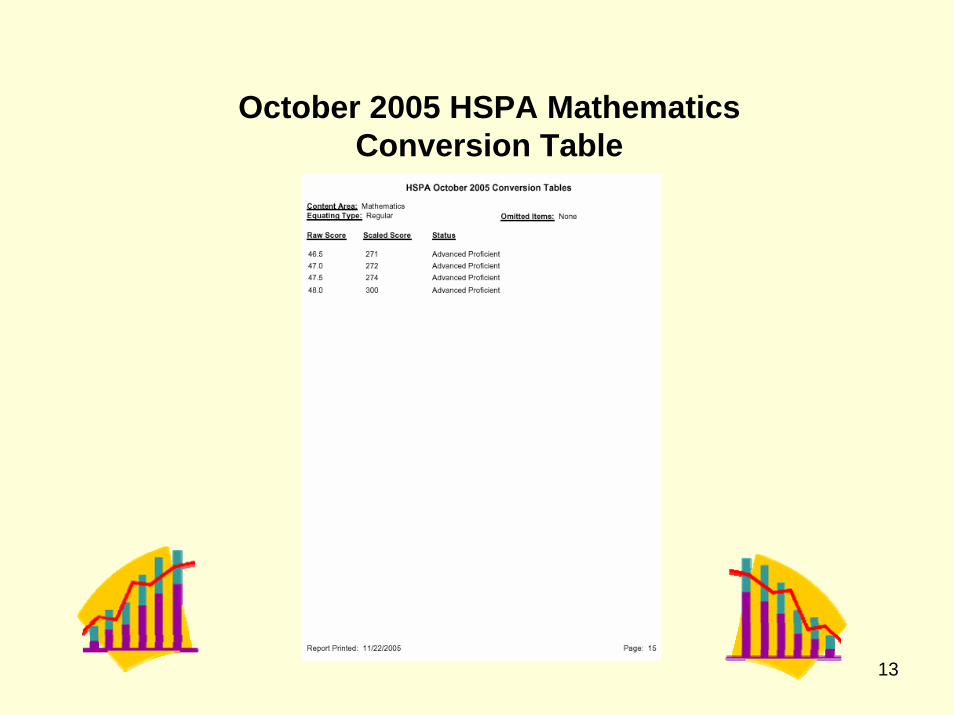
October 2005 HSPA MathematicsConversion Table
14
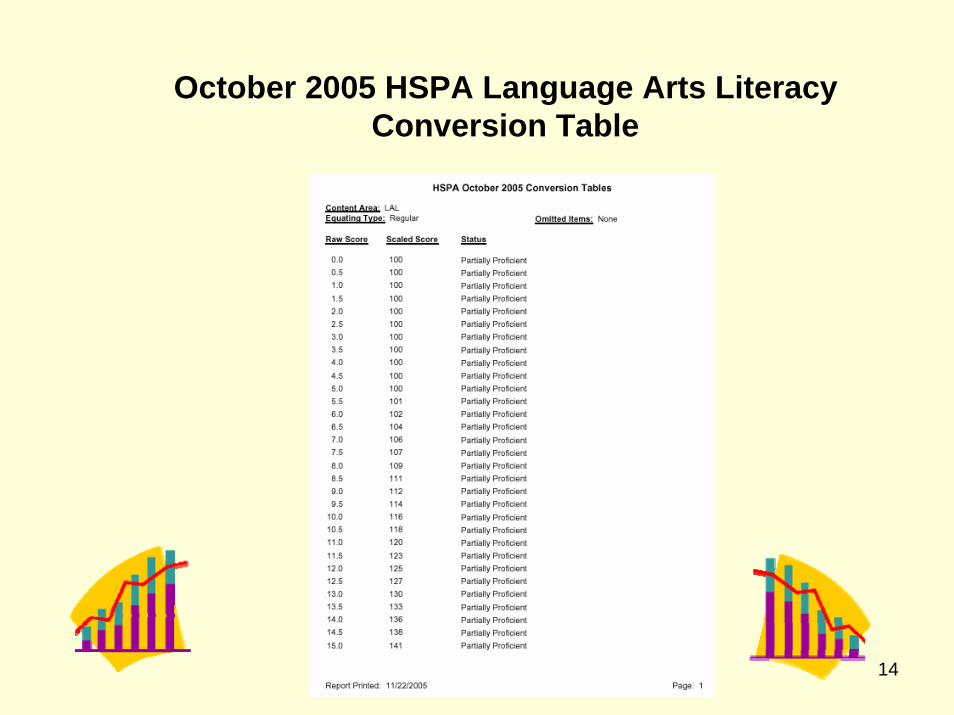
October 2005 HSPA Language Arts Literacy Conversion Table
15
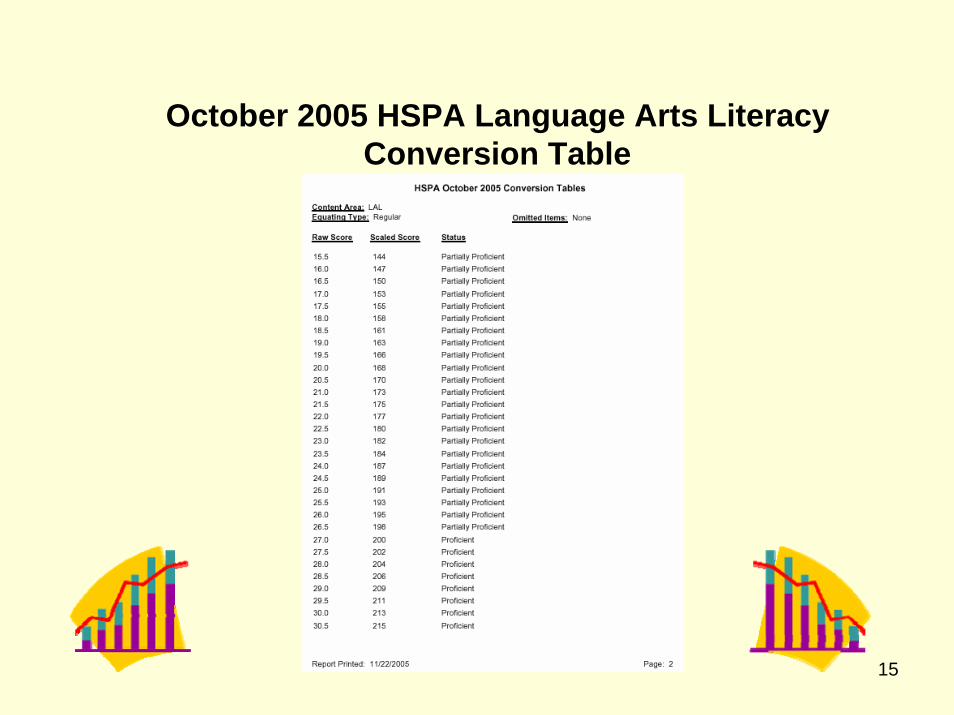
October 2005 HSPA Language Arts Literacy Conversion Table
16
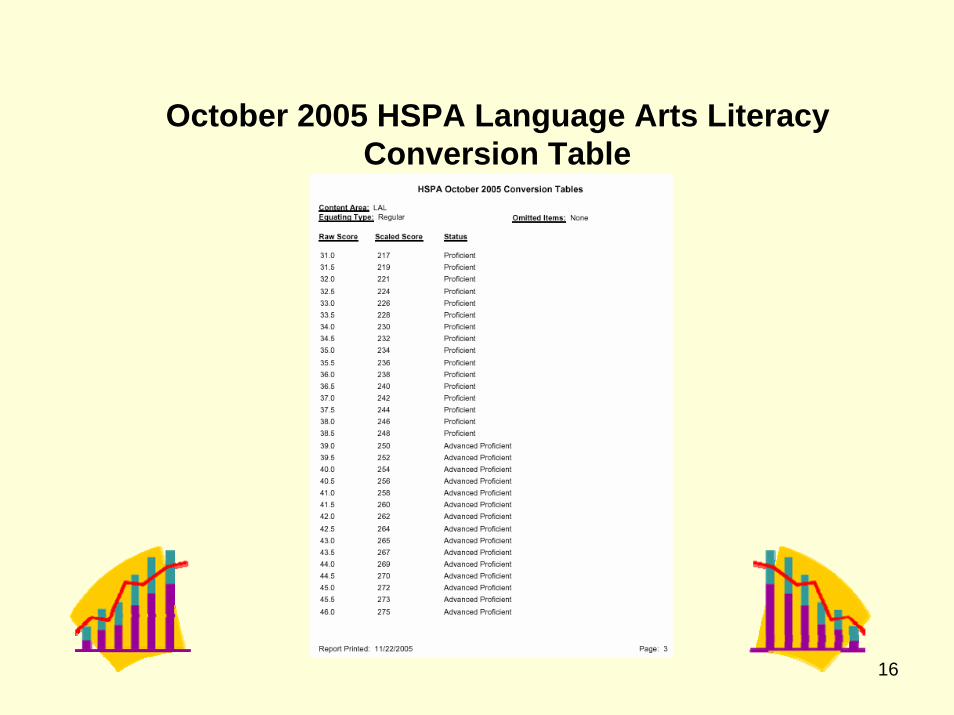
October 2005 HSPA Language Arts Literacy Conversion Table
17
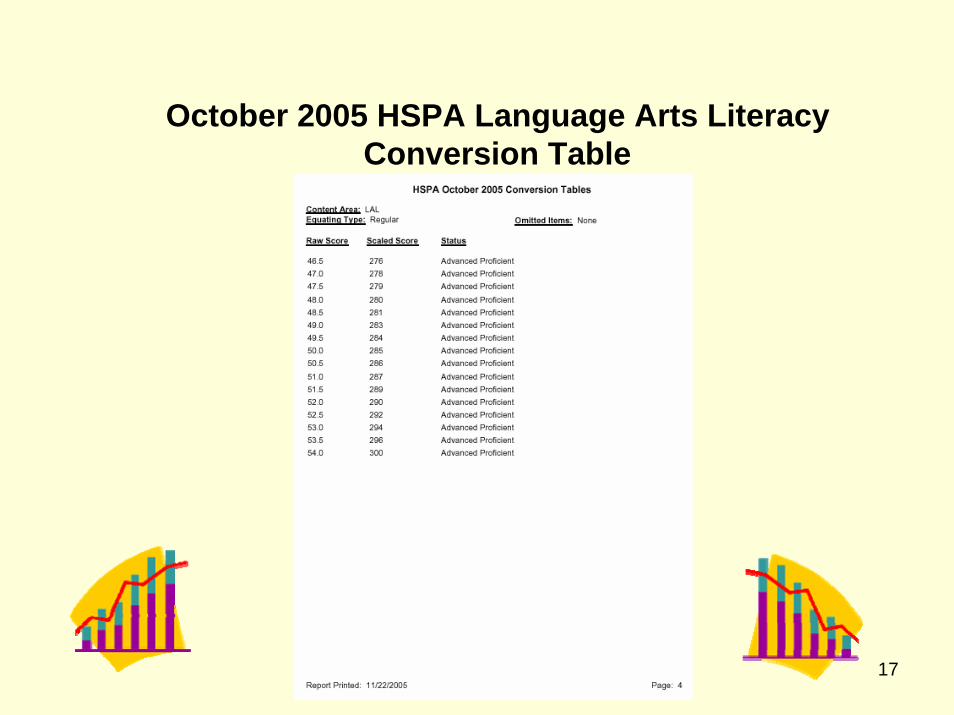
October 2005 HSPA Language Arts Literacy Conversion Table
18
Student Evaluation– Use proficiency levels to evaluate Partially
Proficient students’ intervention needs.
– Examine the obtained raw score points.
– Compare cluster raw scores to Just Proficient Means to diagnose possible weakness.
– Use multiple measures to evaluate students.
– Never use the test results as the onlyparameter for important decisions such as student placement.
Proper Use of HSPA Results
19
Program Evaluation– Use percentage of students at
Proficient and Advanced Proficient to make year-to-year comparisons.
– Use school or district Scale Score Means to make year-to-year comparisons.
– Never compare school or district Cluster Means from year-to-year since clusters have too few items to be equated.
– Never compare Just Proficient Meansfrom year-to-year since clusters have too few items to be equated.
Proper Use of HSPA Results (continued)
20
Program Evaluation (cont.)
– Use DFG as a relative indicator.
– Do NOT use the Preliminary Performance by Demographic Group Report for Adequate Yearly Progress (AYP) purposes since this report includes ALL students and does NOT have AYP exclusions.
Proper Use of HSPA Results (continued)
21
• Student information that appears on the actual reports is information that was scanned from the answer folders and reflects any record changes that were made.
• Reports are sorted by grade (11, R11,12, R12, RS, AH).
• Reports for students attending out-of-district placements (ODP) appear at the end of each grade appropriate report.
• Adult High (AH) & Returning Students (RS) onlyreceive ISRs & a Student Sticker.
Sample Reports
22
• The following slides show sample reports. They are for illustrative purposes only. They do not represent the actual raw score to scale score conversions & all student information is fictitious.
• Students who took the Braille, Large Print, or Alternate form of the test are not included in the aggregate reports because items were dropped from the regular test.
• Please consult the 2005-2006 HSPA Cycle I & Cycle II Score Interpretation Manual available online at www.measinc.com/nj and at www.state.nj.us/education/
Sample Reports (continued)
23
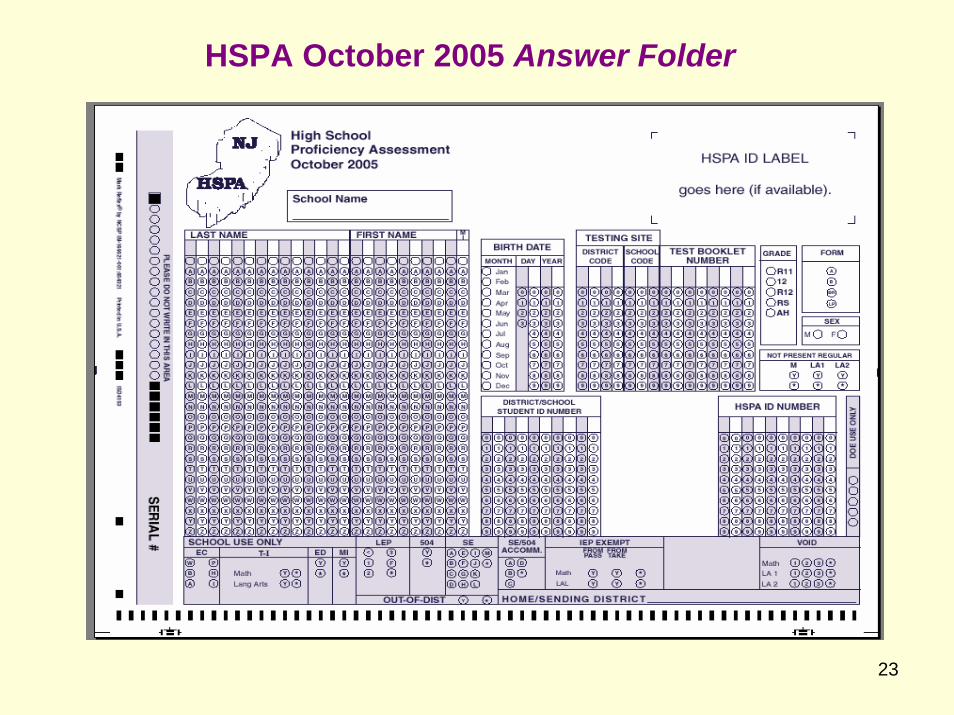
HSPA October 2005 Answer Folder
24
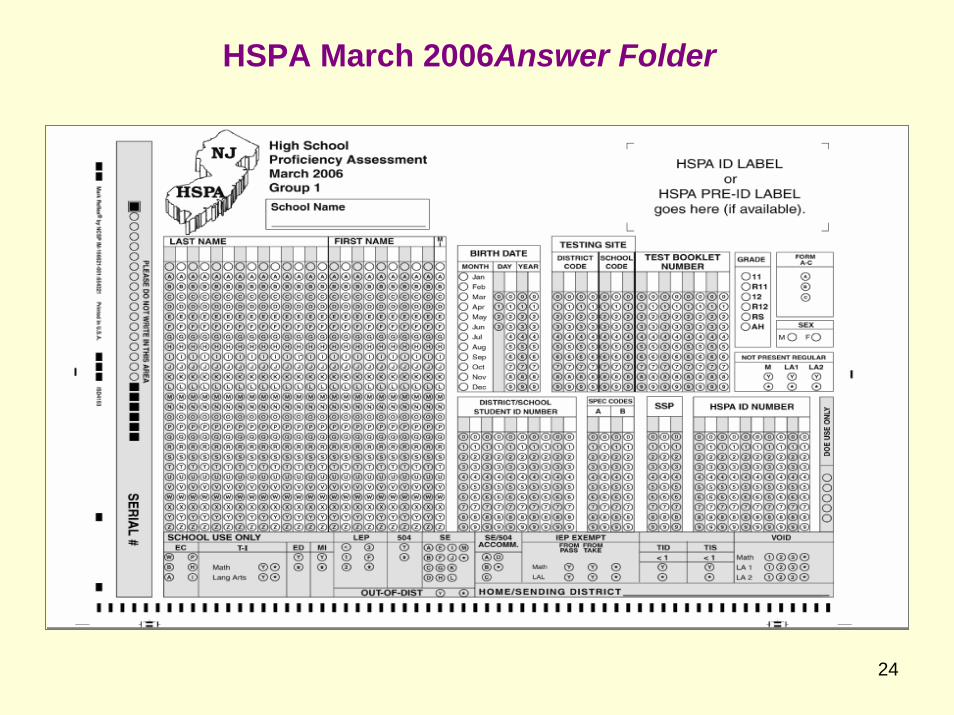
HSPA March 2006Answer Folder
25
October 2005 Cycle I ReportsAll Grades TestedDelivered January 3-6, 2006
March 2006 Cycle I ReportsAll Grades Tested
Delivered June 5-9, 2006
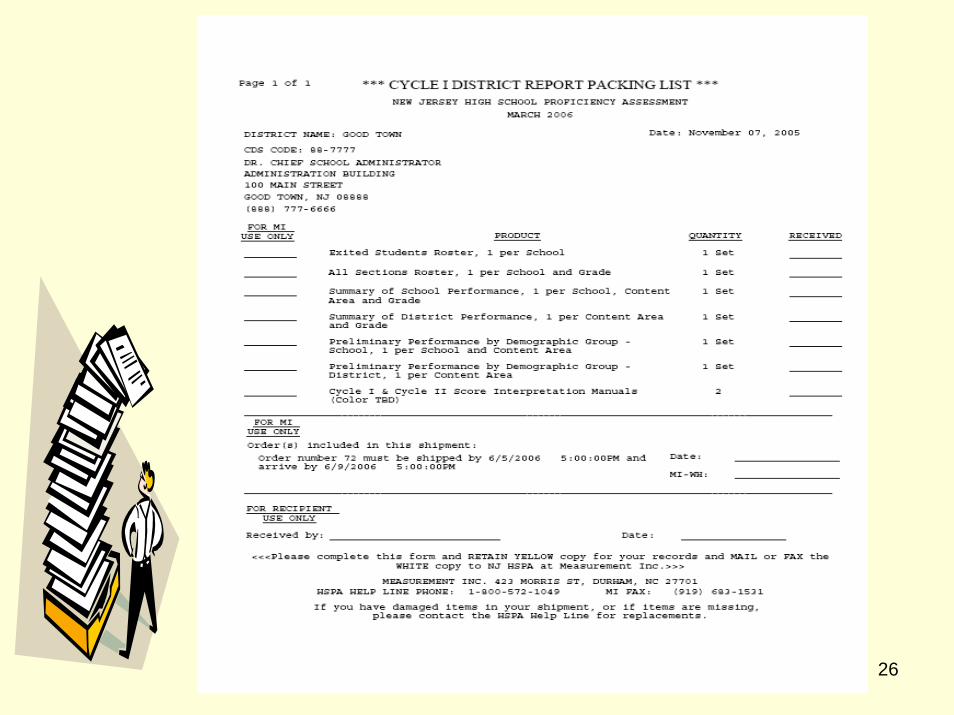
26
27
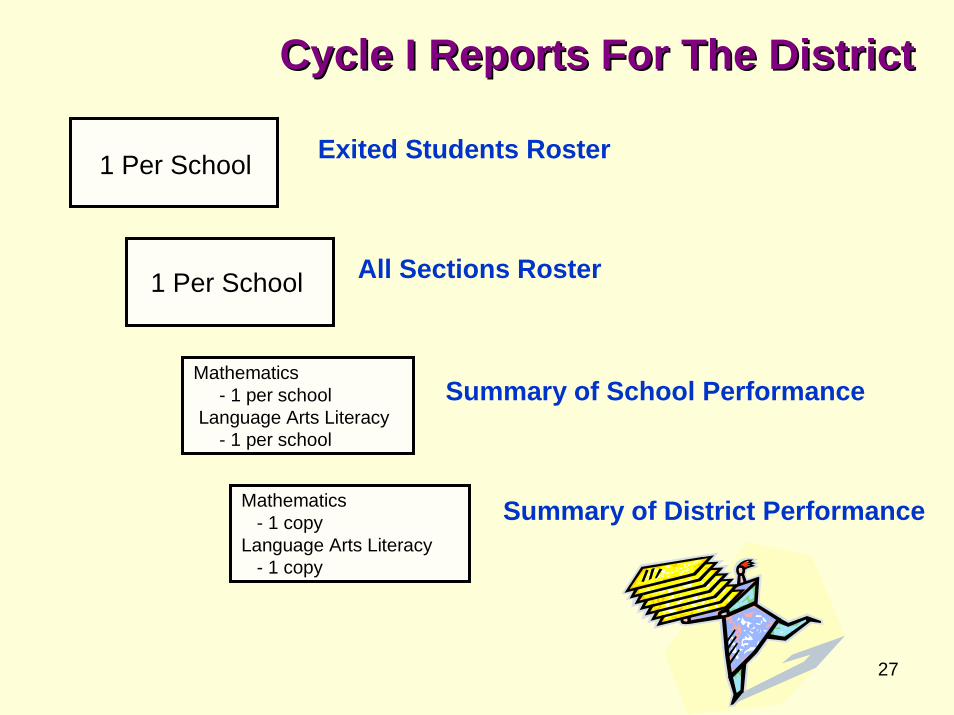
1 Per School
1 Per School
Mathematics - 1 per school
Language Arts Literacy- 1 per school
Mathematics - 1 copy
Language Arts Literacy- 1 copy
Exited Students Roster
All Sections Roster
Summary of School Performance
Summary of District Performance
Cycle I Reports For The DistrictCycle I Reports For The District
28
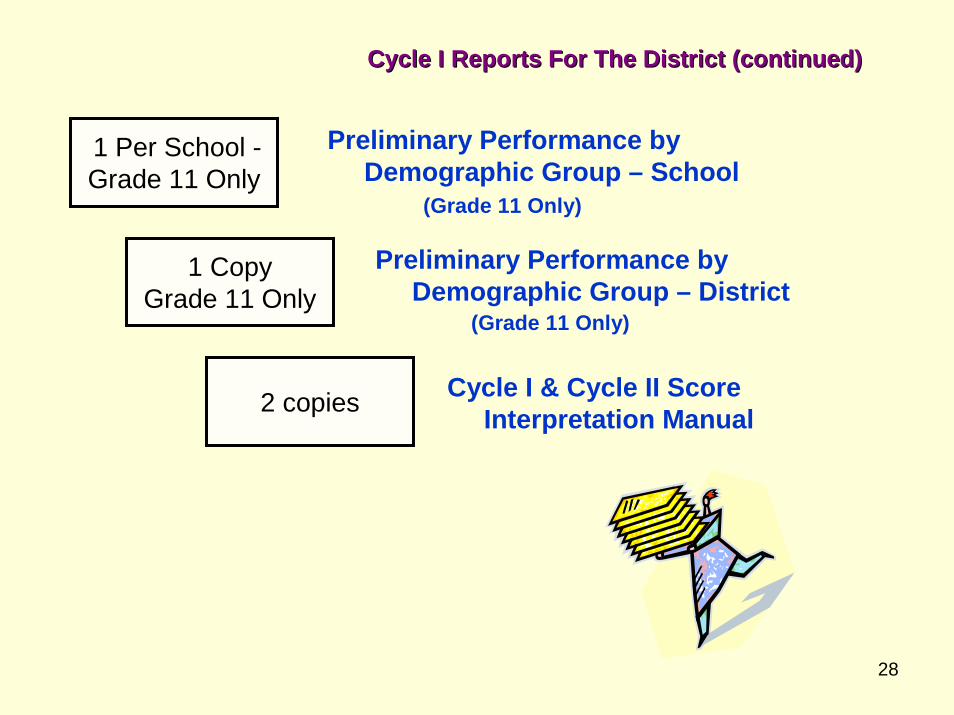
1 Per School -Grade 11 Only
1 CopyGrade 11 Only
2 copies
Preliminary Performance byDemographic Group – School
(Grade 11 Only)
Preliminary Performance byDemographic Group – District
(Grade 11 Only)
Cycle I & Cycle II Score Interpretation Manual
Cycle I Reports For The District (continued)Cycle I Reports For The District (continued)
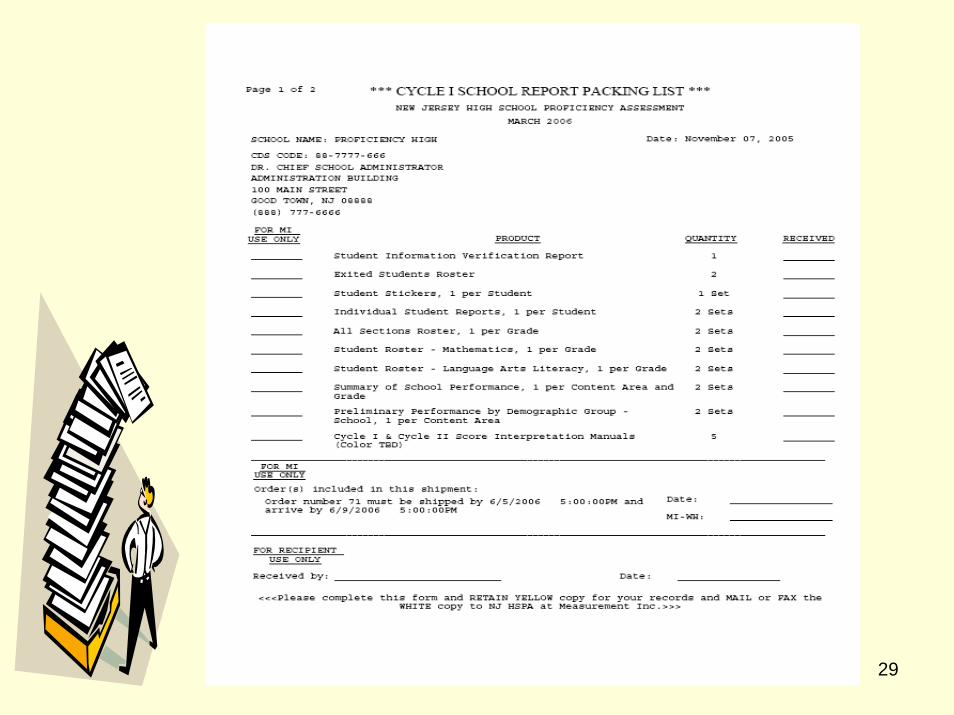
29
30
31
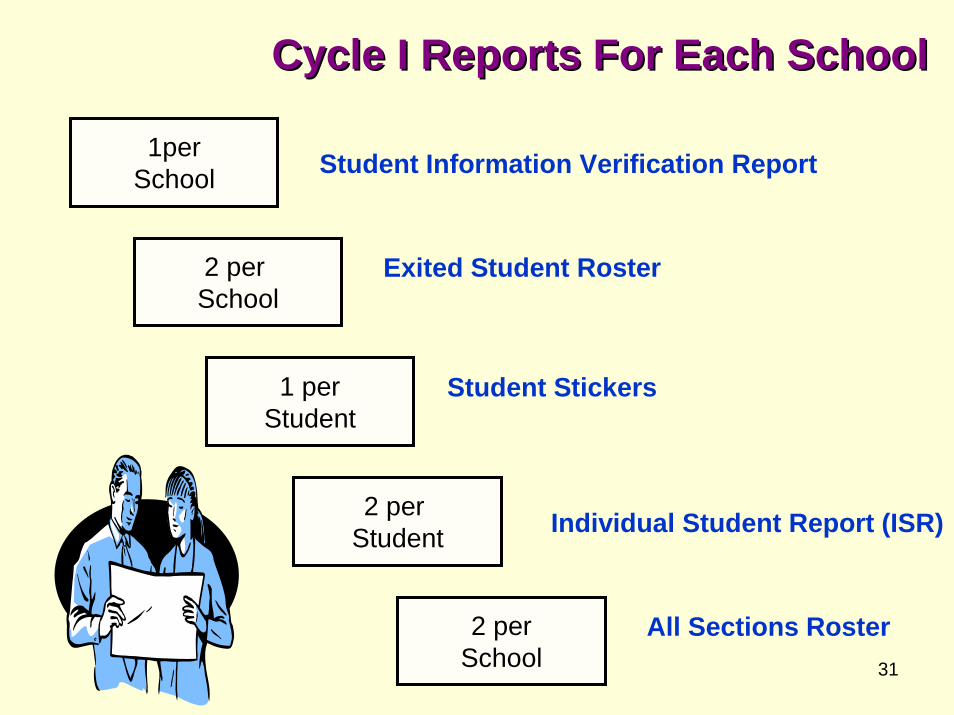
1perSchool
2 per School
1 perStudent
2 per Student
2 perSchool
Student Information Verification Report
Exited Student Roster
Student Stickers
Individual Student Report (ISR)
All Sections Roster
Cycle I Reports For Each SchoolCycle I Reports For Each School
32
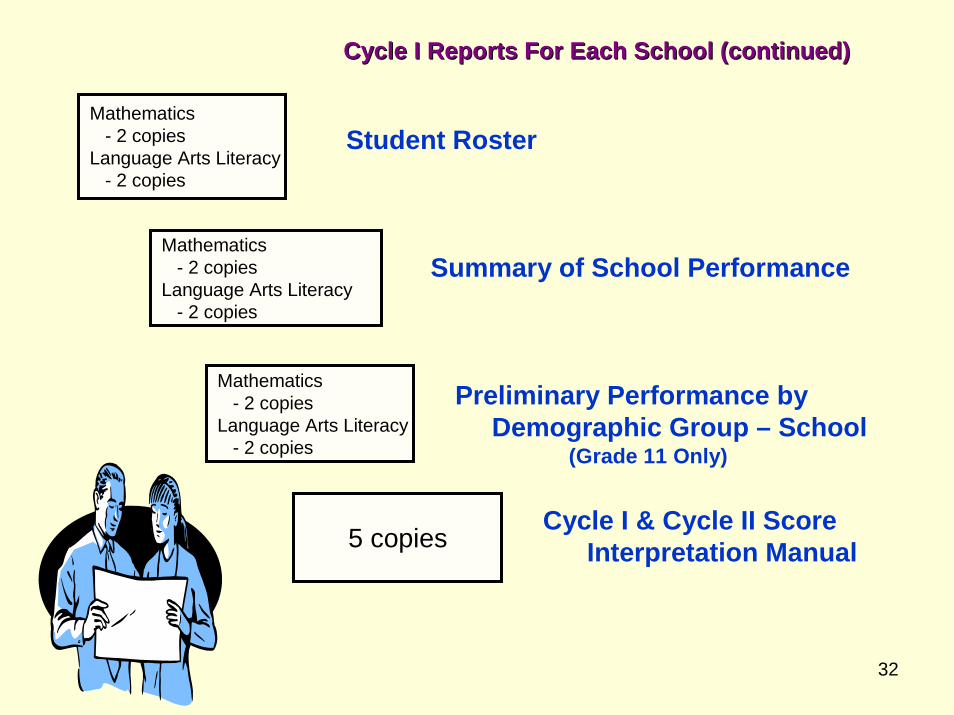
Mathematics - 2 copies
Language Arts Literacy- 2 copies
Mathematics - 2 copies
Language Arts Literacy- 2 copies
Mathematics - 2 copies
Language Arts Literacy- 2 copies
5 copies
Student Roster
Summary of School Performance
Preliminary Performance byDemographic Group – School
(Grade 11 Only)
Cycle I & Cycle II Score Interpretation Manual
Cycle I Reports For Each School (continued)Cycle I Reports For Each School (continued)
33
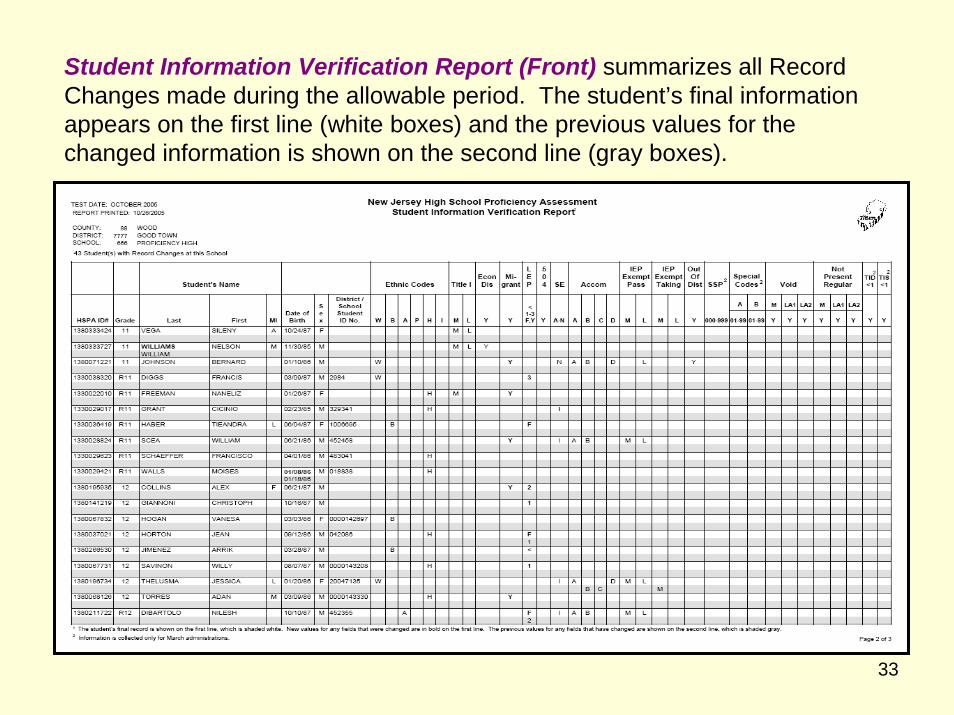
Student Information Verification Report (Front) summarizes all Record Changes made during the allowable period. The student’s final information appears on the first line (white boxes) and the previous values for the changed information is shown on the second line (gray boxes).
34
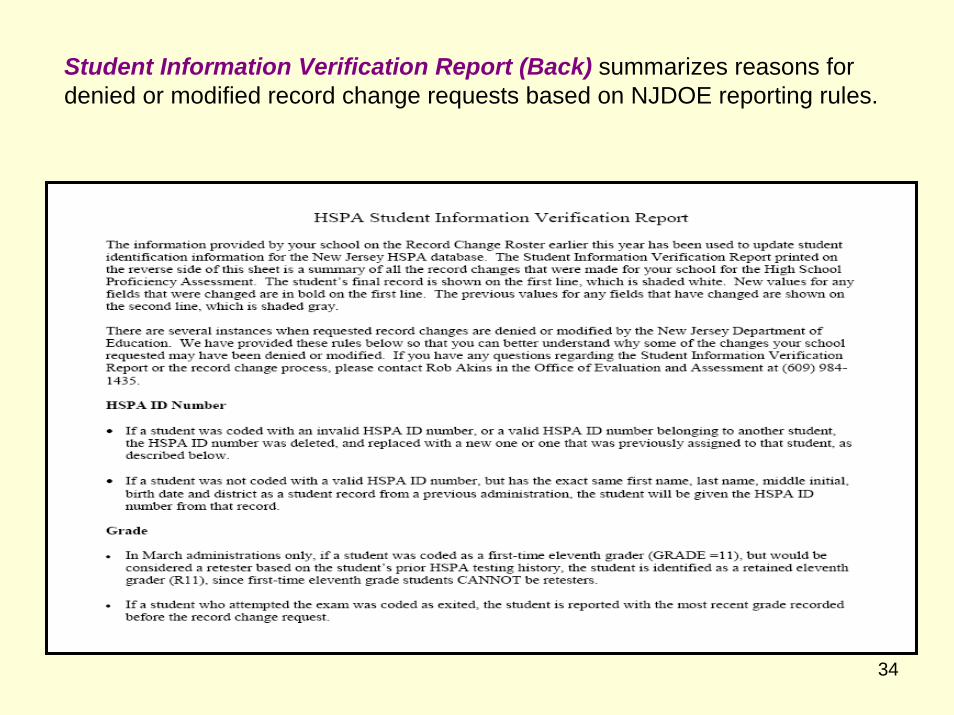
Student Information Verification Report (Back) summarizes reasons for denied or modified record change requests based on NJDOE reporting rules.
35
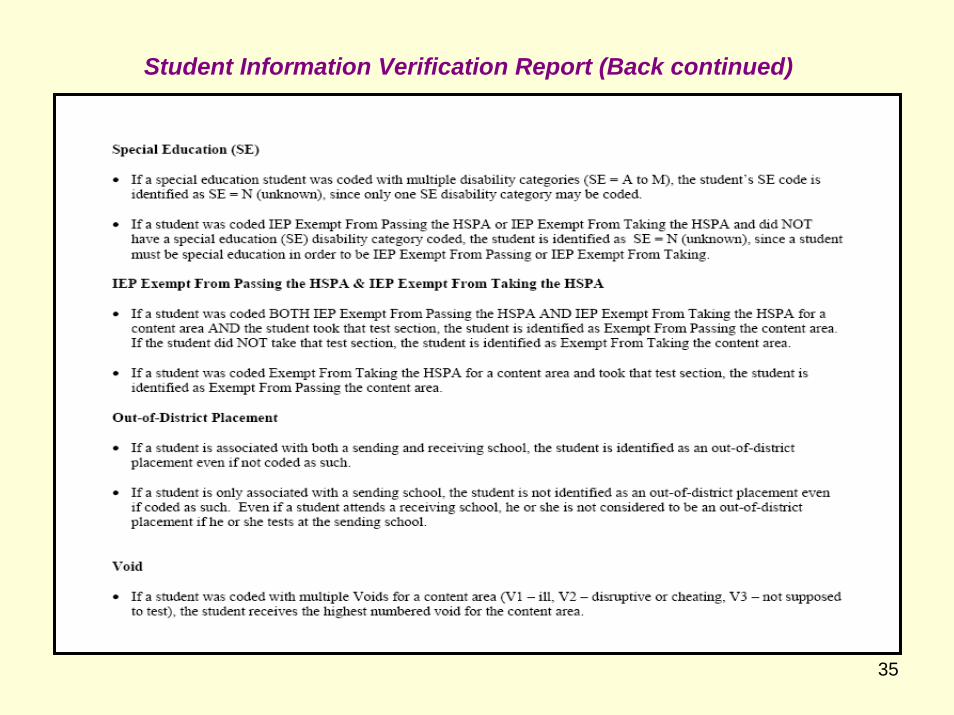
Student Information Verification Report (Back continued)
36
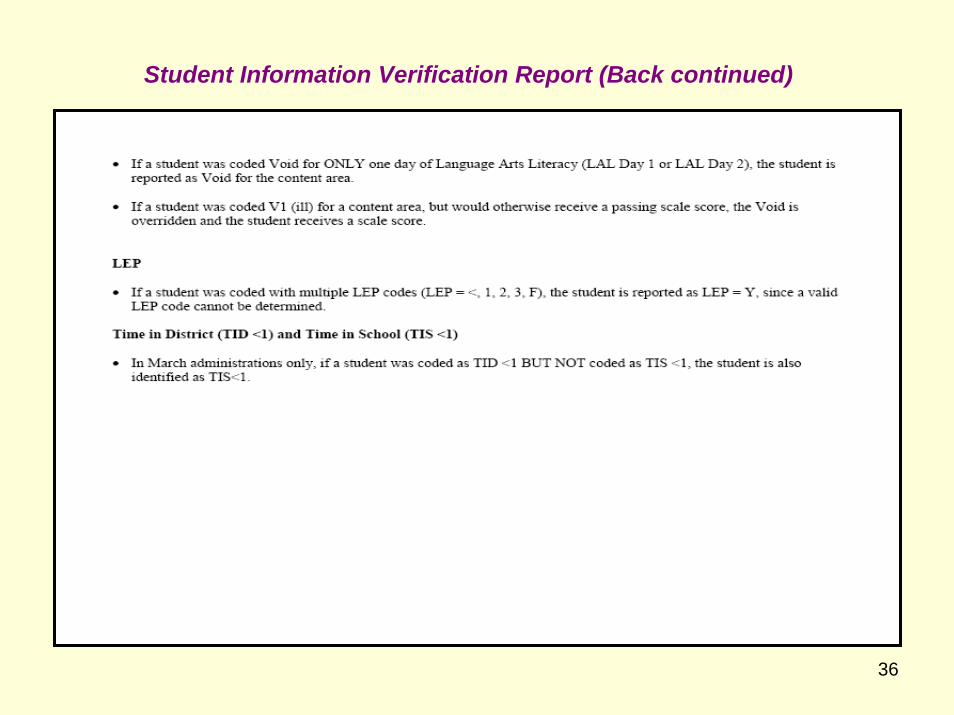
Student Information Verification Report (Back continued)
37
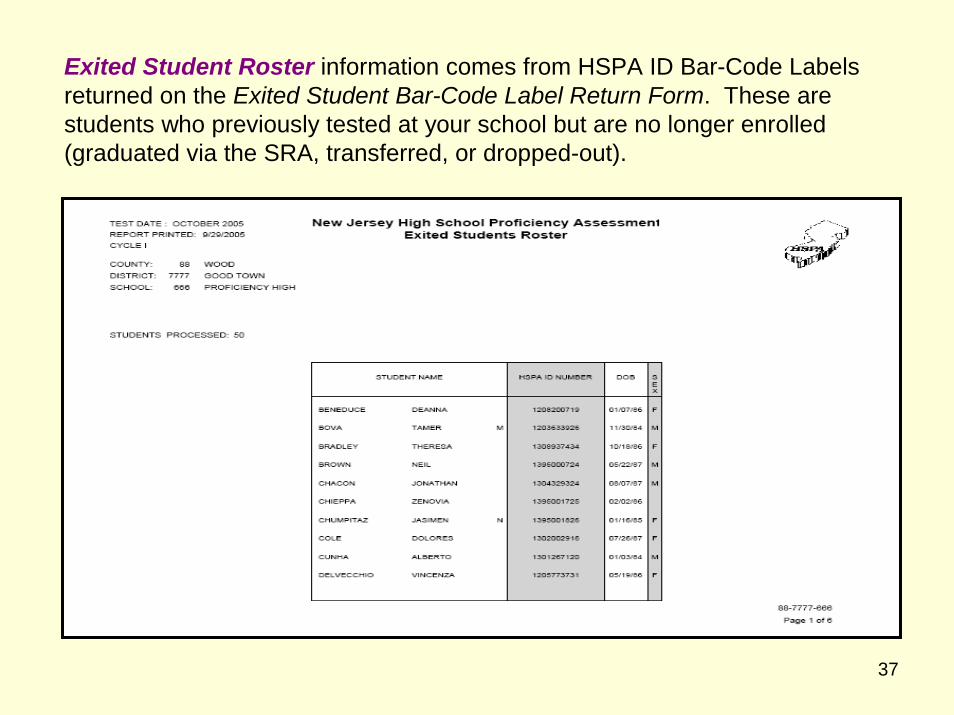
Exited Student Roster information comes from HSPA ID Bar-Code Labels returned on the Exited Student Bar-Code Label Return Form. These are students who previously tested at your school but are no longer enrolled (graduated via the SRA, transferred, or dropped-out).
38
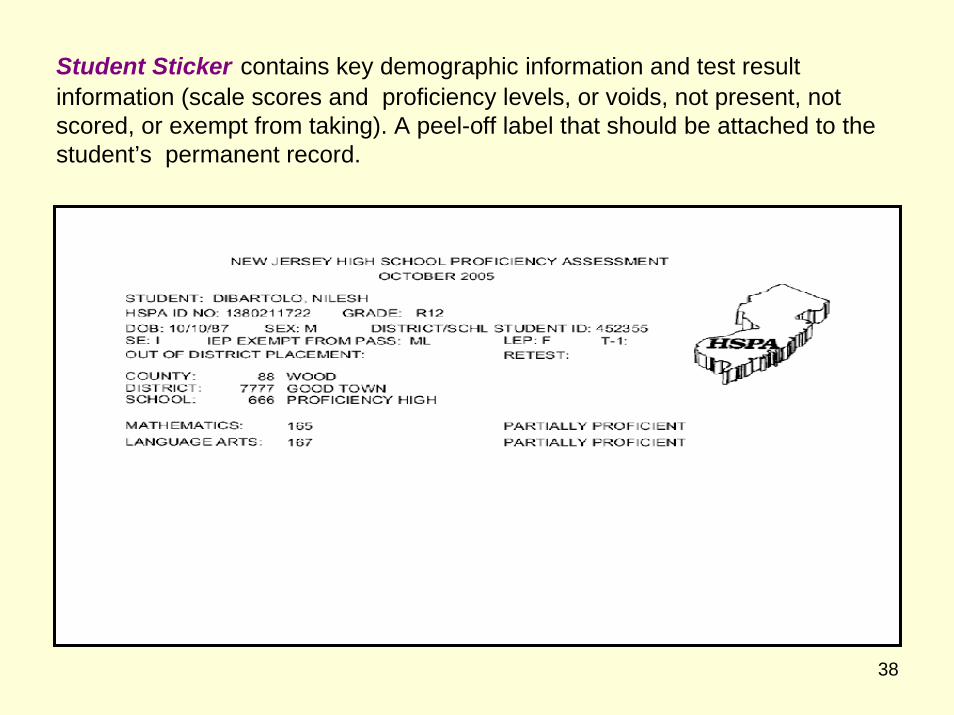
Student Sticker contains key demographic information and test result information (scale scores and proficiency levels, or voids, not present, not scored, or exempt from taking). A peel-off label that should be attached to the student’s permanent record.
39
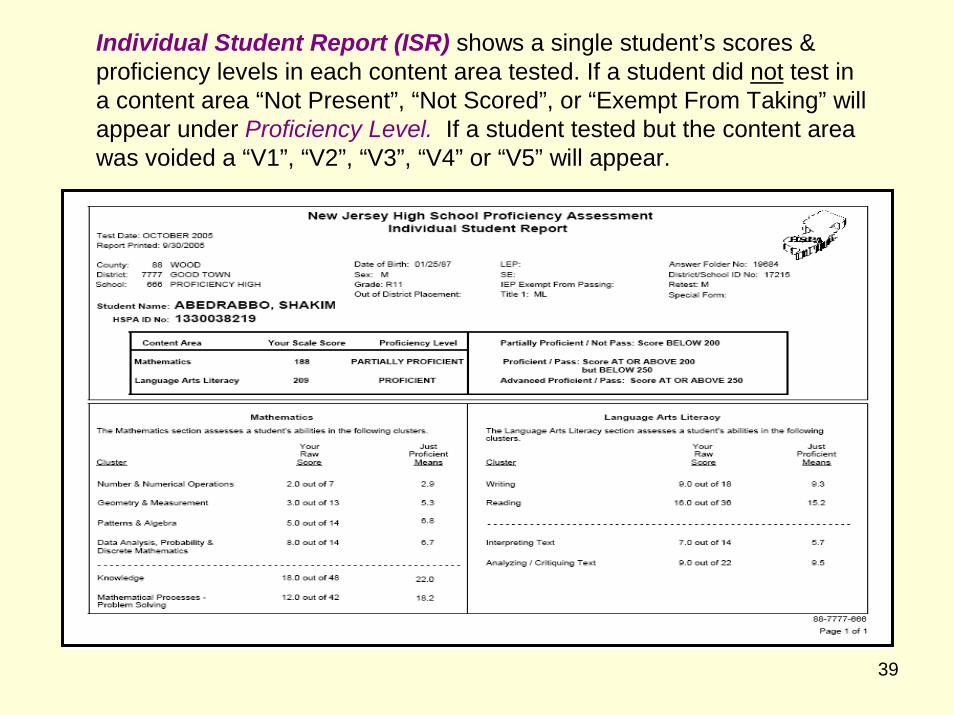
Individual Student Report (ISR) shows a single student’s scores & proficiency levels in each content area tested. If a student did not test in a content area “Not Present”, “Not Scored”, or “Exempt From Taking” will appear under Proficiency Level. If a student tested but the content area was voided a “V1”, “V2”, “V3”, “V4” or “V5” will appear.
40
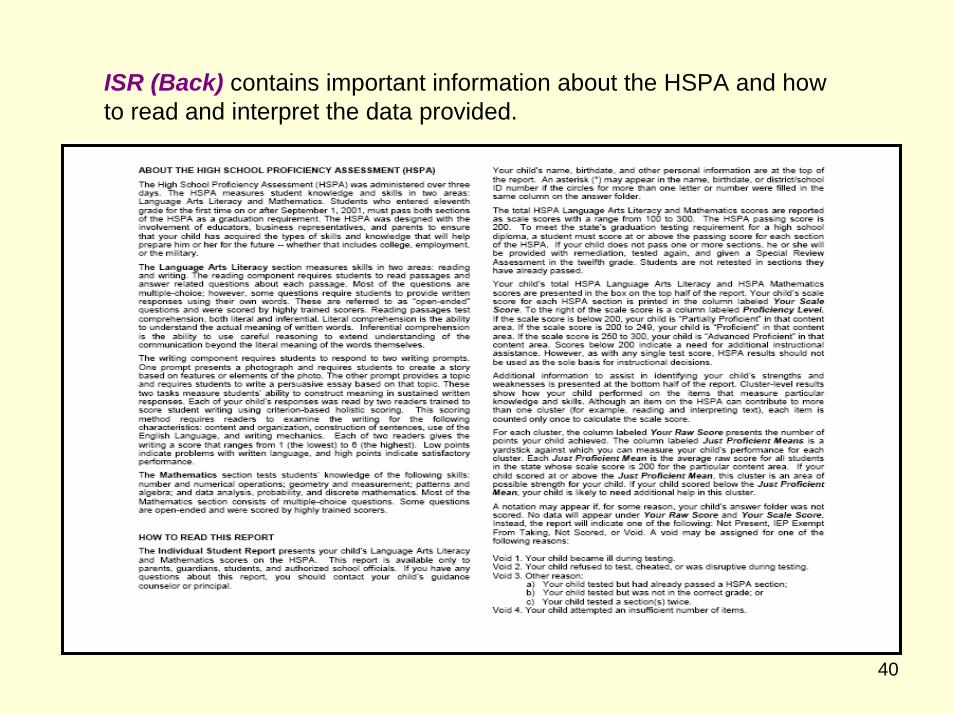
ISR (Back) contains important information about the HSPA and how to read and interpret the data provided.
41
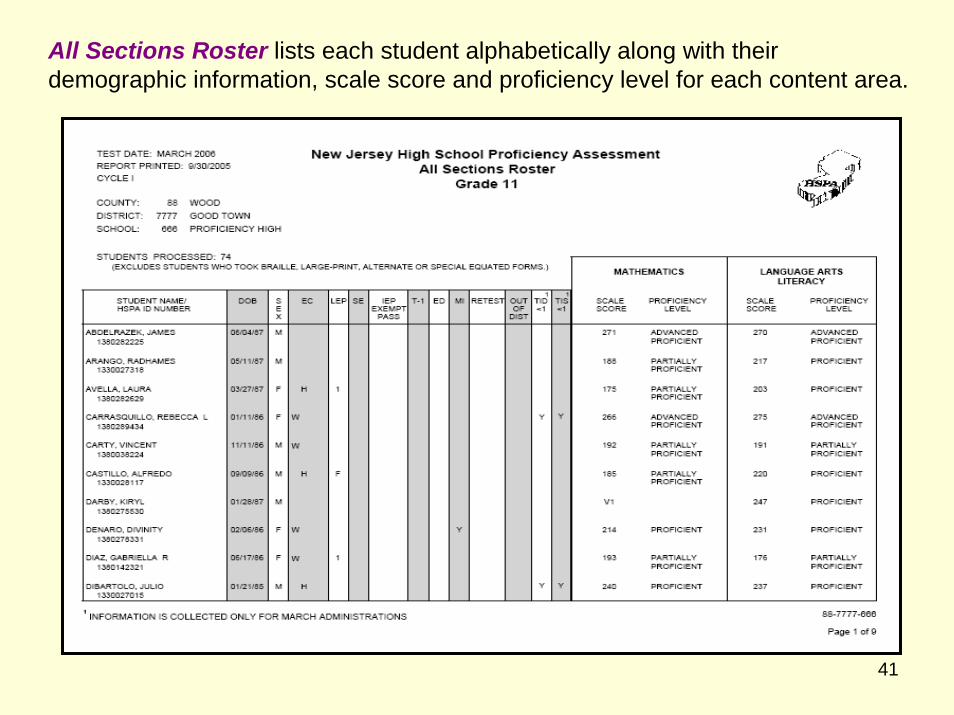
All Sections Roster lists each student alphabetically along with their demographic information, scale score and proficiency level for each content area.
42
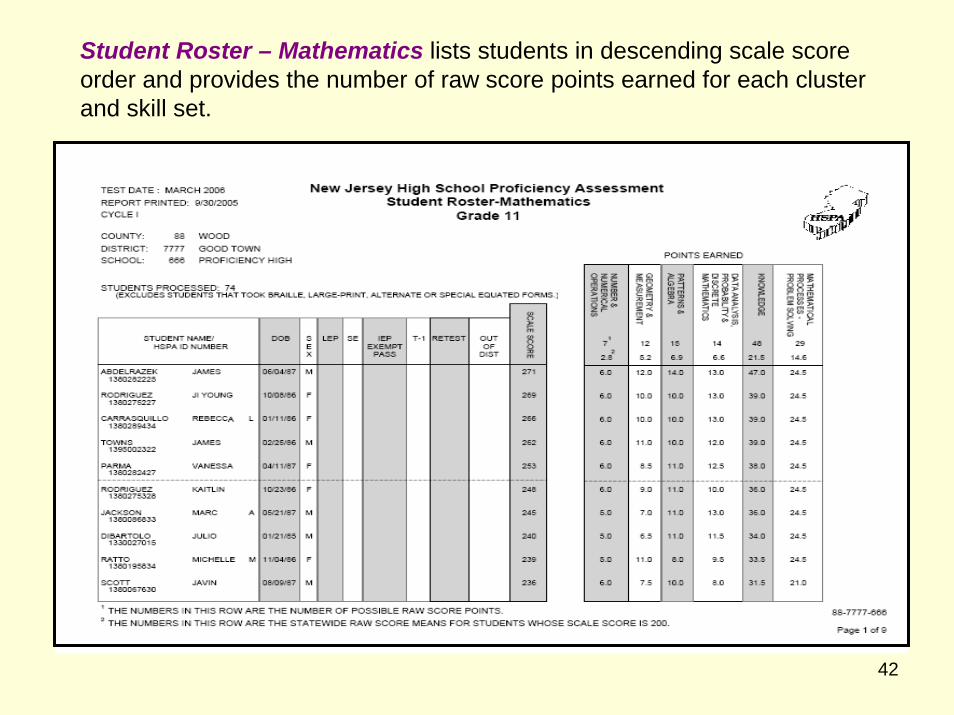
Student Roster – Mathematics lists students in descending scale score order and provides the number of raw score points earned for each cluster and skill set.
43
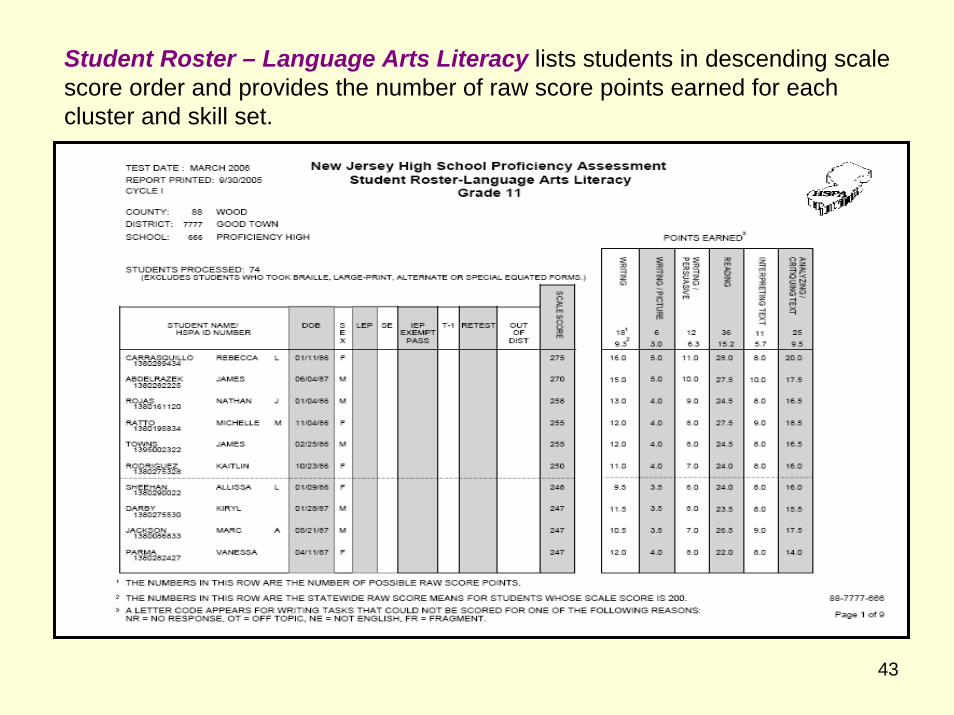
Student Roster – Language Arts Literacy lists students in descending scale score order and provides the number of raw score points earned for each cluster and skill set.
44
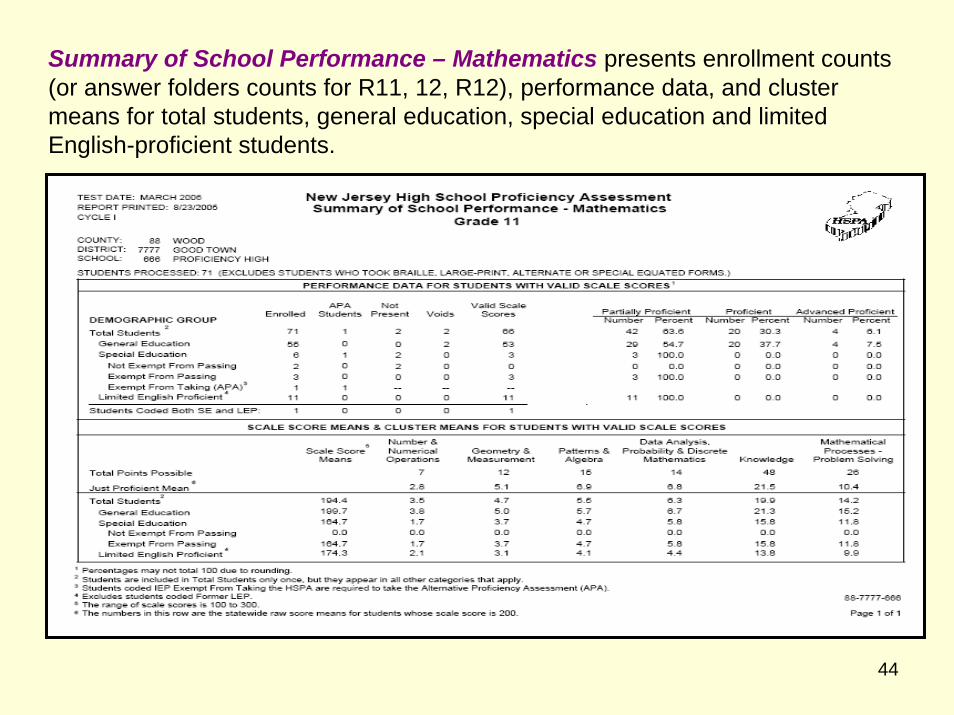
Summary of School Performance – Mathematics presents enrollment counts (or answer folders counts for R11, 12, R12), performance data, and cluster means for total students, general education, special education and limited English-proficient students.
45
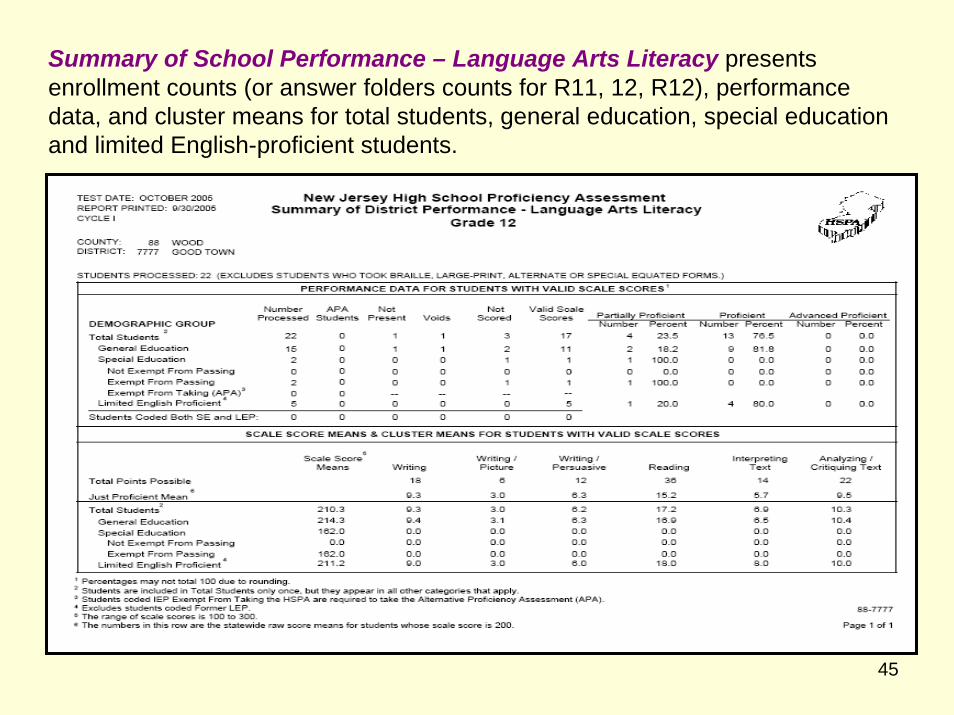
Summary of School Performance – Language Arts Literacy presents enrollment counts (or answer folders counts for R11, 12, R12), performance data, and cluster means for total students, general education, special education and limited English-proficient students.
46
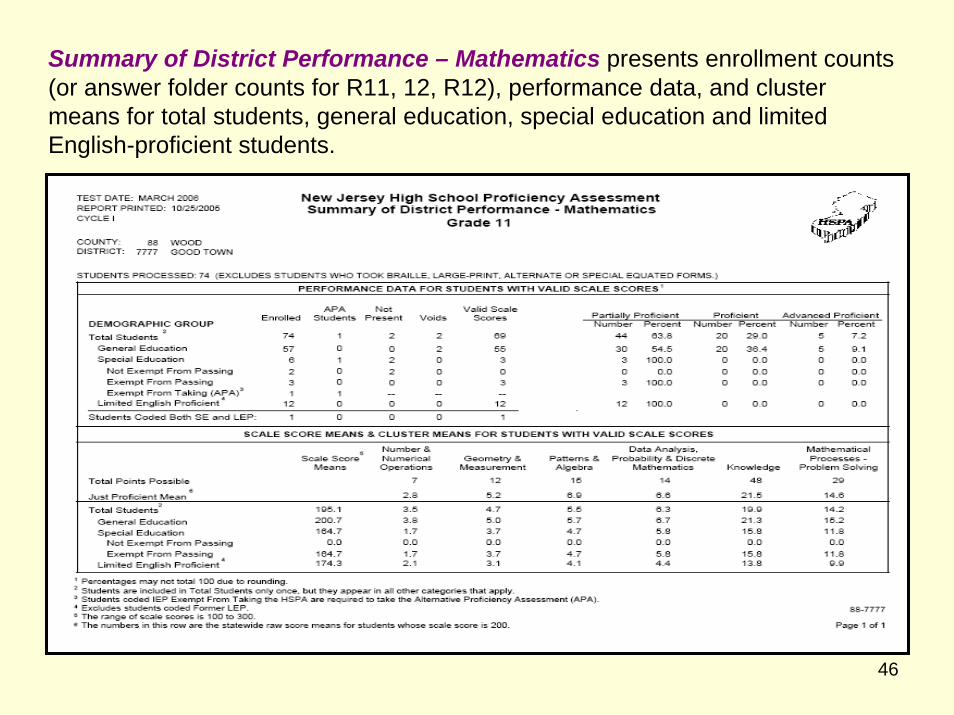
Summary of District Performance – Mathematics presents enrollment counts (or answer folder counts for R11, 12, R12), performance data, and cluster means for total students, general education, special education and limited English-proficient students.
47
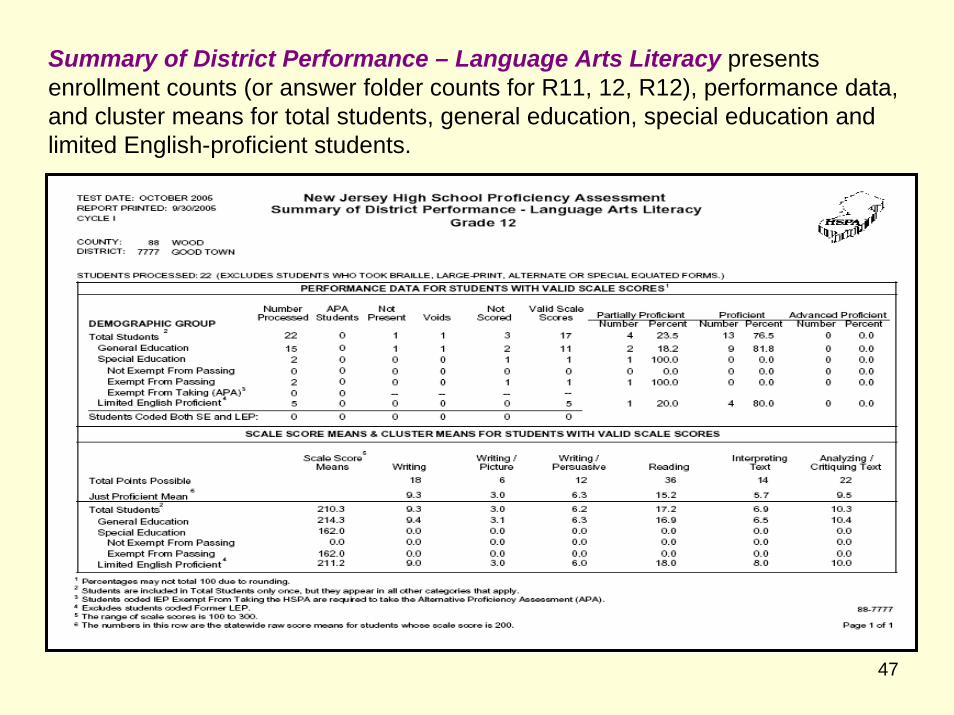
Summary of District Performance – Language Arts Literacy presents enrollment counts (or answer folder counts for R11, 12, R12), performance data, and cluster means for total students, general education, special education and limited English-proficient students.
48
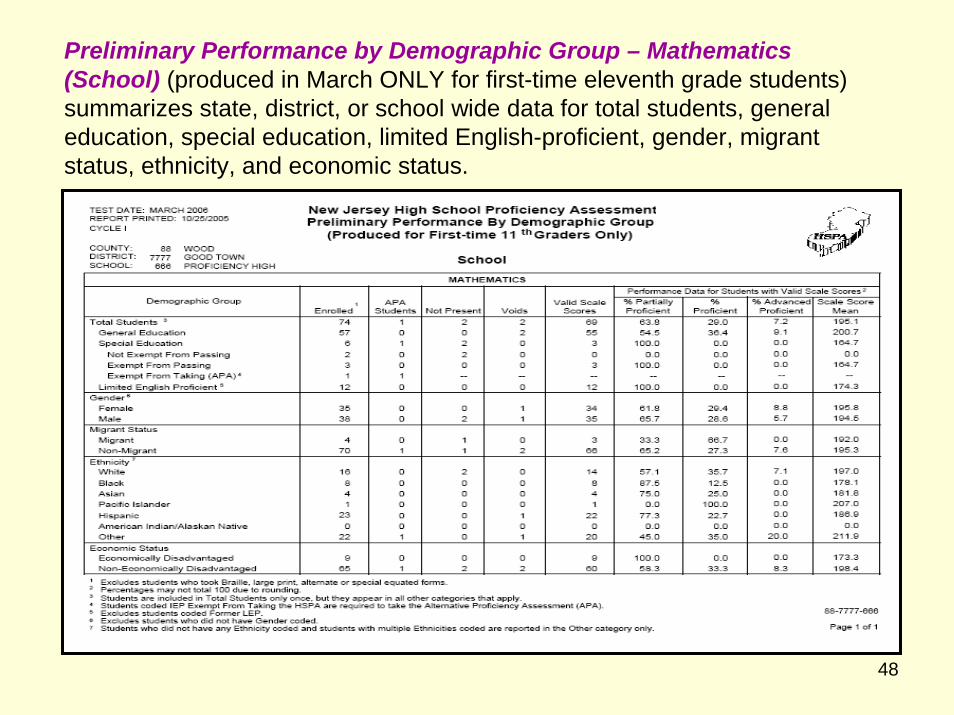
Preliminary Performance by Demographic Group – Mathematics (School) (produced in March ONLY for first-time eleventh grade students)summarizes state, district, or school wide data for total students, general education, special education, limited English-proficient, gender, migrant status, ethnicity, and economic status.
49
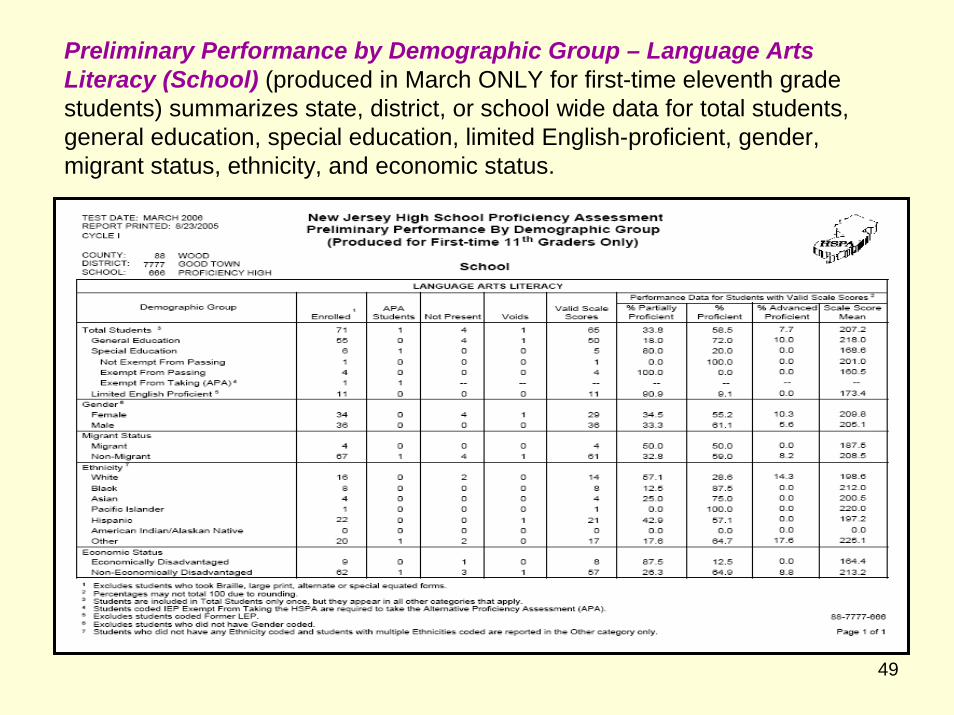
Preliminary Performance by Demographic Group – Language Arts Literacy (School) (produced in March ONLY for first-time eleventh grade students) summarizes state, district, or school wide data for total students, general education, special education, limited English-proficient, gender, migrant status, ethnicity, and economic status.
50
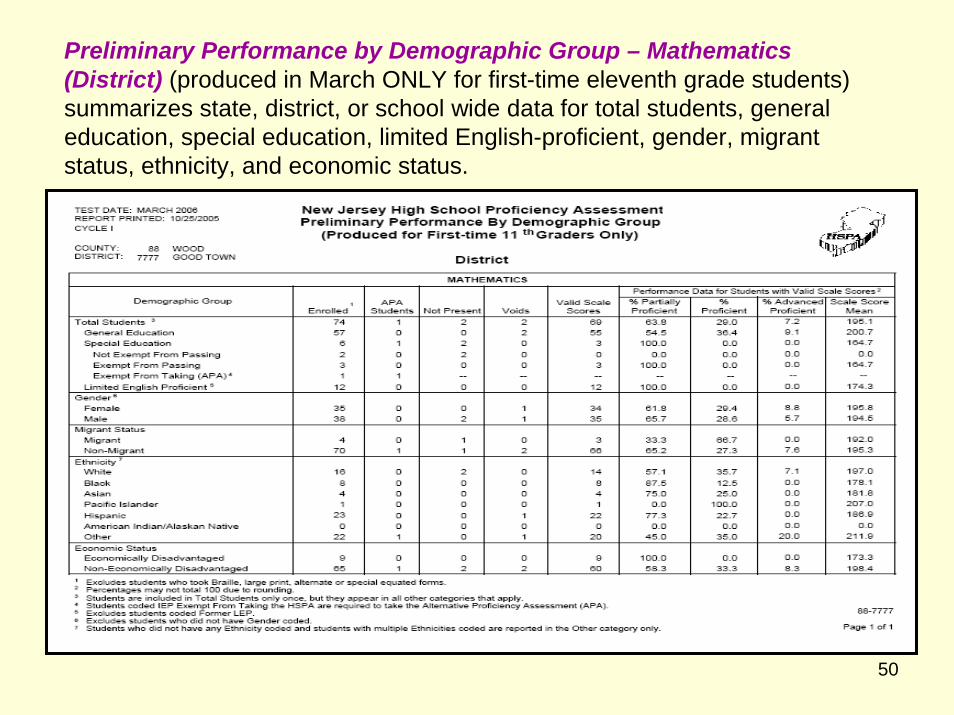
Preliminary Performance by Demographic Group – Mathematics (District) (produced in March ONLY for first-time eleventh grade students)summarizes state, district, or school wide data for total students, general education, special education, limited English-proficient, gender, migrant status, ethnicity, and economic status.
51
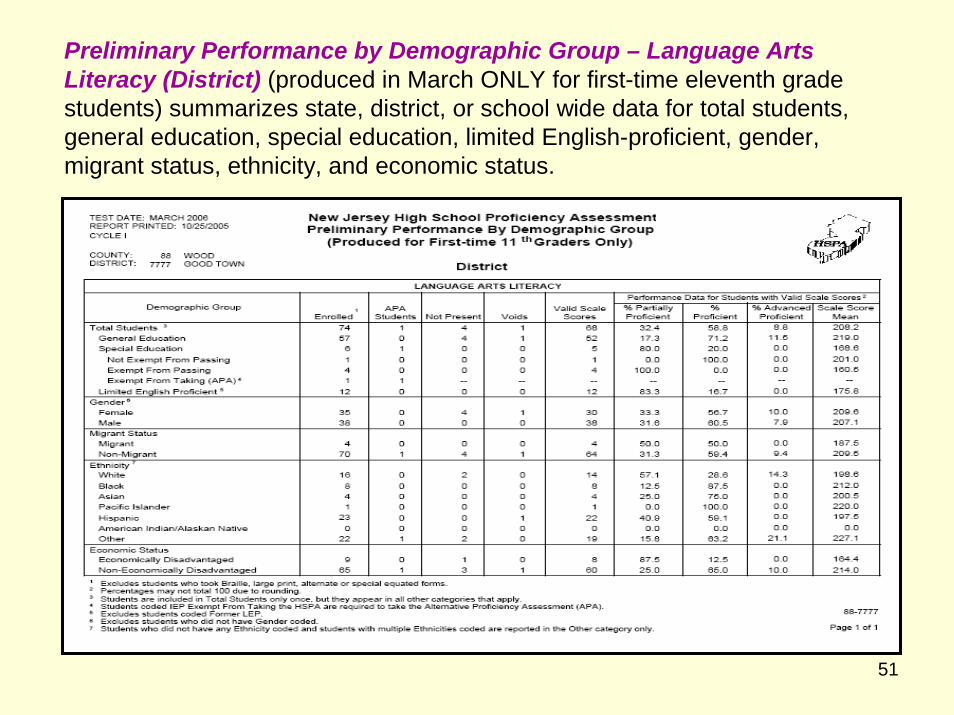
Preliminary Performance by Demographic Group – Language Arts Literacy (District) (produced in March ONLY for first-time eleventh grade students) summarizes state, district, or school wide data for total students, general education, special education, limited English-proficient, gender, migrant status, ethnicity, and economic status.
52
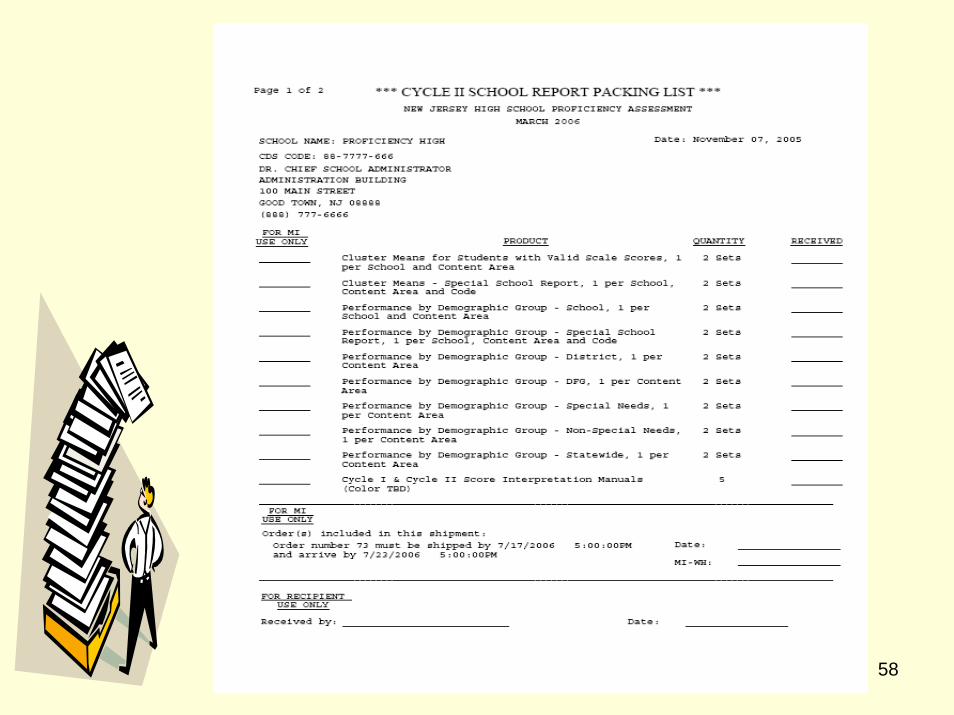
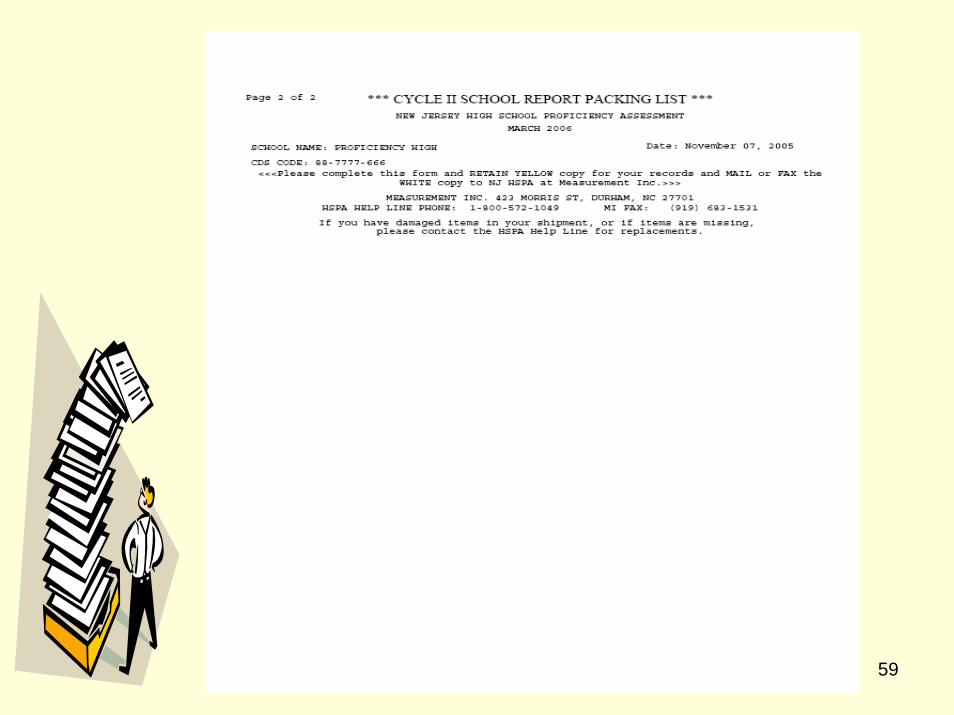
March 2006 Cycle II Reports
First-Time Eleventh Grade Students Only
Delivered July 17-21, 2006
53
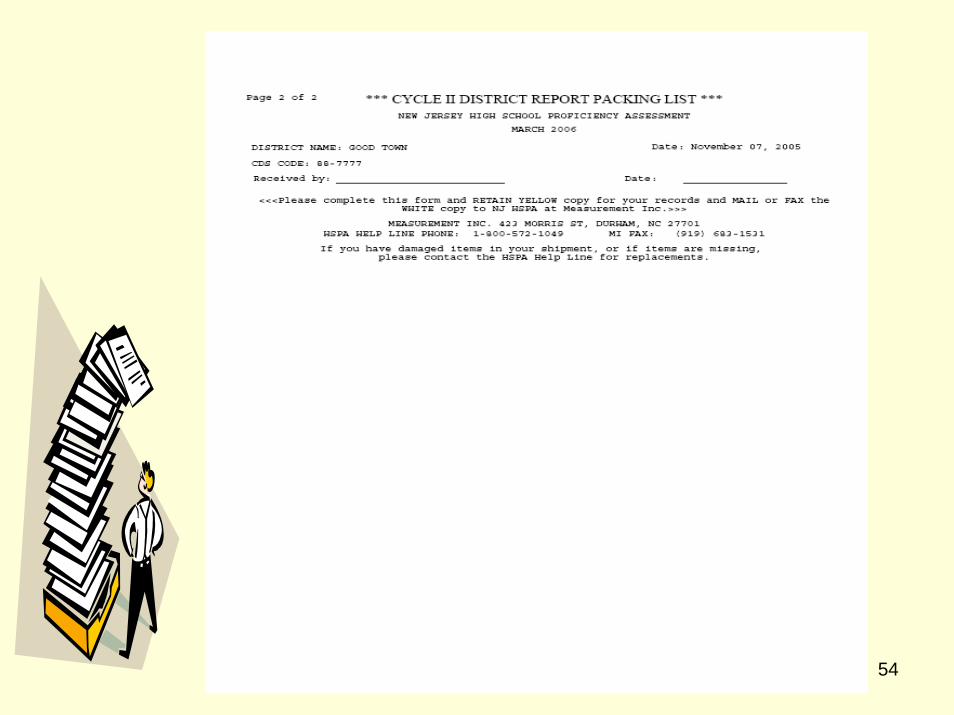
54
55
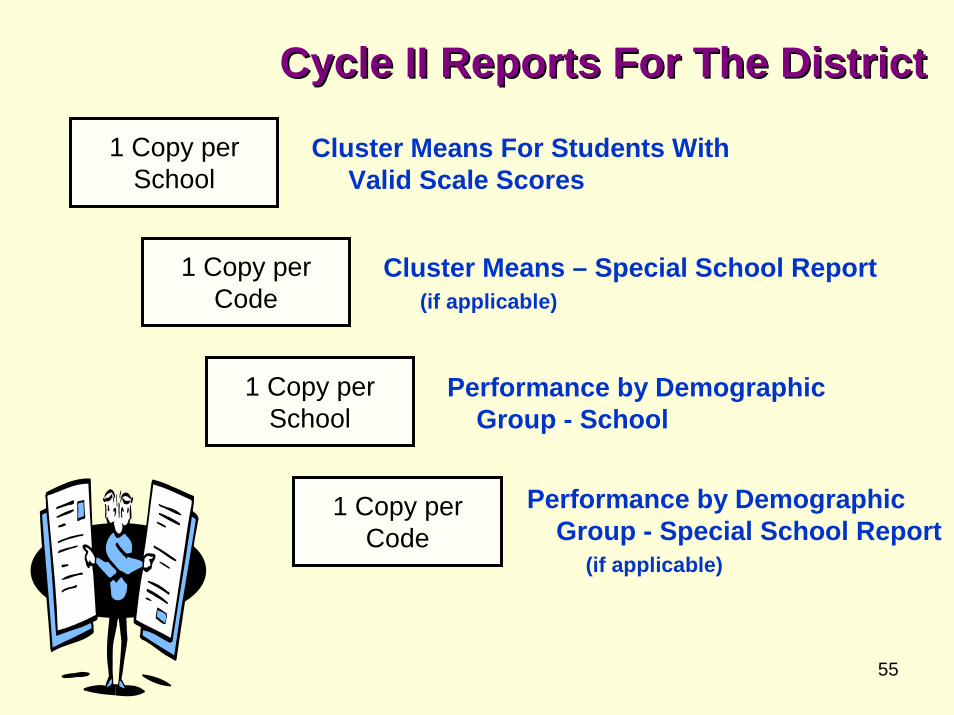
1 Copy perSchool
1 Copy perSchool
1 Copy perCode
Cluster Means For Students With Valid Scale Scores
Cluster Means – Special School Report (if applicable)
Performance by Demographic Group - School
Performance by Demographic Group - Special School Report
(if applicable)
Cycle II Reports For The DistrictCycle II Reports For The District
1 Copy perCode
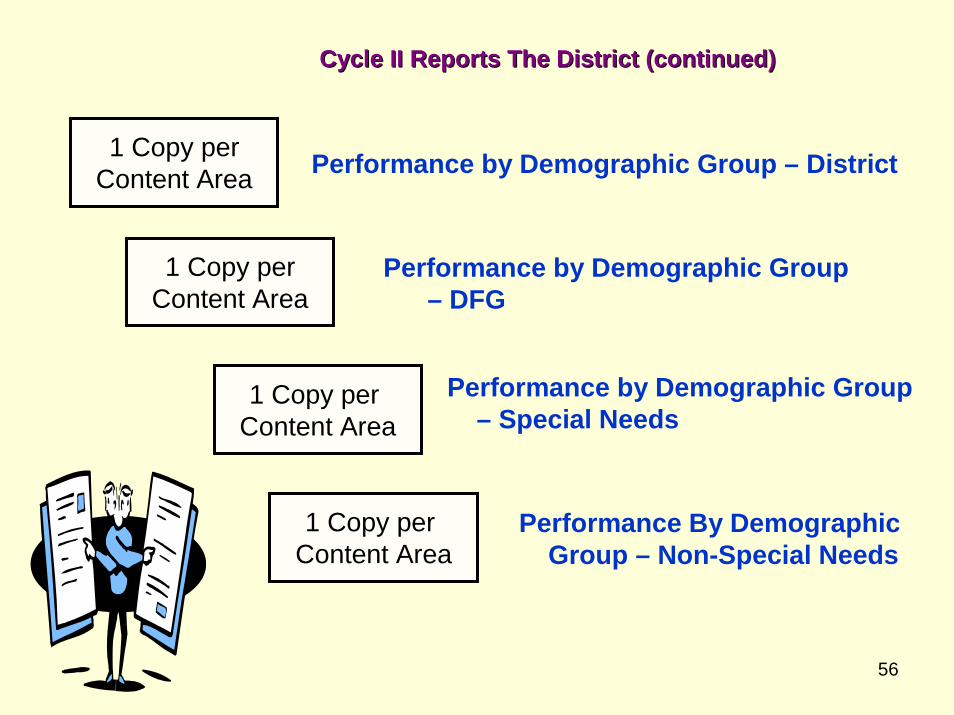
56
1 Copy perContent Area
1 Copy per Content Area
Performance by Demographic Group – District
Performance by Demographic Group – DFG
Performance by Demographic Group – Special Needs
Performance By Demographic Group – Non-Special Needs
Cycle II Reports The District (continued)Cycle II Reports The District (continued)
1 Copy perContent Area
1 Copy per Content Area
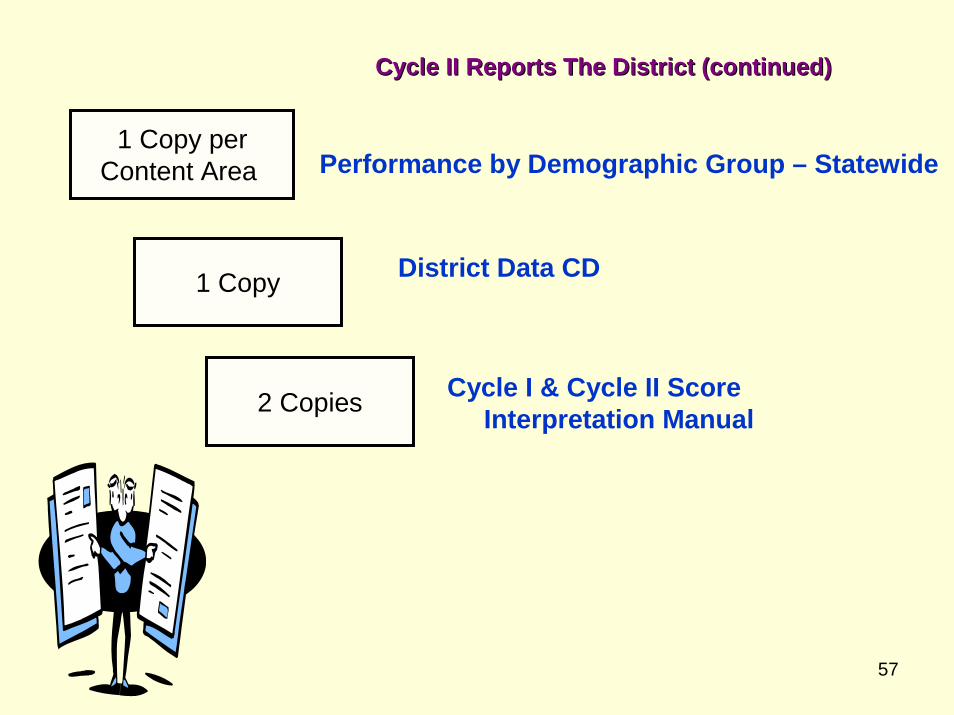
57
1 Copy perContent Area
1 Copy
2 Copies
Performance by Demographic Group – Statewide
District Data CD
Cycle I & Cycle II Score Interpretation Manual
Cycle II Reports The District (continued)Cycle II Reports The District (continued)
58
59
60
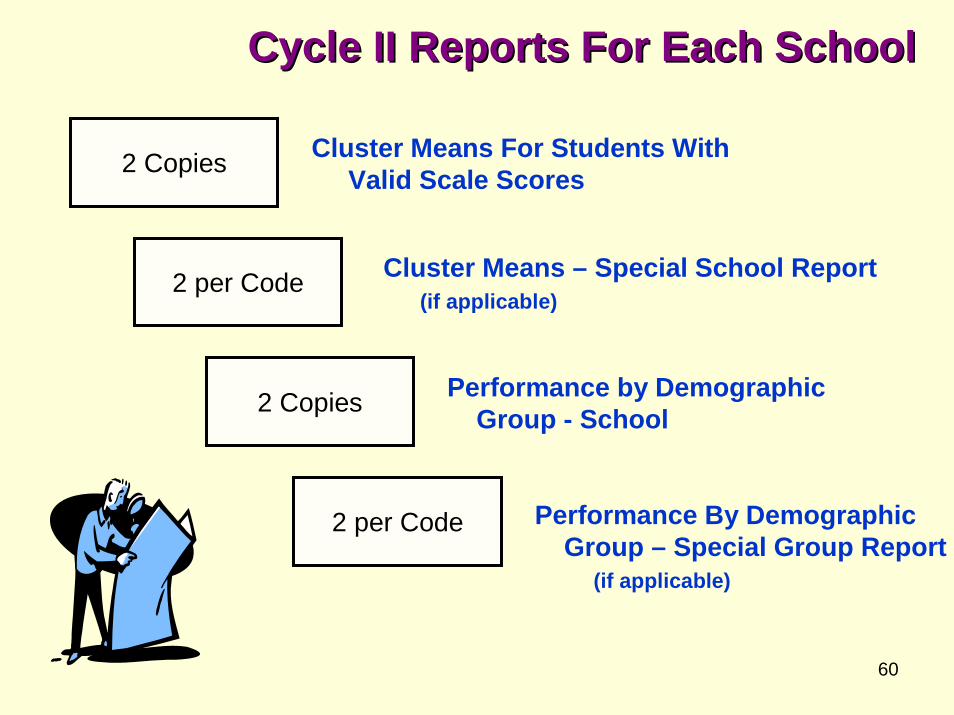
2 Copies
2 per Code
2 Copies
2 per Code
Cluster Means For Students With Valid Scale Scores
Cluster Means – Special School Report (if applicable)
Performance by Demographic Group - School
Performance By Demographic Group – Special Group Report
(if applicable)
Cycle II Reports For Each SchoolCycle II Reports For Each School
61
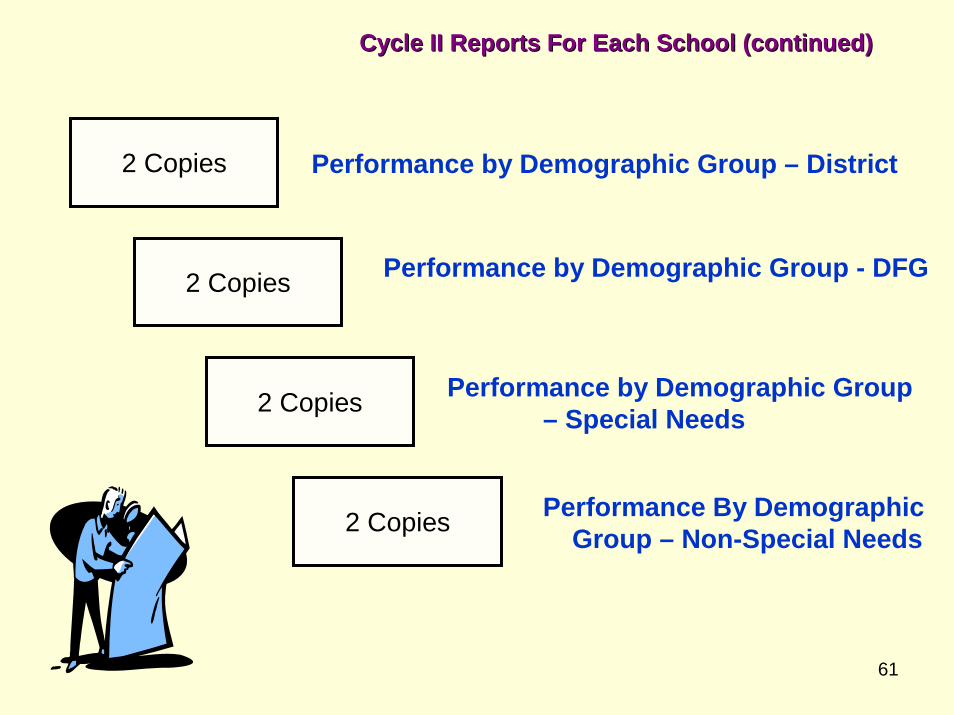
2 Copies
2 Copies
2 Copies
2 Copies
Performance by Demographic Group – District
Performance by Demographic Group - DFG
Performance by Demographic Group – Special Needs
Performance By Demographic Group – Non-Special Needs
Cycle II Reports For Each School (continued)Cycle II Reports For Each School (continued)
62
2 Per Code Performance by Demographic Group – Statewide
Cycle I & Cycle II Score Interpretation Manual
5 Copies
Cycle II Reports For Each School (continued)Cycle II Reports For Each School (continued)
63
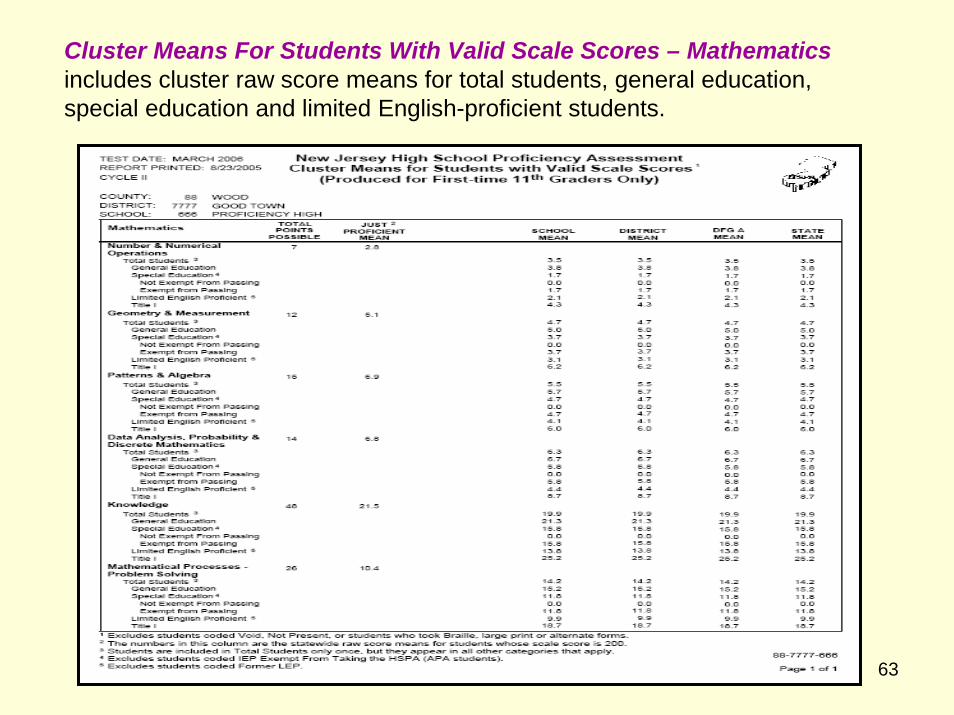
Cluster Means For Students With Valid Scale Scores – Mathematics includes cluster raw score means for total students, general education, special education and limited English-proficient students.
64
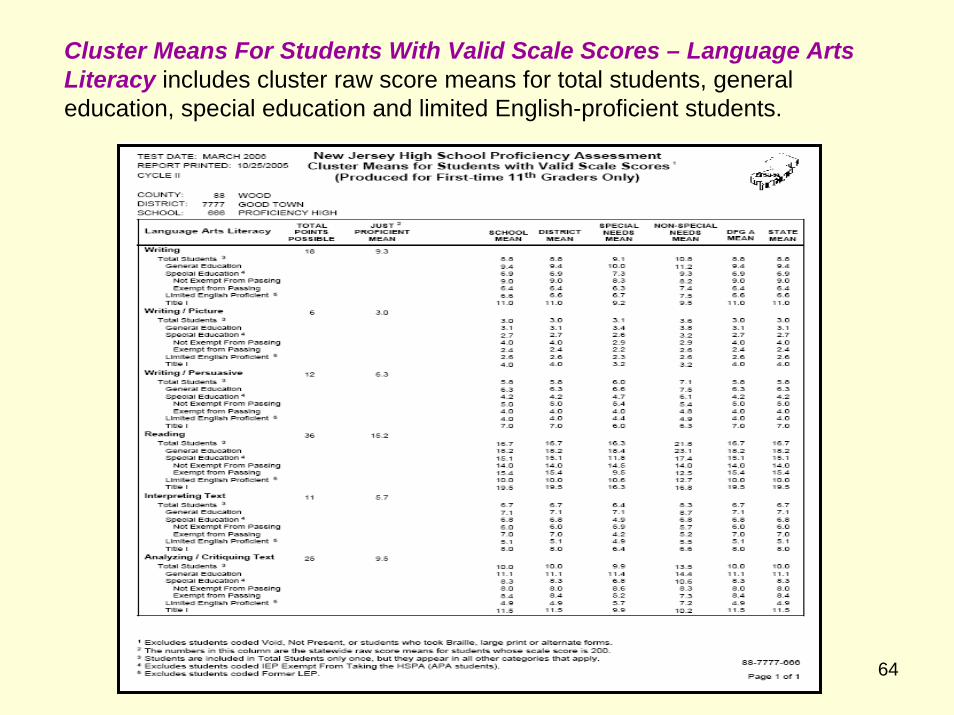
Cluster Means For Students With Valid Scale Scores – Language Arts Literacy includes cluster raw score means for total students, general education, special education and limited English-proficient students.
65
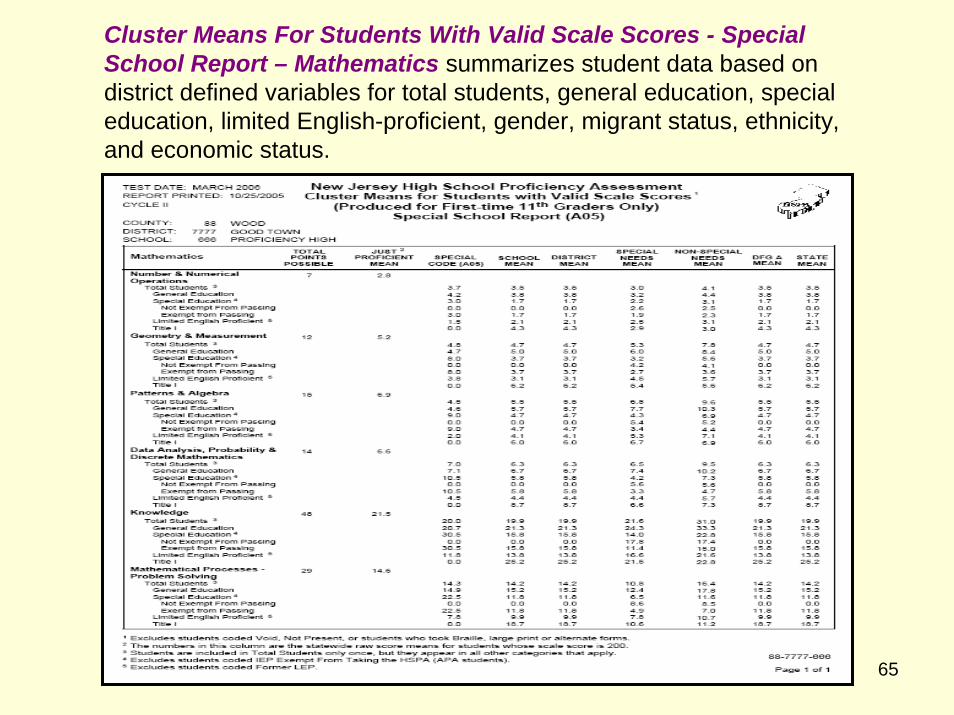
Cluster Means For Students With Valid Scale Scores - Special School Report – Mathematics summarizes student data based on district defined variables for total students, general education, special education, limited English-proficient, gender, migrant status, ethnicity, and economic status.
66
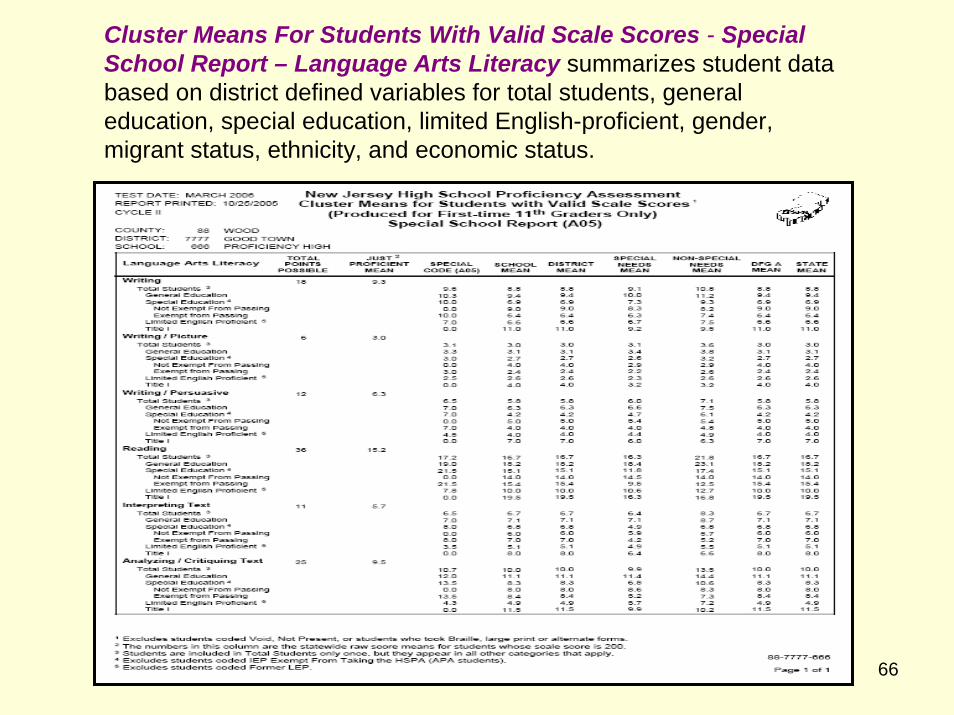
Cluster Means For Students With Valid Scale Scores - Special School Report – Language Arts Literacy summarizes student data based on district defined variables for total students, general education, special education, limited English-proficient, gender, migrant status, ethnicity, and economic status.
67
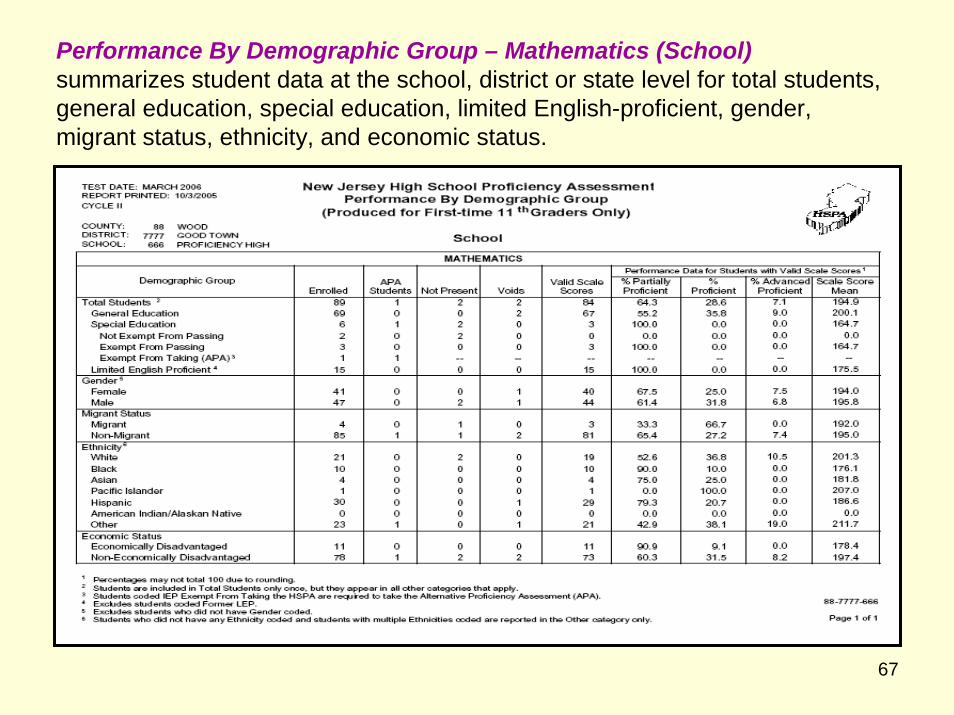
Performance By Demographic Group – Mathematics (School) summarizes student data at the school, district or state level for total students, general education, special education, limited English-proficient, gender, migrant status, ethnicity, and economic status.
68
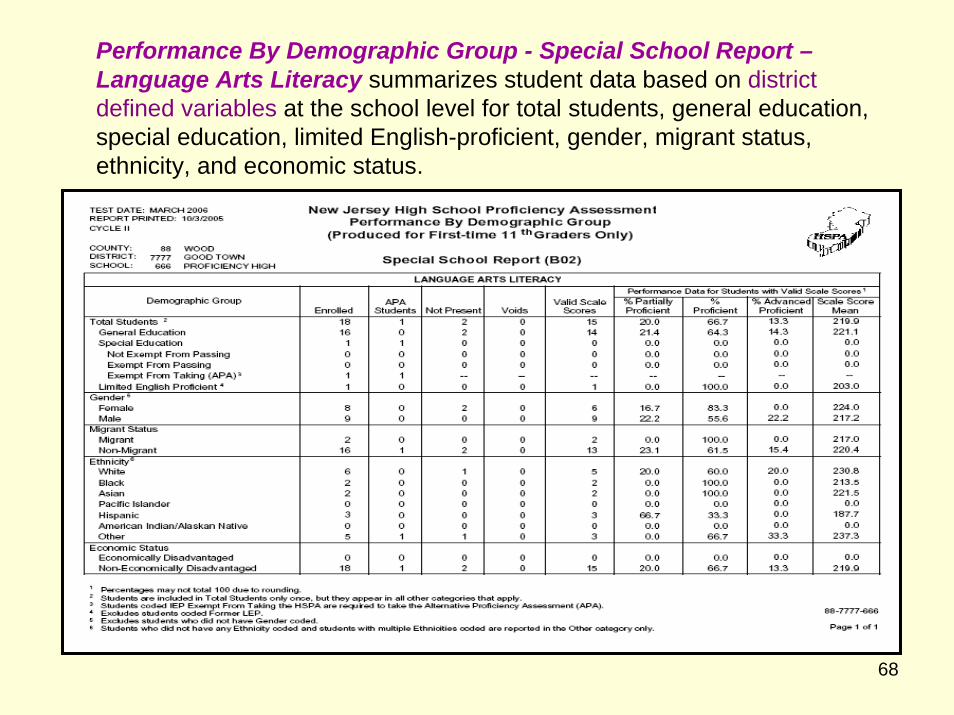
Performance By Demographic Group - Special School Report –Language Arts Literacy summarizes student data based on district defined variables at the school level for total students, general education, special education, limited English-proficient, gender, migrant status, ethnicity, and economic status.
69
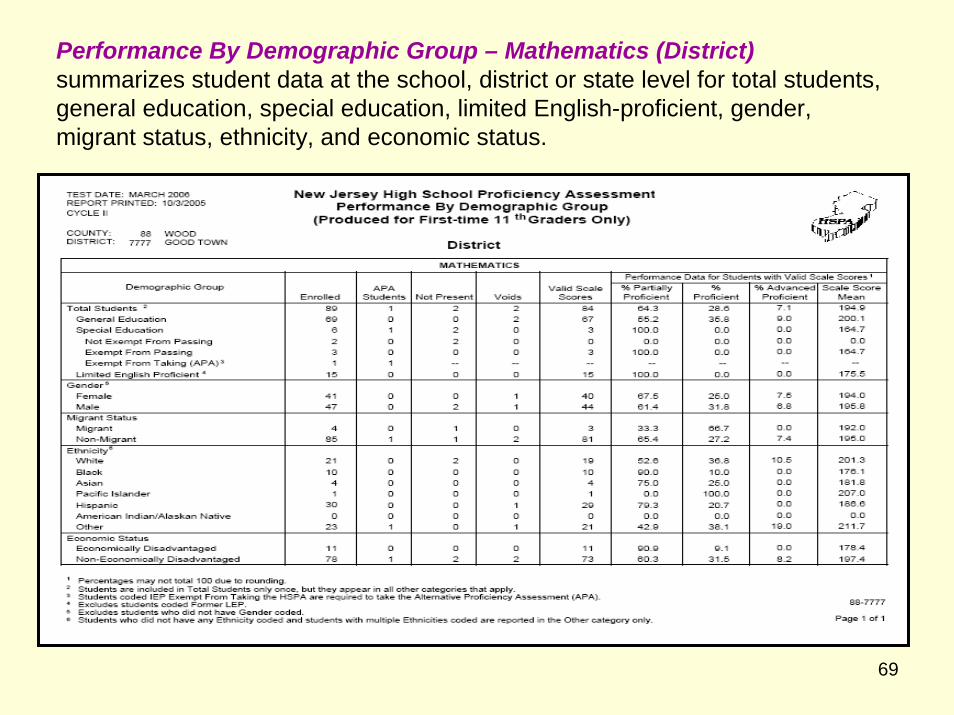
Performance By Demographic Group – Mathematics (District) summarizes student data at the school, district or state level for total students, general education, special education, limited English-proficient, gender, migrant status, ethnicity, and economic status.
70
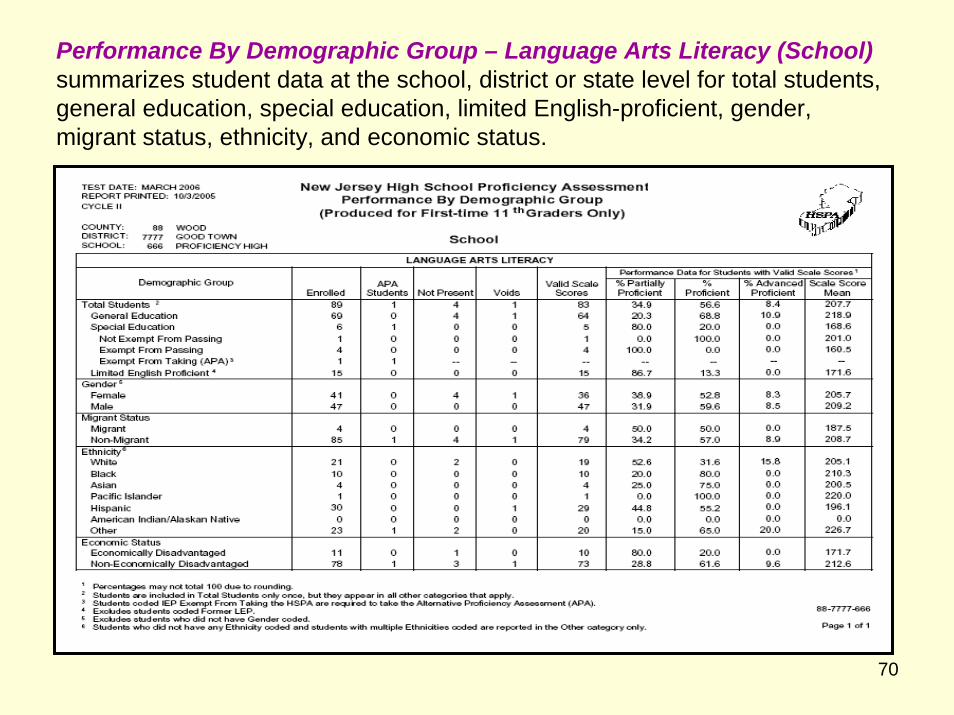
Performance By Demographic Group – Language Arts Literacy (School)summarizes student data at the school, district or state level for total students, general education, special education, limited English-proficient, gender, migrant status, ethnicity, and economic status.
71
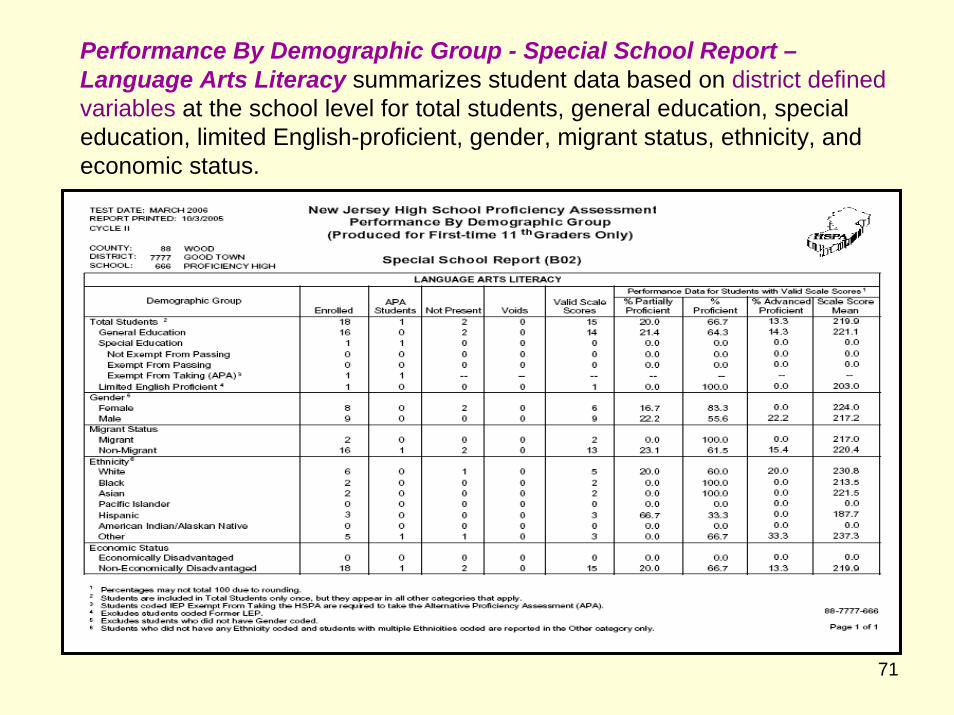
Performance By Demographic Group - Special School Report –Language Arts Literacy summarizes student data based on district defined variables at the school level for total students, general education, special education, limited English-proficient, gender, migrant status, ethnicity, and economic status.
72
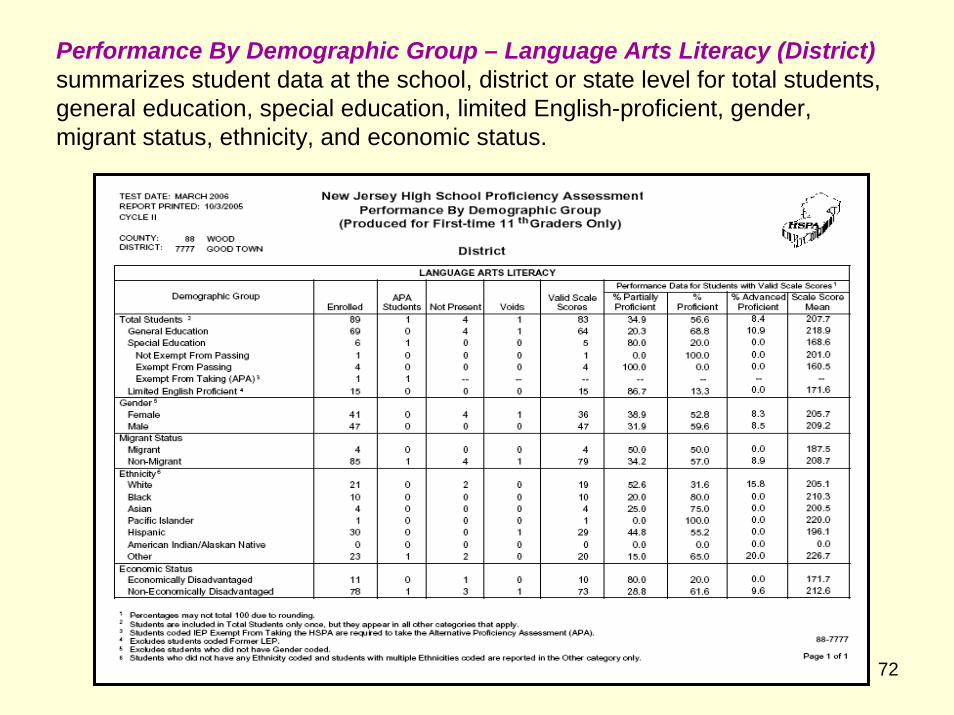
Performance By Demographic Group – Language Arts Literacy (District)summarizes student data at the school, district or state level for total students, general education, special education, limited English-proficient, gender, migrant status, ethnicity, and economic status.
73
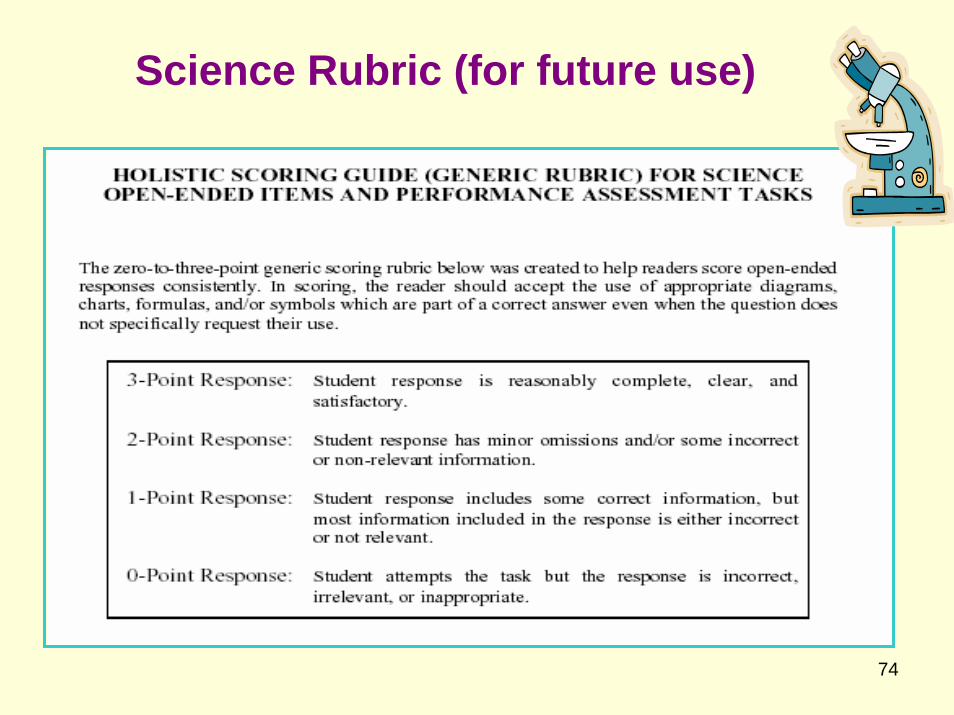
HSPA Scoring RubricsThe following pages show generic rubrics used as guides to develop specific scoring rubrics for each of the Open-Ended (OE) items that appear in each content area.
The generic rubric helps ensure that students are scored in the same way for the same demonstration of knowledge and skills, regardless of the test question.
More information on OE items and related scoring is provided in the Directory of Test Specifications for each content area.
74
Science Rubric (for future use)
75
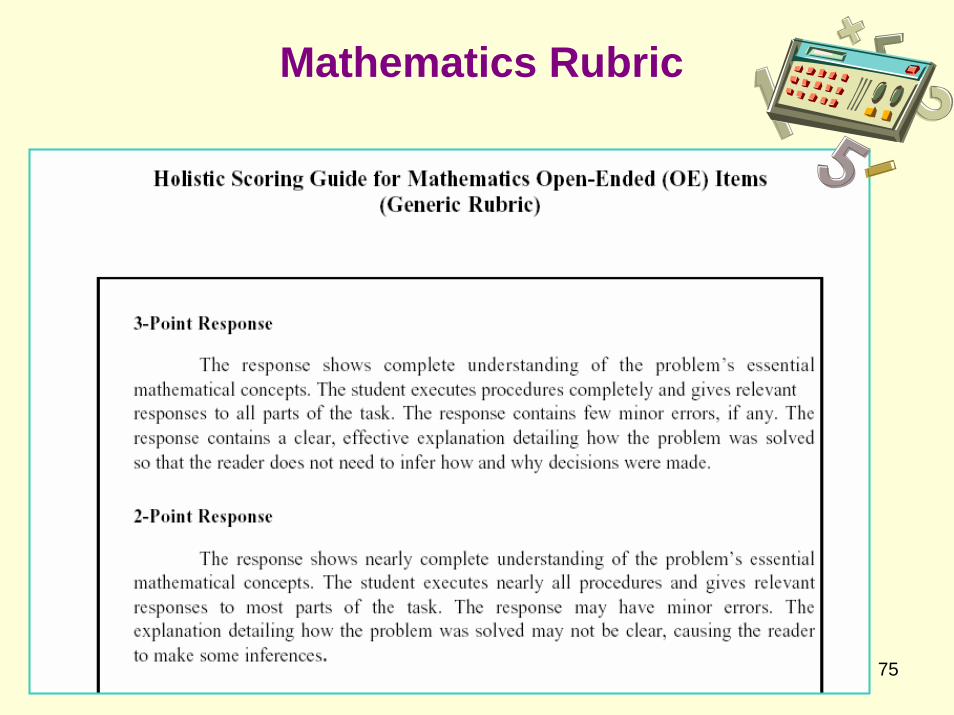
Mathematics Rubric
76
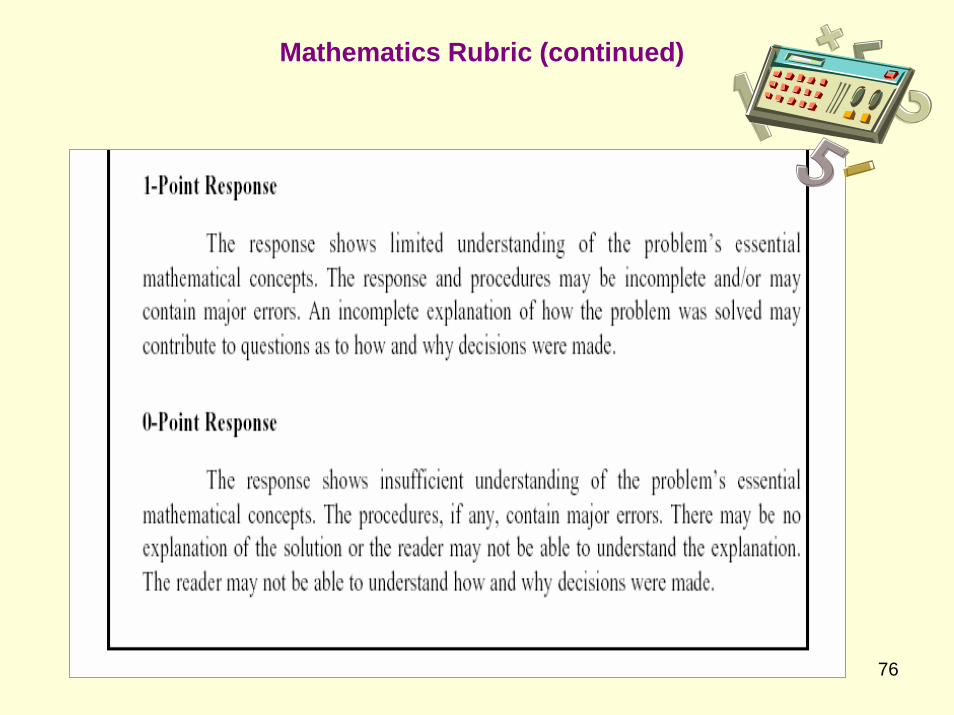
Mathematics Rubric (continued)
77
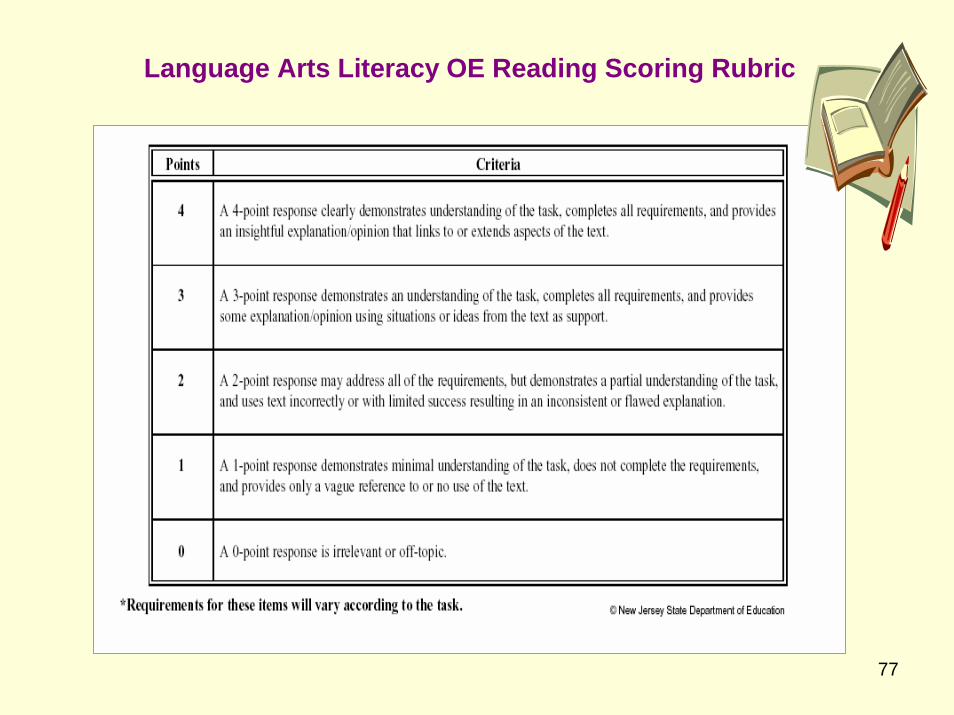
Language Arts Literacy OE Reading Scoring Rubric
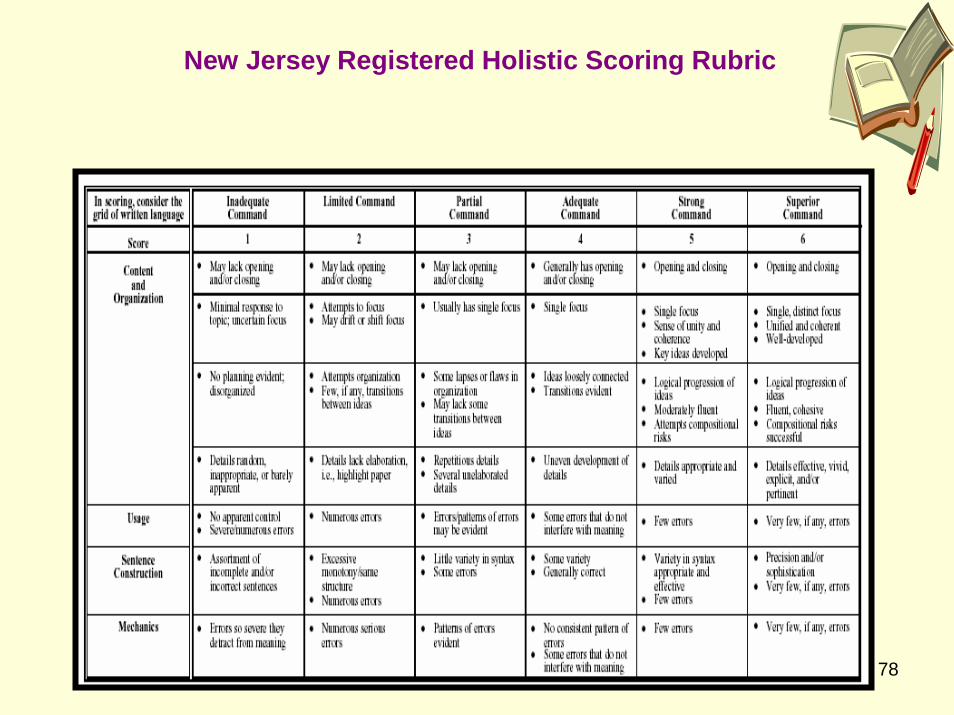
78
New Jersey Registered Holistic Scoring Rubric
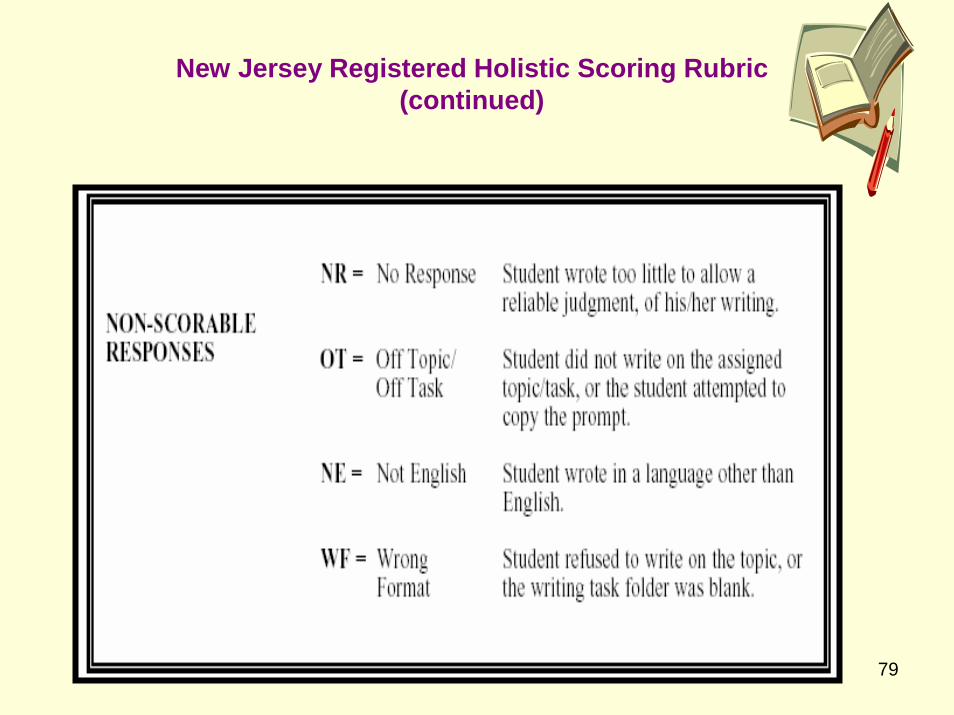
79
New Jersey Registered Holistic Scoring Rubric(continued)
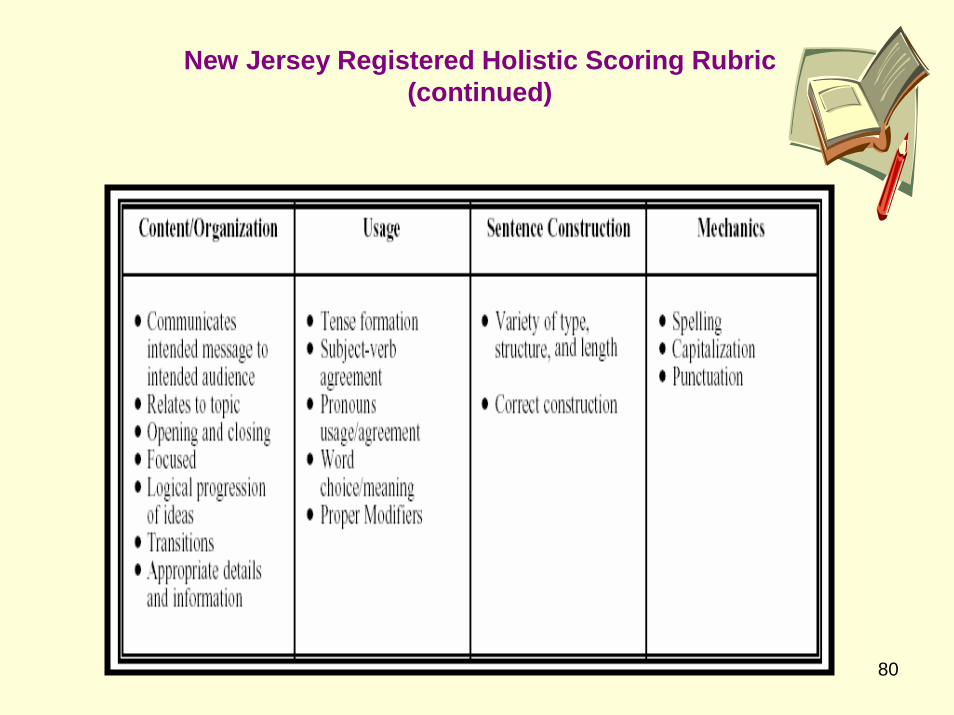
80
New Jersey Registered Holistic Scoring Rubric(continued)
81
• NJDOE policy mandates an automatic rescoring process for the HSPA.
• Any student with a scale score ranging from approximately 3-5 scale score points below 200(passing) will be automatically rescored.
• Cycle I Score Reports will reflect any automatic rescores that result in a student receiving a higher score.
• This allows possible scoring anomalies to be identified and corrected and affords students the benefit of another examination and additional consideration of their open-ended constructed responses.
Automatic Rescoring Process
82
Frequently Asked Questions
Q. Which office should we contact if we have questions regarding Adequate Yearly Progress (AYP)?
A. Please contact the Office of Title I Program Planning at (609) 943-4283.
83
Frequently Asked Questions (cont.)
Q. When a district reports disaggregated HSPA results by gender, ethnicity, migrant status, etc., should the district take into account the number of tested students in a subgroup?
A. Yes, according to the NJ DOE policy, when the number of tested students in a subgroup is less than 11, no disaggregated data should be reported to the public due to statistical instability & student confidentiality.
84
Frequently Asked Questions (cont.)
Q. In the past years, district coordinators were required to attend a live score interpretation training session. This year, the live training is no longer required; why did the NJDOE change the training format?
A. In 2003, NJDOE provided online GEPA training for the first time; it was very favorably received by the districts and has been expanded to the HSPA. You can find all the score interpretation information and materials on MI’s website at:
http://www.measinc.com/nj
85
Frequently Asked Questions (cont.)
Q. How should we best explain year-to-year changes in test results to the public?
A. It is important to carefully examine percentages at each Proficiency Leveland the Scale Score Means for several years in order to do a trend analysis. Due to cohort differences in the tested population, slight fluctuations from year-to-year will occur. However, a downward trend for several years may indicate a need for improvement.
86
Frequently Asked Questions (cont.)
Q. How do I request a rescore for a student who did not fall in the automatic rescore range?
A. There is no “rescore request” process any more. Only scores determined by the automatic process will be rescored. If the student’s scale score is not within one raw score point from passing (just below the Proficient Cut Score), the content area will not rescored.
87
Frequently Asked Questions (cont.)
Q. Why should I never compare Just Proficient(Cluster) Means or Raw Scores from year-to-year?
A. To establish comparability of the HSPA results from year-to-year, a statistical approach call“equating” is used. Due to the small number of test items in each cluster and the varying number of possible raw score points, the Just Proficient (Cluster) Means and the Raw Scores vary from one year to another. Equating is only done at the Scale Score level so that the Cut Scores are always 200 and 250. Therefore, it is statistically unsound to compare Just Proficient (Cluster) Means and Raw Scores across years.
88
PLEASE NOTE:
• The opportunity to make record changes for the October 2005 HSPA has passed.
• Record changes for the March 2006 mustbe made April 3 to May 3, 2006.
89
• We hope the online training is helpful in your interpretation and use of the October 2005 & March 2006 HSPA Results
• If you have any suggestions about how to improve the training session, please contact Rob Akins, HSPA Measurement Specialist, at (609)984-1435.