Embed Size (px)
Citation preview
21.2 World Climates
Reading StrategyOutlining Copy and continue the outline foreach climate type discussed in this section.Include temperature and precipitationinformation for each climate type, as well as atleast one location with that climate type.
Key ConceptsWhat is the Köppen climateclassification system?
What are humid tropicalclimates?
Contrast the different typesof humid mid-latitudeclimates.
What are the characteristicsof dry climates?
What are the characteristicsof polar climates?
How do highland climatescompare with nearbylowlands?
Vocabulary◆ Köppen climate
classification system◆ wet tropical climate◆ tropical wet and
dry climate◆ humid subtropical
climate◆ marine west coast
climate◆ dry-summer
subtropical climate◆ subarctic climate
If you were to travel around the world, you would find an incrediblevariety of climates. So many, in fact, that it might be hard to believethey could all occur on the same planet! Despite the diversity, climatescan be classified according to average temperatures and amount of pre-cipitation. In this section, you will learn about the Köppen climateclassification system, which is commonly used to group climates.
The Köppen Climate ClassificationSystemMany classification systems have been used to group climates. Perhapsthe best-known and most commonly used system is the Köppen cli-mate classification system. The Köppen climate classificationsystem uses mean monthly and annual values of temperature andprecipitation to classify climates. This system is often used because itclassifies the world into climatic regions in a realistic way.
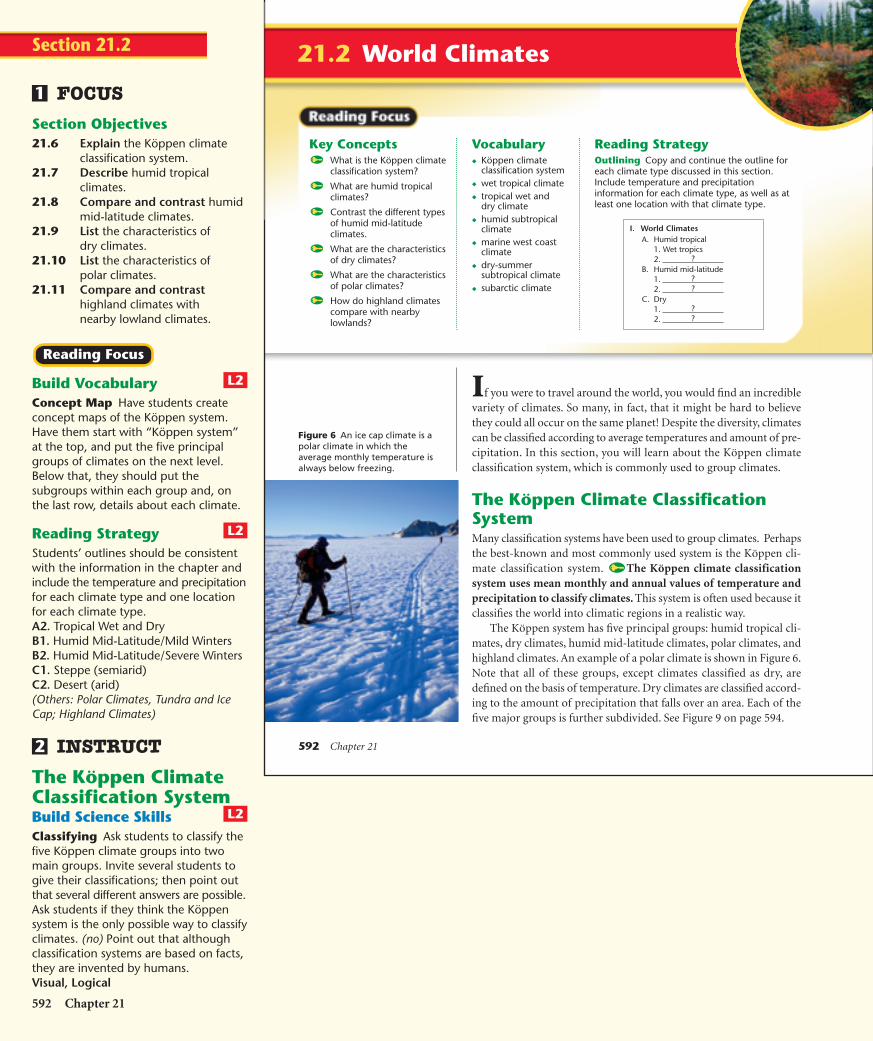
The Köppen system has five principal groups: humid tropical cli-mates, dry climates, humid mid-latitude climates, polar climates, andhighland climates. An example of a polar climate is shown in Figure 6.Note that all of these groups, except climates classified as dry, aredefined on the basis of temperature. Dry climates are classified accord-ing to the amount of precipitation that falls over an area. Each of thefive major groups is further subdivided. See Figure 9 on page 594.
I. World ClimatesA. Humid tropical
1. Wet tropics2.
B. Humid mid-latitude1.2.
C. Dry1.2. ?
?
??
?
592 Chapter 21
Figure 6 An ice cap climate is apolar climate in which theaverage monthly temperature isalways below freezing.
592 Chapter 21
Section 21.2
FOCUS
Section Objectives21.6 Explain the Köppen climate
classification system.21.7 Describe humid tropical
climates.21.8 Compare and contrast humid
mid-latitude climates.21.9 List the characteristics of
dry climates.21.10 List the characteristics of
polar climates.21.11 Compare and contrast
highland climates withnearby lowland climates.
Build VocabularyConcept Map Have students createconcept maps of the Köppen system.Have them start with “Köppen system”at the top, and put the five principalgroups of climates on the next level.Below that, they should put thesubgroups within each group and, onthe last row, details about each climate.
Reading StrategyStudents’ outlines should be consistentwith the information in the chapter andinclude the temperature and precipitationfor each climate type and one locationfor each climate type.A2. Tropical Wet and DryB1. Humid Mid-Latitude/Mild WintersB2. Humid Mid-Latitude/Severe WintersC1. Steppe (semiarid)C2. Desert (arid)(Others: Polar Climates, Tundra and IceCap; Highland Climates)
INSTRUCT
The Köppen ClimateClassification SystemBuild Science SkillsClassifying Ask students to classify thefive Köppen climate groups into twomain groups. Invite several students togive their classifications; then point outthat several different answers are possible.Ask students if they think the Köppensystem is the only possible way to classifyclimates. (no) Point out that althoughclassification systems are based on facts,they are invented by humans.Visual, Logical
L2
2
L2
L2
Reading Focus
1
HSES_1eTE_C21.qxd 5/17/04 2:36 PM Page 592
Climate 593
Humid Tropical ClimatesHumid tropical climates are climates without winters.Every month
in such a climate has a mean temperature above 18°C. The amount ofprecipitation can exceed 200 cm. There are two types of humid tropicalclimates: wet tropical climates and tropical wet and dry climates.
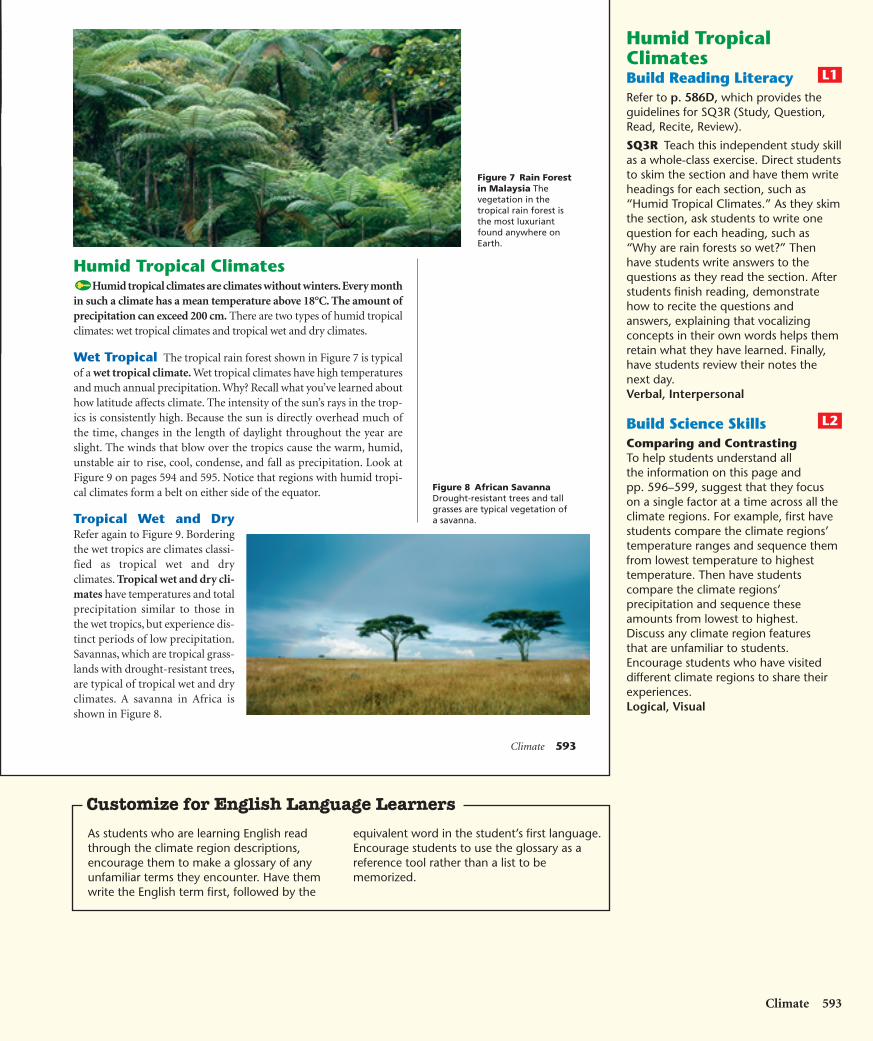
Wet Tropical The tropical rain forest shown in Figure 7 is typicalof a wet tropical climate. Wet tropical climates have high temperaturesand much annual precipitation. Why? Recall what you’ve learned abouthow latitude affects climate. The intensity of the sun’s rays in the trop-ics is consistently high. Because the sun is directly overhead much ofthe time, changes in the length of daylight throughout the year areslight. The winds that blow over the tropics cause the warm, humid,unstable air to rise, cool, condense, and fall as precipitation. Look atFigure 9 on pages 594 and 595. Notice that regions with humid tropi-cal climates form a belt on either side of the equator.
Tropical Wet and DryRefer again to Figure 9. Borderingthe wet tropics are climates classi-fied as tropical wet and dryclimates. Tropical wet and dry cli-mates have temperatures and totalprecipitation similar to those inthe wet tropics, but experience dis-tinct periods of low precipitation.Savannas, which are tropical grass-lands with drought-resistant trees,are typical of tropical wet and dryclimates. A savanna in Africa isshown in Figure 8.
Figure 7 Rain Forestin Malaysia Thevegetation in thetropical rain forest isthe most luxuriantfound anywhere onEarth.
Figure 8 African SavannaDrought-resistant trees and tallgrasses are typical vegetation of a savanna.
Humid TropicalClimatesBuild Reading LiteracyRefer to p. 586D, which provides theguidelines for SQ3R (Study, Question,Read, Recite, Review).
SQ3R Teach this independent study skillas a whole-class exercise. Direct studentsto skim the section and have them writeheadings for each section, such as“Humid Tropical Climates.” As they skimthe section, ask students to write onequestion for each heading, such as“Why are rain forests so wet?” Thenhave students write answers to thequestions as they read the section. Afterstudents finish reading, demonstratehow to recite the questions andanswers, explaining that vocalizingconcepts in their own words helps themretain what they have learned. Finally,have students review their notes thenext day.Verbal, Interpersonal
Build Science SkillsComparing and ContrastingTo help students understand allthe information on this page andpp. 596–599, suggest that they focuson a single factor at a time across all theclimate regions. For example, first havestudents compare the climate regions’temperature ranges and sequence themfrom lowest temperature to highesttemperature. Then have studentscompare the climate regions’precipitation and sequence theseamounts from lowest to highest.Discuss any climate region featuresthat are unfamiliar to students.Encourage students who have visiteddifferent climate regions to share theirexperiences.Logical, Visual
L2
L1
Climate 593
Customize for English Language Learners
As students who are learning English readthrough the climate region descriptions,encourage them to make a glossary of anyunfamiliar terms they encounter. Have themwrite the English term first, followed by the
equivalent word in the student’s first language.Encourage students to use the glossary as areference tool rather than a list to bememorized.
HSES_1eTE_C21.qxd 5/17/04 2:37 PM Page 593
594 Chapter 21
HUMID TROPICAL
DRY
HUMID MID-LATITUDE (Mild winters)
HUMID MID-LATITUDE (Severe winters)
POLAR
Wet Tropics
Tropical Wet and Dry
Steppe or Semiarid
Desert or Arid
Dry-Summer Subtropical
Humid Subtropical
Marine West Coast
Humid Continental
Subarctic
Tundra
Ice Cap
0
20
40
60
20
40
60
80 160 140 120 100
20
40
40
Equator
80 60 40 0 20 40
20
0 40
Arctic Circle
HIGHLAND
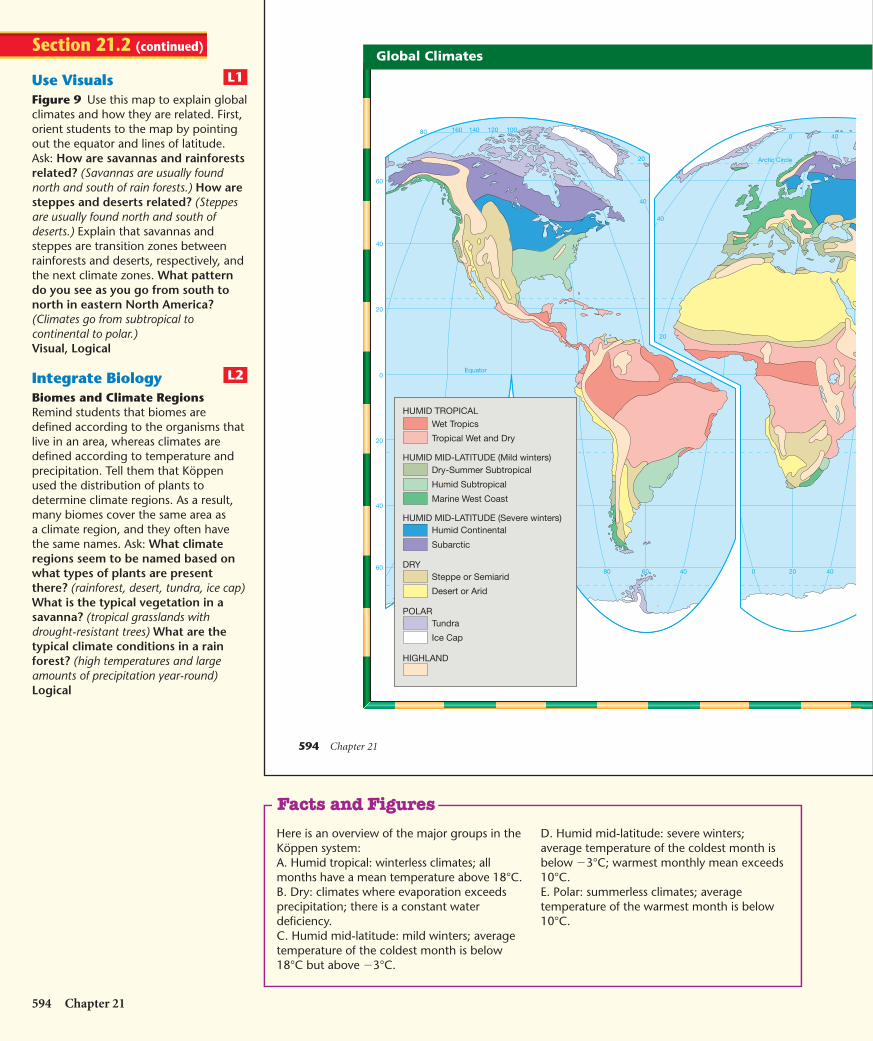
Global Climates
594 Chapter 21
Use VisualsFigure 9 Use this map to explain globalclimates and how they are related. First,orient students to the map by pointingout the equator and lines of latitude.Ask: How are savannas and rainforestsrelated? (Savannas are usually foundnorth and south of rain forests.) How aresteppes and deserts related? (Steppesare usually found north and south ofdeserts.) Explain that savannas andsteppes are transition zones betweenrainforests and deserts, respectively, andthe next climate zones. What patterndo you see as you go from south tonorth in eastern North America?(Climates go from subtropical tocontinental to polar.)Visual, Logical
Integrate BiologyBiomes and Climate RegionsRemind students that biomes aredefined according to the organisms thatlive in an area, whereas climates aredefined according to temperature andprecipitation. Tell them that Köppenused the distribution of plants todetermine climate regions. As a result,many biomes cover the same area asa climate region, and they often havethe same names. Ask: What climateregions seem to be named based onwhat types of plants are presentthere? (rainforest, desert, tundra, ice cap)What is the typical vegetation in asavanna? (tropical grasslands withdrought-resistant trees) What are thetypical climate conditions in a rainforest? (high temperatures and largeamounts of precipitation year-round)Logical
L2
L1
Section 21.2 (continued)
Here is an overview of the major groups in theKöppen system:A. Humid tropical: winterless climates; allmonths have a mean temperature above 18°C.B. Dry: climates where evaporation exceedsprecipitation; there is a constant waterdeficiency.C. Humid mid-latitude: mild winters; averagetemperature of the coldest month is below18°C but above �3°C.
D. Humid mid-latitude: severe winters;average temperature of the coldest month isbelow �3°C; warmest monthly mean exceeds10°C.E. Polar: summerless climates; averagetemperature of the warmest month is below10°C.
Facts and Figures
HSES_1eTE_C21.qxd 5/17/04 2:37 PM Page 594
Climate 595
60 60
40
20Tropic of Capricorn
100 120 140 160
80
60
40
20
0
20
Tropic of Cancer
80
40
60
180
8080 100 120 140 160
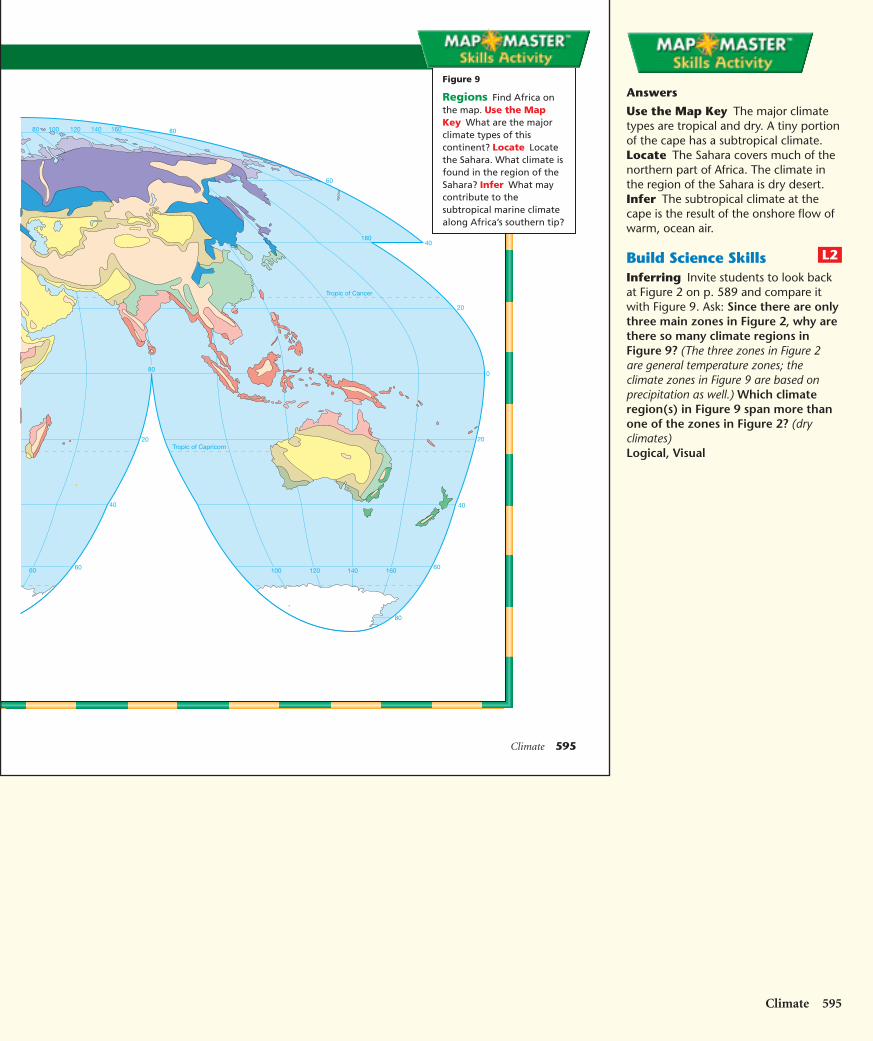
Figure 9
Regions Find Africa onthe map. Use the MapKey What are the majorclimate types of thiscontinent? Locate Locatethe Sahara. What climate isfound in the region of theSahara? Infer What maycontribute to thesubtropical marine climatealong Africa’s southern tip?
Answers
Use the Map Key The major climatetypes are tropical and dry. A tiny portionof the cape has a subtropical climate.Locate The Sahara covers much of thenorthern part of Africa. The climate inthe region of the Sahara is dry desert.Infer The subtropical climate at thecape is the result of the onshore flow ofwarm, ocean air.
Build Science SkillsInferring Invite students to look backat Figure 2 on p. 589 and compare itwith Figure 9. Ask: Since there are onlythree main zones in Figure 2, why arethere so many climate regions inFigure 9? (The three zones in Figure 2are general temperature zones; theclimate zones in Figure 9 are based onprecipitation as well.) Which climateregion(s) in Figure 9 span more thanone of the zones in Figure 2? (dryclimates)Logical, Visual
L2
Climate 595
HSES_1eTE_C21.qxd 5/17/04 2:37 PM Page 595
596 Chapter 21
Humid Mid-Latitude ClimatesHumid mid-latitude climates include climates with mild winters aswell as those with severe winters. Climates with mild winters havean average temperature in the coldest month that is below 18°C butabove �3°C. Climates with severe winters have an average temper-ature in the coldest month that is below �3°C.
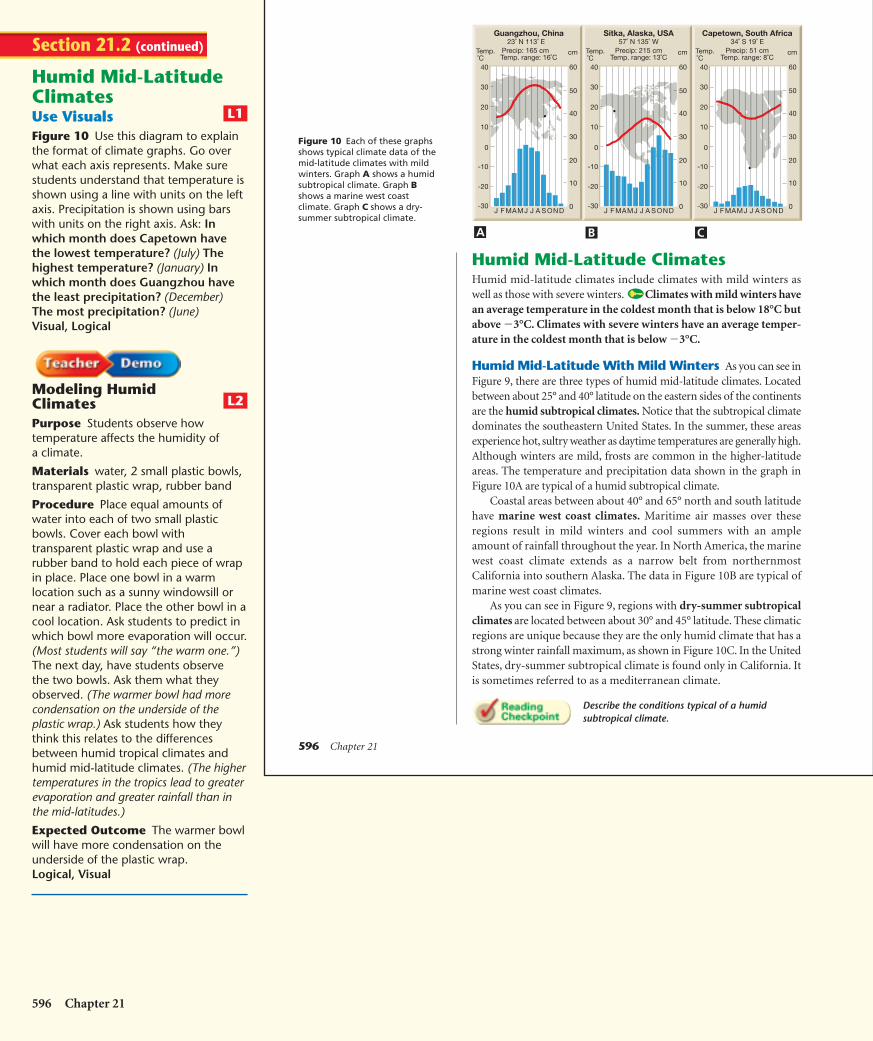
Humid Mid-Latitude With Mild Winters As you can see inFigure 9, there are three types of humid mid-latitude climates. Locatedbetween about 25° and 40° latitude on the eastern sides of the continentsare the humid subtropical climates. Notice that the subtropical climatedominates the southeastern United States. In the summer, these areasexperience hot, sultry weather as daytime temperatures are generally high.Although winters are mild, frosts are common in the higher-latitudeareas. The temperature and precipitation data shown in the graph inFigure 10A are typical of a humid subtropical climate.
Coastal areas between about 40° and 65° north and south latitudehave marine west coast climates. Maritime air masses over theseregions result in mild winters and cool summers with an ampleamount of rainfall throughout the year. In North America, the marinewest coast climate extends as a narrow belt from northernmostCalifornia into southern Alaska. The data in Figure 10B are typical ofmarine west coast climates.
As you can see in Figure 9, regions with dry-summer subtropicalclimates are located between about 30° and 45° latitude. These climaticregions are unique because they are the only humid climate that has astrong winter rainfall maximum, as shown in Figure 10C. In the UnitedStates, dry-summer subtropical climate is found only in California. Itis sometimes referred to as a mediterranean climate.
Describe the conditions typical of a humidsubtropical climate.
Figure 10 Each of these graphsshows typical climate data of themid-latitude climates with mildwinters. Graph A shows a humidsubtropical climate. Graph Bshows a marine west coastclimate. Graph C shows a dry-summer subtropical climate.
Guangzhou, China23˚ N 113˚ E
Precip: 165 cmTemp. range: 16˚C
Sitka, Alaska, USA57˚ N 135˚ W
Precip: 215 cmTemp. range: 13˚C
Capetown, South Africa34˚ S 19˚ E
Precip: 51 cmTemp. range: 8˚C˚C
cm
40
30
20
10
0
-10
-20
-30
50
40
30
20
10
0J F MAMJ J A S OND
60
Temp.˚C
cm
40
30
20
10
0
-10
-20
-30
50
40
30
20
10
0J F MAMJ J A S OND
60
Temp.˚C
cm
40
30
20
10
0
-10
-20
-30
50
40
30
20
10
0J F MAMJ J A S OND
60
Temp.
A B C
596 Chapter 21
Humid Mid-LatitudeClimatesUse VisualsFigure 10 Use this diagram to explainthe format of climate graphs. Go overwhat each axis represents. Make surestudents understand that temperature isshown using a line with units on the leftaxis. Precipitation is shown using barswith units on the right axis. Ask: Inwhich month does Capetown havethe lowest temperature? (July) Thehighest temperature? (January) Inwhich month does Guangzhou havethe least precipitation? (December)The most precipitation? (June)Visual, Logical
Modeling HumidClimatesPurpose Students observe howtemperature affects the humidity ofa climate.
Materials water, 2 small plastic bowls,transparent plastic wrap, rubber band
Procedure Place equal amounts ofwater into each of two small plasticbowls. Cover each bowl withtransparent plastic wrap and use arubber band to hold each piece of wrapin place. Place one bowl in a warmlocation such as a sunny windowsill ornear a radiator. Place the other bowl in acool location. Ask students to predict inwhich bowl more evaporation will occur.(Most students will say “the warm one.”)The next day, have students observethe two bowls. Ask them what theyobserved. (The warmer bowl had morecondensation on the underside of theplastic wrap.) Ask students how theythink this relates to the differencesbetween humid tropical climates andhumid mid-latitude climates. (The highertemperatures in the tropics lead to greaterevaporation and greater rainfall than inthe mid-latitudes.)
Expected Outcome The warmer bowlwill have more condensation on theunderside of the plastic wrap.Logical, Visual
L2
L1
Section 21.2 (continued)
HSES_1eTE_C21.qxd 9/29/04 3:09 AM Page 596
Climate 597
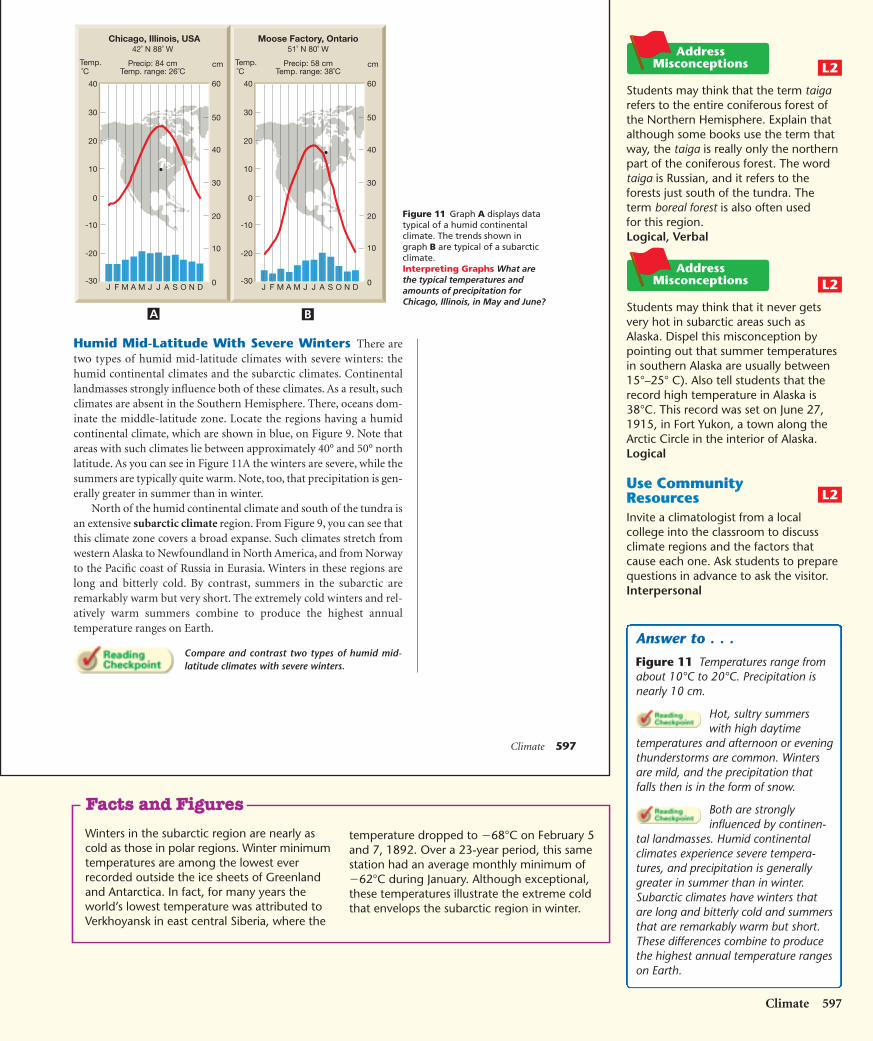
Humid Mid-Latitude With Severe Winters There aretwo types of humid mid-latitude climates with severe winters: thehumid continental climates and the subarctic climates. Continentallandmasses strongly influence both of these climates. As a result, suchclimates are absent in the Southern Hemisphere. There, oceans dom-inate the middle-latitude zone. Locate the regions having a humidcontinental climate, which are shown in blue, on Figure 9. Note thatareas with such climates lie between approximately 40° and 50° northlatitude. As you can see in Figure 11A the winters are severe, while thesummers are typically quite warm. Note, too, that precipitation is gen-erally greater in summer than in winter.
North of the humid continental climate and south of the tundra isan extensive subarctic climate region. From Figure 9, you can see thatthis climate zone covers a broad expanse. Such climates stretch fromwestern Alaska to Newfoundland in North America, and from Norwayto the Pacific coast of Russia in Eurasia. Winters in these regions arelong and bitterly cold. By contrast, summers in the subarctic areremarkably warm but very short. The extremely cold winters and rel-atively warm summers combine to produce the highest annualtemperature ranges on Earth.
Compare and contrast two types of humid mid-latitude climates with severe winters.
Chicago, Illinois, USA42˚ N 88˚ W
Precip: 84 cmTemp. range: 26˚C
Moose Factory, Ontario51˚ N 80˚ W
Precip: 58 cmTemp. range: 38˚C˚C
cm
40
30
20
10
0
-10
-20
-30
50
40
30
20
10
0J F M A M J J A S O N D
60
Temp.˚C
cm
40
30
20
10
0
-10
-20
-30
50
40
30
20
10
0J F M A M J J A S O N D
60
Temp.
A B
Figure 11 Graph A displays datatypical of a humid continentalclimate. The trends shown ingraph B are typical of a subarcticclimate.Interpreting Graphs What arethe typical temperatures andamounts of precipitation forChicago, Illinois, in May and June?
Students may think that the term taigarefers to the entire coniferous forest ofthe Northern Hemisphere. Explain thatalthough some books use the term thatway, the taiga is really only the northernpart of the coniferous forest. The wordtaiga is Russian, and it refers to theforests just south of the tundra. Theterm boreal forest is also often usedfor this region.Logical, Verbal
Students may think that it never getsvery hot in subarctic areas such asAlaska. Dispel this misconception bypointing out that summer temperaturesin southern Alaska are usually between15°–25° C). Also tell students that therecord high temperature in Alaska is38°C. This record was set on June 27,1915, in Fort Yukon, a town along theArctic Circle in the interior of Alaska.Logical
Use CommunityResourcesInvite a climatologist from a localcollege into the classroom to discussclimate regions and the factors thatcause each one. Ask students to preparequestions in advance to ask the visitor.Interpersonal
L2
L2
L2
Climate 597
Answer to . . .
Figure 11 Temperatures range fromabout 10°C to 20°C. Precipitation isnearly 10 cm.
Hot, sultry summerswith high daytime
temperatures and afternoon or eveningthunderstorms are common. Wintersare mild, and the precipitation thatfalls then is in the form of snow.
Both are stronglyinfluenced by continen-
tal landmasses. Humid continentalclimates experience severe tempera-tures, and precipitation is generallygreater in summer than in winter.Subarctic climates have winters thatare long and bitterly cold and summersthat are remarkably warm but short.These differences combine to producethe highest annual temperature rangeson Earth.
Winters in the subarctic region are nearly ascold as those in polar regions. Winter minimumtemperatures are among the lowest everrecorded outside the ice sheets of Greenlandand Antarctica. In fact, for many years theworld’s lowest temperature was attributed toVerkhoyansk in east central Siberia, where the
temperature dropped to �68°C on February 5and 7, 1892. Over a 23-year period, this samestation had an average monthly minimum of�62°C during January. Although exceptional,these temperatures illustrate the extreme coldthat envelops the subarctic region in winter.
Facts and Figures
HSES_1eTE_C21.qxd 9/29/04 3:09 AM Page 597
598 Chapter 21
Dry ClimatesA dry climate is one in which the yearly precipitation is not as
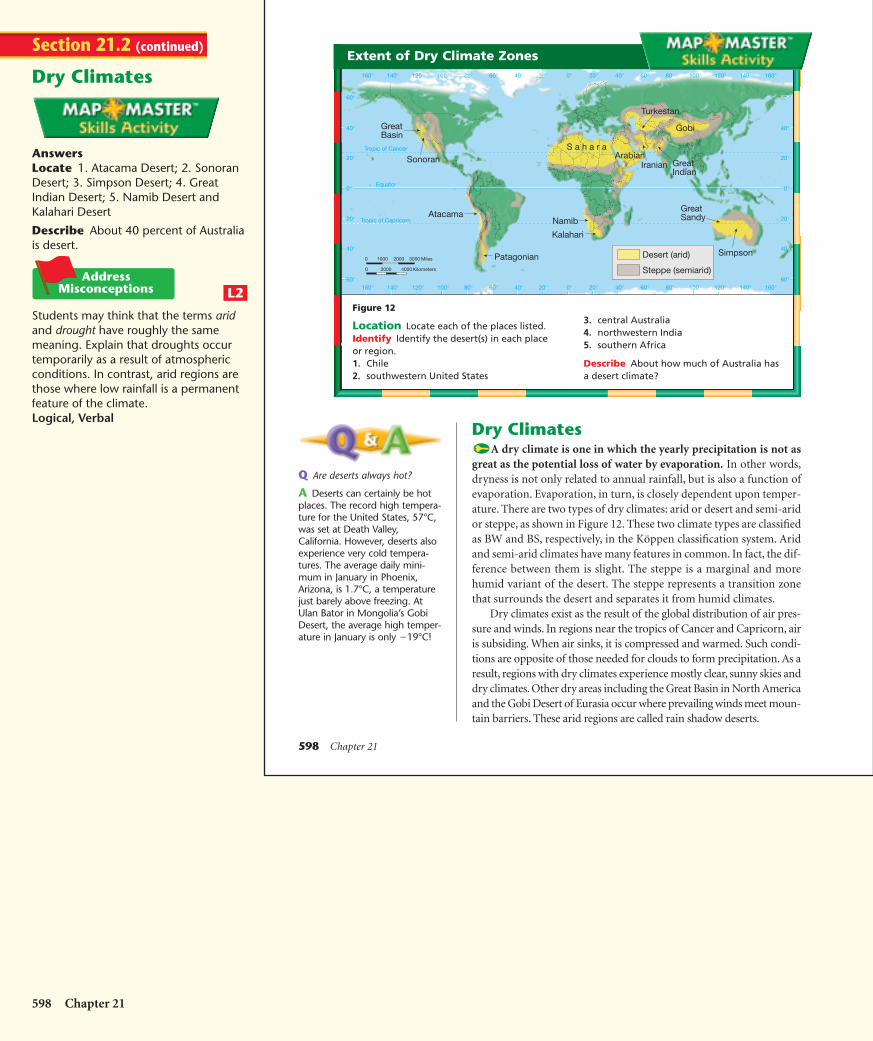
great as the potential loss of water by evaporation. In other words,dryness is not only related to annual rainfall, but is also a function ofevaporation. Evaporation, in turn, is closely dependent upon temper-ature. There are two types of dry climates: arid or desert and semi-aridor steppe, as shown in Figure 12. These two climate types are classifiedas BW and BS, respectively, in the Köppen classification system. Aridand semi-arid climates have many features in common. In fact, the dif-ference between them is slight. The steppe is a marginal and morehumid variant of the desert. The steppe represents a transition zonethat surrounds the desert and separates it from humid climates.
Dry climates exist as the result of the global distribution of air pres-sure and winds. In regions near the tropics of Cancer and Capricorn, airis subsiding. When air sinks, it is compressed and warmed. Such condi-tions are opposite of those needed for clouds to form precipitation. As aresult, regions with dry climates experience mostly clear, sunny skies anddry climates. Other dry areas including the Great Basin in North Americaand the Gobi Desert of Eurasia occur where prevailing winds meet moun-tain barriers. These arid regions are called rain shadow deserts.
Q Are deserts always hot?
A Deserts can certainly be hotplaces. The record high tempera-ture for the United States, 57°C,was set at Death Valley,California. However, deserts alsoexperience very cold tempera-tures. The average daily mini-mum in January in Phoenix,Arizona, is 1.7°C, a temperaturejust barely above freezing. AtUlan Bator in Mongolia’s GobiDesert, the average high temper-ature in January is only �19°C!
Tropic of Cancer
Tropic of Capricorn
Equator
Desert (arid)
Steppe (semiarid)
140° 120°100°40°60°80° 140° 160°80°60°40°
20°
0°
20°
60°
40°
40°
60°0° 20°20°100°120°160°
140° 120°100°40°60°80° 140° 160°80°60°40°0° 20°20°100°120°160°
20°
0°
20°
60°
40°
40°
60°
0 20001000 3000 Miles
0 40002000 Kilometers
GreatBasin
Sonoran
Atacama
Patagonian
Kalahari
Namib
S a h a r a
Iranian
Turkestan
Gobi
GreatIndian
GreatSandy
Simpson
Arabian
Extent of Dry Climate Zones
Figure 12
Location Locate each of the places listed.Identify Identify the desert(s) in each placeor region. 1. Chile2. southwestern United States
3. central Australia4. northwestern India5. southern Africa
Describe About how much of Australia hasa desert climate?
598 Chapter 21
Dry Climates
AnswersLocate 1. Atacama Desert; 2. SonoranDesert; 3. Simpson Desert; 4. GreatIndian Desert; 5. Namib Desert andKalahari Desert
Describe About 40 percent of Australiais desert.
Students may think that the terms aridand drought have roughly the samemeaning. Explain that droughts occurtemporarily as a result of atmosphericconditions. In contrast, arid regions arethose where low rainfall is a permanentfeature of the climate.Logical, Verbal
L2
Section 21.2 (continued)
HSES_1eTE_C21.qxd 5/17/04 2:38 PM Page 598
Section 21.2 Assessment
Reviewing Concepts1. What is the Köppen climate classification
system?
2. Describe the characteristics of humidtropical climates.
3. What are some characteristics of humidmid-latitude climates?
4. What defines a dry climate?
5. What are the characteristics of polarclimates?
6. How do highland climates compare withnearby lowlands?
Critical Thinking7. Identifying Use Figure 9 to identify the
climate type of your city. Describe somecharacteristics of your city’s climate type.
8. Formulating Conclusions Can tundraclimates exist at low latitudes? Explain.
Polar ClimatesPolar climates are those in which the mean temperature of the
warmest month is below 10°C. Winters in these regions are periods ofperpetual night, or nearly so, making temperatures at most polar loca-tions extremely cold. During the summer months, temperaturesremain cool despite the long days. Very little precipitation falls in polarregions. Evaporation, too, in these areas is limited.
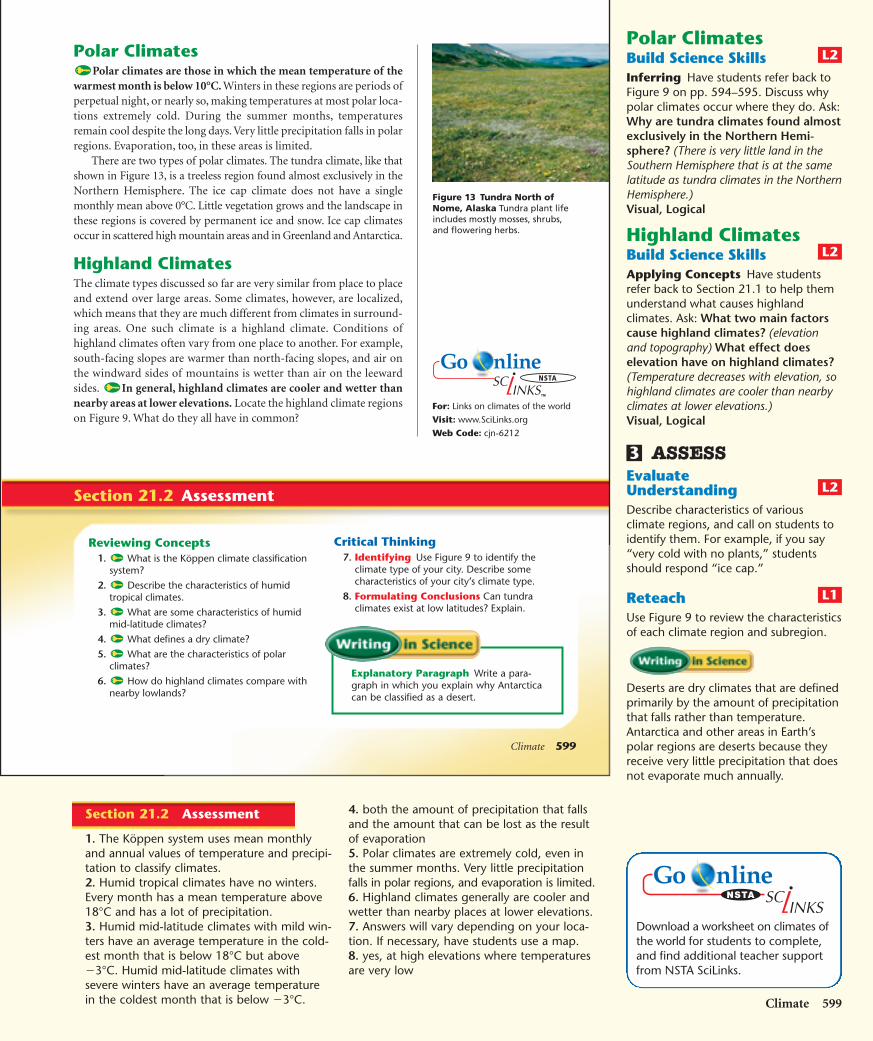
There are two types of polar climates. The tundra climate, like thatshown in Figure 13, is a treeless region found almost exclusively in theNorthern Hemisphere. The ice cap climate does not have a singlemonthly mean above 0°C. Little vegetation grows and the landscape inthese regions is covered by permanent ice and snow. Ice cap climatesoccur in scattered high mountain areas and in Greenland and Antarctica.
Highland ClimatesThe climate types discussed so far are very similar from place to placeand extend over large areas. Some climates, however, are localized,which means that they are much different from climates in surround-ing areas. One such climate is a highland climate. Conditions ofhighland climates often vary from one place to another. For example,south-facing slopes are warmer than north-facing slopes, and air onthe windward sides of mountains is wetter than air on the leewardsides. In general, highland climates are cooler and wetter thannearby areas at lower elevations. Locate the highland climate regionson Figure 9. What do they all have in common?
Climate 599
Explanatory Paragraph Write a para-graph in which you explain why Antarcticacan be classified as a desert.
Figure 13 Tundra North ofNome, Alaska Tundra plant lifeincludes mostly mosses, shrubs,and flowering herbs.
For: Links on climates of the world
Visit: www.SciLinks.org
Web Code: cjn-6212
Polar ClimatesBuild Science SkillsInferring Have students refer back toFigure 9 on pp. 594–595. Discuss whypolar climates occur where they do. Ask:Why are tundra climates found almostexclusively in the Northern Hemi-sphere? (There is very little land in theSouthern Hemisphere that is at the samelatitude as tundra climates in the NorthernHemisphere.)Visual, Logical
Highland ClimatesBuild Science SkillsApplying Concepts Have studentsrefer back to Section 21.1 to help themunderstand what causes highlandclimates. Ask: What two main factorscause highland climates? (elevationand topography) What effect doeselevation have on highland climates?(Temperature decreases with elevation, sohighland climates are cooler than nearbyclimates at lower elevations.)Visual, Logical
ASSESSEvaluateUnderstandingDescribe characteristics of variousclimate regions, and call on students toidentify them. For example, if you say“very cold with no plants,” studentsshould respond “ice cap.”
ReteachUse Figure 9 to review the characteristicsof each climate region and subregion.
Deserts are dry climates that are definedprimarily by the amount of precipitationthat falls rather than temperature.Antarctica and other areas in Earth’spolar regions are deserts because theyreceive very little precipitation that doesnot evaporate much annually.
L1
L2
3
L2
L2
Climate 599
4. both the amount of precipitation that fallsand the amount that can be lost as the resultof evaporation5. Polar climates are extremely cold, even inthe summer months. Very little precipitationfalls in polar regions, and evaporation is limited.6. Highland climates generally are cooler andwetter than nearby places at lower elevations.7. Answers will vary depending on your loca-tion. If necessary, have students use a map.8. yes, at high elevations where temperaturesare very low
Section 21.2 Assessment
1. The Köppen system uses mean monthlyand annual values of temperature and precipi-tation to classify climates.2. Humid tropical climates have no winters.Every month has a mean temperature above18°C and has a lot of precipitation.3. Humid mid-latitude climates with mild win-ters have an average temperature in the cold-est month that is below 18°C but above�3°C. Humid mid-latitude climates withsevere winters have an average temperaturein the coldest month that is below �3°C.
Download a worksheet on climates ofthe world for students to complete,and find additional teacher supportfrom NSTA SciLinks.
HSES_1eTE_C21.qxd 9/29/04 3:10 AM Page 599