Embed Size (px)
Citation preview
The HSBC UAE Purchasing Managers’ Index (PMI) is a composite indicator designed to provide an overall view of activity in the United Arab Emirates non-oil pri-vate sector economy. The indicator is derived from individual diffusion indices which measure changes in output, new orders, employment, suppliers’ delivery times and stocks of goods purchased. A reading of the PMI below 50.0 indicates that the economy is generally declining; above 50.0, that it is generally expanding. A read-ing of 50.0 signals no change. The greater the divergence from 50.0, the greater the rate of change signalled by the index. Purchasing Managers’ Index™ and PMI™ are trade marks of Markit Economics Limited, HSBC use the above marks under licence. Markit and the Markit logo are registered trade marks of Markit Group Limited.
HSBC UAE Purchasing Managers’ Index™ (PMI™)
45
50
55
60
2010 2011
Increasing rate of contraction
Increasing rate of growth50 = no change on previous month, S.Adj.
HSBC Purchasing Managers’ Index™ 2012
HSBC UAE PMI™Operating conditions improve moderately amid cautious optimism
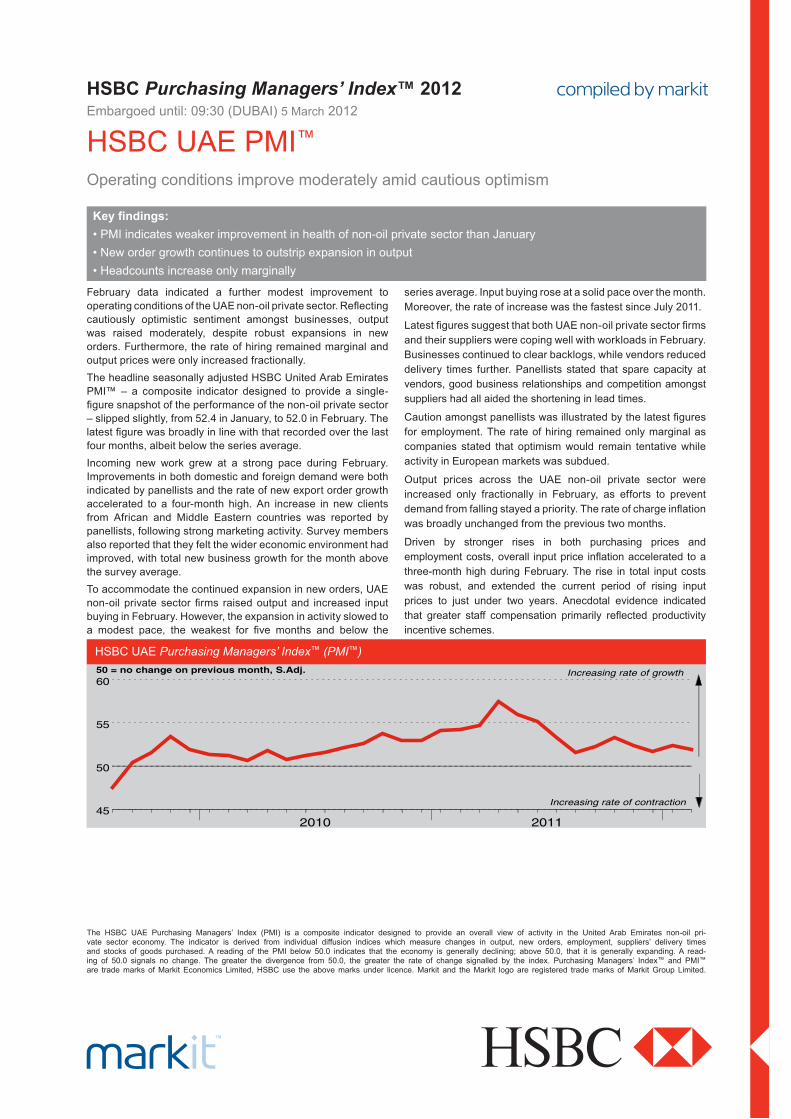
February data indicated a further modest improvement to operating conditions of the UAE non-oil private sector. Reflecting cautiously optimistic sentiment amongst businesses, output was raised moderately, despite robust expansions in new orders. Furthermore, the rate of hiring remained marginal and output prices were only increased fractionally.The headline seasonally adjusted HSBC United Arab Emirates PMI™ – a composite indicator designed to provide a single-figure snapshot of the performance of the non-oil private sector – slipped slightly, from 52.4 in January, to 52.0 in February. The latest figure was broadly in line with that recorded over the last four months, albeit below the series average. Incoming new work grew at a strong pace during February. Improvements in both domestic and foreign demand were both indicated by panellists and the rate of new export order growth accelerated to a four-month high. An increase in new clients from African and Middle Eastern countries was reported by panellists, following strong marketing activity. Survey members also reported that they felt the wider economic environment had improved, with total new business growth for the month above the survey average.To accommodate the continued expansion in new orders, UAE non-oil private sector firms raised output and increased input buying in February. However, the expansion in activity slowed to a modest pace, the weakest for five months and below the
series average. Input buying rose at a solid pace over the month. Moreover, the rate of increase was the fastest since July 2011.
Latest figures suggest that both UAE non-oil private sector firms and their suppliers were coping well with workloads in February. Businesses continued to clear backlogs, while vendors reduced delivery times further. Panellists stated that spare capacity at vendors, good business relationships and competition amongst suppliers had all aided the shortening in lead times.
Caution amongst panellists was illustrated by the latest figures for employment. The rate of hiring remained only marginal as companies stated that optimism would remain tentative while activity in European markets was subdued.
Output prices across the UAE non-oil private sector were increased only fractionally in February, as efforts to prevent demand from falling stayed a priority. The rate of charge inflation was broadly unchanged from the previous two months.
Driven by stronger rises in both purchasing prices and employment costs, overall input price inflation accelerated to a three-month high during February. The rise in total input costs was robust, and extended the current period of rising input prices to just under two years. Anecdotal evidence indicated that greater staff compensation primarily reflected productivity incentive schemes.
Key findings:• PMI indicates weaker improvement in health of non-oil private sector than January• New order growth continues to outstrip expansion in output• Headcounts increase only marginally
Embargoed until: 09:30 (DUBAI) 5 March 2012
All Intellectual Property Rights owned by Markit Economics Limited 2
HSBC UAE PMI™
Output IndexQ. Please compare your production/output this month with the situation one month ago.
Q. Please compare the level of new export orders received this month with the situation of one month ago.
Q. Please compare the level of outstanding business in your company this month with the situation one month ago.
New Orders Index
New Export Orders Index
Backlogs of Work Index
Suppliers’ Delivery Times IndexQ. Please compare your suppliers' delivery times (volume weighted) this month with the situation one month ago.
Q. Please compare the level of new orders received this month with the situation of one month ago.
% Low er
% S am e
% H igher
40
45
50
55
60
65
2010 2011Increasing rate of contraction
Increasing rate of growth50 = no change on previous month, S.Adj.
% Low er
% S am e
% H igher
45
50
55
60
65
2010 2011
Increasing rate of contraction
Increasing rate of growth50 = no change on previous month, S.Adj.
% Low er
% S am e
% H igher
45
50
55
60
2010 2011
Increasing rate of contraction
Increasing rate of growth50 = no change on previous month, S.Adj.
% Low er
% S am e
% H igher
40
45
50
55
2010 2011
Increasing rate of contraction
Increasing rate of growth50 = no change on previous month, S.Adj.
% S low er % Faster
% Sam e45
50
55
60
65
70
2010 2011
Faster delivery times
Slower delivery times
50 = no change on previous month, S.Adj.
All Intellectual Property Rights owned by Markit Economics Limited 2 3
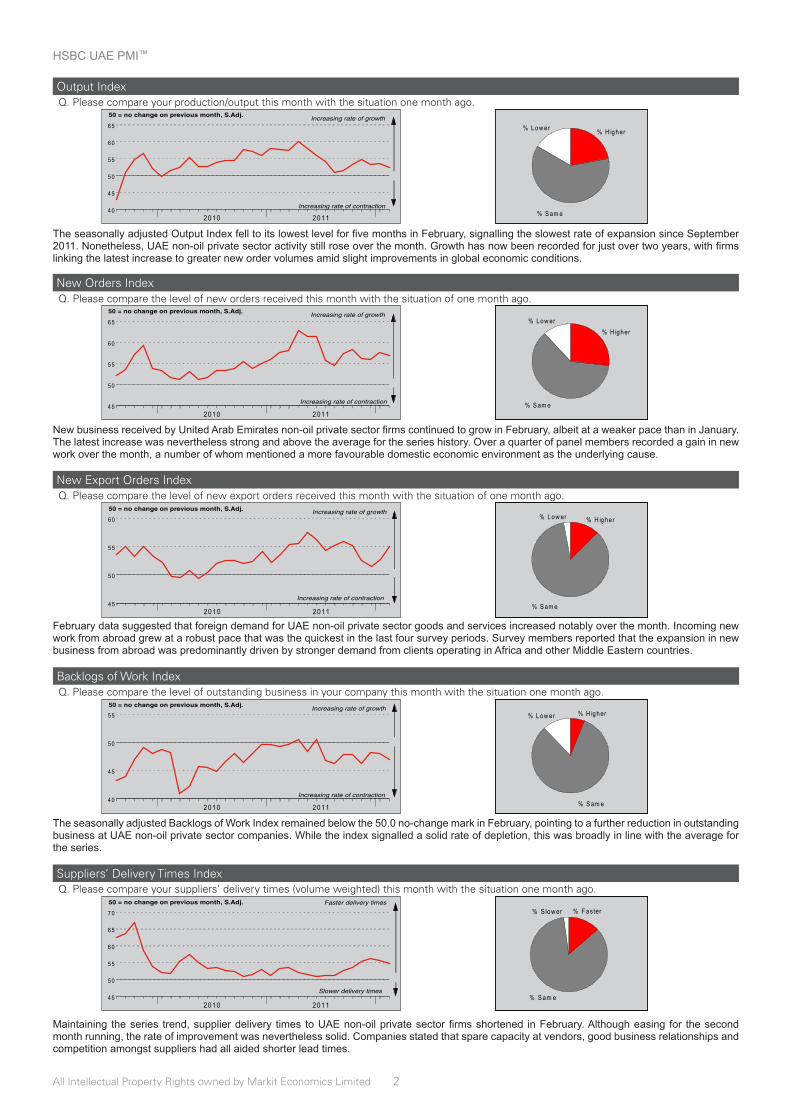
The seasonally adjusted Output Index fell to its lowest level for five months in February, signalling the slowest rate of expansion since September 2011. Nonetheless, UAE non-oil private sector activity still rose over the month. Growth has now been recorded for just over two years, with firms linking the latest increase to greater new order volumes amid slight improvements in global economic conditions.
New business received by United Arab Emirates non-oil private sector firms continued to grow in February, albeit at a weaker pace than in January. The latest increase was nevertheless strong and above the average for the series history. Over a quarter of panel members recorded a gain in new work over the month, a number of whom mentioned a more favourable domestic economic environment as the underlying cause.
February data suggested that foreign demand for UAE non-oil private sector goods and services increased notably over the month. Incoming new work from abroad grew at a robust pace that was the quickest in the last four survey periods. Survey members reported that the expansion in new business from abroad was predominantly driven by stronger demand from clients operating in Africa and other Middle Eastern countries.
The seasonally adjusted Backlogs of Work Index remained below the 50.0 no-change mark in February, pointing to a further reduction in outstanding business at UAE non-oil private sector companies. While the index signalled a solid rate of depletion, this was broadly in line with the average for the series.
Maintaining the series trend, supplier delivery times to UAE non-oil private sector firms shortened in February. Although easing for the second month running, the rate of improvement was nevertheless solid. Companies stated that spare capacity at vendors, good business relationships and competition amongst suppliers had all aided shorter lead times.
All Intellectual Property Rights owned by Markit Economics Limited 2 All Intellectual Property Rights owned by Markit Economics Limited 2
5 March 2012
3
Employment IndexQ. Please compare the level of employment at your unit with the situation one month ago.
Output Prices IndexQ. Please compare the average prices you charged this month with the situation one month ago.
Overall Input Prices IndexQ. Please compare your overall average input prices this month with the situation one month ago.
Input Costs: Purchase Prices IndexQ. Please compare the price of your purchases (volume-weighted) this month with the situation one month ago.
Input Costs: Staff Costs IndexQ. Please compare the average prices you paid for salaries/wages this month with the situation one month ago.
% Low er
% S am e
% H igher
45
50
55
60
2010 2011
Increasing rate of contraction
Increasing rate of growth50 = no change on previous month, S.Adj.
% Low er
% S am e
% H igher
45
50
55
60
2010 2011Increasing rate of deflation
Increasing rate of inflation50 = no change on previous month, S.Adj.
% Low er
% S am e
% H igher
45
50
55
60
2010 2011
Increasing rate of deflation
Increasing rate of inflation50 = no change on previous month, S.Adj.
% Low er
% S am e
% H igher
45
50
55
60
65
2010 2011
Increasing rate of deflation
Increasing rate of inflation50 = no change on previous month, S.Adj.
% H igher% Low er
% Sam e45
50
55
2010 2011
Increasing rate of deflation
Increasing rate of inflation50 = no change on previous month, S.Adj.
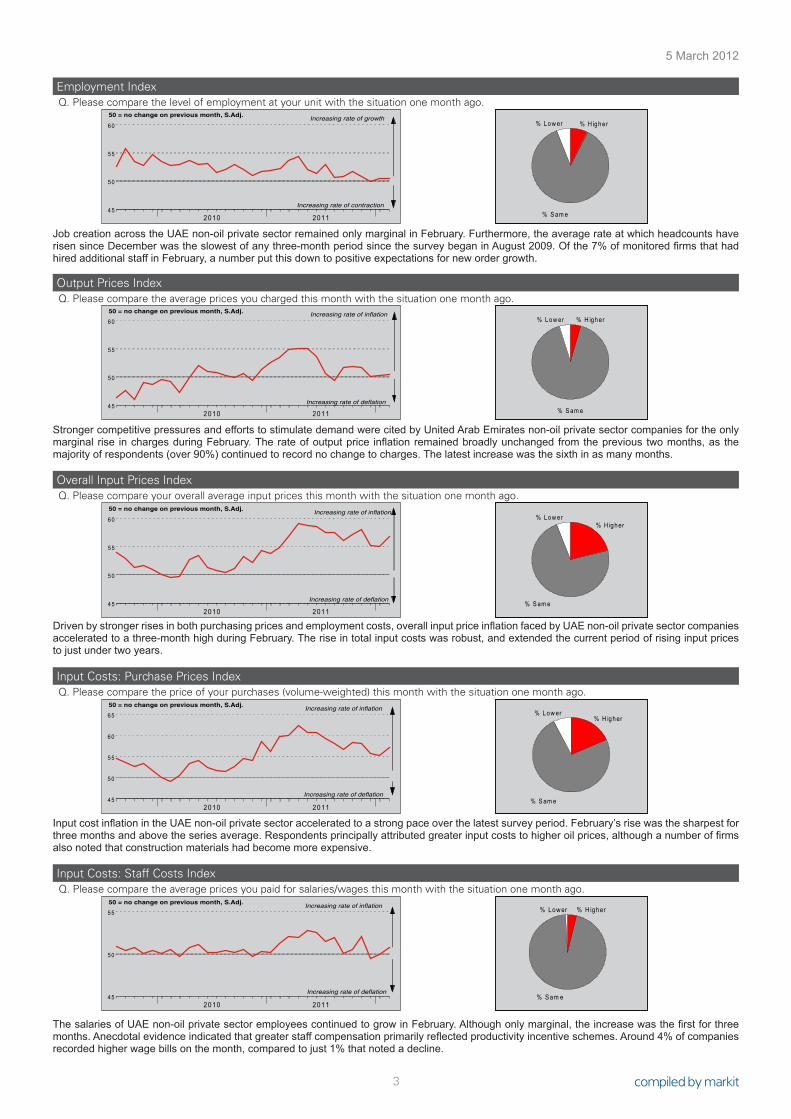
Job creation across the UAE non-oil private sector remained only marginal in February. Furthermore, the average rate at which headcounts have risen since December was the slowest of any three-month period since the survey began in August 2009. Of the 7% of monitored firms that had hired additional staff in February, a number put this down to positive expectations for new order growth.
Stronger competitive pressures and efforts to stimulate demand were cited by United Arab Emirates non-oil private sector companies for the only marginal rise in charges during February. The rate of output price inflation remained broadly unchanged from the previous two months, as the majority of respondents (over 90%) continued to record no change to charges. The latest increase was the sixth in as many months.
Driven by stronger rises in both purchasing prices and employment costs, overall input price inflation faced by UAE non-oil private sector companies accelerated to a three-month high during February. The rise in total input costs was robust, and extended the current period of rising input prices to just under two years.
Input cost inflation in the UAE non-oil private sector accelerated to a strong pace over the latest survey period. February’s rise was the sharpest for three months and above the series average. Respondents principally attributed greater input costs to higher oil prices, although a number of firms also noted that construction materials had become more expensive.
The salaries of UAE non-oil private sector employees continued to grow in February. Although only marginal, the increase was the first for three months. Anecdotal evidence indicated that greater staff compensation primarily reflected productivity incentive schemes. Around 4% of companies recorded higher wage bills on the month, compared to just 1% that noted a decline.
5 March 2012
All Intellectual Property Rights owned by Markit Economics Limited 4
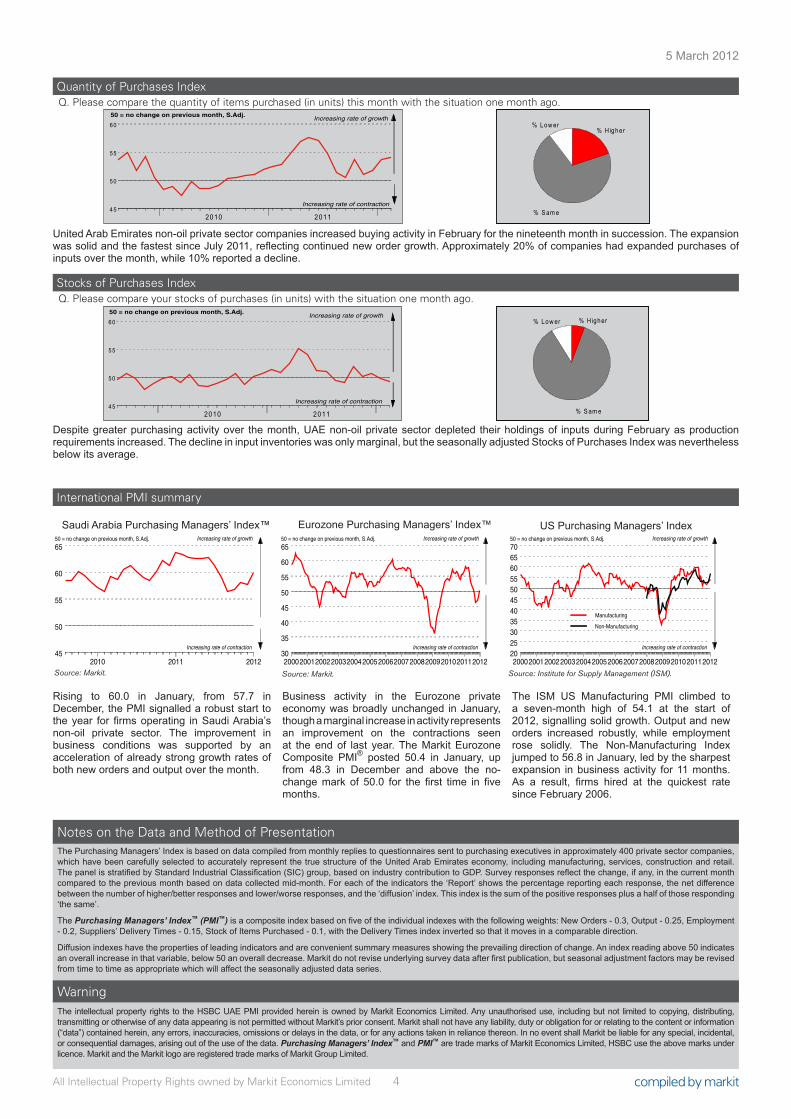
Quantity of Purchases IndexQ. Please compare the quantity of items purchased (in units) this month with the situation one month ago.
Stocks of Purchases IndexQ. Please compare your stocks of purchases (in units) with the situation one month ago.
International PMI summary
% Low er
% S am e
% H igher
45
50
55
60
2010 2011
Increasing rate of contraction
Increasing rate of growth50 = no change on previous month, S.Adj.
% Low er
% S am e
% H igher
45
50
55
60
2010 2011
Increasing rate of contraction
Increasing rate of growth50 = no change on previous month, S.Adj.
The Purchasing Managers’ Index is based on data compiled from monthly replies to questionnaires sent to purchasing executives in approximately 400 private sector companies, which have been carefully selected to accurately represent the true structure of the United Arab Emirates economy, including manufacturing, services, construction and retail. The panel is stratified by Standard Industrial Classification (SIC) group, based on industry contribution to GDP. Survey responses reflect the change, if any, in the current month compared to the previous month based on data collected mid-month. For each of the indicators the ‘Report’ shows the percentage reporting each response, the net difference between the number of higher/better responses and lower/worse responses, and the ‘diffusion’ index. This index is the sum of the positive responses plus a half of those responding ‘the same’.
The Purchasing Managers’ Index™ (PMI™) is a composite index based on five of the individual indexes with the following weights: New Orders - 0.3, Output - 0.25, Employment - 0.2, Suppliers’ Delivery Times - 0.15, Stock of Items Purchased - 0.1, with the Delivery Times index inverted so that it moves in a comparable direction.
Diffusion indexes have the properties of leading indicators and are convenient summary measures showing the prevailing direction of change. An index reading above 50 indicates an overall increase in that variable, below 50 an overall decrease. Markit do not revise underlying survey data after first publication, but seasonal adjustment factors may be revised from time to time as appropriate which will affect the seasonally adjusted data series.
Notes on the Data and Method of Presentation
The intellectual property rights to the HSBC UAE PMI provided herein is owned by Markit Economics Limited. Any unauthorised use, including but not limited to copying, distributing, transmitting or otherwise of any data appearing is not permitted without Markit’s prior consent. Markit shall not have any liability, duty or obligation for or relating to the content or information (“data”) contained herein, any errors, inaccuracies, omissions or delays in the data, or for any actions taken in reliance thereon. In no event shall Markit be liable for any special, incidental, or consequential damages, arising out of the use of the data. Purchasing Managers’ Index™ and PMI™ are trade marks of Markit Economics Limited, HSBC use the above marks under licence. Markit and the Markit logo are registered trade marks of Markit Group Limited.
Warning
United Arab Emirates non-oil private sector companies increased buying activity in February for the nineteenth month in succession. The expansion was solid and the fastest since July 2011, reflecting continued new order growth. Approximately 20% of companies had expanded purchases of inputs over the month, while 10% reported a decline.
Despite greater purchasing activity over the month, UAE non-oil private sector depleted their holdings of inputs during February as production requirements increased. The decline in input inventories was only marginal, but the seasonally adjusted Stocks of Purchases Index was nevertheless below its average.
Rising to 60.0 in January, from 57.7 in December, the PMI signalled a robust start to the year for firms operating in Saudi Arabia’s non-oil private sector. The improvement in business conditions was supported by an acceleration of already strong growth rates of both new orders and output over the month.
Business activity in the Eurozone private economy was broadly unchanged in January, though a marginal increase in activity represents an improvement on the contractions seen at the end of last year. The Markit Eurozone Composite PMI® posted 50.4 in January, up from 48.3 in December and above the no-change mark of 50.0 for the first time in five months.
The ISM US Manufacturing PMI climbed to a seven-month high of 54.1 at the start of 2012, signalling solid growth. Output and new orders increased robustly, while employment rose solidly. The Non-Manufacturing Index jumped to 56.8 in January, led by the sharpest expansion in business activity for 11 months. As a result, firms hired at the quickest rate since February 2006.
Saudi Arabia Purchasing Managers’ Index™
Source: Markit.
Eurozone Purchasing Managers’ Index™
Source: Markit.
US Purchasing Managers’ Index
Source: Institute for Supply Management (ISM).2010 2011 2012
45
50
55
60
65
Increasing rate of contraction
Increasing rate of growth50 = no change on previous month, S.Adj.
200020012002200320042005200620072008200920102011201230
35
40
45
50
55
60
65
Increasing rate of contraction
Increasing rate of growth50 = no change on previous month, S.Adj.
20002001200220032004200520062007200820092010201120122025303540455055606570
Increasing rate of contraction
Increasing rate of growth50 = no change on previous month, S.Adj.
Manufacturing
Non-Manufacturing