Embed Size (px)
Citation preview
Investor Presentation
HSBC North AmericaMarch 8, 2010
This presentation, including the accompanying slides and subsequent discussion, contains certain forward-looking information with respect to the financial condition, results of operations and business of HSBC Holdings plc and HSBC USA Inc. This forward-looking information represents expectations or beliefs concerning future events and involves known and unknown risks and uncertainties that could cause actual results, performance or events to differ materially from those expressed or implied in such statements. Additional detailed information concerning important factors that could cause actual results to differ materially is available in the HSBC Holdings plc Annual Report and the HSBC USA Inc. Annual Report on Form 10-K, each for the year ended December 31, 2009. Please be further advised that Regulation FD prohibits HSBC representatives from answering certain, specific questions during the Q&A session. You may get copies of the HSBC USA Inc. document referred to above free by visiting EDGAR on the SEC website at www.sec.gov.
These materials do not constitute an offer to sell, or the solicitation of an offer to buy, any security of HSBC USA Inc. or any other issuer.
HSBC Holdings plc reports financial results in accordance with International Financial Reporting Standards (‘IFRSs’) as issued by the International Accounting Standards Board (“IASB”) and endorsed by the European Union (“EU”). EU-endorsed IFRSs may differ from IFRSs, as issued by the IASB if, at any point in time, new or amended IFRSs have not been endorsed by the EU. At December 31, 2009, there were no unendorsed standards affecting this document and there was no difference between IFRSs endorsed by the EU and IFRSs as issued by the IASB in terms of their application to HSBC.
IFRSs comprise accounting standards issued by the International Accounting Standards Board and its predecessor body and interpretations issued by the International Financial Reporting Interpretations Committee and its predecessor body.
All amounts are in US$ unless otherwise stated.
Disclosure statements
Investor Presentation
Update on HSBCNorth America Strategy
Brendan McDonaghChief Executive Officer
HSBC North America Holdings Inc.
Update on HSBC North America Strategy
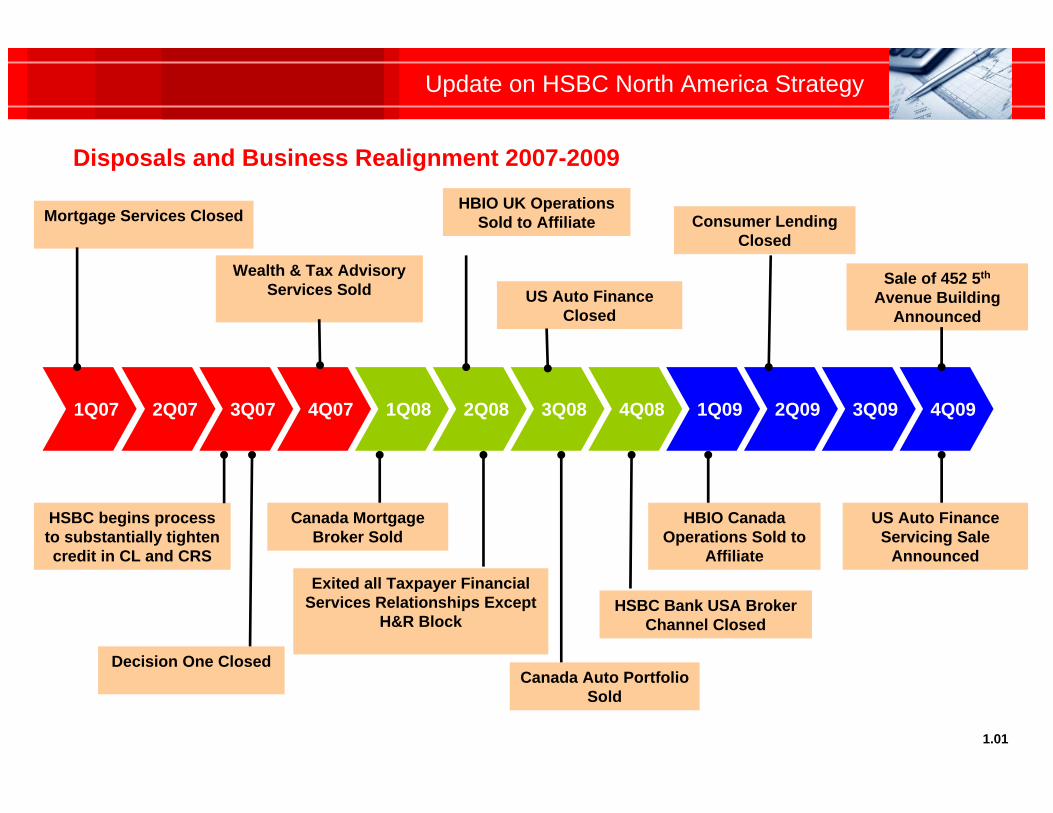
1Q07 2Q07 3Q07 4Q07 1Q08 2Q08 3Q08 4Q08 1Q09 2Q09 3Q09 4Q09
Mortgage Services Closed
Wealth & Tax Advisory Services Sold
HSBC begins process to substantially tighten credit in CL and CRS
Decision One Closed
Canada Mortgage Broker Sold
Exited all Taxpayer Financial Services Relationships Except
H&R Block
Canada Auto Portfolio Sold
HSBC Bank USA Broker Channel Closed
HBIO Canada Operations Sold to
Affiliate
US Auto Finance Servicing Sale
Announced
HBIO UK Operations Sold to Affiliate
US Auto Finance Closed
Consumer Lending Closed
Sale of 452 5th
Avenue Building Announced
1.01
Disposals and Business Realignment 2007-2009
Update on HSBC North America Strategy
1.02
Lead from Strength
• Optimizing performance in our core businesses:• Cards business in US recorded 2009 PBT of $641 million, excluding goodwill impairment charges of
$530 million
• Strategic expansion of bank branch network with 24 new branches opened in 2009 (18 in US and 6 in Canada)
• Online savings accounts have grown to $18 billion in North America, up 8 percent year-over-year
• During 2009 approximately 146,000 have joined Premier, a 40 percent increase in the North America customer base
• Global Banking and Markets in the US and Canada recorded 2009 PBT of $664 million*, up $3.3 billion year-over-year
• Reserves for consumer receivables remained flat in Q4 2009 (excluding change in write-off policy), down from Q1 2009 and Q2 2009 levels
* Refers to North America excluding Bermuda
Update on HSBC North America Strategy
1.03
Enhance our Brand
• HSBC Brand Health Index scores* in the US and Canada are steadily improving, and have both hit their 2009 targets
• For the first time ever, HSBC in New York has moved into 3rd position (overtaking Citibank) just behind Chase and Bank of America
• We continue to proactively reach out and assist customers who are experiencing financial difficulties
• During 2009, we have modified more than 104,000 loans, with balances totaling approximately $14.6 billion
• North America employees have completed close to 72,000 service hours; 66 percent of the volunteerism supported education and the environment
*Internal HSBC Brand Health Index administered by Synovate for Group Marketing in London
Update on HSBC North America Strategy
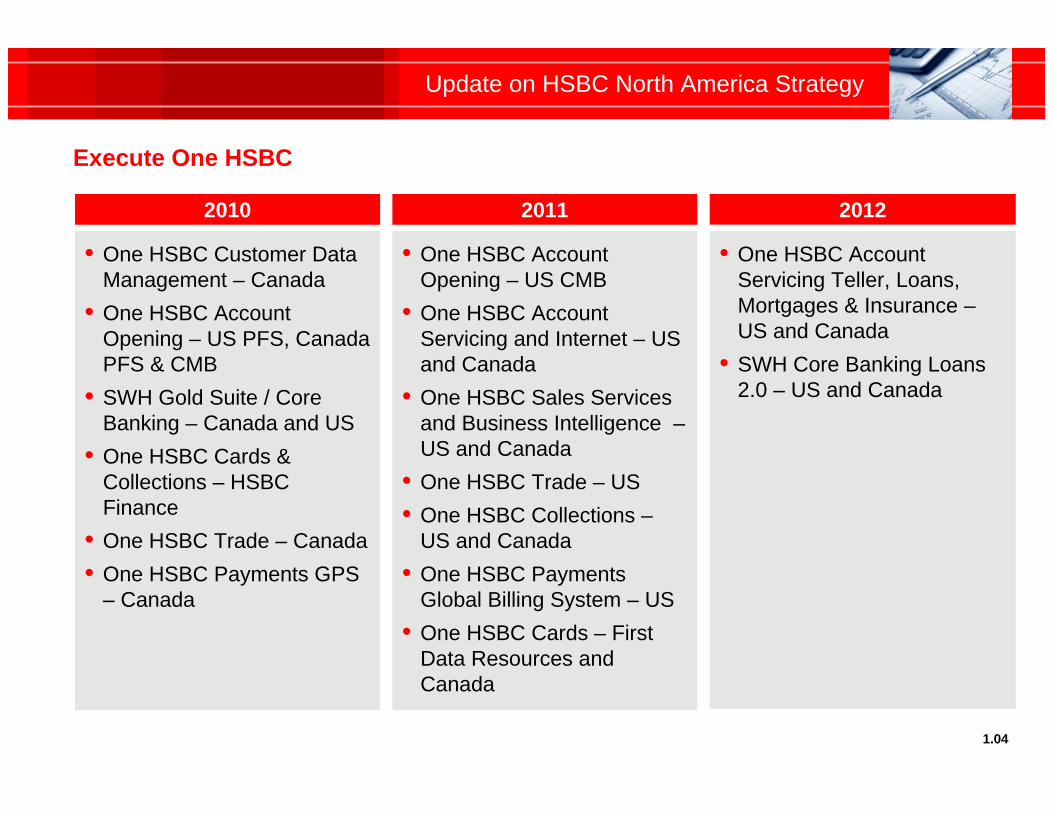
Execute One HSBC
• One HSBC Customer Data Management – Canada
• One HSBC Account Opening – US PFS, Canada PFS & CMB
• SWH Gold Suite / Core Banking – Canada and US
• One HSBC Cards & Collections – HSBC Finance
• One HSBC Trade – Canada • One HSBC Payments GPS
– Canada
2010
• One HSBC Account Opening – US CMB
• One HSBC Account Servicing and Internet – US and Canada
• One HSBC Sales Services and Business Intelligence –US and Canada
• One HSBC Trade – US • One HSBC Collections –
US and Canada• One HSBC Payments
Global Billing System – US • One HSBC Cards – First
Data Resources and Canada
2011
• One HSBC Account Servicing Teller, Loans, Mortgages & Insurance –US and Canada
• SWH Core Banking Loans 2.0 – US and Canada
2012
1.04
Update on HSBC North America Strategy
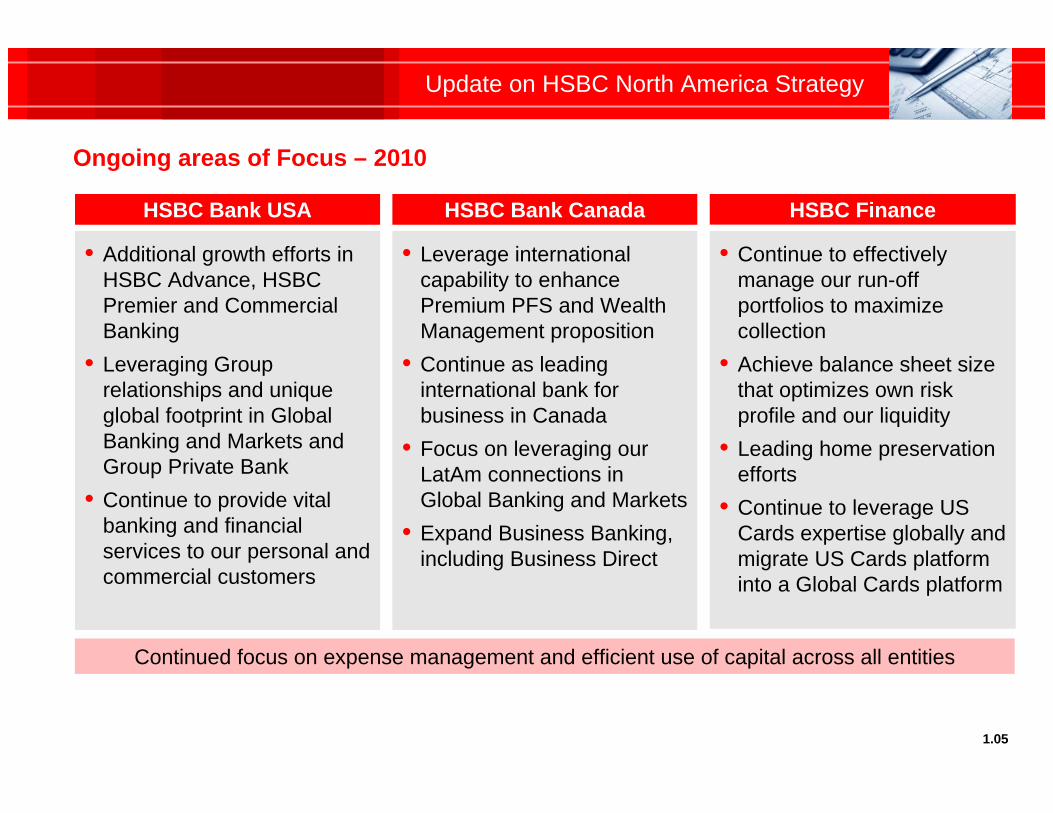
Ongoing areas of Focus – 2010
• Additional growth efforts in HSBC Advance, HSBC Premier and Commercial Banking
• Leveraging Group relationships and unique global footprint in Global Banking and Markets and Group Private Bank
• Continue to provide vital banking and financial services to our personal and commercial customers
HSBC Bank USA
• Leverage international capability to enhance Premium PFS and Wealth Management proposition
• Continue as leading international bank for business in Canada
• Focus on leveraging our LatAm connections in Global Banking and Markets
• Expand Business Banking, including Business Direct
HSBC Bank Canada
• Continue to effectively manage our run-off portfolios to maximize collection
• Achieve balance sheet size that optimizes own risk profile and our liquidity
• Leading home preservation efforts
• Continue to leverage US Cards expertise globally and migrate US Cards platform into a Global Cards platform
HSBC Finance
1.05
Continued focus on expense management and efficient use of capital across all entities
Update on HSBC North America Strategy
1.06
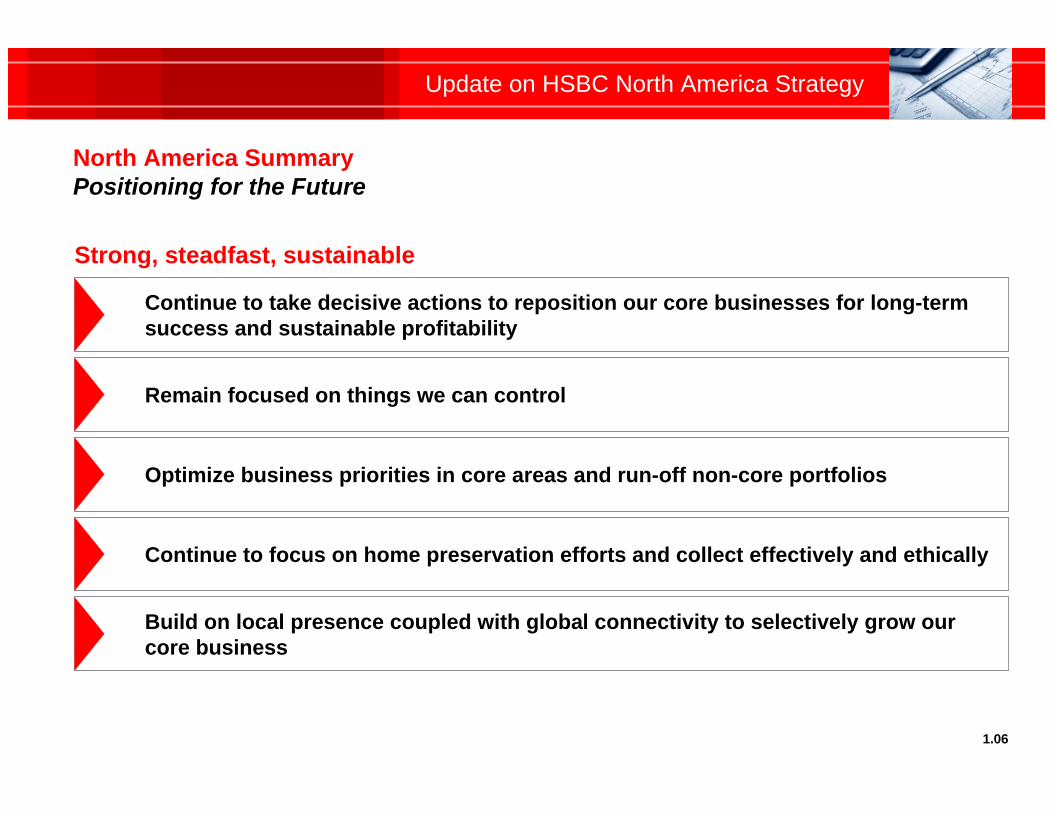
Strong, steadfast, sustainable
Build on local presence coupled with global connectivity to selectively grow our core business
Continue to focus on home preservation efforts and collect effectively and ethically
Optimize business priorities in core areas and run-off non-core portfolios
Remain focused on things we can control
Continue to take decisive actions to reposition our core businesses for long-term success and sustainable profitability
North America SummaryPositioning for the Future
Investor Presentation
HSBC USA Inc.March 8, 2010
……………………………….…...............................................
..................................................................................………………………………………………….....……………
…………………………………................................. Private Banking
Global Banking and Markets
Commercial Banking
Personal Financial Services
Business overview
Financial overview
Strategic overview
Gerard Mattia
Irene Dorner
Table of Contents
Investor Presentation
……………………………….…..............................................
Kevin Martin
Chris Davies
Tony Murphy
Marlon Young
2.00
………………………………….................................................

Strategic Overview
Irene DornerChief Executive Officer
HSBC USA Inc.
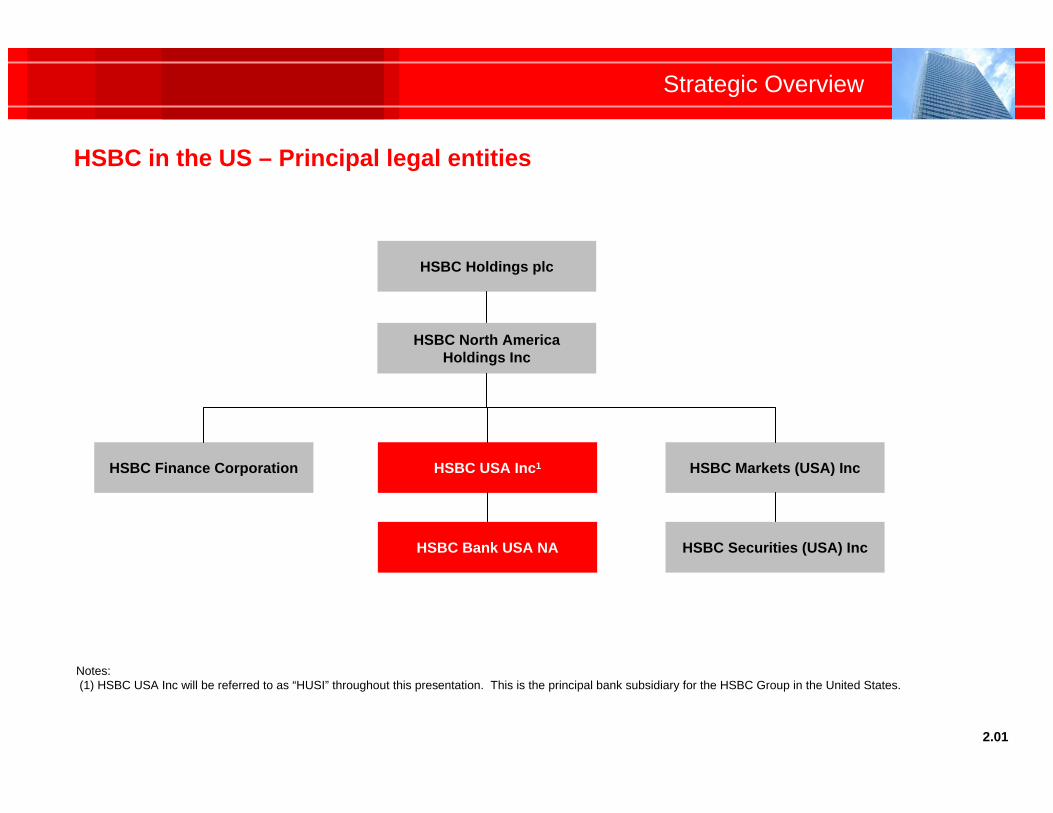
HSBC in the US – Principal legal entities
Strategic Overview
2.01
HSBC Holdings plc
HSBC North AmericaHoldings Inc
HSBC Finance Corporation HSBC USA Inc1 HSBC Markets (USA) Inc
HSBC Bank USA NA HSBC Securities (USA) Inc
Notes:(1) HSBC USA Inc will be referred to as “HUSI” throughout this presentation. This is the principal bank subsidiary for the HSBC Group in the United States.
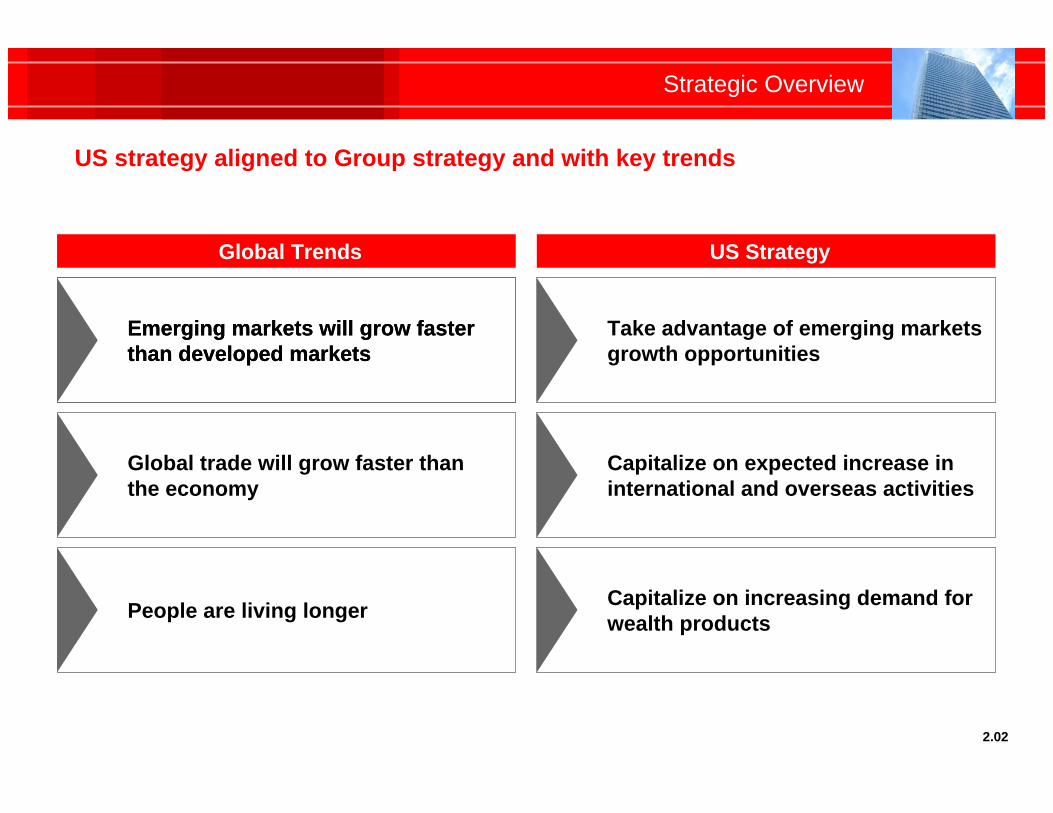
US strategy aligned to Group strategy and with key trends
Strategic Overview
Emerging markets will grow faster than developed markets
Global trade will grow faster thanthe economy
People are living longer
Take advantage of emerging markets growth opportunities
Capitalize on expected increase ininternational and overseas activities
Capitalize on increasing demand for wealth products
Global Trends US Strategy
2.02
Emerging markets will grow faster than developed markets
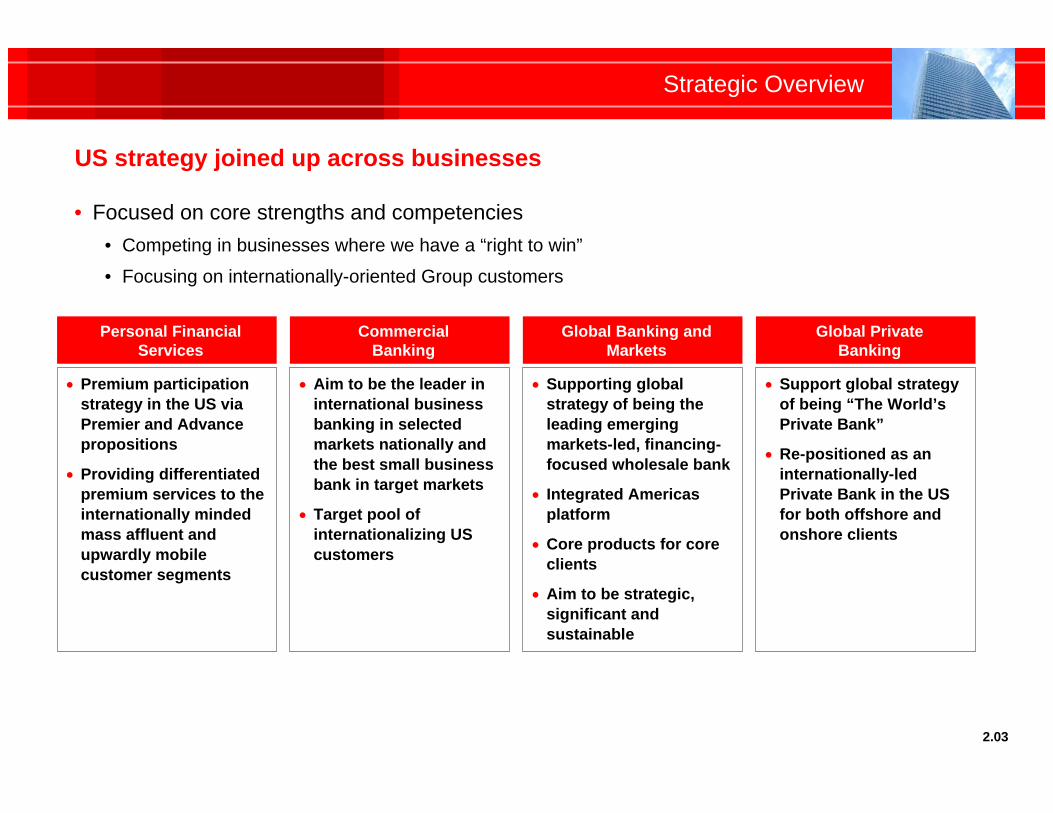
US strategy joined up across businesses
Strategic Overview
Personal Financial Services
Premium participation strategy in the US via Premier and Advance propositions
Providing differentiated premium services to the internationally minded mass affluent and upwardly mobile customer segments
CommercialBanking
Aim to be the leader in international business banking in selected markets nationally and the best small business bank in target markets
Target pool of internationalizing US customers
Global Banking andMarkets
Supporting global strategy of being the leading emerging markets-led, financing-focused wholesale bank
Integrated Americas platform
Core products for core clients
Aim to be strategic, significant and sustainable
Global PrivateBanking
Support global strategy of being “The World’s Private Bank”
Re-positioned as an internationally-led Private Bank in the US for both offshore and onshore clients
• Focused on core strengths and competencies• Competing in businesses where we have a “right to win”
• Focusing on internationally-oriented Group customers
2.03
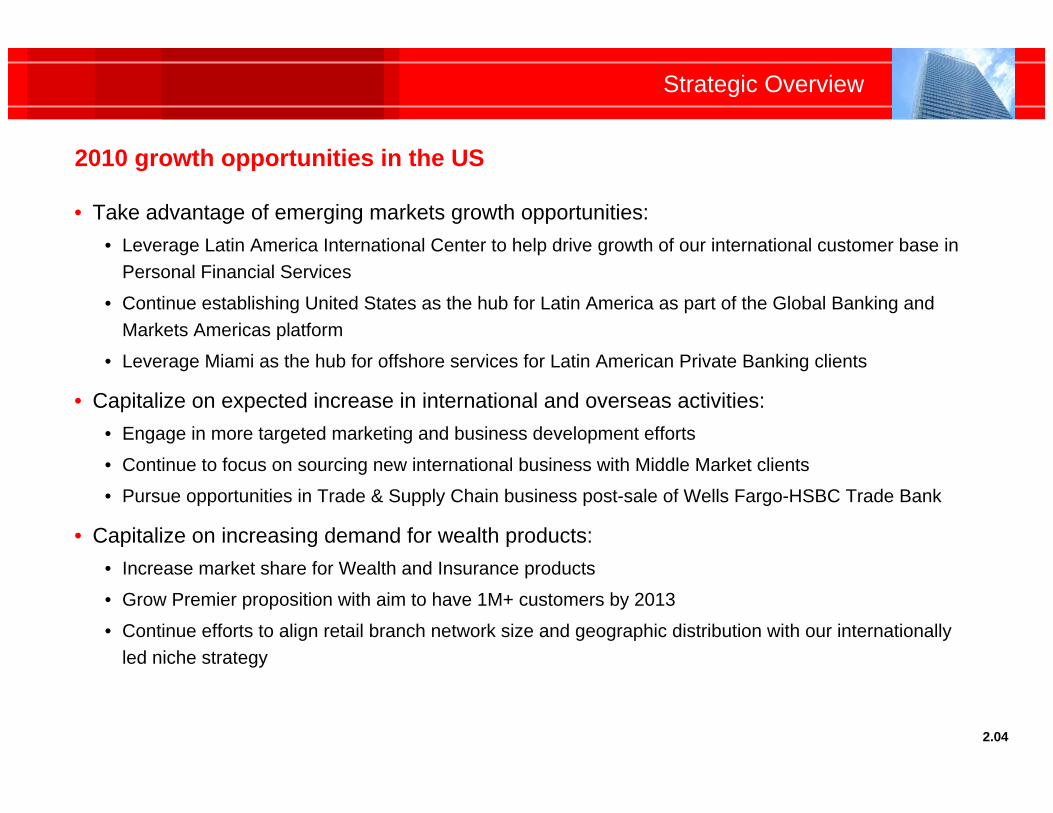
• Take advantage of emerging markets growth opportunities:• Leverage Latin America International Center to help drive growth of our international customer base in
Personal Financial Services
• Continue establishing United States as the hub for Latin America as part of the Global Banking and Markets Americas platform
• Leverage Miami as the hub for offshore services for Latin American Private Banking clients
• Capitalize on expected increase in international and overseas activities:• Engage in more targeted marketing and business development efforts
• Continue to focus on sourcing new international business with Middle Market clients
• Pursue opportunities in Trade & Supply Chain business post-sale of Wells Fargo-HSBC Trade Bank
• Capitalize on increasing demand for wealth products:• Increase market share for Wealth and Insurance products
• Grow Premier proposition with aim to have 1M+ customers by 2013
• Continue efforts to align retail branch network size and geographic distribution with our internationally led niche strategy
Strategic Overview
2.04
2010 growth opportunities in the US
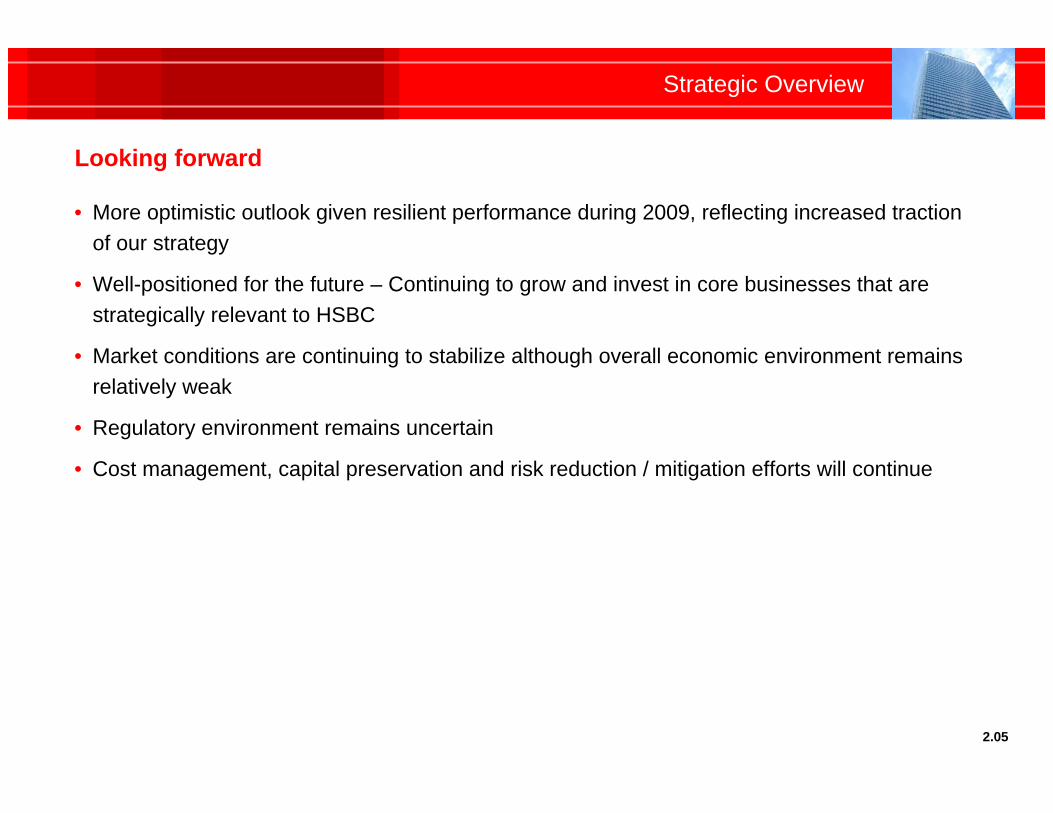
• More optimistic outlook given resilient performance during 2009, reflecting increased traction of our strategy
• Well-positioned for the future – Continuing to grow and invest in core businesses that are strategically relevant to HSBC
• Market conditions are continuing to stabilize although overall economic environment remains relatively weak
• Regulatory environment remains uncertain
• Cost management, capital preservation and risk reduction / mitigation efforts will continue
Strategic Overview
2.05
Looking forward
Financial Overview
Gerard MattiaChief Financial Officer
HSBC USA Inc.
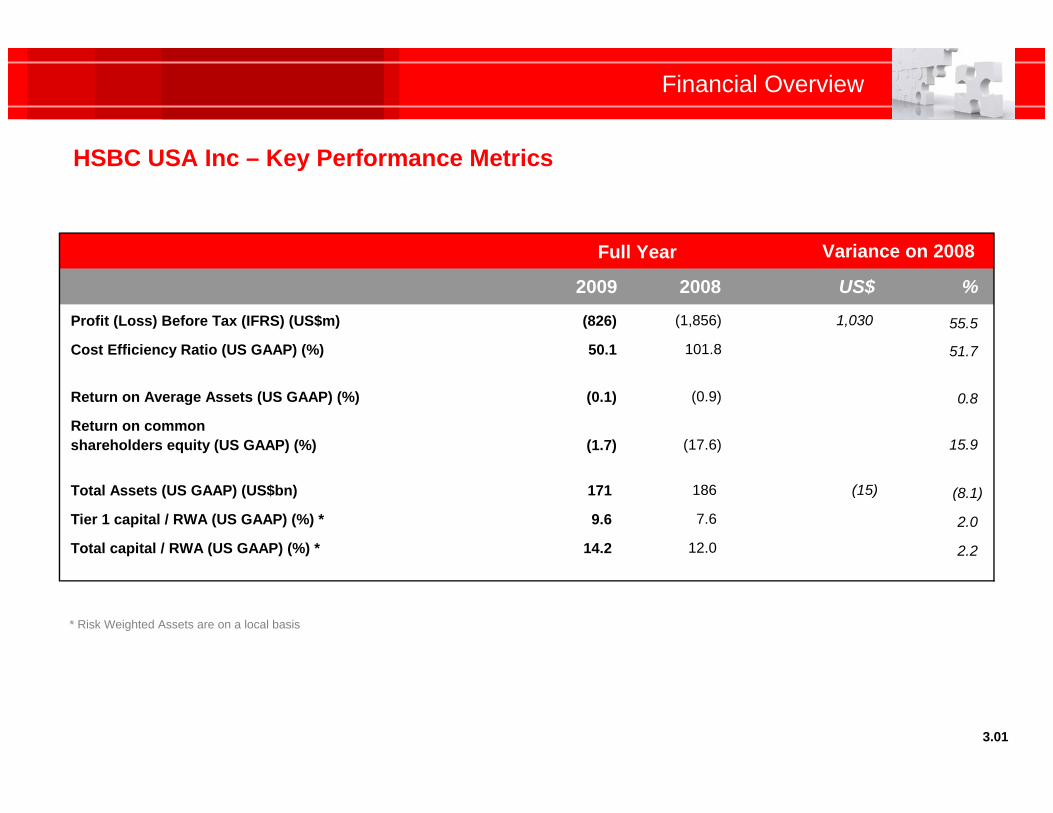
HSBC USA Inc – Key Performance Metrics
Financial Overview
3.01
2009 2008 US$ %
Profit (Loss) Before Tax (IFRS) (US$m) (826) (1,856) 1,030 55.5
Cost Efficiency Ratio (US GAAP) (%) 50.1 101.8 51.7
Return on Average Assets (US GAAP) (%) (0.1) (0.9) 0.8
Return on commonshareholders equity (US GAAP) (%) (1.7) (17.6) 15.9
Total Assets (US GAAP) (US$bn) 171 186 (15) (8.1)
Tier 1 capital / RWA (US GAAP) (%) * 9.6 7.6 2.0
Total capital / RWA (US GAAP) (%) * 14.2 12.0 2.2
Variance on 2008Full Year
* Risk Weighted Assets are on a local basis
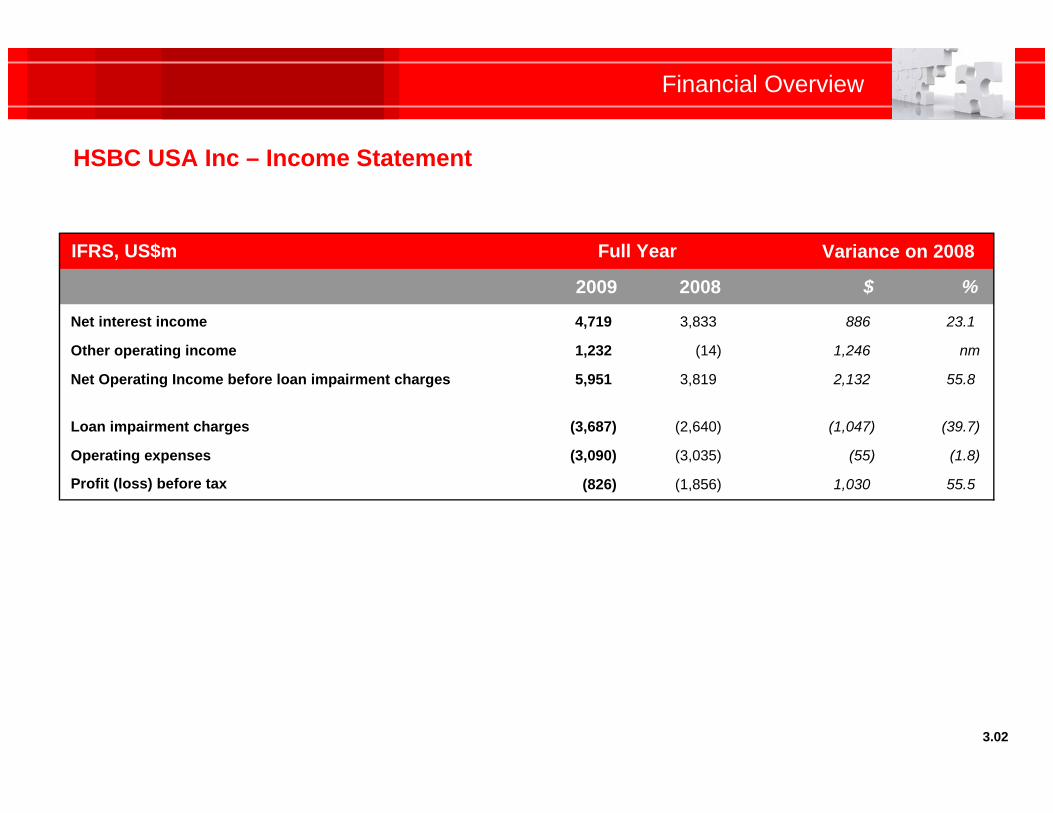
HSBC USA Inc – Income Statement
Financial Overview
3.02
IFRS, US$m
2009 2008 $ %
Net interest income 4,719 3,833 886 23.1
Other operating income 1,232 (14) 1,246 nm
Net Operating Income before loan impairment charges 5,951 3,819 2,132 55.8
Loan impairment charges (3,687) (2,640) (1,047) (39.7)
Operating expenses (3,090) (3,035) (55) (1.8)
Profit (loss) before tax (826) (1,856) 1,030 55.5
Variance on 2008Full Year
Financial Overview
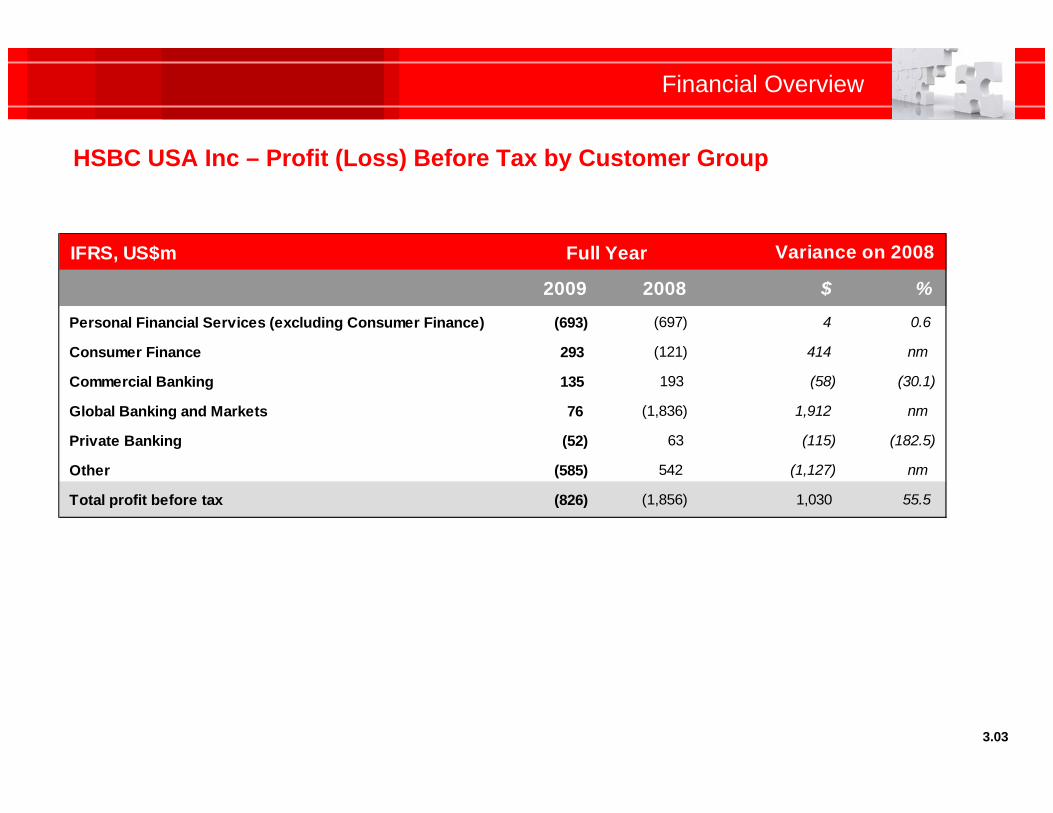
HSBC USA Inc – Profit (Loss) Before Tax by Customer Group
3.03
IFRS, US$m
2009 2008 $ %
Personal Financial Services (excluding Consumer Finance) (693) (697) 4 0.6
Consumer Finance 293 (121) 414 nm
Commercial Banking 135 193 (58) (30.1)
Global Banking and Markets 76 (1,836) 1,912 nm
Private Banking (52) 63 (115) (182.5)
Other (585) 542 (1,127) nm
Total profit before tax (826) (1,856) 1,030 55.5
Full Year Variance on 2008
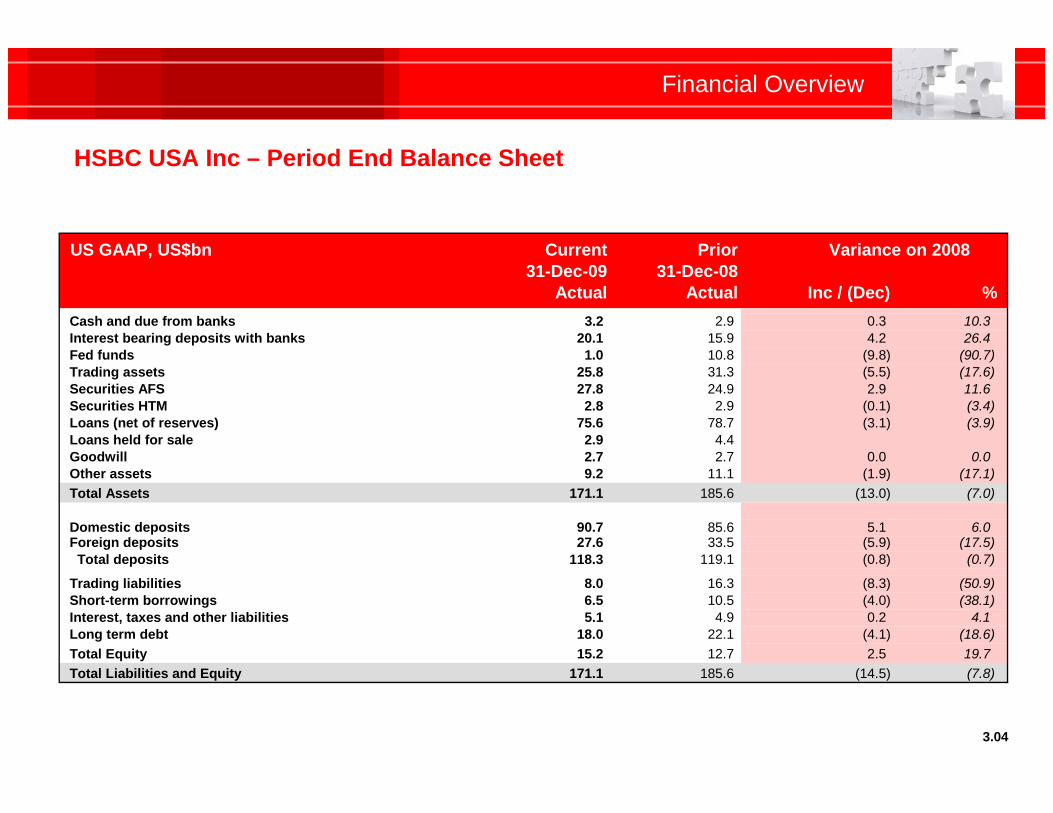
HSBC USA Inc – Period End Balance Sheet
Financial Overview
3.04
US GAAP, US$bn Current Prior31-Dec-09 31-Dec-08
Actual Actual Inc / (Dec) %Cash and due from banks 3.2 2.9 0.3 10.3Interest bearing deposits with banks 20.1 15.9 4.2 26.4Fed funds 1.0 10.8 (9.8) (90.7)Trading assets 25.8 31.3 (5.5) (17.6)Securities AFS 27.8 24.9 2.9 11.6Securities HTM 2.8 2.9 (0.1) (3.4)Loans (net of reserves) 75.6 78.7 (3.1) (3.9)Loans held for sale 2.9 4.4Goodwill 2.7 2.7 0.0 0.0Other assets 9.2 11.1 (1.9) (17.1)Total Assets 171.1 185.6 (13.0) (7.0)
Domestic deposits 90.7 85.6 5.1 6.0Foreign deposits 27.6 33.5 (5.9) (17.5) Total deposits 118.3 119.1 (0.8) (0.7)
Trading liabilities 8.0 16.3 (8.3) (50.9)Short-term borrowings 6.5 10.5 (4.0) (38.1)Interest, taxes and other liabilities 5.1 4.9 0.2 4.1Long term debt 18.0 22.1 (4.1) (18.6)Total Equity 15.2 12.7 2.5 19.7Total Liabilities and Equity 171.1 185.6 (14.5) (7.8)
Variance on 2008
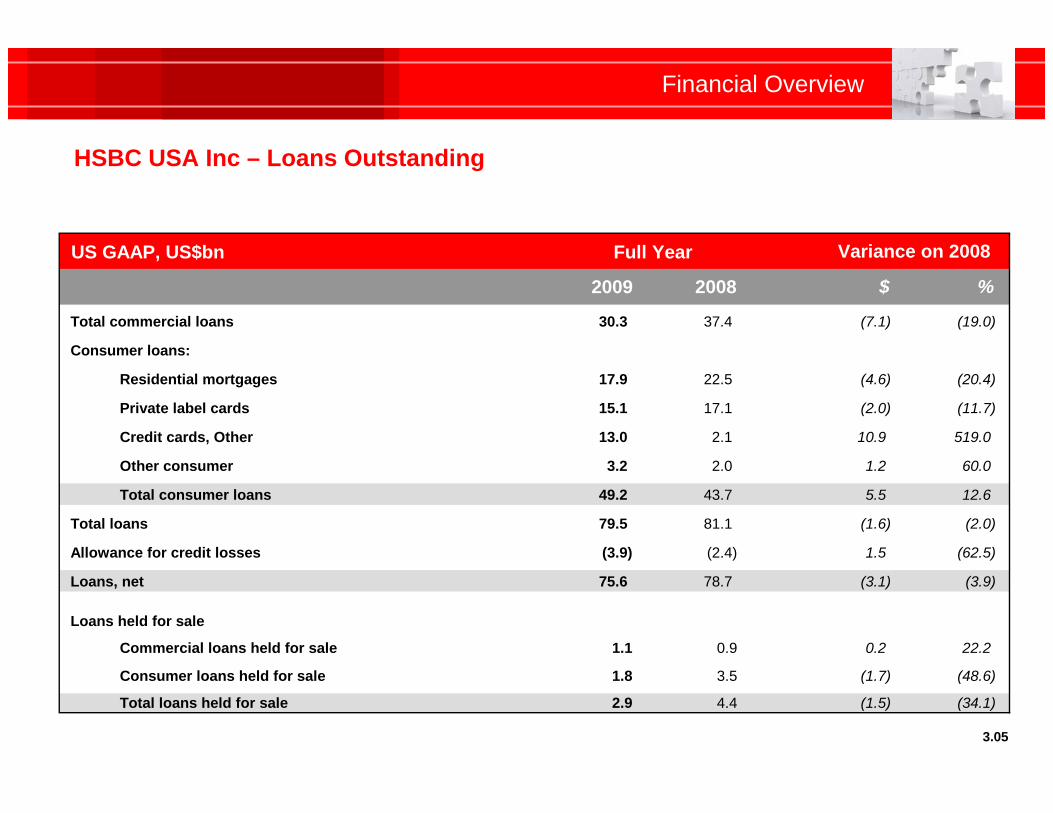
HSBC USA Inc – Loans Outstanding
Financial Overview
3.05
US GAAP, US$bn
2009 2008 $ %
Total commercial loans 30.3 37.4 (7.1) (19.0)
Consumer loans:
Residential mortgages 17.9 22.5 (4.6) (20.4)
Private label cards 15.1 17.1 (2.0) (11.7)
Credit cards, Other 13.0 2.1 10.9 519.0
Other consumer 3.2 2.0 1.2 60.0
Total consumer loans 49.2 43.7 5.5 12.6
Total loans 79.5 81.1 (1.6) (2.0)
Allowance for credit losses (3.9) (2.4) 1.5 (62.5)
Loans, net 75.6 78.7 (3.1) (3.9)
Loans held for sale
Commercial loans held for sale 1.1 0.9 0.2 22.2
Consumer loans held for sale 1.8 3.5 (1.7) (48.6)
Total loans held for sale 2.9 4.4 (1.5) (34.1)
Full Year Variance on 2008
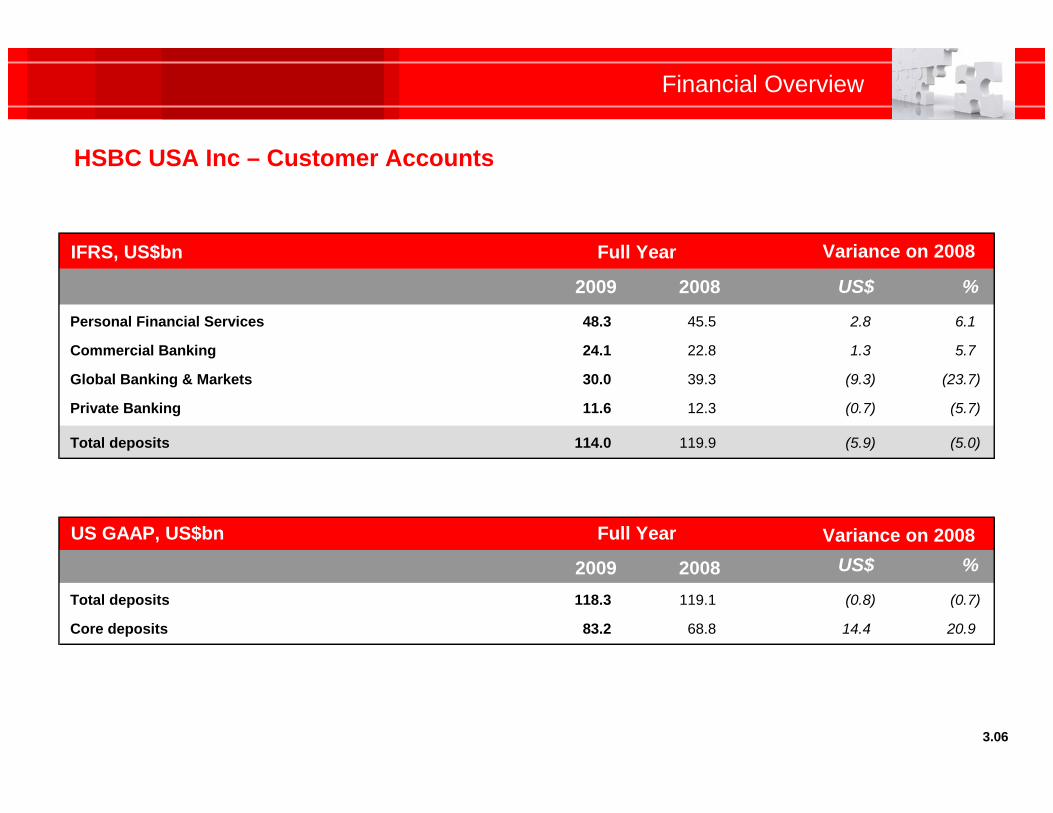
HSBC USA Inc – Customer Accounts
Financial Overview
3.06
IFRS, US$bn
2009 2008 US$ %
Personal Financial Services 48.3 45.5 2.8 6.1
Commercial Banking 24.1 22.8 1.3 5.7
Global Banking & Markets 30.0 39.3 (9.3) (23.7)
Private Banking 11.6 12.3 (0.7) (5.7)
Total deposits 114.0 119.9 (5.9) (5.0)
US GAAP, US$bn
2009 2008 US$ %
Total deposits 118.3 119.1 (0.8) (0.7)
Core deposits 83.2 68.8 14.4 20.9
Full Year Variance on 2008
Full Year Variance on 2008
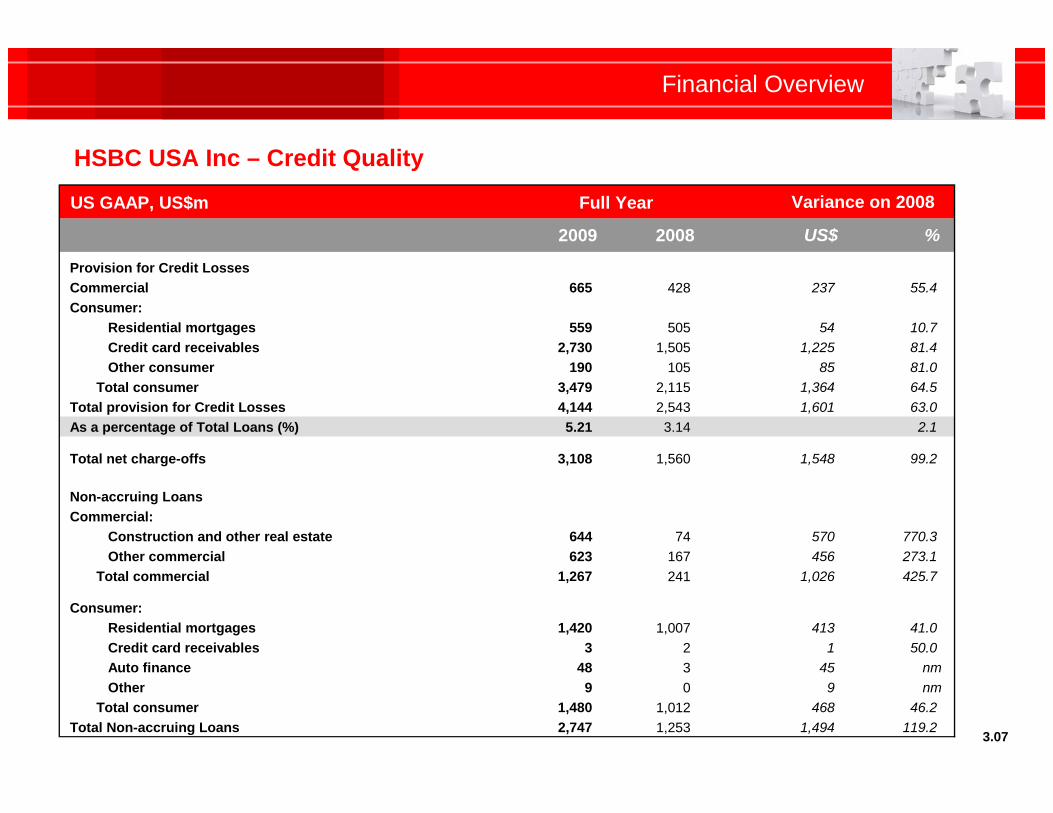
HSBC USA Inc – Credit Quality
Financial Overview
3.07
US GAAP, US$m
2009 2008 US$ %
Provision for Credit LossesCommercial 665 428 237 55.4Consumer:
Residential mortgages 559 505 54 10.7 Credit card receivables 2,730 1,505 1,225 81.4 Other consumer 190 105 85 81.0Total consumer 3,479 2,115 1,364 64.5
Total provision for Credit Losses 4,144 2,543 1,601 63.0As a percentage of Total Loans (%) 5.21 3.14 2.1
Total net charge-offs 3,108 1,560 1,548 99.2
Non-accruing LoansCommercial:
Construction and other real estate 644 74 570 770.3 Other commercial 623 167 456 273.1Total commercial 1,267 241 1,026 425.7
Consumer: Residential mortgages 1,420 1,007 413 41.0 Credit card receivables 3 2 1 50.0 Auto finance 48 3 45 nm Other 9 0 9 nmTotal consumer 1,480 1,012 468 46.2
Total Non-accruing Loans 2,747 1,253 1,494 119.2
Full Year Variance on 2008
Business Overview
Personal Financial Services
Kevin MartinSenior Executive Vice President
Personal Financial Services
Business Overview
Personal Financial ServicesPremium participation strategy
• Leverage global scale and local distribution and capabilities to grow profitably in selected markets
• Competing where we have a “right to win”• Customer segments which have strong international connectivity
• Product families where global scale is critical and we have it
• Launch of Advance customer proposition in 2H 2010 targeted to internationally-oriented upwardly mobile segment. HSBC Direct re-branded to HSBC Advance as of January 31, 2010
• Network transformation continues with focus on Premium Bank strategy
• Implementation in the US:• Wealth Management-led banking targeted to internationally-oriented mass affluent, emerging affluent and
niche segments
• Direct banking
4.01
Business Overview
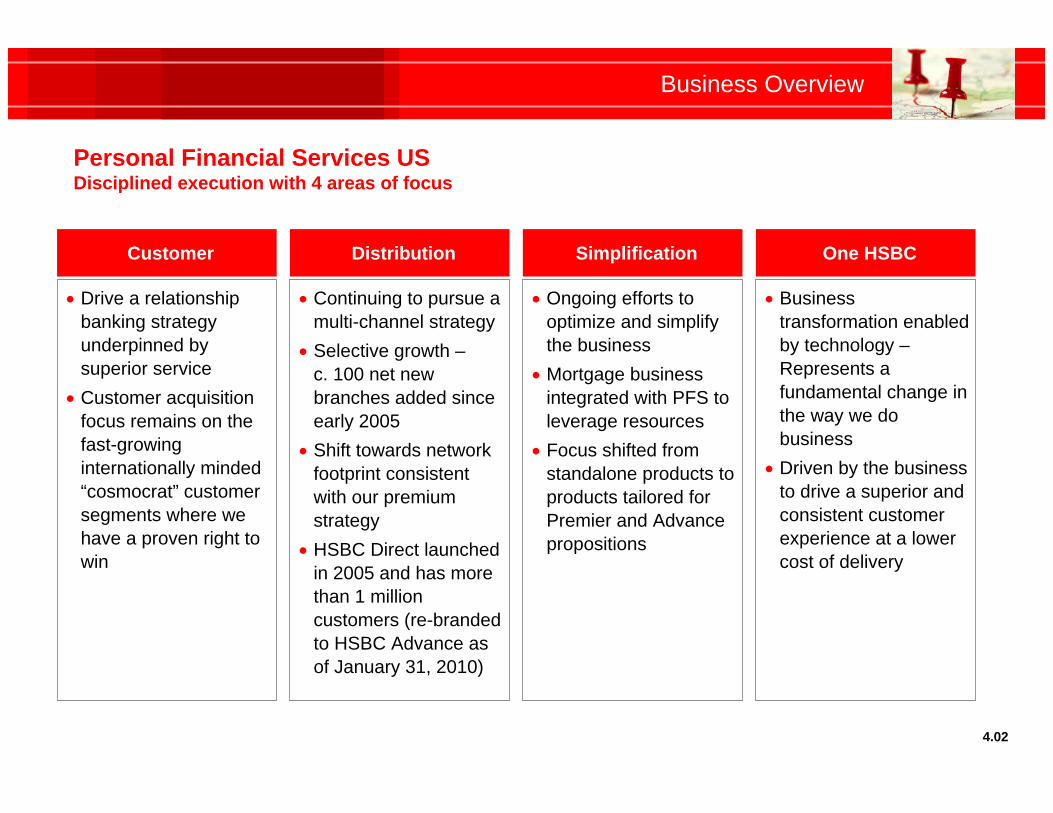
Personal Financial Services USDisciplined execution with 4 areas of focus
4.02
Customer
Drive a relationship banking strategy underpinned by superior service
Customer acquisition focus remains on the fast-growing internationally minded “cosmocrat” customer segments where we have a proven right to win
Distribution
Continuing to pursue a multi-channel strategy
Selective growth –c. 100 net new branches added since early 2005
Shift towards network footprint consistent with our premium strategy
HSBC Direct launched in 2005 and has more than 1 million customers (re-branded to HSBC Advance as of January 31, 2010)
Simplification
Ongoing efforts to optimize and simplify the business
Mortgage business integrated with PFS to leverage resources
Focus shifted from standalone products to products tailored for Premier and Advance propositions
One HSBC
Business transformation enabled by technology –Represents a fundamental change in the way we do business
Driven by the business to drive a superior and consistent customer experience at a lower cost of delivery
Business Overview
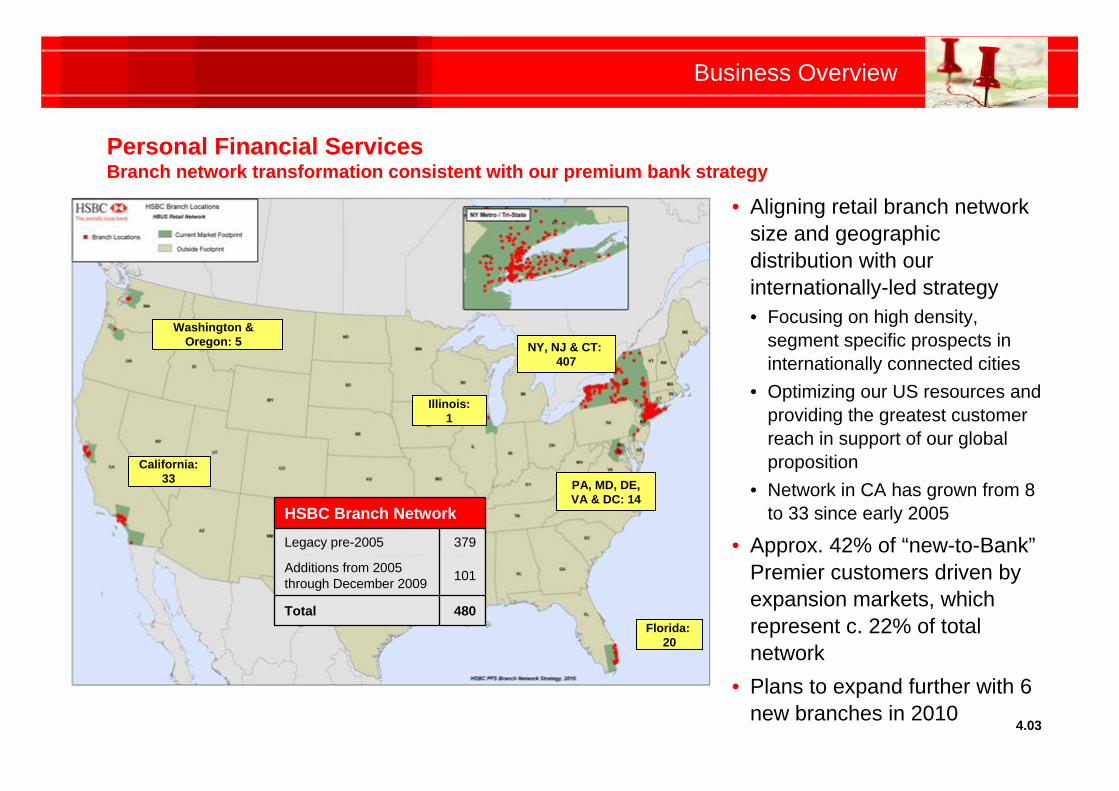
Personal Financial ServicesBranch network transformation consistent with our premium bank strategy
4.03
Washington & Oregon: 5
California:33
Illinois:1
NY, NJ & CT: 407
Florida: 20
480Total
101Additions from 2005 through December 2009
379Legacy pre-2005
HSBC Branch Network
PA, MD, DE,VA & DC: 14
• Aligning retail branch network size and geographic distribution with our internationally-led strategy• Focusing on high density,
segment specific prospects in internationally connected cities
• Optimizing our US resources and providing the greatest customer reach in support of our global proposition
• Network in CA has grown from 8 to 33 since early 2005
• Approx. 42% of “new-to-Bank”Premier customers driven by expansion markets, which represent c. 22% of total network
• Plans to expand further with 6 new branches in 2010
Business Overview
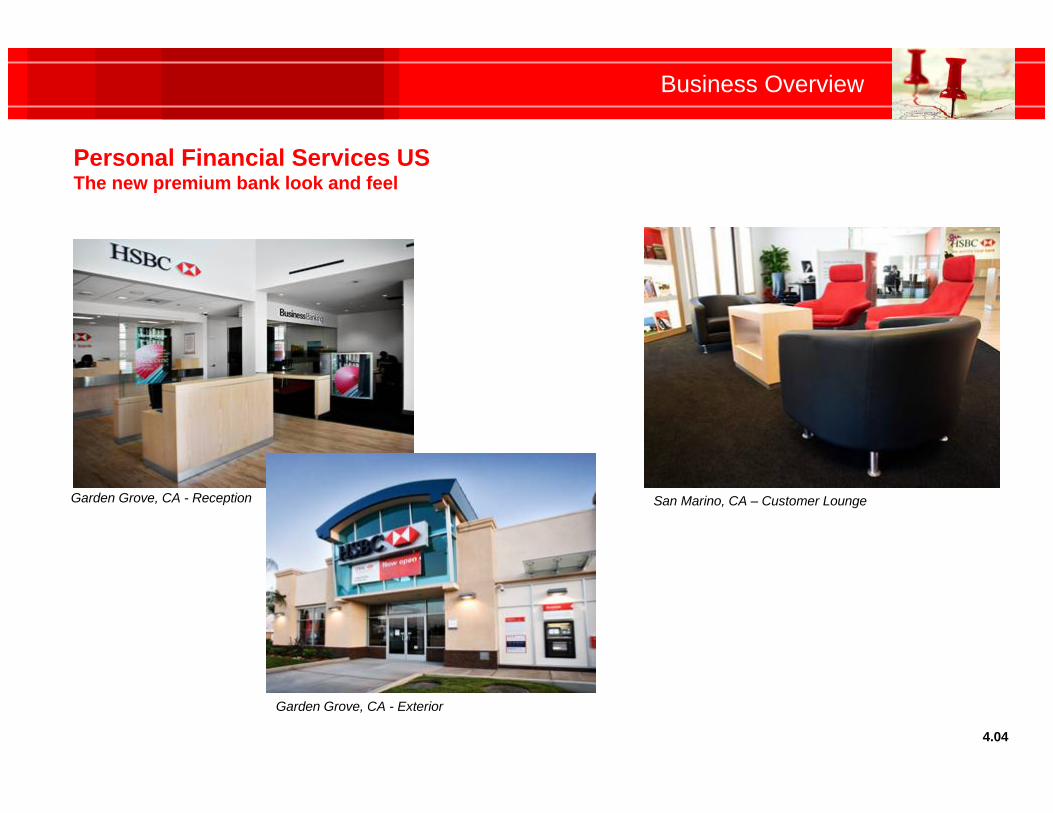
Personal Financial Services USThe new premium bank look and feel
Garden Grove, CA - Reception
Garden Grove, CA - Exterior
San Marino, CA – Customer Lounge
4.04
Business Overview
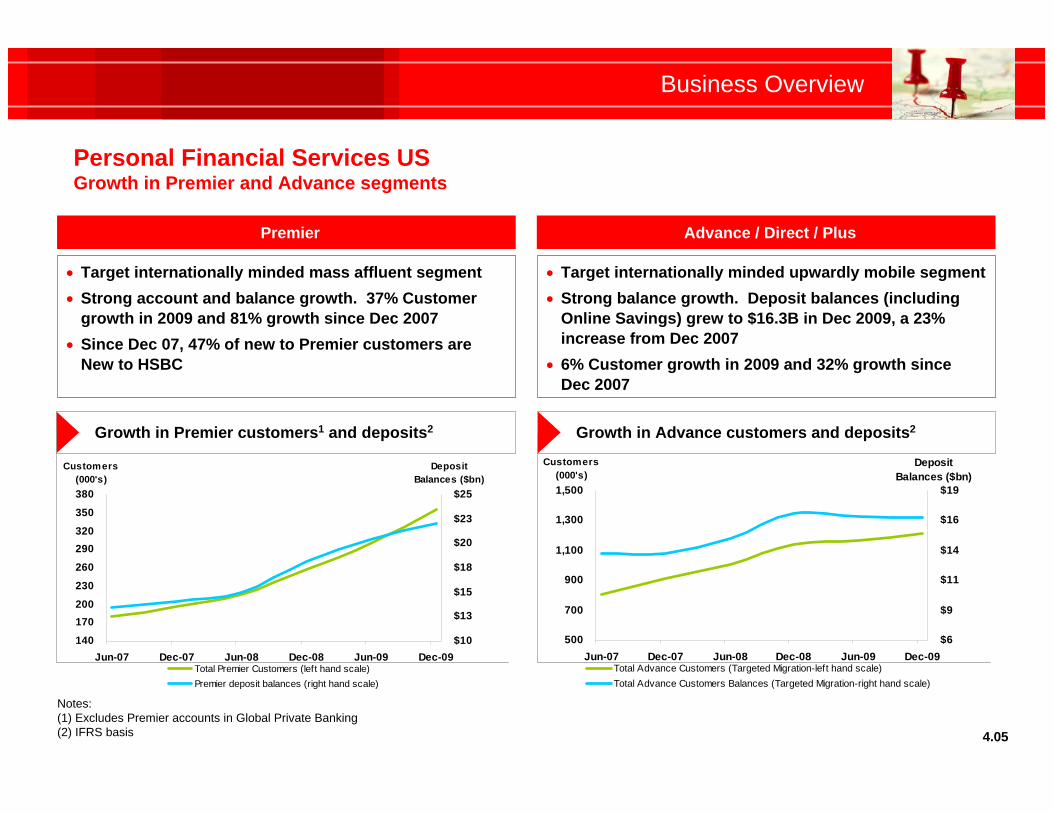
Personal Financial Services USGrowth in Premier and Advance segments
4.05
500
700
900
1,100
1,300
1,500
Jun-07 Dec-07 Jun-08 Dec-08 Jun-09 Dec-09
Customers(000's)
$6
$9
$11
$14
$16
$19
Deposit Balances ($bn)
Total Advance Customers (Targeted Migration-left hand scale)Total Advance Customers Balances (Targeted Migration-right hand scale)
140
170200
230
260
290320
350
380
Jun-07 Dec-07 Jun-08 Dec-08 Jun-09 Dec-09
Customers(000's)
$10
$13
$15
$18
$20
$23
$25
Deposit Balances ($bn)
Total Premier Customers (left hand scale)Premier deposit balances (right hand scale)
Target internationally minded mass affluent segment Strong account and balance growth. 37% Customer
growth in 2009 and 81% growth since Dec 2007 Since Dec 07, 47% of new to Premier customers are
New to HSBC
Target internationally minded upwardly mobile segment Strong balance growth. Deposit balances (including
Online Savings) grew to $16.3B in Dec 2009, a 23% increase from Dec 2007
6% Customer growth in 2009 and 32% growth sinceDec 2007
Growth in Premier customers1 and deposits2 Growth in Advance customers and deposits2
Notes:(1) Excludes Premier accounts in Global Private Banking (2) IFRS basis
Premier Advance / Direct / Plus
Commercial Banking
Chris DaviesSenior Executive Vice President
Head of Commercial Banking, North America
Business Overview
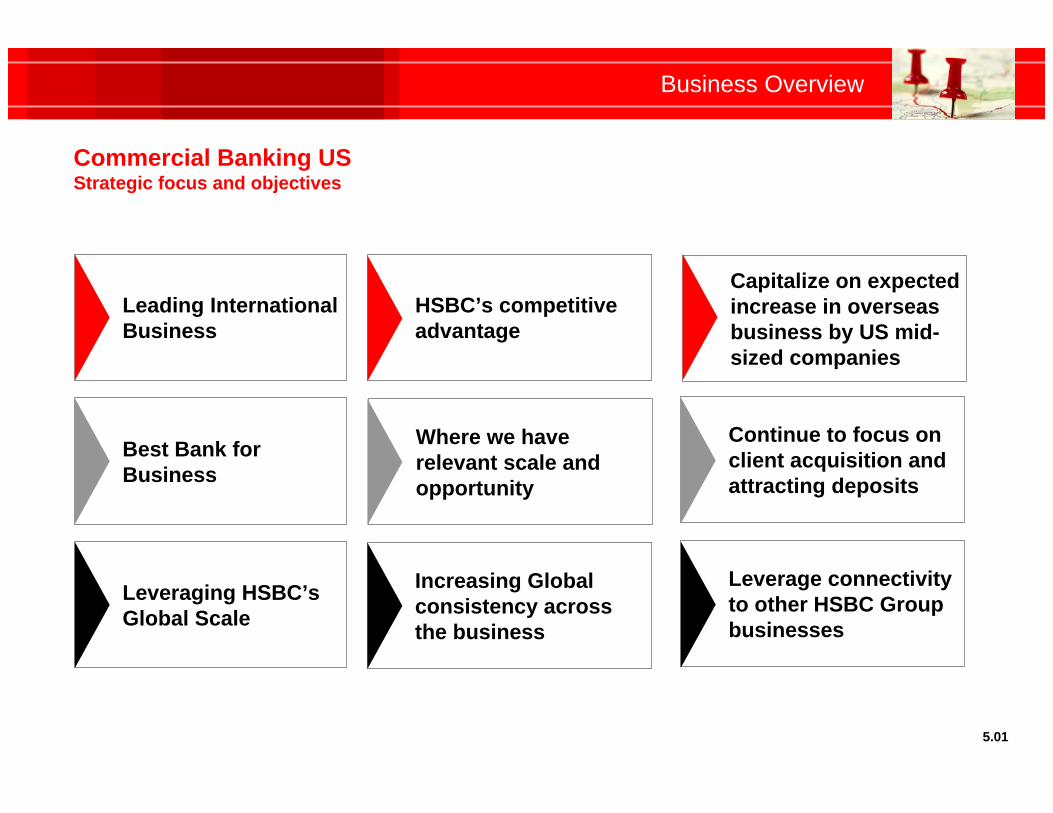
Commercial Banking USStrategic focus and objectives
5.01
Leveraging HSBC’s Global Scale
Leading International Business
Best Bank for Business
Increasing Global consistency across the business
HSBC’s competitive advantage
Where we have relevant scale and opportunity
Capitalize on expected increase in overseas business by US mid-sized companies
Leverage connectivity to other HSBC Group businesses
Continue to focus on client acquisition and attracting deposits
Business Overview
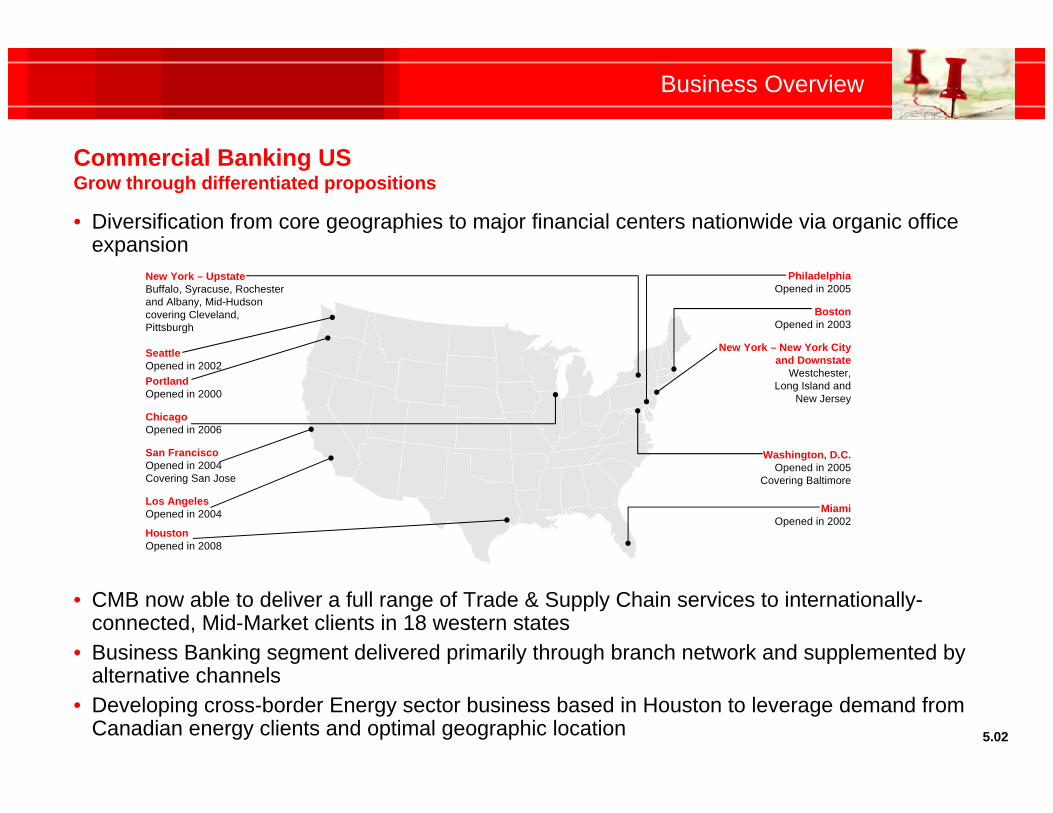
Commercial Banking USGrow through differentiated propositions
5.02
• Diversification from core geographies to major financial centers nationwide via organic office expansion
• CMB now able to deliver a full range of Trade & Supply Chain services to internationally-connected, Mid-Market clients in 18 western states
• Business Banking segment delivered primarily through branch network and supplemented by alternative channels
• Developing cross-border Energy sector business based in Houston to leverage demand from Canadian energy clients and optimal geographic location
PhiladelphiaOpened in 2005
BostonOpened in 2003
New York – New York Cityand Downstate
Westchester,Long Island and
New Jersey
Washington, D.C. Opened in 2005
Covering Baltimore
MiamiOpened in 2002
New York – UpstateBuffalo, Syracuse, Rochester and Albany, Mid-Hudson covering Cleveland, Pittsburgh
SeattleOpened in 2002PortlandOpened in 2000
ChicagoOpened in 2006
San FranciscoOpened in 2004 Covering San Jose
Los Angeles Opened in 2004
HoustonOpened in 2008
Business Overview
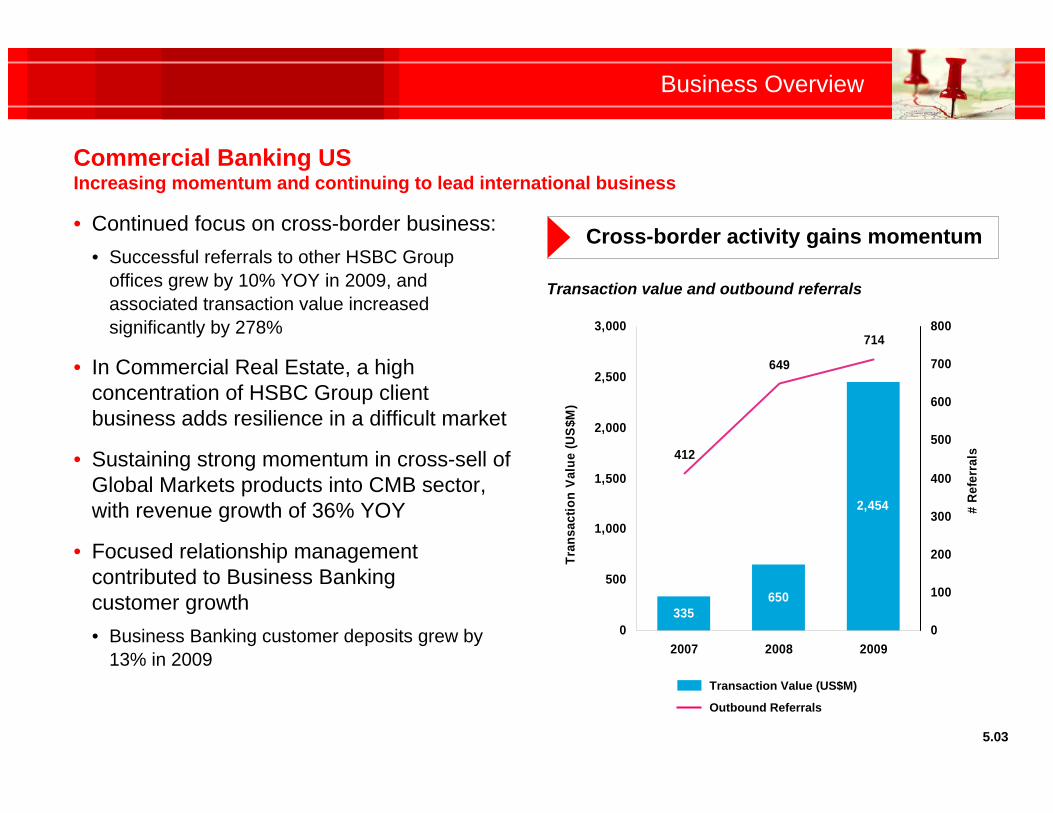
Commercial Banking USIncreasing momentum and continuing to lead international business
5.03
• Continued focus on cross-border business:• Successful referrals to other HSBC Group
offices grew by 10% YOY in 2009, and associated transaction value increased significantly by 278%
• In Commercial Real Estate, a high concentration of HSBC Group client business adds resilience in a difficult market
• Sustaining strong momentum in cross-sell of Global Markets products into CMB sector, with revenue growth of 36% YOY
• Focused relationship management contributed to Business Bankingcustomer growth• Business Banking customer deposits grew by
13% in 2009
650
2,454
335
412
649
714
0
500
1,000
1,500
2,000
2,500
3,000
2007 2008 2009
Tran
sact
ion
Valu
e (U
S$M
)
0
100
200
300
400
500
600
700
800
# Re
ferr
als
Transaction value and outbound referrals
Cross-border activity gains momentum
Outbound Referrals
Transaction Value (US$M)
Business Overview
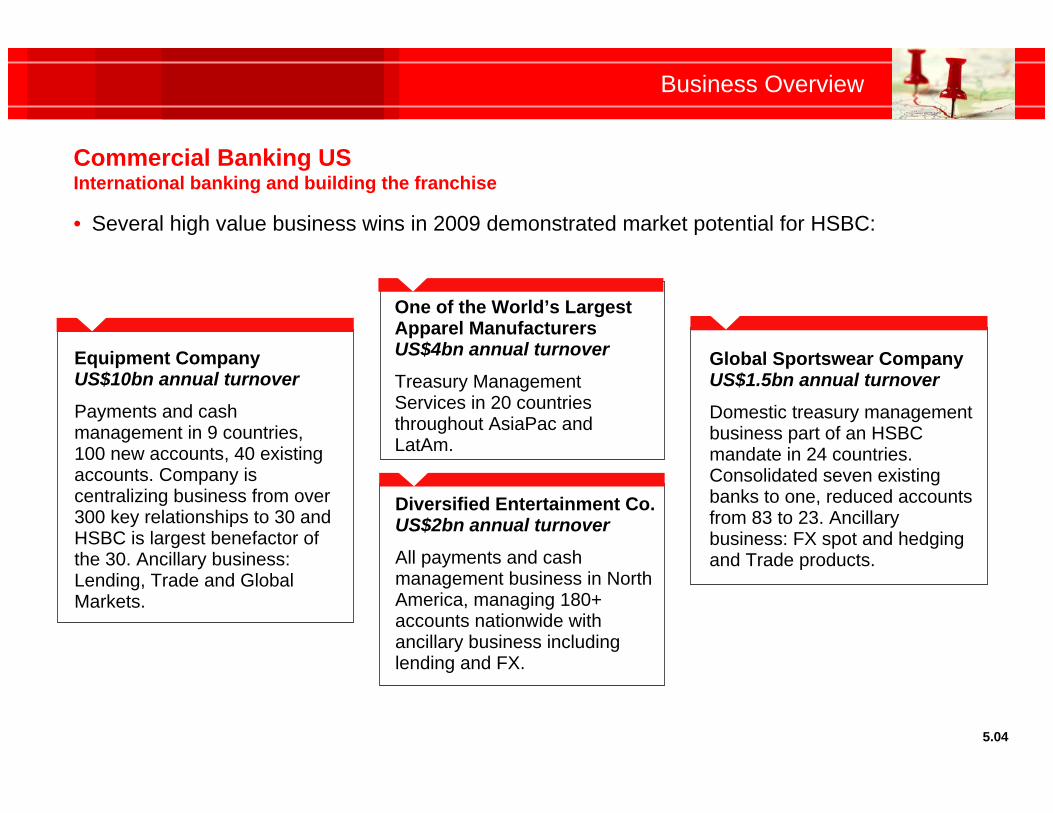
Commercial Banking USInternational banking and building the franchise
5.04
• Several high value business wins in 2009 demonstrated market potential for HSBC:
Global Sportswear Company US$1.5bn annual turnover
Domestic treasury management business part of an HSBC mandate in 24 countries. Consolidated seven existing banks to one, reduced accounts from 83 to 23. Ancillary business: FX spot and hedging and Trade products.
One of the World’s Largest Apparel Manufacturers US$4bn annual turnover
Treasury Management Services in 20 countries throughout AsiaPac and LatAm.
Diversified Entertainment Co. US$2bn annual turnover
All payments and cash management business in North America, managing 180+ accounts nationwide with ancillary business including lending and FX.
Equipment Company US$10bn annual turnover
Payments and cash management in 9 countries, 100 new accounts, 40 existing accounts. Company is centralizing business from over 300 key relationships to 30 and HSBC is largest benefactor of the 30. Ancillary business: Lending, Trade and Global Markets.
Business Overview
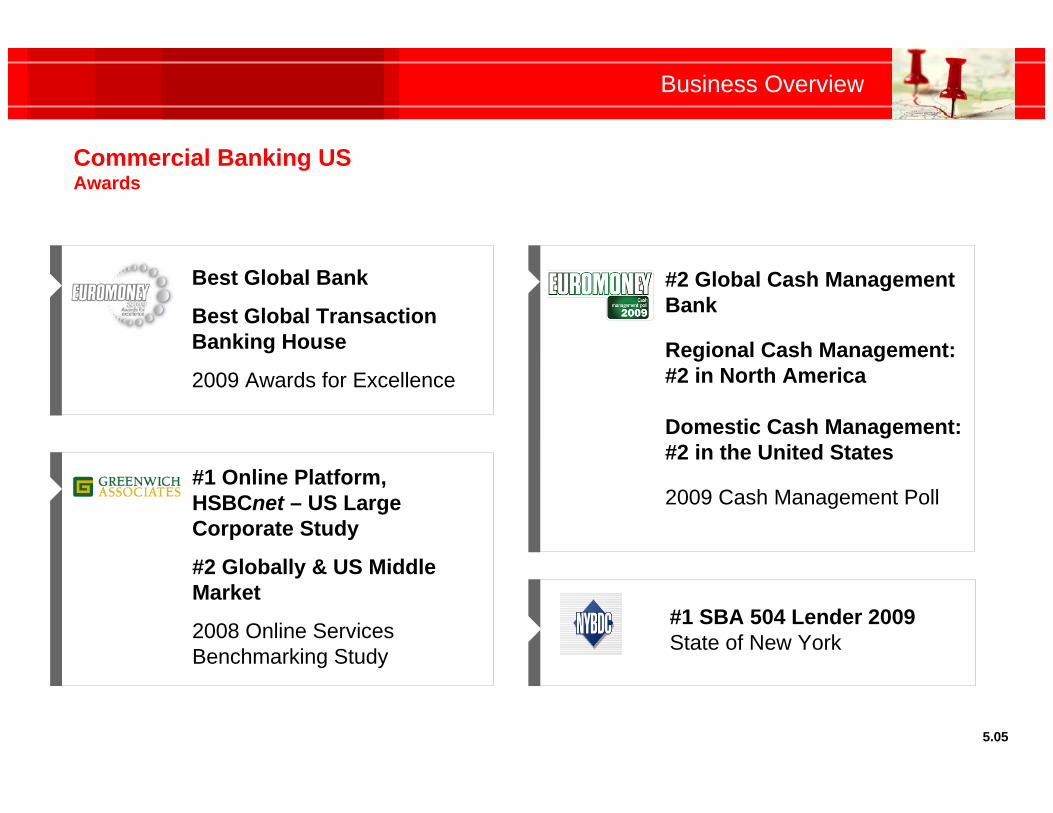
Commercial Banking USAwards
5.05
#1 Online Platform, HSBCnet – US Large Corporate Study
#2 Globally & US Middle Market
2008 Online Services Benchmarking Study
Best Global Bank
Best Global TransactionBanking House
2009 Awards for Excellence
#2 Global Cash Management Bank
Regional Cash Management:#2 in North America
Domestic Cash Management:#2 in the United States
2009 Cash Management Poll
#1 SBA 504 Lender 2009State of New York

Global Banking and Markets
Tony MurphyChief Executive Officer
Global Banking and Markets Americas
Business Overview
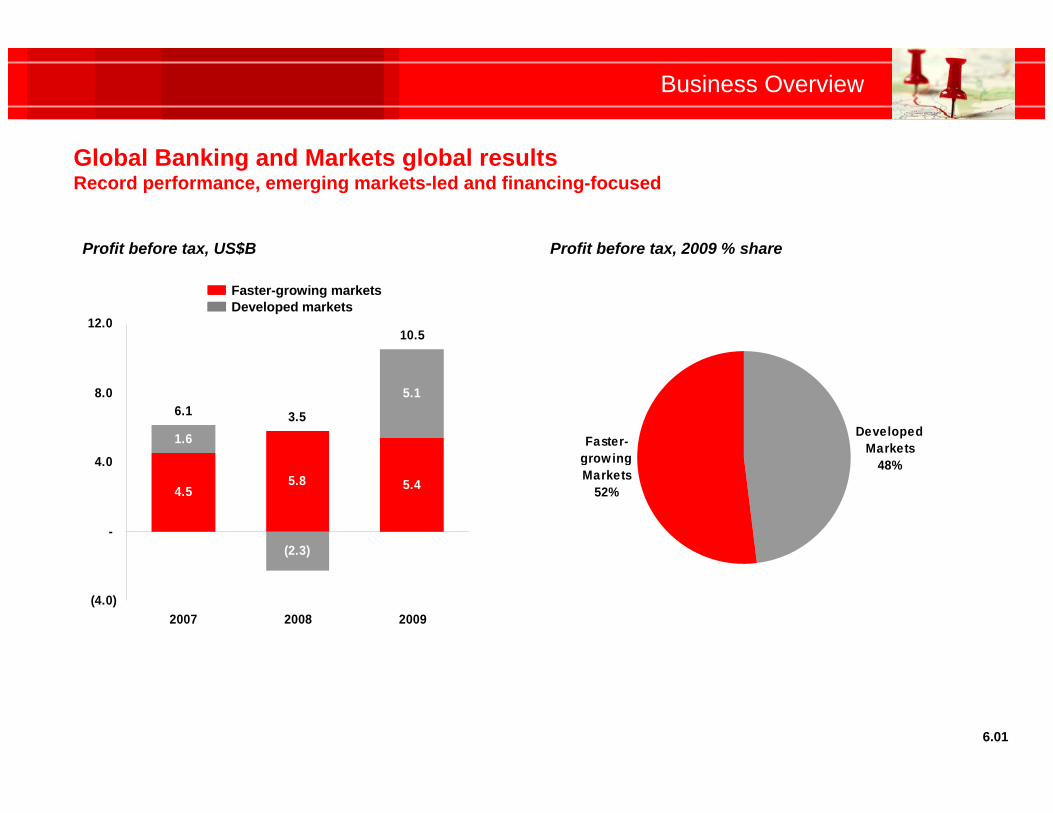
Global Banking and Markets global resultsRecord performance, emerging markets-led and financing-focused
6.01
5.8 5.4
1.6
(2.3)
5.1
10.5
4.5
3.56.1
(4.0)
-
4.0
8.0
12.0
2007 2008 2009
Profit before tax, US$B
Developed Markets
48%
Faster-growing Markets
52%
Profit before tax, 2009 % share
Faster-growing marketsDeveloped markets
Business Overview
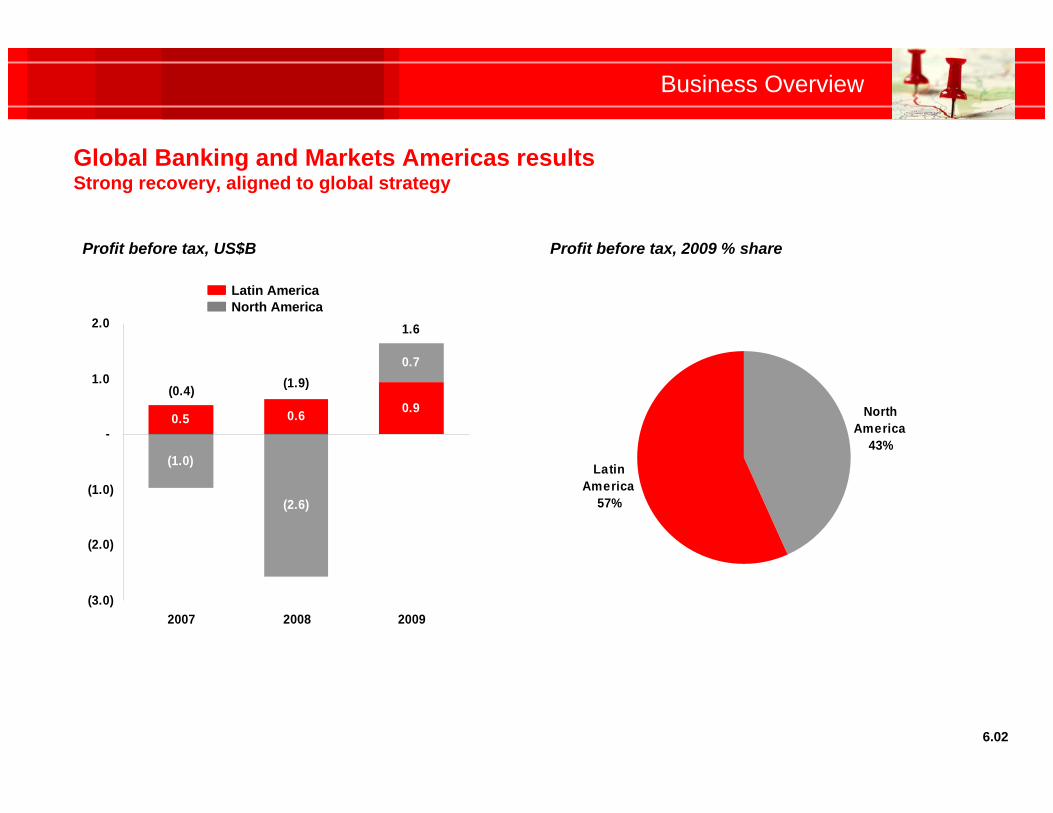
6.02
0.5 0.6 0.9
(1.0)
(2.6)
0.7
1.6
(0.4) (1.9)
(3.0)
(2.0)
(1.0)
-
1.0
2.0
2007 2008 2009
Profit before tax, US$B
North America
43%
Latin America
57%
Profit before tax, 2009 % share
Global Banking and Markets Americas resultsStrong recovery, aligned to global strategy
Latin AmericaNorth America
Business Overview
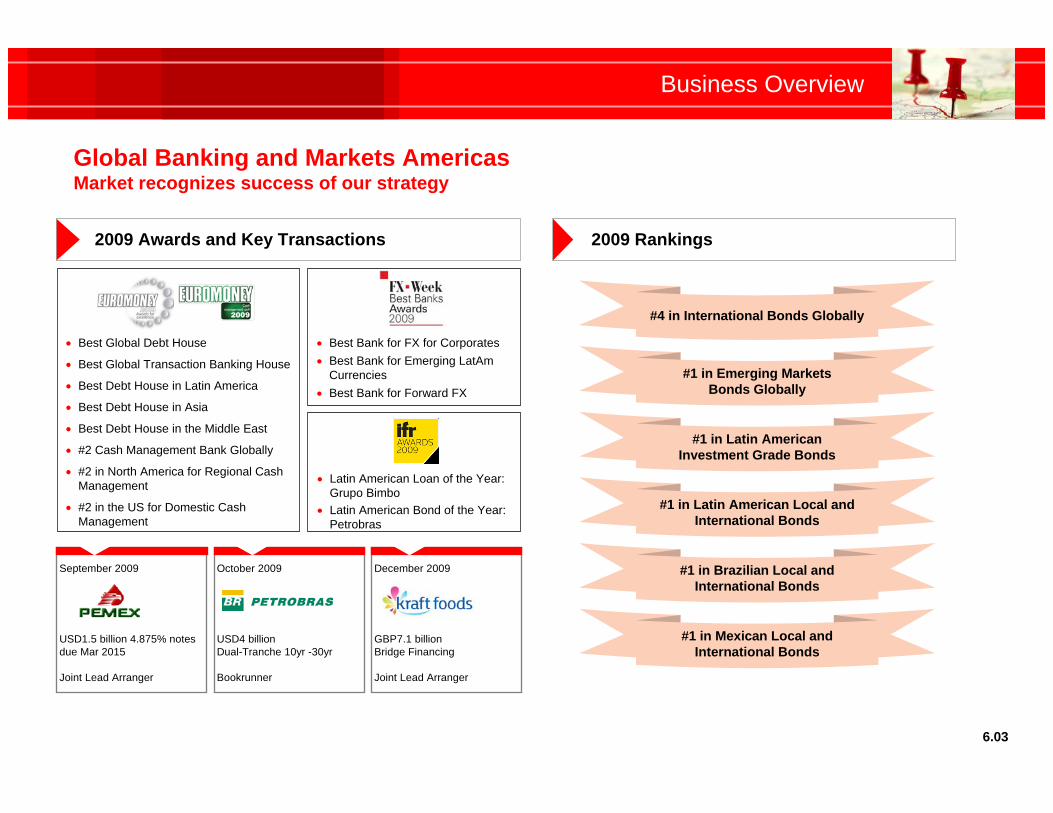
Global Banking and Markets AmericasMarket recognizes success of our strategy
6.03
2009 Awards and Key Transactions 2009 Rankings
#1 in Emerging MarketsBonds Globally
#1 in Latin AmericanInvestment Grade Bonds
#1 in Latin American Local and International Bonds
#1 in Brazilian Local and International Bonds
Best Global Debt House
Best Global Transaction Banking House
Best Debt House in Latin America
Best Debt House in Asia
Best Debt House in the Middle East
#2 Cash Management Bank Globally
#2 in North America for Regional Cash Management
#2 in the US for Domestic Cash Management
Best Bank for FX for Corporates Best Bank for Emerging LatAm
Currencies Best Bank for Forward FX
Latin American Loan of the Year: Grupo Bimbo
Latin American Bond of the Year: Petrobras
#1 in Mexican Local and International Bonds
#4 in International Bonds Globally
December 2009
GBP7.1 billionBridge Financing
Joint Lead Arranger
October 2009
USD4 billionDual-Tranche 10yr -30yr
Bookrunner
September 2009
USD1.5 billion 4.875% notes due Mar 2015
Joint Lead Arranger
Business Overview
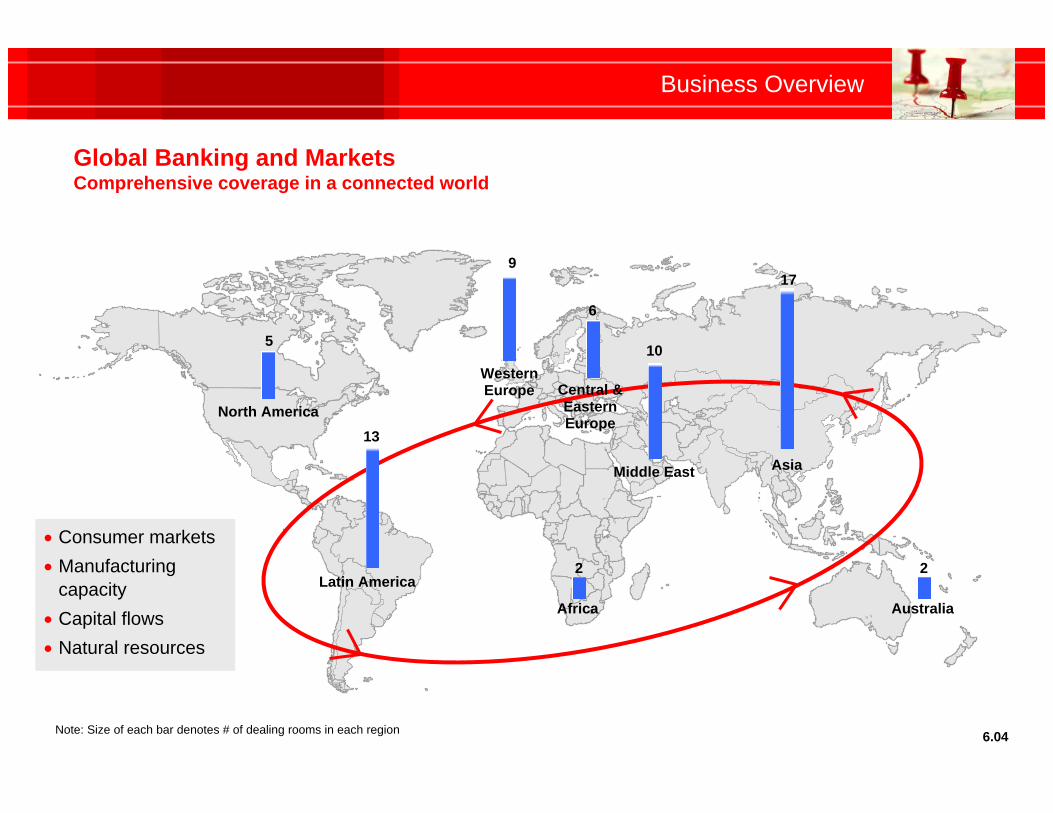
6.04
Global Banking and MarketsComprehensive coverage in a connected world
Latin America
North America
WesternEurope
Middle East Asia
Africa Australia
5
9
13
6
10
2
17
2
Central &EasternEurope
Consumer markets Manufacturing
capacity Capital flows Natural resources
Note: Size of each bar denotes # of dealing rooms in each region
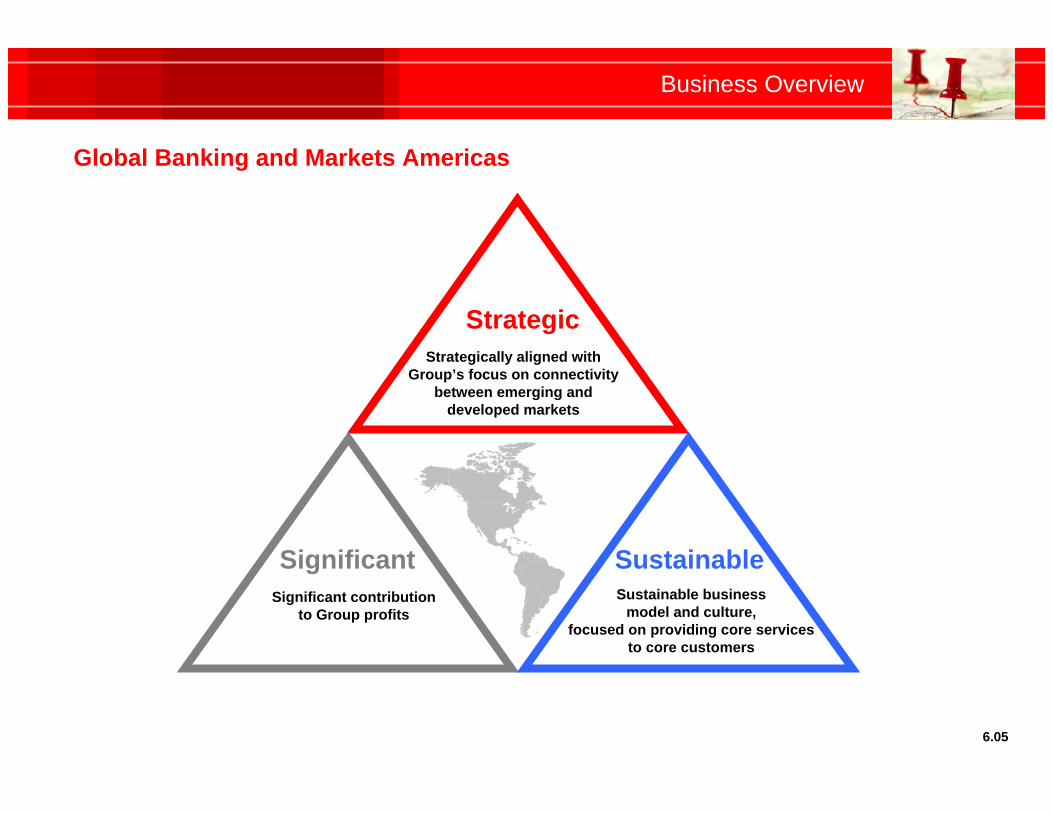
Business Overview
Global Banking and Markets Americas
6.05
Strategically aligned with Group’s focus on connectivity
between emerging and developed markets
Strategic
Significant contributionto Group profits
SignificantSustainable business
model and culture,focused on providing core services
to core customers
Sustainable
Business Overview
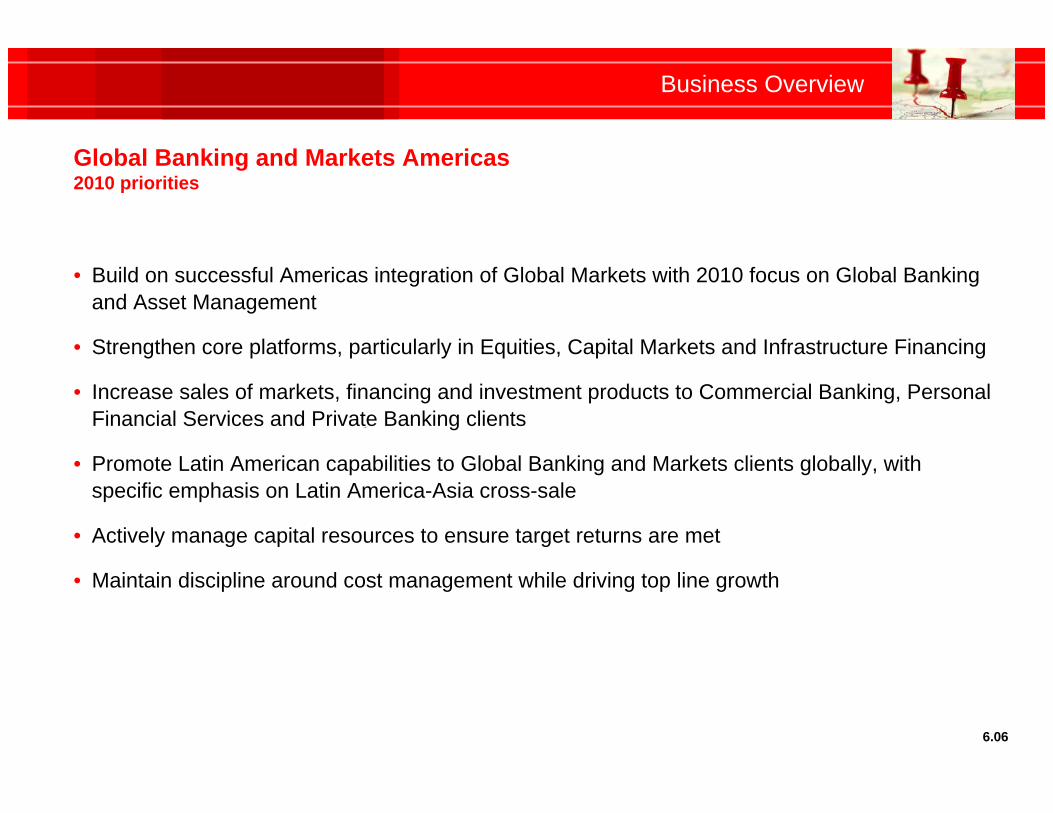
Global Banking and Markets Americas2010 priorities
• Build on successful Americas integration of Global Markets with 2010 focus on Global Banking and Asset Management
• Strengthen core platforms, particularly in Equities, Capital Markets and Infrastructure Financing
• Increase sales of markets, financing and investment products to Commercial Banking, Personal Financial Services and Private Banking clients
• Promote Latin American capabilities to Global Banking and Markets clients globally, with specific emphasis on Latin America-Asia cross-sale
• Actively manage capital resources to ensure target returns are met
• Maintain discipline around cost management while driving top line growth
6.06
Private Banking
Marlon YoungChief Executive Officer
Private Banking Americas
Business Overview
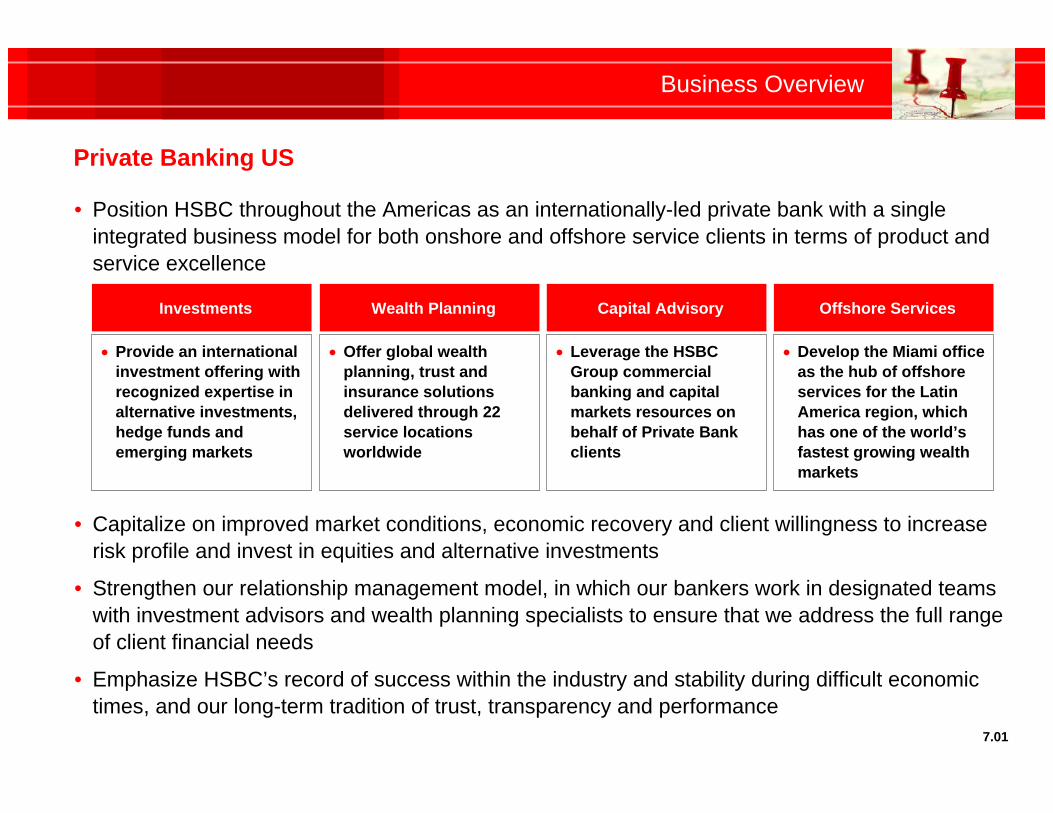
Private Banking US
• Position HSBC throughout the Americas as an internationally-led private bank with a single integrated business model for both onshore and offshore service clients in terms of product and service excellence
• Capitalize on improved market conditions, economic recovery and client willingness to increase risk profile and invest in equities and alternative investments
• Strengthen our relationship management model, in which our bankers work in designated teams with investment advisors and wealth planning specialists to ensure that we address the full range of client financial needs
• Emphasize HSBC’s record of success within the industry and stability during difficult economic times, and our long-term tradition of trust, transparency and performance
7.01
Investments
Provide an international investment offering with recognized expertise in alternative investments, hedge funds and emerging markets
Wealth Planning
Offer global wealth planning, trust and insurance solutions delivered through 22 service locations worldwide
Capital Advisory
Leverage the HSBC Group commercial banking and capital markets resources on behalf of Private Bank clients
Offshore Services
Develop the Miami office as the hub of offshore services for the Latin America region, which has one of the world’s fastest growing wealth markets
Business Overview
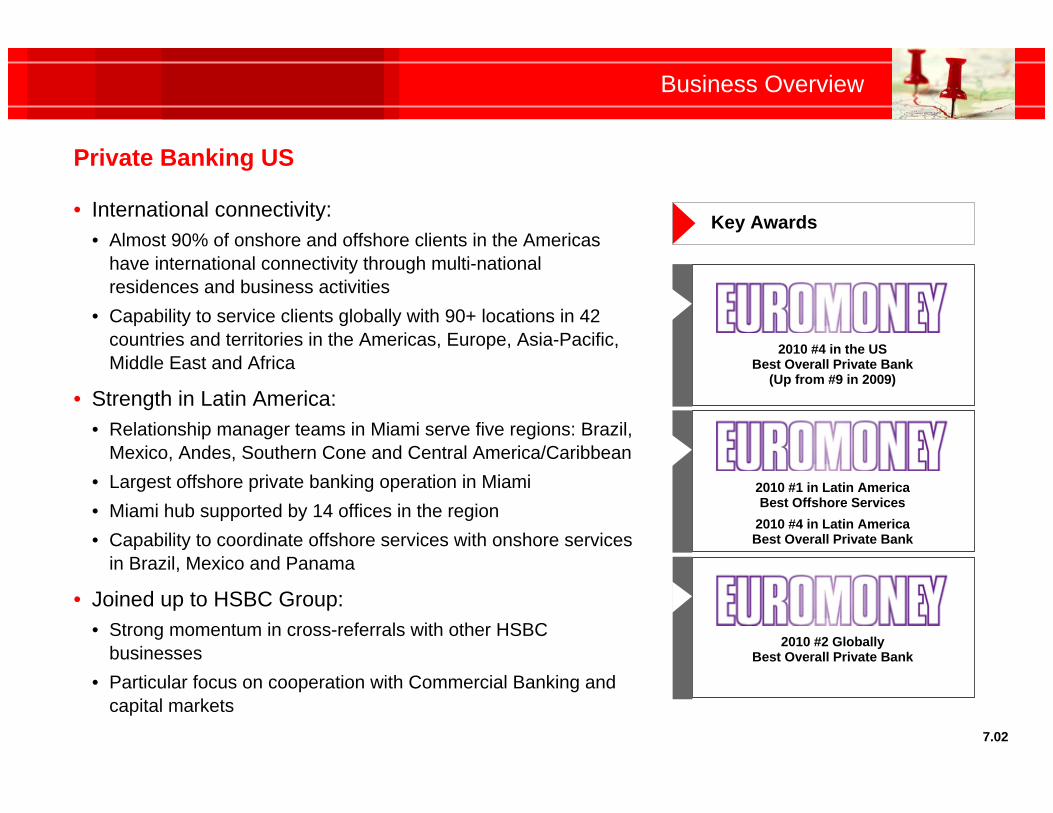
Private Banking US
• International connectivity:• Almost 90% of onshore and offshore clients in the Americas
have international connectivity through multi-national residences and business activities
• Capability to service clients globally with 90+ locations in 42 countries and territories in the Americas, Europe, Asia-Pacific, Middle East and Africa
• Strength in Latin America:• Relationship manager teams in Miami serve five regions: Brazil,
Mexico, Andes, Southern Cone and Central America/Caribbean• Largest offshore private banking operation in Miami• Miami hub supported by 14 offices in the region• Capability to coordinate offshore services with onshore services
in Brazil, Mexico and Panama
• Joined up to HSBC Group:• Strong momentum in cross-referrals with other HSBC
businesses• Particular focus on cooperation with Commercial Banking and
capital markets
Key Awards
2010 #4 in the USBest Overall Private Bank
(Up from #9 in 2009)
2010 #2 GloballyBest Overall Private Bank
2010 #1 in Latin AmericaBest Offshore Services
2010 #4 in Latin AmericaBest Overall Private Bank
7.02

Additional Q & A