Embed Size (px)
Citation preview
Hong Kong Exchanges and Clearing Limited and The Stock Exchange of Hong Kong Limited take no responsibility for the contents of this document, make no representation as to its accuracy or completeness and expressly disclaim any liability whatsoever for any loss howsoever arising from or in reliance upon the whole or any part of the contents of this document.
HSBC Holdings plc
Overseas Regulatory Announcement The attached announcement has been released to the other stock exchanges on which HSBC Holdings plc is listed. The Board of Directors of HSBC Holdings plc as at the date of this announcement are: D J Flint, S T Gulliver, S A Catz†, L M L Cha†, M K T Cheung†, J B Comey†, J D Coombe†, J Faber†, R A Fairhead†, R Fassbind†, J W J Hughes-Hallett†, W S H Laidlaw†, J P Lipsky†, J R Lomax†, I J Mackay, Sir Simon Robertson† and J L Thornton†. † Independent non-executive Director Hong Kong Stock Code: 5
Registered Office and Group Head Office:
8 Canada Square, London E14 5HQ, United Kingdom
Web: www.hsbc.com
Incorporated in England with limited liability. Registered number 617987
We only advise on our own life assurance, pensions and unit trusts
15 May 2013
HSBC INVESTOR UPDATE
HSBC Holdings plc is today holding an update on Group Strategy for investors and
analysts at its London headquarters located at 8 Canada Square, Canary Wharf.
Registration for webcast viewing of these presentations is available at www.hsbc.com
Highlights
Significant execution progress against the strategy outlined in May 2011
Strategy unchanged – priorities for the next phase 2014-2016:
grow both the business and dividends
implement global standards
streamline processes and procedures
Re-affirmed return on equity target range of 12-15%
Revenue growth exceeding cost growth (‘positive jaws’)
Additional sustainable costs savings of US$2-3bn
Cost efficiency ratio in the mid-50s
Basel 3 common equity tier 1 ratio above 10%
Progressive dividends
Stuart Gulliver, Group Chief Executive, commented:
“We have transformed HSBC in the first phase of the execution of our strategy. We
have announced the closure or disposal of 52 non-strategic or underperforming
businesses, achieved US$4bn of annualised sustainable cost savings and generated
double-digit loan growth in 15 priority markets. HSBC is now simpler, easier to
manage and ready to take advantage of growth opportunities.
more
HSBC Investor Update/2
“HSBC’s network bridges more than 90% of global international trade and capital
flows and connects customers to the world’s biggest growth opportunities. Our 22
home and priority markets are expected to account for approximately 58% of
addressable total banking revenue growth1 globally to 2020. Over the next three years
we will focus discretionary growth of risk-weighted assets in our priority faster
growing markets and Commercial Banking.
“We will also implement global standards, invest in world-leading risk and
compliance capabilities and de-risk our operations in higher risk locations.
“We will continue to exert tight cost discipline whilst streamlining processes and
procedures. This enables us to invest in growth and global standards.
“As we execute our strategy we will keep under review the capital we hold and, if it
appears to the Board to be in the interests of the Company and shareholders, we may
seek to neutralise the effects of the scrip dividend.
“HSBC has a distinctive position in the new environment for the banking industry.
Taken together, we are confident that these measures will deliver consistent and
superior financial results and move us closer to achieving our ambition of being the
world’s leading international bank.”
ends/more
1 Source: McKinsey & Company
HSBC Investor Update/3
Investor Relations enquiries to:
London
Guy Lewis + 44 (0)20 7992 1938 [email protected]
Hong Kong
Hugh Pye +852 2822 4908 [email protected]
Media enquiries to:
London
Patrick Humphris + 44 (0) 20 7992 1631 [email protected]
Hong Kong
Gareth Hewett + 852 2822 4929 [email protected]
Cautionary Statement Regarding Forward-Looking Statements
This News Release contains certain forward-looking statements with respect to HSBC’s financial condition,
results of operations and business. Forward-looking statements involve inherent risks and uncertainties. A
number of factors could cause actual results to differ, in some instances materially, from those anticipated or
implied in any forward-looking statement. These include, but are not limited to: changes in general economic
conditions in the markets in which we operate, such as continuing or deepening recessions and fluctuations
in employment beyond those factored into consensus forecasts; changes in foreign exchange rates and
interest rates; volatility in equity markets; lack of liquidity in wholesale funding markets; illiquidity and
downward price pressure in national real estate markets; adverse changes in central banks’ policies with
respect to the provision of liquidity support to financial markets; and factors specific to HSBC, including our
success in adequately identifying the risks we face, such as the incidence of loan losses or delinquency, and
managing those risks (through account management, hedging and other techniques). HSBC Holdings plc
does not undertake to update the forward-looking statements to reflect the impact of circumstances or
events that may arise after the date of the forward-looking statements.
Notes to editors
HSBC Holdings plc
HSBC Holdings plc, the parent company of the HSBC Group, is headquartered in London. The Group
serves customers worldwide from around 6,600 offices in over 80 countries and territories in Europe,
Hong Kong, Rest of Asia-Pacific, North and Latin America, and the Middle East and North Africa.
With assets of US$2,681bn at 31 March 2013, the HSBC Group is one of the world’s largest banking
and financial services organisations.
ends/all
Stuart Gulliver Group Chief Executive
Sean O’Sullivan Group Chief Operating Officer
Iain Mackay Group Finance Director
Investor update – Strategy unchanged – Next phase 15 May 2013
2
Forward-looking statements
This presentation and subsequent discussion may contain certain forward-looking statements with respect to the
financial condition, results of operations and business of the Group. These forward-looking statements represent the
Group’s expectations or beliefs concerning future events or targets and involve known and unknown risks and
uncertainty that could cause actual results, performance or events to differ materially from those expressed or implied
in such statements. Additional detailed information concerning important factors that could cause actual results to
differ materially is available in our 2012 Annual Report and Accounts. Past performance cannot be relied on as a
guide to future performance.
This presentation contains non-GAAP financial information. Reconciliation of non-GAAP financial information to the
most directly comparable measures under GAAP are provided in the ‘constant currency and underlying
reconciliations’ supplement available at www.hsbc.com.
3
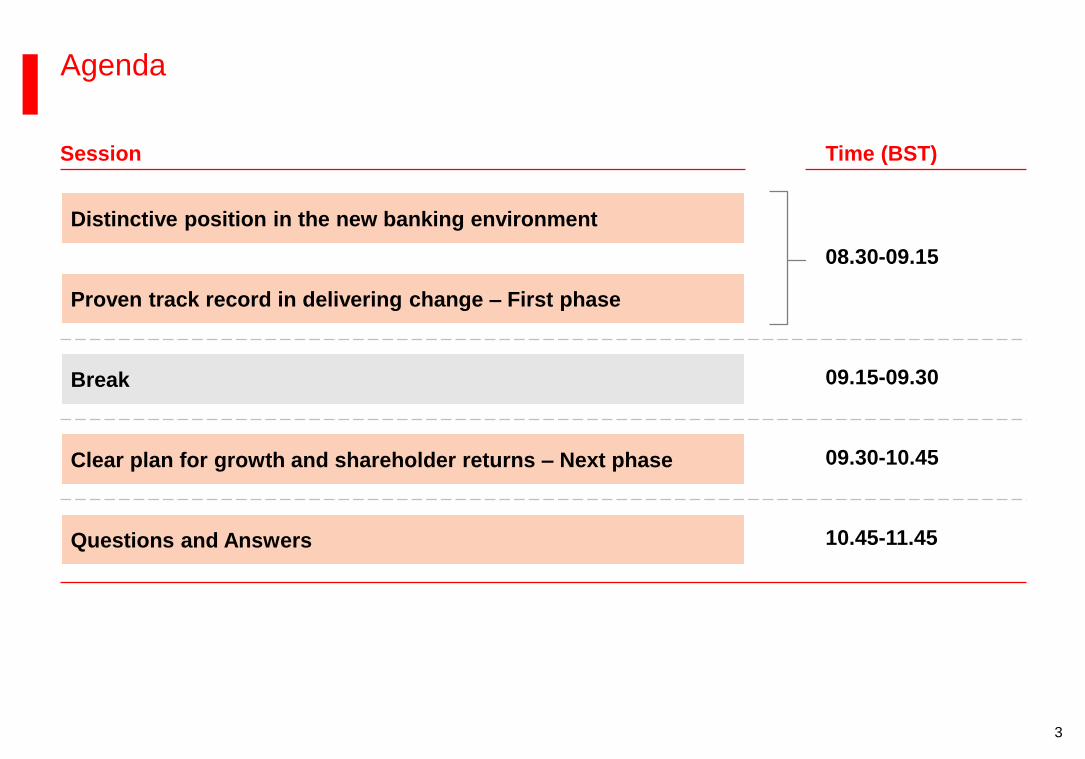
Agenda
Proven track record in delivering change – First phase
Clear plan for growth and shareholder returns – Next phase
Distinctive position in the new banking environment
Break
Questions and Answers
Session Time (BST)
09.15-09.30
10.45-11.45
08.30-09.15
09.30-10.45
4
52 disposals/exits announced since 2011, reduced
c.USD95bn RWAs1 and c.15k FTE2
c.USD8bn gain on sale2
USD4.0bn in annualised sustainable saves and c.28k
FTE reduction3 up to 1Q 2013
Double digit loan growth in 15 priority markets4,5
c.USD27bn capital generated and retained4
c.USD16bn in gross dividends paid4
Since 2011
HSBC transformed since 2011
1 Expected reduction in RWAs after completion of all 52 transactions
2 From transactions completed up to 1Q 2013
3 Excluding transactions
4 From 2010-2012
5 15 priority markets are: Argentina, Australia, Brazil, Egypt, Germany, Hong Kong, India, Indonesia, Mainland China, Malaysia, Mexico, Singapore, Taiwan, Turkey, Vietnam
5
Next phase 2014-16
Strategy remains unchanged
Grow both business and dividends
Implement Global Standards
Streamline processes and procedures
Targets
ROE 12-15%1
Positive jaws
CER mid-50s2
Additional USD2-3bn in sustainable saves
Common equity tier 1 ratio >10%
Advances-to-deposits ratio cap <90%
Progressive dividends and share buy-backs3
1 Return on average ordinary shareholders’ equity
2 Group Performance Share Plan long-term scorecard will remain unchanged with a Cost Efficiency Ratio target of 48-52% for 2013
3 Subject to meeting United Kingdom regulatory capital requirements and shareholder approval
6
Why should you own HSBC?
B Proven track record in delivering change – First phase
Clear plan for growth and shareholder returns – Next phase C
A Distinctive position in the new banking environment
Long term trends remain valid I
II HSBC distinctive position
7
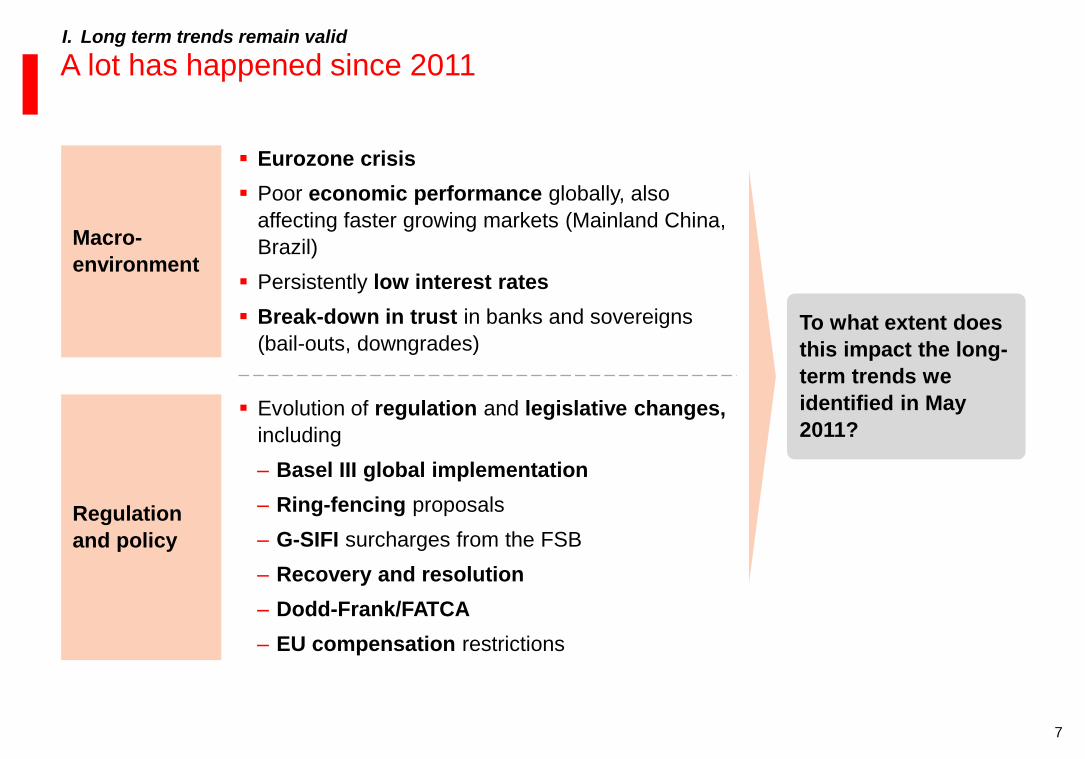
A lot has happened since 2011
To what extent does
this impact the long-
term trends we
identified in May
2011?
Macro-
environment
Regulation
and policy
Eurozone crisis
Poor economic performance globally, also
affecting faster growing markets (Mainland China,
Brazil)
Persistently low interest rates
Break-down in trust in banks and sovereigns
(bail-outs, downgrades)
Evolution of regulation and legislative changes,
including
‒ Basel III global implementation
‒ Ring-fencing proposals
‒ G-SIFI surcharges from the FSB
‒ Recovery and resolution
‒ Dodd-Frank/FATCA
‒ EU compensation restrictions
I. Long term trends remain valid
8
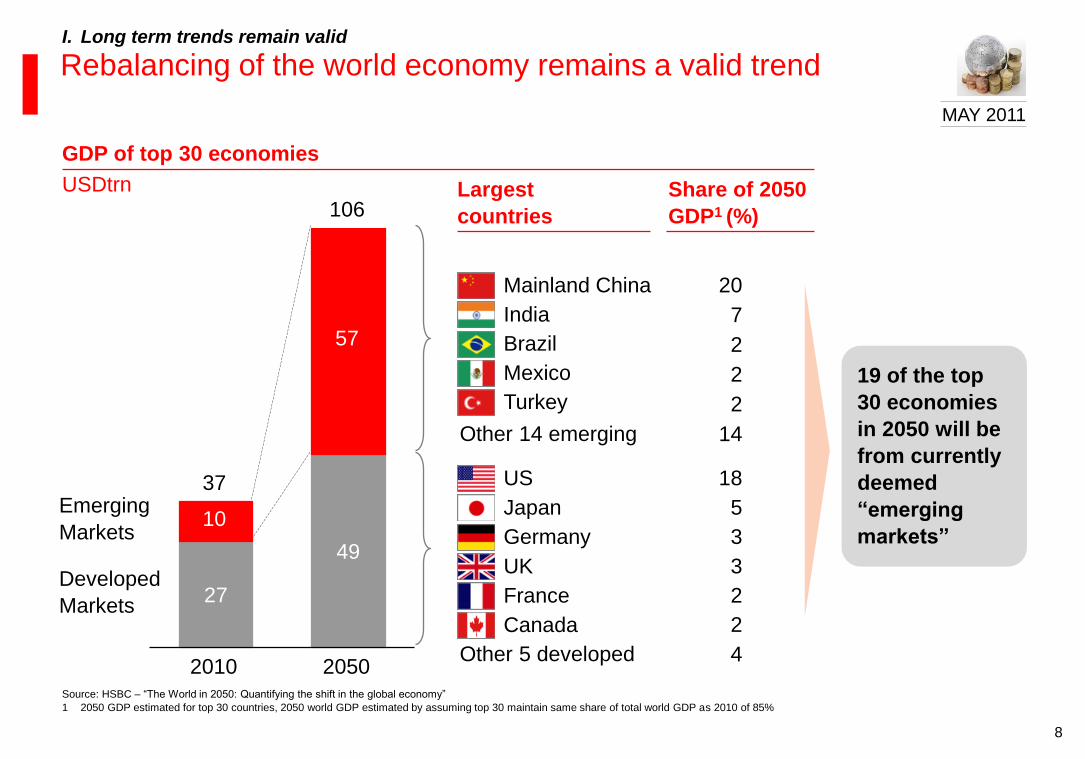
27
49
Developed
Markets
Emerging
Markets
2050
106
57
2010
37
10
Mainland China
India
Brazil
Mexico
Other 14 emerging
Largest
countries
19 of the top
30 economies
in 2050 will be
from currently
deemed
“emerging
markets”
Share of 2050
GDP1 (%)
UK
France
Canada
Other 5 developed
USDtrn
GDP of top 30 economies
US
Japan
Germany
Turkey
Rebalancing of the world economy remains a valid trend I. Long term trends remain valid
Source: HSBC – “The World in 2050: Quantifying the shift in the global economy”
1 2050 GDP estimated for top 30 countries, 2050 world GDP estimated by assuming top 30 maintain same share of total world GDP as 2010 of 85%
20
7
2
2
14
3
2
2
4
18
5
3
2
MAY 2011
9
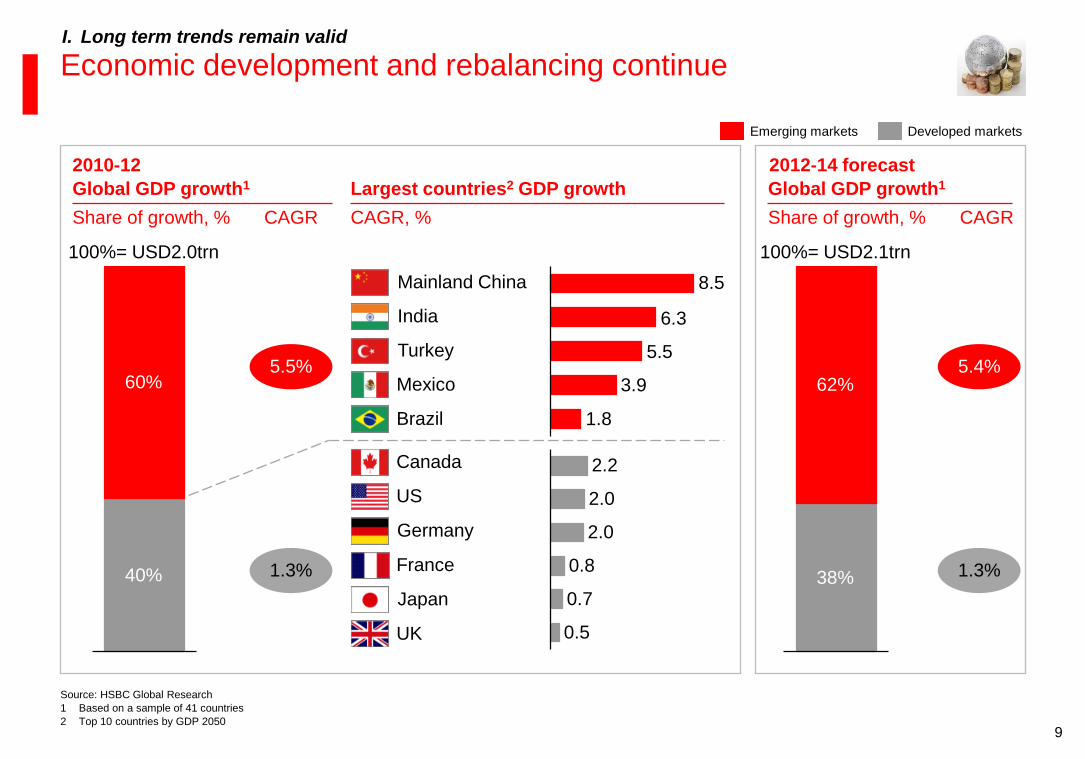
Economic development and rebalancing continue
5.5
3.9
6.3
1.8
8.5
I. Long term trends remain valid
40%
60%
100%= USD2.0trn
Source: HSBC Global Research
1 Based on a sample of 41 countries
2 Top 10 countries by GDP 2050
100%= USD2.1trn
38%
62%
Global GDP growth1 Largest countries2 GDP growth
Share of growth, % CAGR, %
5.5%
CAGR
1.3%
Mainland China
India
Turkey
Mexico
Brazil
Canada
US
Germany
France
Japan
UK
2010-12 2012-14 forecast
Global GDP growth1
Share of growth, %
0.7
0.8
2.0
2.0
2.2
0.5
5.4%
1.3%
CAGR
Emerging markets Developed markets
10
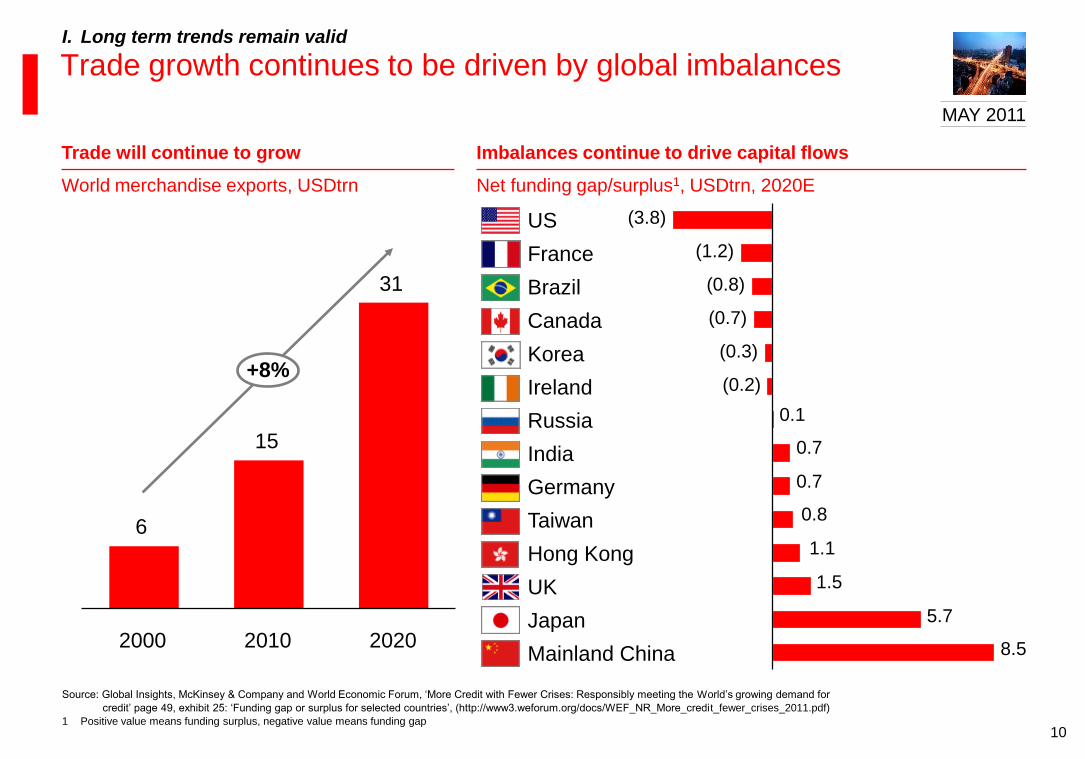
6
15
31
+8%
2020 2010 2000
World merchandise exports, USDtrn
Trade will continue to grow
Net funding gap/surplus1, USDtrn, 2020E
Imbalances continue to drive capital flows
Mainland China
US
India
Japan
Germany
Brazil
France
Canada
Korea
Ireland
Russia
Taiwan
Hong Kong
0.1
0.7
0.7
0.8
1.1
1.5
5.7
8.5
(0.2)
(0.3)
(0.7)
(0.8)
(1.2)
(3.8)
UK
Trade growth continues to be driven by global imbalances I. Long term trends remain valid
Source: Global Insights, McKinsey & Company and World Economic Forum, ‘More Credit with Fewer Crises: Responsibly meeting the World’s growing demand for
credit’ page 49, exhibit 25: ‘Funding gap or surplus for selected countries’, (http://www3.weforum.org/docs/WEF_NR_More_credit_fewer_crises_2011.pdf)
1 Positive value means funding surplus, negative value means funding gap
MAY 2011
11
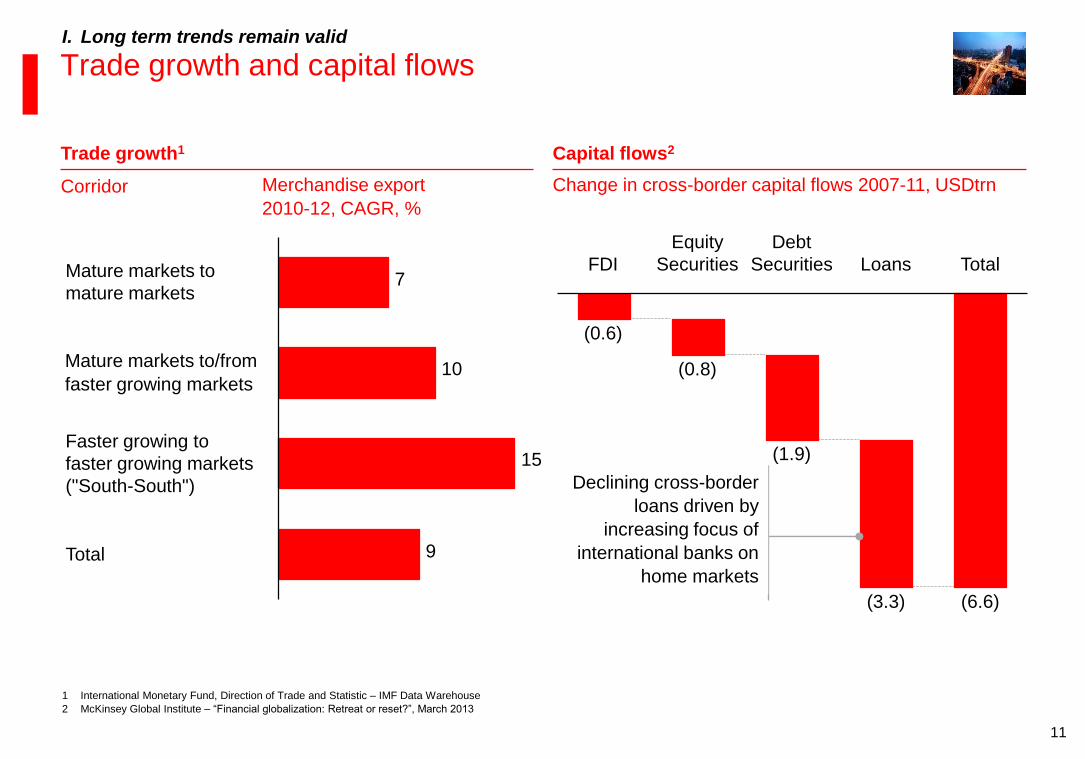
Mature markets to/from
faster growing markets
Trade growth and capital flows
Capital flows2 Trade growth1
Change in cross-border capital flows 2007-11, USDtrn Merchandise export
1 International Monetary Fund, Direction of Trade and Statistic – IMF Data Warehouse
2 McKinsey Global Institute – “Financial globalization: Retreat or reset?”, March 2013
I. Long term trends remain valid
7
10
15
9 Total
Faster growing to
faster growing markets
("South-South")
Mature markets to
mature markets
Total
(6.6)
Loans
(3.3)
Debt
Securities
(1.9)
Equity
Securities
(0.8)
FDI
(0.6)
Corridor
Declining cross-border
loans driven by
increasing focus of
international banks on
home markets
2010-12, CAGR, %
12
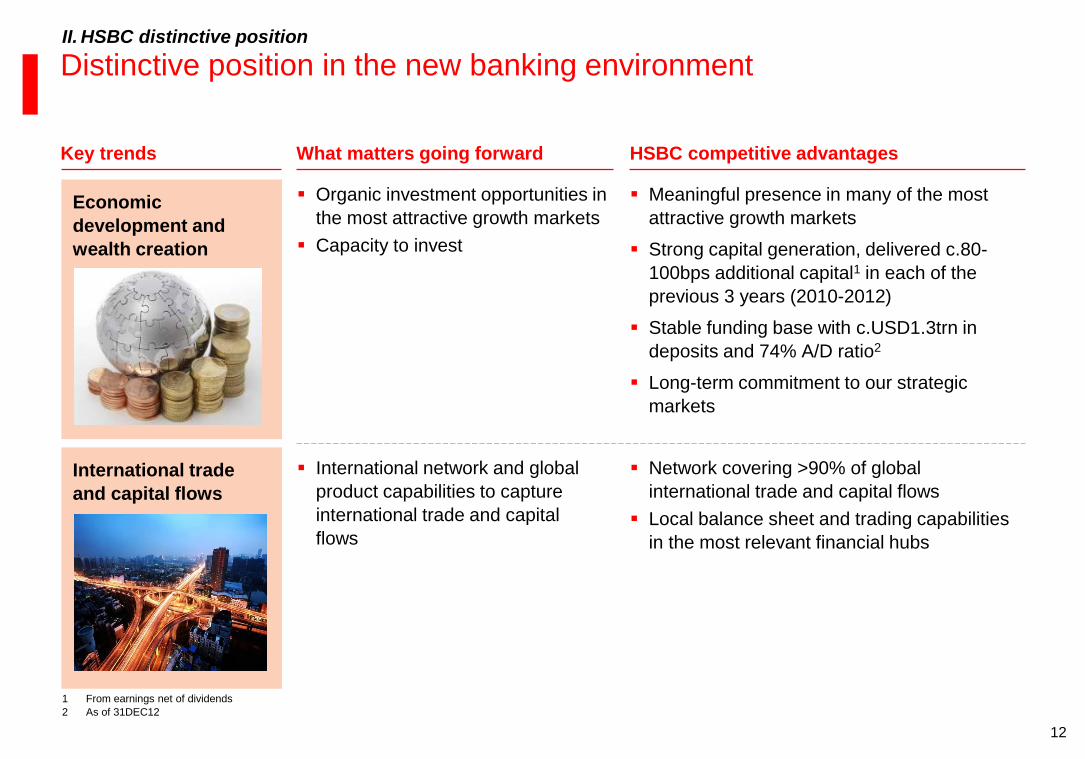
Distinctive position in the new banking environment
What matters going forward HSBC competitive advantages
Economic
development and
wealth creation
Organic investment opportunities in
the most attractive growth markets
Capacity to invest
Meaningful presence in many of the most
attractive growth markets
Strong capital generation, delivered c.80-
100bps additional capital1 in each of the
previous 3 years (2010-2012)
Stable funding base with c.USD1.3trn in
deposits and 74% A/D ratio2
Long-term commitment to our strategic
markets
International trade
and capital flows
International network and global
product capabilities to capture
international trade and capital
flows
Network covering >90% of global
international trade and capital flows
Local balance sheet and trading capabilities
in the most relevant financial hubs
II. HSBC distinctive position
Key trends
1 From earnings net of dividends
2 As of 31DEC12
13
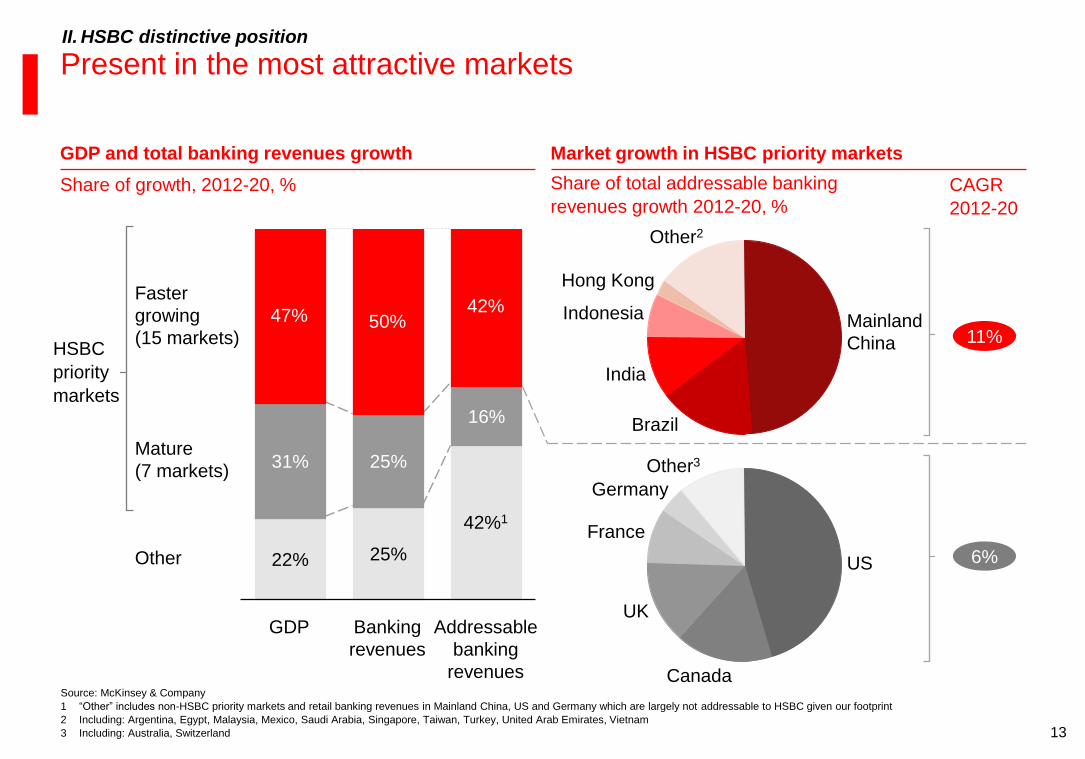
Present in the most attractive markets II. HSBC distinctive position
Share of growth, 2012-20, %
Market growth in HSBC priority markets
Share of total addressable banking
revenues growth 2012-20, % CAGR
2012-20
11%
6%
GDP and total banking revenues growth
HSBC
priority
markets
22% 25%
31% 25%
16%
Other
Mature
(7 markets)
Faster
growing
(15 markets)
Addressable
banking
revenues
42%1
42%
Banking
revenues
50%
GDP
47%
US
Canada
UK
France
Germany
Other3
Other2
Hong Kong
Indonesia
India
Brazil
Mainland
China
Source: McKinsey & Company
1 “Other” includes non-HSBC priority markets and retail banking revenues in Mainland China, US and Germany which are largely not addressable to HSBC given our footprint
2 Including: Argentina, Egypt, Malaysia, Mexico, Saudi Arabia, Singapore, Taiwan, Turkey, United Arab Emirates, Vietnam
3 Including: Australia, Switzerland
14
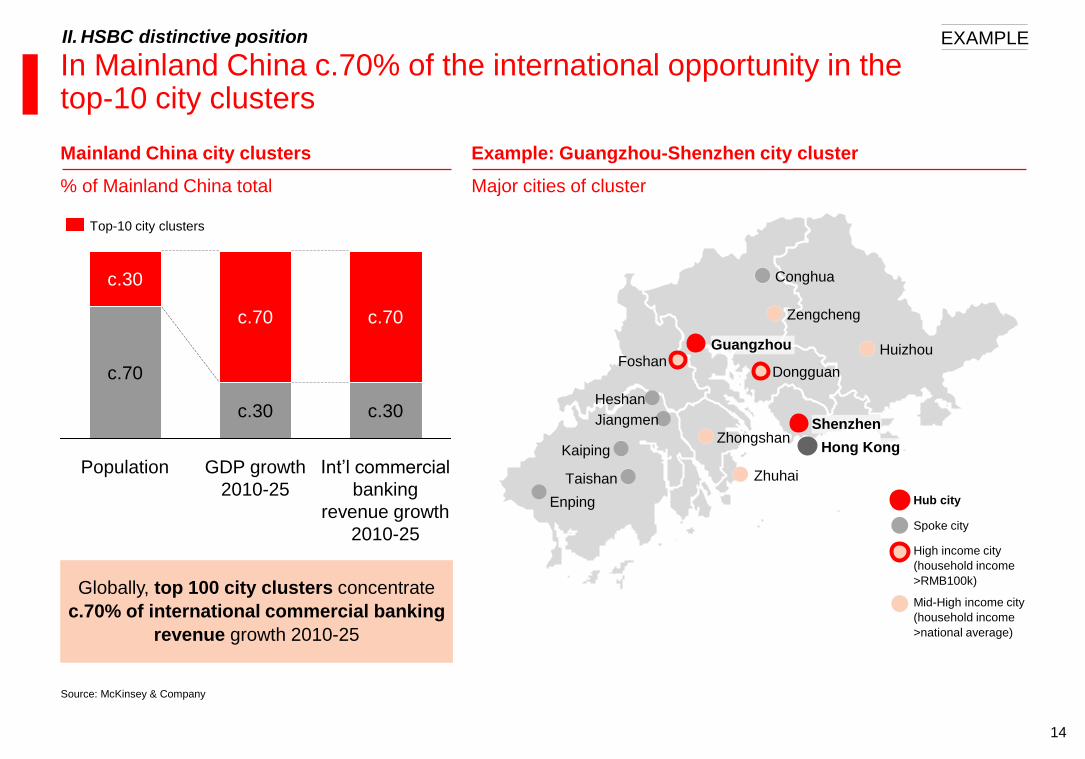
In Mainland China c.70% of the international opportunity in the top-10 city clusters
Mainland China city clusters
% of Mainland China total
II. HSBC distinctive position
Globally, top 100 city clusters concentrate
c.70% of international commercial banking
revenue growth 2010-25
Hub city
High income city
(household income
>RMB100k)
Mid-High income city
(household income
>national average)
Spoke city
Example: Guangzhou-Shenzhen city cluster
Major cities of cluster
Dongguan
Shenzhen
Huizhou
Zengcheng
Guangzhou Foshan
Zhongshan Hong Kong
Zhuhai
Conghua
Heshan
Jiangmen
Kaiping
Taishan
Enping
Source: McKinsey & Company
EXAMPLE
Population GDP growth
2010-25
Int’l commercial
banking
revenue growth
2010-25
c.30
c.70
c.70
c.30
c.70
c.30
Top-10 city clusters
15
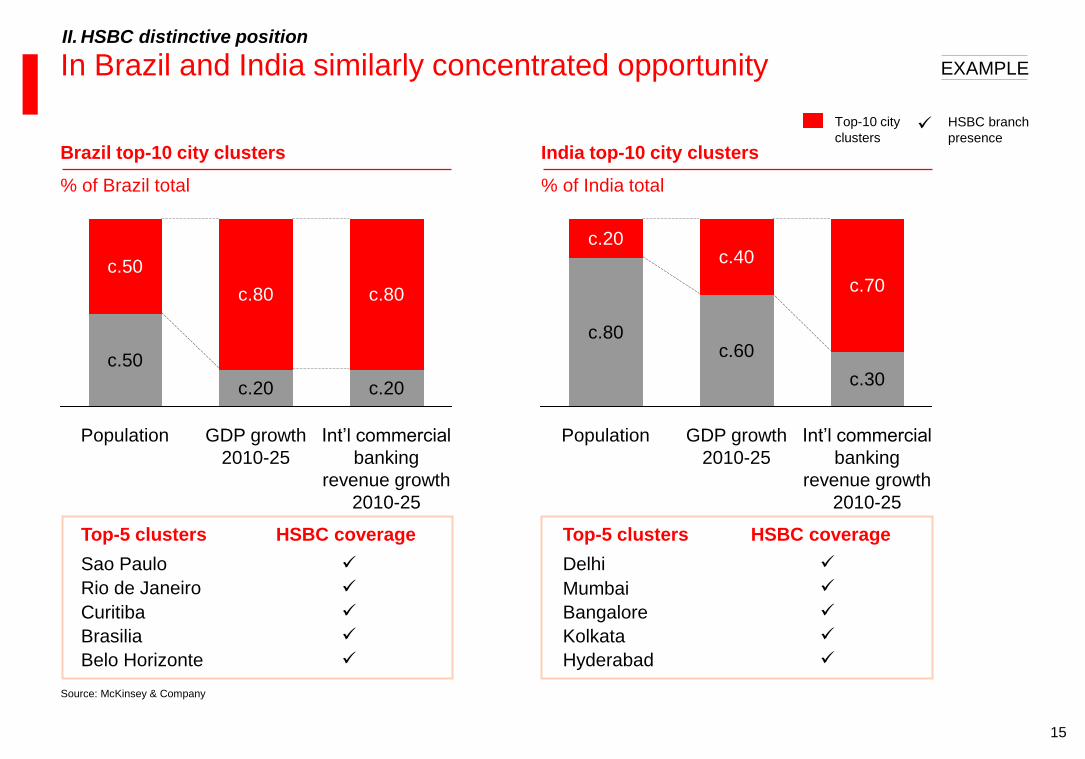
In Brazil and India similarly concentrated opportunity
Brazil top-10 city clusters
% of Brazil total
II. HSBC distinctive position
Source: McKinsey & Company
EXAMPLE
India top-10 city clusters
% of India total
Top-5 clusters HSBC coverage
Int’l commercial
banking
revenue growth
2010-25
c.80
c.20
GDP growth
2010-25
c.80
c.50
Population
c.20
c.50
Int’l commercial
banking
revenue growth
2010-25
c.40
GDP growth
2010-25
Population
c.20
c.80
c.30
c.70
c.60
Top-5 clusters HSBC coverage
HSBC branch
presence
Top-10 city
clusters
Sao Paulo
Rio de Janeiro
Curitiba
Brasilia
Belo Horizonte
Bangalore
Delhi
Hyderabad
Kolkata
Mumbai
16
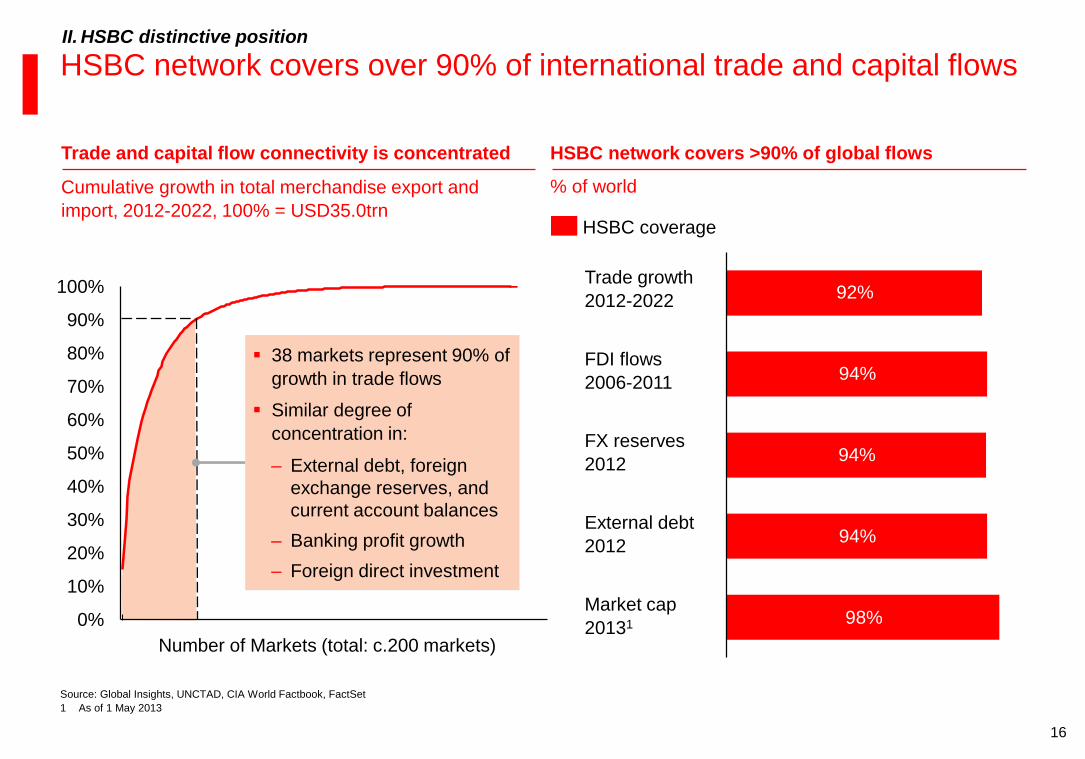
HSBC network covers over 90% of international trade and capital flows II. HSBC distinctive position
% of world
HSBC network covers >90% of global flows
Source: Global Insights, UNCTAD, CIA World Factbook, FactSet
1 As of 1 May 2013
Trade and capital flow connectivity is concentrated
Cumulative growth in total merchandise export and
import, 2012-2022, 100% = USD35.0trn
98%
94%
94%
94%
92%
HSBC coverage
Trade growth
2012-2022
FDI flows
2006-2011
FX reserves
2012
External debt
2012
Market cap
20131
Number of Markets (total: c.200 markets)
0%
10%
20%
30%
40%
50%
60%
70%
80%
90%
100%
38 markets represent 90% of
growth in trade flows
Similar degree of
concentration in:
– External debt, foreign
exchange reserves, and
current account balances
– Banking profit growth
– Foreign direct investment
17
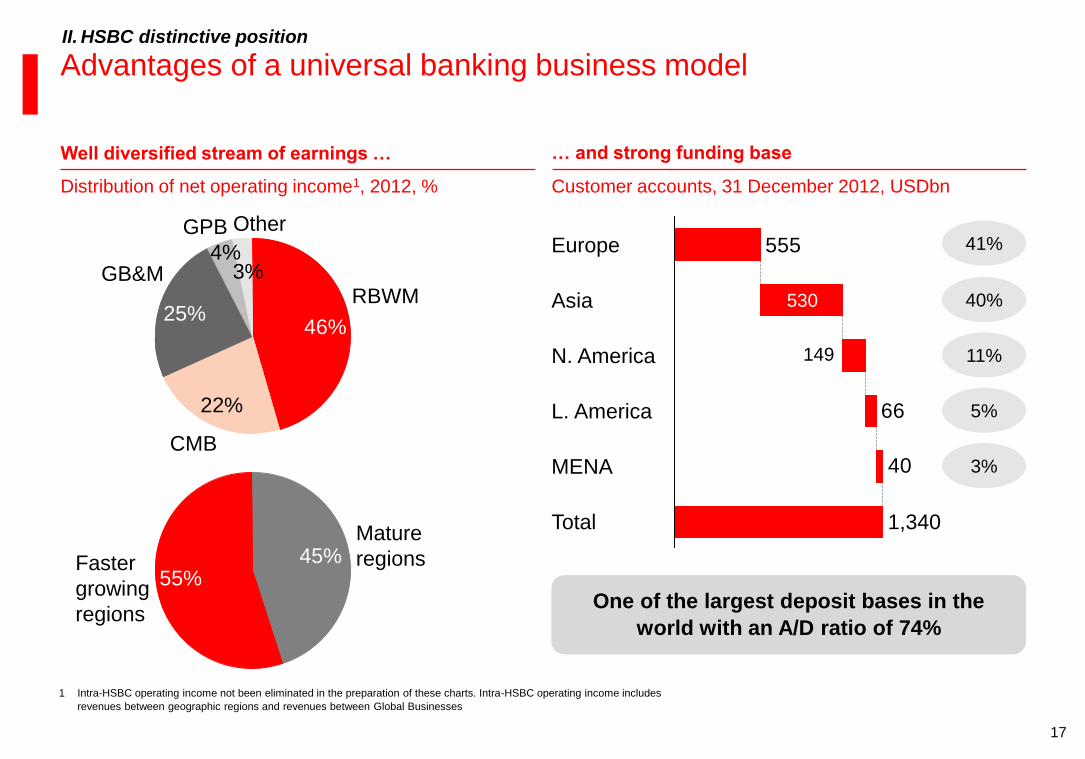
Advantages of a universal banking business model
Customer accounts, 31 December 2012, USDbn
… and strong funding base Well diversified stream of earnings …
Distribution of net operating income1, 2012, %
40
66
555
Total 1,340
MENA
L. America
N. America
Asia
Europe
One of the largest deposit bases in the
world with an A/D ratio of 74%
1 Intra-HSBC operating income not been eliminated in the preparation of these charts. Intra-HSBC operating income includes
revenues between geographic regions and revenues between Global Businesses
II. HSBC distinctive position
530
149
41%
40%
11%
5%
3%
45% Faster
growing
regions
Mature
regions 55%
22%
RBWM
46%
4% 3%
GPB
GB&M
Other
CMB
25%
18
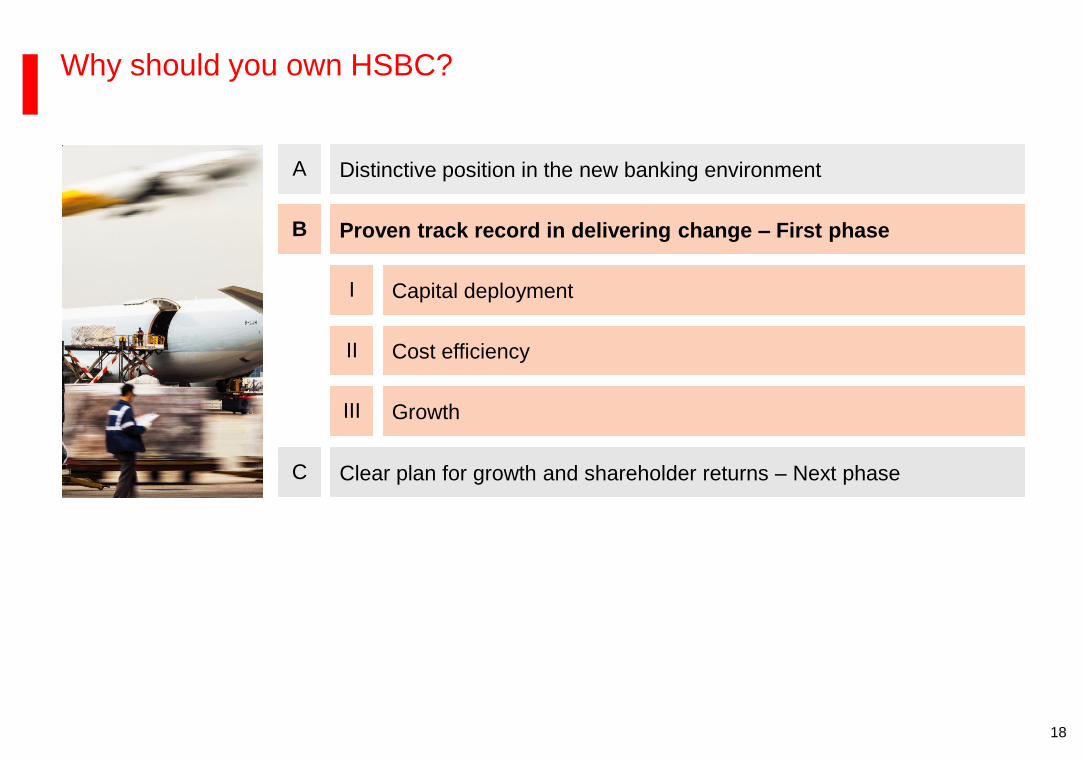
Why should you own HSBC?
B Proven track record in delivering change – First phase
Clear plan for growth and shareholder returns – Next phase C
A Distinctive position in the new banking environment
Capital deployment I
Cost efficiency II
III Growth
19
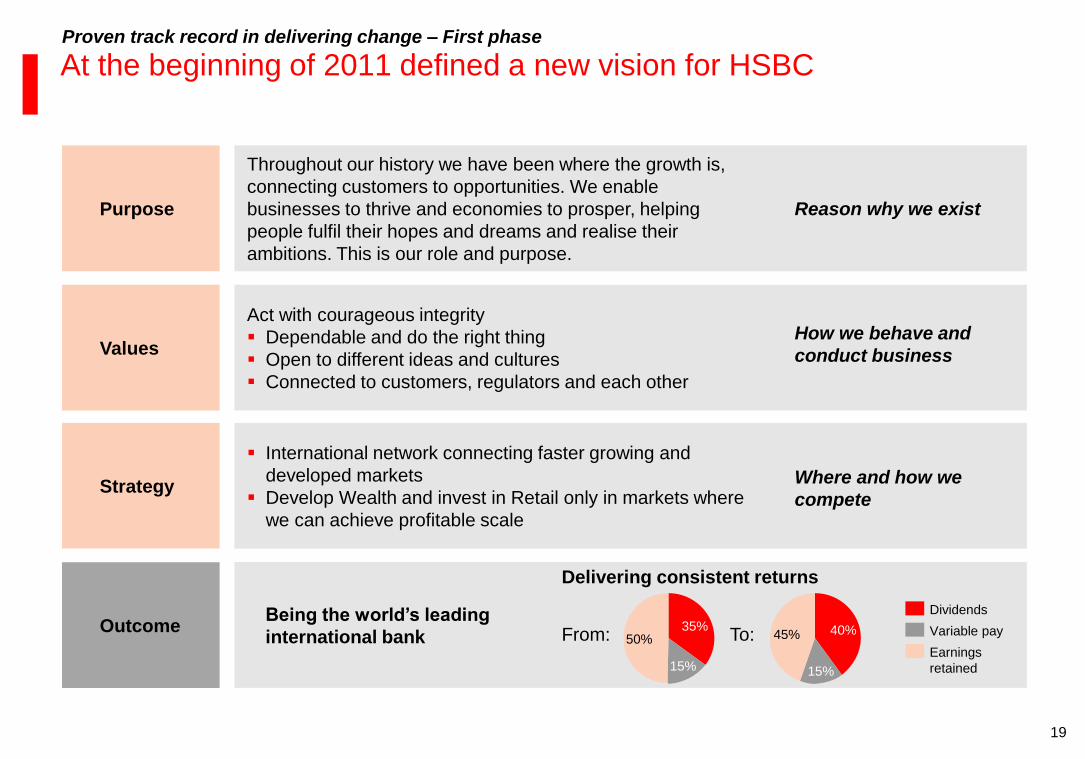
At the beginning of 2011 defined a new vision for HSBC Proven track record in delivering change – First phase
Purpose
Values
Strategy
Outcome
Reason why we exist
Throughout our history we have been where the growth is,
connecting customers to opportunities. We enable
businesses to thrive and economies to prosper, helping
people fulfil their hopes and dreams and realise their
ambitions. This is our role and purpose.
How we behave and
conduct business
Act with courageous integrity
Dependable and do the right thing
Open to different ideas and cultures
Connected to customers, regulators and each other
Where and how we
compete
International network connecting faster growing and
developed markets
Develop Wealth and invest in Retail only in markets where
we can achieve profitable scale
Being the world’s leading
international bank
Delivering consistent returns
15%
50% 35%
15%
45% 40%
Earnings
retained
Variable pay
Dividends
From: To:
20
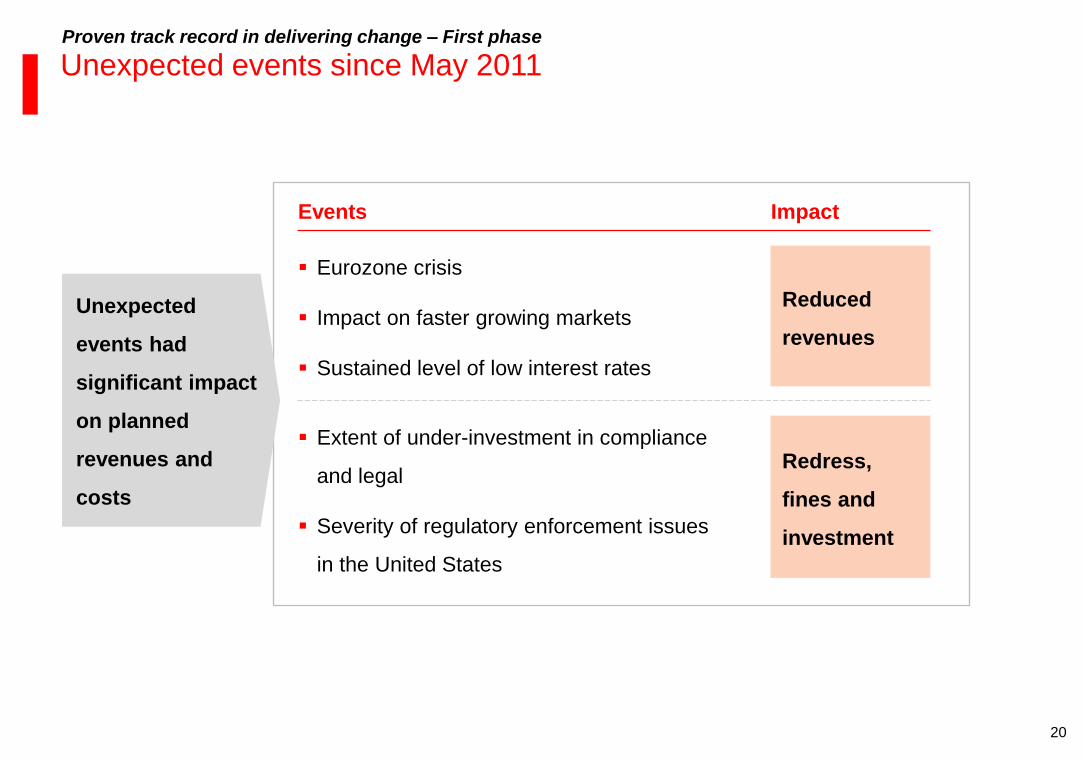
Unexpected events since May 2011
Eurozone crisis
Impact on faster growing markets
Sustained level of low interest rates
Impact
Extent of under-investment in compliance
and legal
Severity of regulatory enforcement issues
in the United States
Reduced
revenues
Redress,
fines and
investment
Events
Proven track record in delivering change – First phase
Unexpected
events had
significant impact
on planned
revenues and
costs
21
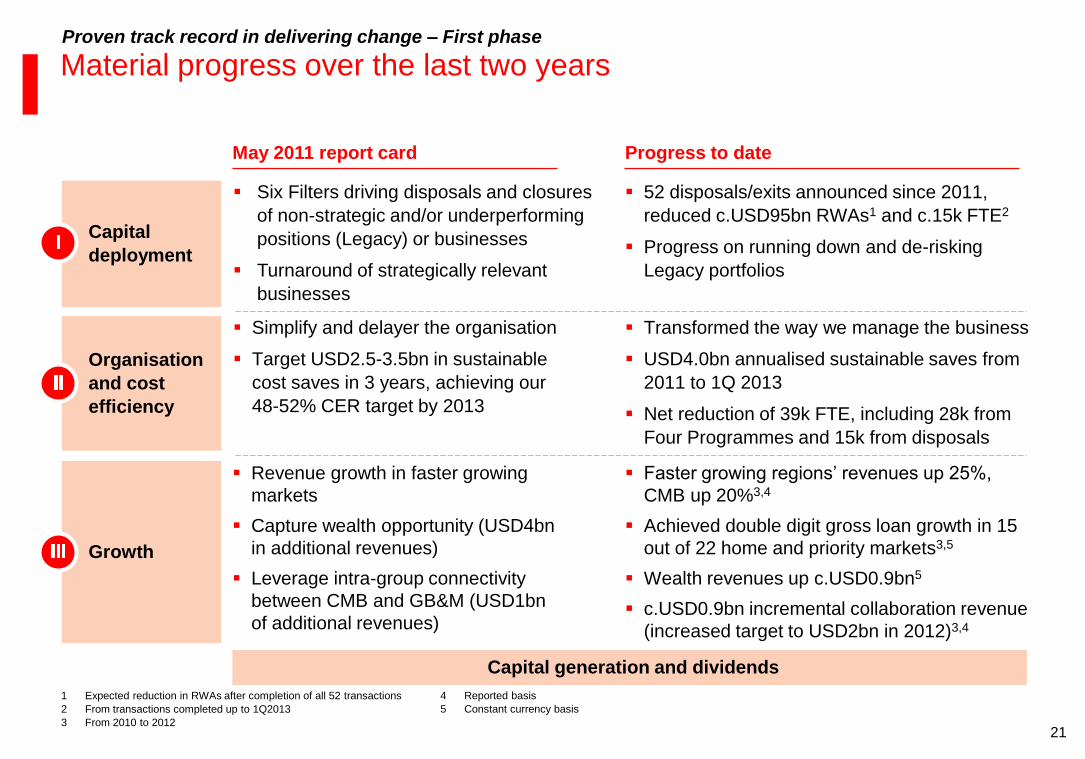
Material progress over the last two years
May 2011 report card Progress to date
Capital
deployment
52 disposals/exits announced since 2011,
reduced c.USD95bn RWAs1 and c.15k FTE2
Progress on running down and de-risking
Legacy portfolios
Six Filters driving disposals and closures
of non-strategic and/or underperforming
positions (Legacy) or businesses
Turnaround of strategically relevant
businesses
Organisation
and cost
efficiency
Simplify and delayer the organisation
Target USD2.5-3.5bn in sustainable
cost saves in 3 years, achieving our
48-52% CER target by 2013
Transformed the way we manage the business
USD4.0bn annualised sustainable saves from
2011 to 1Q 2013
Net reduction of 39k FTE, including 28k from
Four Programmes and 15k from disposals
Proven track record in delivering change – First phase
1 Expected reduction in RWAs after completion of all 52 transactions
2 From transactions completed up to 1Q2013
3 From 2010 to 2012
Growth
Revenue growth in faster growing
markets
Capture wealth opportunity (USD4bn
in additional revenues)
Leverage intra-group connectivity
between CMB and GB&M (USD1bn
of additional revenues)
Faster growing regions’ revenues up 25%,
CMB up 20%3,4
Achieved double digit gross loan growth in 15
out of 22 home and priority markets3,5
Wealth revenues up c.USD0.9bn5
c.USD0.9bn incremental collaboration revenue
(increased target to USD2bn in 2012)3,4
Capital generation and dividends
4 Reported basis
5 Constant currency basis
22
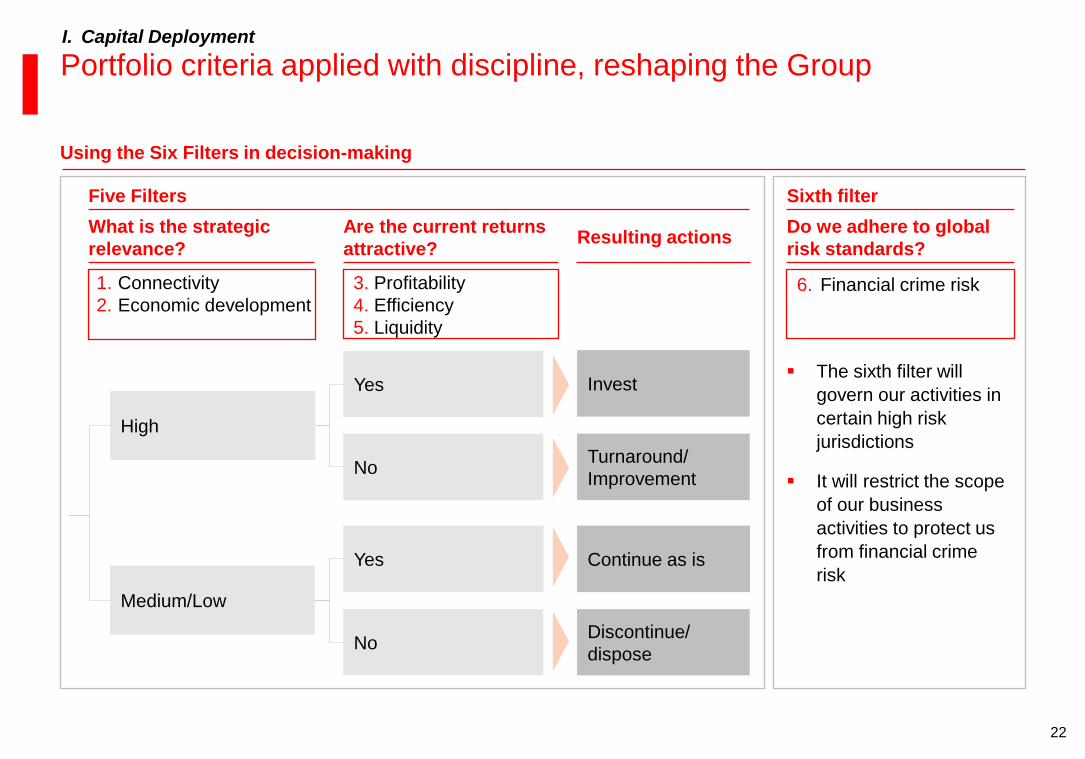
Five Filters
What is the strategic
relevance?
3. Profitability
4. Efficiency
5. Liquidity
1. Connectivity
2. Economic development
Are the current returns
attractive?
High
Medium/Low
Yes
No
No
Yes
Continue as is
Discontinue/
dispose
Turnaround/
Improvement
Invest
Resulting actions
Sixth filter
The sixth filter will
govern our activities in
certain high risk
jurisdictions
It will restrict the scope
of our business
activities to protect us
from financial crime
risk
6. Financial crime risk
Do we adhere to global
risk standards?
Portfolio criteria applied with discipline, reshaping the Group I. Capital Deployment
Using the Six Filters in decision-making
23
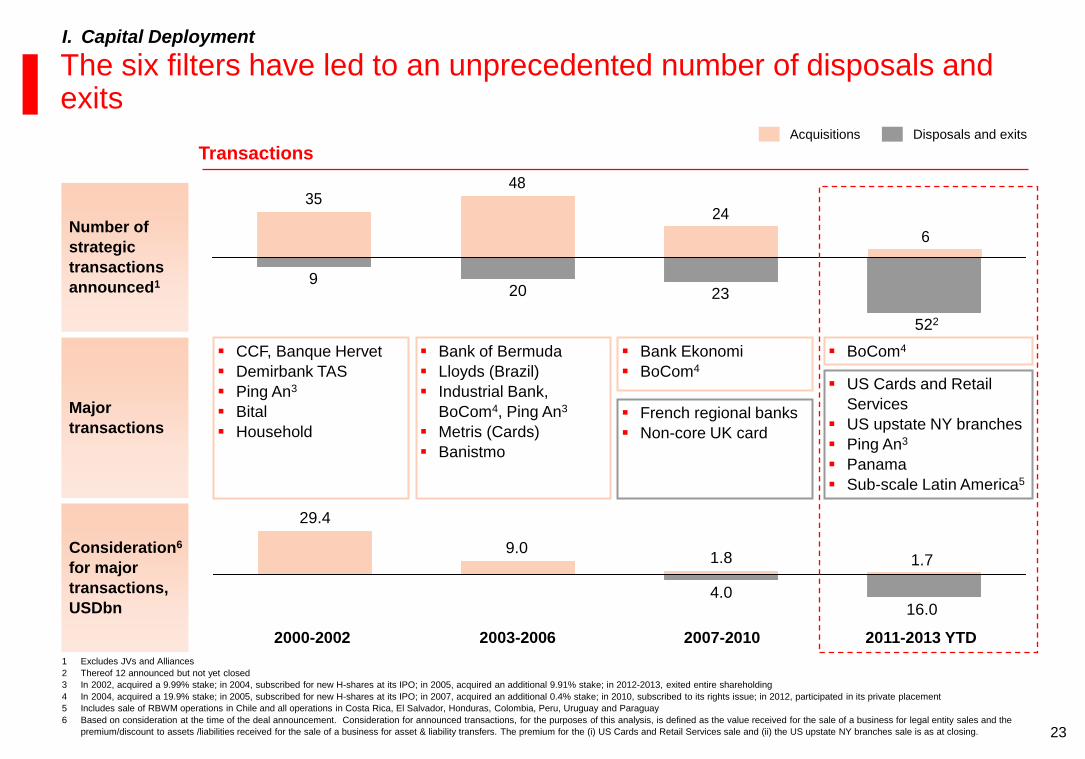
522
23 20 9
2003-2006 2000-2002 2011-2013 YTD
16.0
2007-2010
4.0
1.7 1.8 9.0
29.4
6
24
4835
The six filters have led to an unprecedented number of disposals and exits
Number of
strategic
transactions
announced1
Consideration6
for major
transactions,
USDbn
Bank of Bermuda
Lloyds (Brazil)
Industrial Bank,
BoCom4, Ping An3
Metris (Cards)
Banistmo
US Cards and Retail
Services
US upstate NY branches
Ping An3
Panama
Sub-scale Latin America5
Major
transactions French regional banks
Non-core UK card
Bank Ekonomi
BoCom4
Acquisitions Disposals and exits
CCF, Banque Hervet
Demirbank TAS
Ping An3
Bital
Household
Transactions
I. Capital Deployment
1 Excludes JVs and Alliances
2 Thereof 12 announced but not yet closed
3 In 2002, acquired a 9.99% stake; in 2004, subscribed for new H-shares at its IPO; in 2005, acquired an additional 9.91% stake; in 2012-2013, exited entire shareholding
4 In 2004, acquired a 19.9% stake; in 2005, subscribed for new H-shares at its IPO; in 2007, acquired an additional 0.4% stake; in 2010, subscribed to its rights issue; in 2012, participated in its private placement
5 Includes sale of RBWM operations in Chile and all operations in Costa Rica, El Salvador, Honduras, Colombia, Peru, Uruguay and Paraguay
6 Based on consideration at the time of the deal announcement. Consideration for announced transactions, for the purposes of this analysis, is defined as the value received for the sale of a business for legal entity sales and the
premium/discount to assets /liabilities received for the sale of a business for asset & liability transfers. The premium for the (i) US Cards and Retail Services sale and (ii) the US upstate NY branches sale is as at closing.
BoCom4
24
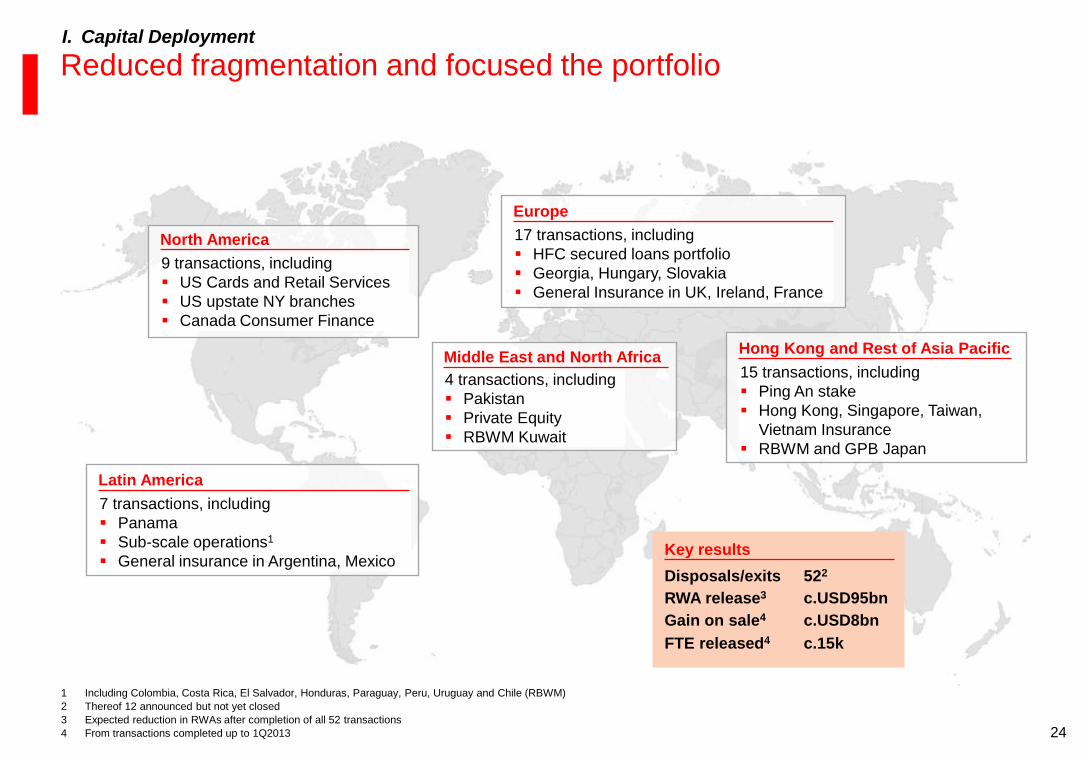
Reduced fragmentation and focused the portfolio
9 transactions, including
US Cards and Retail Services
US upstate NY branches
Canada Consumer Finance
North America
7 transactions, including
Panama
Sub-scale operations1
General insurance in Argentina, Mexico
Latin America
17 transactions, including
HFC secured loans portfolio
Georgia, Hungary, Slovakia
General Insurance in UK, Ireland, France
Europe
4 transactions, including
Pakistan
Private Equity
RBWM Kuwait
Middle East and North Africa 15 transactions, including
Ping An stake
Hong Kong, Singapore, Taiwan,
Vietnam Insurance
RBWM and GPB Japan
Hong Kong and Rest of Asia Pacific
Disposals/exits
RWA release3
Gain on sale4
522
c.USD95bn
c.USD8bn
Key results
I. Capital Deployment
1 Including Colombia, Costa Rica, El Salvador, Honduras, Paraguay, Peru, Uruguay and Chile (RBWM)
2 Thereof 12 announced but not yet closed
3 Expected reduction in RWAs after completion of all 52 transactions
4 From transactions completed up to 1Q2013
FTE released4 c.15k
25
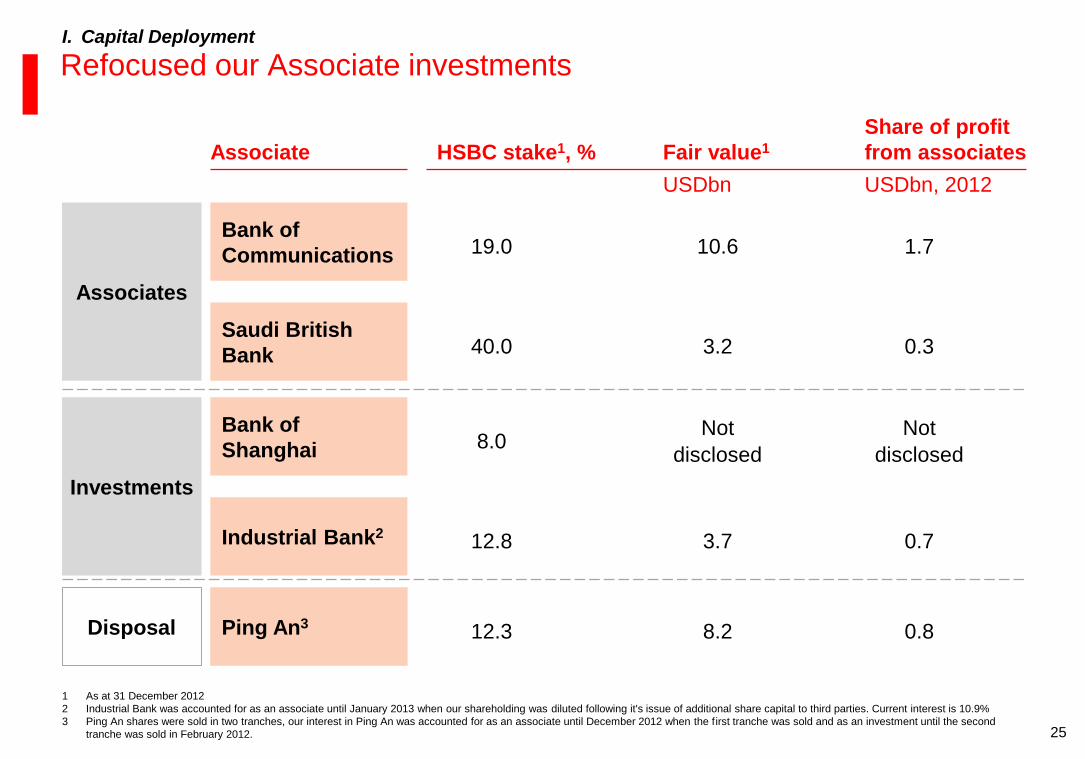
Refocused our Associate investments
Associates
Bank of
Communications
Saudi British
Bank
Ping An3 Disposal
HSBC stake1, %
19.0
40.0
12.3
Fair value1
USDbn
10.6
3.2
8.2
Share of profit
from associates
USDbn, 2012
1.7
0.3
Investments
Bank of
Shanghai
Industrial Bank2
8.0
12.8
Not
disclosed
3.7
Not
disclosed
0.7
0.8
Associate
I. Capital Deployment
1 As at 31 December 2012
2 Industrial Bank was accounted for as an associate until January 2013 when our shareholding was diluted following it's issue of additional share capital to third parties. Current interest is 10.9%
3 Ping An shares were sold in two tranches, our interest in Ping An was accounted for as an associate until December 2012 when the first tranche was sold and as an investment until the second
tranche was sold in February 2012.
26
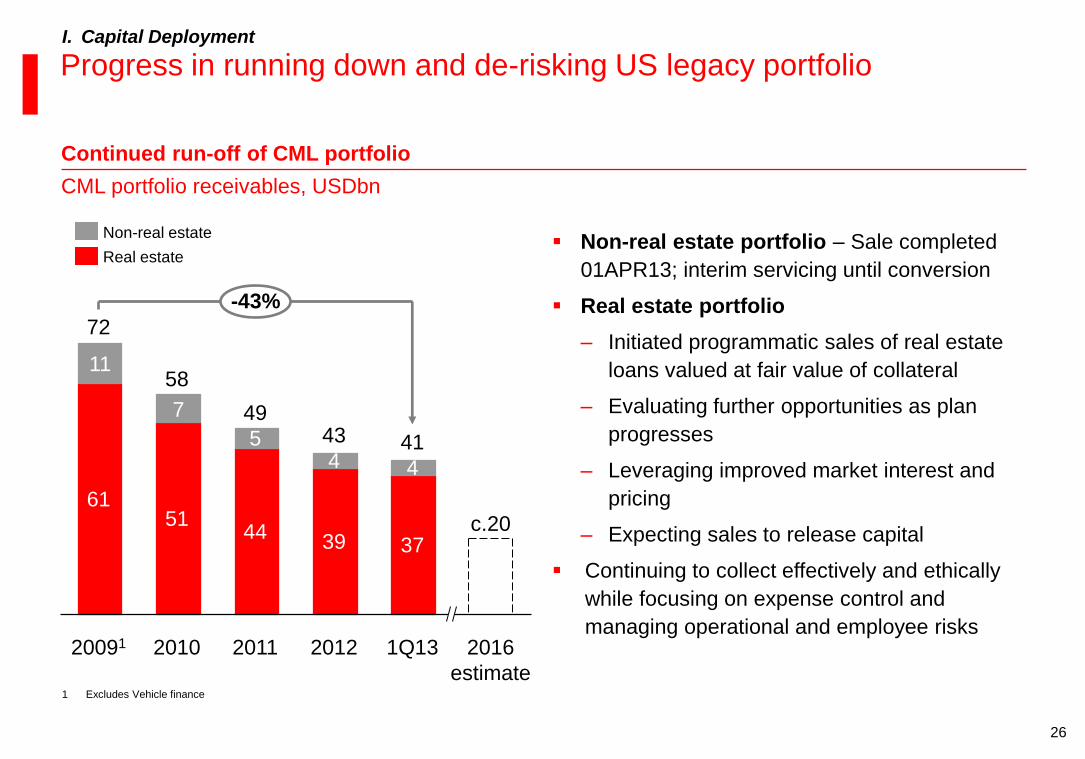
Non-real estate portfolio – Sale completed
01APR13; interim servicing until conversion
Real estate portfolio
‒ Initiated programmatic sales of real estate
loans valued at fair value of collateral
‒ Evaluating further opportunities as plan
progresses
‒ Leveraging improved market interest and
pricing
‒ Expecting sales to release capital
Continuing to collect effectively and ethically
while focusing on expense control and
managing operational and employee risks
Continued run-off of CML portfolio
11
7
-43%
2016
estimate
c.20
1Q13
41
37
4
20091
72
61
2012
43
39
4
2011
49
44
5
2010
58
51
Real estate
Non-real estate
Progress in running down and de-risking US legacy portfolio I. Capital Deployment
CML portfolio receivables, USDbn
1 Excludes Vehicle finance
27
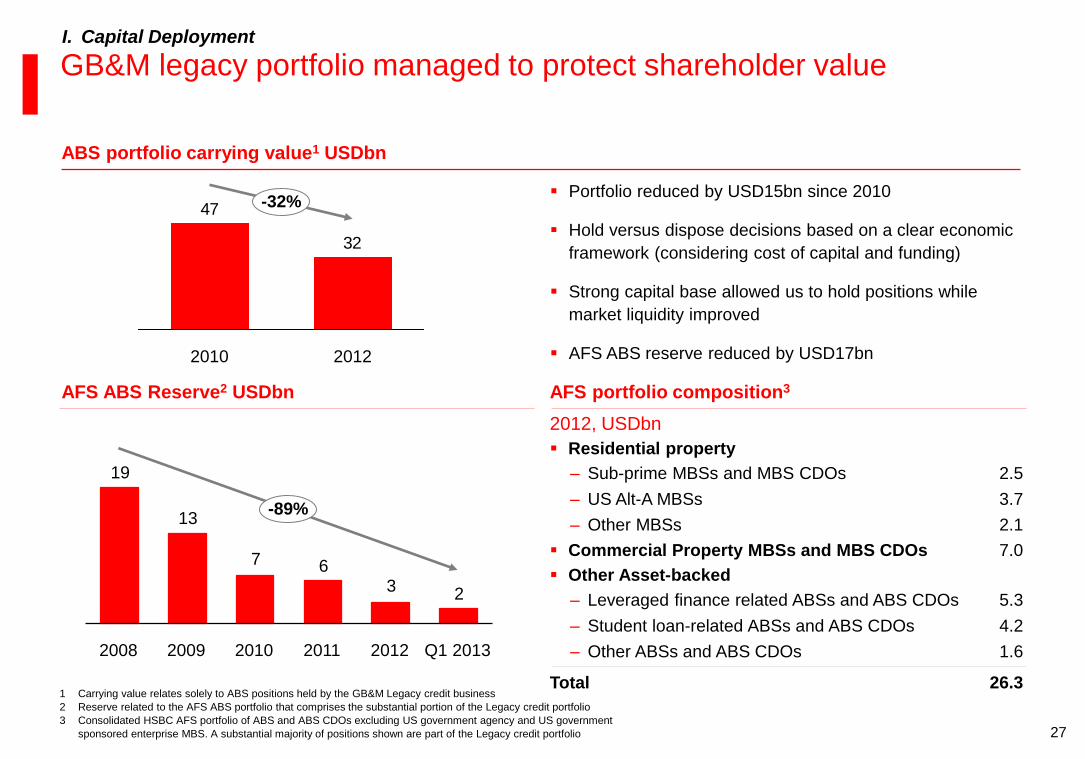
GB&M legacy portfolio managed to protect shareholder value
AFS ABS Reserve2 USDbn AFS portfolio composition3
ABS portfolio carrying value1 USDbn
Portfolio reduced by USD15bn since 2010
Hold versus dispose decisions based on a clear economic
framework (considering cost of capital and funding)
Strong capital base allowed us to hold positions while
market liquidity improved
AFS ABS reserve reduced by USD17bn
I. Capital Deployment
Residential property
‒ Sub-prime MBSs and MBS CDOs
‒ US Alt-A MBSs
‒ Other MBSs
2.5
3.7
2.1
Other Asset-backed
‒ Leveraged finance related ABSs and ABS CDOs
‒ Student loan-related ABSs and ABS CDOs
‒ Other ABSs and ABS CDOs
5.3
4.2
1.6
Total 26.3
2012, USDbn
Commercial Property MBSs and MBS CDOs 7.0
1 Carrying value relates solely to ABS positions held by the GB&M Legacy credit business
2 Reserve related to the AFS ABS portfolio that comprises the substantial portion of the Legacy credit portfolio
3 Consolidated HSBC AFS portfolio of ABS and ABS CDOs excluding US government agency and US government
sponsored enterprise MBS. A substantial majority of positions shown are part of the Legacy credit portfolio
19
13
7 6 3 2
2012
-89%
Q1 2013 2009 2011 2010 2008
32
47 -32%
2012 2010
28
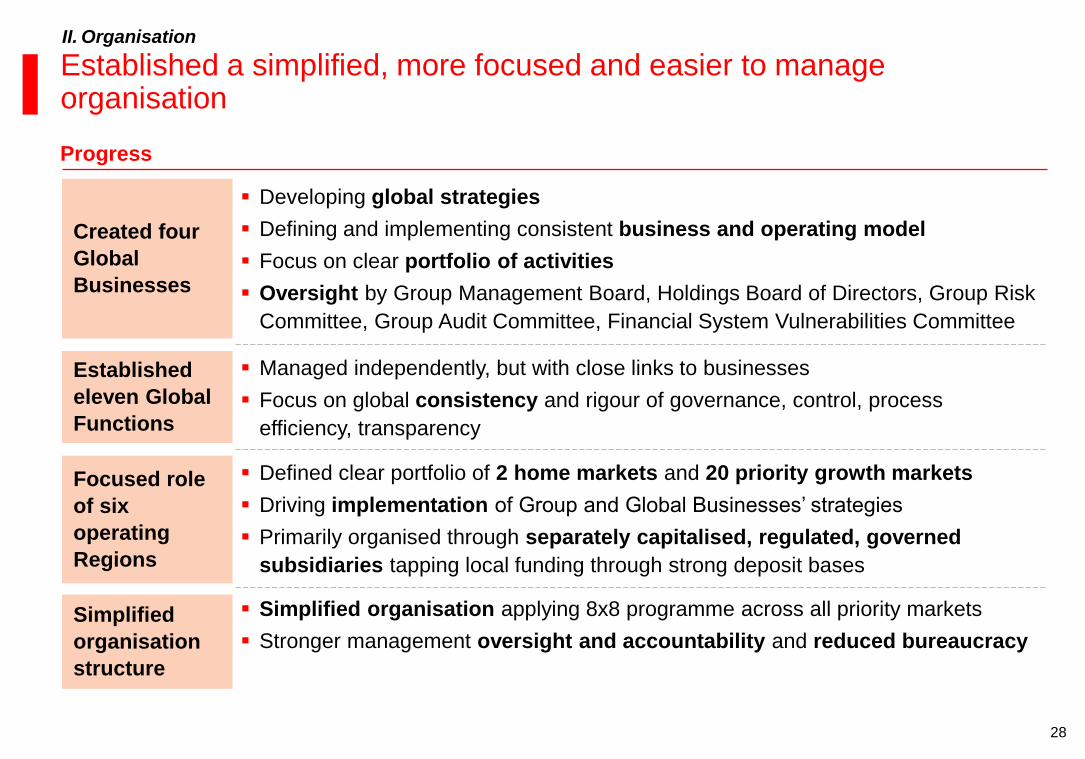
Established a simplified, more focused and easier to manage organisation
Progress
II. Organisation
Created four
Global
Businesses
Developing global strategies
Defining and implementing consistent business and operating model
Focus on clear portfolio of activities
Oversight by Group Management Board, Holdings Board of Directors, Group Risk
Committee, Group Audit Committee, Financial System Vulnerabilities Committee
Established
eleven Global
Functions
Managed independently, but with close links to businesses
Focus on global consistency and rigour of governance, control, process
efficiency, transparency
Focused role
of six
operating
Regions
Defined clear portfolio of 2 home markets and 20 priority growth markets
Driving implementation of Group and Global Businesses’ strategies
Primarily organised through separately capitalised, regulated, governed
subsidiaries tapping local funding through strong deposit bases
Simplified
organisation
structure
Simplified organisation applying 8x8 programme across all priority markets
Stronger management oversight and accountability and reduced bureaucracy
29
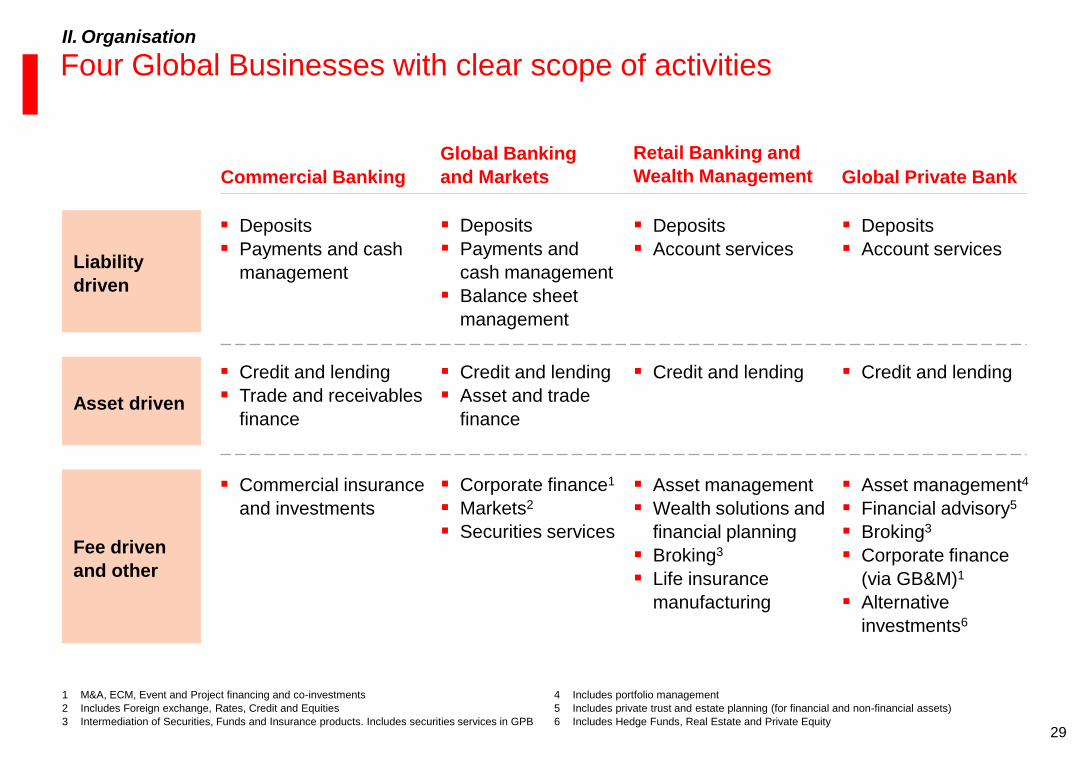
Four Global Businesses with clear scope of activities
Retail Banking and
Wealth Management Commercial Banking
Global Banking
and Markets
Liability
driven
Deposits
Account services
Deposits
Payments and cash
management
Deposits
Payments and
cash management
Balance sheet
management
Deposits
Account services
Global Private Bank
Asset driven
Credit and lending Credit and lending
Trade and receivables
finance
Credit and lending
Asset and trade
finance
Credit and lending
Fee driven
and other
Asset management
Wealth solutions and
financial planning
Broking3
Life insurance
manufacturing
Commercial insurance
and investments
Corporate finance1
Markets2
Securities services
Asset management4
Financial advisory5
Broking3
Corporate finance
(via GB&M)1
Alternative
investments6
1 M&A, ECM, Event and Project financing and co-investments
2 Includes Foreign exchange, Rates, Credit and Equities
3 Intermediation of Securities, Funds and Insurance products. Includes securities services in GPB
II. Organisation
4 Includes portfolio management
5 Includes private trust and estate planning (for financial and non-financial assets)
6 Includes Hedge Funds, Real Estate and Private Equity

30
Strong leadership team and talent pipeline
Description
Talent
pipeline
Strong ability to attract, develop and retain talent
– International Managers – c.400 managers with strong international focus,
established since beginning of HSBC
– Graduates – Attracting c.500 graduates per year across our international
network
Improved opportunities and visibility in the new organisation
II. Organisation
1 Cut-off date 1 March 2013
2 Group Management Board and Group General Managers
Leadership
team
Senior leadership team with long experience in the industry
– Group Management Board – 13 senior executives leading the Group, Global
Businesses and Regions, average tenure of 22 years1 with HSBC
– Group General Managers – c.35 key senior managers, with on average more
than 20 years1 of experience at HSBC
– Global Talent Pool – c.120 key talent, next generation of leaders
Since 2011 we have changed c.50% of the leadership team2
Target to grow the leadership team to c.320 people

31
Employees
FTE, thousands
II. Organisation
Simplifying the firm
-39k
1Q13
260
4Q12
261
3Q12
267
2Q12
272
1Q12
285
4Q11
288
3Q11
294
2Q11
296
1Q11
299
4Q10
295 Reshaped portfolio
Simplified organisation
Established Four Programmes
Transformation
Outcome
USD4.0bn in annualised
sustainable saves by 1Q 2013
Net reduction of 39k FTE,
including 28k from Four
Programmes and 15k from
disposals1
1 From transactions completed up to 1Q2013. Gross reduction of 43k FTE offset in part by investments leading to a net reduction of 39k FTE
32
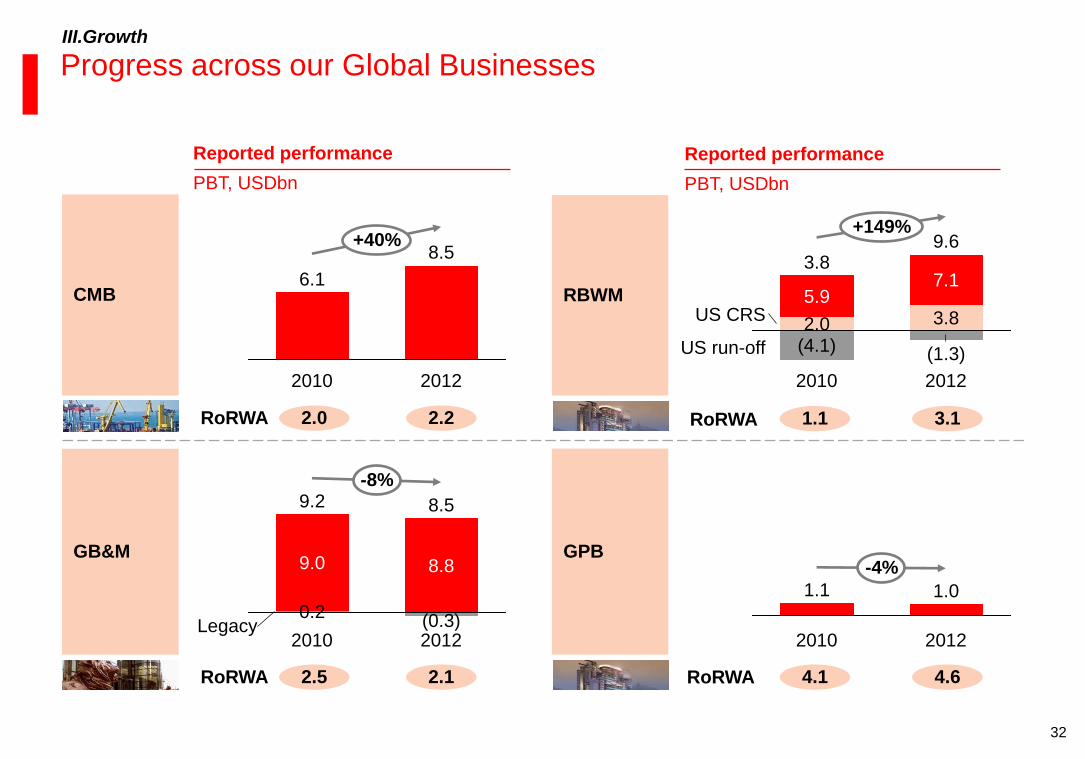
Progress across our Global Businesses
Reported performance
PBT, USDbn
2.5 2.1 RoRWA
2.0 2.2 RoRWA
CMB
GB&M
Reported performance
PBT, USDbn
RBWM
1.1 3.1 RoRWA
4.1 4.6 RoRWA
GPB
III.Growth
+149%
US run-off
US CRS
2012
9.6
(1.3)
3.8
7.1
2010
3.8
(4.1) 2.0
5.9
2012
8.8 9.0
-8%
2010
9.2
(0.3) 0.2
8.5
-4%
2012
1.0
2010
1.1
+40%
2012
8.5
2010
6.1
Legacy
33
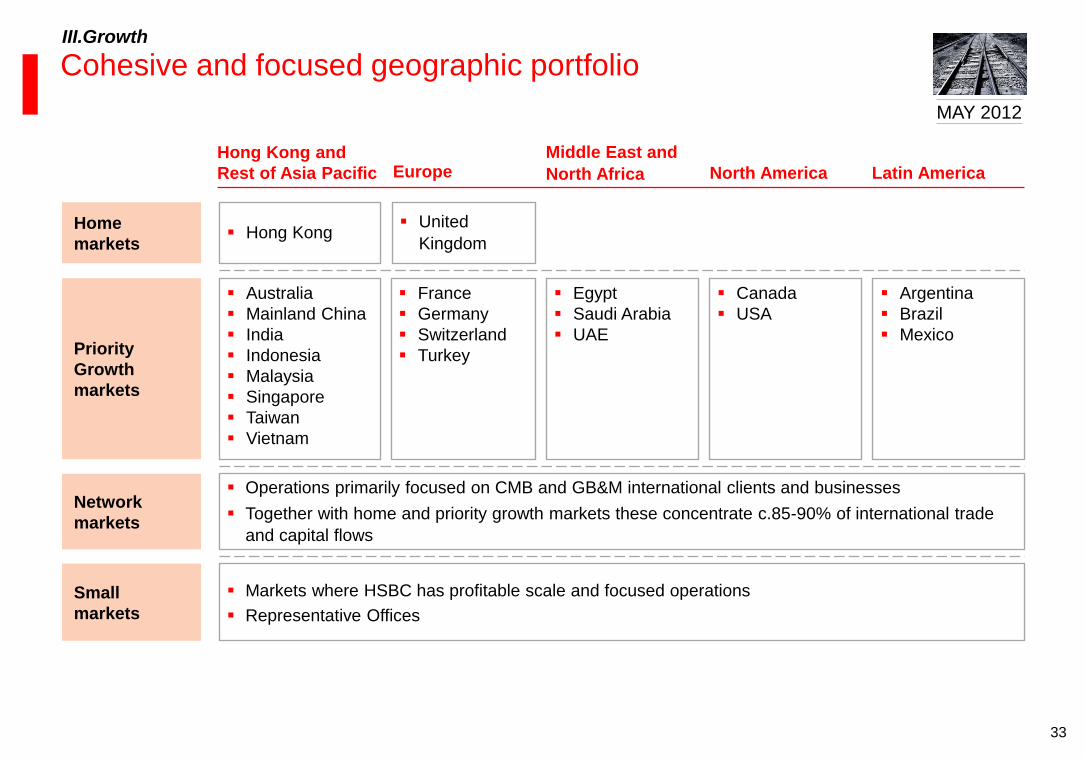
Cohesive and focused geographic portfolio
Network
markets
Small
markets
Home
markets
Priority
Growth
markets
Hong Kong and
Rest of Asia Pacific
Operations primarily focused on CMB and GB&M international clients and businesses
Together with home and priority growth markets these concentrate c.85-90% of international trade
and capital flows
Markets where HSBC has profitable scale and focused operations
Representative Offices
North America Latin America
Hong Kong
Middle East and
North Africa Europe
United
Kingdom
Egypt
Saudi Arabia
UAE
France
Germany
Switzerland
Turkey
Canada
USA
Australia
Mainland China
India
Indonesia
Malaysia
Singapore
Taiwan
Vietnam
Argentina
Brazil
Mexico
III.Growth
MAY 2012
34
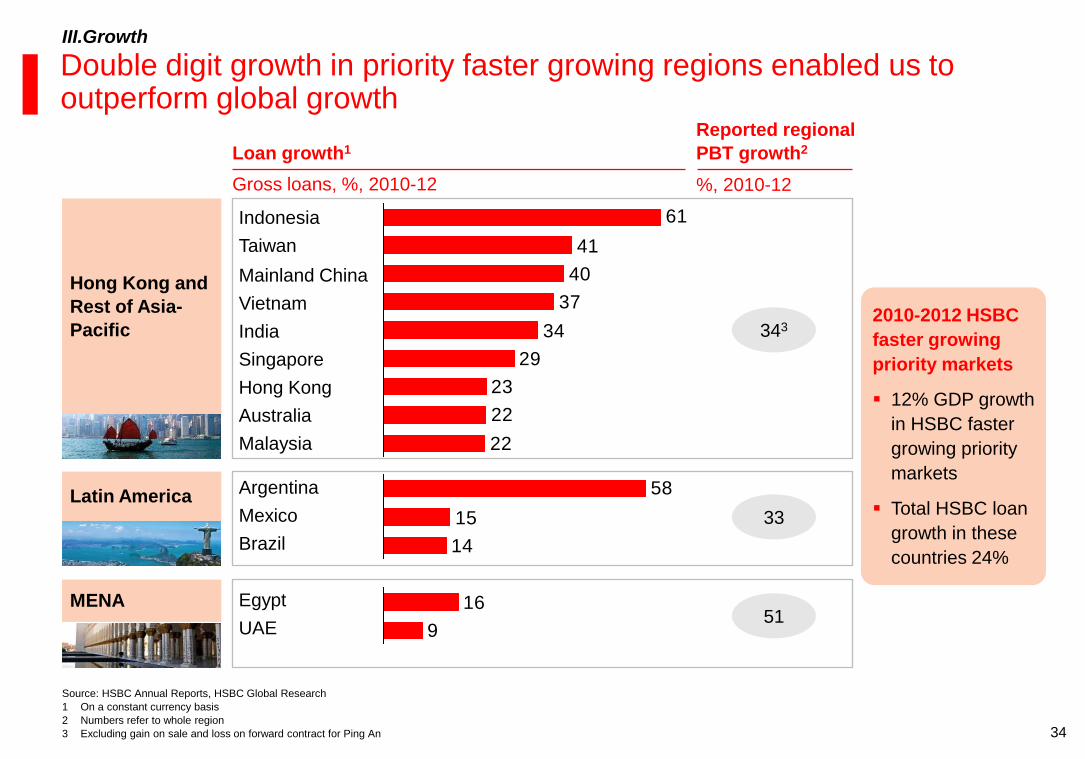
Loan growth1
Hong Kong and
Rest of Asia-
Pacific
Reported regional
PBT growth2
Gross loans, %, 2010-12
Latin America
MENA
Double digit growth in priority faster growing regions enabled us to outperform global growth
%, 2010-12
343
33
51
Source: HSBC Annual Reports, HSBC Global Research
1 On a constant currency basis
2 Numbers refer to whole region
3 Excluding gain on sale and loss on forward contract for Ping An
III.Growth
2010-2012 HSBC
faster growing
priority markets
12% GDP growth
in HSBC faster
growing priority
markets
Total HSBC loan
growth in these
countries 24%
22
22
23
29
34
37
40
41
61
14
15
58
9
16
Indonesia
Taiwan
Mainland China
Vietnam
India
Singapore
Hong Kong
Australia
Malaysia
Argentina
Mexico
Brazil
Egypt
UAE
35
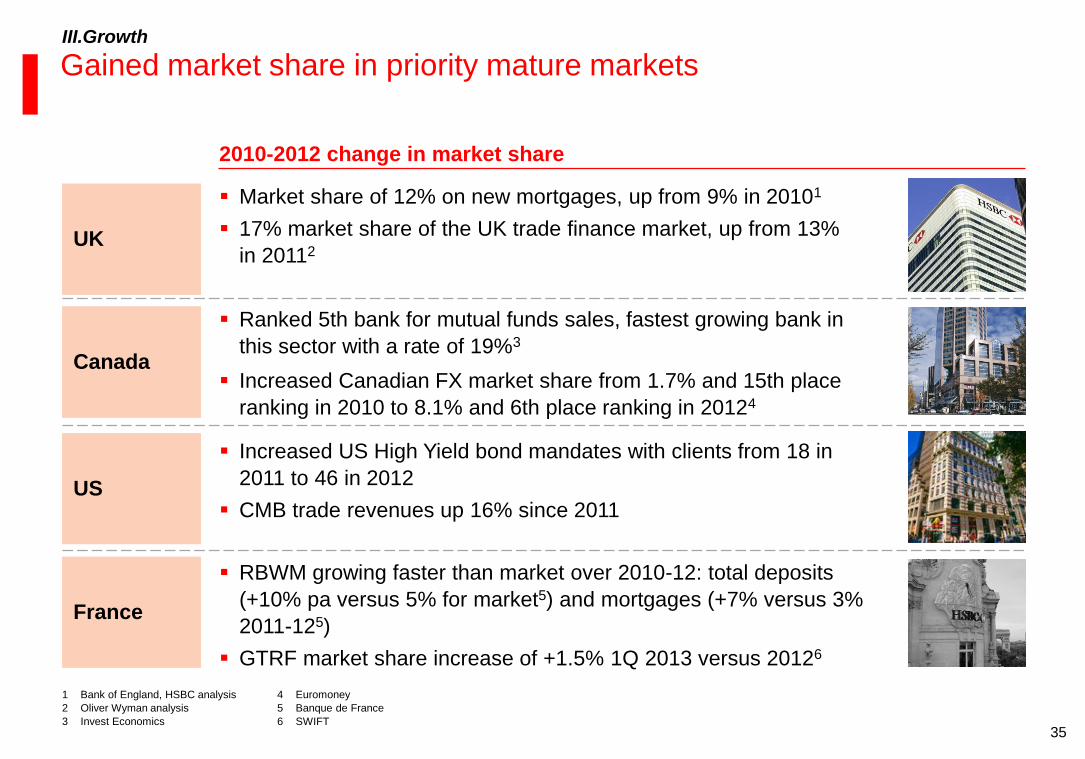
Gained market share in priority mature markets
1 Bank of England, HSBC analysis
2 Oliver Wyman analysis
3 Invest Economics
2010-2012 change in market share
UK
Market share of 12% on new mortgages, up from 9% in 20101
17% market share of the UK trade finance market, up from 13%
in 20112
US
Increased US High Yield bond mandates with clients from 18 in
2011 to 46 in 2012
CMB trade revenues up 16% since 2011
Canada
Ranked 5th bank for mutual funds sales, fastest growing bank in
this sector with a rate of 19%3
Increased Canadian FX market share from 1.7% and 15th place
ranking in 2010 to 8.1% and 6th place ranking in 20124
III.Growth
France
RBWM growing faster than market over 2010-12: total deposits
(+10% pa versus 5% for market5) and mortgages (+7% versus 3%
2011-125)
GTRF market share increase of +1.5% 1Q 2013 versus 20126
4 Euromoney
5 Banque de France
6 SWIFT
36
III.Growth
Wealth target
Significant momentum in the transformation of RBWM
Material progress
Established RBWM as Global Business
‒ Standardised organisation structure
‒ Global portfolio management
‒ Common business/operating model
‒ Common metrics
Wealth capabilities
‒ Changed Premier ambition – quantity to
quality
‒ 900k non-qualifying Premier migrated out
‒ Significant platform upgrading
‒ Building out managed solutions
Wealth revenues comprise of
‒ Investments
‒ Life insurance
‒ FX
‒ But exclude deposits
Modest progress of USD0.9bn incremental
revenues since 2011
Change in context since 2011
‒ Fundamental change in wealth distribution
model
‒ More challenging macro environment
37
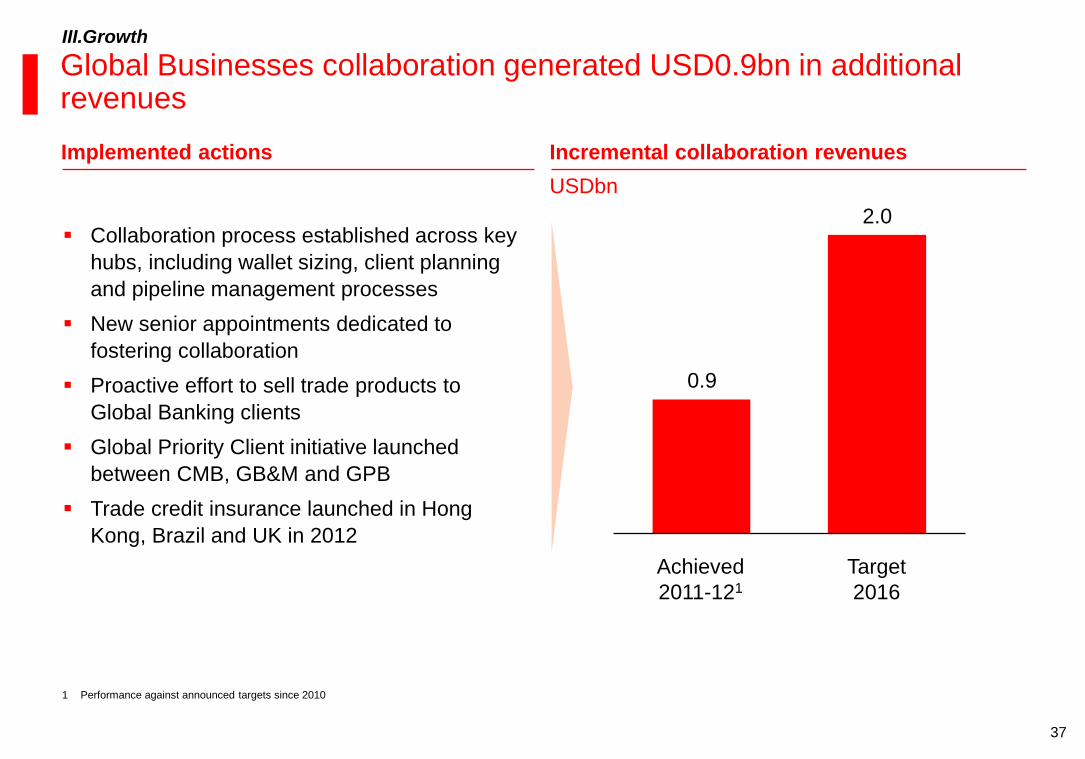
Global Businesses collaboration generated USD0.9bn in additional revenues
Implemented actions Incremental collaboration revenues
Collaboration process established across key
hubs, including wallet sizing, client planning
and pipeline management processes
New senior appointments dedicated to
fostering collaboration
Proactive effort to sell trade products to
Global Banking clients
Global Priority Client initiative launched
between CMB, GB&M and GPB
Trade credit insurance launched in Hong
Kong, Brazil and UK in 2012
USDbn
1 Performance against announced targets since 2010
III.Growth
0.9
2.0
Target
2016
Achieved
2011-121
38
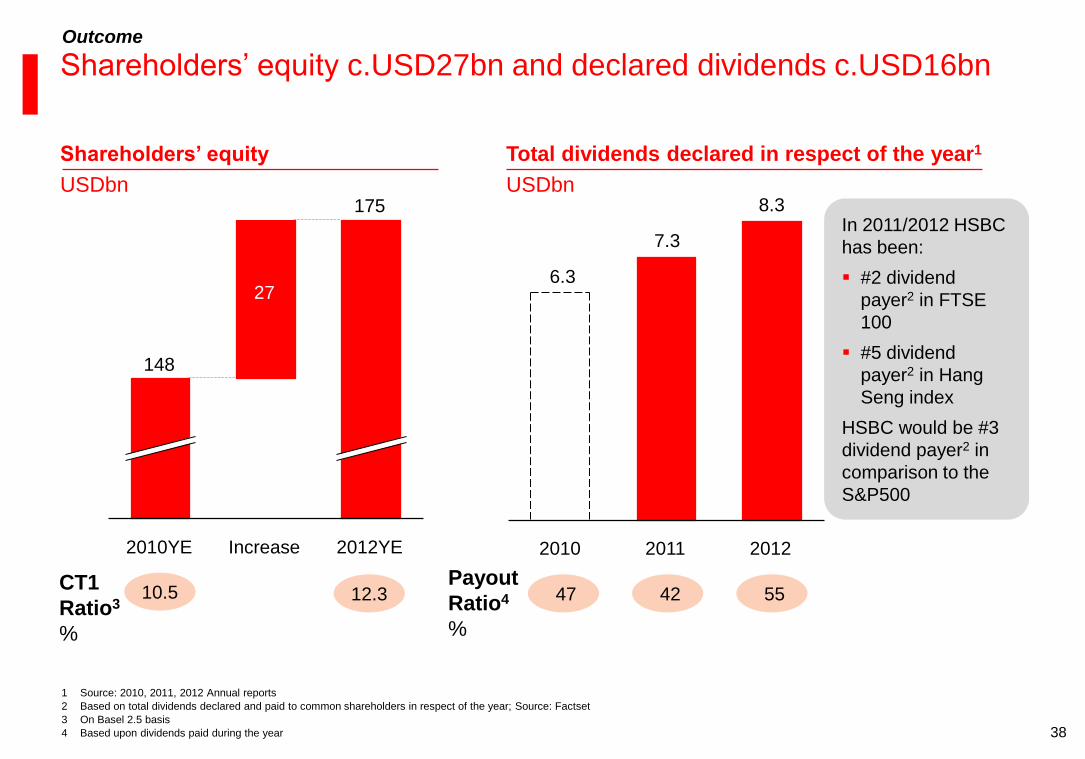
Shareholders’ equity c.USD27bn and declared dividends c.USD16bn
Shareholders’ equity Total dividends declared in respect of the year1
USDbn USDbn
CT1
Ratio3
%
10.5 12.3 42 55 Payout
Ratio4
%
6.3
7.3
8.3
2012 2011 2010
47
2012YE
175
Increase 2010YE
148
In 2011/2012 HSBC
has been:
#2 dividend
payer2 in FTSE
100
#5 dividend
payer2 in Hang
Seng index
HSBC would be #3
dividend payer2 in
comparison to the
S&P500
27
1 Source: 2010, 2011, 2012 Annual reports
2 Based on total dividends declared and paid to common shareholders in respect of the year; Source: Factset
3 On Basel 2.5 basis
4 Based upon dividends paid during the year
Outcome
39
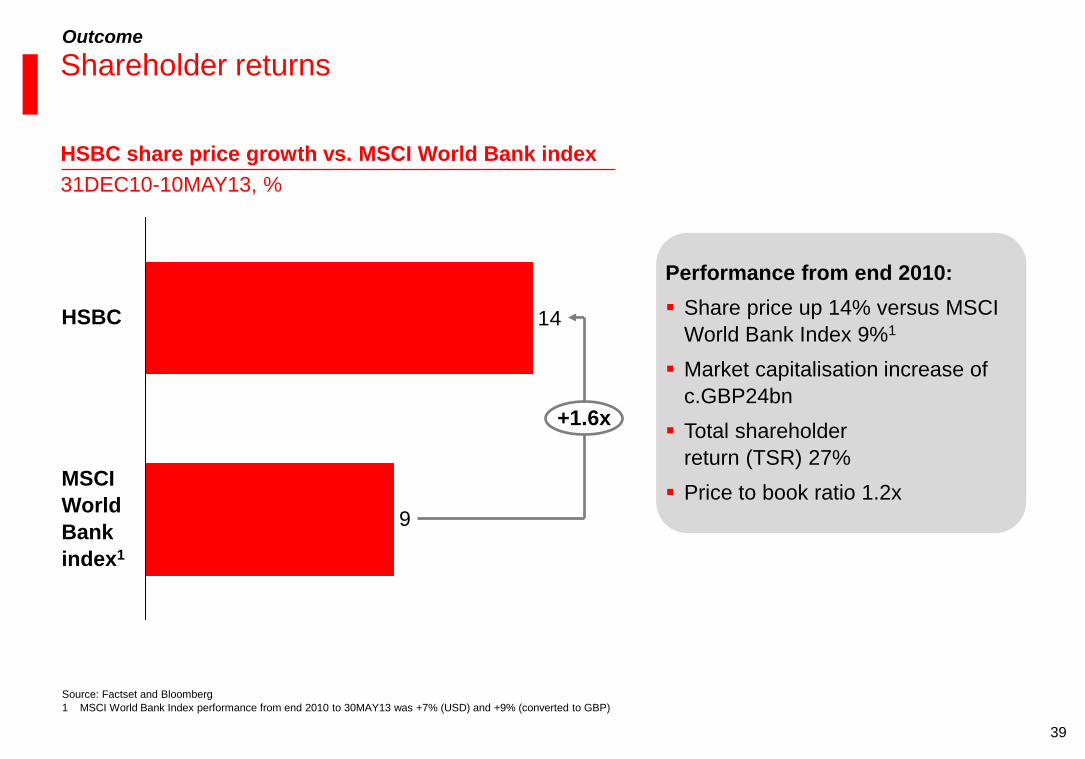
HSBC share price growth vs. MSCI World Bank index
31DEC10-10MAY13, %
Performance from end 2010:
Share price up 14% versus MSCI
World Bank Index 9%1
Market capitalisation increase of
c.GBP24bn
Total shareholder
return (TSR) 27%
Price to book ratio 1.2x
Shareholder returns Outcome
Source: Factset and Bloomberg
1 MSCI World Bank Index performance from end 2010 to 30MAY13 was +7% (USD) and +9% (converted to GBP)
9
14
+1.6x
MSCI
World
Bank
index1
HSBC
40
Why should you own HSBC?
B Proven track record in delivering change – First phase
Clear plan for growth and shareholder returns – Next phase C
A Distinctive position in the new banking environment
Break
41
Why should you own HSBC?
B Proven track record in delivering change – First phase
Clear plan for growth and shareholder returns – Next phase C
A Distinctive position in the new banking environment
Priorities I
Financial targets II
III Vision
42
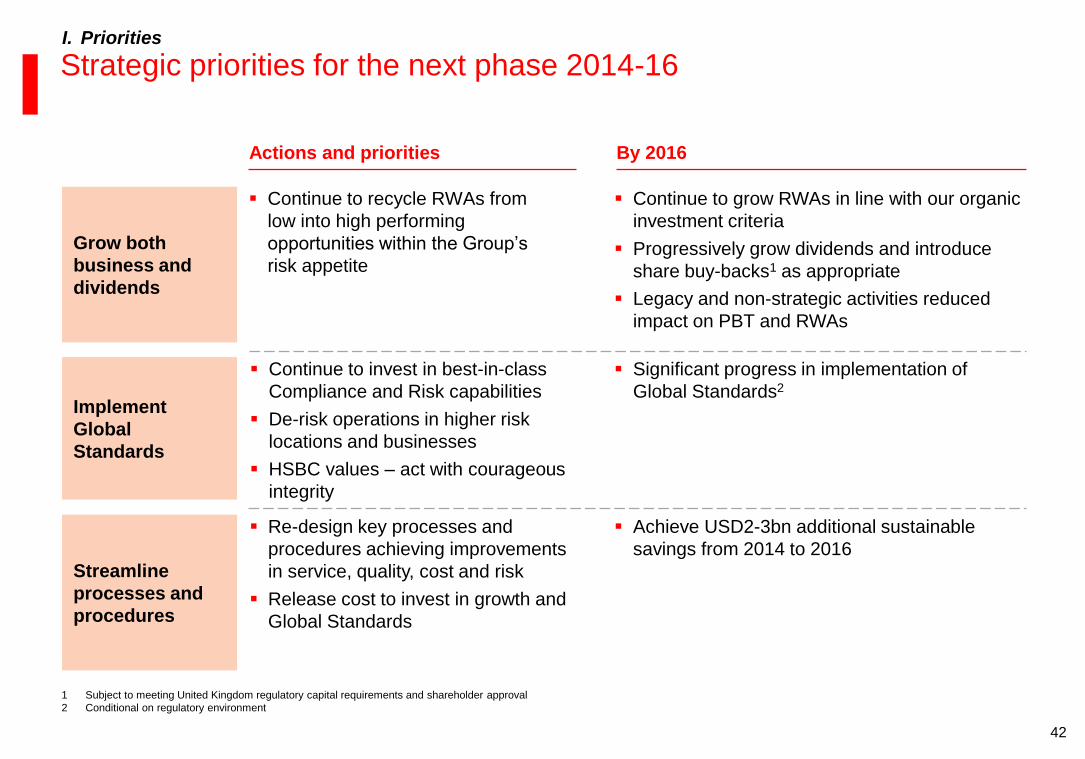
Strategic priorities for the next phase 2014-16
Implement
Global
Standards
Continue to invest in best-in-class
Compliance and Risk capabilities
De-risk operations in higher risk
locations and businesses
HSBC values – act with courageous
integrity
Continue to recycle RWAs from
low into high performing
opportunities within the Group’s
risk appetite
Grow both
business and
dividends
Re-design key processes and
procedures achieving improvements
in service, quality, cost and risk
Release cost to invest in growth and
Global Standards
Streamline
processes and
procedures
By 2016
Significant progress in implementation of
Global Standards2
Continue to grow RWAs in line with our organic
investment criteria
Progressively grow dividends and introduce
share buy-backs1 as appropriate
Legacy and non-strategic activities reduced
impact on PBT and RWAs
Achieve USD2-3bn additional sustainable
savings from 2014 to 2016
I. Priorities
Actions and priorities
1 Subject to meeting United Kingdom regulatory capital requirements and shareholder approval
2 Conditional on regulatory environment
43
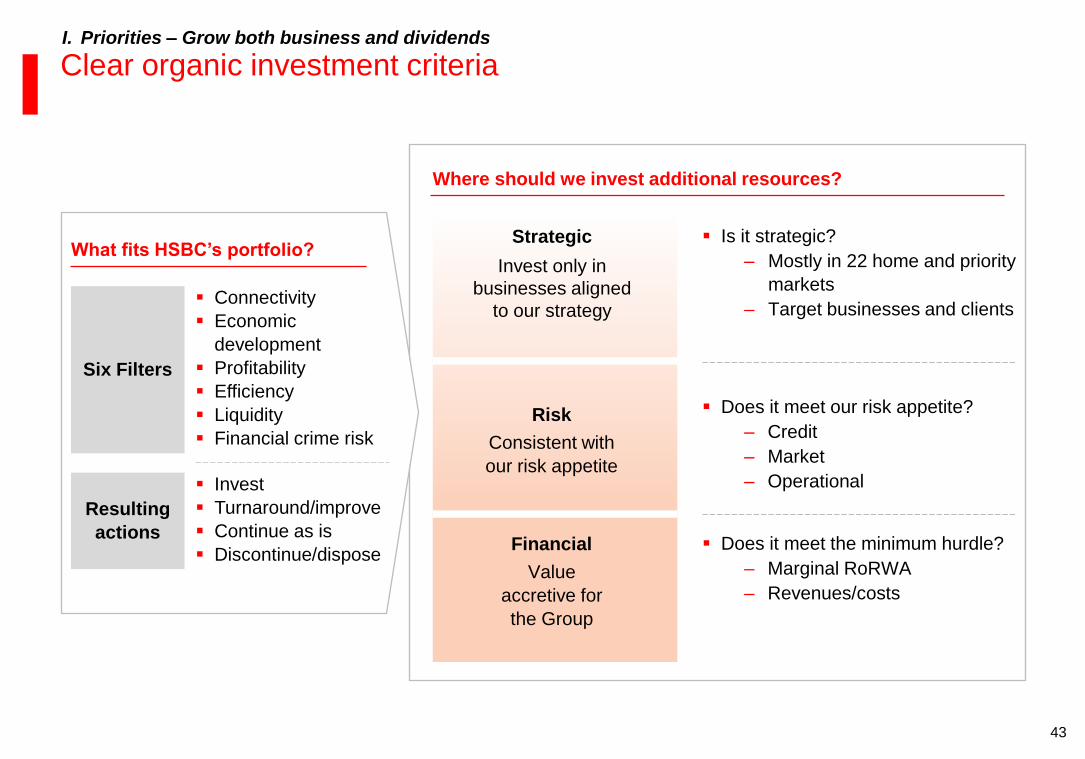
Is it strategic?
‒ Mostly in 22 home and priority
markets
‒ Target businesses and clients
Does it meet our risk appetite?
– Credit
– Market
– Operational
Does it meet the minimum hurdle?
– Marginal RoRWA
– Revenues/costs
Strategic
Invest only in
businesses aligned
to our strategy
Risk
Consistent with
our risk appetite
Financial
Value
accretive for
the Group
Where should we invest additional resources?
Clear organic investment criteria
What fits HSBC’s portfolio?
Connectivity
Economic
development
Profitability
Efficiency
Liquidity
Financial crime risk
Six Filters
Resulting
actions
Invest
Turnaround/improve
Continue as is
Discontinue/dispose
I. Priorities – Grow both business and dividends
44
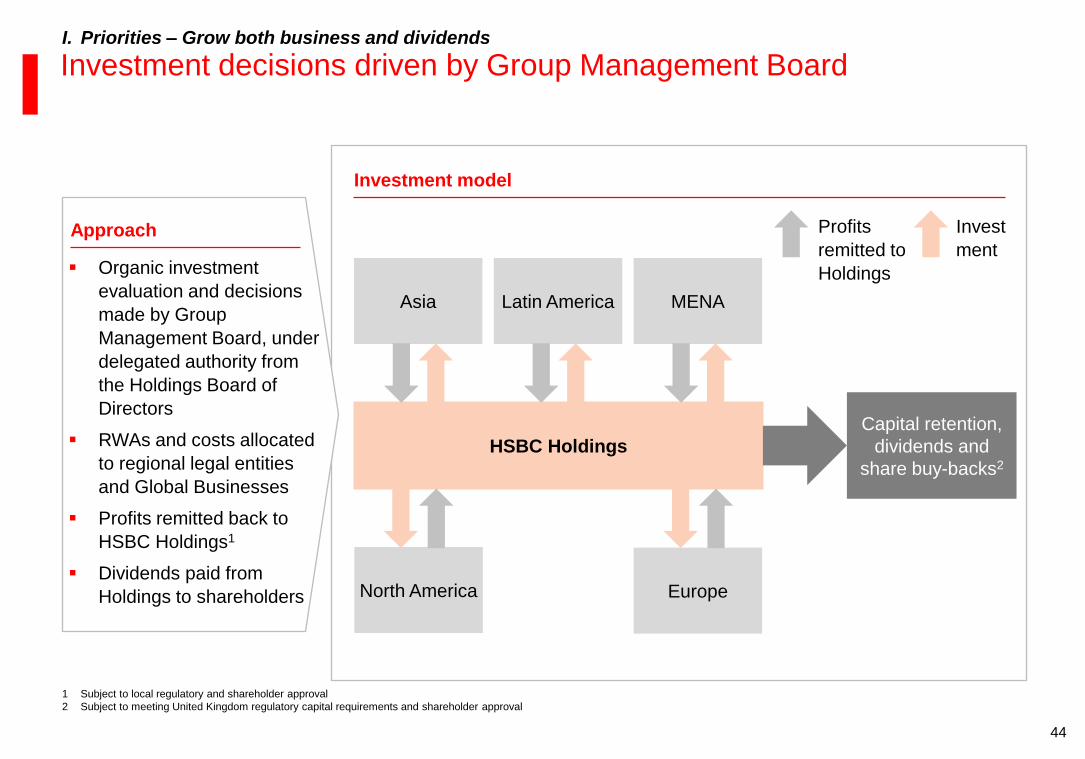
Investment decisions driven by Group Management Board I. Priorities – Grow both business and dividends
1 Subject to local regulatory and shareholder approval
2 Subject to meeting United Kingdom regulatory capital requirements and shareholder approval
Invest
ment
Profits
remitted to
Holdings Organic investment
evaluation and decisions
made by Group
Management Board, under
delegated authority from
the Holdings Board of
Directors
RWAs and costs allocated
to regional legal entities
and Global Businesses
Profits remitted back to
HSBC Holdings1
Dividends paid from
Holdings to shareholders
Approach
Investment model
HSBC Holdings
Capital retention,
dividends and
share buy-backs2
Asia Latin America MENA
North America Europe
45
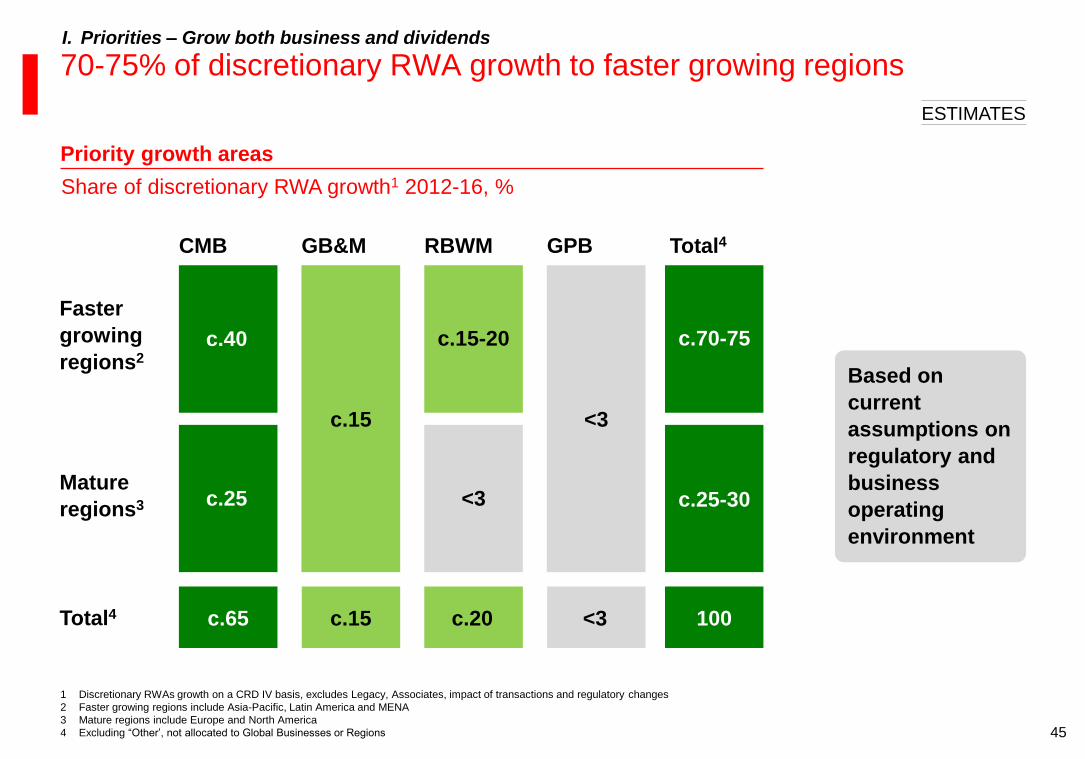
70-75% of discretionary RWA growth to faster growing regions I. Priorities – Grow both business and dividends
Priority growth areas
Share of discretionary RWA growth1 2012-16, %
1 Discretionary RWAs growth on a CRD IV basis, excludes Legacy, Associates, impact of transactions and regulatory changes
2 Faster growing regions include Asia-Pacific, Latin America and MENA
3 Mature regions include Europe and North America
4 Excluding “Other’, not allocated to Global Businesses or Regions
ESTIMATES
GB&M GPB
Faster
growing
regions2
Mature
regions3
Total4
CMB RBWM Total4
c.40
c.15
c.65 c.20
c.70
c.15
<3
<3 100
c.25
c.70-75
c.25-30
c.15-20
<3
Based on
current
assumptions on
regulatory and
business
operating
environment
46
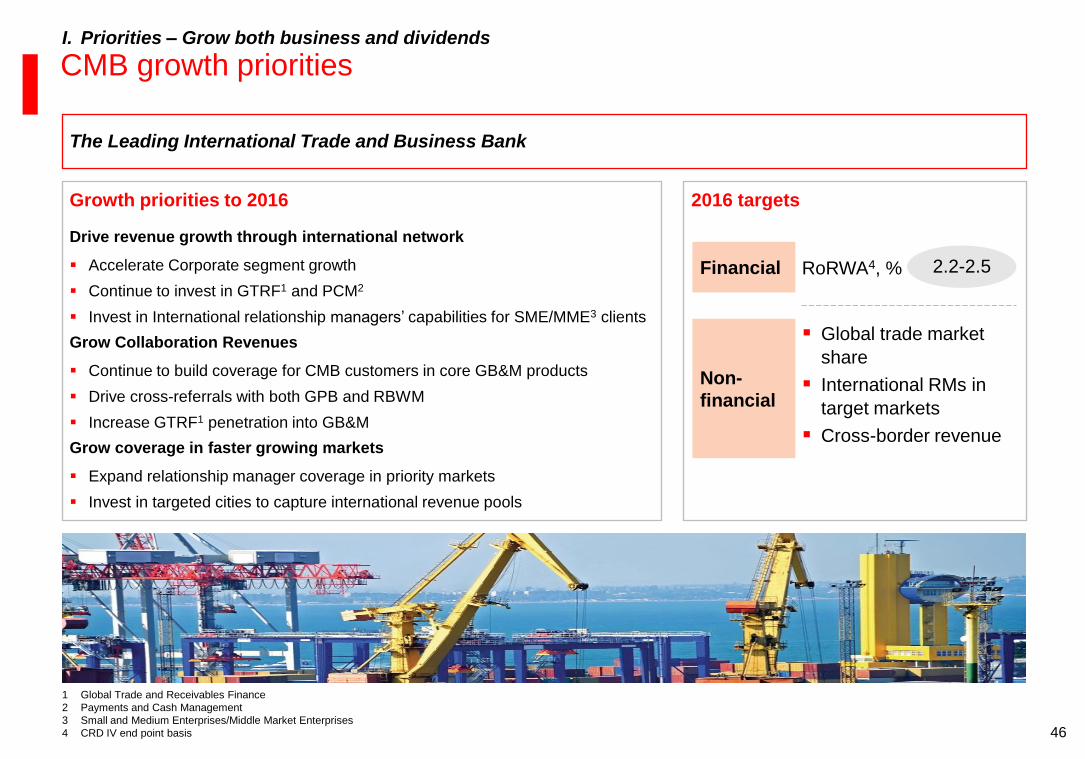
CMB growth priorities
The Leading International Trade and Business Bank
2016 targets Growth priorities to 2016
Drive revenue growth through international network
Accelerate Corporate segment growth
Continue to invest in GTRF1 and PCM2
Invest in International relationship managers’ capabilities for SME/MME3 clients
Grow Collaboration Revenues
Continue to build coverage for CMB customers in core GB&M products
Drive cross-referrals with both GPB and RBWM
Increase GTRF1 penetration into GB&M
Grow coverage in faster growing markets
Expand relationship manager coverage in priority markets
Invest in targeted cities to capture international revenue pools
Financial
Non-
financial
RoRWA4, %
Global trade market
share
International RMs in
target markets
Cross-border revenue
2.2-2.5
I. Priorities – Grow both business and dividends
1 Global Trade and Receivables Finance
2 Payments and Cash Management
3 Small and Medium Enterprises/Middle Market Enterprises
4 CRD IV end point basis
47
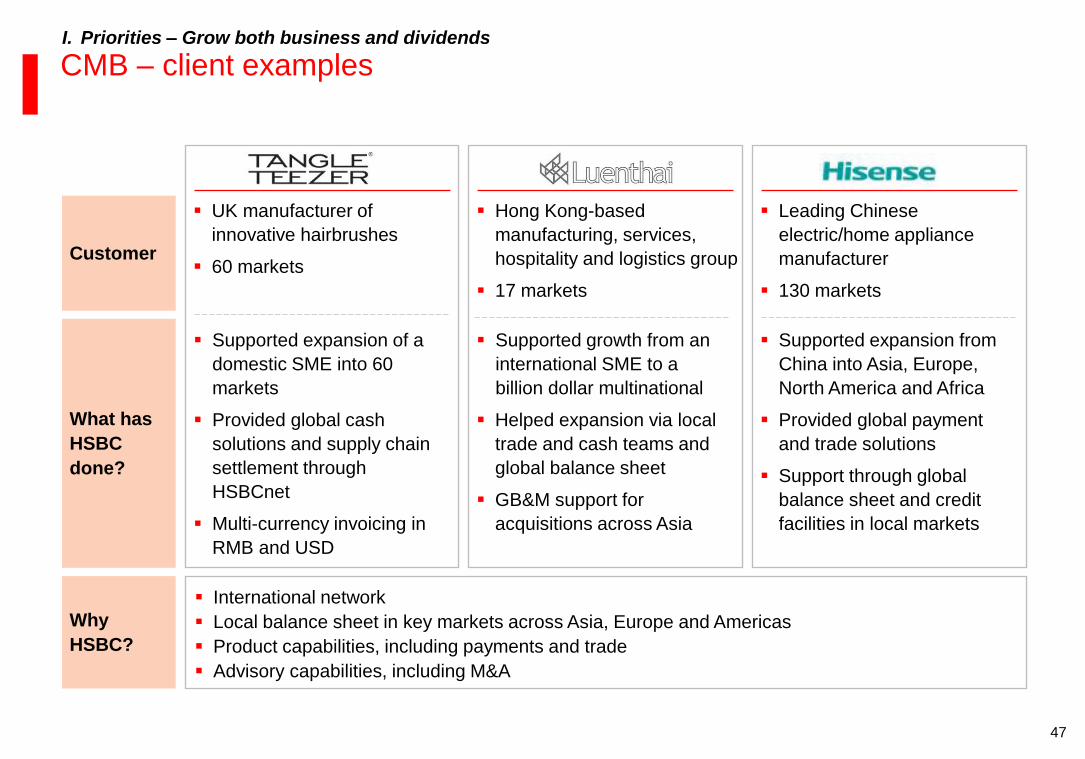
CMB – client examples I. Priorities – Grow both business and dividends
What has
HSBC
done?
Supported growth from an
international SME to a
billion dollar multinational
Helped expansion via local
trade and cash teams and
global balance sheet
GB&M support for
acquisitions across Asia
Supported expansion from
China into Asia, Europe,
North America and Africa
Provided global payment
and trade solutions
Support through global
balance sheet and credit
facilities in local markets
Why
HSBC?
Supported expansion of a
domestic SME into 60
markets
Provided global cash
solutions and supply chain
settlement through
HSBCnet
Multi-currency invoicing in
RMB and USD
Customer
Hong Kong-based
manufacturing, services,
hospitality and logistics group
17 markets
Leading Chinese
electric/home appliance
manufacturer
130 markets
UK manufacturer of
innovative hairbrushes
60 markets
International network
Local balance sheet in key markets across Asia, Europe and Americas
Product capabilities, including payments and trade
Advisory capabilities, including M&A
48
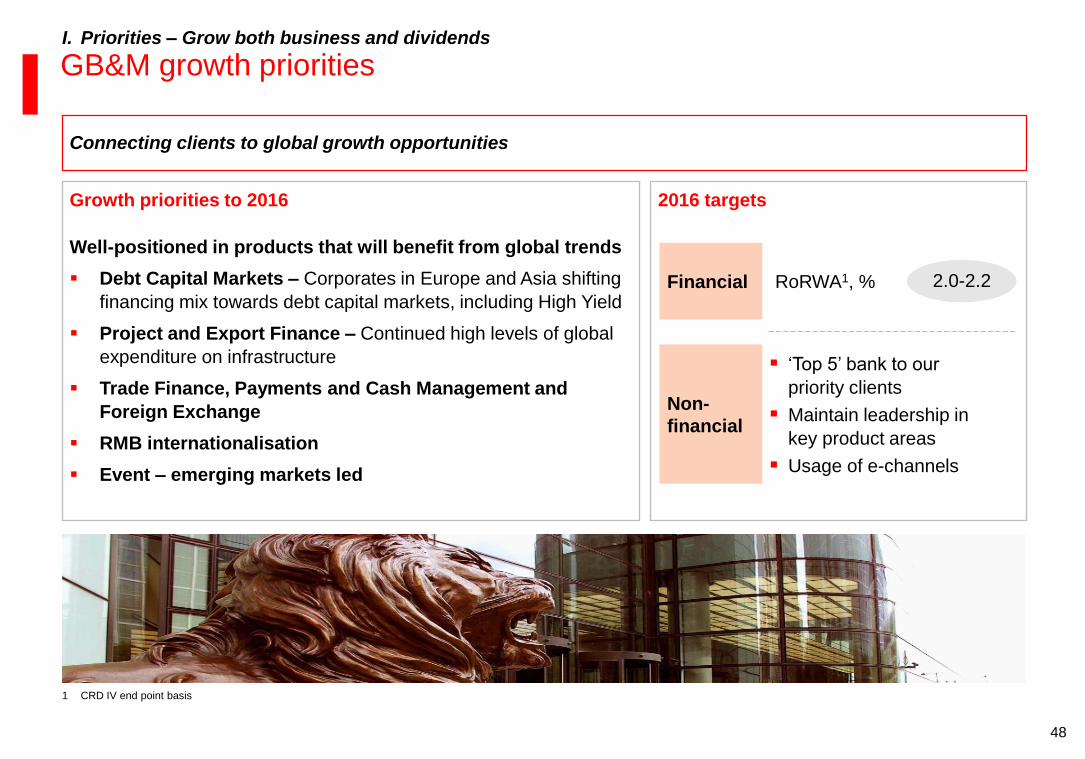
GB&M growth priorities
Connecting clients to global growth opportunities
I. Priorities – Grow both business and dividends
2016 targets Growth priorities to 2016
Well-positioned in products that will benefit from global trends
Debt Capital Markets – Corporates in Europe and Asia shifting
financing mix towards debt capital markets, including High Yield
Project and Export Finance – Continued high levels of global
expenditure on infrastructure
Trade Finance, Payments and Cash Management and
Foreign Exchange
RMB internationalisation
Event – emerging markets led
Financial
Non-
financial
‘Top 5’ bank to our
priority clients
Maintain leadership in
key product areas
Usage of e-channels
2.0-2.2
1 CRD IV end point basis
RoRWA1, %
49
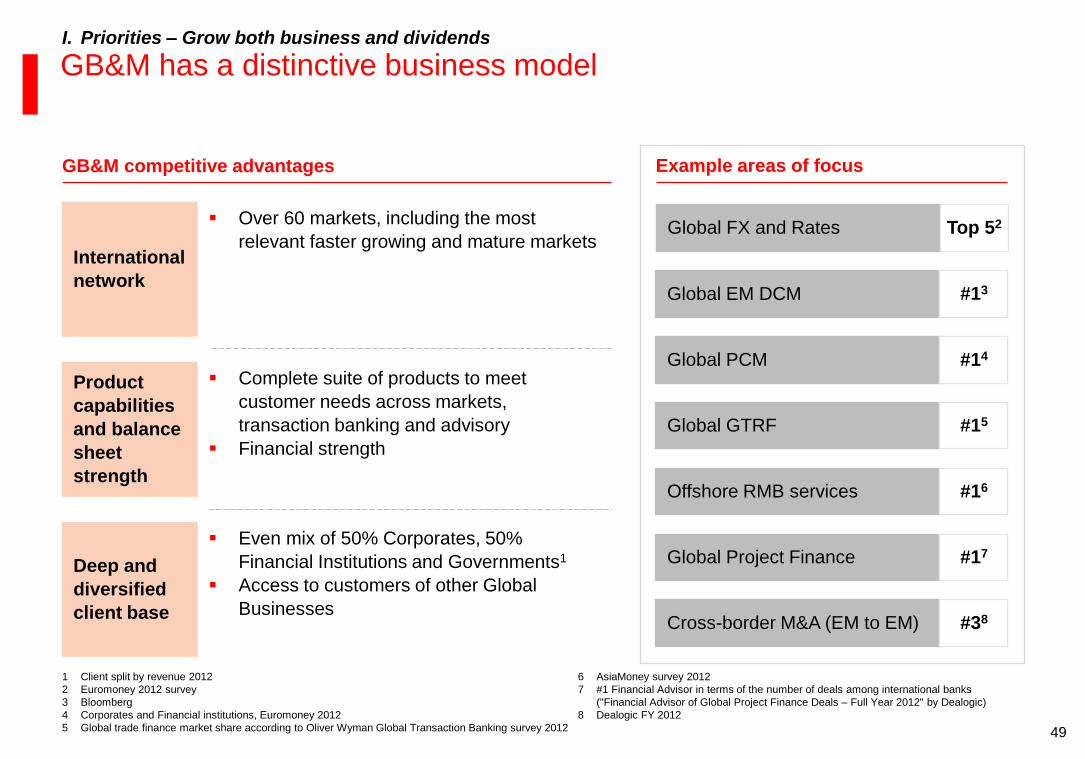
GB&M has a distinctive business model I. Priorities – Grow both business and dividends
GB&M competitive advantages
Over 60 markets, including the most
relevant faster growing and mature markets
Complete suite of products to meet
customer needs across markets,
transaction banking and advisory
Financial strength
Even mix of 50% Corporates, 50%
Financial Institutions and Governments1
Access to customers of other Global
Businesses
International
network
Product
capabilities
and balance
sheet
strength
Deep and
diversified
client base
Example areas of focus
Global EM DCM #13
Global GTRF #15
Cross-border M&A (EM to EM) #38
Global PCM #14
Offshore RMB services #16
Global FX and Rates Top 52
Global Project Finance #17
1 Client split by revenue 2012
2 Euromoney 2012 survey
3 Bloomberg
4 Corporates and Financial institutions, Euromoney 2012
5 Global trade finance market share according to Oliver Wyman Global Transaction Banking survey 2012
6 AsiaMoney survey 2012
7 #1 Financial Advisor in terms of the number of deals among international banks
("Financial Advisor of Global Project Finance Deals – Full Year 2012" by Dealogic)
8 Dealogic FY 2012
50
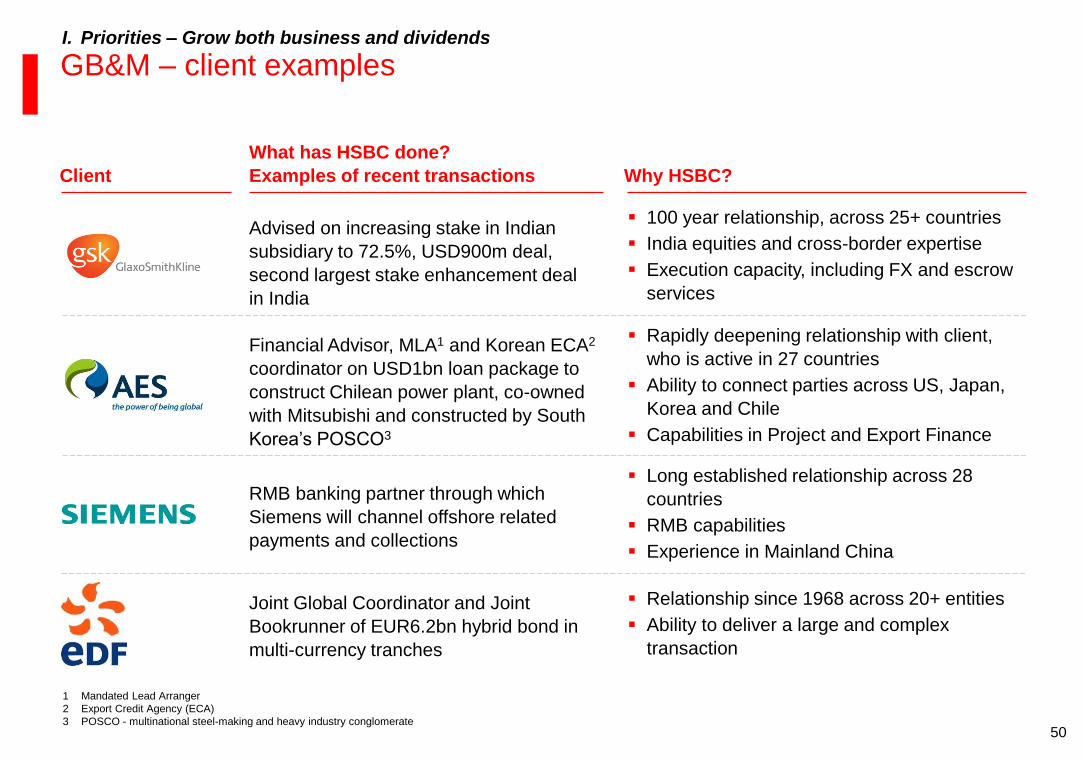
GB&M – client examples
Client
Advised on increasing stake in Indian
subsidiary to 72.5%, USD900m deal,
second largest stake enhancement deal
in India
100 year relationship, across 25+ countries
India equities and cross-border expertise
Execution capacity, including FX and escrow
services
Financial Advisor, MLA1 and Korean ECA2
coordinator on USD1bn loan package to
construct Chilean power plant, co-owned
with Mitsubishi and constructed by South
Korea’s POSCO3
Rapidly deepening relationship with client,
who is active in 27 countries
Ability to connect parties across US, Japan,
Korea and Chile
Capabilities in Project and Export Finance
Joint Global Coordinator and Joint
Bookrunner of EUR6.2bn hybrid bond in
multi-currency tranches
Relationship since 1968 across 20+ entities
Ability to deliver a large and complex
transaction
RMB banking partner through which
Siemens will channel offshore related
payments and collections
Long established relationship across 28
countries
RMB capabilities
Experience in Mainland China
I. Priorities – Grow both business and dividends
1 Mandated Lead Arranger
2 Export Credit Agency (ECA)
3 POSCO - multinational steel-making and heavy industry conglomerate
What has HSBC done?
Examples of recent transactions Why HSBC?
51
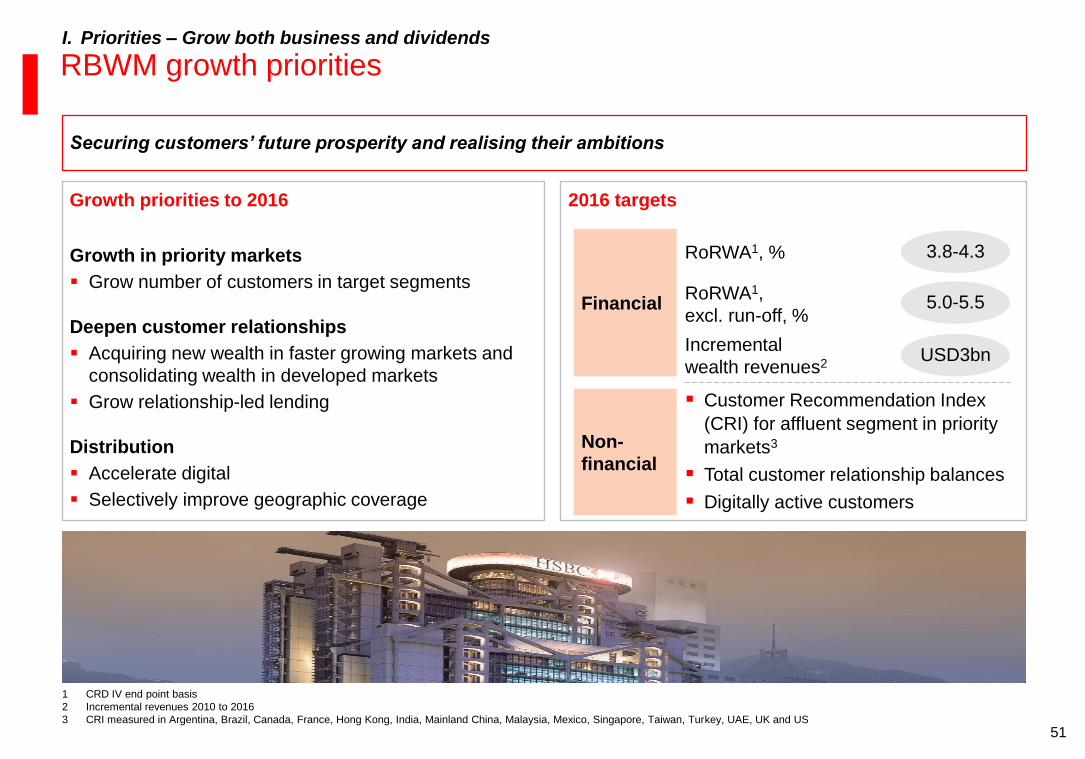
RBWM growth priorities I. Priorities – Grow both business and dividends
1 CRD IV end point basis
2 Incremental revenues 2010 to 2016
3 CRI measured in Argentina, Brazil, Canada, France, Hong Kong, India, Mainland China, Malaysia, Mexico, Singapore, Taiwan, Turkey, UAE, UK and US
Securing customers’ future prosperity and realising their ambitions
2016 targets Growth priorities to 2016
Growth in priority markets
Grow number of customers in target segments
Deepen customer relationships
Acquiring new wealth in faster growing markets and
consolidating wealth in developed markets
Grow relationship-led lending
Distribution
Accelerate digital
Selectively improve geographic coverage
Financial
Non-
financial
RoRWA1, %
Customer Recommendation Index
(CRI) for affluent segment in priority
markets3
Total customer relationship balances
Digitally active customers
3.8-4.3
Incremental
wealth revenues2 USD3bn
RoRWA1,
excl. run-off, % 5.0-5.5
52
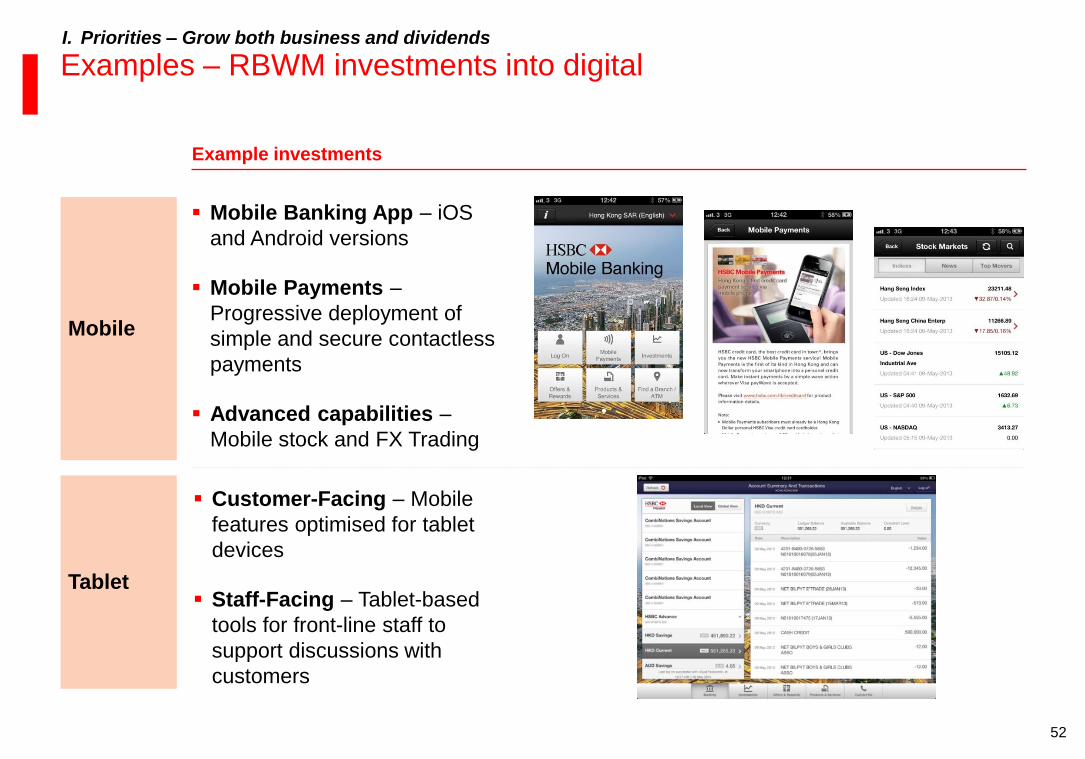
Examples – RBWM investments into digital
Example investments
Mobile
Tablet
Mobile Banking App – iOS
and Android versions
Mobile Payments –
Progressive deployment of
simple and secure contactless
payments
Advanced capabilities –
Mobile stock and FX Trading
Customer-Facing – Mobile
features optimised for tablet
devices
Staff-Facing – Tablet-based
tools for front-line staff to
support discussions with
customers
I. Priorities – Grow both business and dividends
53
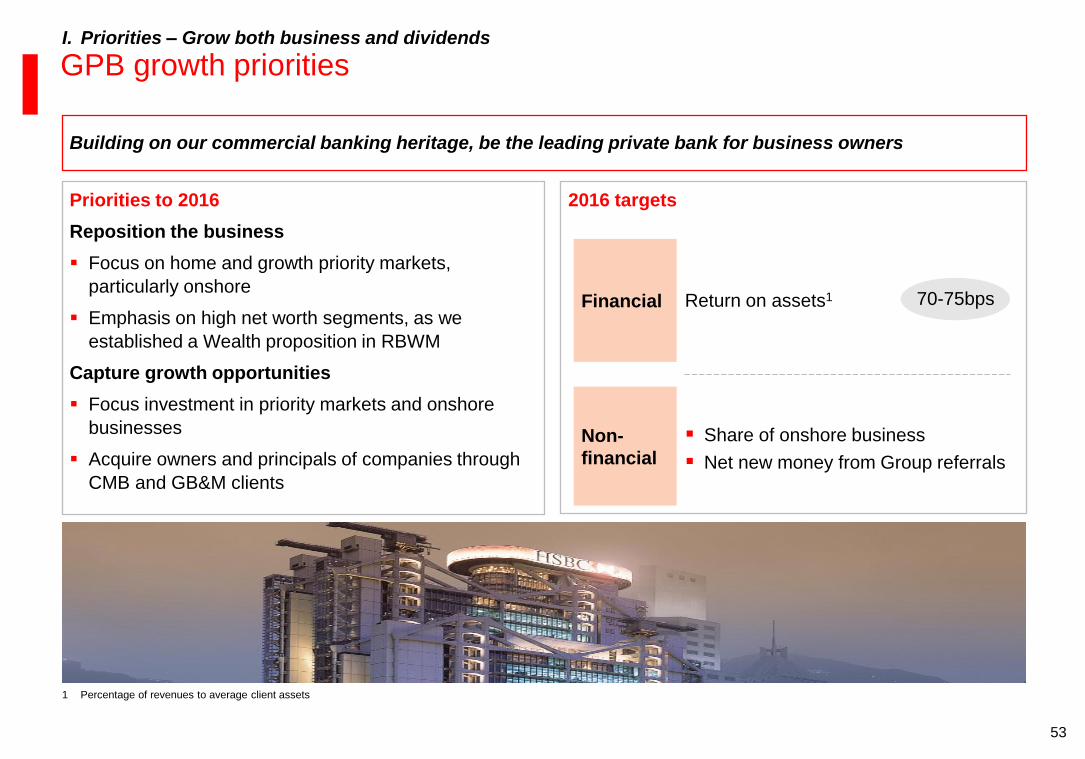
GPB growth priorities I. Priorities – Grow both business and dividends
1 Percentage of revenues to average client assets
Building on our commercial banking heritage, be the leading private bank for business owners
2016 targets Priorities to 2016
Reposition the business
Focus on home and growth priority markets,
particularly onshore
Emphasis on high net worth segments, as we
established a Wealth proposition in RBWM
Capture growth opportunities
Focus investment in priority markets and onshore
businesses
Acquire owners and principals of companies through
CMB and GB&M clients
Financial
Non-
financial
Return on assets1
Share of onshore business
Net new money from Group referrals
70-75bps
54
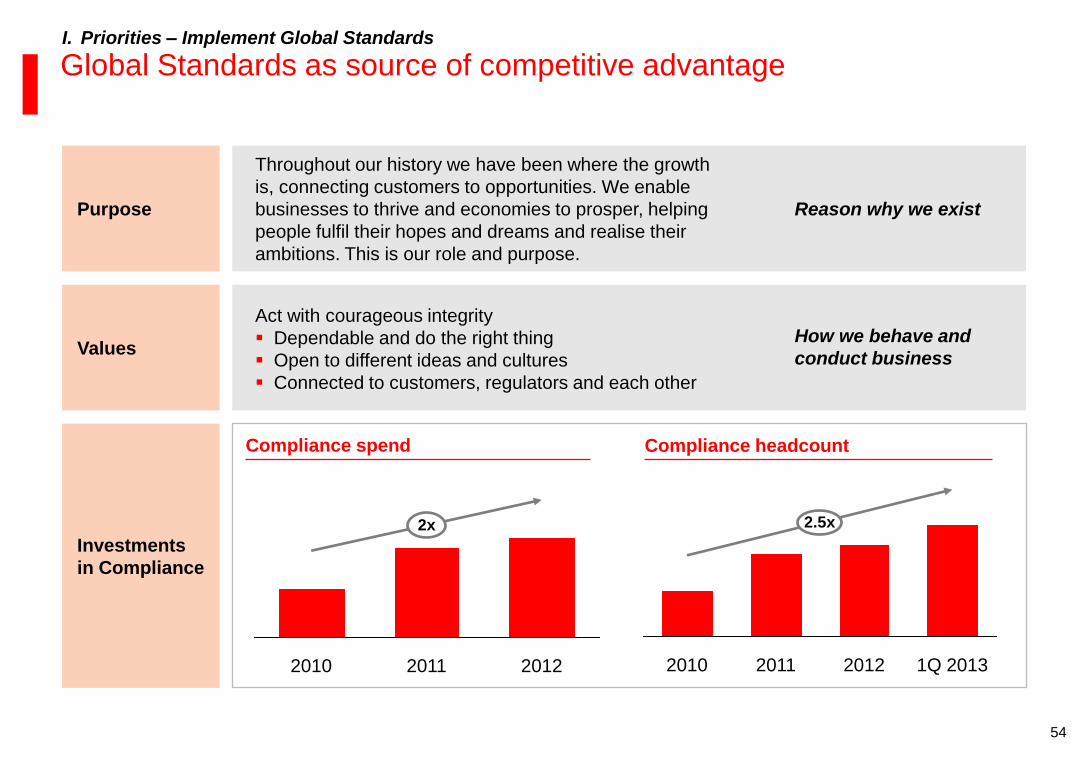
Global Standards as source of competitive advantage
Investments
in Compliance
Compliance headcount
Purpose
Values
Reason why we exist
Throughout our history we have been where the growth
is, connecting customers to opportunities. We enable
businesses to thrive and economies to prosper, helping
people fulfil their hopes and dreams and realise their
ambitions. This is our role and purpose.
How we behave and
conduct business
Act with courageous integrity
Dependable and do the right thing
Open to different ideas and cultures
Connected to customers, regulators and each other
Compliance spend
2.5x
1Q 2013 2012 2011 2010
2x
2012 2011 2010
I. Priorities – Implement Global Standards

55
Global Standards define governance and programmes
1 New Board committee of external experts and independent advisers
2 Part of the Group Management Board
3 Deferred Prosecution Agreement
Financial
Intelligence
Financial Crime
Compliance
Customer Due
Diligence
Global Standards
Steering Meeting2
Global Standards
Execution
Committee
Governance
Programmes
Financial System
Vulnerabilities
Committee1
Develop an integrated framework to manage financial crime risk more
effectively (including Affiliates Due Diligence, Tax Transparency, Bearer
Shares, Customer Selection and Exit Policy)
Sets the strategic direction and priorities for the Global Standards
programme
Provides execution control across line of business based on strategic
direction and priorities
Create a consistent, flexible and scalable organisation and establish
controls to meet DPA3 and other regulatory obligations
Build our capabilities in capturing and using customer and transactional
level data to identify suspicious transactions, activity or connections
Provides governance, oversight and policy advice to simplify business
activities and enhance risk management and control
I. Priorities – Implement Global Standards
56
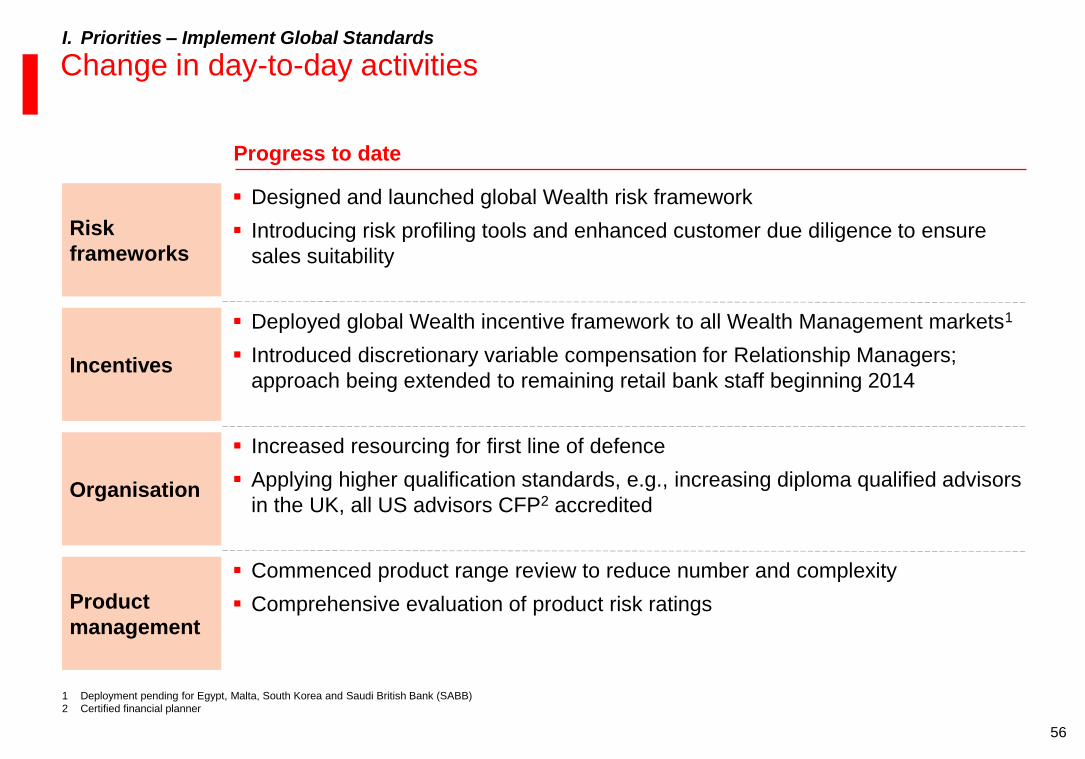
Change in day-to-day activities
1 Deployment pending for Egypt, Malta, South Korea and Saudi British Bank (SABB)
2 Certified financial planner
Progress to date
Incentives
Deployed global Wealth incentive framework to all Wealth Management markets1
Introduced discretionary variable compensation for Relationship Managers;
approach being extended to remaining retail bank staff beginning 2014
Designed and launched global Wealth risk framework
Introducing risk profiling tools and enhanced customer due diligence to ensure
sales suitability
Risk
frameworks
Increased resourcing for first line of defence
Applying higher qualification standards, e.g., increasing diploma qualified advisors
in the UK, all US advisors CFP2 accredited Organisation
Commenced product range review to reduce number and complexity
Comprehensive evaluation of product risk ratings Product
management
I. Priorities – Implement Global Standards
57
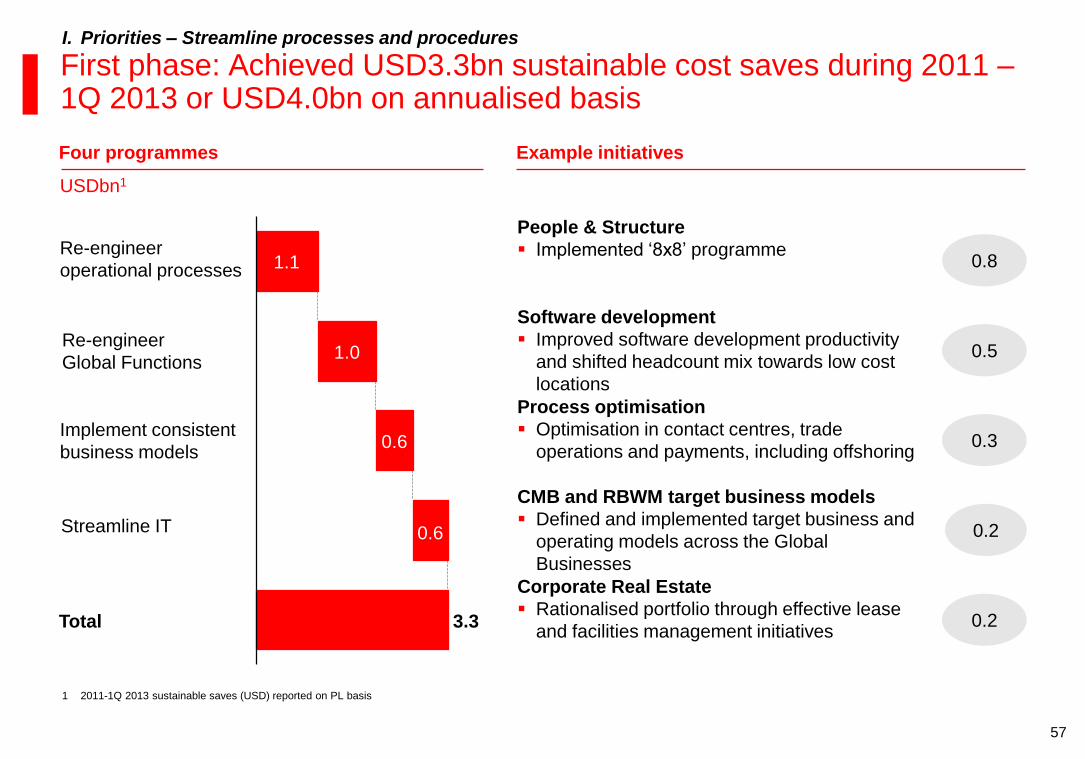
First phase: Achieved USD3.3bn sustainable cost saves during 2011 – 1Q 2013 or USD4.0bn on annualised basis
Four programmes Example initiatives
USDbn1
People & Structure
Implemented ‘8x8’ programme
Corporate Real Estate
Rationalised portfolio through effective lease
and facilities management initiatives
CMB and RBWM target business models
Defined and implemented target business and
operating models across the Global
Businesses
Software development
Improved software development productivity
and shifted headcount mix towards low cost
locations
Total 3.3
Streamline IT 0.6
Implement consistent
business models 0.6
Re-engineer
Global Functions 1.0
Re-engineer
operational processes 1.1 0.8
0.2
0.2
0.5
I. Priorities – Streamline processes and procedures
Process optimisation
Optimisation in contact centres, trade
operations and payments, including offshoring 0.3
1 2011-1Q 2013 sustainable saves (USD) reported on PL basis
58
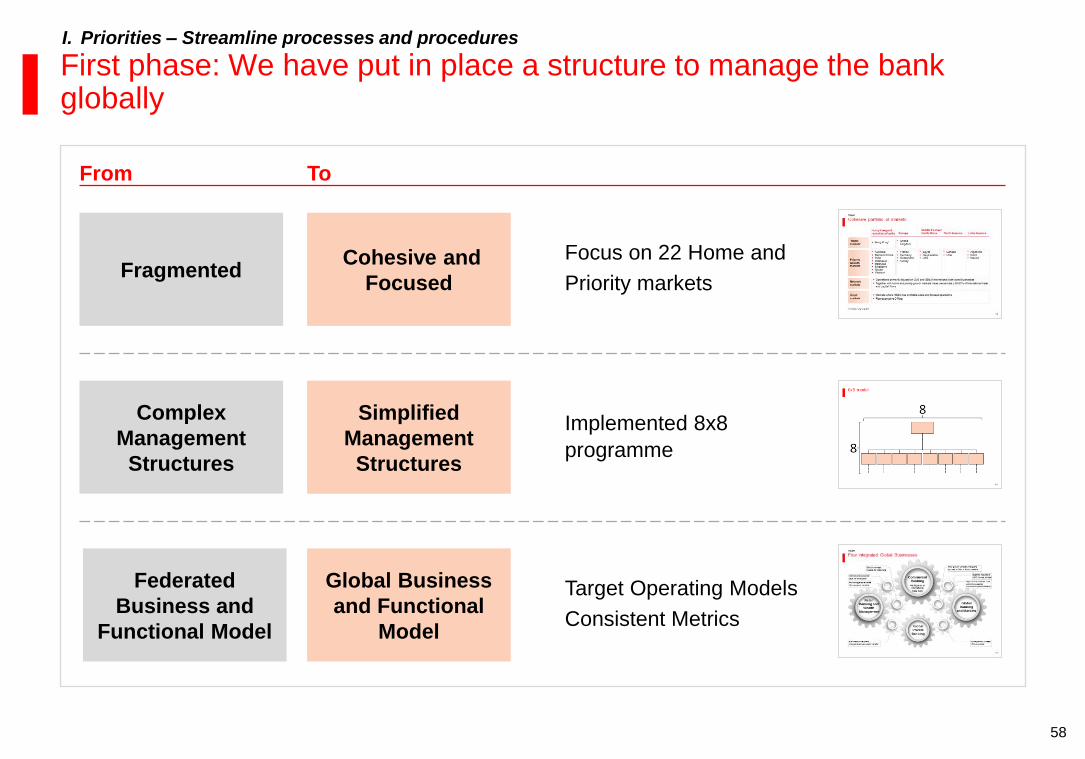
First phase: We have put in place a structure to manage the bank globally
Focus on 22 Home and
Priority markets Fragmented
Cohesive and
Focused
Federated
Business and
Functional Model
Global Business
and Functional
Model
Target Operating Models
Consistent Metrics
Complex
Management
Structures
Simplified
Management
Structures
From To
Implemented 8x8
programme
I. Priorities – Streamline processes and procedures
59
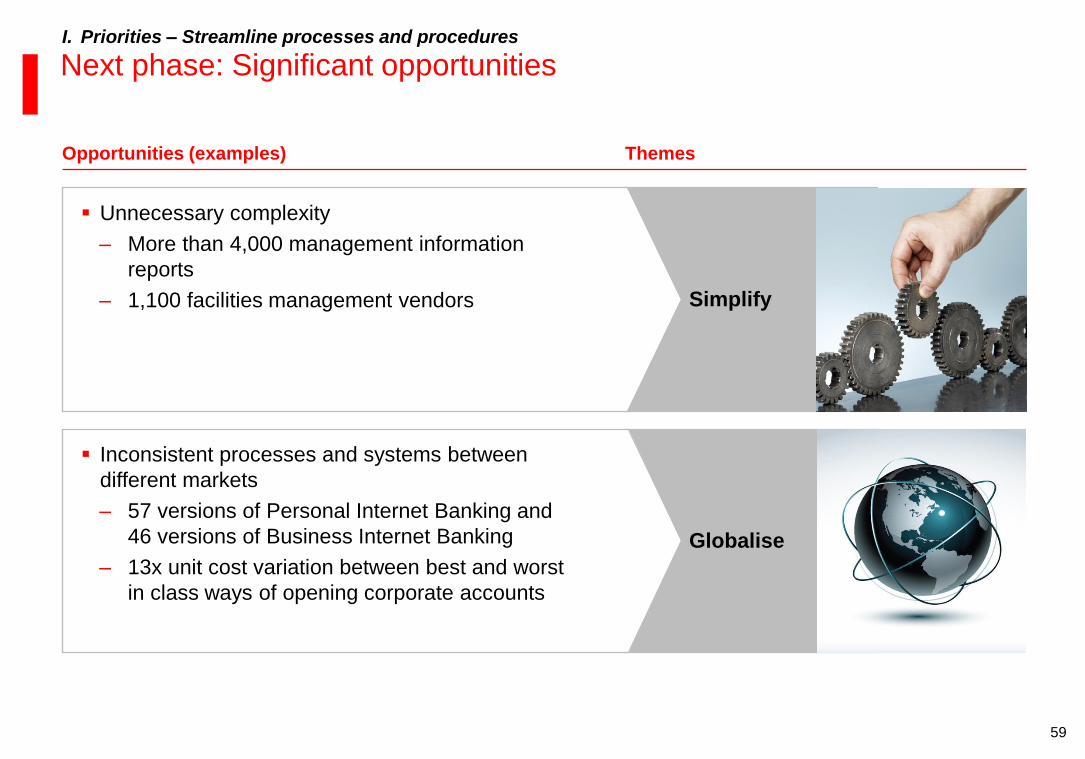
Next phase: Significant opportunities
Opportunities (examples)
I. Priorities – Streamline processes and procedures
Themes
Simplify
Globalise
Unnecessary complexity
– More than 4,000 management information
reports
– 1,100 facilities management vendors
Inconsistent processes and systems between
different markets
– 57 versions of Personal Internet Banking and
46 versions of Business Internet Banking
– 13x unit cost variation between best and worst
in class ways of opening corporate accounts
60
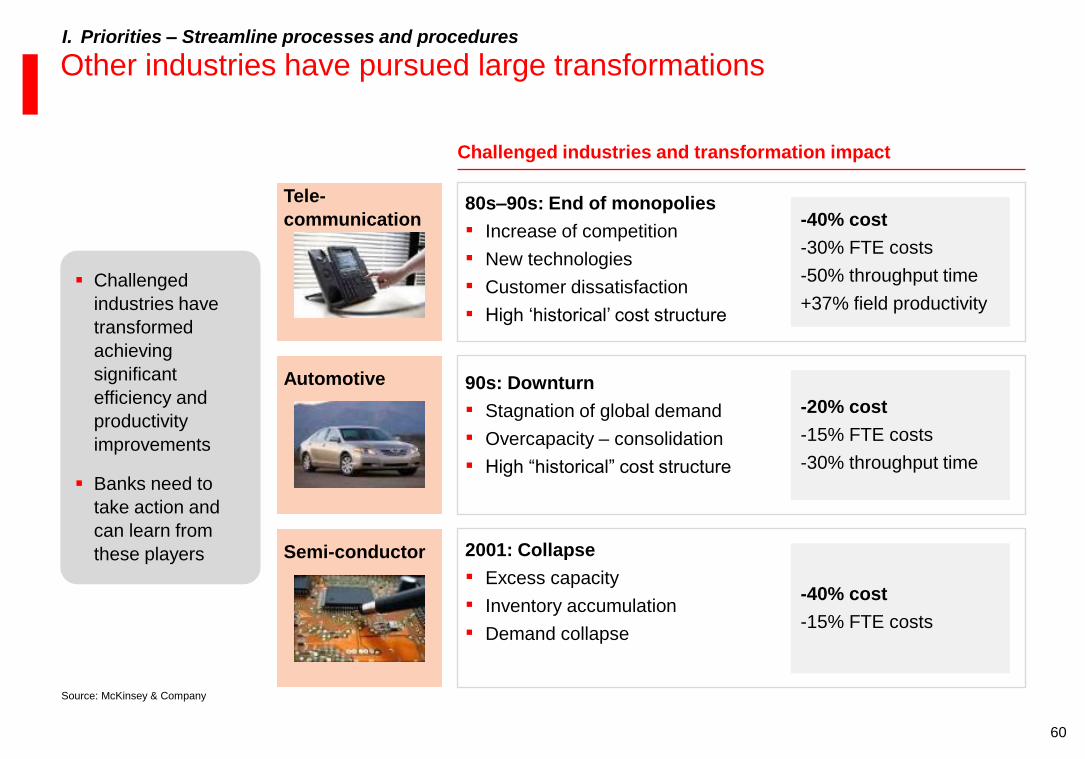
Other industries have pursued large transformations
Challenged
industries have
transformed
achieving
significant
efficiency and
productivity
improvements
Banks need to
take action and
can learn from
these players
80s–90s: End of monopolies
▪ Increase of competition
▪ New technologies
▪ Customer dissatisfaction
▪ High ‘historical’ cost structure
-40% cost
-30% FTE costs
-50% throughput time
+37% field productivity
Tele-
communication
2001: Collapse
▪ Excess capacity
▪ Inventory accumulation
▪ Demand collapse
-40% cost
-15% FTE costs
Semi-conductor
Automotive 90s: Downturn
▪ Stagnation of global demand
▪ Overcapacity – consolidation
▪ High “historical” cost structure
-20% cost
-15% FTE costs
-30% throughput time
Source: McKinsey & Company
I. Priorities – Streamline processes and procedures
Challenged industries and transformation impact
61
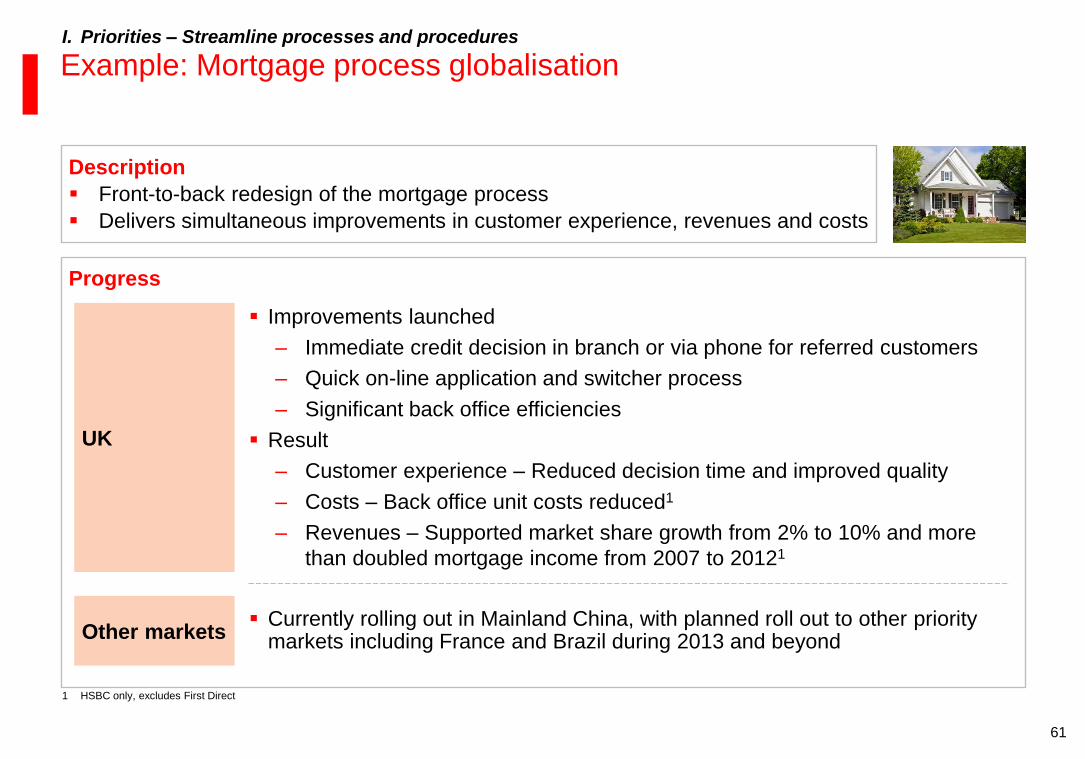
Example: Mortgage process globalisation
Progress
UK
Improvements launched
– Immediate credit decision in branch or via phone for referred customers
– Quick on-line application and switcher process
– Significant back office efficiencies
Result
– Customer experience – Reduced decision time and improved quality
– Costs – Back office unit costs reduced1
– Revenues – Supported market share growth from 2% to 10% and more
than doubled mortgage income from 2007 to 20121
I. Priorities – Streamline processes and procedures
Description
Front-to-back redesign of the mortgage process
Delivers simultaneous improvements in customer experience, revenues and costs
Other markets Currently rolling out in Mainland China, with planned roll out to other priority
markets including France and Brazil during 2013 and beyond
1 HSBC only, excludes First Direct
62
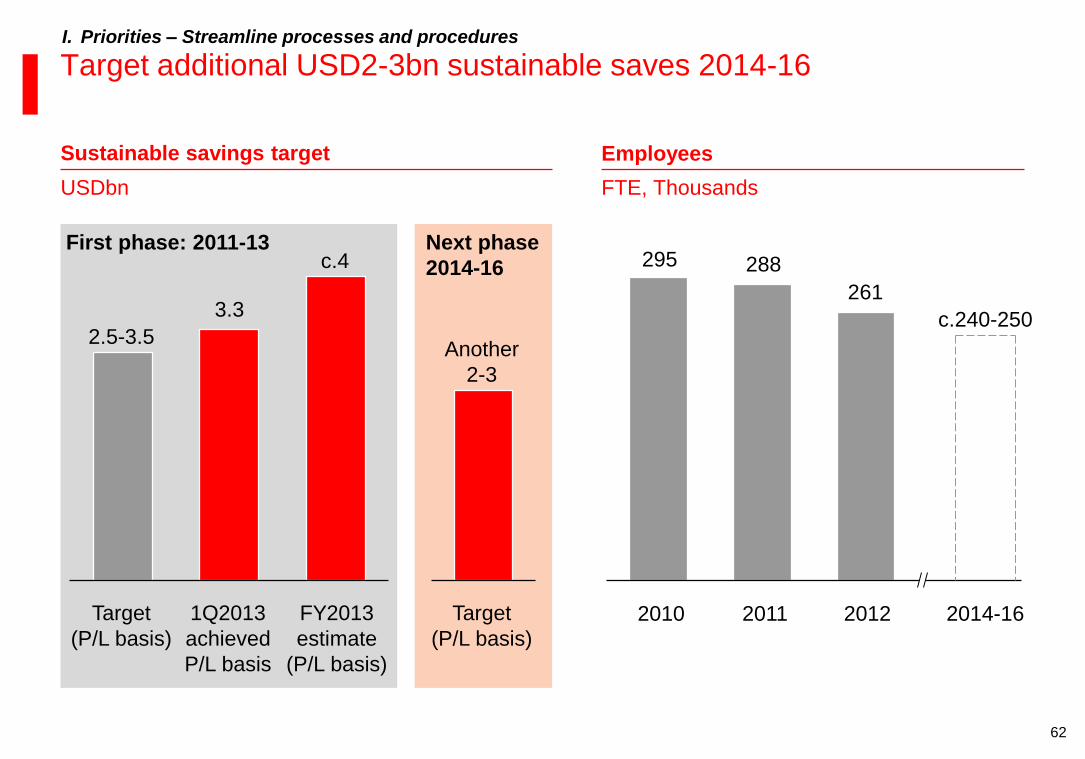
Target additional USD2-3bn sustainable saves 2014-16 I. Priorities – Streamline processes and procedures
Sustainable savings target Employees
FTE, Thousands
295 288
261
2014-16
c.240-250
2012 2011 2010
3.3
Target
(P/L basis)
2.5-3.5
FY2013
estimate
(P/L basis)
c.4
1Q2013
achieved
P/L basis
USDbn
Another
2-3
Target
(P/L basis)
First phase: 2011-13 Next phase
2014-16

63
Simplify I. Priorities – Streamline processes and procedures
Approach
Identify activities with
potential opportunity to
simplify
Map the current activity or
process
Identify inefficiencies and
improvement opportunities
e.g., duplications,
unnecessary complexity,
over-capacity etc.
Redesign and optimise
Pilot launch and measure
impact
Examples
US
transformation
Execute transformation plan focused
on simplifying IT, Operations and
Global Functions
Management
information
Centralise, standardise and rationalise
MI production and implement a
consistent finance operating model
Facilities
management
Recently signed a 5 year global
facilities management contract with one
vendor to replace c.1,100
64
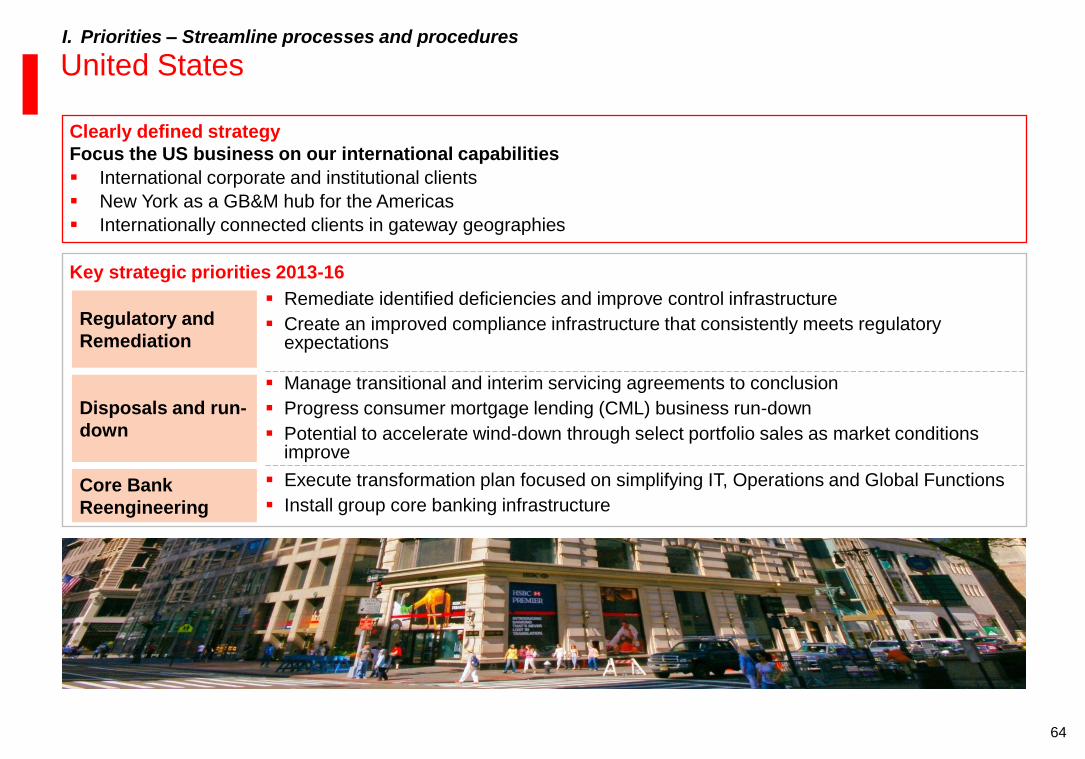
United States
Key strategic priorities 2013-16
Regulatory and
Remediation
Remediate identified deficiencies and improve control infrastructure
Create an improved compliance infrastructure that consistently meets regulatory expectations
Disposals and run-
down
Manage transitional and interim servicing agreements to conclusion
Progress consumer mortgage lending (CML) business run-down
Potential to accelerate wind-down through select portfolio sales as market conditions improve
Core Bank
Reengineering
Execute transformation plan focused on simplifying IT, Operations and Global Functions
Install group core banking infrastructure
I. Priorities – Streamline processes and procedures
Clearly defined strategy
Focus the US business on our international capabilities
International corporate and institutional clients
New York as a GB&M hub for the Americas
Internationally connected clients in gateway geographies
65
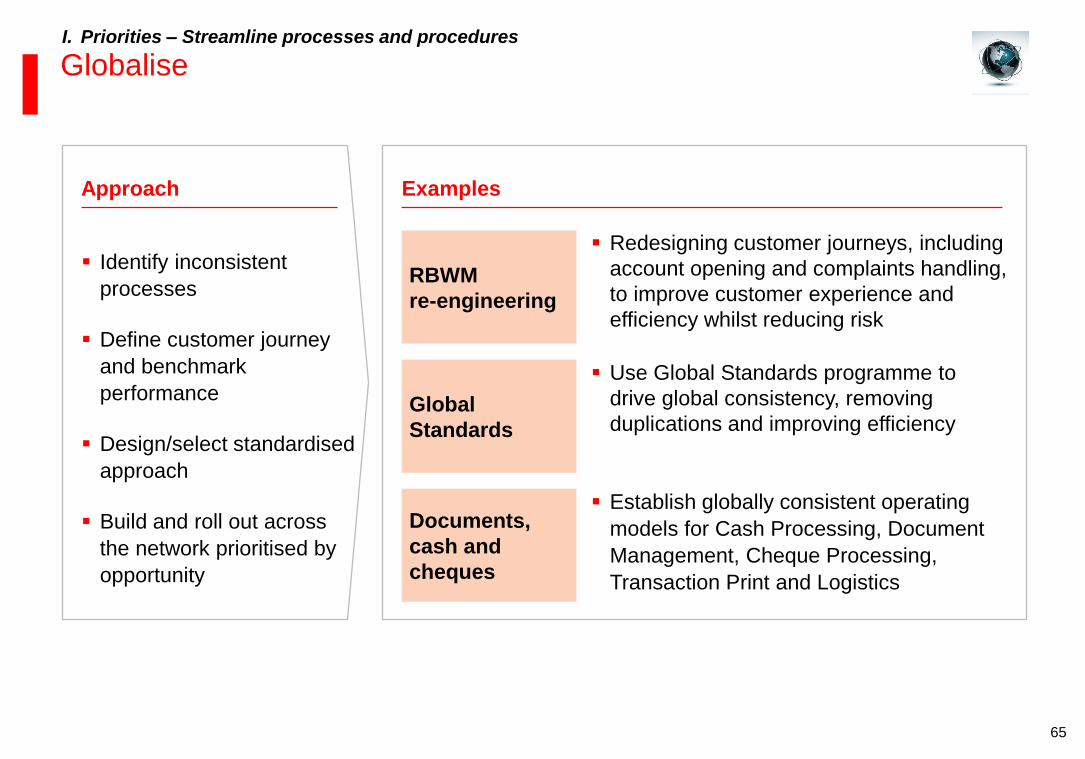
Globalise I. Priorities – Streamline processes and procedures
Identify inconsistent
processes
Define customer journey
and benchmark
performance
Design/select standardised
approach
Build and roll out across
the network prioritised by
opportunity
Approach Examples
Redesigning customer journeys, including
account opening and complaints handling,
to improve customer experience and
efficiency whilst reducing risk
RBWM
re-engineering
Documents,
cash and
cheques
Establish globally consistent operating
models for Cash Processing, Document
Management, Cheque Processing,
Transaction Print and Logistics
Use Global Standards programme to
drive global consistency, removing
duplications and improving efficiency Global
Standards
66
Why should you own HSBC?
B Proven track record in delivering change – First phase
Clear plan for growth and shareholder returns – Next phase C
A Distinctive position in the new banking environment
Priorities I
Financial targets II
III Vision
67
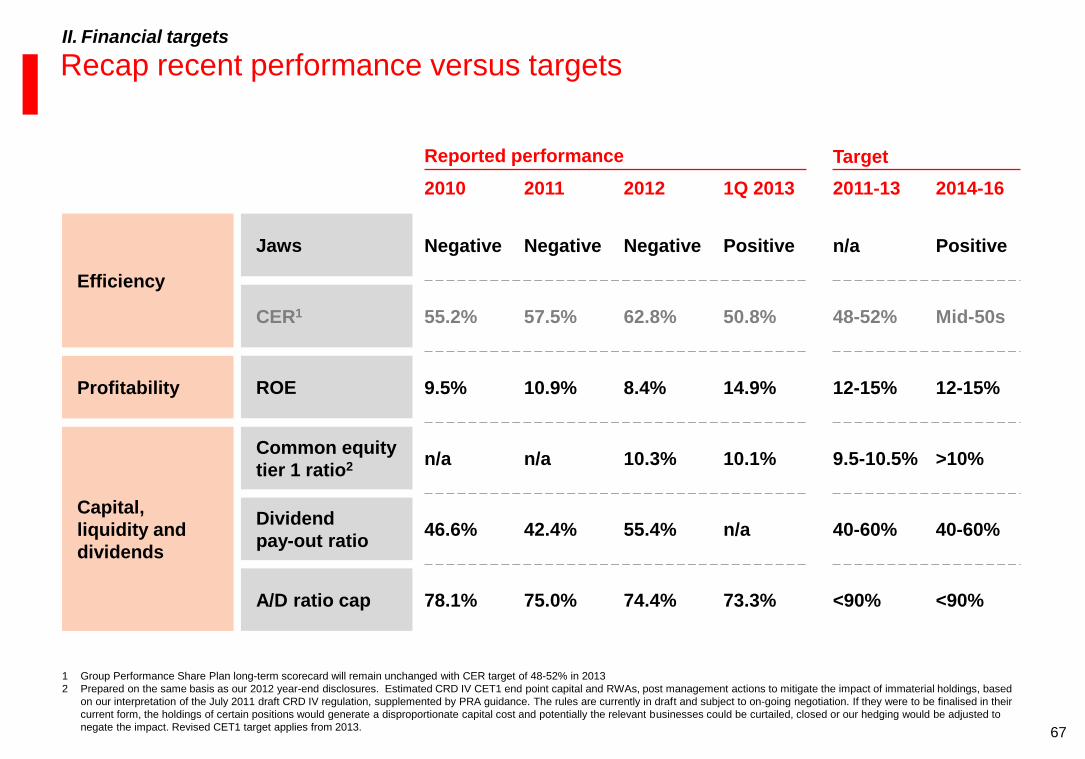
Recap recent performance versus targets
Reported performance Target
Efficiency
Jaws
CER1
Profitability ROE
Capital,
liquidity and
dividends
Common equity
tier 1 ratio2
A/D ratio cap
Dividend
pay-out ratio
2012
Negative
62.8%
8.4%
10.3%
74.4%
55.4%
Positive
50.8%
14.9%
10.1%
73.3%
n/a
1Q 2013
1 Group Performance Share Plan long-term scorecard will remain unchanged with CER target of 48-52% in 2013
2 Prepared on the same basis as our 2012 year-end disclosures. Estimated CRD IV CET1 end point capital and RWAs, post management actions to mitigate the impact of immaterial holdings, based
on our interpretation of the July 2011 draft CRD IV regulation, supplemented by PRA guidance. The rules are currently in draft and subject to on-going negotiation. If they were to be finalised in their
current form, the holdings of certain positions would generate a disproportionate capital cost and potentially the relevant businesses could be curtailed, closed or our hedging would be adjusted to
negate the impact. Revised CET1 target applies from 2013.
2011
Negative
57.5%
10.9%
n/a
75.0%
42.4%
2010
Negative
55.2%
9.5%
n/a
78.1%
46.6%
Positive
Mid-50s
12-15%
>10%
<90%
40-60%
2014-16 2011-13
n/a
48-52%
12-15%
9.5-10.5%
<90%
40-60%
II. Financial targets
68
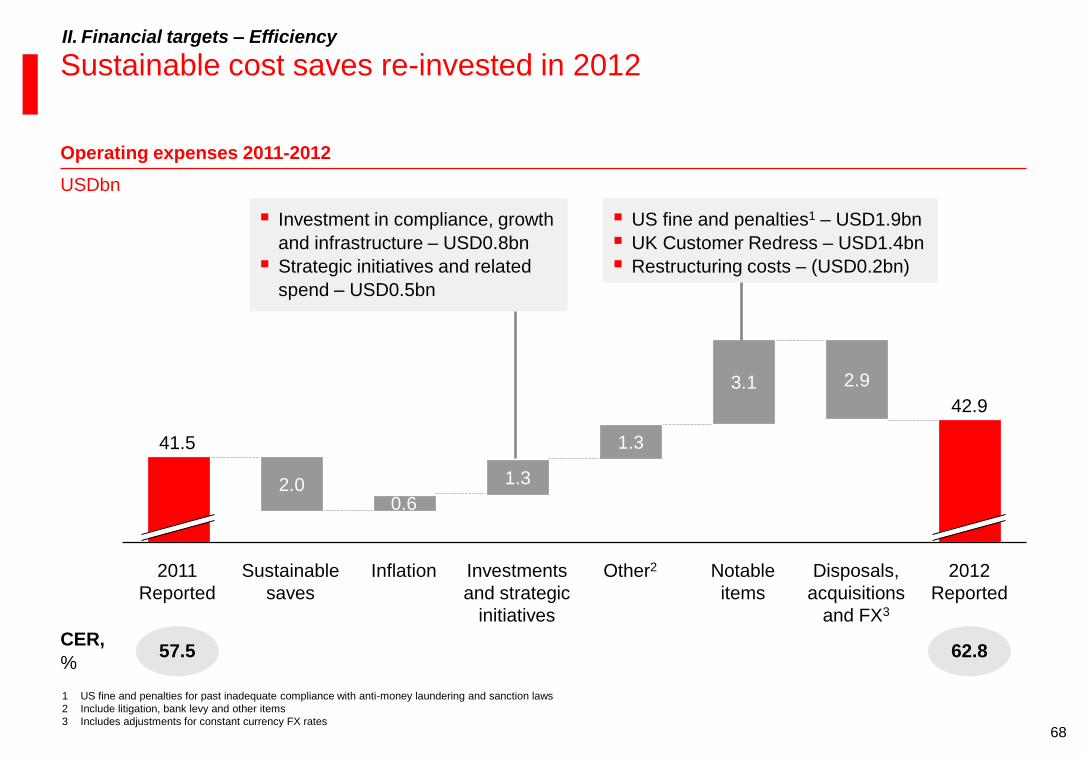
Sustainable cost saves re-invested in 2012 II. Financial targets – Efficiency
Operating expenses 2011-2012
CER,
% 57.5 62.8
USDbn
US fine and penalties1 – USD1.9bn
UK Customer Redress – USD1.4bn
Restructuring costs – (USD0.2bn)
Investment in compliance, growth
and infrastructure – USD0.8bn
Strategic initiatives and related
spend – USD0.5bn
2.0 1.3
1.3
3.1 2.9
42.9
2012
Reported
2011
Reported
41.5
Disposals,
acquisitions
and FX3
Notable
items
Other2 Investments
and strategic
initiatives
Inflation
0.6
Sustainable
saves
1 US fine and penalties for past inadequate compliance with anti-money laundering and sanction laws
2 Include litigation, bank levy and other items
3 Includes adjustments for constant currency FX rates
69
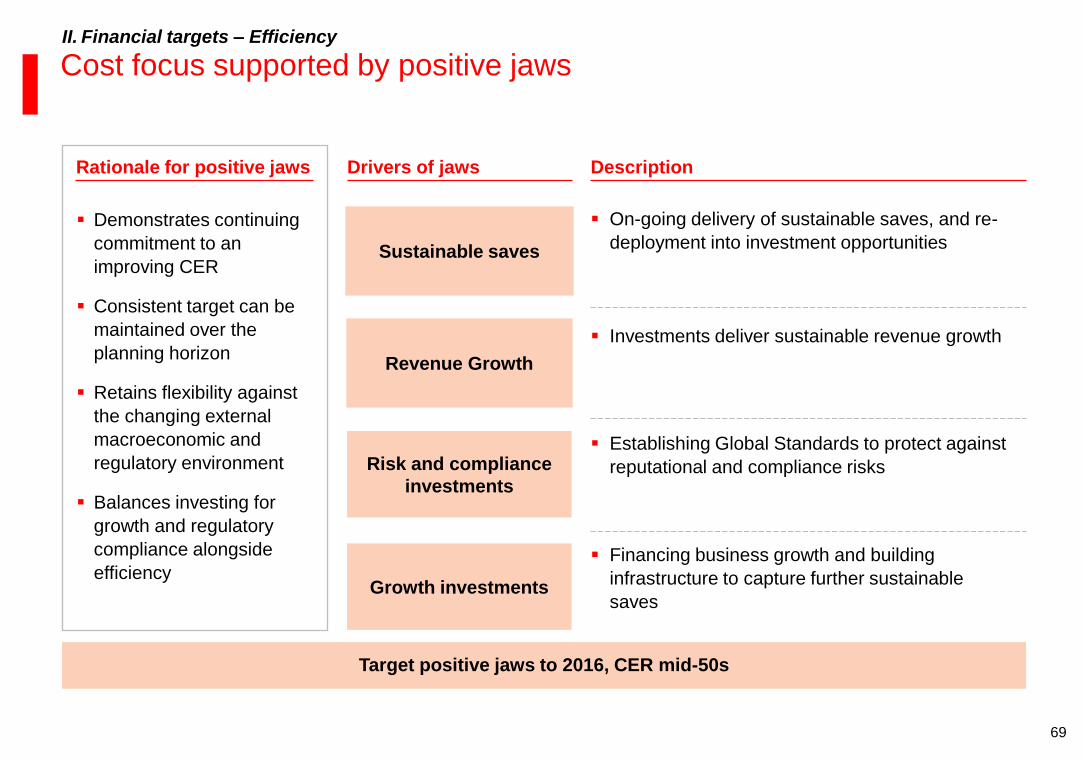
Cost focus supported by positive jaws
Drivers of jaws Rationale for positive jaws
Demonstrates continuing
commitment to an
improving CER
Consistent target can be
maintained over the
planning horizon
Retains flexibility against
the changing external
macroeconomic and
regulatory environment
Balances investing for
growth and regulatory
compliance alongside
efficiency
II. Financial targets – Efficiency
On-going delivery of sustainable saves, and re-
deployment into investment opportunities
Investments deliver sustainable revenue growth
Establishing Global Standards to protect against
reputational and compliance risks
Sustainable saves
Financing business growth and building
infrastructure to capture further sustainable
saves
Revenue Growth
Growth investments
Target positive jaws to 2016, CER mid-50s
Description
Risk and compliance
investments
70
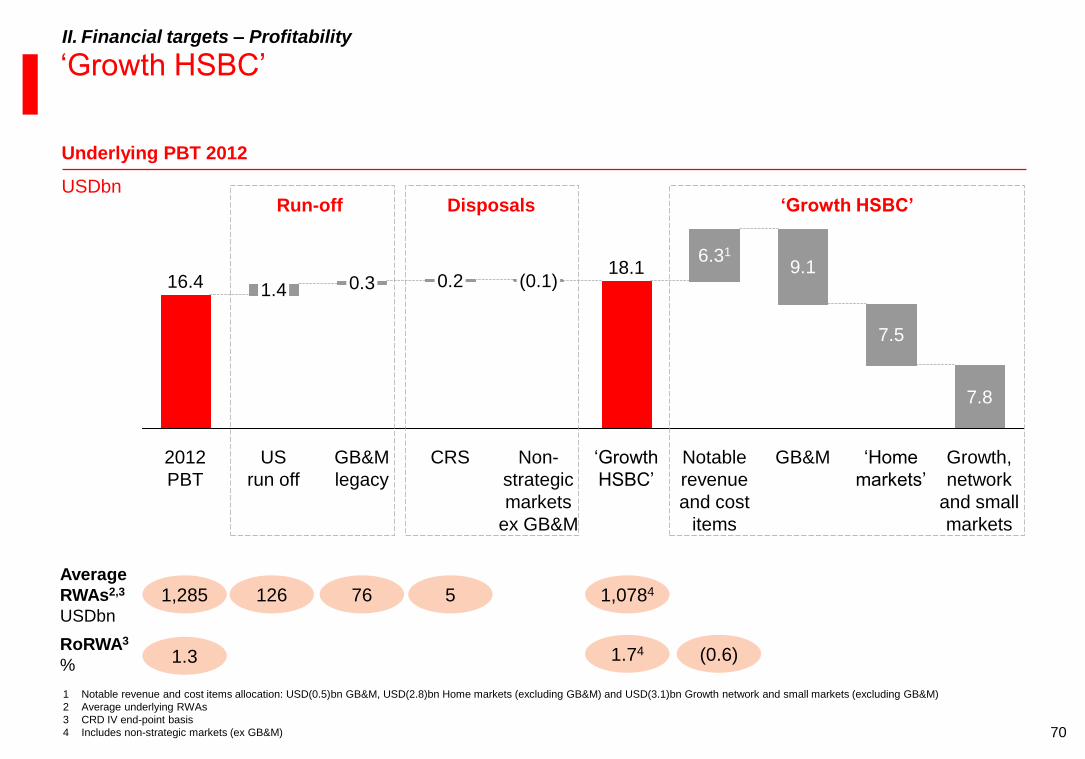
‘Growth HSBC’
Average
RWAs2,3
USDbn
5 126 76 1,285
RoRWA3
% 1.3
1,0784
1.74
1 Notable revenue and cost items allocation: USD(0.5)bn GB&M, USD(2.8)bn Home markets (excluding GB&M) and USD(3.1)bn Growth network and small markets (excluding GB&M)
2 Average underlying RWAs
3 CRD IV end-point basis
4 Includes non-strategic markets (ex GB&M)
II. Financial targets – Profitability
Underlying PBT 2012
‘Growth HSBC’ Run-off
Growth,
network
and small
markets
7.8
‘Home
markets’
7.5
GB&M
9.1
Notable
revenue
and cost
items
6.31
‘Growth
HSBC’
18.1
Non-
strategic
markets
ex GB&M
(0.1)
CRS
0.2
GB&M
legacy
0.3
US
run off
1.4
2012
PBT
16.4
Disposals USDbn
(0.6)
71
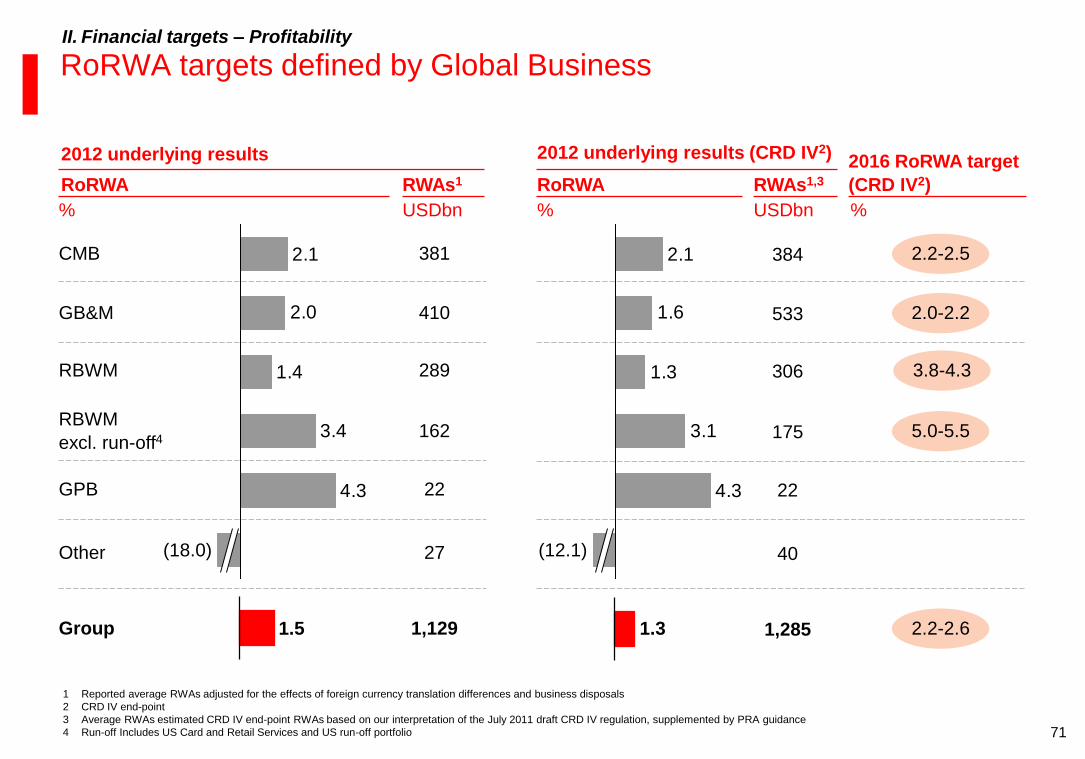
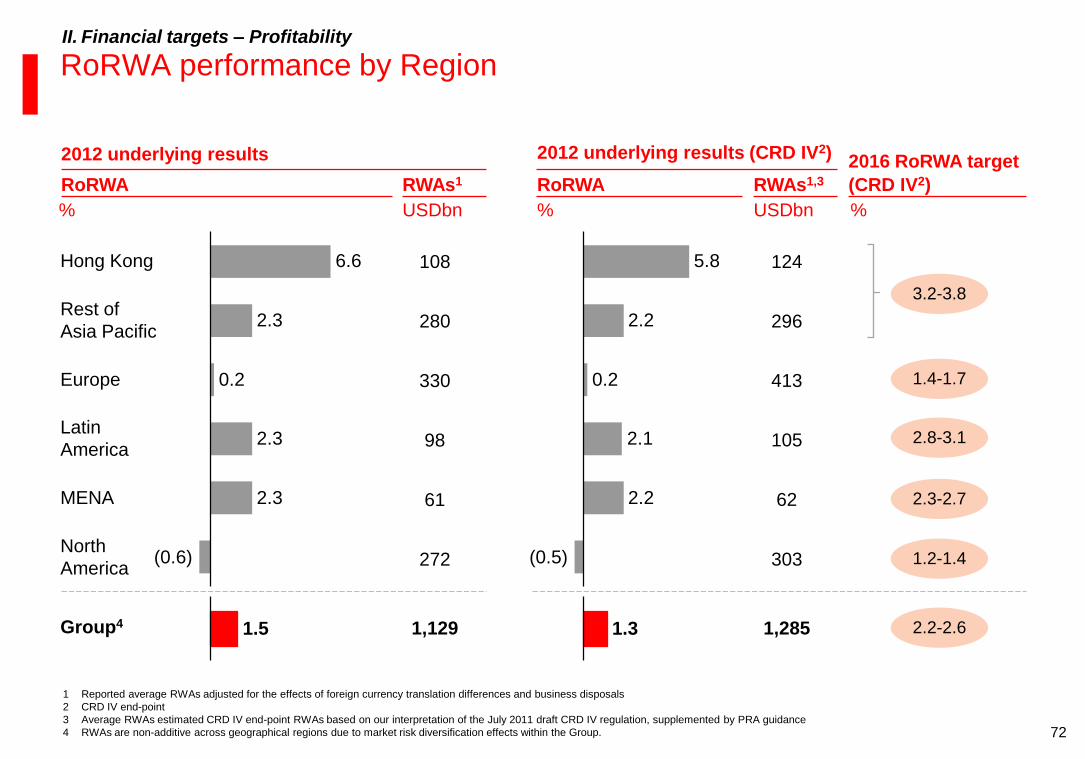
RoRWA targets defined by Global Business
40
384
175
1,285
533
1.3
1 Reported average RWAs adjusted for the effects of foreign currency translation differences and business disposals
2 CRD IV end-point
3 Average RWAs estimated CRD IV end-point RWAs based on our interpretation of the July 2011 draft CRD IV regulation, supplemented by PRA guidance
4 Run-off Includes US Card and Retail Services and US run-off portfolio
II. Financial targets – Profitability
22
306
4.3
3.4
1.4
2.0
2.1
(18.0)
Group
381
410
289
162
22
27
1,129
GPB
RBWM
excl. run-off4
RBWM
GB&M
CMB
2.0-2.2
2.2-2.5
5.0-5.5
2012 underlying results (CRD IV2)
RoRWA
USDbn
RWAs1,3
%
2012 underlying results
RoRWA
USDbn
RWAs1
% %
2016 RoRWA target
(CRD IV2)
3.8-4.3
4.3
3.1
1.3
1.6
2.1
(12.1) Other
1.5 2.2-2.6
72
North
America (0.6)
MENA 2.3
Latin
America 2.3
Europe 0.2
Rest of
Asia Pacific 2.3
Hong Kong 6.6
RoRWA performance by Region
303
124
105
1,285 1,129
296
1.5 Group4 1.3
II. Financial targets – Profitability
62
413
280
330
98
272
61
108 5.8
2.2
0.2
2.1
2.2
(0.5)
1 Reported average RWAs adjusted for the effects of foreign currency translation differences and business disposals
2 CRD IV end-point
3 Average RWAs estimated CRD IV end-point RWAs based on our interpretation of the July 2011 draft CRD IV regulation, supplemented by PRA guidance
4 RWAs are non-additive across geographical regions due to market risk diversification effects within the Group.
2012 underlying results (CRD IV2)
RoRWA
USDbn
RWAs1,3
%
2012 underlying results
RoRWA
USDbn
RWAs1
% %
2016 RoRWA target
(CRD IV2)
3.2-3.8
1.4-1.7
2.8-3.1
2.3-2.7
1.2-1.4
2.2-2.6
73
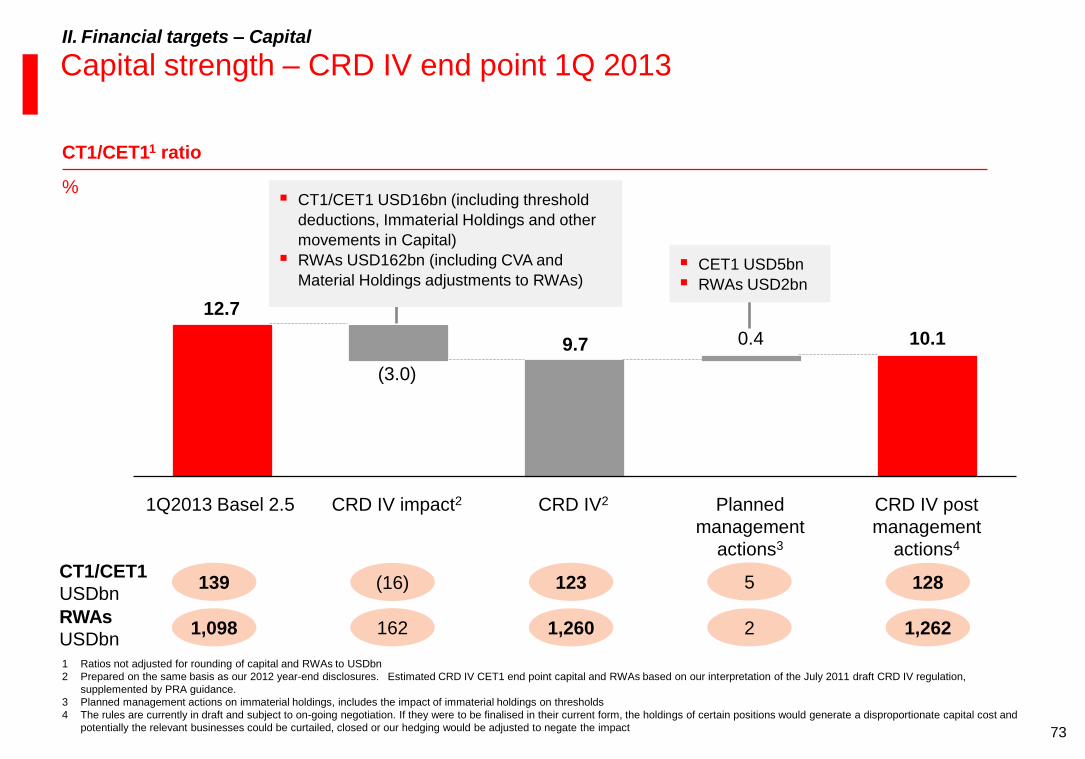
12.7
9.7 0.4 10.1
CRD IV post
management
actions4
Planned
management
actions3
CRD IV2 CRD IV impact2
(3.0)
1Q2013 Basel 2.5
Capital strength – CRD IV end point 1Q 2013
CT1/CET11 ratio
%
II. Financial targets – Capital
RWAs
USDbn
CT1/CET1
USDbn
CT1/CET1 USD16bn (including threshold
deductions, Immaterial Holdings and other
movements in Capital)
RWAs USD162bn (including CVA and
Material Holdings adjustments to RWAs) CET1 USD5bn
RWAs USD2bn
1,260 1,098 1,262
123 139 128
2
5
162
(16)
1 Ratios not adjusted for rounding of capital and RWAs to USDbn
2 Prepared on the same basis as our 2012 year-end disclosures. Estimated CRD IV CET1 end point capital and RWAs based on our interpretation of the July 2011 draft CRD IV regulation,
supplemented by PRA guidance.
3 Planned management actions on immaterial holdings, includes the impact of immaterial holdings on thresholds
4 The rules are currently in draft and subject to on-going negotiation. If they were to be finalised in their current form, the holdings of certain positions would generate a disproportionate capital cost and
potentially the relevant businesses could be curtailed, closed or our hedging would be adjusted to negate the impact
74
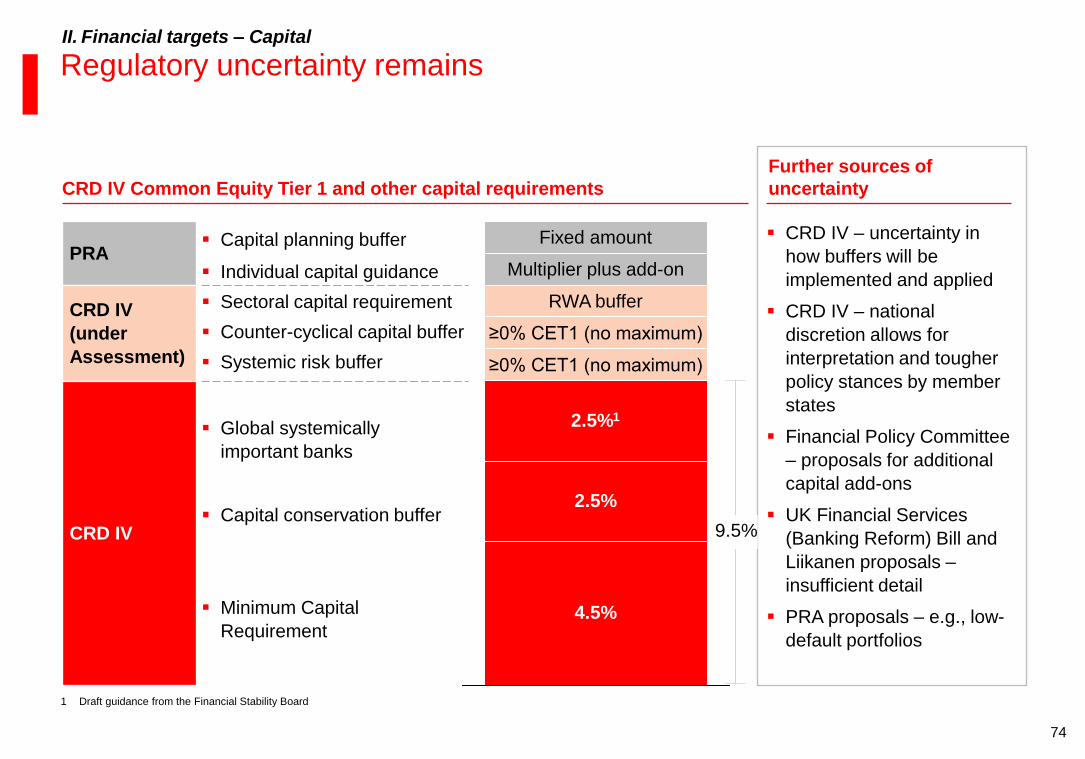
Regulatory uncertainty remains
1 Draft guidance from the Financial Stability Board
II. Financial targets – Capital
CRD IV Common Equity Tier 1 and other capital requirements
CRD IV – uncertainty in
how buffers will be
implemented and applied
CRD IV – national
discretion allows for
interpretation and tougher
policy stances by member
states
Financial Policy Committee
– proposals for additional
capital add-ons
UK Financial Services
(Banking Reform) Bill and
Liikanen proposals –
insufficient detail
PRA proposals – e.g., low-
default portfolios
Further sources of
uncertainty
PRA
CRD IV
(under
Assessment)
CRD IV
Minimum Capital
Requirement
Capital conservation buffer
Global systemically
important banks
Individual capital guidance
Capital planning buffer
Counter-cyclical capital buffer
Sectoral capital requirement
Systemic risk buffer
2.5%
4.5%
2.5%1
≥0% CET1 (no maximum)
≥0% CET1 (no maximum)
RWA buffer
Multiplier plus add-on
Fixed amount
9.5%
75
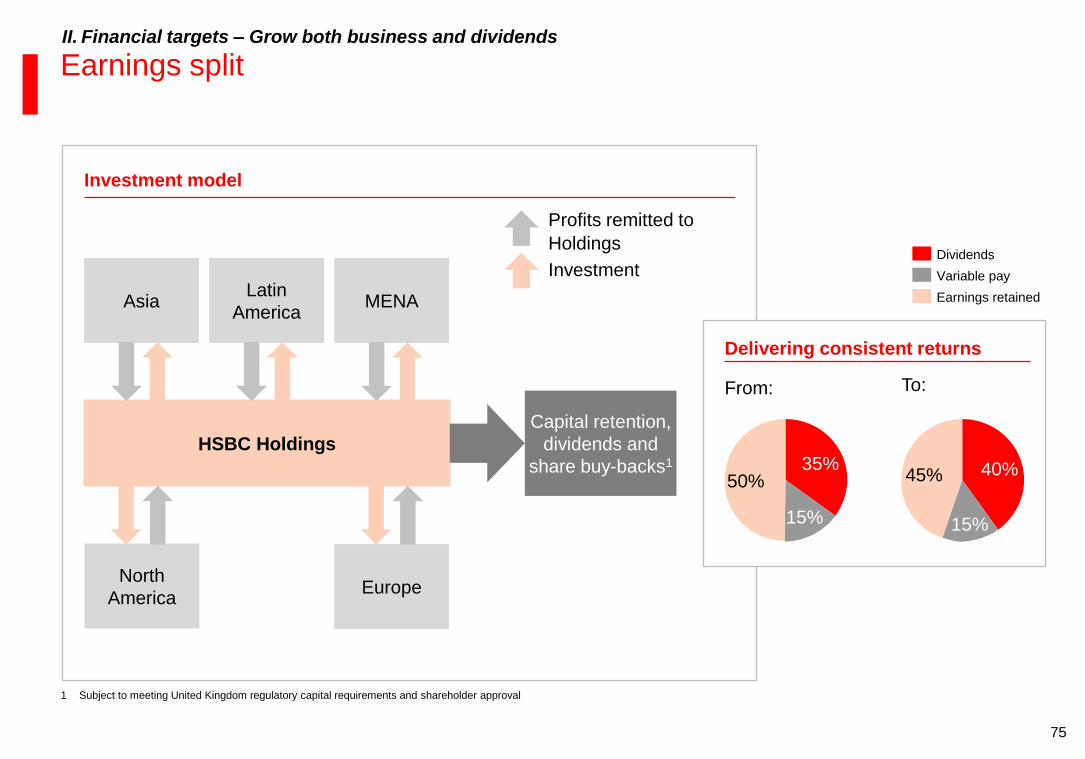
Earnings split
Investment
Profits remitted to
Holdings
Investment model
HSBC Holdings
Capital retention,
dividends and
share buy-backs1
Asia Latin
America MENA
North
America Europe
Delivering consistent returns
50%
15%
35% 45%
15%
40%
Variable pay
Dividends
Earnings retained
From: To:
1 Subject to meeting United Kingdom regulatory capital requirements and shareholder approval
II. Financial targets – Grow both business and dividends
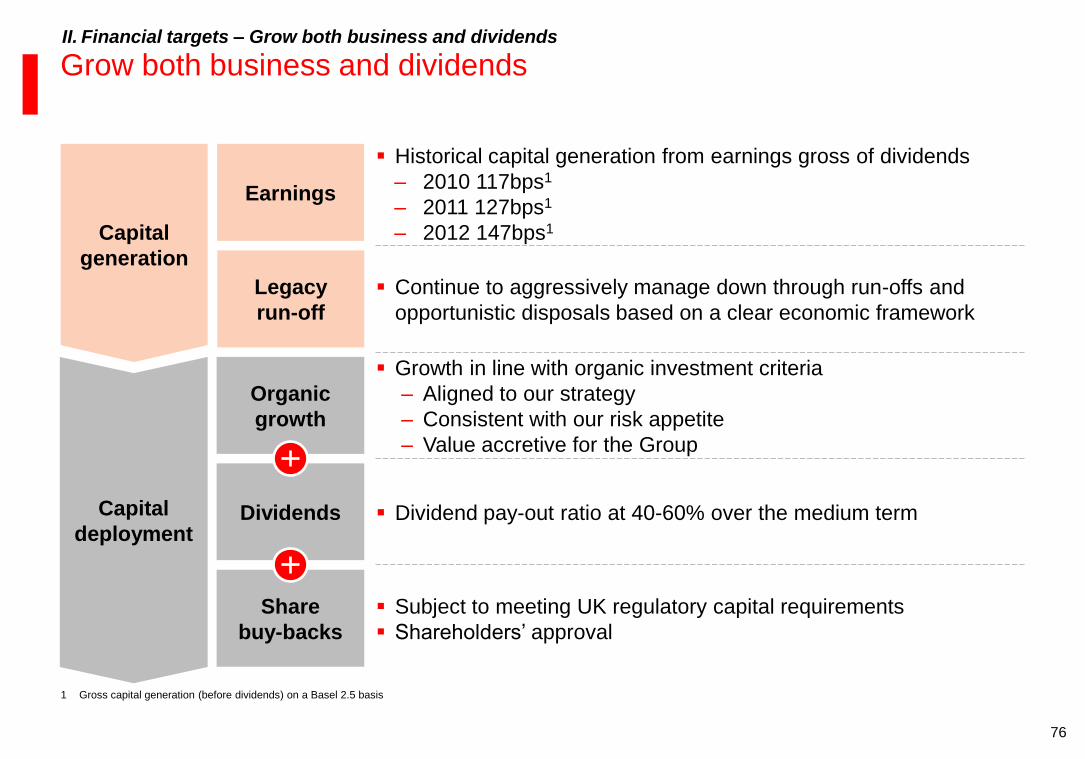
76
Grow both business and dividends II. Financial targets – Grow both business and dividends
Earnings
Historical capital generation from earnings gross of dividends
– 2010 117bps1
– 2011 127bps1
– 2012 147bps1
Legacy
run-off
Continue to aggressively manage down through run-offs and
opportunistic disposals based on a clear economic framework
Organic
growth
Dividends
Share
buy-backs
Growth in line with organic investment criteria
– Aligned to our strategy
– Consistent with our risk appetite
– Value accretive for the Group
Dividend pay-out ratio at 40-60% over the medium term
Subject to meeting UK regulatory capital requirements
Shareholders’ approval
Capital
deployment
Capital
generation
1 Gross capital generation (before dividends) on a Basel 2.5 basis
77
Why should you own HSBC?
B Proven track record in delivering change – First phase
Clear plan for growth and shareholder returns – Next phase C
A Distinctive position in the new banking environment
Priorities I
Financial targets II
III Vision
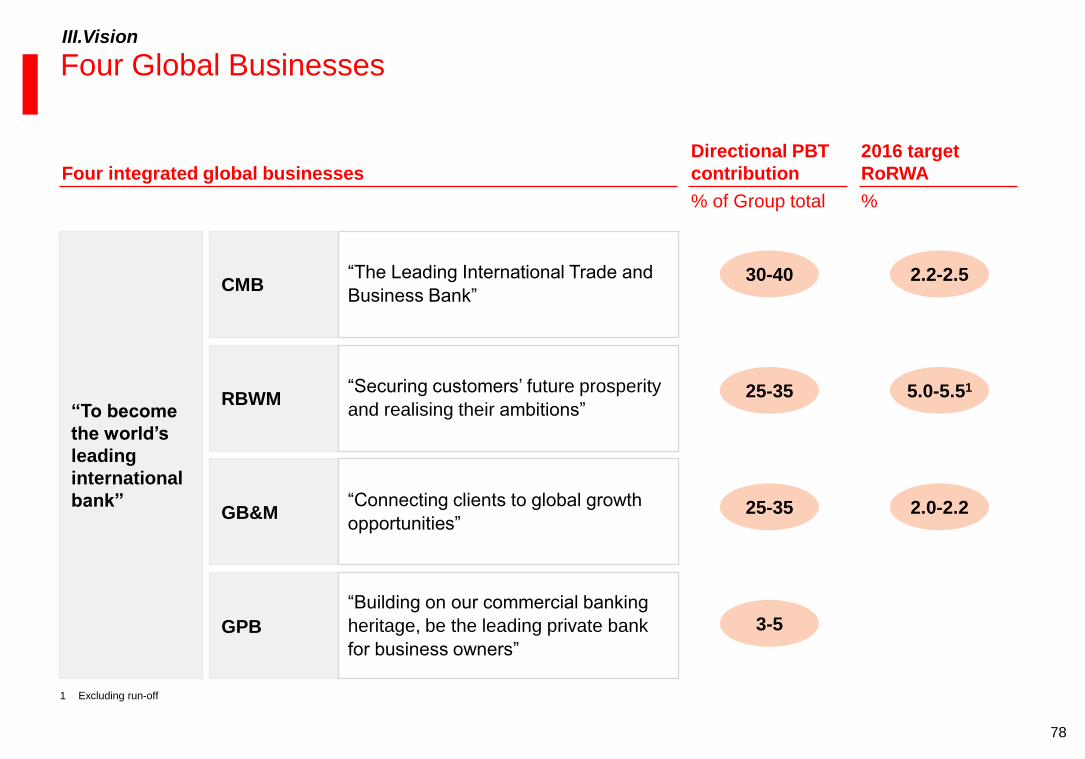
78
Four Global Businesses III.Vision
Four integrated global businesses
Directional PBT
contribution
RBWM
CMB
GB&M
GPB
“Securing customers’ future prosperity
and realising their ambitions”
“The Leading International Trade and
Business Bank”
“Connecting clients to global growth
opportunities”
“Building on our commercial banking
heritage, be the leading private bank
for business owners”
“To become
the world’s
leading
international
bank”
% of Group total
2016 target
RoRWA
%
30-40
25-35
25-35
3-5
2.2-2.5
5.0-5.51
2.0-2.2
1 Excluding run-off
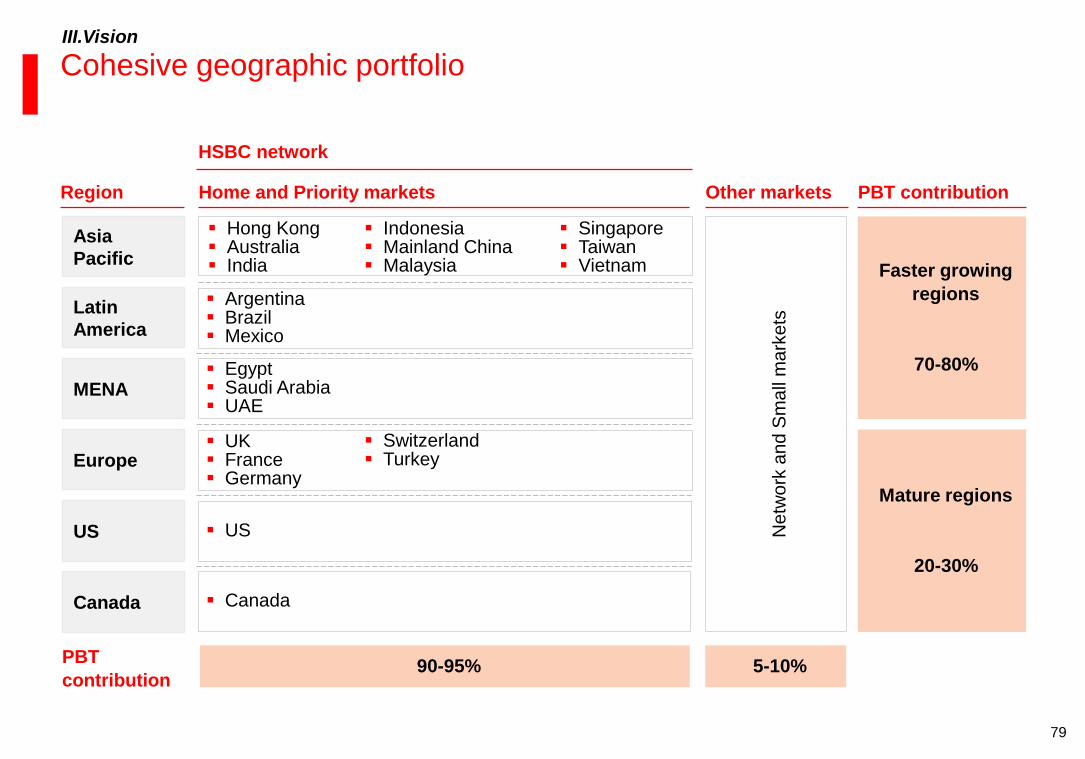
79
Cohesive geographic portfolio
Home and Priority markets Region Other markets
HSBC network
PBT contribution
Canada
US
UK France Germany
Egypt Saudi Arabia UAE
Argentina Brazil Mexico
Mature regions
20-30%
Asia
Pacific
Latin
America
MENA
Europe
Hong Kong Australia India
US
Canada
Indonesia Mainland China Malaysia
Singapore Taiwan Vietnam
Switzerland Turkey
Ne
two
rk a
nd
Sm
all
ma
rke
ts
Faster growing
regions
70-80%
90-95% 5-10% PBT
contribution
III.Vision

80
Next phase 2014-16
Strategy remains unchanged
Grow both business and dividends
Implement Global Standards
Streamline processes and procedures
Targets
ROE 12-15%1
Positive jaws
CER mid-50s2
Additional USD2-3bn in sustainable saves
Common equity tier 1 ratio >10%
Advances-to-deposits ratio cap <90%
Progressive dividends and share buy-backs3
1 Return on average ordinary shareholders’ equity
2 Group Performance Share Plan long-term scorecard will remain unchanged with a Cost Efficiency Ratio target of 48-52% for 2013
3 Subject to meeting United Kingdom regulatory capital requirements and shareholder approval
81
Definitions (1/3)
A/D ratio Customer advances to customer accounts
ABS Asset backed securities
AFS Available for sale
CAGR Compound annual growth rate
CDO Collateralised Debt Obligation
CER The cost efficiency ratio is total operating expenses divided by net operating income before
loan impairment charges and other credit risk provisions.
CET1 Common equity tier 1 ratio
CMB Commercial Banking
CML Consumer and Mortgage Lending
CRS Card and Retail Services
DCM Debt Capital Markets
EM Emerging markets
Europe Europe geographic segment includes the Group’s head office costs, intra-HSBC recharges
and the total impact of the UK bank levy.
82
Definitions (2/3)
FVOD Changes in fair value due to movements in credit spread on own long-term debt issued by
the Group and designated at fair value.
GB&M Global Banking and Markets
GPB Global Private Banking
Growth HSBC The term ‘Growth HSBC’ is used in an analysis of HSBC’s results, showing the effect of
disposals and run-off portfolios separately from the rest of the Group.
GTRF Global Trade and Receivables Finance
Home markets The term ‘Home markets’ refers to our principal existing markets in Hong Kong and the
United Kingdom.
Jaws This is calculated as percentage growth in net operating income before loan impairment
charges and other credit risk provisions less percentage growth in total operating expenses.
M&A Mergers and acquisitions
MBS Mortgage backed securities
Network markets Network markets are further HSBC markets with high relevance for international trade and
capital flows.
Other Global
Business
‘Other’ contains the full impact of the bank levy, the results of certain property transactions,
unallocated investment activities, centrally held investment companies, movements in the
fair value of own debt, central support and functional costs with associated recoveries,
HSBC’s holding company and financing operations.
83
Definitions (3/3)
PCM Payments and Cash Management
Priority growth
markets
Priority growth markets are Australia, Mainland China, India, Indonesia, Malaysia,
Singapore, Taiwan, Vietnam, France, Germany, Switzerland, Turkey, Egypt, Saudi Arabia,
United Arab Emirates, Canada, United States of America, Argentina, Brazil and Mexico.
RBWM Retail Banking Wealth Management
RMB Renminbi
ROE Return on average ordinary shareholders' equity
RoRWA
The metric, return on risk weighted assets (‘RoRWA’), is defined as profit before tax divided
by average risk weighted assets (‘RWAs’). RWAs have been calculated using FSA rules for
the 2010, 2011 and 2012 metrics. In all cases, RWAs or financial metrics based on RWAs
for geographical segments or Global Businesses include associates, are on a third party
basis and exclude intra-HSBC exposures.
Run-off Run-off includes Legacy Credit in GB&M and the US Consumer and Mortgage Lending
portfolios and the related treasury operations.
Small markets Small markets are markets where HSBC has profitable scale and/or focused operations,
subscale markets foreseen for exit and representative offices.
Photography by Matthew Mawson (cover, p.4 and subsequent pages with same photograph)