Embed Size (px)
Citation preview

HSBC Investment Funds TrustAnnual Report 2017

Contents
Page1. HSBCINVESTMENTFUNDSTRUST
1.1 HSBCASIANBONDFUND
1.2 HSBCCHINAMOMENTUMFUND
1.3 HSBCCHINAGROWTHFUND
1.4 HSBCASIANHIGHYIELDBONDFUND
Investment Adviser’s Reports 1Trustee’s Report 3Independent Auditors’ Report to the Unitholders 4Statement of Financial Position 7Statement of Comprehensive Income 11Statement of Changes in Net Assets Attributable to Unitholders/Statement of Changes in Equity 13Cash Flow Statement 16Distribution Statement 18Notes to the Financial Statements 22Portfolio Statement (Unaudited) 71Statement of Movements in Portfolio Holdings (Unaudited) 89Performance Record (Unaudited) 93
2. ADMINISTRATION 104
3. BOARDOFDIRECTORSOFHSBCINVESTMENTFUNDS(HONGKONG)LIMITED 105

1
Investment Adviser’s Report
HSBCAsianBondFund
MarketReviewAsia US dollar credit held up well in the year ending at 31 July 2017, as tightening in spreads offset the rise in US treasury yields. Post Trump’s victory in the US Presidential Election in November 2016, the market was expecting increasing fiscal stimulus from Trump to lead to a higher fiscal deficit and potentially more US treasury supply. This sent the benchmark 10 year US treasury yield to its 2-year high in mid December 2016. Coming into 2017, the US treasury yield curve flattened, as the Fed has delivered another two rate hikes since December 2016. US treasury yields at the belly to long-end of the curve declined, with no meaningful progress in the pro-growth fiscal policies proposed by Trump and soft inflation persistently below the Fed’s 2% target. Spreads tightened for both investment grade and non-investment grade names, as demand for Asia dollar credit remained strong with the return of flows into emerging market. Over the past year, the Fund delivered a positive return and outperformed its benchmark gross of fees, mainly thanks to our favourable credit selection (particularly in quasi sovereign issues). Going forward, the Fund continues to hold a neutral to underweight stance in duration and we look to manage this exposure more tactically given the potential event risk and geopolitical risk. We remain constructive in Asia dollar credit, with support from solid macro and credit fundamentals for the region. Demand from both Asian local investors and global investors should stay resilient on the back of continued search for yields and high quality of Asia dollar credit relative to other emerging market peers. In addition, Asia dollar credit has become more attractive on a relative basis compared to other major corporate bond markets, which should provide further support for the strategy.
HSBCChinaMomentumFund
MarketReviewDespite some political turbulences such as the unexpected U.S. president election result and the increasing geopolitical tensions between US and North Korea, the Chinese equity markets finished its year ended 31 July 2017 on a strong note, as Chinese economy and corporations continued to show signs of strength.
Leading economic indicator such as PPI, industrial profits and PMI rebounded from their troughs in late 2015/early 2016. This was achieved on the back of government’s effort in pressing forward the supply-side reform since late 2015 to clear excessive production capacity and restore competitiveness across different sectors. These curtailment efforts translated into improving earnings in traditional sectors
such as commodities and industrials. On the new economy front, continued product innovation in technology sector and the resulting rise of online advertising also fueled economic growth and consumer expenditures. This explained why the equity market rally has been broad-based. Another driver behind the upbeat offshore Chinese market since the middle of 2016 is the strong southbound inflow into the market thanks to the launch of the stock connect programmes as well as the green light given by the Chinese government to insurers to invest in Hong Kong stocks since Q4 2016. Total inflow from China through the stock connect system in the first 7 months of 2017 already exceeded 75% of the total inflows in 2016. The inflow from China has not only supported the valuation of offshore Chinese equities but also create liquidity to the overall market.
The Fund’s strongest contribution came from stock selection in the consumer discretionary, namely automobile and education, and information technology sectors. We believe the outlook of Chinese economy remains healthy as supply side reform continued and recently we have seen a renewed effort in state-owned enterprises form. Recovery of global economy will also help China’s economic growth by means of strong export. Having said that, we are mindful of the rising geopolitical risks resulting from the escalating tension between the US and Korea. The liquidity risk from the unwinding of Balance Sheet by Fed may also create market volatility.
HSBCChinaGrowthFund
MarketReviewDespite some political turbulences such as the unexpected U.S. president election result and the increasing geopolitical tensions between US and North Korea, the Chinese equity markets finished its year ended 31 July 2017 on a strong note, as Chinese economy and corporations continued to show signs of strength.
Leading economic indicator such as PPI, industrial profits and PMI rebounded from their troughs in late 2015/early 2016. This was achieved on the back of government’s effort in pressing forward the supply-side reform since late 2015 to clear excessive production capacity and restore competitiveness across different sectors. These curtailment efforts translated into improving earnings in traditional sectors such as commodities and industrials. On the new economy front, continued product innovation in technology sector and the resulting rise of online advertising also fueled economic growth and consumer expenditures. This explained why the equity market rally has been broad-based. Another driver behind the upbeat offshore Chinese market since the middle of 2016 is the strong southbound inflow into the market

2
Investment Adviser’s Report
thanks to the launch of the stock connect programmes as well as the green light given by the Chinese government to insurers to invest in Hong Kong stocks since Q4 2016. Total inflow from China through the stock connect system in the first 7 months of 2017 already exceeded 75% of the total inflows in 2016. The inflow from China has not only supported the valuation of offshore Chinese equities but also create liquidity to the overall market.
The Fund’s strongest contribution came from stock selection in the consumer discretionary, namely automobile and education, and information technology sectors. We believe the outlook of Chinese economy remains healthy as supply side reform continued and recently we have seen a renewed effort in state-owned enterprises form. Recovery of global economy will also help China’s economic growth by means of strong export. Having said that, we are mindful of the rising geopolitical risks resulting from the escalating tension between the US and Korea. The liquidity risk from the unwinding of Balance Sheet by Fed may also create market volatility.
HSBCAsianHighYieldBondFund
MarketReviewAsia US dollar high yield credit held up well in the year ending at 31 July 2017, as spreads tightened amid investors’ search for yields. Thanks to its shorter duration, the strategy was less affected by the rise in US treasury yields. Post Trump’s victory in the US Presidential Election in November 2016, the market was expecting increasing fiscal stimulus from Trump to lead to a higher fiscal deficit and potentially more US treasury supply. This sent the benchmark 10 year US treasury yield to its 2-year high in mid December 2016. Coming into 2017, the US treasury yield curve flattened, as the Fed has delivered another two rate hikes since December 2016. US treasury yields at the belly to long-end of the curve declined, with no meaningful progress in the pro-growth fiscal policies proposed by Trump and soft inflation persistently below the Fed’s 2% target. Non-investment grade sovereign issues rallied in the year, in particular for Mongolia. Corporate names also performed well with names from the Macau, India and Indonesian complex leading the rally. During the year, the Fund delivered a good positive return and outperformed its benchmark gross of fees, with most of the outperformance from our favourable credit selection in particular from cyclical and industrials issues. Going forward, the Fund continues to hold a neutral to underweight stance in duration and we look to manage this exposure more tactically given the potential event risk and geopolitical risk. We remain constructive in Asia dollar credit, with support from solid macro and credit fundamentals for the region. Demand from both Asian local investors and global investors should stay resilient on the
back of continued search for yields and high quality of Asia dollar credit relative to other emerging market peers. In addition, Asia dollar credit has become more attractive on a relative basis compared to other major corporate bond markets, which should provide further support for the strategy.
HSBCGlobalAssetManagement(HongKong)Limited10 November 2017

3
Trustee’s Report
HSBCInvestmentFundsTrust(“theTrust”)
We hereby confirm that, to the best of our knowledge in our opinion, the Manager of the sub-funds within the Trust (“the sub-funds”) has, in all material respects, managed the sub-funds in accordance with the provisions of the Trust Deed dated 13 November 1995, as amended, for the year ended 31 July 2017.
) Bertha TAM ) For and on behalf of Dickson LEE ) HSBC Trustee (Cayman) Limited, ) Trustee )

4
Independent Auditors’ Report to the Unitholders
ReportontheAuditofFinancialStatements
Opinion
We have audited the financial statements of HSBC Asian Bond Fund, HSBC China Momentum Fund, HSBC China Growth Fund and HSBC Asian High Yield Bond Fund (“the sub-funds”), sub-funds of HSBC Investment Funds Trust, set out on pages 7 to 70, which comprise the statements of financial position as at 31 July 2017, the statements of comprehensive income, the statements of changes in net assets attributable to unitholders/statement of changes in equity, the cash flow statements and the distribution statements for the year then ended, and notes to the financial statements, including a summary of significant accounting policies.
In our opinion, the financial statements give a true and fair view of the financial disposition of the sub-funds at 31 July 2017, and of their financial transactions and cash flows for the year then ended in accordance with Hong Kong Financial Reporting Standards (“HKFRSs”) issued by the Hong Kong Institute of Certified Public Accountants (“HKICPA”).
BasisforOpinion
We conducted our audit in accordance with Hong Kong Standards on Auditing (“HKSAs”) issued by the HKICPA. Our responsibilities under those standards are further described in the Auditors’ Responsibilities for the Audit of the Financial Statements section of our report. We are independent of the sub-funds in accordance with the HKICPA’s Code of Ethics for Professional Accountants (“the Code”) together with the ethical requirements that are relevant to our audit of the financial statements in Cayman Islands, and we have fulfilled our other ethical responsibilities in accordance with these requirements and the Code. We believe that the audit evidence we have obtained is sufficient and appropriate to provide a basis for our opinion.
InformationOtherthantheFinancialStatementsandAuditors’ReportThereon
The Manager and the Trustee of the sub-funds are responsible for the other information. The other information comprises the information included in the annual report, but does not include the financial statements and our auditors’ report thereon.
Our opinion on the financial statements does not cover the other information and we do not express any form of assurance conclusion thereon.
In connection with our audit of the financial statements, our responsibility is to read the other information and, in doing so, consider whether the other information is materially inconsistent with the financial statements or our knowledge obtained in the audit, or otherwise appears to be materially misstated. If, based on the work we have performed, we conclude that there is a material misstatement of this other information, we are required to report that fact. We have nothing to report in this regard.
ResponsibilitiesoftheManagerandtheTrusteeoftheSub-FundsfortheFinancialStatements
The Manager and the Trustee of the sub-funds are responsible for the preparation and fair presentation of financial statements in accordance with HKFRSs issued by the HKICPA and for such internal control as the Manager and the Trustee determine is necessary to enable the preparation of financial statements that are free from material misstatement, whether due to fraud or error.
In preparing the financial statements, the Manager and the Trustee of the sub-funds are responsible for assessing the sub-funds’ ability to continue as a going concern, disclosing, as applicable, matters related to going concern and using the going concern basis of accounting unless the Manager and the Trustee of the sub-funds either intend to liquidate the sub-funds or to cease operations, or have no realistic alternative but to do so.
In addition, the Manager and the Trustee of the sub-funds are required to ensure that the financial statements have been properly prepared in accordance with the relevant provisions of the Trust Deed as amended (“the Trust Deed”) and the relevant disclosure provisions of Appendix E of the Code on Unit Trusts and Mutual Funds (“the SFC Code”) issued by the Hong Kong Securities and Futures Commission.

5
Independent Auditors’ Report to the Unitholders
Auditors’ResponsibilitiesfortheAuditoftheFinancialStatements
Our objectives are to obtain reasonable assurance about whether the financial statements as a whole are free from material misstatement, whether due to fraud or error, and to issue an auditors’ report that includes our opinion. This report is made solely to you, as a body, in accordance with our agreed terms of engagement, and for no other purpose. We do not assume responsibility towards or accept liability to any other person for the contents of this report.
Reasonable assurance is a high level of assurance but is not a guarantee that an audit conducted in accordance with HKSAs will always detect a material misstatement when it exists. Misstatements can arise from fraud or error and are considered material if, individually or in the aggregate, they could reasonably be expected to influence the economic decisions of users taken on the basis of these financial statements. In addition, we are required to assess whether the financial statements of the sub-funds have been properly prepared, in all material respects, in accordance with the relevant provisions of the Trust Deed and the relevant disclosure provisions of Appendix E of the SFC Code.
As part of an audit in accordance with HKSAs, we exercise professional judgement and maintain professional scepticism throughout the audit. We also:
• Identify and assess the risks of material misstatement of the financial statements, whether due to fraud or error, design and perform audit procedures responsive to those risks, and obtain audit evidence that is sufficient and appropriate to provide a basis for our opinion. The risk of not detecting a material misstatement resulting from fraud is higher than for one resulting from error, as fraud may involve collusion, forgery, intentional omissions, misrepresentations or the override of internal control.
• Obtain an understanding of internal control relevant to the audit in order to design audit procedures that are appropriate in the circumstances, but not for the purpose of expressing an opinion on the effectiveness of the sub-funds’ internal control.
• Evaluate the appropriateness of accounting policies used and the reasonableness of accounting estimates and related disclosures made by the Manager and the Trustee of the sub-funds.
• Conclude on the appropriateness of the Manager’s and the Trustee’s use of the going concern basis of accounting and, based on the audit evidence obtained, whether a material uncertainty exists related to events or conditions that may cast significant doubt on the sub-funds’ ability to continue as a going concern. If we conclude that a material uncertainty exists, we are required to draw attention in our auditors’ report to the related disclosures in the financial statements or, if such disclosures are inadequate, to modify our opinion. Our conclusions are based on the audit evidence obtained up to the date of our auditors’ report. However, future events or conditions may cause the sub-funds to cease to continue as a going concern.
• Evaluate the overall presentation, structure and content of the financial statements, including the disclosures, and whether the financial statements represent the underlying transactions and events in a manner that achieves fair presentation.
We communicate with the Manager and the Trustee of the sub-funds regarding, among other matters, the planned scope and timing of the audit and significant audit findings, including any significant deficiencies in internal control that we identify during our audit.

6
Independent Auditors’ Report to the Unitholders
ReportonmattersundertherelevantprovisionsoftheTrustDeedandtherelevantdisclosureprovisionsofAppendixEoftheSFCCode
In our opinion, the financial statements have been properly prepared, in all material respects, in accordance with the relevant provisions of the Trust Deed and the relevant disclosure provisions of Appendix E of the SFC Code.
KPMGP.O. Box 493Century Yard, Cricket SquareGrand Cayman KY1-1106Cayman Islands
10 November 2017

7
Statement of Financial Position
HSBCInvestmentFundsTrustas at 31 July 2017
2017 Asat31July Asat31July Asat31July Asat31July
Note
HSBCAsianBond
Fund
HSBCChina
MomentumFund
HSBCChinaGrowthFund
HSBCAsian
HighYieldBondFund
USD USD USD USD
ASSETSFinancial assets at fair value through
profit or loss 5, 12(g) 2,367,636,862 74,498,668 391,032,484 934,480,606Interest receivable 24,887,194 5 34 13,561,866Dividends receivable – 395,959 2,298,543 –Subscriptions receivable 9,651,013 – 1,236,569 24,675,758Amounts due from brokers 6 10,305,376 506,326 7,223,287 1,100,016Cash and cash equivalents 7(b) 25,592,472 1,618,193 1,788,023 20,258,727
2,438,072,917 77,019,151 403,578,940 994,076,973
LIABILITIESRedemptions payable 17,035,892 234,538 6,276,433 9,851,921Amounts due to brokers 6 14,510,576 751,822 5,463,868 10,986,652Taxes payable 4 296 – – –Distributions payable 11 8,251,805 – – 3,862,665Other payables 7(a), 7(c), 7(d) 2,264,873 144,903 565,477 1,298,015
42,063,442 1,131,263 12,305,778 25,999,253
NETASSETSATTRIBUTABLETOUNITHOLDERS 2,396,009,475 75,887,888 391,273,162 968,077,720
Representing:
Financialliabilities 2,396,009,475 – 391,273,162 968,077,720
Equity – 75,887,888 – –
Totalnumberofunitsinissue
– “AC – HKD” class 9(a) – – 51,353,315 197,395– “AC – SGD” class 9(b) – – – 9,683– “AC – USD” class 9(c) 631,809 1,153,233 23,350,939 743,622– “AM – HKD” class 9(d) 433,283,486 – – 204,421,346– “AM – USD” class 9(e) 157,193,355 – – 61,493,635– “AMH – AUD” class 9(f) 14,577,785 – – 3,938,576– “AMH – EUR” class 9(g) 1,921,932 – – 1,334,392– “IC – USD” class 9(h) 13,585,877 – – 1,341,644– “ID – USD” class 9(i) 2,907,224 – – –– “ZD – USD” class 9(j) 1,431,325 – – 30,206

8
Statement of Financial Position
HSBCInvestmentFundsTrustas at 31 July 2017
2017 Asat31July Asat31July Asat31July Asat31July
Note
HSBCAsianBond
Fund
HSBCChina
MomentumFund
HSBCChinaGrowthFund
HSBCAsian
HighYieldBondFund
USD USD USD USD
Netassetvalueperunit
– “AC – HKD” class 9(k) – – 1.701 1.868– “AC – SGD” class 9(k) – – – 11.365– “AC – USD” class 9(k) 13.028 65.805 13.015 14.526– “AM – HKD” class 9(k) 1.319 – – 1.314– “AM – USD” class 9(k) 9.263 – – 10.204– “AMH – AUD” class 9(k) 7.798 – – 7.926– “AMH – EUR” class 9(k) 11.418 – – 11.433– “IC – USD” class 9(k) 13.255 – – 10.425– “ID – USD” class 9(k) 10.162 – – –– “ZD – USD” class 9(k) 10.513 – – 10.388

9
Statement of Financial Position
HSBCInvestmentFundsTrustas at 31 July 2017
2016 Asat31July Asat31July Asat31July Asat31July
NoteHSBCAsianBondFund
HSBCChina
MomentumFund
HSBCChinaGrowth
Fund
HSBCAsianHighYieldBond
FundUSD USD USD USD
ASSETSFinancial assets at fair value through
profit or loss 5, 12(g) 3,351,403,140 60,007,792 419,787,806 746,506,208Interest receivable 34,149,478 – – 11,385,747Dividends receivable – 266,192 1,624,460 –Subscriptions receivable 41,200,915 – 119,687 17,438,415Amounts due from brokers 6 14,246,928 218,355 6,827,370 6,791,275Cash and cash equivalents 7(b) 8,800,471 8,017,667 13,569,482 28,392,075
3,449,800,932 68,510,006 441,928,805 810,513,720
LIABILITIESFinancial liabilities at fair value through
profit or loss 5, 12(g) – – – 70,979Redemptions payable 38,277,247 70,907 3,177,895 11,898,964Amounts due to brokers 6 9,596,073 205,794 7,949,351 9,146,222Taxes payable 4 312 6,515,122 41,790 –Distributions payable 11 12,944,529 – – 3,029,368Other payables 7(a), 7(c), 7(d) 3,268,612 113,591 591,329 968,035
64,086,773 6,905,414 11,760,365 25,113,568
NETASSETSATTRIBUTABLETOUNITHOLDERS 3,385,714,159 61,604,592 430,168,440 785,400,152
Representing:
Financialliabilities 3,385,714,159 – 430,168,440 785,400,152
Totalequity – 61,604,592 – –
Totalnumberofunitsinissue
– “AC – HKD” class 9(l) – – 83,447,976 298,029– “AC – SGD” class 9(m) – – – 9,683– “AC – USD” class 9(n) 461,597 1,414,559 33,481,179 559,038– “AM – HKD” class 9(o) 660,419,239 – – 198,884,891– “AM – USD” class 9(p) 219,698,875 – – 46,872,152– “AMH – AUD” class 9(q) 17,819,764 – – 2,951,951– “AMH – EUR” class 9(r) 2,466,706 – – 851,269– “IC – USD” class 9(s) 6,014,232 – – –– “ID – USD” class 9(t) 3,730,144 – – –– “ZD – USD” class 9(u) 11,697,349 – – –

10
Statement of Financial Position
HSBCInvestmentFundsTrustas at 31 July 2017
2016 Asat31July Asat31July Asat31July Asat31July
NoteHSBCAsianBondFund
HSBCChina
MomentumFund
HSBCChinaGrowth
Fund
HSBCAsianHighYieldBond
FundUSD USD USD USD
Netassetvalueperunit
– “AC – HKD” class 9(v) – – 1.267 1.802– “AC – SGD” class 9(v) – – – 10.951– “AC – USD” class 9(v) 12.874 43.550 9.690 14.267– “AM – HKD” class 9(v) 1.350 – – 1.333– “AM – USD” class 9(v) 9.484 – – 10.243– “AMH – AUD” class 9(v) 7.521 – – 7.504– “AMH – EUR” class 9(v) 11.083 – – 10.970– “IC – USD” class 9(v) 13.038 – – –– “ID – USD” class 9(v) 10.517 – – –– “ZD – USD” class 9(v) 10.727 – – –
Approved by the Trustee and the Manager on 10 November 2017.
) Bertha TAM ) For and on behalf of Dickson LEE ) HSBC Trustee (Cayman) Limited, ) Trustee )
) ) For and on behalf of Guillermo Eduardo MALDONADO-CODINA ) HSBC Investment Funds Chun Pong Stephen TAM ) (Hong Kong) Limited, ) Manager )
The notes on pages 22 to 70 form part of these financial statements.

11
Statement of Comprehensive Income
HSBCInvestmentFundsTrustfor the year ended 31 July 2017
2017 Yearended
31JulyYearended
31JulyYearended
31JulyYearended
31July
Note
HSBCAsianBond
Fund
HSBCChina
MomentumFund
HSBCChinaGrowth
Fund
HSBCAsianHighYieldBond
FundUSD USD USD USD
Interest income 7(b) 42,409 5,676 746 44,450Dividend income – 1,368,450 9,641,984 –Net gains from financial instruments at
fair value through profit or loss 3 51,105,790 19,723,714 115,374,418 48,321,034Net foreign exchange (losses)/gains (145,492) (19,431) (164,484) 6,271,456Other income 7(c), 7(d) 2,637,804 123,744 437,819 1,082,103
Totalrevenue 53,640,511 21,202,153 125,290,483 55,719,043
Management fees 7(a) 27,387,848 1,168,509 5,938,641 11,245,515Transaction costs 7(d), 7(e) 37,429 275,130 1,590,539 22,160Trustee’s fees 7(c) 3,024,077 84,001 425,346 1,204,275Registrar’s fees 7(a) 126,385 5,657 19,913 48,947Administrative fees 7(a) – – – –Auditors’ remuneration 16,417 22,606 28,436 16,440Legal and professional fees 19,565 8,921 6,431 11,639Safe custody fees, bank charges and
miscellaneous expenses 7(d) 487,776 33,065 123,604 149,495
Totaloperatingexpenses 31,099,497 1,597,889 8,132,910 12,698,471
Netprofitfromoperationsbeforetaxation 22,541,014 19,604,264 117,157,573 43,020,572
Taxation 4 (310,943) 8,186,832 (575,039) (313,582)
Netprofitfromoperationsbeforedistributions 22,230,071 27,791,096 116,582,534 42,706,990
Distributions to unitholders 11 (90,722,877) – – (41,825,300)
(Decrease)/increaseinnetassetsattributabletounitholdersandtotalcomprehensiveincomefortheyear (68,492,806) 27,791,096 116,582,534 881,690

12
Statement of Comprehensive Income
HSBCInvestmentFundsTrustfor the year ended 31 July 2017
2016 Yearended
31JulyYearended
31JulyYearended
31JulyYearended
31July
Note
HSBCAsianBond
Fund
HSBCChina
MomentumFund
HSBCChinaGrowth
Fund
HSBCAsianHighYieldBond
FundUSD USD USD USD
Interest income 7(b) 46,488 – – 16,376Dividend income – 2,457,610 14,730,253 –Net gains/(losses) from financial
instruments at fair value through profit or loss 3 217,317,696 (10,013,932) (88,651,109) 79,732,088
Net foreign exchange gain/(loss) 261,353 (2,069) 21,679 (440,351)Other income 7(c), 7(d) 46,643 – – 188,449
Totalrevenue/(loss) 217,672,180 (7,558,391) (73,899,177) 79,496,562
Management fees 7(a) 21,511,716 1,155,339 8,018,781 8,237,282Transaction costs 7(d), 7(e) 25,417 345,391 2,787,664 24,979Trustee’s fees 7(c) 2,516,786 84,980 573,011 946,653Registrar’s fees 7(a) 156,880 7,600 42,685 111,561Administrative fees 7(a) 1,387 3,062 3,463 –Auditors’ remuneration 9,197 15,451 14,641 2,770Legal and professional fees 15,984 1,651 3,003 13,517Safe custody fees, bank charges and
miscellaneous expenses 7(d) 411,669 29,505 146,076 154,009
Totaloperatingexpenses 24,649,036 1,642,979 11,589,324 9,490,771
Netprofit/(loss)fromoperationsbeforetaxation 193,023,144 (9,201,370) (85,488,501) 70,005,791
Taxation 4 (215,961) (125,957) (969,857) (221,085)
Netprofit/(loss)fromoperationsbeforedistributions 192,807,183 (9,327,327) (86,458,358) 69,784,706
Distributions to unitholders 11 (80,541,355) – – (38,222,088)
Increase/(decrease)innetassetsattributabletounitholdersandtotalcomprehensiveincomefortheyear 112,265,828 (9,327,327) (86,458,358) 31,562,618
The notes on pages 22 to 70 form part of these financial statements.

13
Statement of Changes in Net Assets Attributable to Unitholders/Statement of Changes in Equity
HSBCInvestmentFundsTrustfor the year ended 31 July 2017
2017 Yearended
31JulyYearended
31JulyYearended
31JulyYearended
31July
Note
HSBCAsianBond
Fund
HSBCChina
MomentumFund
HSBCChinaGrowth
Fund
HSBCAsianHighYieldBond
FundUSD USD USD USD
Balanceatthebeginningoftheyear 3,385,714,159 61,604,592 430,168,440 785,400,152
(Decrease)/increaseinnetassetsattributabletounitholdersandtotalcomprehensiveincomefortheyear (68,492,806) 27,791,096 116,582,534 881,690
Subscriptionsofunits(excludingequalisation)
– “AC – HKD” class – – 29,994,624 1,888,331– “AC – USD” class 2,868,879 – 72,789,963 3,295,435– “AM – HKD” class 494,182,433 – – 163,439,480– “AM – USD” class 912,469,374 – – 436,404,064– “AMH – AUD” class 103,078,009 – – 40,248,375– “AMH – EUR” class 9,480,902 – – 10,040,342– “IC – USD” class 114,960,567 – – 39,506,095– “ID – USD” class 2,553,202 – – –– “ZD – USD” class 19,625,975 – – 535,727
Redemptionsofunits(excludingequalisation)
– “AC – HKD” class – – (75,280,526) (2,129,865)– “AC – USD” class (743,009) (12,452,925) (182,444,804) (700,694)– “AM – HKD” class (792,028,317) – – (155,403,337)– “AM – USD” class (1,487,530,005) – – (291,349,591)– “AMH – AUD” class (127,238,475) – – (33,038,491)– “AMH – EUR” class (15,337,214) – – (4,910,049)– “IC – USD” class (18,645,157) – – (25,957,111)– “ID – USD” class (11,243,577) – – –– “ZD – USD” class (125,677,115) – – (179,397)
Income equalisation on subscriptions and redemptions 10 (1,988,350) (1,054,875) (537,069) 106,564
(921,211,878) (13,507,800) (155,477,812) 181,795,878
Balanceattheendoftheyear 2,396,009,475 75,887,888 391,273,162 968,077,720

14
Statement of Changes in Net Assets Attributable to Unitholders/Statement of Changes in Equity
HSBCInvestmentFundsTrustfor the year ended 31 July 2017
2016 Yearended
31JulyYearended
31JulyYearended
31JulyYearended
31July
Note
HSBCAsianBond
Fund
HSBCChina
MomentumFund
HSBCChinaGrowth
Fund
HSBCAsianHighYieldBond
FundUSD USD USD USD
Balanceatthebeginningoftheyear 1,494,420,242 82,815,596 758,416,160 643,721,892
Increase/(decrease)innetassetsattributabletounitholdersandtotalcomprehensiveincomefortheyear 112,265,828 (9,327,327) (86,458,358) 31,562,618
Subscriptionsofunits(excludingequalisation)
– “AC – HKD” class – – 41,969,712 (79,199)– “AC – USD” class 1,720,614 – 75,555,236 2,505,113– “AM – HKD” class 1,095,538,319 – – 125,630,299– “AM – USD” class 2,092,440,069 – – 260,924,156– “AMH – AUD” class 182,288,635 – – 30,125,344– “AMH – EUR” class 24,926,706 – – 7,244,821– “IC – USD” class 88,584,233 – – 34,818,695– “ID – USD” class 54,441,893 – – –– “ZD – USD” class 7,486,951 – – –
15
Statement of Changes in Net Assets Attributable to Unitholders/Statement of Changes in Equity
HSBCInvestmentFundsTrustfor the year ended 31 July 2017
2016 Yearended
31JulyYearended
31JulyYearended
31JulyYearended
31July
Note
HSBCAsianBond
Fund
HSBCChina
MomentumFund
HSBCChinaGrowth
Fund
HSBCAsianHighYieldBond
FundUSD USD USD USD
Redemptionsofunits(excludingequalisation)
– “AC – HKD” class – – (119,597,768) (164,970)– “AC – USD” class (1,090,303) (11,927,493) (240,344,828) (2,342,956)– “AM – HKD” class (521,105,053) – – (100,804,910)– “AM – USD” class (1,021,467,491) – – (164,338,488)– “AMH – AUD” class (77,198,376) – – (38,767,021)– “AMH – EUR” class (10,901,093) – – (8,481,472)– “IC – USD” class (75,756,012) – – (34,960,775)– “ID – USD” class (20,257,824) – – –– “ZD – USD” class (38,777,246) – – –
Income equalisation on subscriptions and redemptions 10 (1,845,933) 43,816 628,286 (1,192,995)
1,779,028,089 (11,883,677) (241,789,362) 110,115,642
Balanceattheendoftheyear 3,385,714,159 61,604,592 430,168,440 785,400,152
The redeemable units of HSBC China Momentum Fund are classified as equity under HKAS 32. Therefore this sub-fund presents a statement of changes in equity, and the issue and redemption of units and distributions to unitholders are treated as transactions with owners and recorded directly in the statement of changes in equity for the year ended 31 July 2017 and 31 July 2016 for HSBC China Momentum Fund.
The redeemable units of HSBC Asian Bond Fund, HSBC China Growth Fund and HSBC Asian High Yield Bond Fund are classified as financial liabilities and these sub-funds present a statement of changes in net assets attributable to unitholders and the issue and redemption of units are treated as transactions with unitholders. The distributions are treated as finance cost and are recognised in the statement of comprehensive income for the year ended 31 July 2017 and 31 July 2016.
The notes on pages 22 to 70 form part of these financial statements.

16
Cash Flow Statement
HSBCInvestmentFundsTrustfor the year ended 31 July 2017
2017 Yearended
31JulyYearended
31JulyYearended
31JulyYearended
31July
HSBCAsianBond
Fund
HSBCChina
MomentumFund
HSBCChinaGrowth
Fund
HSBCAsianHighYieldBond
FundUSD USD USD USD
OperatingactivitiesInterest received 42,409 5,671 712 44,450Dividends received – 1,238,683 8,967,901 –Management fees paid (27,949,281) (1,145,324) (5,964,220) (11,051,531)Trustee’s fees paid (3,144,187) (84,037) (435,857) (1,216,401)Payments on purchase of investments (954,056,364) (56,375,458) (336,502,414) (1,357,012,121)Proceeds from sale of investments 2,007,046,771 61,866,353 477,750,754 1,222,643,348Taxes paid (310,959) 1,671,710 (616,829) (313,582)Other operating income received/(expenses paid) 1,482,544 (232,903) (1,485,350) 7,253,000
Cashprovidedby/(usedin)operatingactivities 1,023,110,933 6,944,695 141,714,697 (139,652,837)
FinancingactivitiesProceeds from issue of units including equalisation 1,692,733,526 – 101,960,017 687,775,560Payments on redemption of units including
equalisation (2,603,636,857) (13,344,169) (255,456,173) (515,264,068)Distributions paid (95,415,601) – – (40,992,003)
Cash(usedin)/providedbyfinancingactivities (1,006,318,932) (13,344,169) (153,496,156) 131,519,489
Netincrease/(decrease)incashandcashequivalents 16,792,001 (6,399,474) (11,781,459) (8,133,348)
Cashandcashequivalentsatthebeginningoftheyear 8,800,471 8,017,667 13,569,482 28,392,075
Cashandcashequivalentsattheendoftheyear 25,592,472 1,618,193 1,788,023 20,258,727

17
Cash Flow Statement
HSBCInvestmentFundsTrustfor the year ended 31 July 2017
2016 Yearended
31JulyYearended
31JulyYearended
31JulyYearended
31July
HSBCAsianBond
Fund
HSBCChina
MomentumFund
HSBCChinaGrowth
Fund
HSBCAsianHighYieldBond
FundUSD USD USD USD
OperatingactivitiesInterest received 46,488 – – 16,376Dividends received – 2,304,200 14,227,222 –Management fees paid (20,109,337) (1,200,192) (8,497,330) (8,119,224)Trustee’s fees paid (2,382,063) (87,703) (605,202) (920,664)Payments on purchase of investments (2,565,441,135) (77,374,610) (668,146,606) (1,143,735,048)Proceeds from sale of investments 864,253,370 87,235,925 884,756,712 1,097,571,771Taxes paid (215,981) (277,570) (1,155,755) (221,085)Other operating income received/(expenses paid) 34,224 (427,336) (3,124,257) (611,386)
Cash(usedin)/providedbyoperatingactivities (1,723,814,434) 10,172,714 217,454,784 (56,019,260)
FinancingactivitiesProceeds from issue of units including equalisation 3,518,869,183 – 123,801,997 446,968,299Payments on redemption of units including
equalisation (1,737,606,973) (11,827,451) (365,478,656) (343,851,719)Distributions paid (77,889,191) – – (38,454,864)
Cashprovidedby/(usedin)financingactivities 1,703,373,019 (11,827,451) (241,676,659) 64,661,716
Net(decrease)/increaseincashandcashequivalents (20,441,415) (1,654,737) (24,221,875) 8,642,456
Cashandcashequivalentsatthebeginningoftheyear 29,241,886 9,672,404 37,791,357 19,749,619
Cashandcashequivalentsattheendoftheyear 8,800,471 8,017,667 13,569,482 28,392,075
The notes on pages 22 to 70 form part of these financial statements.

18
Distribution Statement
HSBCInvestmentFundsTrustfor the year ended 31 July 2017
2017 Yearended
31JulyYearended
31JulyYearended
31JulyYearended
31July
HSBCAsianBond
Fund
HSBCChina
MomentumFund
HSBCChinaGrowth
Fund
HSBCAsianHighYieldBond
FundUSD USD USD USD
Amountavailablefordistributionbroughtforward 3,385,714,159 61,604,592 430,168,440 785,400,152
Net (paid or payable)/received or receivable on issue and redemption of units (921,211,878) (13,507,800) (155,477,812) 181,795,878
Income before distributions after taxation 22,230,071 27,791,096 116,582,534 42,706,990
Amountavailablefordistributiontounitholders 2,486,732,352 75,887,888 391,273,162 1,009,903,020Distributions to unitholders (90,722,877) – – (41,825,300)
Amountavailablefordistributioncarriedforward 2,396,009,475 75,887,888 391,273,162 968,077,720
2016 Yearended
31JulyYearended
31JulyYearended
31JulyYearended
31July
HSBCAsianBond
Fund
HSBCChina
MomentumFund
HSBCChinaGrowth
Fund
HSBCAsianHighYieldBond
FundUSD USD USD USD
Amountavailablefordistributionbroughtforward 1,494,420,242 82,815,596 758,416,160 643,721,892
Net received or receivable/(paid or payable) on issue and redemption of units 1,779,028,089 (11,883,677) (241,789,362) 110,115,642
Income/(loss) before distributions after taxation 192,807,183 (9,327,327) (86,458,358) 69,784,706
Amountavailablefordistributiontounitholders 3,466,255,514 61,604,592 430,168,440 823,622,240Distributions to unitholders (80,541,355) – – (38,222,088)
Amountavailablefordistributioncarriedforward 3,385,714,159 61,604,592 430,168,440 785,400,152

19
Distribution Statement
HSBCInvestmentFundsTrustfor the year ended 31 July 2017
Yearended31July2017 Yearended31July2016
NoteDistribution
perunitDateof
distributionDistribution
perunitDateof
distributionUSD USD
Distributionhistory–HSBCAsianBondFund
ClassAM–HKDFirst distribution 11 0.0035 30 August 2016 0.0042 28 August 2015Second distribution 11 0.0034 29 September 2016 0.0041 29 September 2015Third distribution 11 0.0034 28 October 2016 0.0040 29 October 2015Fourth distribution 11 0.0038 29 November 2016 0.0040 27 November 2015Fifth distribution 11 0.0041 29 December 2016 0.0042 30 December 2015Sixth distribution 11 0.0038 26 January 2017 0.0042 28 January 2016Seventh distribution 11 0.0041 27 February 2017 0.0041 26 February 2016Eighth distribution 11 0.0039 30 March 2017 0.0038 30 March 2016Ninth distribution 11 0.0039 27 April 2017 0.0035 28 April 2016Tenth distribution 11 0.0038 29 May 2017 0.0035 30 May 2016Eleventh distribution 11 0.0038 29 June 2017 0.0035 29 June 2016Twelfth distribution 11 0.0039 28 July 2017 0.0033 28 July 2016 ClassAM–USD First distribution 11 0.0245 30 August 2016 0.0292 28 August 2015Second distribution 11 0.0239 29 September 2016 0.0289 29 September 2015Third distribution 11 0.0241 28 October 2016 0.0280 29 October 2015Fourth distribution 11 0.0265 29 November 2016 0.0278 27 November 2015Fifth distribution 11 0.0285 29 December 2016 0.0292 30 December 2015Sixth distribution 11 0.0270 26 January 2017 0.0296 28 January 2016Seventh distribution 11 0.0285 27 February 2017 0.0285 26 February 2016Eighth distribution 11 0.0272 30 March 2017 0.0267 30 March 2016Ninth distribution 11 0.0274 27 April 2017 0.0244 28 April 2016Tenth distribution 11 0.0268 29 May 2017 0.0246 30 May 2016Eleventh distribution 11 0.0269 29 June 2017 0.0248 29 June 2016Twelfth distribution 11 0.0273 28 July 2017 0.0234 28 July 2016
ClassAMH–AUD First distribution 11 0.0259 30 August 2016 0.0318 28 August 2015Second distribution 11 0.0241 29 September 2016 0.0307 29 September 2015Third distribution 11 0.0241 28 October 2016 0.0306 29 October 2015Fourth distribution 11 0.0252 29 November 2016 0.0306 27 November 2015Fifth distribution 11 0.0256 29 December 2016 0.0319 30 December 2015Sixth distribution 11 0.0252 26 January 2017 0.0303 28 January 2016Seventh distribution 11 0.0265 27 February 2017 0.0295 26 February 2016Eighth distribution 11 0.0255 30 March 2017 0.0303 30 March 2016Ninth distribution 11 0.0244 27 April 2017 0.0285 28 April 2016Tenth distribution 11 0.0240 29 May 2017 0.0270 30 May 2016Eleventh distribution 11 0.0246 29 June 2017 0.0265 29 June 2016Twelfth distribution 11 0.0250 28 July 2017 0.0260 28 July 2016

20
Distribution Statement
HSBCInvestmentFundsTrustfor the year ended 31 July 2017
Yearended31July2017 Yearended31July2016
NoteDistribution
perunitDateof
distributionDistribution
perunitDateof
distributionUSD USD
Distributionhistory–HSBCAsianBondFund
ClassAMH–EUR First distribution 11 0.0204 30 August 2016 0.0325 28 August 2015Second distribution 11 0.0191 29 September 2016 0.0318 29 September 2015Third distribution 11 0.0181 28 October 2016 0.0301 29 October 2015Fourth distribution 11 0.0204 29 November 2016 0.0293 27 November 2015Fifth distribution 11 0.0219 29 December 2016 0.0323 30 December 2015Sixth distribution 11 0.0200 26 January 2017 0.0291 28 January 2016Seventh distribution 11 0.0213 27 February 2017 0.0284 26 February 2016Eighth distribution 11 0.0197 30 March 2017 0.0250 30 March 2016Ninth distribution 11 0.0194 27 April 2017 0.0224 28 April 2016Tenth distribution 11 0.0191 29 May 2017 0.0220 30 May 2016Eleventh distribution 11 0.0192 29 June 2017 0.0220 29 June 2016Twelfth distribution 11 0.0191 28 July 2017 0.0195 28 July 2016 ClassID–USD First distribution 11 0.4202 28 July 2017 0.3230 28 July 2016
ClassZD–USD First distribution 11 0.4554 28 July 2017 0.3327 28 July 2016
Distributionhistory–HSBCAsianHighYieldBondFund
ClassAM–HKD First distribution 11 0.0048 30 August 2016 0.0063 28 August 2015Second distribution 11 0.0050 29 September 2016 0.0064 29 September 2015Third distribution 11 0.0051 28 October 2016 0.0064 29 October 2015Fourth distribution 11 0.0056 29 November 2016 0.0063 27 November 2015Fifth distribution 11 0.0055 29 December 2016 0.0065 30 December 2015Sixth distribution 11 0.0049 26 January 2017 0.0068 28 January 2016Seventh distribution 11 0.0055 27 February 2017 0.0067 26 February 2016Eighth distribution 11 0.0050 30 March 2017 0.0063 30 March 2016Ninth distribution 11 0.0050 27 April 2017 0.0056 28 April 2016Tenth distribution 11 0.0049 29 May 2017 0.0057 30 May 2016Eleventh distribution 11 0.0049 29 June 2017 0.0060 29 June 2016Twelfth distribution 11 0.0055 28 July 2017 0.0051 28 July 2016

21
Distribution Statement
HSBCInvestmentFundsTrustfor the year ended 31 July 2017
Yearended31July2017 Yearended31July2016
NoteDistribution
perunitDateof
distributionDistribution
perunitDateof
distributionUSD USD
Distributionhistory–HSBCAsianHighYieldBondFund
ClassAM–USD First distribution 11 0.0377 30 August 2016 0.0487 28 August 2015Second distribution 11 0.0391 29 September 2016 0.0499 29 September 2015Third distribution 11 0.0397 28 October 2016 0.0494 29 October 2015Fourth distribution 11 0.0434 29 November 2016 0.0489 27 November 2015Fifth distribution 11 0.0424 29 December 2016 0.0503 30 December 2015Sixth distribution 11 0.0383 26 January 2017 0.0525 28 January 2016Seventh distribution 11 0.0425 27 February 2017 0.0524 26 February 2016Eighth distribution 11 0.0386 30 March 2017 0.0490 30 March 2016Ninth distribution 11 0.0390 27 April 2017 0.0434 28 April 2016Tenth distribution 11 0.0379 29 May 2017 0.0446 30 May 2016Eleventh distribution 11 0.0380 29 June 2017 0.0468 29 June 2016Twelfth distribution 11 0.0424 28 July 2017 0.0399 28 July 2016 ClassAMH–AUD First distribution 11 0.0339 30 August 2016 0.0429 28 August 2015Second distribution 11 0.0338 29 September 2016 0.0426 29 September 2015Third distribution 11 0.0341 28 October 2016 0.0434 29 October 2015Fourth distribution 11 0.0359 29 November 2016 0.0434 27 November 2015Fifth distribution 11 0.0336 29 December 2016 0.0447 30 December 2015Sixth distribution 11 0.0318 26 January 2017 0.0439 28 January 2016Seventh distribution 11 0.0354 27 February 2017 0.0439 26 February 2016Eighth distribution 11 0.0325 30 March 2017 0.0447 30 March 2016Ninth distribution 11 0.0312 27 April 2017 0.0407 28 April 2016Tenth distribution 11 0.0302 29 May 2017 0.0395 30 May 2016Eleventh distribution 11 0.0312 29 June 2017 0.0404 29 June 2016Twelfth distribution 11 0.0350 28 July 2017 0.0363 28 July 2016
ClassAMH–EUR First distribution 11 0.0322 30 August 2016 0.0508 28 August 2015Second distribution 11 0.0332 29 September 2016 0.0517 29 September 2015Third distribution 11 0.0322 28 October 2016 0.0502 29 October 2015Fourth distribution 11 0.0353 29 November 2016 0.0484 27 November 2015Fifth distribution 11 0.0331 29 December 2016 0.0517 30 December 2015Sixth distribution 11 0.0289 26 January 2017 0.0503 28 January 2016Seventh distribution 11 0.0327 27 February 2017 0.0512 26 February 2016Eighth distribution 11 0.0285 30 March 2017 0.0471 30 March 2016Ninth distribution 11 0.0288 27 April 2017 0.0409 28 April 2016Tenth distribution 11 0.0282 29 May 2017 0.0410 30 May 2016Eleventh distribution 11 0.0285 29 June 2017 0.0434 29 June 2016Twelfth distribution 11 0.0331 28 July 2017 0.0349 28 July 2016
The notes on pages 22 to 70 form part of these financial statements.

22
Notes to the Financial Statements
1 TheTrust
HSBC Investment Funds Trust (“the Trust”) is an open ended umbrella unit trust which was established under a trust deed dated 13 November 1995, as amended (the “Trust Deed”), and is governed by the laws of the Cayman Islands. The Trust registered under the Mutual Funds Law of the Cayman Islands on 10 November 1995. The four sub-funds (“the sub-funds”) of the Trust included under this report are:
– HSBC Asian Bond Fund– HSBC China Momentum Fund– HSBC China Growth Fund– HSBC Asian High Yield Bond Fund
HSBC Asia ex Japan Equity Index Fund, was created under the Trust on 9 December 2010. The financial statements of this sub fund is not included under this report because separate set of financial statements is prepared solely for this sub-fund.
The sub-funds included under this report commenced their operations on the dates as set out below:
Date of commencement
HSBC Asian Bond Fund 13 November 1995HSBC China Momentum Fund 28 October 2003HSBC China Growth Fund 5 July 2007HSBC Asian High Yield Bond Fund 23 May 2011
The objective of HSBC Asian Bond Fund is to achieve a reasonably high income whilst maintaining a prudent policy of capital conservation for the unitholders through investing in fixed interest securities and government bonds within the Asian region.
The objective of HSBC China Momentum Fund is to achieve long-term capital appreciation by investing in securities issued by or linked to the companies that are positioned to benefit from the strong economic growth and rising investment opportunities in Mainland China (“China”).
The objective of HSBC China Growth Fund is to seek long-term capital growth by investing in a portfolio of equities issued by companies located in China or deriving a preponderant part of their income and/or assets from China, and instruments linked to such investments.
The objective of HSBC Asian High Yield Bond Fund is to achieve a higher level of income and capital appreciation through investing primarily in a diversified portfolio of higher yielding fixed income securities including investment grade, non investment grade and unrated bonds that are primarily denominated in United States dollars, traded or issued by issuers in the Asian markets.
All sub-funds included under this report are authorised by the Hong Kong Securities and Futures Commission (“SFC”) under Section 104 of the Hong Kong Securities and Futures Ordinance (“HKSFO”) and are governed by the Hong Kong Code on Unit Trusts and Mutual Funds issued by the SFC.
The financial statements of the sub-funds are presented in United States dollars.
The Trust Deed does not contain any requirement that a combined set of financial statements for the Trust itself be prepared.
2 Significantaccountingpolicies
(a) Statementofcompliance
The financial statements have been prepared in accordance with all applicable Hong Kong Financial Reporting Standards (“HKFRSs”), which as a collective term includes all applicable individual Hong Kong Financial Reporting Standards, Hong Kong Accounting Standards (“HKASs”) and Interpretations issued by the Hong Kong Institute of Certified Public Accountants (“HKICPA”), accounting principles generally accepted in Hong Kong, the relevant disclosure provisions of the Trust Deed, as amended, and the relevant disclosure provisions of the Hong Kong Code on Unit Trusts and Mutual Funds issued by the SFC. A summary of the significant accounting policies adopted by the Trust is set out below.
(b) Basisofpreparationofthefinancialstatements
The functional and presentation currency for the sub-funds is United States dollars reflecting the fact that a majority of the participating redeemable units of the sub-funds are issued and redeemed in United States dollars.
The financial statements are prepared on a fair value basis for financial assets and financial liabilities at fair value through profit or loss and derivative financial instruments. Other financial assets and financial liabilities are stated at amortised cost or redemption amount (redeemable units).

23
Notes to the Financial Statements
The preparation of financial statements in conformity with HKFRSs requires management to make judgements, estimates and assumptions that affect the application of policies and reported amounts of assets, liabilities, income and expenses. The estimates and associated assumptions are based on historical experience and various other factors that are believed to be reasonable under the circumstances, the results of which form the basis of making the judgements about carrying values of assets and liabilities that are not readily apparent from other sources. Actual results may differ from these estimates.
The estimates and underlying assumptions are reviewed on an ongoing basis. Revisions to accounting estimates are recognised in the period in which the estimate is revised if the revision affects only that period, or in the period of the revision and future periods if the revision affects both current and future periods.
The accounting policies have been applied consistently by the sub-funds and are consistent with those used in the previous year.
(c) Changesinaccountingpolicies
The HKICPA has issued a number of amendments to HKFRSs that are first effective for the current accounting period of the sub-funds. None of these developments have had a material effect on how the sub-funds results and financial position for the current or prior periods have been prepared or presented.
The sub-funds have not applied any new standard or interpretation that is not yet effective for the current accounting period (see note 15).
(d) Foreigncurrencytranslation
Foreign currency transactions during the year are translated into the reporting currencies of the respective sub-funds at the exchange rates ruling at the transaction dates. Monetary assets and liabilities denominated in foreign currencies that are stated at fair value are translated into the reporting currencies of the respective sub-funds at the foreign exchange rates ruling at the date of the statement of financial position. Foreign currency exchange differences arising on translation and realised gains and losses on disposals or settlements of monetary assets and liabilities are recognised in profit or loss.
Foreign currency exchange differences relating to investments at fair value through profit or loss are included in net gains or losses from financial instruments at fair value through profit or loss. All other foreign currency exchange differences relating to monetary items including cash and cash equivalents are presented separately in profit or loss.
(e) Financialinstruments
(i) Classification
All of the sub-funds’ investments are classified as financial assets or financial liabilities at fair value through profit or loss. This category comprises financial instruments held for trading, which are instruments that the sub-funds have acquired principally for the purpose of short-term profit-taking. These include investments in equities and debt securities, equity-linked instruments and forward contracts.
All derivatives in a net receivable position (positive fair value) are reported as financial assets. All derivatives in a net payable position (negative fair value) are reported as financial liabilities.
Financial assets at amortised cost that are classified as loans and receivables include interest receivable, dividends receivable, subscriptions receivable and amounts due from brokers.
Financial l iabilities at amortised cost include redemptions payable, amounts due to brokers, taxes payable, distributions payable and other payables. Financial liabilities arising from the redeemable units issued by HSBC Asian Bond Fund, HSBC China Growth Fund and HSBC Asian High Yield Bond Fund are carried at the redemption amount.
(ii) Recognition
The sub-funds recognise financial assets and financial liabilities on the date they become a party to the contractual provisions of the instruments.
A regular way purchase or sale of financial assets is recognised using trade date accounting. From this date any gains and losses arising from changes in fair value of the financial assets or financial liabilities are recorded.
24
Notes to the Financial Statements
Financial liabilities are not recognised unless one of the parties has performed their obligations under the contract or the contract is a derivative contract not exempted from the scope of HKAS 39.
(iii) Measurement
Financial instruments are measured initially at fair value (transaction price). Transaction costs on financial assets and liabilities at fair value through profit or loss are expensed immediately, while on other financial instruments they are amortised.
Subsequent to initial recognition, all instruments classified at fair value through profit or loss are measured at fair value with changes in their fair value recognised in profit or loss.
Financial assets classified as loans and receivables are carried at amortised cost using the effective interest rate method, less impairment losses, if any.
Financial liabilities other than those at fair value through profit or loss are measured at amortised cost using the effective interest rate method. Financial liabilities arising from the redeemable units issued by the sub-funds are carried at the redemption amount representing the unitholders’ right to a residual interest in the sub-funds’ assets.
(iv) Fair value measurement principles
Fair value is the price that would be received to sell an asset or paid to transfer a liability in an orderly transaction between market participants at the measurement date in the principal or, in its absence, the most advantageous market to which the sub-funds have access at that date. The fair value of a liability reflects its non performance risk.
When available, the sub-funds measure the fair value of an instrument using the quoted price in an active market for that instrument provided such price is within the bid ask spread. A market is regarded as active if transactions for the asset or liability take place with sufficient frequency and volume to provide pricing information on an ongoing basis. In circumstances where the quoted price is not within the bid ask spread, the Manager of the sub-funds will determine the points within the bid ask spread that are most representative of the fair value.
When there is no quoted price in an active market, the sub-funds use valuation techniques that maximise the use of relevant observable inputs and minimise the use of unobservable inputs. The chosen valuation technique incorporates all the factors that market participants would take into account in pricing a transaction.
The best evidence of the fair value of a financial instrument at initial recognition is normally the transaction price – i.e. the fair value of the consideration given or received. If the sub-funds determine that the fair value at initial recognition differs from the transaction price and the fair value is evidenced neither by a quoted price in an active market for an identical asset or liability nor based on a valuation technique that uses only data from observable markets, the financial instrument is initially measured at fair value, adjusted to defer the difference between the fair value at initial recognition and the transaction price. Subsequently, that difference is recognised in profit or loss on an appropriate basis over the life of the instrument but no later than when the valuation is supported wholly by observable market data or the transaction is closed out.
Portfolios of financial assets and financial liabilities that are exposed to market risk and credit risk that are managed by the sub-funds on the basis of the net exposure to either market or credit risk, are measured on the basis of a price that would be received to sell a net long position (or paid to transfer a net short position) for a particular risk exposure. Those portfolio-level adjustments are allocated to the individual assets and liabilities on the basis of the relative risk adjustment of each of the individual instruments in the portfolio.
The sub-funds recognise transfers between levels of the fair value hierarchy as of the end of the reporting period during which the change has occurred.
(v) Amortised cost measurement principles
The amortised cost of a financial asset or liability is the amount at which the financial asset or liability is measured at initial recognition, minus principal repayments, plus or minus the cumulative amortisation using the effective interest method of any difference between the initial amount recognised and the maturity amount, minus any reduction for impairment.

25
Notes to the Financial Statements
(vi) Impairment
Financial assets that are stated at cost or amortised cost are reviewed at each date of the statement of financial position to determine whether there is objective evidence of impairment. If any such indication exists, an impairment loss is recognised in profit or loss as the difference between the asset’s carrying amount and the present value of estimated future cash flows discounted at the financial asset’s original effective interest rate.
If in a subsequent period the amount of an impairment loss recognised on a financial asset carried at amortised cost decreases and the decrease can be linked objectively to an event occurring after the write down, the write down is reversed through profit or loss.
(vii) Derecognition
The sub-funds derecognise a financial asset when the contractual rights to the cash flows from the financial asset expire or they transfer the financial asset and the transfer qualifies for derecognition in accordance with HKAS 39.
The sub-funds use the weighted average method to determine realised gains and losses on derecognition.
A financial liability is derecognised when the obligation specified in the contract is discharged, cancelled or expired.
(viii) Offsetting
Financial assets and liabilities are offset and the net amount is reported in the statement of financial position when the sub-funds have a legally enforceable right to offset the recognised amounts and the transactions are intended to be settled on a net basis or simultaneously, e.g. through a market clearing mechanism.
(ix) Specific instruments
Cash and cash equivalents
Cash comprises current deposits with banks. Cash equivalents are short-term highly liquid investments that are readily convertible to known amounts of cash, are subject to an insignificant risk of changes in value, and are held for the purpose of meeting short term cash commitments rather than for investment or other purposes.
(f) Revenuerecognition
Provided it is probable that the economic benefits will flow to the sub-funds and the revenue and costs, if applicable, can be measured reliably, revenue is recognised in profit or loss as follows:
(i) Dividends
Dividend income from listed investments is recognised when the share price of the investment goes ex-dividend. Dividends from other investments are recognised in profit or loss as dividend income when declared. In some cases, the sub-funds may choose to receive dividends in the form of additional shares rather than cash. In such cases, the sub-funds recognise the dividend income for the amount of the equivalent cash dividend with the corresponding debit treated as an additional investment.
(ii) Interest income
Interest income is recognised in profit or loss as it accrues, using the effective interest rate method. Interest income on bank deposits and amount due from brokers is disclosed separately on the face of profit or loss. Interest income on debt securities is included in net gains or losses from financial instruments at fair value through profit or loss.
(g) Expenses
All expenses are recognised in profit or loss on an accrual basis.

26
Notes to the Financial Statements
(h) Foreignexchangegainsandlosses
Foreign exchange gains and losses on financial assets and financial liabilities at fair value through profit or loss are recognised together with other changes in the fair value. Included in profit or loss line item Net foreign exchange (losses)/gains are net of foreign exchange gains and losses on monetary financial assets and financial liabilities other than those classified at fair value through profit or loss.
(i) Relatedparties
(a) A person, or a close member of that person’s family, is related to the Trust if that person:
(i) has control or joint control over the Trust;
(ii) has significant influence over the Trust; or
(iii) is a member of the key management personnel of the Trust.
(b) An entity is related to the Trust if any of the following conditions applies:
(i) The entity and the Trust are members of the same group (which means that each parent, subsidiary and fellow subsidiary is related to the others).
(ii) One entity is an associate or joint venture of the other entity (or an associate or joint venture of a member of a group of which the other entity is a member).
(iii) Both entities are joint ventures of the same third party.
(iv) One entity is a joint venture of a third entity and the other entity is an associate of the third entity.
(v) The entity is a post-employment benefit plan for the benefit of employees of an entity related to the Trust.
(vi) The entity is controlled or jointly controlled by a person identified in (a).
(vii) A person identified in (a)(i) has significant influence over the entity or is a member of the key management personnel of the entity (or of a parent of the entity).
(viii) The entity, or any member of a group of which it is a part, provides key management personnel services to the Trust.
Close members of the family of a person are those family members who may be expected to influence, or be influenced by, that person in their dealings with the entity.
(j) Subscriptionsandredemptions
The sub-funds recognise unitholders’ subscriptions and allot units upon receipt of a valid subscription application and derecognise them upon receipt of a valid redemption application.
(k) Unitsinissue
The sub-funds classify financial instruments issued as financial liabilities or equity instruments in accordance with the substance of the contractual terms of the instruments.
A puttable financial instrument that includes a contractual obligation for the issuer to repurchase or redeem that instrument for cash or another financial asset is classified as an equity instrument if it meets the following conditions:
(i) it entitles the holder to a pro rata share of the sub-funds’ net assets in the event of the sub-funds’ liquidation;
(ii) it is in the class of instruments that is subordinate to all other classes of instruments;
(iii) all financial instruments in the class of instruments that is subordinate to all other classes of instruments have identical features;
(iv) apart from the contractual obligation for the sub-funds to repurchase or redeem the instrument for cash or another financial asset, the instrument does not include any other features that would require classification as a liability; and
(v) the total expected cash flows attributable to the instrument over its life are based substantially on profit or loss, the change in the recognised net assets or the change in the fair value of the recognised and unrecognised net assets of the sub-funds over the life of the instrument.
HSBC China Momentum Fund has only one class of redeemable units in issue and their redeemable units meet all of these conditions and are classified as equity.

27
Notes to the Financial Statements
HSBC Asian Bond Fund, HSBC China Growth Fund and HSBC Asian High Yield Bond Fund have multiple classes of redeemable units in issue. All the classes are the most subordinate classes of financial instruments in the respective sub-funds and rank pari passu in all material respects and have the same terms and conditions other than different currencies and management fees rates, and/or different distribution policies, etc. The redeemable units provide unitholders with the right to require redemption for cash at a value proportionate to the unitholders’ share in the sub-funds’ net assets at each redemption date, and also in the event of the sub-funds’ liquidation. The redeemable units of these sub-funds are classified as financial liabilities and are measured at the present value of the redemption amounts.
(l) Distributionstoholdersofredeemableunits
Distributions to holders of redeemable units classified as financial liabilities are recognised in profit or loss as finance costs when they are authorised and no longer at the discretion of the sub-funds. Distributions to holders of
redeemable units classified as equity are classified as transactions with owners and recorded in the statement of changes in equity.
(m) Segmentreporting
An operating segment is a component of the sub-funds that engages in business activities from which it may earn revenues and incur expenses, including revenues and expenses that relate to transactions with any of the sub-funds’ other components, whose operating results are reviewed regularly by the chief operating decision maker to make decisions about resources allocated to the segment and assess its performance, and for which discrete financial information is available. Segment results that are reported to the chief operating decision maker include items directly attributable to a segment as well as those that can be allocated on a reasonable basis. The chief operating decision maker of the sub-funds is identified as the Manager, HSBC Investment Funds (Hong Kong) Limited.
3 Netgains/(losses)fromfinancialinstrumentsatfairvaluethroughprofitorloss
2017 Yearended
31JulyYearended
31JulyYearended
31JulyYearended
31July
HSBCAsianBond
Fund
HSBCChina
MomentumFund
HSBCChinaGrowth
Fund
HSBCAsianHighYieldBond
FundUSD USD USD USD
Realised gains 151,317,105 5,809,641 47,879,437 63,669,897Unrealised (losses)/gains (100,211,315) 13,914,073 67,494,981 (15,348,863)
51,105,790 19,723,714 115,374,418 48,321,034
2016 Yearended
31JulyYearended
31JulyYearended
31JulyYearended
31July
HSBCAsianBond
Fund
HSBCChina
MomentumFund
HSBCChinaGrowth
Fund
HSBCAsianHighYieldBond
FundUSD USD USD USD
Realised gains/(losses) 97,830,178 (12,093,522) (157,708,099) 47,035,605Unrealised gains 119,487,518 2,079,590 69,056,990 32,696,483
217,317,696 (10,013,932) (88,651,109) 79,732,088

28
Notes to the Financial Statements
4 Taxation
There are currently no taxes on income or gains under Cayman Islands law. Accordingly, no provision for income taxes is included in these financial statements.
No provision for Hong Kong profits tax has been made in the financial statements as the sub-funds are exempt from taxation under section 26A(1A) of the Hong Kong Inland Revenue Ordinance.
Interest income and dividend income received by the sub-funds may be subject to non-recoverable withholding tax imposed in the country of origin. Interest income and dividend income are recorded gross of such taxes and the withholding tax is recognised in profit or loss as taxation expenses as incurred.
Under the current general provisions of the PRC Corporate Income Tax (“CIT”) Law and published tax circulars, the sub-funds are subject to PRC CIT withholding at the rate of 10% in respect of any PRC sourced income earned, including gains realised on the sale of shares of PRC listed companies (subject to temporary exemption under Circular 79 as discussed below), gains realised on the sale of PRC onshore bonds, dividend income derived from PRC listed companies where no PRC CIT has been withheld by the payer and interest income earned in respect of PRC bank deposits and PRC onshore bonds (unless specifically tax exempt). During the years ended 31 July 2017 and 2016, HSBC China Momentum Fund and HSBC China Growth Fund had investment in equity-linked notes and other similar equity-linked securities and instruments issued by institutions that have obtained the qualified foreign institutional investors (“QFII”) status (collectively referred to as “ELN”) linked to China A-shares. This withholding taxation basis should apply as the sub-funds are managed and operated in such a manner that they would not be considered as tax resident enterprises in China or otherwise as having taxable permanent establishment in the PRC. The CIT on dividend income are withheld by the PRC resident enterprises which the sub-funds invested in upon payment of dividend.
On 14 November 2014, the Ministry of Finance, the State Administration of Taxation and the China Securities Regulatory Commission have jointly promulgated the Circular Concerning the Temporary Exemption of the Corporate Income Tax for Gains Earned by QFII and RQFII from Transfer of Domestic Shares and Other Equity Interest Investment in China (“Circular 79”).
According to Circular 79, amongst other things:
(i) corporate income tax shall be exempt on a temporary basis on the gains earned by QFIIs from the transfer of domestic shares and other equity interest investment in China with effect from 17 November 2014; and
(ii) corporate income tax shall be imposed on such gains earned by QFIIs before 17 November 2014 in accordance with the tax laws.
Circular 79 is applicable for QFIIs without any establishment or place in China or the income derived by the QFIIs are not effectively connected with their establishment or place in China.
As a result of the promulgation of Circular 79, the Manager has decided on the following changes to the tax provision practice of the sub-funds:
(i) the sub-funds have ceased to withhold 10% of unrealised gains on their investments in equity-linked notes and other similar equity-linked securities and instruments issued by institutions that have obtained the QFII status (collectively referred to as “ELN”) linked to China A shares as a tax provision from 14 November 2014 (the last Valuation Day before 17 November 2014) on the basis that any gains subsequently realised from 17 November 2014 onwards will be temporarily exempt from corporate income tax; and
(ii) the sub-funds have ceased to withhold (or ceased to request the ELN issuers to withhold) 10% of realised gains on their investments in ELN linked to China A-shares as a tax provision from 17 November 2014.
Any tax provision, if made, will be reflected in the net asset value of the relevant sub-funds at the time of debit or release of such provision and thus will only impact on units which remain in the relevant sub-funds at the time of debit or release of such provision. Units which are redeemed prior to the time of debit of such provision will not be affected by reason of any insufficiency of the tax provision. Likewise, such units and the unitholders who have redeemed will not benefit from any release of excess tax provisions.

29
Notes to the Financial Statements
Investors may be advantaged or disadvantaged depending upon the final tax outcome as and when investors subscribed and/or redeemed the units of the relevant sub-funds. Investors should note that no unitholders who have redeemed their units in the sub-funds before the release of any excess tax provision shall be entitled to claim in whatsoever form any part of the tax provision or withholding amounts released to the sub-funds, which amount will be reflected in the value of units in the sub-funds.
During the year, HSBC China Momentum Fund has settled its PRC enterprise income tax liability with respect to its investment in equity-linked notes and has received refunds of tax provisions previously withheld by the equity-linked notes issuers with respect to certain equity-linked notes in which this sub-fund invested.
In addition, the Manager, upon the consultation with the Trustee, has decided that HSBC China Momentum Fund and HSBC China Growth Fund had over-provisions of tax with respect to certain equity-linked notes in which these sub-funds invested and such tax over-provisions were released and recognised as a gain in the books.
ForeignAccountTaxComplianceAct(“FATCA”)
On 18 March 2010, the Hiring Incentives to Restore Employment Act of 2010 added chapter 4 to Subtitle A (“Chapter 4”) of the US Internal Revenue Code (the “Code”). The provisions in Chapter 4 are commonly referred to as the Foreign Account Tax Compliance Act (“FATCA”). US Treasury regulations providing guidance on the due diligence, reporting, and withholding obligations under FATCA were passed and came into effect in January 2013 (“the Regulations”).
The Regulations require foreign financial institution (“FFI”) to provide the Internal Revenue Service (“IRS”) with information on certain U.S. persons invested in accounts outside of the U.S. and for certain non U.S. entities to provide information about any U.S. owners. The obligations of an FFI under FATCA may be modified by an Intergovernmental Agreement (“IGA”) between the US and the FFI’s country of organization. The Cayman Islands entered into a Model 1 IGA on 29 November 2013, which provides for reporting and enforcement by FFIs to be facilitated by local authorities. The Cayman Islands also entered into a similar IGA with the United Kingdom. Therefore, all Cayman Islands domiciled “financial institutions” are subject to domestic legislation and regulations that implement both the Foreign Account Tax Compliance Act (“US FATCA”) and its UK equivalent (“UK FATCA” and together, “FATCA”). The due diligence and reporting regimes introduced by the domestic legislation and regulations apply to all such financial institutions irrespective of whether they have US or UK based account holders and/or have US or UK assets or source income.
The Trust is a non-reporting financial institution and such is not required to register for a Global Intermediary Identification Number (“GIIN”) for US FATCA purposes.

30
Notes to the Financial Statements
Taxationinprofitorlossrepresents:
2017 Yearended
31JulyYearended
31JulyYearended
31JulyYearended
31July
HSBCAsianBond
Fund
HSBCChina
MomentumFund
HSBCChinaGrowth
Fund
HSBCAsianHighYieldBond
FundUSD USD USD USD
Overseas withholding tax 310,943 – – 313,582PRC withholding tax – 94,804 616,828 –PRC withholding tax refund – (1,774,895) – –Reversal of PRC withholding tax provision – (6,506,741) (41,789) –
310,943 (8,186,832) 575,039 313,582
2016 Yearended
31JulyYearended
31JulyYearended
31JulyYearended
31July
HSBCAsianBond
Fund
HSBCChina
MomentumFund
HSBCChinaGrowth
Fund
HSBCAsianHighYieldBond
FundUSD USD USD USD
Overseas withholding tax 215,961 – – 221,085PRC withholding tax – 125,957 969,857 –
215,961 125,957 969,857 221,085
31
Notes to the Financial Statements
5 Financialassetsandfinancialliabilitiesatfairvaluethroughprofitorloss
2017
HSBCAsianBond
Fund
HSBCChina
MomentumFund
HSBCChinaGrowth
Fund
HSBCAsianHighYieldBond
FundUSD USD USD USD
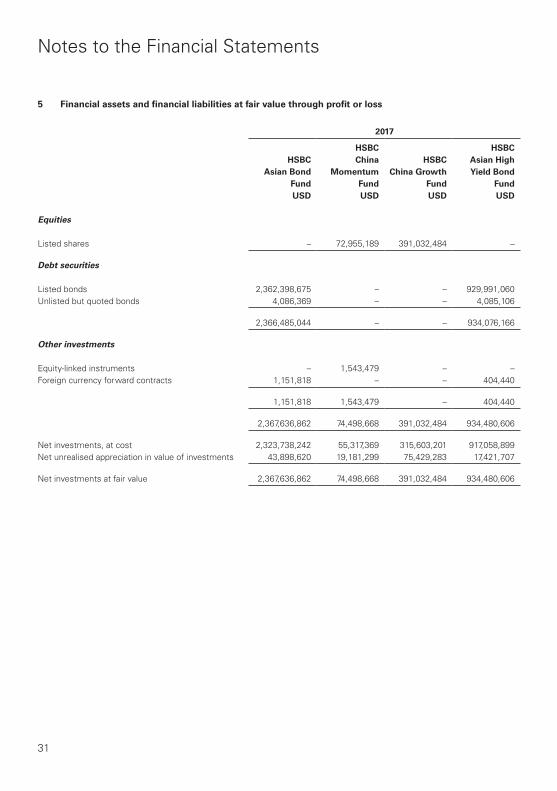
Equities
Listed shares – 72,955,189 391,032,484 –
Debtsecurities
Listed bonds 2,362,398,675 – – 929,991,060Unlisted but quoted bonds 4,086,369 – – 4,085,106
2,366,485,044 – – 934,076,166
Otherinvestments
Equity-linked instruments – 1,543,479 – –Foreign currency forward contracts 1,151,818 – – 404,440
1,151,818 1,543,479 – 404,440
2,367,636,862 74,498,668 391,032,484 934,480,606
Net investments, at cost 2,323,738,242 55,317,369 315,603,201 917,058,899Net unrealised appreciation in value of investments 43,898,620 19,181,299 75,429,283 17,421,707
Net investments at fair value 2,367,636,862 74,498,668 391,032,484 934,480,606

32
Notes to the Financial Statements
2016
HSBCAsianBond
Fund
HSBCChina
MomentumFund
HSBCChinaGrowth
Fund
HSBCAsianHighYieldBond
FundUSD USD USD USD
Financialassetsatfairvaluethroughprofitorloss
Equities
Listed shares – 57,188,648 412,667,198 –
Debtsecurities
Listed bonds 3,317,436,370 – 2,416,849 736,060,789Unlisted but quoted bonds 33,728,614 – – 10,380,031
3,351,164,984 – 2,416,849 746,440,820
Otherinvestments
Equity-linked instruments – 2,819,144 4,703,759 –Foreign currency forward contracts 238,156 – – 65,388
238,156 2,819,144 4,703,759 65,388
3,351,403,140 60,007,792 419,787,806 746,506,208
Financialliabilitiesatfairvaluethroughprofitorloss
Foreign currency forward contracts – – – (70,979)
3,351,403,140 60,007,792 419,787,806 746,435,229
Net investments, at cost 3,216,555,480 54,740,566 411,393,386 711,488,540Net unrealised appreciation in value of investments 134,847,660 5,267,226 8,394,420 34,946,689
Net investments at fair value 3,351,403,140 60,007,792 419,787,806 746,435,229

33
Notes to the Financial Statements
6 Amountsduefrom/(to)brokers
2017
HSBCAsianBond
Fund
HSBCChina
MomentumFund
HSBCChinaGrowth
Fund
HSBCAsianHighYieldBond
FundUSD USD USD USD
Balanceduefrombrokers
Amounts receivable on sales of investments 9,101,471 506,326 7,223,287 1,100,016Margin deposits 1,203,905 – – –
10,305,376 506,326 7,223,287 1,100,016
Balanceduetobrokers
Amounts payable on purchases of investments 14,510,576 751,822 5,463,868 10,986,652
2016
HSBCAsianBond
Fund
HSBCChina
MomentumFund
HSBCChinaGrowth
Fund
HSBCAsianHighYieldBond
FundUSD USD USD USD
Balanceduefrombrokers
Amounts receivable on sales of investments 13,045,490 218,355 6,827,370 6,791,275Margin deposits 1,201,438 – – –
14,246,928 218,355 6,827,370 6,791,275
Balanceduetobrokers
Amounts payable on purchases of investments 9,596,073 205,794 7,949,351 9,146,222
Margin deposits represent cash deposits with brokers transferred as collateral against open forward contracts.

34
Notes to the Financial Statements
7 Relatedpartytransactions
The following is a summary of significant related party transactions or transactions entered into during the year between the Trust and the Trustee, the Manager and their Connected Persons. Connected Persons are those as defined in the Code issued by the SFC. All transactions during the year between the Trust and the Manager and its Connected Persons were entered into in the ordinary course of business and under normal commercial terms. To the best of the
knowledge of the Trustee and the Manager, the Trust did not have any other transactions with Connected Persons except for those disclosed below.
(a) The Manager of the sub-funds is HSBC Investment Funds (Hong Kong) Limited, which receives a management fee, payable monthly in arrears, equivalent to a percentage per annum of the net asset value of the sub-funds as follows:
HSBCAsianBond
Fund
HSBCChina
MomentumFund
HSBCChinaGrowth
Fund
HSBCAsianHighYieldBond
Fund
For “AC – HKD” class units N/A N/A 1.5% 1.25%For “AC – SGD” class units N/A N/A N/A 1.25%For “AC – USD” class units 1% 1.75% 1.5% 1.25%For “AM – HKD” class units 1% N/A N/A 1.25%For “AM – USD” class units 1% N/A N/A 1.25%For “AMH – AUD” class units 1% N/A N/A 1.25%For “AMH – EUR” class units 1% N/A N/A 1.25%For “IC – USD” class units 0.55% N/A N/A 0.85%For “ID – USD” class units 0.55% N/A N/A N/AFor “ZD – USD” class units Nil N/A N/A N/A
2017
HSBCAsianBond
Fund
HSBCChina
MomentumFund
HSBCChinaGrowth
Fund
HSBCAsianHighYieldBond
FundUSD USD USD USD
(i) Management fees for the year 27,387,848 1,168,509 5,938,641 11,245,515(ii) Registrar’s fees and administrative fees for the
year 126,385 5,657 19,913 48,947(iii) Management fees payable at year end 1,950,598 107,277 490,594 1,005,901(iv) Registrar’s fees and administrative fees payable at
year end 7,948 2,616 2,645 7,903

35
Notes to the Financial Statements
2016
HSBCAsianBond
Fund
HSBCChina
MomentumFund
HSBCChinaGrowth
Fund
HSBCAsianHighYieldBond
FundUSD USD USD USD
(i) Management fees for the year 21,511,716 1,155,339 8,018,781 8,237,282(ii) Registrar’s fees and administrative fees for the
year 158,267 10,662 46,148 111,561(iii) Management fees payable at year end 2,512,031 84,092 516,173 811,917(iv) Registrar’s fees and administrative fees payable at
year end 7,893 2,631 2,631 15,095
(b) Bank accounts are maintained with members of the HSBC Group. Margin accounts are maintained with HSBC Bank Plc Futures Wholesale Trading Operations and Global Markets Operations, which are fellow
subsidiaries of the Manager within the HSBC Group. The balances of these accounts and the interest income and interest expenses arising from these accounts are set out below:
2017
HSBCAsianBond
Fund
HSBCChina
MomentumFund
HSBCChinaGrowth
Fund
HSBCAsianHighYieldBond
FundUSD USD USD USD
(i) Cash held at the year end 25,592,472 1,618,193 1,788,023 20,258,727(ii) Interest income earned for the year 42,409 5,676 746 44,450(iii) Margin deposits held with a fellow subsidiary at
the year end 1,203,905 – – –
2016
HSBCAsianBond
Fund
HSBCChina
MomentumFund
HSBCChinaGrowth
Fund
HSBCAsianHighYieldBond
FundUSD USD USD USD
(i) Cash held at the year end 8,800,471 8,017,667 13,569,482 28,392,075(ii) Interest income earned for the year 46,488 – – 16,376(iii) Margin deposits held with a fellow subsidiary at
the year end 1,201,438 – – –

36
Notes to the Financial Statements
(c) The trustee of the sub-funds is HSBC Trustee (Cayman) Limited (“the Trustee”), a fellow subsidiary of the Manager within the HSBC Group, which receives a monthly fee equivalent to a percentage per annum of
the net asset value of the sub-funds. The fee rate was changed with the effective date of 1 July 2017. During the year, the Trustee rebated trustee’s fee to the sub-funds (2016: nil). The new fee schedule is as follows:
Effectiveon1July2017
HSBCAsianBondFund
HSBCChinaMomentum
FundHSBC
ChinaGrowthFund
HSBCAsianHighYield
BondFund
For “AC – HKD” class units N/A N/A 7 bps on NAV per annum
7 bps on NAV per annum
For “AC – SGD” class units N/A N/A N/A 7 bps on NAV per annum
For “AC – USD” class units 7 bps on NAV per annum
7 bps on NAV per annum
7 bps on NAV per annum
7 bps on NAV per annum
For “AM – HKD” class units 7 bps on NAV per annum
N/A N/A 7 bps on NAV per annum
For “AM – USD” class units 7 bps on NAV per annum
N/A N/A 7 bps on NAV per annum
For “AMH – AUD” class units 7 bps on NAV per annum
N/A N/A 7 bps on NAV per annum
For “AMH – EUR” class units 7 bps on NAV per annum
N/A N/A 7 bps on NAV per annum
For “IC – USD” class units 7 bps on NAV per annum
N/A N/A 7 bps on NAV per annum
For “ID – USD” class units 7 bps on NAV per annum
N/A N/A N/A
For “ZD – USD” class units 7 bps on NAV per annum
N/A N/A 7 bps on NAV per annum

37
Notes to the Financial Statements
Priorto1July2017
HSBCAsianBondFund
HSBCChinaMomentum
FundHSBC
ChinaGrowthFund
HSBCAsianHighYield
BondFund
For “AC – HKD” class units N/A N/A 0.125% on the first US$50 million of NAV,
0.1% on any excess
0.135% on the first US$50 million of NAV, 0.11% on any excess
For “AC – SGD” class units N/A N/A N/A 0.135% on the first US$50 million of NAV, 0.11% on any excess
For “AC – USD” class units 0.125% on the first US$50 million of NAV,
0.1% on any excess
0.1% on NAV per annum
0.125% on the first US$50 million of NAV,
0.1% on any excess
0.135% on the first US$50 million of NAV, 0.11% on any excess
For “AM – HKD” class units 0.125% on the first US$50 million of NAV,
0.1% on any excess
N/A N/A 0.135% on the first US$50 million of NAV, 0.11% on any excess
For “AM – USD” class units 0.125% on the first US$50 million of NAV,
0.1% on any excess
N/A N/A 0.135% on the first US$50 million of NAV, 0.11% on any excess
For “AMH – AUD” class units 0.125% on the first US$50 million of NAV,
0.1% on any excess
N/A N/A 0.135% on the first US$50 million of NAV, 0.11% on any excess
For “AMH – EUR” class units 0.125% on the first US$50 million of NAV,
0.1% on any excess
N/A N/A 0.135% on the first US$50 million of NAV, 0.11% on any excess
For “IC – USD” class units 0.125% on the first US$50 million of NAV,
0.1% on any excess
N/A N/A 0.135% on the first US$50 million of NAV, 0.11% on any excess
For “ID – USD” class units 0.125% on the first US$50 million of NAV,
0.1% on any excess
N/A N/A N/A
For “ZD – USD” class units 0.125% on the first US$50 million of NAV,
0.1% on any excess
N/A N/A N/A

38
Notes to the Financial Statements
In addition, the Trustee provides valuation services to unitholders in return for a daily fee of US$100 (2016: US$50) for HSBC Asian Bond Fund, US$100 (2016: US$30) for HSBC China Momentum Fund, US$100 (2016: US$150) for HSBC
China Growth Fund, and US$100 (2016: US$500) for HSBC Asian High Yield Bond Fund. No rebate was made with regards to valuation fees paid to the Trustee.
2017
HSBCAsianBond
Fund
HSBCChina
MomentumFund
HSBCChinaGrowth
Fund
HSBCAsianHighYieldBond
FundUSD USD USD USD
Trustee’s fees for the year 3,024,077 84,001 425,346 1,204,275Trustee’s fees payable at year end 159,973 6,369 27,094 75,984Rebate of trustee’s fee (1,855,437) (50,412) (371,983) (610,730)
2016
HSBCAsianBond
Fund
HSBCChina
MomentumFund
HSBCChinaGrowth
Fund
HSBCAsianHighYieldBond
FundUSD USD USD USD
Trustee’s fees for the year 2,516,786 84,980 573,011 946,653Trustee’s fees payable at year end 280,083 6,405 37,605 88,110
During the year, the Trustee provided financial reporting service to the sub-funds and charged each sub-fund financial reporting fee of US$3,000 (2016: nil).

39
Notes to the Financial Statements
2017
HSBCAsianBond
Fund
HSBCChina
MomentumFund
HSBCChinaGrowth
Fund
HSBCAsianHighYieldBond
FundUSD USD USD USD
Safe custody fees for the year 443,461 16,882 88,715 156,633Safe custody fees payable at year end 23,873 1,087 5,911 20,109Rebate of safe custody fees (706,588) (21,346) (65,836) (257,620)Safe custody transaction fees for the year 19,504 60,233 59,117 22,159Safe custody transaction fees payable at year end 1,503 4,336 2,451 555Rebate of safe custody transaction fees (30,966) (51,986) – (33,820)
2016
HSBCAsianBond
Fund
HSBCChina
MomentumFund
HSBCChinaGrowth
Fund
HSBCAsianHighYieldBond
FundUSD USD USD USD
Safe custody fees for the year 371,035 18,299 127,630 118,603Safe custody fees payable at year end 44,371 1,364 8,514 10,610Safe custody transaction fees for the year 25,411 68,222 91,216 24,570Safe custody transaction fees payable at year end 1,923 1,576 3,206 1,837
(d) The safe custodian of the sub-funds is HSBC Trustee (Cayman) Ltd, a fellow subsidiary of the Manager within the HSBC Group, which receives a monthly fee equivalent to 1 – 55 basis points (2016: 1 – 30 basis point) based on sub-custodian value of the securities.
The safe custodian also receives a transaction fee of 10 – 124 (2016: US$10 – 205) for each trade handled. During the year, the Trustee rebated safe custody fees and safe custody transaction fees charged to the sub-funds (2016: nil).

40
Notes to the Financial Statements
(e) In their purchases and sales of investments, the sub-funds utilise the brokerage services of The Hongkong and Shanghai Banking Corporation Limited, which is member of the HSBC Group. Details of transactions effected through these companies are as follows:
HSBCAsianBondFund
TheHongkongandShanghaiBanking
CorporationLimited HSBCChina2017 2016 2017 2016USD USD USD USD
Commission paid for the year – – – –
Average rate of commission – – – –
Total aggregate value of such transactions for the year 433,686,236 297,889,602 1,486,156 –
Percentage of such transactions in value to total transactions for the year 15.38% 8.90% 0.05% –
HSBCChinaMomentumFund
TheHongkongandShanghaiBanking
CorporationLimited2017 2016USD USD
Commission paid for the year 16,032 11,028
Average rate of commission 0.09% 0.14%
Total aggregate value of such transactions for the year 17,851,834 7,940,162
Percentage of such transactions in value to total transactions for the year 15.01% 4.84%
HSBCChinaGrowthFund
TheHongkongandShanghaiBanking
CorporationLimited2017 2016USD USD
Commission paid for the year 77,822 85,776
Average rate of commission 0.09% 0.14%
Total aggregate value of such transactions for the year 89,942,361 63,158,593
Percentage of such transactions in value to total transactions for the year 11.07% 4.09%
HSBCAsianHighYieldBondFund
TheHongkongandShanghaiBanking
CorporationLimited HSBCChina2017 2016 2017 2016USD USD USD USD
Commission paid for the year – – – –
Average rate of commission – – – –
Total aggregate value of such transactions for the year 296,698,788 201,987,114 1,486,156 –
Percentage of such transactions in value to total transactions for the year 11.77% 9.17% 0.06% –

41
Notes to the Financial Statements
8 Softcommissionarrangements
No soft commission arrangements were entered into with brokers by HSBC Asian Bond Fund and HSBC Asian High Yield Bond Fund during the year.
For HSBC China Momentum Fund and HSBC China Growth Fund, the Manager had entered into soft commission arrangements with brokers under which certain goods and services used to support investment decision making are
received by the Manager. The Manager did not make direct payment for these services but transacted an agreed amount of business with the brokers on behalf of the sub-funds. Commission was paid from the sub-funds on these transactions.
During the year ended 31 July 2017 and 31 July 2016, the goods and services utilised for the sub-funds were limited to research services only.
9 Unitsissuedandredeemed
2017
HSBCAsianBond
Fund
HSBCChina
MomentumFund
HSBCChinaGrowth
Fund
HSBCAsianHighYieldBond
Fund
(a) “AC–HKD”classunits
Number of units in issue brought forward – – 83,447,976 298,029Units issued during the year – – 21,043,632 1,055,149Units redeemed during the year – – (53,138,293) (1,155,783)
Number of units in issue carried forward – – 51,353,315 197,395
(b) “AC–SGD”classunits
Number of units in issue brought forward – – – 9,683
Number of units in issue carried forward – – – 9,683
(c) “AC–USD”classunits
Number of units in issue brought forward 461,597 1,414,559 33,481,179 559,038Units issued during the year 229,535 – 6,537,903 234,305Units redeemed during the year (59,323) (261,326) (16,668,143) (49,721)
Number of units in issue carried forward 631,809 1,153,233 23,350,939 743,622
(d) “AM–HKD”classunits
Number of units in issue brought forward 660,419,239 – – 198,884,891Units issued during the year 371,126,945 – – 124,682,860Units redeemed during the year (598,262,698) – – (119,146,405)
Number of units in issue carried forward 433,283,486 – – 204,421,346

42
Notes to the Financial Statements
2017
HSBCAsianBond
Fund
HSBCChina
MomentumFund
HSBCChinaGrowth
Fund
HSBCAsianHighYieldBond
Fund
(e) “AM–USD”classunits
Number of units in issue brought forward 219,698,875 – – 46,872,152Units issued during the year 97,557,200 – – 43,232,265Units redeemed during the year (160,062,720) – – (28,610,782)
Number of units in issue carried forward 157,193,355 – – 61,493,635
(f) “AMH–AUD”classunits
Number of units in issue brought forward 17,819,764 – – 2,951,951Units issued during the year 13,748,227 – – 5,355,252Units redeemed during the year (16,990,206) – – (4,368,627)
Number of units in issue carried forward 14,577,785 – – 3,938,576
(g) “AMH–EUR”classunits
Number of units in issue brought forward 2,466,706 – – 851,269Units issued during the year 886,867 – – 944,678Units redeemed during the year (1,431,641) – – (461,555)
Number of units in issue carried forward 1,921,932 – – 1,334,392
(h) “IC–USD”classunits
Number of units in issue brought forward 6,014,232 – – –Units issued during the year 9,037,180 – – 3,941,644Units redeemed during the year (1,465,535) – – (2,600,000)
Number of units in issue carried forward 13,585,877 – – 1,341,644
(i) “ID–USD”classunits
Number of units in issue brought forward 3,730,144 – – –Units issued during the year 250,750 – – –Units redeemed during the year (1,073,670) – – –
Number of units in issue carried forward 2,907,224 – – –

43
Notes to the Financial Statements
2017
HSBCAsianBond
Fund
HSBCChina
MomentumFund
HSBCChinaGrowth
Fund
HSBCAsianHighYieldBond
Fund
(j) “ZD–USD”classunits
Number of units in issue brought forward 11,697,349 – – –Units issued during the year 1,880,215 – – 45,656Units redeemed during the year (12,146,239) – – (15,450)
Number of units in issue carried forward 1,431,325 – – 30,206
(k) According to the Trust Deed of the Trust, some of the classes are denominated in AUD, EUR, HKD and SGD for dealing, which are different from the reporting currencies of respective sub-funds. The net asset value
per unit for each class of the sub-funds in their respective denomination currencies as at year end is as follows:
2017 Asat31July Asat31July Asat31July Asat31July
Denominationcurrency
HSBCAsianBond
Fund
HSBCChina
MomentumFund
HSBCChinaGrowth
Fund
HSBCAsianHighYieldBond
Fund
Netassetvalueperunit
– “AC – HKD” class HKD – – 13.198 14.496– “AC – SGD” class SGD – – – 16.203– “AC – USD” class USD 13.028 65.805 13.015 14.526– “AM – HKD” class HKD 10.300 – – 10.193– “AM – USD” class USD 9.263 – – 10.204– “AMH – AUD” class AUD 9.793 – – 10.524– “AMH – EUR” class EUR 9.724 – – 10.702– “IC – USD” class USD 13.255 – – 10.425– “ID – USD” class USD 10.162 – – –– “ZD – USD” class USD 10.513 – – 10.388

44
Notes to the Financial Statements
2016
HSBCAsianBond
Fund
HSBCChina
MomentumFund
HSBCChinaGrowth
Fund
HSBCAsianHighYieldBond
Fund
(l) “AC–HKD”classunits
Number of units in issue brought forward – – 148,371,930 328,436Units issued during the year – – 33,614,116 74,583Units redeemed during the year – – (98,538,070) (104,990)
Number of units in issue carried forward – – 83,447,976 298,029
(m) “AC–SGD”classunits
Number of units in issue brought forward – – – 9,683
Number of units in issue carried forward – – – 9,683
(n) “AC–USD”classunits
Number of units in issue brought forward 411,529 1,701,739 51,252,191 532,421Units issued during the year 141,050 – 7,846,534 216,173Units redeemed during the year (90,982) (287,180) (25,617,546) (189,556)
Number of units in issue carried forward 461,597 1,414,559 33,481,179 559,038
(o) “AM–HKD”classunits
Number of units in issue brought forward 221,673,639 – – 179,715,795Units issued during the year 833,096,330 – – 98,951,151Units redeemed during the year (394,350,730) – – (79,782,055)
Number of units in issue carried forward 660,419,239 – – 198,884,891
(p) “AM–USD”classunits
Number of units in issue brought forward 103,303,981 – – 37,216,952Units issued during the year 226,551,250 – – 26,326,460Units redeemed during the year (110,156,356) – – (16,671,260)
Number of units in issue carried forward 219,698,875 – – 46,872,152

45
Notes to the Financial Statements
2016
HSBCAsianBond
Fund
HSBCChina
MomentumFund
HSBCChinaGrowth
Fund
HSBCAsianHighYieldBond
Fund
(q) “AMH–AUD”classunits
Number of units in issue brought forward 3,210,899 – – 4,284,133Units issued during the year 25,079,018 – – 4,316,452Units redeemed during the year (10,470,153) – – (5,648,634)
Number of units in issue carried forward 17,819,764 – – 2,951,951
(r) “AMH–EUR”classunits
Number of units in issue brought forward 1,170,629 – – 947,990Units issued during the year 2,297,862 – – 735,125Units redeemed during the year (1,001,785) – – (831,846)
Number of units in issue carried forward 2,466,706 – – 851,269
(s) “IC–USD”classunits
Number of units in issue brought forward 4,866,095 – – –Units issued during the year 7,317,776 – – 3,465,325Units redeemed during the year (6,169,639) – – (3,465,325)
Number of units in issue carried forward 6,014,232 – – –
(t) “ID–USD”classunits
Number of units in issue brought forward 329,796 – – –Units issued during the year 5,396,815 – – –Units redeemed during the year (1,996,467) – – –
Number of units in issue carried forward 3,730,144 – – –
(u) “ZD–USD”classunits
Number of units in issue brought forward 14,770,634 – – –Units issued during the year 736,472 – – –Units redeemed during the year (3,809,757) – – –
Number of units in issue carried forward 11,697,349 – – –

46
Notes to the Financial Statements
(v) During the year ended 31 July 2016, a new class, “IC – USD” class, was issued by HSBC Asian High Yield Bond Fund. According to the Trust Deed of the Trust, some of the classes are denominated in AUD, EUR, HKD and SGD for dealing, which are different
2016 Asat31July Asat31July Asat31July Asat31July
Denominationcurrency
HSBCAsianBond
Fund
HSBCChina
MomentumFund
HSBCChinaGrowth
Fund
HSBCAsianHighYieldBond
Fund
Netassetvalueperunit
– “AC – HKD” class HKD – – 9.828 13.974– “AC – SGD” class SGD – – – 14.805– “AC – USD” class USD 12.874 43.550 9.690 14.267– “AM – HKD” class HKD 10.472 – – 10.341– “AM – USD” class USD 9.484 – – 10.243– “AMH – AUD” class AUD 9.999 – – 10.011– “AMH – EUR” class EUR 10.001 – – 9.893– “IC – USD” class USD 13.038 – – –– “ID – USD” class USD 10.517 – – –– “ZD – USD” class USD 10.727 – – –
from the reporting currencies of respective sub-funds. The net asset value per unit for each class of the sub-funds in their respective denomination currencies as at year end is as follows:
Units may be acquired and redeemed on any valuation date at the unit value determined on that day. The valuation date is every business day in Hong Kong except Saturday. The minimum investment and redemption amount for the sub-funds are as below:
(w) The capital of the sub-funds is represented by the net assets attributable to unitholders which are subject to subscriptions and redemptions of units. The Trust and the sub-funds do not have any externally imposed capital requirements.
HSBCAsianBond
Fund
HSBCChina
MomentumFund
HSBCChinaGrowth
Fund
HSBCAsianHighYieldBond
Fund
A Classes unit US$ 1,000 US$ 3,000 US$ 1,000 US$ 1,000I Classes unit US$ 1,000,000 – – –Z Classes unit – – – –
The Class features and naming convention of the sub-funds are as below:
Accumulation units: These units normally do not declare any dividends and instead retain all net income, capital and capital gains within the price of the units. These classes are suffixed by a “C”.
Distribution units: These units may be offered with the following dividend declaration/payment frequencies. The classes with annual distribution declaration are suffixed by a
“D”. The classes with monthly distribution declaration are suffixed by a “M”.
Currency Hedged units: Hedging will be performed in order to hedge (i) the base currency of the Sub-Fund; or (ii) the currency of the assets in which the Sub-Fund primarily invests back to the currency of denomination of the currency hedged classes. Hedged classes are suffixed by an “H” followed by the currency of denomination which is in addition to the suffix indicating whether a class is an accumulation unit or whether it is distribution unit.

47
Notes to the Financial Statements
10 Incomeequalisation
Income portion of received and receivable on issue of units or paid and payable on redemption of units is calculated based on the portion of the unit price related to undistributed accumulated net investment income and accumulated expenses of the unit at the date of issue or redemption.
11 Distributions
HSBCAsianBondFund
2017 2016USD USD
“AM–HKD”classunit
(a) Distributionsattributabletotheyear
Distributions declared and paid during the year– HK$0.0271 per unit on 642,838,572 units (August
2015: HK$0.0322 per unit on 233,119,470 units) 2,245,688 968,536
– HK$0.0264 per unit on 633,225,056 units (September 2015: HK$0.0319 per unit on 259,302,873 units) 2,155,326 1,067,310
– HK$0.0266 per unit on 630,114,113 units (October 2015: HK$0.0309 per unit on 296,297,763 units) 2,161,348 1,181,353
– HK$0.0292 per unit on 608,570,027 units (November 2015: HK$0.0307 per unit on 320,941,171 units) 2,291,250 1,271,276
– HK$0.0315 per unit on 569,949,015 units (December 2015: HK$0.0322 per unit on 322,375,517 units) 2,315,044 1,339,245
– HK$0.0298 per unit on 521,727,028 units (January 2016: HK$0.0328 per unit on 372,486,423 units) 2,004,030 1,568,062
– HK$0.0315 per unit on 512,151,774 units (February 2016: HK$0.0315 per unit on 455,135,950 units) 2,078,431 1,843,675
– HK$0.0300 per unit on 475,405,990 units (March 2016: HK$0.0294 per unit on 534,423,266 units) 1,835,155 2,026,210
– HK$0.0304 per unit on 459,101,716 units (April 2016: HK$0.0270 per unit on 591,468,725 units) 1,793,585 2,058,529
– HK$0.0298 per unit on 438,902,599 units (May 2016: HK$0.0272 per unit on 636,303,455 units) 1,678,501 2,227,816
– HK$0.0299 per unit on 419,059,180 units (June 2016: HK$0.0274 per unit on 643,969,726 units) 1,605,220 2,274,192
Distributions declared during the year– HK$0.0304 per unit on 432,648,945 units (July 2016:
HK$0.0259 per unit on 659,667,218 units) 1,684,203 2,202,774
23,847,781 20,028,978
2017 2016USD USD
(b) Distributionsattributabletothepreviousfinancialyear,approvedandpaidduringtheyear
Distributions declared during the previous financial year and paid during the year of HK$0.0259 per unit on 659,667,218 units (July 2015: HK$0.0322 per unit on 221,551,424 units) 2,202,774 920,225
“AM–USD”classunit
(a) Distributionsattributabletotheyear
Distributions declared and paid during the year– US$0.0245 per unit on 216,795,241 units (August
2015: US$0.0292 per unit on 106,397,807 units) 5,311,483 3,106,816– US$0.0239 per unit on 212,833,193 units
(September 2015: US$0.0289 per unit on 112,199,945 units) 5,086,713 3,242,578
– US$0.0241 per unit on 213,884,614 units (October 2015: US$0.0280 per unit on 122,152,288 units) 5,154,619 3,420,264
– US$0.0265 per unit on 209,066,371 units (November 2015: US$0.0278 per unit on 130,784,063 units) 5,540,259 3,635,797
– US$0.0285 per unit on 197,161,193 units (December 2015: US$0.0292 per unit on 128,604,753 units) 5,619,094 3,755,259
– US$0.0270 per unit on 188,661,566 units (January 2016: US$0.0296 per unit on 144,077,730 units) 5,093,862 4,264,701
– US$0.0285 per unit on 182,970,387 units (February 2016: US$0.0285 per unit on 167,882,430 units) 5,214,656 4,784,649
– US$0.0272 per unit on 173,064,529 units (March 2016: US$0.0267 per unit on 185,519,400 units) 4,707,355 4,953,368
– US$0.0274 per unit on 170,069,261 units (April 2016: US$0.0244 per unit on 204,083,852 units) 4,659,898 4,979,646
– US$0.0268 per unit on 168,743,388 units (May 2016: US$0.0246 per unit on 213,095,046 units) 4,522,323 5,242,138
– US$0.0269 per unit on 164,093,422 units (June 2016: US$0.0248 per unit on 212,429,783 units) 4,414,113 5,268,259
Distributions declared during the year– US$0.0273 per unit on 157,190,622 units (July 2016:
US$0.0234 per unit on 219,315,676 units) 4,291,304 5,131,987
59,615,679 51,785,462

48
Notes to the Financial Statements
2017 2016USD USD
(b) Distributionsattributabletothepreviousfinancialyear,approvedandpaidduringtheyear
Distributions declared during the previous financial year and paid during the year of US$0.0234 per unit on 219,315,676 units (July 2015: US$0.0291 per unit on 103,249,407 units) 5,131,987 3,004,558
“AMH–AUD”classunit
(a) Distributionsattributabletotheyear
Distributions declared and paid during the year– AUD0.0344 per unit on 18,556,187 units (August
2015: AUD0.0446 per unit on 3,425,926 units) 479,771 109,066– AUD0.0316 per unit on 17,748,240 units (September
2015: AUD0.0438 per unit on 3,634,122 units) 427,363 111,629– AUD0.0317 per unit on 17,418,527 units (October
2015: AUD0.0431 per unit on 5,157,269 units) 419,150 157,928– AUD 0.0337 per unit on 18,142,824 units (November
2015: AUD0.0427 per unit on 5,314,095 units) 457,704 162,832– AUD0.0354 per unit on 17,497,110 units (December
2015: AUD0.0438 per unit on 5,337,850 units) 448,630 170,415– AUD0.0334 per unit on 17,014,405 units (January
2016: AUD0.0427 per unit on 6,952,527 units) 427,973 210,423– AUD0.0346 per unit on 14,974,323 units (February
2016: AUD0.0414 per unit on 8,547,539 units) 397,495 252,131– AUD0.0333 per unit on 14,679,962 units (March
2016: AUD0.0396 per unit on 9,210,562 units) 373,818 279,426– AUD0.0327 per unit on 14,885,498 units (April 2016:
AUD0.0373 per unit on 10,542,054 units) 363,704 300,262– AUD0.0321 per unit on 15,608,431 units (May 2016:
AUD0.0376 per unit on 14,883,371 units) 374,295 402,587– AUD0.0319 per unit on 15,685,856 units (June 2016:
AUD0.0355 per unit on 17,391,005 units) 385,367 460,257
Distributions declared during the year– AUD0.0314 per unit on 14,638,180 units (July 2016:
AUD0.0346 per unit on 17,870,950 units) 366,010 465,112
4,921,280 3,082,068
2017 2016USD USD
(b) Distributionsattributabletothepreviousfinancialyear,approvedandpaidduringtheyear
Distributions attributable to the previous financial year, approved and paid during the year of AUD0.0346 per unit on 17,870,950 units (July 2015: AUD0.0448 per unit on 3,209,590 units) 465,112 104,895
“AMH–EUR”classunit
(a) Distributionsattributabletotheyear
Distributions declared and paid during the year– EUR0.0183 per unit on 2,287,068 units (August
2015: EUR0.0290 per unit on 1,212,726 units) 46,629 39,474– EUR0.0170 per unit on 2,376,086 units (September
2015: EUR0.0283 per unit on 1,165,324 units) 45,265 37,091– EUR0.0165 per unit on 2,050,442 units (October
2015: EUR0.0274 per unit on 1,413,753 units) 37,117 42,545– EUR0.0192 per unit on 1,958,084 units (November
2015: EUR0.0277 per unit on 1,475,519 units) 40,031 43,230– EUR0.0208 per unit on 1,875,557 units (December
2015: EUR0.0295 per unit on 1,566,181 units) 41,165 50,522– EUR0.0187 per unit on 1,955,489 units (January
2016: EUR0.0266 per unit on 1,684,000 units) 39,065 48,960– EUR0.0201 per unit on 1,942,302 units (February
2016: EUR0.0260 per unit on 1,815,973 units) 41,301 51,578– EUR0.0184 per unit on 1,788,554 units (March 2016:
EUR0.0221 per unit on 1,778,860 units) 35,154 44,541– EUR0.0179 per unit on 1,725,426 units (April 2016:
EUR0.0197 per unit on 1,918,233 units) 33,544 42,940– EUR0.0171 per unit on 1,676,106 units (May 2016:
EUR0.0197 per unit on 2,239,097 units) 32,019 49,174– EUR0.0168 per unit on 1,904,098 units (June 2016:
EUR0.0198 per unit on 2,279,104 units) 36,558 50,136
Distributions declared during the year– EUR0.0163 per unit on 1,921,932 units (July 2016:
EUR0.0176 per unit on 2,466,706 units) 36,788 48,111
464,636 548,302

49
Notes to the Financial Statements
2017 2016USD USD
(b) Distributionsattributabletothepreviousfinancialyear,approvedandpaidduringtheyear
Distributions attributable to the previous financial year, approved and paid during the year of EUR 0.0176 per unit on 2,466,706 units (July 2015: EUR0.0287 per unit on 1,169,591 units) 48,111 36,716
“ID–USD”classunit
(a) Distributionsattributabletotheyear
Distributions declared during the year– US$0.4202 per unit on 2,907,223 units (July 2016:
US$0.3230 per unit on 3,730,144 units) 1,221,667 1,204,837
1,221,667 1,204,837
(b) Distributionsattributabletothepreviousfinancialyear,approvedandpaidduringtheyear
Distributions attributable to the previous financial year, approved and paid during the year of US$0.3230 per unit on 3,730,144 units (July 2015: US$0.4025 per unit on 330,647 units) 1,204,837 133,085
“ZD–USD”classunit
(a) Distributionsattributabletotheyear
Distributions declared during the year– US$0.4554 per unit on 1,431,325 units (July 2016:
US$0.3327 per unit on 11,697,349 units) 651,833 3,891,708
(b) Distributionsattributabletothepreviousfinancialyear,approvedandpaidduringtheyear
Distributions declared during the previous financial year and paid during the year of US$0.3327 per unit on 11,697,349 units (July 2015: US$0.4125 per unit on 14,770,634 units) 3,891,708 6,092,886
HSBCAsianHighYieldBondFund
2017 2016USD USD
“AM–HKD”classunit
(a) Distributionsattributabletotheyear
Distributions declared and paid during the year– HK$0.0376 per unit on 206,660,570 units (August
2015: HK$0.0486 per unit on 176,216,127 units) 1,001,771 1,104,946
– HK$0.0391 per unit on 221,151,652 units (September 2015: HK$0.0497 per unit on 174,206,065 units) 1,115,141 1,117,152
– HK$0.0396 per unit on 224,417,914 units (October 2015: HK$0.0493 per unit on 173,102,333 units) 1,145,934 1,101,140
– HK$0.0433 per unit on 209,091,850 units (November 2015: HK$0.0488 per unit on 173,036,248 units) 1,167,358 1,089,542
– HK$0.0423 per unit on 203,844,874 units (December 2015: HK$0.0502 per unit on 169,694,113 units) 1,111,837 1,099,137
– HK$0.0383 per unit on 201,603,394 units (January 2016: HK$0.0526 per unit on 168,158,632 units) 995,239 1,135,623
– HK$0.0425 per unit on 195,713,310 units (Febraury 2016: HK$0.0524 per unit on 166,819,834 units) 1,071,649 1,124,189
– HK$0.0386 per unit on 203,918,938 units (March 2016: HK$0.0489 per unit on 172,587,890 units) 1,013,138 1,088,370
– HK$0.0390 per unit on 203,828,315 units (April 2016: HK$0.0433 per unit on 184,685,113 units) 1,021,696 1,030,803
– HK$0.0379 per unit on 201,206,435 units (May 2016: HK$0.0446 per unit on 190,146,885 units) 979,295 1,091,687
– HK$0.0381 per unit on 201,310,619 units (June 2016: HK$0.0467 per unit on 193,558,601 units) 982,607 1,165,039
Distributions declared during the year– Distributions declared and paid during the year of
HK$0.0426 per unit on 196,494,361 units (July 2016: HK$0.0398 per unit on 197,502,911 units) 1,071,877 1,013,501
12,677,542 13,161,129
(b)Distributionsattributabletothepreviousfinancialyear,approvedandpaidduringtheyear
HK$0.0398 per unit on 197,502,911 units (July 2015: HK$0.0499 per unit on 179,964,477 units) 1,013,501 1,158,410

50
Notes to the Financial Statements
2017 2016USD USD
“AM–USD”classunit
(a) Distributionsattributabletotheyear
Distributions declared and paid during the year– US$0.0377 per unit on 51,290,016 units (August
2015: US$0.0487 per unit on 37,119,960 units) 1,933,634 1,807,742– US$0.0391 per unit on 53,431,699 units (September
2015: US$0.0499 per unit on 36,739,768 units) 2,089,179 1,833,314– US$0.0397 per unit on 54,851,807 units (October
2015: US$0.0494 per unit on 36,889,126 units) 2,177,617 1,822,323– US$0.0434 per unit on 54,127,877 units (November
2014: US$0.0489 per unit on 37,166,733 units) 2,349,150 1,817,453– US$0.0424 per unit on 53,491,091 units (December
2015: US$0.0503 per unit on 36,394,294 units) 2,268,022 1,830,633– US$0.0383 per unit on 54,360,670 units (January
2016: US$0.0525 per unit on 37,104,375 units) 2,082,014 1,947,980– US$0.0425 per unit on 57,054,362 units (Febraury
2016: US$0.0524 per unit on 37,171,138 units) 2,424,810 1,947,768– US$0.0386 per unit on 58,791,637 units (March
2015: US$0.0490 per unit on 38,340,427 units) 2,269,357 1,878,681– US$0.0390 per unit on 60,309,616 units (April 2015:
US$0.0434 per unit on 40,959,987 units) 2,352,075 1,777,663– US$0.0379 per unit on 60,192,112 units (May 2016:
US$0.0446 per unit on 42,969,134 units) 2,281,281 1,916,423– US$0.0380 per unit on 61,213,947 units (June 2015:
US$0.0468 per unit on 44,607,785 units) 2,326,130 2,087,644
Distributions declared during the year– US$0.0424 per unit on 61,531,050 units (July 2016:
US$0.0399 per unit on 47,093,557 units) 2,608,917 1,879,033
27,162,186 22,546,657
(b) Distributionsattributabletothepreviousfinancialyear,approvedandpaidduringtheyear
Distributions declared during the previous financial year and paid during the year of US$0.0399 per unit on 47,093,557 units (July 2015: US$0.0500 per unit on 37,241,053 units) 1,879,033 1,862,053
2017 2016USD USD
“AMH–AUD”classunit
(a) Distributionsattributabletotheyear
Distributions declared and paid during the year– AUD0.0452 per unit on 3,072,059 units (August
2015: AUD0.0602 per unit on 4,269,924 units) 104,295 183,289– AUD0.0444 per unit on 3,634,162 units (September
2015: AUD0.0608 per unit on 4,312,809 units) 122,688 183,776– AUD0.0448 per unit on 3,842,002 units (October
2015: AUD0.0609 per unit on 5,230,106 units) 131,036 226,734– AUD0.0480 per unit on 3,852,022 units (November
2015: AUD0.0602 per unit on 5,092,730 units) 138,257 220,770– AUD0.0466 per unit on 3,922,339 units (December
2015: AUD0.0611 per unit on 4,807,435 units) 131,950 214,720– AUD0.0422 per unit on 3,691,558 units (January
2016: AUD0.0617 per unit on 4,835,422 units) 117,274 212,482– AUD0.0461 per unit on 3,668,730 units (February
2016: AUD0.0615 per unit on 3,675,944 units) 129,882 161,233– AUD0.0424 per unit on 3,408,437 units (March
2016: AUD0.0585 per unit on 3,637,344 units) 110,658 162,578– AUD0.0417 per unit on 3,565,369 units (April 2016:
AUD0.0533 per unit on 3,570,576 units) 111,112 145,313– AUD0.0406 per unit on 4,477,396 units (May 2016:
AUD0.0546 per unit on 3,905,823 units) 135,437 154,271– AUD0.0405 per unit on 4,497,770 units (June 2016:
AUD0.0544 per unit on 3,295,088 units) 140,291 133,131
Distributions declared during the year– AUD0.0439 per unit on 3,938,576 units (July 2016:
AUD0.0484 per unit on 2,951,951 units) 137,682 107,099
1,510,562 2,105,396
(b) Distributionsattributabletothepreviousfinancialyear,approvedandpaidduringtheyear
Distributions declared during the previous financial year and paid during the year of AUD0.0484 per unit on 2,951,951 units (July 2015: AUD0.0620 per unit on 4,288,073 units) 107,099 193,586

51
Notes to the Financial Statements
2017 2016USD USD
“AMH–EUR”classunit
(a) Distributionsattributabletotheyear
Distributions declared and paid during the year– EUR0.0289 per unit on 905,838 units (August 2015:
EUR0.0453 per unit on 895,436 units) 29,145 45,500– EUR0.0297 per unit on 961,675 units (September
2015: EUR0.0460 per unit on 620,828 units) 31,949 32,071– EUR0.0294 per unit on 1,182,450 units (October
2015: EUR0.0457 per unit on 628,757 units) 38,105 31,573– EUR0.0332 per unit on 1,445,973 units (November
2015: EUR0.0457 per unit on 549,974 units) 51,002 26,597– EUR0.0315 per unit on 1,446,184 units (December
2015: EUR0.0473 per unit on 538,383 units) 47,869 27,826– EUR0.0271 per unit on 1,290,999 units (January
2016: EUR0.0462 per unit on 921,653 units) 37,344 46,404– EUR0.0309 per unit on 1,296,925 units (February
2016: EUR0.0467 per unit on 882,730 units) 42,459 45,169– EUR0.0267 per unit on 1,284,475 units (March 2016:
EUR0.0415 per unit on 663,314 units) 36,665 31,227– EUR0.0265 per unit on 1,330,055 units (April 2016:
EUR0.0359 per unit on 698,343 units) 38,371 28,528– EUR0.0252 per unit on 1,406,022 units (May 2016:
EUR0.0369 per unit on 712,142 units) 39,631 29,232– EUR0.0249 per unit on 1,345,201 units (June 2016:
EUR0.0390 per unit on 808,354 units) 38,281 35,044
Distributions declared during the year– EUR0.0282 per unit on 1,334,392 units (July 2016:
EUR0.0315 per unit on 851,269 units) 44,189 29,735
475,010 408,906
(b) Distributionsattributabletothepreviousfinancialyear,approvedandpaidduringtheyear
Distributions declared during the previous financial year and paid during the year of EUR0.0315 per unit on 851,269 units (July 2015: EUR0.0464 per unit on 947,990 units) 29,735 48,095
During the year, no distributions were made to the unitholders of HSBC China Momentum Fund and HSBC China Growth Fund.
12 Financialinstrumentsandassociatedrisks
The sub-funds maintain investment portfolios in a variety of listed and unlisted financial instruments as dictated by their respective investment management strategies. The objective of the sub-funds is to invest in securities issued by or linked to the companies that are positioned to benefit from the strong economic growth and rising investment opportunities in different regions of China, Hong Kong and other Asian countries determined by the Manager. The sub-funds’ investment portfolios comprise mainly debt securities, equities, foreign currency forward contracts and equity-linked instruments.
The sub-funds’ investing activities expose them to various types of risks that are associated with the financial instruments and markets in which they invest. The Manager and the Trustee have set out below the most important types of financial risks inherent in each type of financial instrument. The Manager and the Trustee would like to highlight that the following list of associated risks only sets out some of the risks but does not purport to constitute an exhaustive list of all the risks inherent in an investment in the sub-funds. Unitholders should note that additional information in respect of risks associated with investment in the sub-funds can be found in their offering document.
The asset allocation is determined by the sub-funds’ Manager who manages and monitors the distribution of the assets to achieve the investment objectives.
The nature and extent of the financial instruments outstanding at the date of statement of financial position and the risk management policies employed by the sub-funds are discussed below.
(a) Pricerisk
Price risk is the risk that value of the instrument will fluctuate as a result of changes in market prices, whether caused by factors specific to an individual investment, its issuer or all factors affecting all instruments traded in the market.
The sub-funds are exposed to price risk arising from changes in market prices. Price risk is managed by investing in a portfolio of different investments in accordance with the investments objectives of the sub-funds.
Price sensitivity
The impact of a 10% increase in value of the investments on 31 July 2017, with all other variables held constant, is shown below. An equal change in the opposite direction would have reduced the net asset value by an equal but opposite amount. The analysis is performed on the same basis for 2016.

52
Notes to the Financial Statements
2017
HSBCAsianBond
Fund
HSBCChina
MomentumFund
HSBCChinaGrowth
Fund
HSBCAsianHighYieldBond
FundUSD USD USD USD
Asat31July2017
Overall market exposures– Equities – 72,955,189 391,032,484 –– Equity-linked instruments – 1,543,479 – –
– 74,498,668 391,032,484 –
Change in net assets if investment value increased by 10%– Equities – 7,295,519 39,103,248 –– Equity-linked instruments – 154,348 – –
– 7,449,867 39,103,248 –
2016
HSBCAsianBond
Fund
HSBCChina
MomentumFund
HSBCChinaGrowth
Fund
HSBCAsianHighYieldBond
FundUSD USD USD USD
Asat31July2016
Overall market exposures– Equities – 57,188,648 412,667,198 –– Equity-linked instruments – 2,819,144 4,703,759 –
– 60,007,792 417,370,957 –
Change in net assets if investment value increased by 10%– Equities – 5,718,865 41,266,720 –– Equity-linked instruments – 281,914 470,376 –
– 6,000,779 41,737,096 –

53
Notes to the Financial Statements
(b) Interestraterisk
Interest rate risk arises from changes in interest rates which may affect the value of debt instruments and therefore result in potential gain or loss to the sub-funds. The sub-funds’ interest rate risk is managed on an ongoing basis by the Manager.
The following table indicates the periods in which the interest-bearing assets mature and re-price at the date of the statement of financial position. The table excludes negligible interest-bearing cash and cash equivalents as the exposure to interest rate risk is minimal. For HSBC China Momentum Fund and HSBC China Growth Fund, there were no interest-bearing assets and liabilities. For HSBC Asian Bond Fund and HSBC Asian High Yield Bond Fund, there were no interest-bearing liabilities.
2017
HSBCAsianBond
Fund
HSBCAsianHighYieldBond
FundUSD USD
ASSETSFinancial assets at fair value through
profit or loss– 1 year or less 82,443,910 47,251,773– over 1 year to 5 years 1,252,209,135 526,482,659– over 5 years 1,031,831,999 360,341,734
2,366,485,044 934,076,166
2016
HSBCAsianBond
Fund
HSBCAsianHighYieldBond
FundUSD USD
ASSETSFinancial assets at fair value through
profit or loss– 1 year or less 130,263,216 48,141,756– over 1 year to 5 years 1,503,919,969 435,056,695– over 5 years 1,716,981,799 263,242,369
3,351,164,984 746,440,820
Interest rate sensitivity
At the date of the statement of financial position, assuming all other factors unchanged, it is estimated that for an increase in interest rates of 100 basis points (2016: 50 basis points), the estimated impact on net assets attributable to unitholders and the profit for the year of the sub-funds are indicated as follows; an equal change in the opposite direction would have changed the net asset attributable to unitholders by an approximately equal but opposite amount. The analysis is performed on the same basis for 2016:
Decreaseinnetassetsifinterestrateincreasedby100bps
(2016:50bps)2017 2016
HSBC Asian Bond Fund USD 115,906,484 USD 88,558,817HSBC Asian High Yield Bond Fund USD 41,292,788 USD 18,187,546
(c) Currencyrisk
All of HSBC China Momentum Fund’s financial instruments at 31 July 2017 and 31 July 2016 are denominated either in Hong Kong dollars (“HKD”) or United States dollars (“USD”). No significant currency risk is associated with this sub-fund.
HSBC Asian Bond Fund, HSBC China Growth Fund and HSBC Asian High Yield Bond Fund may invest in financial instruments and enter into transactions denominated in currencies other than their respective functional currency. Consequently, these sub-funds are exposed to risks that the exchange rate of their respective functional currency relative to other foreign currencies may change in a manner that has an adverse effect on the value of that portion of the sub-funds’ assets or liabilities denominated in currencies other than their respective functional currency.
The fluctuations in the rate of exchange between the currency in which the asset or liability is denominated and the functional currency could result in an appreciation or depreciation in the fair value of that asset or liability. The Manager may attempt to mitigate this risk by using financial derivative instruments. The Manager monitors the sub-funds’ currency exposures on an ongoing basis.
Currency sensitivity
At 31 July 2017, had the United States dollar (“USD”) weakened by 5% (2016: 5%) in relation to respective currencies, with all other variables held constant, net assets attributable to unitholders and the profit for the year would have increased/(decreased) by the amounts shown below. The analysis is performed on the same basis for 2016.

54
Notes to the Financial Statements
Asat31July2017
HSBCAsianBondFund
HSBCChinaMomentumFund
HSBCChinaGrowthFund
HSBCAsianHighYieldBondFund
Netexposure
ChangeinnetassetifUSD
weakenedby5% Netexposure
ChangeinnetassetifUSD
weakenedby5% Netexposure
ChangeinnetassetifUSD
weakenedby5% Netexposure
ChangeinnetassetifUSD
weakenedby5%
USD USD USD USD USD USD USD USD
Australian Dollar 113,102,091 5,655,105 – – – – 132,232 6,612Chinese Renminbi 42,287,588 2,114,379 2,905,387 145,269 1,604,349 80,217 6,174,992 308,750Euro 21,910,570 1,095,529 – – – – 98,097 4,905Indonesian Rupiah 10,747,428 537,371 – – – – 19,955,412 997,771Indian Rupee 25,657,777 1,282,889 – – – – 30,293,378 1,514,669Korean Won 3 – – – – – – –Malaysian Ringgit (295) (15) – – – – – –Singaporean Dollar – – – – – – 163 8
213,705,162 10,685,258 2,905,387 145,269 1,604,349 80,217 56,654,274 2,832,715
Asat31July2016
HSBCAsianBondFund
HSBCChinaMomentumFund
HSBCChinaGrowthFund
HSBCAsianHighYieldBondFund
Netexposure
ChangeinnetassetifUSD
weakenedby5% Netexposure
ChangeinnetassetifUSD
weakenedby5% Netexposure
ChangeinnetassetifUSD
weakenedby5% Netexposure
ChangeinnetassetifUSD
weakenedby5%
USD USD USD USD USD USD USD USD
Australian Dollar 133,376,263 6,668,813 – – – – (165,331) (8,267)Chinese Renminbi 39,160,513 1,958,026 – – 207,216 10,361 11,247,363 562,368Euro 27,141,772 1,357,089 – – – – 35,612 1,781Indonesian Rupiah – – – – – – 82 4Indian Rupee 13,736,857 686,843 – – – – 14,172,430 708,622Korean Won 3 – – – – – – –Malaysian Ringgit (311) (16) – – – – – –Singaporean Dollar – – – – – – 163 8
213,415,097 10,670,755 – – 207,216 10,361 25,290,319 1,264,516
As the HKD is pegged to the USD, the sub-funds do not expect any significant movement in USD/HKD exchange rate. A 5% appreciation of USD against the above currencies would have resulted in an equal but opposite effect on the financial statement amounts, on the basis that all other variables remain constant.

55
Notes to the Financial Statements
(d) Creditrisk
(i) Analysis of credit policy and concentration of credit risk
Credit risk is the risk that a counterparty to a financial instrument will fail to discharge an obligation or commitment that it has entered into with the sub-funds. The sub-funds’ exposure to credit risk is monitored by the Manager on an ongoing basis.
At 31 July 2017 and 31 July 2016, two of the sub-funds, HSBC Asian Bond Fund, HSBC China Growth Fund and HSBC Asian High Yield Bond Fund invested in debt securities with the following credit quality expressed as a percentage of debt securities:
Asat31July2017
HSBCAsianBondFund
HSBCAsianHighYield
BondFundRating %ofdebtsecurities %ofdebtsecurities
(Moody’s/S&P/Fitch)
Aaa/AAA/AAA – 0.03Aa2/AA/AA 3.33 –Aa3/AA-/AA– 0.42 –A1/A+/A+ 16.30 –A2/A/A 6.42 0.78A3/A-/A– 10.53 0.09Baa1/BBB+/BBB+ 11.43 –Baa2/BBB/BBB 10.62 4.45Baa3/BBB-/BBB– 20.89 18.08Ba1/BB+/BB+ 3.89 4.89Ba2/BB/BB 1.87 8.19Ba3/BB-/BB– 1.98 13.51B1/B+/B+ 2.90 17.18B2/B/B 0.71 9.26B3/B-/B– 0.73 10.25Caa1/CCC+/CCC+ 0.22 0.61Caa2/CCC/CCC – 1.10NR 7.76 11.58
Total 100.00 100.00
Asat31July2016
HSBCAsianBondFund
HSBCChinaGrowthFund
HSBCAsianHighYield
BondFund
Rating%ofdebtsecurities
%ofdebtsecurities
%ofdebtsecurities
(Moody’s/S&P/Fitch)
Aa1/AA+/AA+ 1.71 – –Aa2/AA/AA 2.37 – –Aa3/AA-/AA– 4.87 – –A1/A+/A+ 14.29 – –A2/A/A 6.76 100.00 1.23A3/A-/A– 13.04 – 0.83Baa1/BBB+/BBB+ 12.17 – 2.12Baa2/BBB/BBB 8.41 – 6.31Baa3/BBB-/BBB– 10.53 – 1.26Ba1/BB+/BB+ 9.89 – 17.03Ba2/BB/BB 4.55 – 12.09Ba3/BB-/BB– 1.34 – 8.88B1/B+/B+ 1.98 – 18.26B2/B/B 1.28 – 13.44B3/B-/B– 0.44 – 3.59Caa1/CCC+/CCC+ – – 2.51NR 6.37 – 12.45
Total 100.00 100.00 100.00
Credit risk is managed by the reviewing and monitoring of the credit quality of debt securities held by the sub-funds or the issuers of the debt instruments held by the sub-funds on an ongoing basis.
Credit risk arising from transactions with brokers relates to transactions awaiting settlement. Risk relating to unsettled transactions is considered small due to the short settlement period involved and the high credit quality of the brokers used.
The majority of the cash held by the sub-funds is deposited with the HSBC Group. According to the Moody’s, the credit rating of HSBC Group is A1 (2016: A1). Bankruptcy or insolvency of the bank may cause the sub-funds’ rights with respect to the cash held by the bank to be delayed or limited. The sub-funds monitor the credit rating and financial position of the bank on an ongoing basis.

56
Notes to the Financial Statements
Substantially all of the assets of the sub-funds are held by the Custodian. Bankruptcy or insolvency of the Custodian may cause the sub-funds’ rights with respect to securities held by the Custodian to be delayed or limited. The Custodian is a group company of the HSBC, which credit risk is considered insignificant.
HSBC China Momentum Fund and HSBC China Growth Fund enter into transactions of over-the-counter-equity-linked instruments, which expose the sub-funds to the risk that the counterparties to the financial instruments might default on their obligations to the sub-funds. The Manager considers the risk to be insignificant.
The carrying amounts of financial assets best represent the maximum credit risk exposure at the date of assets and liabilities.
As of 31 July 2017, HSBC Asian Bond Fund and HSBC Asian High Yield Bond Fund had fixed income investments issued by the Indonesian Government amounting to 5.19% and 9.52% (2016: 3.67% and 7.96%) of net asset value, respectively.
(ii) Offsetting financial assets and financial liabilities
None of the financial assets and financial liabilities is offset in the statement of financial position. The disclosures set-out in the table below include financial assets and financial liabilities that are subject to an enforceable master netting arrangement.
The enforceable master netting arrangements do not meet the criteria for offsetting in the statement of financial position. This is because they create a right of set off of recognised amounts that is enforceable only following on event of default, insolvency or bankruptcy of the Trust and its sub-fund or their counterparties. In addition, the Trust and its sub-funds and their counterparties do not intend to settle on a net basis or to realise the assets and settle the liabilities simultaneously.
The equity-linked instruments are not subject to an enforceable master netting arrangement.
31July2017
Financial assets subject to enforceable master netting arrangements
Grossamountsofrecognised
financialassets
Grossamountsofrecognised
financialliabilitiesoffsetin
thestatement
offinancialposition
Netamountsof
financialassets
presentedinthe
statementoffinancial
position
Amountsoffinancial
instruments(includingnon-cash
collateral)
Cashcollateralreceived
Netamount
USD USD USD USD USD USD
HSBCAsianBondFund
Derivative financial instruments:– Forward foreign exchange contracts 1,151,818 – 1,151,818 – – 1,151,818
HSBCAsianHighYieldBondFund
Derivative financial instruments:– Forward foreign exchange contracts 404,440 – 404,440 – – 404,440

57
Notes to the Financial Statements
Financial liabilities subject to enforceable master netting arrangements
Grossamountsofrecognised
financialliabilities
Grossamountsofrecognised
financialassets
offsetinthe
statementoffinancial
position
Netamountsof
financialliabilities
presentedinthe
statementoffinancial
position
Amountsoffinancial
instruments(includingnon-cash
collateral)
Cashcollateralpledged
Netamount
USD USD USD USD USD USD
HSBCAsianBondFund
Derivative financial instruments:– Forward foreign exchange contracts – – – – – –
HSBCAsianHighYieldBondFund
Derivative financial instruments:– Forward foreign exchange contracts – – – – – –
31July2016
Financial assets subject to enforceable master netting arrangements
Grossamountsofrecognised
financialassets
Grossamountsofrecognised
financialliabilitiesoffsetin
thestatement
offinancialposition
Netamountsof
financialassets
presentedinthe
statementoffinancial
position
Amountsoffinancial
instruments(includingnon-cash
collateral)
Cashcollateralreceived
Netamount
USD USD USD USD USD USD
HSBCAsianBondFund
Derivative financial instruments:– Forward foreign exchange contracts 238,156 – 238,156 – – 238,156
HSBCAsianHighYieldBondFund
Derivative financial instruments:– Forward foreign exchange contracts 65,388 – 65,388 (65,388) – –

58
Notes to the Financial Statements
Financial liabilities subject to enforceable master netting arrangements
Grossamountsofrecognised
financialliabilities
Grossamountsofrecognised
financialassets
offsetinthe
statementoffinancial
position
Netamountsof
financialliabilities
presentedinthe
statementoffinancial
position
Amountsoffinancial
instruments(includingnon-cash
collateral)
Cashcollateralpledged
Netamount
USD USD USD USD USD USD
HSBCAsianBondFund
Derivative financial instruments:– Forward foreign exchange contracts – – – – – –
HSBCAsianHighYieldBondFund
Derivative financial instruments:– Forward foreign exchange contracts (70,979) – (70,979) 65,388 5,591 –
The gross amounts of recognised financial assets and financial liabilities and their net amounts presented in the statement of financial position disclosed in the above tables have been measured in the statement of financial position at fair value.

59
Notes to the Financial Statements
The tables below reconcile the “Net amounts of financial assets and financial liabilities presented in the statement of financial position”, as set out above, to the line items presented in the statement of financial position.
Reconciliation to the net amounts of financial assets and financial liabilities presented in the statement of financial position.
31July2017
Financial assets
Netamounts
Lineiteminstatementof
financialposition
Carryingamountin
statementoffinancialposition
Financialassetsnotin
scopeofoffsetting
disclosuresUSD USD USD
HSBCAsianBondFund
Derivative financial instruments:
– Forward foreign exchange contracts 1,151,818
Forwardcontracts
receivable 1,151,818 –
HSBCAsianHighYieldBondFund
Derivative financial instruments:
– Forward foreign exchange contracts 404,440
Forwardcontracts
receivable 404,440 –
Financial liabilities
Netamounts
Lineiteminstatementof
financialposition
Carryingamountin
statementoffinancialposition
Financialliabilitiesnot
inscopeofoffsetting
disclosuresUSD USD USD
HSBCAsianBondFund
Derivative financial instruments:
– Forward foreign exchange contracts –
Forwardcontracts
payable – –
HSBCAsianHighYieldBondFund
Derivative financial instruments:
– Forward foreign exchange contracts –
Forwardcontracts
payable – –
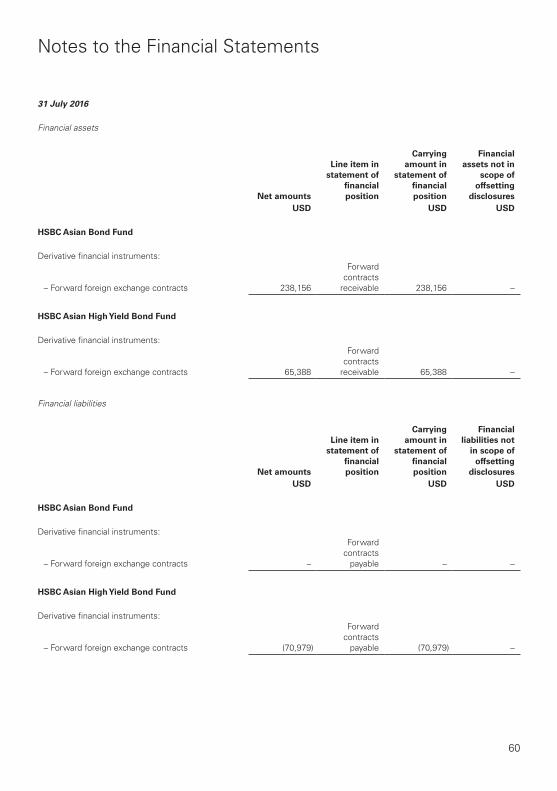
60
Notes to the Financial Statements
31July2016
Financial assets
Netamounts
Lineiteminstatementof
financialposition
Carryingamountin
statementoffinancialposition
Financialassetsnotin
scopeofoffsetting
disclosuresUSD USD USD
HSBCAsianBondFund
Derivative financial instruments:
– Forward foreign exchange contracts 238,156
Forwardcontracts
receivable 238,156 –
HSBCAsianHighYieldBondFund
Derivative financial instruments:
– Forward foreign exchange contracts 65,388
Forwardcontracts
receivable 65,388 –
Financial liabilities
Netamounts
Lineiteminstatementof
financialposition
Carryingamountin
statementoffinancialposition
Financialliabilitiesnot
inscopeofoffsetting
disclosuresUSD USD USD
HSBCAsianBondFund
Derivative financial instruments:
– Forward foreign exchange contracts –
Forwardcontracts
payable – –
HSBCAsianHighYieldBondFund
Derivative financial instruments:
– Forward foreign exchange contracts (70,979)
Forwardcontracts
payable (70,979) –

61
Notes to the Financial Statements
(e) Liquidityrisk
Liquidity risk is the risk that the sub-funds will encounter difficulty in meeting obligations arising from their financial liabilities that are settled by delivering cash or another financial asset, or that such obligations will have to be settled in a manner disadvantageous to the sub-funds. The sub-funds are exposed to daily liquidity risk on redemption of units.
The sub-funds’ policy is to regularly monitor current and expected liquidity requirements to ensure that it maintains sufficient reserves of cash and readily realisable marketable securities to meet its liquidity requirements in the short and longer term.
The sub-funds’ listed investments are generally considered to have insignificant exposures to liquidity risk as they are all readily realisable under normal market conditions. The sub-funds, however, also invest in unlisted investments such as unlisted bonds, equity-linked instruments and derivatives, which are not publicly traded on exchanges and may be illiquid.
As at 31 July 2017 and 31 July 2016, the sub-funds’ financial liabilities are due within three months, except for redemptions payable and net asset attributable to unitholders which are repayable on demand.
(f) Capitalmanagement
The sub-funds’ capital as at the year end date are represented by their redeemable units.
The sub-funds’ objectives in managing the capital are to ensure a stable and strong base to maximise returns to all investors, and to manage liquidity risk arising from the redemptions. The Manager manages the capital of the sub-funds in accordance with the sub-funds’ investment objectives and policies stated in the sub-funds’ Explanatory Memorandum.
There were no changes in the policies and procedures during the year with respect to the sub-funds’ approaches to their capital management.
The amount and the movement of net assets/equity are stated in the statement of changes in net assets attributable to unitholders/statement of changes in equity. As the redeemable units are redeemed on demand at the unitholders’/owners’ option, the actual level of redemption may differ significantly from historical experience.
(g) Specificinstruments
Forward contracts
Forward contracts are commitments either to purchase or sell a designated financial instrument, currency, commodity or index at a specified future date for a specified price and may be settled in cash or the underlying financial asset.
Forward contracts result in exposure to market risk based on changes in market prices relative to contracted prices. Market risks arise due to the possible movement in foreign currency exchange rates, indices, and securities’ values underlying these instruments. In addition, because of the low margin deposits normally required in relation to notional contract sizes, a high degree of leverage may be typical of a forward contract and may result in substantial losses to the sub-funds. Forward contracts are generally subject to liquidity risk.
At 31 July 2017 and 31 July 2016, the sub-funds’ holdings in foreign exchange forward contracts were as specified in the following table.
As at 31 July 2017
HSBCAsianBondFund
Buy Sell SettlementdateFairvalue
assetsFairvalue
(liabilities)USD USD
AUD144,164,218 USD113,801,792 31 August 2017 946,583 –
EUR18,690,030 USD21,779,510 31 August 2017 205,235 –
1,151,818 –
HSBCAsianHighYieldBondFund
Buy Sell SettlementdateFairvalue
assetsFairvalue
(liabilities)USD USD
AUD39,900,750 USD31,497,253 31 August 2017 261,988 –
EUR12,923,432 USD15,059,688 31 August 2017 141,912 –
USD439,977 AUD552,087 31 August 2017 540 –
404,440 –

62
Notes to the Financial Statements
As at 31 July 2016
HSBCAsianBondFund
Buy Sell SettlementdateFairvalue
assetsFairvalue
(liabilities)USD USD
AUD177,396,937 USD133,263,240 31 August 2016 53,929 –
AUD1,930,459 USD1,445,850 31 August 2016 4,926 –
EUR24,537,256 USD27,045,766 31 August 2016 179,301 –
238,156 –
HSBCAsianHighYieldBondFund
Buy Sell SettlementdateFairvalue
assetsFairvalue
(liabilities)USD USD
AUD31,698,294 USD23,804,436 31 August 2016 – (70,974)
EUR8,336,064 USD9,187,884 31 August 2016 65,352 –
EUR107,212 USD119,014 31 August 2016 – (5)
USD1,516,809 AUD2,025,201 31 August 2016 36 –
65,388 (70,979)
13 Fairvalueinformation
The sub-funds’ financial instruments are measured at fair value on the date of the statement of financial position. Fair value estimates are made at a specified point in time, based on market conditions and information about the financial instruments. Usually, fair values can be reliably determined within a reasonable range of estimates. For certain other financial instruments, including interest and dividends receivables, subscriptions receivable, amounts due from brokers, redemptions payable, amounts due to brokers, taxes payable, distributions payable and other payables, the carrying amounts approximate fair values due to the immediate or short term nature of these financial instruments.
Valuationoffinancialinstruments
The sub-funds’ accounting policy on fair value measurements is detailed in the significant accounting policy in note 2(e)(iv).
The sub-funds measure fair values using the following fair value hierarchy that reflects the significance of the inputs used in making the measurements.
– Level 1: Inputs that are quoted market prices (unadjusted) in active markets for identical instruments.
– Level 2: Inputs other than quoted prices included within Level 1 that are observable either directly (i.e. as prices) or indirectly (i.e. derived from prices). The category includes instruments valued using: quoted market price in active markets for similar instruments; quoted prices for identical or similar instruments in markets that are considered less than active; or other valuation techniques in which all significant inputs are directly or indirectly observable from market data.
– Level 3: Inputs that are unobservable. This category includes all instruments for which the valuation technique includes inputs not based on observable data and the unobservable inputs have a significant effect on the instrument’s valuation. This category includes instruments that are valued based on quoted prices for similar instruments but for which significant unobservable adjustments or assumptions are required to reflect differences between the instruments.
When fair values of listed and quoted investments at the reporting date are based on quoted market prices or binding dealer price quotations in an active market, without any deduction for transactions costs, the instruments are included within Level 1 of the hierarchy. When fair values of debt securities at the reporting date represent quoted prices in markets that are considered less than active or consensus prices derived by third parties using valuation techniques where all significant inputs are directly or indirectly observable from market data, those debt securities are included within Level 2 of the hierarchy. For all other financial instruments, the sub-funds determine fair value using valuation techniques.
The sub-funds use widely recognised valuation models for determining the fair value of the debt securities and equity-linked instruments which do not have quoted market prices in active markets. Valuation techniques include net present value, discounted cash flow models, comparison to similar instruments for which market observable prices exist, comparison to quoted prices for identical instruments that are considered less than active and other valuation models.
The following analyses financial instruments at fair value through profit or loss at the date of the statement of financial position, by the level in the fair value hierarchy into which the fair value measurement is categorised.

63
Notes to the Financial Statements
Financial instruments at fair value through profit or loss
HSBCAsianBondFund
2017
Level1 Level2 Level3 TotalUSD USD USD USD
Financial assets
Debt securities – 2,366,485,044 – 2,366,485,044Equity securities – – – –Equity-linked
instruments – – – –Foreign currency
forward contracts – 1,151,818 – 1,151,818
– 2,367,636,862 – 2,367,636,862
2016
Level1 Level2 Level3 TotalUSD USD USD USD
Financial assets
Debt securities – 3,351,164,984 – 3,351,164,984Equity securities – – – –Equity-linked
instruments – – – –Foreign currency
forward contracts – 238,156 – 238,156
– 3,351,403,140 – 3,351,403,140
HSBCChinaMomentumFund
2017
Level1 Level2 Level3 TotalUSD USD USD USD
Financial assets
Debt securities – – – –Equity securities 72,955,189 – – 72,955,189Equity-linked
instruments – 1,543,479 – 1,543,479Foreign currency
forward contracts – – – –
72,955,189 1,543,479 – 74,498,668
2016
Level1 Level2 Level3 TotalUSD USD USD USD
Financial assets
Debt securities – – – –Equity securities 57,188,648 – – 57,188,648Equity-linked
instruments – 2,819,144 – 2,819,144Foreign currency
forward contracts – – – –
57,188,648 2,819,144 – 60,007,792

64
Notes to the Financial Statements
HSBCChinaGrowthFund
2017
Level1 Level2 Level3 TotalUSD USD USD USD
Financial assets
Debt securities – – – –Equity securities 391,032,484 – – 391,032,484Equity-linked
instruments – – – –Foreign currency
forward contracts – – – –
391,032,484 – – 391,032,484
2016
Level1 Level2 Level3 TotalUSD USD USD USD
Financial assets
Debt securities – 2,416,849 – 2,416,849Equity securities 412,667,198 – – 412,667,198Equity-linked
instruments – 4,703,759 – 4,703,759Foreign currency
forward contracts – – – –
412,667,198 7,120,608 – 419,787,806
Financial liabilities
Foreign currency forward contracts – – – –
HSBCAsianHighYieldBondFund
2017
Level1 Level2 Level3 TotalUSD USD USD USD
Financial assets
Debt securities – 934,076,166 – 934,076,166Equity securities – – – –Equity-linked
instruments – – – –Foreign currency
forward contracts – 404,440 – 404,440
– 934,480,606 – 934,480,606
2016
Level1 Level2 Level3 TotalUSD USD USD USD
Financial assets
Debt securities – 746,440,820 – 746,440,820Equity securities – – – –Equity-linked
instruments – – – –Foreign currency
forward contracts – 65,388 – 65,388
– 746,506,208 – 746,506,208
Financial liabilities
Foreign currency forward contracts – 70,979 – 70,979
Level 3 financial instrument of HSBC China Growth Fund includes China Metal Recycling Holdings Ltd. This instrument has been delisted and in financial statements it is revalued and priced based on relevant news and information.

65
Notes to the Financial Statements
The table below presents the reconciliation from the beginning balances to the ending balances for fair value measurements in Level 3 of the fair value hierarchy.
Asat1August2016
Netlossesincludedinthe
statementofcomprehensive
income PurchaseTransferinof
Level3Asat31July
2017USD USD USD USD USD
Equities – – – – –
Asat1August2015
Netlossesincludedinthe
statementofcomprehensive
income PurchaseTransferinof
Level3Asat31July
2016USD USD USD USD USD
Equities – – – – –
The change in unrealised gains or losses for the year is included in the statement of comprehensive income for financial assets and financial liabilities held at the reporting date.
Quantitative information of significant unobservable inputs – Level 3
The table below sets out information about significant unobservable inputs used at 31 July 2017 and 31 July 2016 in measuring financial instruments categorised as Level 3 in the fair value hierarchy.
DescriptionFairvalueat31July
2017/2016Valuation
techniquesUnobservable
input
Equities –Provision on the
total costDiscountprovision
The significant unobservable inputs used in the fair value measurement categorised within Level 3 of the fair value hierarchy together with a quantitative sensitivity analysis as at year end is as shown below:
Input
Changeinunobservable
input
Effectonthenetassets
attributabletounitholders
Asat31July2017
Equities Discount provision 5% 262,275
Asat31July2016
Equities Discount provision 5% 341,389
There were no transfers between the Levels during the year (2016: nil).

66
Notes to the Financial Statements
Valuation of financial instruments not measured at fair value
HSBCAsianBondFund
2017
Level1 Level2 Level3 TotalUSD USD USD USD
Financial assets
Interest receivable – 24,887,194 – 24,887,194Dividends receivable – – – –Subscriptions
receivable – 9,651,013 – 9,651,013Amounts due from
brokers – 10,305,376 – 10,305,376Cash and cash
equivalents – 25,592,472 – 25,592,472
– 70,436,055 – 70,436,055
Financial liabilities
Redemptions payable – 17,035,892 – 17,035,892
Amounts due to brokers – 14,510,576 – 14,510,576
Tax payable – 296 – 296Distributions payable – 8,251,805 – 8,251,805Other payables – 2,264,873 – 2,264,873Net assets
attributable to unitholders – 2,396,009,475 – 2,396,009,475
– 2,438,072,917 – 2,438,072,917
2016
Level1 Level2 Level3 TotalUSD USD USD USD
Financial assets
Interest receivable – 34,149,478 – 34,149,478Dividends receivable – – – –Subscriptions
receivable – 41,200,915 – 41,200,915Amounts due from
brokers – 14,246,928 – 14,246,928Cash and cash
equivalents – 8,800,471 – 8,800,471
– 98,397,792 – 98,397,792
Financial liabilities
Redemptions payable – 38,277,247 – 38,277,247
Amounts due to brokers – 9,596,073 – 9,596,073
Tax payable – 312 – 312Distributions payable – 12,944,529 – 12,944,529Other payables – 3,268,612 – 3,268,612Net assets
attributable to unitholders – 3,385,714,159 – 3,385,714,159
– 3,449,800,932 – 3,449,800,932

67
Notes to the Financial Statements
HSBCChinaMomentumFund
2017
Level1 Level2 Level3 TotalUSD USD USD USD
Financial assets
Interest receivable – 5 – 5Dividends receivable – 395,959 – 395,959Subscriptions
receivable – – – –Amounts due from
brokers – 506,326 – 506,326Cash and cash
equivalents – 1,618,193 – 1,618,193
– 2,520,483 – 2,520,483
Financial liabilities
Redemptions payable – 234,538 – 234,538
Amounts due to brokers – 751,822 – 751,822
Tax payable – – – –Distributions payable – – – –Other payables – 144,903 – 144,903Net assets
attributable to unitholders – – – –
– 1,131,263 – 1,131,263
2016
Level1 Level2 Level3 TotalUSD USD USD USD
Financial assets
Interest receivable – – – –Dividends receivable – 266,192 – 266,192Subscriptions
receivable – – – –Amounts due from
brokers – 218,355 – 218,355Cash and cash
equivalents – 8,017,667 – 8,017,667
– 8,502,214 – 8,502,214
Financial liabilities
Redemptions payable – 70,907 – 70,907
Amounts due to brokers – 205,794 – 205,794
Tax payable – 6,515,122 – 6,515,122Distributions payable – – – –Other payables – 113,591 – 113,591Net assets
attributable to unitholders – – – –
– 6,905,414 – 6,905,414

68
Notes to the Financial Statements
HSBCChinaGrowthFund
2017
Level1 Level2 Level3 TotalUSD USD USD USD
Financial assets
Interest receivable – 34 – 34Dividends receivable – 2,298,543 – 2,298,543Subscriptions
receivable – 1,236,569 – 1,236,569Amounts due from
brokers – 7,223,287 – 7,223,287Cash and cash
equivalents – 1,788,023 – 1,788,023
– 12,546,456 – 12,546,456
Financial liabilities
Redemptions payable – 6,276,433 – 6,276,433
Amounts due to brokers – 5,463,868 – 5,463,868
Tax payable – – – –Distributions payable – – – –Other payables – 565,477 – 565,477Net assets
attributable to unitholders – 391,273,162 – 391,273,162
– 403,578,940 – 403,578,940
2016
Level1 Level2 Level3 TotalUSD USD USD USD
Financial assets
Interest receivable – – – –Dividends receivable – 1,624,460 – 1,624,460Subscriptions
receivable – 119,687 – 119,687Amounts due from
brokers – 6,827,370 – 6,827,370Cash and cash
equivalents – 13,569,482 – 13,569,482
– 22,140,999 – 22,140,999
Financial liabilities
Redemptions payable – 3,177,895 – 3,177,895
Amounts due to brokers – 7,949,351 – 7,949,351
Tax payable – 41,790 – 41,790Distributions payable – – – –Other payables – 591,329 – 591,329Net assets
attributable to unitholders – 430,168,440 – 430,168,440
– 441,928,805 – 441,928,805

69
Notes to the Financial Statements
HSBCAsianHighYieldBondFund
2017
Level1 Level2 Level3 TotalUSD USD USD USD
Financial assets
Interest receivable – 13,561,866 – 13,561,866Dividends receivable – – – –Subscriptions
receivable – 24,675,758 – 24,675,758Amounts due from
brokers – 1,100,016 – 1,100,016Cash and cash
equivalents – 20,258,727 – 20,258,727
– 59,596,367 – 59,596,367
Financial liabilities
Redemptions payable – 9,851,921 – 9,851,921
Amounts due to brokers – 10,986,652 – 10,986,652
Tax payable – – – –Distributions payable – 3,862,665 – 3,862,665Other payables – 1,298,015 – 1,298,015Net assets
attributable to unitholders – 968,077,720 – 968,077,720
– 994,076,973 – 994,076,973
2016
Level1 Level2 Level3 TotalUSD USD USD USD
Financial assets
Interest receivable – 11,385,747 – 11,385,747Dividends receivable – – – –Subscriptions
receivable – 17,438,415 – 17,438,415Amounts due from
brokers – 6,791,275 – 6,791,275Cash and cash
equivalents – 28,392,075 – 28,392,075
– 64,007,512 – 64,007,512
Financial liabilities
Redemptions payable – 11,898,964 – 11,898,964
Amounts due to brokers – 9,146,222 – 9,146,222
Tax payable – – – –Distributions payable – 3,029,368 – 3,029,368Other payables – 968,035 – 968,035Net assets
attributable to unitholders – 785,400,152 – 785,400,152
– 810,442,741 – 810,442,741
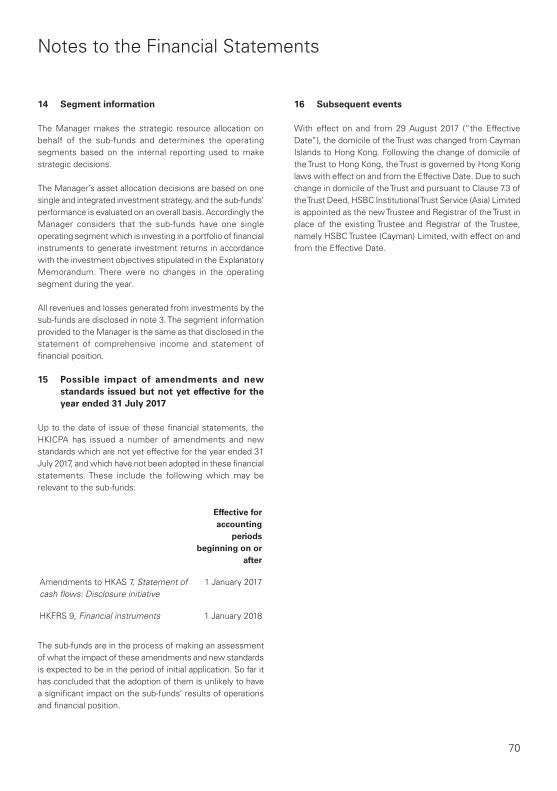
70
Notes to the Financial Statements
14 Segmentinformation
The Manager makes the strategic resource allocation on behalf of the sub-funds and determines the operating segments based on the internal reporting used to make strategic decisions.
The Manager’s asset allocation decisions are based on one single and integrated investment strategy, and the sub-funds’ performance is evaluated on an overall basis. Accordingly the Manager considers that the sub-funds have one single operating segment which is investing in a portfolio of financial instruments to generate investment returns in accordance with the investment objectives stipulated in the Explanatory Memorandum. There were no changes in the operating segment during the year.
All revenues and losses generated from investments by the sub-funds are disclosed in note 3. The segment information provided to the Manager is the same as that disclosed in the statement of comprehensive income and statement of financial position.
15 Possible impact of amendments and newstandardsissuedbutnotyeteffectivefortheyearended31July2017
Up to the date of issue of these financial statements, the HKICPA has issued a number of amendments and new standards which are not yet effective for the year ended 31 July 2017, and which have not been adopted in these financial statements. These include the following which may be relevant to the sub-funds:
Effectiveforaccounting
periodsbeginningonor
after
Amendments to HKAS 7, Statement of cash flows: Disclosure initiative
1 January 2017
HKFRS 9, Financial instruments 1 January 2018
The sub-funds are in the process of making an assessment of what the impact of these amendments and new standards is expected to be in the period of initial application. So far it has concluded that the adoption of them is unlikely to have a significant impact on the sub-funds’ results of operations and financial position.
16 Subsequentevents
With effect on and from 29 August 2017 (“the Effective Date”), the domicile of the Trust was changed from Cayman Islands to Hong Kong. Following the change of domicile of the Trust to Hong Kong, the Trust is governed by Hong Kong laws with effect on and from the Effective Date. Due to such change in domicile of the Trust and pursuant to Clause 7.3 of the Trust Deed, HSBC Institutional Trust Service (Asia) Limited is appointed as the new Trustee and Registrar of the Trust in place of the existing Trustee and Registrar of the Trustee, namely HSBC Trustee (Cayman) Limited, with effect on and from the Effective Date.
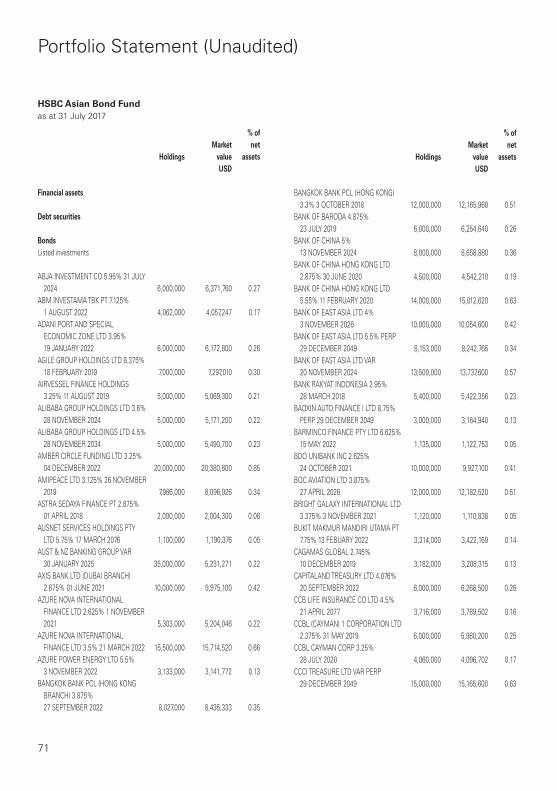
71
Portfolio Statement (Unaudited)
HSBCAsianBondFundas at 31 July 2017
HoldingsMarket
value
%ofnet
assetsUSD
Financialassets
Debtsecurities
BondsListed investments
ABJA INVESTMENT CO 5.95% 31 JULY 2024 6,000,000 6,371,760 0.27
ABM INVESTAMA TBK PT 7.125% 1 AUGUST 2022 4,062,000 4,057,247 0.17
ADANI PORT AND SPECIAL ECONOMIC ZONE LTD 3.95% 19 JANUARY 2022 6,000,000 6,172,800 0.26
AGILE GROUP HOLDINGS LTD 8.375% 18 FEBRUARY 2019 7,000,000 7,297,010 0.30
AIRVESSEL FINANCE HOLDINGS 3.25% 11 AUGUST 2019 5,000,000 5,069,300 0.21
ALIBABA GROUP HOLDINGS LTD 3.6% 28 NOVEMBER 2024 5,000,000 5,171,200 0.22
ALIBABA GROUP HOLDINGS LTD 4.5% 28 NOVEMBER 2034 5,000,000 5,490,700 0.23
AMBER CIRCLE FUNDING LTD 3.25% 04 DECEMBER 2022 20,000,000 20,380,800 0.85
AMIPEACE LTD 3.125% 26 NOVEMBER 2019 7,986,000 8,096,926 0.34
ASTRA SEDAYA FINANCE PT 2.875% 01 APRIL 2018 2,000,000 2,004,300 0.08
AUSNET SERVICES HOLDINGS PTY LTD 5.75% 17 MARCH 2076 1,100,000 1,190,376 0.05
AUST & NZ BANKING GROUP VAR 30 JANUARY 2025 35,000,000 5,231,271 0.22
AXIS BANK LTD (DUBAI BRANCH) 2.875% 01 JUNE 2021 10,000,000 9,975,100 0.42
AZURE NOVA INTERNATIONAL FINANCE LTD 2.625% 1 NOVEMBER 2021 5,303,000 5,204,046 0.22
AZURE NOVA INTERNATIONAL FINANCE LTD 3.5% 21 MARCH 2022 15,500,000 15,714,520 0.66
AZURE POWER ENERGY LTD 5.5% 3 NOVEMBER 2022 3,133,000 3,141,772 0.13
BANGKOK BANK PCL (HONG KONG BRANCH) 3.875% 27 SEPTEMBER 2022 8,027,000 8,435,333 0.35
HoldingsMarket
value
%ofnet
assetsUSD
BANGKOK BANK PCL (HONG KONG) 3.3% 3 OCTOBER 2018 12,000,000 12,165,960 0.51
BANK OF BARODA 4.875% 23 JULY 2019 6,000,000 6,254,640 0.26
BANK OF CHINA 5% 13 NOVEMBER 2024 8,000,000 8,658,880 0.36
BANK OF CHINA HONG KONG LTD 2.875% 30 JUNE 2020 4,500,000 4,542,210 0.19
BANK OF CHINA HONG KONG LTD 5.55% 11 FEBRUARY 2020 14,000,000 15,012,620 0.63
BANK OF EAST ASIA LTD 4% 3 NOVEMBER 2026 10,000,000 10,054,600 0.42
BANK OF EAST ASIA LTD 5.5% PERP 29 DECEMBER 2049 8,153,000 8,242,765 0.34
BANK OF EAST ASIA LTD VAR 20 NOVEMBER 2024 13,500,000 13,737,600 0.57
BANK RAKYAT INDONESIA 2.95% 28 MARCH 2018 5,400,000 5,422,356 0.23
BAOXIN AUTO FINANCE I LTD 8.75% PERP 29 DECEMBER 2049 3,000,000 3,164,940 0.13
BARMINCO FINANCE PTY LTD 6.625% 15 MAY 2022 1,135,000 1,122,753 0.05
BDO UNIBANK INC 2.625% 24 OCTOBER 2021 10,000,000 9,927,100 0.41
BOC AVIATION LTD 3.875% 27 APRIL 2026 12,000,000 12,182,520 0.51
BRIGHT GALAXY INTERNATIONAL LTD 3.375% 3 NOVEMBER 2021 1,120,000 1,110,838 0.05
BUKIT MAKMUR MANDIRI UTAMA PT 7.75% 13 FEBUARY 2022 3,314,000 3,422,169 0.14
CAGAMAS GLOBAL 2.745% 10 DECEMBER 2019 3,182,000 3,208,315 0.13
CAPITALAND TREASURY LTD 4.076% 20 SEPTEMBER 2022 6,000,000 6,268,500 0.26
CCB LIFE INSURANCE CO LTD 4.5% 21 APRIL 2077 3,716,000 3,789,502 0.16
CCBL (CAYMAN) 1 CORPORATION LTD 2.375% 31 MAY 2019 6,000,000 5,980,200 0.25
CCBL CAYMAN CORP 3.25% 28 JULY 2020 4,060,000 4,096,702 0.17
CCCI TREASURE LTD VAR PERP 29 DECEMBER 2049 15,000,000 15,165,600 0.63

72
Portfolio Statement (Unaudited)
HSBCAsianBondFundas at 31 July 2017
HoldingsMarket
value
%ofnet
assetsUSD
BondsListed investments
CDBL FUNDING 2 3% 1 AUGUST 2022 3,569,000 3,555,331 0.15CDBL FUNDING 3.25%
2 DECEMBER 2019 10,000,000 10,127,800 0.42CDBL FUNDING 4.25% 2 DECEMBER
2024 15,000,000 15,688,650 0.65CGNPC INTERNATIONAL LTD 4%
19 MAY 2025 3,350,000 3,464,805 0.14CHALCO HONG KONG INVESTMENT
CO LTD 4.25% PERP 29 DECEMBER 2049 5,000,000 5,077,300 0.21
CHINA ADYUAN PROPERTY 10.875% 26 MAY 2018 1,150,000 1,209,260 0.05
CHINA AOYUAN PROPERTY GROUP LTD 6.35% 11 JANUARY 2020 1,308,000 1,339,157 0.06
CHINA AOYUAN PROPERTY GROUP LTD 6.525% 25 APRIL 2019 3,429,000 3,512,462 0.15
CHINA CINDA FINANCE (2017) I LTD 4.1% 9 MARCH 2024 9,000,000 9,189,360 0.38
CHINA CINDA FINANCE 2015 I LTD 4.25% 23 APRIL 2025 5,000,000 5,099,100 0.21
CHINA CITIC BANK INTERNATIONAL LTD 3.875% 28 SEPTEMBER 2022 4,000,000 4,005,600 0.17
CHINA CITIC BANK INTERNATIONAL LTD 6% 07 MAY 2024 7,101,000 7,433,895 0.31
CHINA CLEAN ENERGY DEVELOPMENT LTD 4% 05 NOVEMBER 2025 12,000,000 12,358,920 0.52
CHINA CONSTRUCTION BANK ASIA CORP LTD 4.25% 20 AUGUST 2024 22,000,000 22,559,900 0.94
CHINA CONSTRUCTION BANK FRN 13 MAY 2025 18,000,000 18,384,480 0.77
CHINA EVERGRANDE GROUP 7.5% 28 JUNE 2023 5,105,000 5,040,422 0.21
CHINA LIFE INSURANCE CO VAR 3 JULY 2075 12,756,000 12,986,373 0.54
CHINA LIFE INSURANCE OVERSEAS COMPANY LTD (HONG KONG BRANCH) 3.35% 27 JULY 2027 2,302,000 2,307,525 0.10
CHINA MERCHANTS LAND LTD 4.021% 11 DECEMBER 2018 9,500,000 9,697,220 0.40
CHINA OIL AND GAS GROUP 5% 7 MAY 2020 6,000,000 6,143,700 0.26
HoldingsMarket
value
%ofnet
assetsUSD
CHINA OVERSEAS FINANCE CAYMAN LTD 5.375% 29 OCTOBER 2023 6,000,000 6,679,380 0.28
CHINA OVERSEAS FINANCE CAYMAN LTD 5.5% 10 NOVEMBER 2020 8,000,000 8,685,520 0.36
CHINA OVERSEAS FINANCE CAYMAN V LTD 3.95% 15 NOVEMBER 2022 3,182,000 3,310,139 0.14
CHINA RAILWAY XUNJIE CO LTD 3.25% 28 JULY 2026 5,500,000 5,371,300 0.22
CHINA REINSURANCE FINANCE CORPORATION LTD 3.375% 9 MARCH 2022 3,600,000 3,572,532 0.15
CHINA RESOURCES GAS GROUP LTD 4.5% 05 APRIL 2022 6,000,000 6,380,520 0.27
CHINA RESOURCES LAND 4.375% 27 FEBRUARY 2019 5,000,000 5,149,800 0.21
CHINA TAIPING CAPITAL LTD 4.125% 21 NOVEMBER 2022 11,000,000 11,423,830 0.48
CHINA TAIPING INSURANCE VAR PERP 29 SEPTEMBER 2049 2,698,000 2,813,528 0.12
CHINA, PEOPLE’S REPUBLIC OF (GOVERNMENT) 3.16% 27 JUNE 2023 20,000,000 2,871,168 0.12
CHINA, PEOPLE’S REPUBLIC OF (GOVERNMENT) 3.99% 26 JUNE 2020 30,000,000 4,500,512 0.19
CHINA, PEOPLE’S REPUBLIC OF (GOVERNMENT) 4.1% 26 JUNE 2022 30,000,000 4,509,508 0.19
CHINALCO FINANCE 3.625% 11 DECEMBER 2019 12,500,000 12,727,000 0.53
CHONG HING BANK LTD 3.876% 26 JULY 2027 2,599,000 2,607,005 0.11
CIFI HOLDINGS GROUP 7.75% 5 JUNE 2020 3,000,000 3,202,950 0.13
CITIC LTD 2.8% 14 DECEMBER 2021 5,000,000 4,972,000 0.21CITIC LTD 3.7% 14 JUNE 2026 3,000,000 2,994,330 0.12CITIC LTD 3.875% 28 February 2027 3,000,000 3,023,400 0.13CITIC PACIFIC LTD 6.625% 15 APRIL
2021 5,000,000 5,643,900 0.24CITIC PACIFIC LTD 6.8% 17 JANUARY
2023 12,000,000 14,099,280 0.59CITIC PACIFIC LTD 6.875%
21 JANUARY 2018 3,000,000 3,068,130 0.13

73
Portfolio Statement (Unaudited)
HSBCAsianBondFundas at 31 July 2017
HoldingsMarket
value
%ofnet
assetsUSD
BondsListed investments
CITIC PACIFIC LTD VAR PERP 29 MAY 2049 2,690,000 2,880,829 0.12
CITIC SEC FINANCE 2013 2.5% 3 MAY 2018 3,000,000 3,001,680 0.12
CITIC SECURITIES FINANCE MTN CO LTD 3.25% 20 APRIL 2022 6,604,000 6,625,133 0.28
CK HUTCHISON CAPITAL SECURITIES (17) LTD 4% 12 NOVEMBER 2065 3,566,000 3,629,332 0.15
CLP POWER HK FINANCE LTD VAR PERP 29 MAY 2049 10,000,000 10,294,100 0.43
CNAC HK FINBRIDGE CO LTD 3.5% 19 JULY 2022 8,000,000 8,053,120 0.34
CNOOC CURTIS FUNDING NO.1 4.5% 03 OCTOBER 2023 16,000,000 17,219,680 0.72
CNOOC FINANCE 2012 LTD 3.875% 02 MAY 2022 10,000,000 10,454,900 0.44
CNOOC FINANCE 2012 LTD 5% 02 MAY 2042 3,500,000 3,882,795 0.16
CNOOC FINANCE 2013 LTD 4.25% 09 MAY 2043 5,000,000 4,980,250 0.21
CNOOC FINANCE 2014 ULC 4.25% 30 APRIL 2024 14,000,000 14,786,240 0.62
CNOOC FINANCE 2015 AUSTRALIA PTY LTD 2.625% 05 MAY 2020 12,000,000 12,068,520 0.50
CNOOC FINANCE 2015 USA LLC 3.5% 05 MAY 2025 8,000,000 8,038,640 0.34
CNPC GENERAL CAPITAL LTD 3.95% 19 APRIL 2022 5,000,000 5,268,150 0.22
CNPC HK OVERSEAS CAPITAL LTD 4.5% 28 APRIL 2021 5,000,000 5,331,450 0.22
CNPC HK OVERSEAS CAPITAL LTD 5.95% 28 APRIL 2041 7,000,000 8,797,180 0.37
CNRC CAPITALE LTD 3.9% PERP 31 DECEMBER 2049 6,000,000 6,053,820 0.25
COMMONWEALTH BANK AUST VAR 11 MARCH 2025 15,000,000 2,274,905 0.09
COMMONWEALTH BANK OF AUSTRALIA 3.375% 20 OCTOBER 2026 5,000,000 5,005,050 0.21
COSCO FINANCE CO LTD 4% 3 DECEMBER 2022 22,000,000 22,982,080 0.96
HoldingsMarket
value
%ofnet
assetsUSD
COSCO PACIFIC FINANCE 2013 CO LTD 4.375% 31 JANUARY 2023 1,455,000 1,497,777 0.06
COUNTRY GARDEN HOLDINGS CO 7.5% 9 MARCH 2020 5,000,000 5,296,200 0.22
COUNTRY GARDEN HOLDINGS CO LTD 7.25% 04 APRIL 2021 8,000,000 8,329,600 0.35
COUNTRY GARDEN HOLDINGS CO LTD 7.5% 10 JANUARY 2023 2,000,000 2,103,780 0.09
CSCEC FINANCE CAYMAN I LTD 2.95% 19 NOVEMBER 2020 6,000,000 6,058,320 0.25
DAH SING BANK LTD 6.625% 11 FEBRUARY 2020 6,125,000 6,643,175 0.28
DAI-ICHI LIFE INSURANCE CO LTD 4% PERP 29 DECEMBER 2049 3,000,000 3,002,820 0.12
DAI-ICHI MUTUAL LIFE VAR PERP 29 OCTOBER 2049 6,000,000 6,445,080 0.27
DBS BANK LTD 3.625% 21 SEPTEMBER 2022 10,000,000 10,021,300 0.42
DBS GROUP HOLDINGS LTD 3.6% PERP 29 DECEMBER 2049 5,000,000 5,008,050 0.21
DOOSAN INFRACORE CO LTD 2.375% 21 NOVEMBER 2019 10,000,000 9,988,900 0.42
DOOSAN INFRACORE CO LTD VAR 5 OCTOBER 2042 6,250,000 6,255,875 0.26
DOOSAN POWER SYSTEMS S.A 2.5% 03 DECEMBER 2045 10,000,000 9,989,700 0.42
DORSETT HOSPITALITY INTERNATIONAL 6% 3 APRIL 2018 29,000,000 4,323,590 0.18
ENN ENERGY HOLDINGS LTD 3.25% 24 JULY 2022 5,955,000 5,965,123 0.25
EXPORT IMPORT BANK OF INDIA 3.875% 02 OCTOBER 2019 6,000,000 6,172,800 0.26
EXPORT IMPORT BANK OF INDIA 4% 14 JANUARY 2023 8,000,000 8,396,160 0.35
EXPORT-IMPORT BANK INDIA 2.75% 01 APRIL 2020 8,000,000 8,019,840 0.33
EXPORT-IMPORT BANK KOREA 5.125% 29 JUNE 2020 8,000,000 8,618,160 0.36
EXPORT-IMPORT BANK OF CHINA 4.37% 15 MAY 2020 10,000,000 1,497,692 0.06
EXPORT-IMPORT BANK OF KOREA 2.125% 11 FEBRUARY 2021 5,000,000 4,936,300 0.21
EXPORT-IMPORT BANK OF MALAYSIA BHD 2.48% 20 OCTOBER 2021 7,582,000 7,549,473 0.31

74
Portfolio Statement (Unaudited)
HSBCAsianBondFundas at 31 July 2017
HoldingsMarket
value
%ofnet
assetsUSD
BondsListed investments
FIRST GEN CORPORATION 6.5% 09 OCTOBER 2023 3,800,000 4,078,616 0.17
FITA INTERNATIONAL LTD 7% 10 FEBRUARY 2020 13,000,000 14,256,190 0.59
FRANSHION BRILLIANT LTD 5.75% 19 MARCH 2019 10,000,000 10,474,100 0.44
FRANSHION DEVELOPMENT LTD 6.75% 15 APRIL 2021 6,000,000 6,709,560 0.28
FUKOKU MUTUAL LIFE VAR PERP 28 JULY 2049 5,000,000 5,263,050 0.22
FWD LTD 6.25% PERP 29 DECEMBER 2049 1,577,000 1,659,461 0.07
GLOBAL LOGISTIC PROP 3.875% 4 JUNE 2025 7,620,000 7,316,724 0.31
GOHL CAPITAL LTD 4.25% 24 JANUARY 2027 8,690,000 8,991,195 0.37
GOLDWIND NEW ENERGY HK 2.5% 24 JULY 2018 2,693,000 2,690,657 0.11
GREENKO DUTCH BV 8% 01 AUGUST 2019 3,000,000 3,127,710 0.13
GREENLAND HONG KONG HOLDINGS LTD 3.875% 28 JULY 2019 4,686,000 4,620,396 0.19
GS CALTEX CORP 3% 12 JUNE 2022 1,739,000 1,743,243 0.07GUOTAI JUNAN FINANCIAL HOLDINGS
3.625% 22 MAY 2019 8,000,000 8,127,200 0.34HAITONG INTERNATIONAL FINANCE
2015 3.5% 21 APRIL 2020 6,000,000 6,070,800 0.25HAITONG INTERNATIONAL FINANCE
3.95% 29 OCTOBER 2018 10,000,000 10,184,800 0.42HANG LUNG PROPERTIES FINANCE
4.75% 25 JUNE 2022 8,300,000 8,900,505 0.37HENGJIAN INTERNATIONAL
INVESTMENT LTD 2.75% 11 JULY 2020 3,090,000 3,092,843 0.13
HESTEEL HONG KONG CO LTD 4.25% 7 APRIL 2020 3,389,000 3,380,290 0.14
HINDUSTAN PETROLEUM CORP LTD 4% 12 JULY 2027 3,200,000 3,221,312 0.13
HKT CAPITAL NO 2 LTD 3.625% 02 APRIL 2025 11,000,000 11,118,800 0.46
HONGKONG LAND FINANCE (CAYMAN ISLANDS) CO LTD 4.625% 16 JANUARY 2024 5,000,000 5,472,950 0.23
HoldingsMarket
value
%ofnet
assetsUSD
HOUSING DEVELOPMENT FINANCE CORP 8.5% 15 MAY 2018 225,000,000 3,544,623 0.15
HOUSING DEVELOPMENT FINANCE CORP 9.05% 4 FEBRUARY 2018 125,000,000 1,968,124 0.08
HOUSING DEVELOPMENT FINANCE CORPORATION LTD 6.875% 30 APRIL 2020 200,000,000 3,114,154 0.13
HOUSING DEVELOPMENT FINANCE CORPORATION LTD 7.875% 21 AUGUST 2019 250,000,000 3,974,694 0.17
HPCL-MITTAL ENERGY LTD 5.25% 28 APRIL 2027 6,025,000 6,272,989 0.26
HUARONG FINANCE 2017 CO LTD 3.16667% 27 APRIL 2022 2,000,000 2,047,620 0.09
HUARONG FINANCE 2017 CO LTD 3.75% 27 APRIL 2022 2,400,000 2,442,024 0.10
HUARONG FINANCE CO LTD 4% 17 JULY 2019 4,000,000 4,080,080 0.17
HUARONG FINANCE II CO LTD 2.875% 22 NOVEMBER 2019 5,000,000 4,989,050 0.21
HUARONG FINANCE II CO LTD 3.25% 03 JUNE 2021 3,000,000 3,000,690 0.12
HUARONG FINANCE II CO LTD 4.875% 22 NOVEMBER 2026 3,000,000 3,130,680 0.13
HUARONG FINANCE II CO LTD 5% 19 NOVEMBER 2025 7,000,000 7,353,430 0.31
HUARONG FINANCE II CO LTD 5.5% 16 JANUARY 2025 5,000,000 5,400,650 0.23
HUATAI INTERNATIONAL 3.625% 08 OCTOBER 2019 4,690,000 4,775,780 0.20
HUTCHISON WHAMPOA INTERNATIONAL 11 LTD 4.625% 13 JANUARY 2022 3,000,000 3,247,260 0.14
HUTCHISON WHAMPOA INTERNATIONAL 14 LTD 3.625% 31 OCTOBER 2024 5,000,000 5,189,900 0.22
HUTCHISON WHAMPOA INTERNATIONAL LTD 5.75% 11 SEPTEMBER 2019 11,000,000 11,802,120 0.49
HUTCHISON WHAMPOA INTERNATIONAL LTD 7.45% 24 NOVEMBER 2033 3,750,000 5,265,638 0.22
HYUNDAI CAPITAL AMERICA 2.75% 27 SEPTEMBER 2026 6,500,000 6,034,340 0.25

75
Portfolio Statement (Unaudited)
HSBCAsianBondFundas at 31 July 2017
HoldingsMarket
value
%ofnet
assetsUSD
BondsListed investments
HYUNDAI CAPITAL AMERICA 3% 30 OCTOBER 2020 7,000,000 7,095,480 0.30
HYUNDAI CAPITAL SERVICES INC 2.875% 16 MARCH 2021 8,000,000 8,035,920 0.34
ICBCIL FINANCE CO LTD 2.75% 19 MAY 2021 6,000,000 5,947,080 0.25
ICBCIL FINANCE CO LTD 3.2% 10 NOVEMBER 2020 13,000,000 13,172,510 0.55
ICBCIL FINANCE CO LTD 3.25% 17 MARCH 2020 3,000,000 3,037,830 0.13
ICBCIL FINANCE CO LTD 3.625% 19 MAY 2026 4,000,000 3,992,400 0.17
ICICI BANK LTD (DUBAI BRANCH) 3.25% 09 SEPTEMBER 2022 6,000,000 6,031,500 0.25
ICICI BANK LTD (DUBAI BRANCH) 4% 18 MARCH 2026 13,000,000 13,251,940 0.55
ICICI BANK LTD 5.75% 16 NOVEMBER 2020 10,000,000 10,923,400 0.46
IDBI BANK LTD (DIFC DUBAI BRANCH) 4.25% 30 NOVEMBER 2020 6,000,000 6,057,900 0.25
IDBI BANK LTD (DIFC DUBAI BRANCH) 5% 25 SEPTEMBER 2019 2,840,000 2,918,327 0.12
INDIAN OIL CORP LTD 5.75% 01 AUGUST 2023 15,000,000 16,971,600 0.71
INDIAN RAILWAY FINANCE CORP 3.917% 26 FEBRUARY 2019 1,818,000 1,860,578 0.08
INDONESIA (REPUBLIC OF) 11.625% 04 MARCH 2019 14,550,000 16,760,436 0.70
INDONESIA (REPUBLIC OF) 3.375% 15 APRIL 2023 8,000,000 8,075,200 0.34
INDONESIA (REPUBLIC OF) 3.75% 25 APRIL 2022 15,000,000 15,533,700 0.65
INDONESIA (REPUBLIC OF) 4.875% 05 MAY 2021 7,000,000 7,535,220 0.31
INDONESIA (REPUBLIC OF) 5.25% 17 JANUARY 2042 7,450,000 8,188,220 0.34
INDONESIA (REPUBLIC OF) 5.875% 13 MARCH 2020 5,000,000 5,467,150 0.23
INDONESIA (REPUBLIC OF) 6.625% 17 FEBRUARY 2037 4,000,000 5,059,920 0.21
INDONESIA (REPUBLIC OF) 7.75% 17 JANUARY 2038 17,000,000 24,056,530 1.00
HoldingsMarket
value
%ofnet
assetsUSD
INDONESIA (REPUBLIC OF) 8.5% 12 OCTOBER 2035 15,000,000 22,033,200 0.92
INDONESIA, REPUBLIC OF (GOVERNMENT) 3.7% 08 JANUARY 2022 900,000 931,995 0.04
INDONESIA, REPUBLIC OF (GOVERNMENT) 7.875% 15 APRIL 2019 140,000,000,000 10,747,428 0.45
INDUSTRIAL AND COMMERCIAL BANK OF CHINA ASIA LTD 4.25% PERP 29 DECEMBER 2049 7,773,000 7,748,748 0.32
INDUSTRIAL AND COMMERCIAL BANK OF CHINA ASIA LTD 5.125% 30 NOVEMBER 2020 7,099,000 7,599,054 0.32
INDUSTRIAL AND COMMERCIAL BANK OF CHINA LTD (NEW YORK BRANCH) 2.452% 20 OCTOBER 2021 7,909,000 7,812,352 0.33
INDUSTRIAL AND COMMERCIAL BANK OF CHINA LTD (HONG KONG BRANCH) 2.875% 21 FEBBUARY 2022 4,286,000 4,295,472 0.18
INDUSTRIAL AND COMMERCIAL BANK OF CHINA LTD 4.875% 21 SEPTEMBER 2025 12,000,000 12,900,720 0.54
INDUSTRIAL BANK OF KOREA 3.9% PERP 29 DECEMBER 2049 2,763,000 2,760,237 0.11
JABABEKA INTERNATIONAL BV 6.5% 05 OCTOBER 2023 3,454,000 3,587,117 0.15
KASIKORNBANK PCL (HONG KONG BRANCH) 2.375% 6 APRIL 2022 5,056,000 4,963,576 0.21
KEB HANA BANK 4.05% 30 JULY 2018 7,000,000 1,038,939 0.04KEB HANA BANK 4.625% 24 OCTOBER
2023 2,900,000 3,059,732 0.13KOREA DEVELOPMENT BANK 2.5%
13 JANUARY 2021 8,000,000 7,994,240 0.33KOREA DEVELOPMENT BANK 4.1%
24 AUGUST 2018 9,000,000 1,335,645 0.06KOREA ELECTRIC POWER CORP
5.125% 23 APRIL 2034 10,250,000 11,954,062 0.50KOREA EXCHANGE BANK 4.25%
14 OCTOBER 2024 9,250,000 9,596,042 0.40KOREA FINANCE CORP 4.625%
16 NOVEMBER 2021 8,500,000 9,194,535 0.38KOREA HYDRO & NUCLEAR P 2.375%
28 OCTOBER 2019 4,889,000 4,893,693 0.20

76
Portfolio Statement (Unaudited)
HSBCAsianBondFundas at 31 July 2017
HoldingsMarket
value
%ofnet
assetsUSD
BondsListed investments
KOREA NATIONAL OIL CORP 2.125% 14 APRIL 2021 6,000,000 5,901,240 0.25
KOREA NATIONAL OIL CORP 2.75% 23 JANUARY 2019 5,000,000 5,037,600 0.21
KOREAN AIR LINES CO LTD 2.5% 25 NOVEMBER 2045 8,850,000 8,839,911 0.37
KRUNG THAI BANK PCL/CAYMAN VAR 26 DECEMBER 2024 5,935,000 6,169,195 0.26
KT CORP 2.625% 22 APRIL 2019 2,500,000 2,515,125 0.10KWG PROPERTY HOLDING LTD 8.25%
05 AUGUST 2019 2,000,000 2,086,320 0.09KWG PROPERTY HOLDINGS LTD
8.975% 14 JANUARY 2019 2,500,000 2,606,525 0.11KYOBO LIFE INSURANCE CO LTD
3.95% 24 JULY 2047 1,750,000 1,760,903 0.07LAI FUNG HOLDINGS LTD 6.875%
25 APRIL 2018 15,120,000 2,256,093 0.09LAI SUN INTERNATIONAL FINANCE
5.7% 18 JANUARY 2018 2,911,000 2,941,595 0.12LAI SUN GARMENT INTERNATIONAL
FINANCE 7.7% 24 JULY 2018 7,570,000 1,149,597 0.05LEMBAGA PEMBIAYAAN EKSPOR
INDONESIA 3.875% 06 APRIL 2024 1,111,000 1,132,109 0.05LIC HOUSING FINANCE LTD 8.72%
28 NOVEMBER 2019 300,000,000 4,828,659 0.20LOGAN PROPERTY HOLDINGS 9.75%
08 DECEMBER 2017 3,000,000 3,061,860 0.13LONGFOR PROPERTIES CO LTD 6.75%
29 JANUARY 2023 13,000,000 13,677,430 0.57LTC GB LTD 2.75% 26 MAY 2021 5,000,000 4,976,350 0.21MAJAPAHIT HOLDINGS 7.75%
20 JANUARY 2020 5,000,000 5,620,600 0.23MAJAPAHIT HOLDINGS BV 7.875%
29 JUNE 2037 8,000,000 10,553,440 0.44MAJAPAHIT HOLDINGS BV 8%
07 AUGUST 2019 4,000,000 4,455,480 0.19MALAYAN BANKING BHD VAR
20 SEPTEMBER 2022 6,000,000 6,006,600 0.25MARBLE II PTE LTD 5.3% 20 JUNE
2022 5,289,000 5,359,714 0.22MARQUEE LAND PTE LTD 9.75%
05 AUGUST 2019 726,000 765,095 0.03
HoldingsMarket
value
%ofnet
assetsUSD
MELCO RESORTS FINANCE LTD 4.875% 06 JUNE 2025 7,855,000 7,857,906 0.33
MELCO RESORTS FINANCE LTD 4.875% 06 JUNE 2025 1,532,000 1,533,762 0.06
MITRA PINASTHIKA MUSTIKA 6.75% 19 SEPTEMBER 2019 3,000,000 3,113,820 0.13
MODERNLAND OVERSEAS PTE LTD 6.95% 13 APRIL 2024 2,520,000 2,511,810 0.10
MONGOLIA (GOVERNMENT) 8.75% 09 MARCH 2024 2,000,000 2,243,240 0.09
MONGOLIA GOVERNMENT INTERNATIONAL BOND 5.125% 05 DECEMBER 2022 3,000,000 2,891,790 0.12
MOON WISE GLOBAL LTD 9% PERP 29 JANUARY 2049 5,000,000 5,321,100 0.22
NATIONAL HIGHWAYS AUTHORITY OF INDIA 7.3% 18 MAY 2022 200,000,000 3,172,768 0.13
NATIONAL SAVINGS BANK 5.15% 10 SEPTEMBER 2019 2,000,000 2,039,960 0.08
NEW WORLD CHINA LAND LTD 5.5% 6 FEBRUARY 2018 51,500,000 7,697,212 0.32
NEXEN ENERGY ULC 5.875% 10 MARCH 2035 10,000,000 11,906,400 0.50
NTPC LTD 4.25% 26 FEBRUARY 2026 8,000,000 8,301,680 0.35NTPC LTD 4.75% 03 OCTOBER 2022 4,400,000 4,737,392 0.20NTPC LTD 5.625% 14 JULY 2021 5,000,000 5,511,100 0.23NWD FINANCE (BVI) LTD 5.75% PERP
29 DECEMBER 2049 3,700,000 3,707,215 0.15NWD MTN LTD 4.375% 30 NOVEMBER
2022 17,500,000 18,346,125 0.77NWD MTN LTD 5.25% 26 FEBRUARY
2021 5,000,000 5,343,550 0.22OIL INDIA INTERNATIONAL PTE LTD
4% 21 APRIL 2027 7,820,000 7,874,036 0.33ONGC VIDESH LTD 3.25% 15 JULY
2019 11,000,000 11,157,630 0.47ONGC VIDESH LTD 4.625% 15 JULY
2024 5,000,000 5,336,050 0.22OVERSEA-CHINESE BANKING VAR
15 OCTOBER 2024 24,000,000 24,633,360 1.03PAKUWON PRIMA PTE LTD 5%
14 FEBUARY 2024 7,604,000 7,637,990 0.32PB INTERNATIONAL BV 7.625%
26 JANUARY 2022 4,000,000 4,181,080 0.17

77
Portfolio Statement (Unaudited)
HSBCAsianBondFundas at 31 July 2017
HoldingsMarket
value
%ofnet
assetsUSD
BondsListed investments
PCCW-HKT CAPITAL NO.5 LTD 3.75% 08 MARCH 2023 6,000,000 6,229,380 0.26
PELABUHAN INDONESIA II (PERSERO) PT 5.375% 5 MAY 2045 2,000,000 2,051,200 0.09
PERTAMINA 5.25% 23 MAY 2021 18,000,000 19,495,980 0.81PERTAMINA PERSERO PT 4.3%
20 MAY 2023 5,000,000 5,217,750 0.22PERTAMINA PERSERO PT 6% 03 MAY
2042 16,500,000 18,253,785 0.76PERTAMINA PERSERO PT 6.45%
30 MAY 2044 13,000,000 15,165,020 0.63PERUSAHAAN GAS NEGARA 5.125%
16 MAY 2024 12,000,000 12,990,480 0.54PERUSAHAAN LISTRIK NEGAR 5.25%
24 OCTOBER 2042 6,000,000 6,131,520 0.26PERUSAHAAN PENERBIT SBSN 4%
21 NOVEMBER 2018 5,000,000 5,133,700 0.21PETRON CORP VAR PERP
30 DECEMBER 2048 2,130,000 2,222,123 0.09PETRONAS CAPITAL LTD 4.5%
18 MARCH 2045 3,000,000 3,259,980 0.14PETRONAS CAPITAL LTD 5.25%
12 AUGUST 2019 2,000,000 2,122,220 0.09PETRONAS CAPITAL LTD 7.875%
22 MAY 2022 7,000,000 8,665,720 0.36PHILIPPINES (REPUBLIC OF) 10.625%
16 MARCH 2025 10,750,000 16,520,492 0.69PHILIPPINES (REPUBLIC OF) 3.95%
20 JANUARY 2040 10,000,000 10,446,400 0.44PHILIPPINES (REPUBLIC OF) 5%
13 JANUARY 2037 7,000,000 8,303,470 0.35PHILIPPINES (REPUBLIC OF) 6.375%
15 JANUARY 2032 5,000,000 6,587,850 0.27PHILIPPINES (REPUBLIC OF) 6.375%
23 OCTOBER 2034 13,000,000 17,499,690 0.73PHILIPPINES (REPUBLIC OF) 7.75%
14 JANUARY 2031 4,000,000 5,796,720 0.24POWER GRID CORP OF INDIA 8.8%
13 MARCH 2023 200,000,000 3,351,057 0.14POWER SECTOR ASSETS 7.25%
27 MAY 2019 8,000,000 8,746,160 0.36
HoldingsMarket
value
%ofnet
assetsUSD
POWER SECTOR ASSETS 7.39% 02 DECEMBER 2024 12,000,000 15,457,080 0.64
PRATAMA AGUNG PTE LTD 6.25% 24 FEBRUARY 2020 8,000,000 8,365,200 0.35
PROVEN GLORY CAPITAL LTD 3.25% 21 FEBUARY 2022 13,000,000 13,099,970 0.55
PROVEN HONOUR CAP 4.125% 06 MAY 2026 4,846,000 4,969,864 0.21
PROVEN HONOUR CAP 4.125% 19 MAY 2025 20,000,000 20,650,000 0.86
PT PELABUHAN INDO II 4.25% 5 MAY 2025 4,000,000 4,087,480 0.17
PTT EXPLOR & PRODUCT PCL VAR PERP 29 DECEMBER 2049 1,739,000 1,774,910 0.07
PTT PCL 3.375% 25 OCTOBER 2022 6,549,000 6,706,241 0.28PTTEP CANADA INTERNATIONAL
FINANCE LTD 5.692% 05 APRIL 2021 2,000,000 2,208,240 0.09PTTEP TREASURY CENTER CO LTD
4.6% PERP 29 DECEMBER 2049 8,000,000 8,151,440 0.34RADIANT ACCESS LTD 4.6% PERP
29 DECEMBER 2049 5,000,000 4,876,300 0.20RELIANCE HOLDINGS USA INC 5.4%
14 FEBRUARY 2022 11,525,000 12,671,507 0.53RELIANCE HOLDINGS USA INC 6.25%
19 OCTOBER 2040 8,500,000 10,506,170 0.44RELIANCE INDUSTRIES LTD 5.875%
PERP 28 FEBRUARY 2049 3,000,000 3,046,500 0.13REPUBLIC OF INDONESIA
(GOVERNMENT) 4.75% 08 JANUARY 2026 10,000,000 10,813,100 0.45
REPUBLIC OF INDONESIA (GOVERNMENT) 5.125% 15 JANUARY 2045 18,000,000 19,574,640 0.82
REPUBLIC OF INDONESIA (GOVERNMENT) 5.875% 15 JANUARY 2024 10,000,000 11,460,600 0.48
REPUBLIC OF INDONESIA (GOVERNMENT) 5.95% 08 JANUARY 2046 12,000,000 14,495,520 0.60
RKI OVERSEAS FINANCE 2016 (B) LTD 4.7% 6 SEPTEMBER 2021 4,000,000 3,922,880 0.16
RKP OVERSEAS FINANCE 2016 A LTD 7.95% 17 FEBUARY 2022 1,692,000 1,746,178 0.07
RONGSHI INTERNATIONAL FINANCE LTD 2.875 04 May 2022 6,000,000 6,006,840 0.25

78
Portfolio Statement (Unaudited)
HSBCAsianBondFundas at 31 July 2017
HoldingsMarket
value
%ofnet
assetsUSD
BondsListed investments
ROYAL CAPITAL BV 4.875% PERP 29 DECEMBER 2049 4,000,000 4,021,920 0.17
ROYAL CAPITAL BV 5.5% PERP 29 DECEMBER 2049 5,000,000 5,267,000 0.22
RURAL ELECTRIFICATION CORP LTD 3.875% 7 JULY 2027 4,706,000 4,710,471 0.20
SAKA ENERGI INDONESIA PT 4.45% 5 MAY 2024 8,000,000 8,154,400 0.34
SHENHUA OVERSEAS CAPITAL 3.125% 20 JANUARY 2020 8,000,000 8,096,560 0.34
SHENZHEN QIANHAI FI 4.55% 28 OCTOBER 2017 3,000,000 446,213 0.02
SHINHAN BANK 3.875% 24 MARCH 2026 12,000,000 12,124,200 0.51
SHINHAN BANK 3.875% 7 DECEMBER 2026 8,636,000 8,842,487 0.37
SHINSEGAE CO LTD VAR 08 MAY 2045 9,750,000 9,622,860 0.40SIAM COMMERCIAL BANK CAY 3.5%
7 APRIL 2019 5,333,000 5,436,514 0.23SIAM COMMERCIAL BANK PUBLIC
COMPANY LIMITED (CAYMAN ISLANDS BRANCH) 3.2% 26 JULY 2022 5,000,000 5,089,200 0.21
SINOCHEM CORP VAR PERP 29 DECEMBER 2049 3,200,000 3,280,928 0.14
SINOPEC CAPITAL 2013 3.125% 24 APRIL 2023 11,990,000 11,997,074 0.50
SINOPEC CAPITAL 2013 4.25% 24 APRIL 2043 5,000,000 5,028,950 0.21
SINOPEC GROUP OVERSEAS DEVELOPMENT 2012 3.9% 17 MAY 2022 5,000,000 5,248,000 0.22
SINOPEC GROUP OVERSEAS DEVELOPMENT 2015 3.25% 28 APRIL 2025 8,000,000 7,972,240 0.33
SINOPEC GROUP OVERSEAS DEVELOPMENT 2016 LTD 2% 29 SEPTEMBER 2021 7,000,000 6,838,790 0.29
SINOPEC GROUP OVERSEAS DEVELOPMENT 2016 LTD 2.75% 29 SEPTEMBER 2026 10,000,000 9,415,400 0.39
HoldingsMarket
value
%ofnet
assetsUSD
SINOPEC GROUP OVERSEAS DEVELOPMENT 4.875% 17 MAY 2042 7,165,000 7,885,799 0.33
SINOSTRONG INTERNATIONAL 4% 28 MAY 2018 8,820,000 1,308,945 0.05
SKYSEA INTERNATIONAL CAPITAL MANAGEMENT 4.875% 07 DECEMBER 2021 12,000,000 13,016,880 0.54
SM INVESTMENTS CORP 4.25% 17 OCTOBER 2019 3,750,000 3,881,250 0.16
SM INVESTMENTS CORP 4.875% 10 JUNE 2024 3,500,000 3,680,950 0.15
SRI LANKA, DEMOCRATIC SOCIALIST REPUBLIC OF (GOVERNMENT) 5.75% 18 JANUARY 2022 1,062,000 1,112,976 0.05
SRI LANKA, DEMOCRATIC SOCIALIST REPUBLIC OF (GOVERNMENT) 6% 14 JANUARY 2019 2,000,000 2,071,580 0.09
SRI LANKA, DEMOCRATIC SOCIALIST REPUBLIC OF (GOVERNMENT) 6.25% 11 MAY 2027 647,000 668,306 0.03
SSG RESOURCES LTD 4.25% 04 OCTOBER 2022 6,400,000 6,742,400 0.28STATE BANK OF INDIA/LONDON
3.622% 17 APRIL 2019 5,000,000 5,096,550 0.21STATE GRID OVERSEAS INVESTMENT
(2016) LTD 2.125% 18 MAY 2021 6,000,000 5,908,020 0.25STATE GRID OVERSEAS INVESTMENT
(2016) LTD 2.75% 04 MAY 2022 3,000,000 3,002,700 0.12STATE GRID OVERSEAS INVESTMENT
(2016) LTD 4% 04 MAY 2047 3,000,000 3,009,630 0.13STATE GRID OVERSEAS INVESTMENT
4.85% 07 MAY 2044 12,000,000 13,783,680 0.57STUDIO CITY CO LTD 7.25%
30 NOVEMBER 2021 8,000,000 8,612,480 0.36STUDIO CITY FINANCE LTD 8.5%
01 DECEMBER 2020 2,500,000 2,587,475 0.11SUN HUNG KAI PROPERTIES (CAPITAL
MARKET) LTD 4.45% PERP 29 DECEMBER 2049 2,000,000 1,975,960 0.08
SUN HUNG KAI PROPERTIES CAPITAL 4.5% 14 FEBRUARY 2022 12,898,000 13,939,127 0.58
SWIRE PROPERTIES MTN FINANCING LTD 3.625% 13 JANUARY 2026 8,000,000 8,167,360 0.34

79
Portfolio Statement (Unaudited)
HSBCAsianBondFundas at 31 July 2017
HoldingsMarket
value
%ofnet
assetsUSD
BondsListed investments
TATA MOTORS LTD 4.625% 30 APRIL 2020 1,000,000 1,037,440 0.04
TATA MOTORS LTD 5.75% 30 OCTOBER 2024 3,000,000 3,292,110 0.14
TELEKOM MALAYSIA BERHAD 7.875% 01 AUGUST 2025 2,000,000 2,586,220 0.11
TENCENT HOLDINGS LTD 2.875% 11 FEBRUARY 2020 10,000,000 10,168,000 0.42
THAI OIL PCL 3.625% 23 JANUARY 2023 5,000,000 5,167,500 0.22
TIMES PROPERTY HOLDINGS LTD 5.75% 26 APRIL 2022 1,840,000 1,806,438 0.08
TIMES PROPERTY HOLDINGS LTD 6.25% 23 JANUARY 2020 867,000 879,615 0.04
TOWNGAS FINANCE LTD VAR PERP 29 JANUARY 2049 2,500,000 2,576,850 0.11
UNITED OVERSEAS BANK LTD 2.875% 17 OCTOBER 2022 5,000,000 5,008,300 0.21
UNITED OVERSEAS BANK LTD 2.88% 08 MARCH 2027 3,047,000 3,021,558 0.13
UNITED OVERSEAS BANK LTD 3.5% 16 SEPTEMBER 2026 7,000,000 7,138,810 0.30
UNITED OVERSEAS BANK LTD VAR 19 SEPTEMBER 2024 13,000,000 13,280,150 0.55
VANKE REAL ESTATE HONG KONG CO LTD 3.95% 23 DECEMBER 2019 2,486,000 2,548,697 0.11
VEDANTA RESOURCES PLC 7.125% 31 MAY 2023 4,841,000 5,115,388 0.21
VEDANTA RESOURCES PLC 8.25% 07 JUNE 2021 4,000,000 4,472,800 0.19
WANT WANT CHINA FINANCE LTD 2.875% 27 APRIL 2022 3,498,000 3,506,325 0.15
WEST CHINA CEMENT LTD 6.5% 11 SEPTEMBER 2019 3,000,000 3,100,290 0.13
WHEELOCK FINANCE LTD 3% 19 MARCH 2018 6,700,000 6,737,654 0.28
WISDOM GLORY GROUP LTD 5.25% PERP 29 DECEMBER 2049 1,309,000 1,325,729 0.06
WOORI BANK 2.625% 22 JULY 2020 10,000,000 10,015,600 0.42WOORI BANK 4.75% 30 APRIL 2024 15,000,000 15,747,450 0.66WOORI BANK 5.25% PERP 29 MAY
2049 2,000,000 2,048,120 0.09
HoldingsMarket
value
%ofnet
assetsUSD
WYNN MACAU LTD 5.25% 15 OCTOBER 2021 5,000,000 5,125,250 0.21
ZHUHAI DA HENG QIN INVESTMENT CO LTD 4.75% 11 DECEMBER 2017 10,000,000 1,483,664 0.06
2,362,398,675 98.60
Unlisted but quoted investments
GEMDALE EVER PROSPERITY INVESTMENT LTD 4.95% 26 JULY 2022 4,075,000 4,086,369 0.17
Debtsecurities(Total) 2,366,485,044 98.77
Derivativeassets
Foreign currency forward contracts 1,151,818 0.05
Totalfinancialassets 2,367,636,862 98.82
Totalinvestments(Totalcostofinvestments:US$2,323,738,242) 2,367,636,862 98.82
Othernetassets 28,372,613 1.18
Totalnetassets 2,396,009,475 100.00

80
Portfolio Statement (Unaudited)
HSBCChinaMomentumFundas at 31 July 2017
HoldingsMarket
value
%ofnet
assetsUSD
Financialassets
EquitiesListed investments
ChinaFUJIAN SUNNER DEVELOPMENT CO
LTD 107,723 286,200 0.38GOERTEK INC 121,298 346,211 0.46HANGZHOU HIKVISION DIGITAL
TECHNOLOGY CO LTD 74,897 333,498 0.44HUANGSHAN TOURISM
DEVELOPMENT CO LTD 135,550 330,757 0.43HUBEI JUMPCAN PHARMACEUTICAL
CO LTD 143,500 729,491 0.96KWEICHOW MOUTAI CO LTD 5,196 371,125 0.49ZHEJIANG SEMIR GARMENT CO LTD 429,588 508,181 0.67
2,905,463 3.83
HongKongAAC TECHNOLOGIES HOLDINGS INC 14,500 195,144 0.26AGILE GROUP HOLDINGS LTD 350,000 416,808 0.55ALUMINUM CORP OF CHINA LTD H
SHARES 548,000 343,844 0.45ANHUI CONCH CEMENT CO LTD H
SHARES 67,500 249,797 0.33BANK OF CHINA LTD H SHARES 4,323,000 2,131,234 2.81BEIJING CAPITAL INTERNATIONAL
AIRPORT CO LTD 196,000 308,707 0.41BEIJING ENTERPRISES WATER
GROUP LTD 248,000 206,102 0.27BOC HONG KONG HOLDINGS LTD 123,500 608,063 0.80BRILLIANCE CHINA AUTOMOTIVE
HOLDINGS LTD 796,000 2,016,158 2.66CHINA COMMUNICATION
CONSTRUCTION CO LTD H SHARES 250,000 333,574 0.44
CHINA CONSTRUCTION BANK H SHARES 3,306,760 2,752,334 3.63
CHINA EVERBRIGHT LTD 212,000 483,216 0.64CHINA GAS HOLDINGS LTD 142,000 343,665 0.45CHINA LIFE INSURANCE CO LTD 582,000 1,844,520 2.43CHINA MENGNIU DAIRY CO LTD 151,000 294,291 0.39
HoldingsMarket
value
%ofnet
assetsUSD
CHINA MERCHANTS BANK CO LTD 134,500 442,630 0.58CHINA MOBILE LTD 321,000 3,442,508 4.54CHINA OILFIELD SERVICES LTD 216,000 184,210 0.24CHINA OVERSEAS LAND &
INVESTMENT LTD 334,000 1,133,385 1.49CHINA PETROLEUM & CHEMICAL
CORP H SHARES 944,000 716,823 0.94CHINA RESOURCES BEER HOLDINGS
CO LTD 294,667 744,841 0.98CHINA RESOURCES CEMENT
HOLDINGS LTD 328,000 195,304 0.26CHINA RESOURCES LAND LTD 172,000 552,824 0.73CHINA RESOURCES POWER
HOLDINGS CO LTD 90,000 171,717 0.23CHINA SHENHUA ENERGY CO LTD H
SHARES 192,000 478,442 0.63CHINA STATE CONSTRUCTION
INTERNATIONAL HOLDINGS LTD 96,000 155,137 0.20CHINA UNICOM HONG KONG LTD 316,000 458,865 0.60CHINA VANKE CO LTD 81,045 239,212 0.33CHINA YONGDA AUTOMOBILES
SERVICES HOLDINGS LTD 164,500 213,594 0.28CNOOC LTD 848,000 949,057 1.25COUNTRY GARDEN HOLDINGS
COMPANY LTD 991,000 1,385,739 1.83CSPC PHARMACEUTICAL GROUP
LTD 1,086,000 1,693,800 2.23ENN ENERGY HOLDINGS LTD 28,000 190,208 0.25GEELY AUTOMOBILE HOLDINGS LTD 471,000 1,089,240 1.44GREAT WALL MOTOR CO LTD 167,500 214,915 0.28GUANGSHEN RAILWAY CO LTD 534,000 274,886 0.36GUANGZHOU AUTOMOBILE GROUP
CO LTD H SHARES 764,000 1,641,612 2.16HAIER ELECTRONICS GROUP CO LTD 77,000 198,679 0.26HEALTH AND HAPPINESS (H&H)
INTERNATIONAL HOLDINGS LTD 108,000 349,197 0.46HENGAN INTERNATIONAL GROUP
COMPANY LTD 37,500 286,195 0.38HUANENG POWER INTERNATIONAL
INC 230,000 162,280 0.21INDUSTRIAL AND COMMERCIAL
BANK OF CHINA H SHARES 4,223,690 2,958,452 3.90JIANGXI COPPER CO LTD 67,000 122,343 0.16KINGBOARD LAMINATES HOLDINGS
LTD 1,241,500 1,732,839 2.28

81
Portfolio Statement (Unaudited)
HSBCChinaMomentumFundas at 31 July 2017
HoldingsMarket
value
%ofnet
assetsUSD
EquitiesListed investments
KINGSOFT CORP LTD 42,000 110,790 0.15LONGFOR PROPERTIES CO LTD 440,000 1,105,444 1.46MMG LTD 1,132,000 504,441 0.66NEW CHINA LIFE INSURANCE CO
LTD 141,200 912,181 1.20NINE DRAGONS PAPER HOLDINGS
LTD 99,000 147,562 0.19PETROCHINA CO LTD H SHARES 1,186,000 763,902 1.01PING AN INSURANCE GROUP CO H
SHARES 407,000 3,020,181 3.98SHANGHAI PHARMACEUTICALS
HOLDING CO LTD 103,100 273,284 0.36SHIMAO PROPERTY HOLDINGS LTD 67,500 134,665 0.18SINO BIOPHARMACEUTICAL LTD 232,000 204,985 0.27SINOPEC ENGINEERING GROUP CO
LTD 72,000 64,630 0.09SINOTRANS LTD 62,000 31,519 0.04SUN ART RETAIL GROUP LTD 135,000 110,118 0.15SUNNY OPTICAL TECHNOLOGY
GROUP CO LTD 156,000 1,857,773 2.45TENCENT HOLDINGS LTD 185,800 7,456,411 9.83TRAVELSKY TECHNOLOGY LTD 50,000 132,533 0.17TSINGTAO BREWERY CO LTD 20,000 85,795 0.11WUXI BIOLOGICS CAYMAN INC 3,000 13,445 0.02XINYI GLASS HOLDINGS LTD 382,000 395,239 0.52YANZHOU COAL MINING CO LTD 484,000 476,603 0.63YICHANG HEC CHANGJIANG
PHARMACEUTICAL CO LTD 320,400 787,733 1.04ZHONGSHENG GROUP HOLDINGS
LTD 181,000 396,333 0.52ZHUZHOU CSR TIMES ELECTRIC CO
LTD H SHARES 15,000 71,453 0.09ZIJIN MINING GROUP CO LTD H
SHARES 314,000 113,789 0.15ZTE CORP 180,800 465,350 0.61
54,542,550 71.88
HoldingsMarket
value
%ofnet
assetsUSD
UnitedStatesALIBABA GROUP HOLDINGS LTD 46,889 7,265,451 9.57BAIDU INC 6,133 1,388,205 1.83CTRIP.COM INTERNATIONAL LTD 19,903 1,188,806 1.57JD.COM INC 52,079 2,352,408 3.10MOMO INC 2,560 112,461 0.15NEW ORIENTAL EDUCATION &
TECHNOLOGY GROUP INC 9,865 785,846 1.04SINA CORP 2,909 275,802 0.36TAL EDUCATION GROUP 12,946 2,029,544 2.67WEIBO CORP 1,412 108,653 0.14
15,507,176 20.43
Equities(Total) 72,955,189 96.14
Equity-linkedinstruments
Equity-linkednote
CICC FINANCIAL TRADING LIMITED (KWEICHOW MOUTAI CO LTD A SHRS) PNOTE 03FEB2018 5,359 382,768 0.50
CICC FINANCIAL TRADING (KANGDE XIN COMPOSITE MATER-A) PNOTE 19AUG2019 244,000 714,898 0.94
CICC FINANCIAL TRADING LTD (FUJIAN SUNNER DEVELOPMENT-A) PNOTE 30SEP2019 167,800 445,813 0.59
1,543,479 2.03
Totalfinancialassets 74,498,668 98.17
Totalinvestments(Totalcostofinvestments:US$55,317,369) 74,498,668 98.17
Othernetassets 1,389,220 1.83
Totalnetassets 75,887,888 100.00

82
Portfolio Statement (Unaudited)
HSBCChinaGrowthFundas at 31 July 2017
HoldingsMarket
value
%ofnet
assetsUSD
Financialassets
EquitiesListed investments
ChinaFUJIAN SUNNER DEVELOPMENT
CO LTD 584,849 1,553,995 0.40
HongKongAAC TECHNOLOGIES HOLDINGS INC 208,500 2,806,040 0.72AGILE GROUP HOLDINGS LTD 1,576,000 1,876,827 0.48ASM PACIFIC TECHNOLOGY LTD 179,500 2,326,109 0.59BANK OF CHINA LTD H SHARES 24,289,000 11,974,447 3.06BOC HONG KONG HOLDINGS LTD 320,000 1,575,547 0.40BRILLIANCE CHINA AUTOMOTIVE
HOLDINGS LTD 2,106,000 5,334,206 1.36CHINA BLUECHEMICAL LTD 3,488,000 982,617 0.25CHINA COMMUNICATIONS
CONSTRUCTION CO LTD 1,079,000 1,439,708 0.37CHINA CONSTRUCTION BANK H
SHARES 25,564,560 21,278,293 5.44CHINA EVERBRIGHT LTD 1,038,000 2,365,933 0.60CHINA GAS HOLDINGS LTD 496,000 1,200,407 0.31CHINA INTERNATIONAL MARINE
CONTAINERS GROUP CO LTD 1,074,700 2,248,663 0.57CHINA JINMAO HOLDINGS GROUP
LTD 1,998,000 928,725 0.24CHINA LIFE INSURANCE CO LTD H
SHARES 2,874,000 9,108,505 2.33CHINA MERCHANTS BANK CO LTD 570,000 1,875,828 0.48CHINA MERCHANTS PORT
HOLDINGS CO LTD 648,000 2,037,097 0.52CHINA MOBILE LTD 1,454,000 15,593,167 3.99CHINA NATIONAL MATERIALS CO
LTD H SHARES 4,180,000 1,696,761 0.43CHINA OVERSEAS GRAND OCEANS
GROUP LTD 2,949,000 1,729,519 0.44CHINA OVERSEAS LAND &
INVESTMENT LIMITED 1,206,000 4,092,402 1.05CHINA OVERSEAS PROPERTY
HOLDINGS LTD 14,445,000 2,626,582 0.67CHINA PETROLEUM & CHEMICAL
CORP H SHARES 5,780,000 4,389,021 1.12
HoldingsMarket
value
%ofnet
assetsUSD
CHINA POWER INTERNATIONAL DEVELOPMENT LTD 1,938,000 665,080 0.17
CHINA RESOURCES BEER HOLDINGS CO LTD 510,667 1,290,833 0.33
CHINA RESOURCES CEMENT HOLDING LTD 4,662,000 2,775,942 0.71
CHINA RESOURCES POWER HOLDINGS CO LTD 564,000 1,076,095 0.27
CHINA SHENHUA ENERGY CO LTD H SHARES 1,061,000 2,643,890 0.68
CHINA STATE CONSTRUCTION INTERNATIONAL HOLDINGS LTD 514,000 830,630 0.21
CHINA SUNTIEN GREEN ENERGY CORP LTD 14,984,000 3,165,897 0.81
CHINA TAIPING INSURANCE HOLDINGS CO LTD 585,400 1,761,593 0.45
CHINA UNICOM HONG KONG LTD 3,540,000 5,140,453 1.31CHINA VANKE CO LTD 695,053 2,051,512 0.52CHINA YONGDA AUTOMOBILES
SERVICES HOLDINGS LTD 1,539,000 1,998,305 0.51CIFI HOLDINGS GROUP CO LTD 1,470,000 837,650 0.21CIMC ENRIC HOLDINGS LTD 3,186,000 2,284,646 0.58CNOOC LTD 3,642,000 4,076,022 1.04COUNTRY GARDEN HOLDINGS
COMPANY LTD 3,491,000 4,881,548 1.25CPMC HOLDINGS LTD 10,290,155 5,099,387 1.30CSPC PHARMACEUTICAL GROUP
LTD 2,034,000 3,172,366 0.81DAH SING FINANCIAL HOLDINGS LTD 292,800 2,073,391 0.53ENN ENERGY HOLDINGS LTD 282,000 1,915,665 0.49GEELY AUTOMOBILE HOLDINGS LTD
H SHARES 815,000 1,884,779 0.48GREAT WALL MOTOR CO LTD 1,458,000 1,870,727 0.48GUANGSHEN RAILWAY CO LTD 2,932,000 1,509,298 0.39GUANGZHOU AUTOMOBILE GROUP
CO LTD H SHARES 3,580,000 7,692,369 1.97HAIER ELECTRONICS GROUP CO LTD 483,000 1,246,256 0.32HUANENG RENEWABLES CORP LTD 3,210,000 978,289 0.25INDUSTRIAL AND COMMERCIAL
BANK OF CHINA H SHARES 21,684,030 15,188,414 3.88KINGBOARD LAMINATES HOLDINGS
LTD 7,104,500 9,916,197 2.53

83
Portfolio Statement (Unaudited)
HSBCChinaGrowthFundas at 31 July 2017
HoldingsMarket
value
%ofnet
assetsUSD
EquitiesListed investments
LEE & MAN PAPER MANUFACTURING LTD 2,923,000 3,117,877 0.80
LONGFOR PROPERTIES CO LTD 632,500 1,589,076 0.41MAANSHAN IRON & STEEL CO LTD 2,362,000 1,146,316 0.29METALLURGICAL CORPORATION OF
CHINA LTD H SHARES 9,129,000 3,144,565 0.80MMG LTD 3,832,000 1,707,615 0.44NEW CHINA LIFE INSURANCE CO H
SHARES 608,900 3,933,619 1.01PACIFIC TEXTILES HOLDINGS LTD 1,574,000 1,781,731 0.46PETROCHINA CO LTD H SHARES 2,952,000 1,901,382 0.49PING AN INSURANCE (GROUP) CO
OF CHINA H SHARES 2,049,500 15,208,503 3.89SHENZHEN INTERNATIONAL
HOLDINGS LTD 3,017,500 5,169,976 1.32SINOPEC KANTONS HOLDINGS LTD 9,564,000 5,780,517 1.48SINOTRANS LTD 11,349,000 5,769,434 1.47SUNNY OPTICAL TECHNOLOGY
GROUP CO LTD 229,000 2,727,116 0.70TENCENT HOLDINGS LTD 979,100 39,292,635 10.04TEXHONG TEXTILE GROUP LTD 4,398,000 4,730,637 1.21XINGDA INTERNATIONAL HOLDINGS
LTD 3,435,000 1,486,718 0.38XINYI AUTOMOBILE GLASS HONG
KONG ENTERPRISES LTD 3,366,500 659,561 0.17XINYI GLASS HOLDING LTD 14,480,000 14,981,836 3.83XINYI SOLAR HOLDINGS LTD 7,280,000 2,293,251 0.59
303,936,003 77.68
UnitedKingdomHSBC HOLDINGS PLC 151,200 1,518,902 0.39
HoldingsMarket
value
%ofnet
assetsUSD
UnitedStatesALIBABA GROUP HOLDING-SP ADR 245,176 37,990,021 9.71BAIDU INC 54,200 12,268,170 3.13CTRIP.COM INTERNATIONAL LTD 112,635 6,727,689 1.72JD.COM INC 207,216 9,359,947 2.39NEW ORIENTAL EDUCATION &
TECHNOLOGY GROUP INC 29,999 2,389,720 0.61SINA CORP 34,271 3,249,234 0.83TAL EDUCATION GROUP 49,555 7,768,737 1.99WEIBO CORP 24,678 1,898,972 0.48ZTO EXPRESS (CAYMAN) INC 158,284 2,371,094 0.61
84,023,584 21.47
Listedinvestments(Total) 391,032,484 99.94
Unlisted investment
CHINA METAL RECYCLING HOLDINGS LTD 4,673,807 – 0.00
Unlistedinvestment(Total) – 0.00
Equities(Total) 391,032,484 99.94
Totalfinancialassets 391,032,484 99.94
Totalinvestments(Totalcostofinvestments:US$315,603,201) 391,032,484 99.94
Othernetassets 240,678 0.06
Totalnetassets 391,273,162 100.00

84
Portfolio Statement (Unaudited)
HSBCAsianHighYieldBondFundas at 31 July 2017
HoldingsMarket
value
%ofnet
assetsUSD
Financialassets
Debtsecurities
BondsListed investments
361 DEGREES INTERNATIONAL LTD 7.25% 03 JUNE 2021 2,000,000 2,132,520 0.22
ABJA INVESTMENT CO 5.95% 31 JULY 2024 12,000,000 12,743,880 1.32
ABJA INVESTMENT CO PTE LTD 4.85% 31 JANUARY 2020 2,000,000 2,063,220 0.21
ABM INVESTAMA TBK PT 7.125% 01 AUGUST 2022 7,615,000 7,606,319 0.79
AGILE GROUP HOLDINGS LTD 9% 21 MAY 2020 5,800,000 6,248,282 0.65
APL REALTY HOLDINGS PTE LTD 5.95% 02 JUNE 2024 1,400,000 1,368,374 0.14
AZURE POWER ENERGY LTD 5.5% 03 NOVEMBER 2022 2,350,000 2,356,580 0.24
BANK OF EAST ASIA LTD 5.5% VAR PERP 4,000,000 4,044,320 0.42
BAOXIN AUTO FINANCE I LTD 8.75% PERP 2,000,000 2,109,940 0.22
BARMINCO FINANCE PTY LTD 6.625% 15 MAY 2022 3,561,000 3,522,577 0.36
BUKIT MAKMUR MANDIRI UTAMA PT 7.75% 13 FEBRUARY 2022 10,000,000 10,326,000 1.07
CAR INC 6% 11 FEBRUARY 2021 6,500,000 6,743,685 0.70CAR INC 6.125% 04 FEBRUARY 2020 3,000,000 3,111,480 0.32CCB LIFE INSURANCE CO LTD 4.5%
21 APRIL 2077 2,477,000 2,524,930 0.26CHINA AOYUAN PROPERTY GROUP
10.875% 26 MAY 2018 2,300,000 2,419,623 0.25CHINA AOYUAN PROPERTY GROUP
LTD 6.35% 11 JANUARY 2020 4,445,000 4,550,213 0.47CHINA AOYUAN PROPERTY GROUP
LTD 6.525% 25 APRIL 2019 6,057,000 6,203,882 0.64CHINA EVERGRANDE GROUP 6.25%
28 JUNE 2021 6,000,000 5,858,760 0.61CHINA EVERGRANDE GROUP 7.5%
28 JUNE 2023 11,509,000 11,358,347 1.17CHINA EVERGRANDE GROUP 8.25%
23 MARCH 2022 7,000,000 7,203,420 0.74
HoldingsMarket
value
%ofnet
assetsUSD
CHINA EVERGRANDE GROUP 8.75% 28 JUNE 2025 7,404,000 7,401,261 0.76
CHINA LIFE INSURANCE OVERSEAS COMPANY LTD (HONG KONG BRANCH) 3.35% 27 JULY 2027 2,878,000 2,885,396 0.30
CHINA OIL AND GAS GROUP LTD 4.625% 20 APRIL 2022 3,000,000 3,021,210 0.31
CHINA OIL AND GAS GROUP LTD 5% 07 MAY 2020 4,000,000 4,095,160 0.42
CHINA SCE PROPERTY HOLDINGS LTD 10% 2 JULY 2020 10,000,000 10,874,900 1.12
CHONG HING BANK LTD 3.876% 26 JULY 2027 1,625,000 1,630,379 0.17
COUNTRY GARDEN HOLDINGS COMPANY LTD 5.625% 15 DECEMBER 2026 4,250,000 4,389,358 0.45
COUNTRY GARDEN HOLDINGS COMPANY LTD 7.5% 10 JANUARY 2023 2,000,000 2,103,160 0.22
COUNTRY GARDEN HOLDINGS COMPANY LTD 7.875% 27 MAY 2019 5,000,000 5,207,450 0.54
COUNTRY GARDEN HOLDINGS COMPANY LTD 7.25% 04 APRIL 2021 4,500,000 4,685,490 0.48
COUNTRY GARDEN HOLDINGS COMPANY LTD 7.5% 09 MARCH 2020 7,700,000 8,153,838 0.84
DELHI INTERNATIONAL AIRPORT LTD 6.125% 03 FEBRUARY 2022 4,500,000 4,798,440 0.50
DELHI INTERNATIONAL AIRPORT LTD 6.125% 31 OCTOBER 2026 2,000,000 2,133,100 0.22
DR PENG HOLDING HONGKONG LTD 5.05% 01 JUNE 2020 5,743,000 5,831,385 0.60
EASY TACTIC LTD 5.75% 13 JANUARY 2022 3,000,000 2,994,510 0.31
EHI CAR SERVICES LTD 7.5% 08 DECEMBER 2018 3,000,000 3,128,250 0.32
EMPEROR INTERNATIONAL HOLDINGS LTD 5% 30 MARCH 2022 3,900,000 3,889,119 0.40
ENN ENERGY HOLDINGS LTD 3.25% 24 JULY 2022 2,450,000 2,453,577 0.25
EXPORT-IMPORT BANK OF CHINA 4.37% 15 MAY 2020 10,000,000 1,497,260 0.15

85
Portfolio Statement (Unaudited)
HSBCAsianHighYieldBondFundas at 31 July 2017
HoldingsMarket
value
%ofnet
assetsUSD
BondsListed investments
FANTASIA HOLDINGS GROUP 13.75% 27 SEPTEMBER 2017 4,000,000 4,065,000 0.42
FANTASIA HOLDINGS GROUP 7.375% 04 OCTOBER 2021 8,057,000 8,035,649 0.83
FORTUNE STAR (BVI) LTD 5.25% 23 MARCH 2022 1,500,000 1,459,260 0.15
FRANSHION BRILLIANT LTD 5.75% 19 MARCH 2019 2,000,000 2,081,380 0.21
FUTURE LAND DEVELOPMENT HOLDINGS LTD 5% 16 FEBRUARY 2020 1,300,000 1,343,654 0.14
FUTURE LAND DEVELOPMENT HOLDINGS LTD 6.25% 12 NOVEMBER 2017 1,754,000 1,767,418 0.18
FWD LTD 6.25% PERP 5,000,000 5,262,300 0.54GLOBAL LOGISTIC PROPERTIES LTD
3.875% 04 JUNE 2025 3,619,000 3,475,000 0.36GOLDEN EAGLE RETAIL GROUP LTD
4.625% 21 MAY 2023 10,000,000 9,336,300 0.96GREENKO DUTCH BV 8% 01 AUGUST
2019 9,750,000 10,165,057 1.05GREENLAND HONG KONG
HOLDINGS LTD 3.875% 28 JULY 2019 3,280,000 3,233,555 0.33
HARVEST OPERATIONS CORP 6.875% 01 OCTOBER 2017 10,250,000 10,270,910 1.06
HEALTH AND HAPPINESS (H&H) INTERNATIONAL HOLDINGS LTD 7.25% 21 JUNE 2021 8,173,000 8,631,424 0.89
HESTEEL HONG KONG CO LTD 4.25% 07 APRIL 2020 2,421,000 2,415,165 0.25
HINDUSTAN PETROLEUM CORP LTD 4% 12 JULY2027 3,600,000 3,625,056 0.37
HOUSING DEVELOPMENT FINANCE CORP 6.875% 30 APRIL 2020 200,000,000 3,114,154 0.32
HOUSING DEVELOPMENT FINANCE CORP 8.5% 15 MAY 2018 25,000,000 393,882 0.04
HOUSING DEVELOPMENT FINANCE CORP 9.05% 25 FEBRUARY 2018 125,000,000 1,969,791 0.20
HOUSING DEVELOPMENT FINANCE CORPORATION LTD 8.75% 13 JANUARY 2020 250,000,000 4,019,913 0.41
HoldingsMarket
value
%ofnet
assetsUSD
HPCL-MITTAL ENERGY LTD 5.25% 28 APRIL 2027 1,325,000 1,379,391 0.14
HT GLOBAL IT SOLUTIONS HOLDINGS LTD 7% 14 JULY 2021 10,000,000 10,566,600 1.09
ICTSI TREASURY BV 5.875% 17 SEPTEMBER 2025 1,300,000 1,425,827 0.15
INDIKA ENERGY CAPITAL II PTE LTD 6.875% 10 APRIL 2022 2,000,000 1,992,620 0.21
INDO ENERGY FINANCE II BV 6.375% 24 JANUARY 2023 4,000,000 3,825,680 0.40
INDONESIA (REPUBLIC OF) 4.35% 08 JANUARY 2027 2,000,000 2,104,500 0.22
INDONESIA (REPUBLIC OF) 4.75% 08 JANUARY 2026 5,000,000 5,406,150 0.56
INDONESIA (REPUBLIC OF) 5.875% 15 JANUARY 2024 5,000,000 5,729,400 0.59
INDONESIA (REPUBLIC OF) 6.75% 15 JANUARY 2044 2,500,000 3,295,625 0.34
INDONESIA (REPUBLIC OF) 3.375% 15 APRIL 2023 10,000,000 10,095,200 1.04
INDONESIA (REPUBLIC OF) 3.7% 08 JANUARY 2022 450,000 465,993 0.05
INDONESIA (REPUBLIC OF) 4.125% 15 JANUARY 2025 5,000,000 5,206,150 0.54
INDONESIA (REPUBLIC OF) 5.125% 15 JANUARY 2045 7,000,000 7,611,100 0.79
INDONESIA (REPUBLIC OF) 5.25% 08 JANUARY 2047 2,000,000 2,214,180 0.23
INDONESIA (REPUBLIC OF) 5.25% 17 JANUARY 2042 5,000,000 5,496,050 0.57
INDONESIA (REPUBLIC OF) 7.75% 17 JANUARY 2038 9,000,000 12,732,120 1.32
INDONESIA (REPUBLIC OF) 7.875% 15 APRIL 2019 260,000,000,000 19,955,412 2.06
INDONESIA (REPUBLIC OF) 8.5% 12 OCTOBER 2035 8,000,000 11,751,040 1.21
INDUSTRIAL AND COMMERCIAL BANK OF CHINA ASIA LTD 4.25% PERP 29 DECEMBER 2049 827,000 824,469 0.09
INDUSTRIAL BANK OF KOREA VAR PERP 29 DECEMBER 2049 2,073,000 2,071,404 0.21
JABABEKA INTERNATIONAL BV 6.5% 05 OCTOBER 2023 11,000,000 11,431,200 1.18
JAIN INTERNATIONAL TRADING BV 7.125% 1 FEBRUARY 2022 4,000,000 4,027,240 0.42

86
Portfolio Statement (Unaudited)
HSBCAsianHighYieldBondFundas at 31 July 2017
HoldingsMarket
value
%ofnet
assetsUSD
BondsListed investments
JAPFA COMFEED INDONESIA TBK PT 5.5% 31 MARCH 2022 1,600,000 1,590,832 0.16
JSW STEEL LTD 4.75% 12 NOVEMBER 2019 4,000,000 4,081,360 0.42
JUBILANT PHARMA LTD 4.875% 06 OCTOBER 2021 10,200,000 10,373,604 1.07
KAISA GROUP HOLDINGS LTD 9.375% 30 JUNE 2024 5,000,000 5,107,950 0.53
KRUNG THAI BANK PCL (CAYMAN BRANCH) 5.2% 26 DECEMBER 2024 5,176,000 5,380,141 0.56
KWG PROPERTY HOLDING LTD 6% 15 SEPTEMBER 2022 3,000,000 3,018,780 0.31
KWG PROPERTY HOLDING LTD 8.25% 05 AUGUST 2019 4,000,000 4,172,240 0.43
KYOBO LIFE INSURANCE CO LTD 3.95% 24 JULY 2047 875,000 880,513 0.09
LAI FUNG HOLDINGS LTD 6.875% 25 APRIL 2018 30,000,000 4,475,975 0.46
LAI SUN INTERNATIONAL FINANCE (2012) LTD 5.7% 18 JANUARY 2018 2,000,000 2,019,960 0.21
LIC HOUSING FINANCE LTD 8.72% 28 NOVEMBER 2019 300,000,000 4,829,092 0.50
LISTRINDO CAPITAL BV 4.95% 14 SEPTEMBER 2026 4,000,000 4,033,880 0.42
LOGAN PROPERTY HOLDINGS CO LTD 5.75% 03 JANUARY 2022 1,000,000 1,003,830 0.10
LONGFOR PROPERTIES CO LTD 3.875% 13 JULY 2022 450,000 453,893 0.05
MAJAPAHIT HOLDINGS BV 7.875% 29 JUNE 2037 10,000,000 13,188,600 1.36
MARBLE II PTE LTD 5.3% 20 JUNE 2022 3,589,000 3,635,334 0.38
MARQUEE LAND PTE 9.75% 05 AUGUST 2019 1,710,000 1,801,895 0.19
MELCO RESORTS FINANCE LTD 4.875% 06 JUNE 2025 5,106,000 5,110,749 0.53
MELCO RESORTS FINANCE LTD 4.875% 06 JUNE 2025 4,909,000 4,909,393 0.51
MODERN LAND (CHINA) CO LTD 6.875% 20 OCTOBER 2019 6,000,000 5,965,500 0.62
MODERNLAND OVERSEAS PTE LTD 6.95% 13 APRIL 2024 7,500,000 7,476,375 0.77
HoldingsMarket
value
%ofnet
assetsUSD
MONGOLIA (GOVERNMENT) 8.75% 09 MARCH 2024 3,000,000 3,369,210 0.35
MONGOLIA (GOVERNMENT) 10.875% 06 APRIL 2021 2,000,000 2,325,600 0.24
MOON WISE GLOBAL LTD VAR PERP 9,000,000 9,575,730 0.99MPM GLOBAL PTE LTD 6.75% 19
SEPTEMBER 2019 5,500,000 5,708,890 0.59NATIONAL HIGHWAYS AUTHORITY
OF INDIA 7.3% 18 MAY 2022 500,000,000 7,944,085 0.82NATIONAL SAVINGS BANK 8.875% 18
SEPTEMBER 2018 9,000,000 9,536,850 0.98NEERG ENERGY LTD 6% 13
FEBRUARY 2022 2,000,000 2,054,720 0.21NTPC LTD 7.375% 10 AUGUST 2021 250,000,000 3,981,752 0.41NWD FINANCE (BVI) LTD 5.75% PERP
29 DECEMBER 2049 6,000,000 6,011,100 0.62NWD MTN LTD 4.375% 30
NOVEMBER 2022 3,929,000 4,118,849 0.43PAKUWON PRIMA PTE LTD 5% 14
FEBRUARY 2024 10,604,000 10,652,460 1.10PARKSON RETAIL GROUP LTD 4.5%
03 MAY 2018 10,000,000 9,952,000 1.03PB INTERNATIONAL BV 7.625% 26
JANUARY 2022 7,000,000 7,316,260 0.76PERTAMINA (PERSERO) PT 6.45% 30
MAY 2044 9,000,000 10,498,590 1.08PERTAMINA (PERSERO) PT 5.625%
20 MAY 2043 3,000,000 3,187,140 0.33PERTAMINA (PERSERO) PT 6% 03
MAY 2042 6,000,000 6,637,500 0.69PERTAMINA PERSERO PT 6.5% 27
MAY 2041 11,500,000 13,508,015 1.40PERUSAHAAN GAS NEGARA 5.125%
16 MAY 2024 4,000,000 4,330,120 0.45PERUSAHAAN LISTRIK NEGARA
(PERSERO) PT 4.125% 15 MAY 2027 5,388,000 5,384,336 0.56
PETRON CORP VAR PERP 30 DECEMBER 2048 11,000,000 11,477,070 1.19
PHILIPPINES, REPUBLIC OF (GOVERNMENT) 3.7% 01 MARCH 2041 4,800,000 4,822,992 0.50
PHILIPPINES, REPUBLIC OF (GOVERNMENT) 3.95% 20 JANUARY 2040 5,000,000 5,222,550 0.54

87
Portfolio Statement (Unaudited)
HSBCAsianHighYieldBondFundas at 31 July 2017
HoldingsMarket
value
%ofnet
assetsUSD
BondsListed investments
PHILIPPINES, REPUBLIC OF (GOVERNMENT) 7.75% 14 JANUARY 2031 1,923,000 2,786,139 0.29
PHILIPPINES, REPUBLIC OF (GOVERNMENT) 9.5% 02 FEBRUARY 2030 6,154,000 9,935,202 1.03
PHILIPPINES, REPUBLIC OF (GOVERNMENT) 3.7% 02 FERBUARY 2042 10,150,000 10,194,457 1.05
POWER GRID CORP OF INDIA LTD 8.8% 13 MARCH 2023 150,000,000 2,513,300 0.26
POWERLONG REAL ESTATE HOLDINGS LTD 4.875% 15 SEPTEMBER 2021 3,000,000 2,817,960 0.29
POWERLONG REAL ESTATE HOLDINGS LTD 7.625% 26 NOVEMBER 2018 8,745,000 8,983,739 0.93
PRATAMA AGUNG PTE LTD 6.25% 24 FEBRUARY 2020 10,000,000 10,456,200 1.08
PROVEN HONOUR CAPITAL LTD 4.125% 19 MAY 2025 2,000,000 2,064,220 0.21
PROVEN HONOUR CAPITAL LTD 4.125% 06 MAY 2026 6,058,000 6,210,601 0.64
PTT EXPLORATION AND PRODUCTION PCL 4.875% PERP 29 DECEMBER 2049 1,739,000 1,774,267 0.18
PTTEP TREASURY CENTER CO LTD 4.6% PERP 29 DECEMBER 2049 5,000,000 5,096,850 0.53
RADIANT ACCESS LTD 4.6% PERP 29 DECEMBER 2049 4,548,000 4,433,436 0.46
REPUBLIC OF PHILIPPINES 6.375% 15 JANUARY 2032 2,000,000 2,634,980 0.27
RIZAL COMMERCIAL BANKING CORP 3.45% 02 FEBRUARY 2021 1,004,000 1,023,056 0.11
RKI OVERSEAS FINANCE 2016 (A) LTD 5% 09 AUGUST 2019 1,807,000 1,817,806 0.19
RKI OVERSEAS FINANCE 2016 (B) LTD 4.7% 06 SEPTEMBER 2021 7,000,000 6,865,810 0.71
RKP OVERSEAS FINANCE 2016 A LTD 7.95% PERP 17 FEBRUARY 2022 8,000,000 8,257,040 0.85
ROYAL CAPITAL BV VAR PERP 29 DECEMBER 2049 6,000,000 6,032,700 0.62
HoldingsMarket
value
%ofnet
assetsUSD
ROYAL CAPITAL BV VAR PERP 29 DECEMBER 2049 6,000,000 6,320,700 0.65
SAKA ENERGI INDONESIA PT 4.45% 05 MAY 2024 3,000,000 3,060,120 0.32
SAMVARDHANA MOTHERSON AUTOMOTIVE SYSTEMS GROUP BV 4.875% 16 DECEMBER 2021 4,500,000 4,718,835 0.49
SHIMAO PROPERTY HOLDINGS LTD 4.75% 03 JULY 2022 5,000,000 5,102,400 0.53
SHIMAO PROPERTY HOLDINGS LTD 8.125% 22 JANUARY 2021 8,000,000 8,505,600 0.88
SHIMAO PROPERTY HOLDINGS LTD 8.375% 10 FEBRUARY 2022 3,000,000 3,316,620 0.34
SHUI ON DEVELOPMENT HOLDINGS LTD VAR PERP 10 DECEMBER 2049 9,712,000 9,917,215 1.02
SK E&S CO LTD 4.875% PERP 29 NOVEMBER 2049 5,000,000 4,992,800 0.52
SM INVESTMENTS CORP 4.875% 10 JUNE 2024 1,000,000 1,051,480 0.11
SMC GLOBAL POWER HOLDINGS CORP VAR PERP 29 DECEMBER 2049 2,000,000 2,134,040 0.22
SMC GLOBAL POWER HOLDINGS CORP 7.5% PERP 09 NOVEMBER 2049 2,000,000 2,152,980 0.22
SRI LANKA, DEMOCRATIC SOCIALIST REPUBLIC OF (GOVERNMENT) 5.875% 25 JULY 2022 3,000,000 3,149,250 0.33
SRI LANKA, DEMOCRATIC SOCIALIST REPUBLIC OF (GOVERNMENT) 6% 14 JANUARY 2019 8,000,000 8,286,160 0.86
SRI LANKA, DEMOCRATIC SOCIALIST REPUBLIC OF (GOVERNMENT) 6.2% 11 MAY 2027 3,647,000 3,768,773 0.39
SRI LANKA, DEMOCRATIC SOCIALIST REPUBLIC OF (GOVERNMENT) 5.75% 18 JANUARY 2022 5,638,000 5,910,146 0.61
SRI LANKA, DEMOCRATIC SOCIALIST REPUBLIC OF (GOVERNMENT) 6.25% 27 JULY 2021 6,000,000 6,412,740 0.66
STUDIO CITY CO LTD 7.25% 30 NOVEMBER 2021 12,000,000 12,920,640 1.33
STUDIO CITY FINANCE LTD 8.5% 01 DECEMBER 2020 10,000,000 10,349,800 1.07

88
Portfolio Statement (Unaudited)
HSBCAsianHighYieldBondFundas at 31 July 2017
HoldingsMarket
value
%ofnet
assetsUSD
BondsListed investments
TATA MOTORS LTD 5.75% 30 OCTOBER 2024 5,000,000 5,486,000 0.57
TBG GLOBAL PTE LTD 5.25% 10 FEBRUARY 2022 6,000,000 6,216,720 0.64
THETA CAPITAL PTE LTD 6.75% 31 OCTOBER 2026 3,000,000 2,991,900 0.31
THETA CAPITAL PTE LTD 7% 11 APRIL 2022 3,000,000 3,136,260 0.32
TIMES PROPERTY HOLDINGS LTD 5.75% 26 APRIL 2022 3,680,000 3,612,987 0.37
TIMES PROPERTY HOLDINGS LTD 6.25% 23 JANUARY 2020 1,733,000 1,758,007 0.18
TIMES PROPERTY HOLDINGS LTD 11.45% 05 MARCH 2020 7,000,000 7,646,380 0.79
UNITED STATES TREASURY 3% 15 MAY 2047 300,000 305,906 0.03
VEDANTA RESOURCES PLC 6.375% 30 JULY 2022 5,000,000 5,197,800 0.54
VEDANTA RESOURCES PLC 8.25% 07 JUNE 2021 9,500,000 10,626,795 1.10
VEDANTA RESOURCES PLC 6% 31 JANUARY 2019 5,500,000 5,793,810 0.60
VEDANTA RESOURCES PLC 7.125% 31 MAY 2023 6,000,000 6,349,680 0.66
WEALTH DRIVEN LTD 5.5% 17 AUGUST 2023 4,000,000 3,941,800 0.41
WEST CHINA CEMENT LTD 6.5% 11 SEPTEMBER 2019 11,000,000 11,367,840 1.17
WISDOM GLORY GROUP LTD 5.25% PERP 29 DECEMBER 2049 1,636,000 1,656,744 0.17
XINYUAN REAL ESTATE CO LTD 7.75% 28 FEBRUARY 2021 3,600,000 3,517,740 0.36
YANCOAL INTERNATIONAL RESOURCES DEVELOPMENT CO LTD VAR PERP 29 DECEMBER 2049 3,000,000 3,078,150 0.32
YUZHOU PROPERTIES CO LTD 6% 25 JANUARY 2022 7,000,000 7,085,400 0.73
YUZHOU PROPERTIES CO LTD 9% 08 DECEMBER 2019 3,000,000 3,185,550 0.33
929,991,060 96.07
HoldingsMarket
value
%ofnet
assetsUSD
Unlisted but quoted investments
GEMDALE EVER PROSPERITY INVESTMENT LTD 4.95% 26 JULY 2022 4,075,000 4,085,106 0.42
Debtsecurities(Total) 934,076,166 96.49
Derivativeassets
Foreign currency forward contracts 404,440 0.04
Totalfinancialassets 934,480,606 96.53
Totalnetinvestments(Totalcostofinvestments:US$917,058,899) 934,480,606 96.53
Othernetassets 33,597,114 3.47
Totalnetassets 968,077,720 100.00
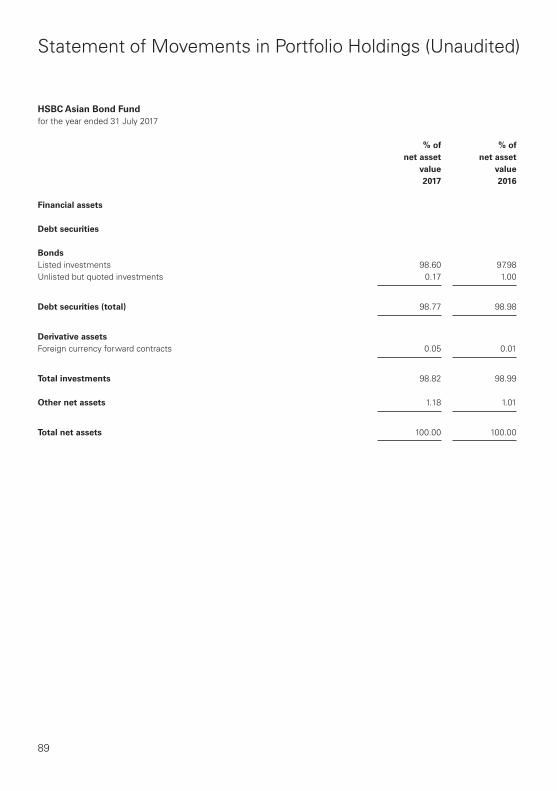
89
Statement of Movements in Portfolio Holdings (Unaudited)
HSBCAsianBondFundfor the year ended 31 July 2017
%ofnetasset
value2017
%ofnetasset
value2016
Financialassets
Debtsecurities
BondsListed investments 98.60 97.98Unlisted but quoted investments 0.17 1.00
Debtsecurities(total) 98.77 98.98
DerivativeassetsForeign currency forward contracts 0.05 0.01
Totalinvestments 98.82 98.99
Othernetassets 1.18 1.01
Totalnetassets 100.00 100.00

90
Statement of Movements in Portfolio Holdings (Unaudited)
HSBCChinaMomentumFundfor the year ended 31 July 2017
%ofnetasset
value2017
%ofnetasset
value2016
Financialassets
EquitiesListed investmentsThe People’s Republic of China 3.83 –Hong Kong 71.88 78.36United States 20.43 14.47
Equities(total) 96.14 92.83
Equity-linkedinstrumentsWarrants – 2.45Equity-linked note 2.03 2.13
Equity-linkedinstruments(Total) 2.03 4.58
Totalinvestments 98.17 97.41
Othernetassets 1.83 2.59
Totalnetassets 100.00 100.00
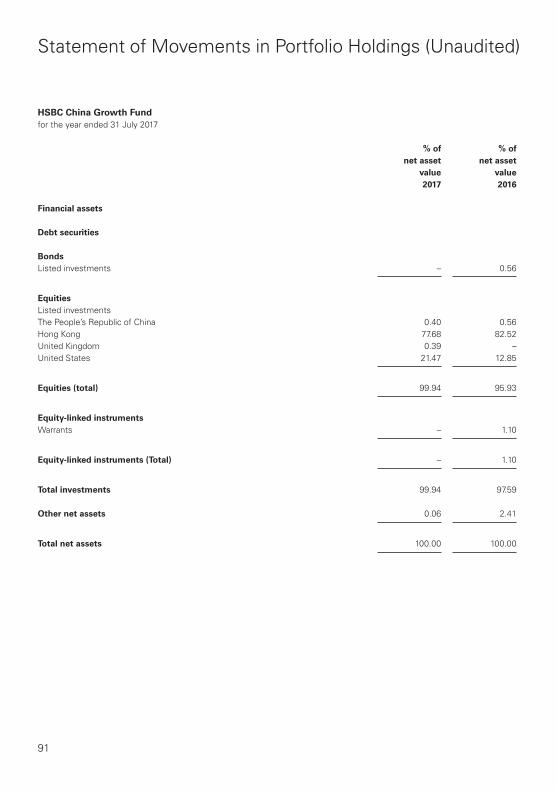
91
Statement of Movements in Portfolio Holdings (Unaudited)
HSBCChinaGrowthFundfor the year ended 31 July 2017
%ofnetasset
value2017
%ofnetasset
value2016
Financialassets
Debtsecurities
BondsListed investments – 0.56
EquitiesListed investmentsThe People’s Republic of China 0.40 0.56Hong Kong 77.68 82.52United Kingdom 0.39 –United States 21.47 12.85
Equities(total) 99.94 95.93
Equity-linkedinstrumentsWarrants – 1.10
Equity-linkedinstruments(Total) – 1.10
Totalinvestments 99.94 97.59
Othernetassets 0.06 2.41
Totalnetassets 100.00 100.00

92
Statement of Movements in Portfolio Holdings (Unaudited)
HSBCAsianHighYieldBondFundfor the year ended 31 July 2017
%ofnetasset
value2017
%ofnetasset
value2016
Financialassets
Debtsecurities
BondsListed investments 96.07 93.72Unlisted but quoted investments 0.42 1.32
Debtsecurities(total) 96.49 95.04
DerivativeassetsForeign currency forward contracts 0.04 0.01
Financialliabilities
DerivativeliabilitiesForeign currency forward contracts – (0.01)
Totalinvestments 96.53 95.04
Othernetassets 3.47 4.96
Totalnetassets 100.00 100.00

93
Performance Record (Unaudited)
HSBCAsianBondFund
(a) Pricerecord(dealingnetassetvalueperunit)
“AC–HKD”classunits
Bid OfferYear Lowest Highest Lowest Highest
HKD HKD HKD HKD
2011 9.960 10.160 10.270 10.4802012 6.567 10.301 6.770 10.620
“AC–USD”classunits
Bid OfferYear Lowest Highest Lowest Highest
USD USD USD USD
2011 9.970 10.180 10.280 10.4902012 9.573 10.823 9.869 11.1582013 10.639 11.442 10.968 11.7962014 10.638 11.737 10.967 12.1002015 10.695 12.224 12.057 12.6022016 11.925 12.874 12.294 13.2722017 12.416 13.028 13.028 13.420
“AM–HKD”classunits
Bid OfferYear Lowest Highest Lowest Highest
HKD HKD HKD HKD
2011 9.940 10.100 10.240 10.4102012 9.409 10.287 9.700 10.6052013 9.791 10.561 10.094 10.8882014 9.687 10.300 9.987 10.6192015 10.131 10.418 10.441 10.7432016 9.990 10.502 10.300 10.8282017 10.000 10.560 10.300 10.886

94
Performance Record (Unaudited)
“AM–USD”classunits
Bid OfferYear Lowest Highest Lowest Highest
USD USD USD USD
2007 7.940 8.430 8.410 8.9302008 8.060 8.470 8.320 8.7402009 6.730 8.190 6.950 8.4502010 8.200 8.850 8.460 9.1302011 8.800 9.220 9.080 9.5202012 8.493 9.314 8.756 9.6022013 8.860 9.555 9.134 9.8512014 8.770 9.335 9.041 9.6242015 9.176 9.439 9.460 9.7312016 9.049 9.508 9.329 9.8022017 9.049 9.566 9.263 9.862
“AMH–AUD”classunits
Bid OfferYear Lowest Highest Lowest Highest
AUD AUD AUD AUD
2013 9.239 10.026 9.525 10.3362014 9.194 9.823 9.478 10.1272015 9.700 10.026 10.000 10.3372016 9.564 10.035 9.860 10.3442017 9.546 10.095 9.793 10.407
“AMH–EUR”classunits
Bid OfferYear Lowest Highest Lowest Highest
EUR EUR EUR EUR
2013 9.391 10.138 9.681 10.4522014 9.295 9.861 9.582 10.1662015 9.715 10.030 10.016 10.3412016 9.567 10.026 9.864 10.3362017 9.512 10.080 9.724 10.392

95
Performance Record (Unaudited)
“IC–USD”classunits
Bid OfferYear Lowest Highest Lowest Highest
USD USD USD USD
2011 10.000 10.070 10.000 10.0702012 9.474 10.753 9.474 10.7532013 10.613 11.407 10.613 11.4072014 10.623 11.781 10.623 11.7812015 11.739 12.310 11.739 12.3102016 12.030 13.038 12.030 13.0382017 12.596 13.255 12.596 13.255
“ID–USD”classunits
Bid OfferYear Lowest Highest Lowest Highest
USD USD USD USD
2007 8.450 9.430 8.460 9.4402008 8.610 9.280 8.620 9.2902009 7.280 9.050 7.290 9.0602010 8.660 9.870 8.670 9.8802011 9.450 10.100 9.460 10.1002012 9.150 10.395 9.150 10.3952013 9.655 10.594 9.655 10.5942014 9.443 10.523 9.443 10.5232015 10.003 10.541 10.003 10.5412016 9.903 10.759 9.903 10.7592017 10.057 10.573 10.057 10.573
“ZD–USD”classunits
Bid OfferYear Lowest Highest Lowest Highest
USD USD USD USD
2010 8.980 9.910 8.990 9.9202011 9.490 10.200 9.500 10.2002012 9.245 10.533 9.247 10.5332013 9.844 10.785 9.844 10.7852014 9.634 10.723 9.634 10.7232015 10.246 10.789 10.246 10.7892016 10.156 11.060 10.156 11.0602017 10.386 10.957 10.386 10.957

96
Performance Record (Unaudited)
(b) Totalnetassetvalue(calculatedinaccordancewithHKFRS)
2017 2016 2015 2014USD USD USD USD
Total net asset value 2,396,009,475 3,385,714,159 1,494,420,242 1,104,740,980
(c) Netassetvalueperunit(calculatedinaccordancewithHKFRS)
Denominationcurrency 2017 2016 2015 2014
Net asset value per unit– “AC – USD” class units USD 13.029 12.874 12.044 11.719– “AM – HKD” class units HKD 10.233 10.472 10.184 10.253– “AM – USD” class units USD 9.263 9.484 9.190 9.291– “AMH – AUD” class units AUD 10.340 9.999 9.705 9.761– “AMH – EUR” class units EUR 10.689 10.001 9.738 9.815– “IC – USD” class units USD 13.255 13.038 12.143 11.766– “ID – USD” class units USD 10.163 10.517 9.996 10.077– “ZD – USD” class units USD 10.514 10.727 10.245 10.269
(d) Totalexpenseratio
2017
Averagenetassetvalue Totalexpenses
Totalexpenseratio
USD USD %
– “AC – USD” class 6,980,377 78,981 1.13%– “AM – HKD” class 709,104,409 8,026,273 1.13%– “AM – USD” class 1,768,270,911 20,010,995 1.13%– “AMH – AUD” class 122,789,832 1,396,848 1.14%– “AMH – EUR” class 21,196,393 248,746 1.17%– “IC – USD” class 144,146,968 979,294 0.68%– “ID – USD” class 30,716,148 208,730 0.68%– “ZD – USD” class 86,194,423 108,973 0.13%
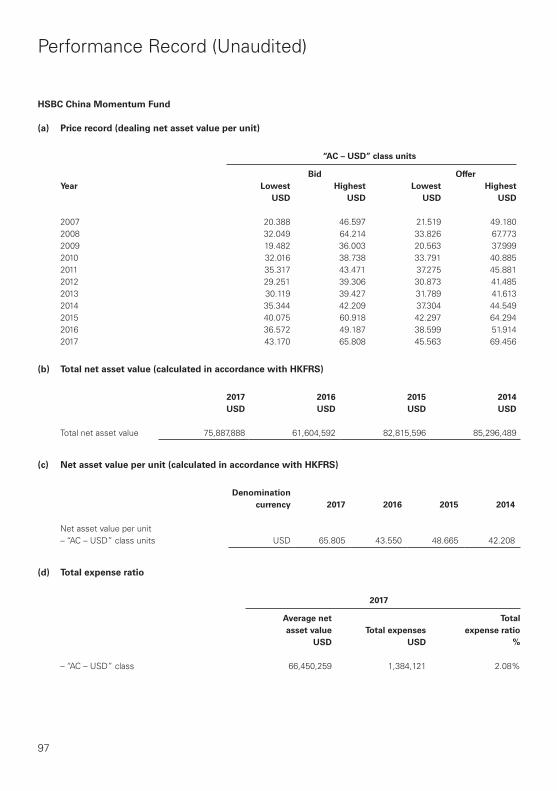
97
Performance Record (Unaudited)
HSBCChinaMomentumFund
(a) Pricerecord(dealingnetassetvalueperunit)
“AC–USD”classunits
Bid OfferYear Lowest Highest Lowest Highest
USD USD USD USD
2007 20.388 46.597 21.519 49.1802008 32.049 64.214 33.826 67.7732009 19.482 36.003 20.563 37.9992010 32.016 38.738 33.791 40.8852011 35.317 43.471 37.275 45.8812012 29.251 39.306 30.873 41.4852013 30.119 39.427 31.789 41.6132014 35.344 42.209 37.304 44.5492015 40.075 60.918 42.297 64.2942016 36.572 49.187 38.599 51.9142017 43.170 65.808 45.563 69.456
(b) Totalnetassetvalue(calculatedinaccordancewithHKFRS)
2017 2016 2015 2014USD USD USD USD
Total net asset value 75,887,888 61,604,592 82,815,596 85,296,489
(c) Netassetvalueperunit(calculatedinaccordancewithHKFRS)
Denominationcurrency 2017 2016 2015 2014
Net asset value per unit– “AC – USD” class units USD 65.805 43.550 48.665 42.208
(d) Totalexpenseratio
2017
Averagenetassetvalue Totalexpenses
Totalexpenseratio
USD USD %
– “AC – USD” class 66,450,259 1,384,121 2.08%

98
Performance Record (Unaudited)
HSBCChinaGrowthFund
(a) Pricerecord(dealingnetassetvalueperunit)
“AC–HKD”classunits
Bid OfferYear Lowest Highest Lowest Highest
HKD HKD HKD HKD
2011 9.250 9.881 9.763 10.4282012 6.641 9.483 7.009 10.0082013 6.725 8.909 7.098 9.4032014 7.508 9.571 7.924 10.1012015 9.076 13.776 9.579 14.5352016 8.208 10.985 8.660 11.5982017 9.725 13.285 13.285 14.018
“AC–USD”classunits
Bid OfferYear Lowest Highest Lowest Highest
USD USD USD USD
2008 6.960 12.606 7.390 13.3042009 3.642 7.781 3.844 8.2122010 7.256 9.374 7.658 9.8942011 8.484 10.361 8.955 10.9362012 6.545 9.299 6.908 9.8142013 6.626 8.780 6.993 9.2662014 7.402 9.448 7.812 9.9722015 8.951 13.593 9.447 14.3462016 8.052 10.853 8.498 11.4542017 9.591 13.015 10.122 13.736
(b) Totalnetassetvalue(calculatedinaccordancewithHKFRS)
2017 2016 2015 2014USD USD USD USD
Total net asset value 391,273,162 430,168,440 758,416,160 260,200,330

99
Performance Record (Unaudited)
(c) Netassetvalueperunit(calculatedinaccordancewithHKFRS)
Denominationcurrency 2017 2016 2015 2014
Net asset value per unit– “AC – HKD” class units HKD 13.198 9.828 10.850 9.571– “AC – USD” class units USD 13.015 9.690 10.746 9.447
(d) Totalexpenseratio
2017
Averagenetassetvalue Totalexpenses
Totalexpenseratio
USD USD %
– “AC – HKD” class 91,939,201 1,542,346 1.68%– “AC – USD” class 301,380,535 5,055,937 1.68%

100
Performance Record (Unaudited)
HSBCAsianHighYieldBondFund
(a) Pricerecord(dealingnetassetvalueperunit)
“AC–HKD”classunits
Bid OfferYear Lowest Highest Lowest Highest
HKD HKD HKD HKD
2011 9.965 10.196 10.517 10.7612012 8.781 10.994 9.268 11.6032013 10.997 12.136 11.606 12.8082014 11.103 12.670 11.447 13.0622015 11.948 12.793 12.610 13.5022016 12.188 13.968 12.863 14.7422017 13.684 15.013 14.592 15.848
“AC–SGD”classunits
Bid OfferYear Lowest Highest Lowest Highest
SGD SGD SGD SGD
2012 10.001 10.823 10.555 11.4232013 10.729 11.897 11.323 12.5562014 11.137 12.386 11.482 12.7702015 12.313 13.648 12.995 14.4042016 13.388 14.895 14.130 15.2702017 14.652 16.149 15.426 17.044
“AC–USD”classunits
Bid OfferYear Lowest Highest Lowest Highest
USD USD USD USD
2011 9.943 10.168 10.494 10.7312012 8.765 11.021 9.251 11.6322013 11.024 12.156 11.635 12.8302014 11.128 12.702 11.473 13.0952015 11.970 12.825 12.633 13.5362016 12.217 13.993 12.894 14.7682017 13.706 14.952 14.465 15.780

101
Performance Record (Unaudited)
“AM–HKD”classunits
Bid OfferYear Lowest Highest Lowest Highest
HKD HKD HKD HKD
2011 9.965 10.164 10.571 10.7272012 8.650 10.344 9.129 10.9172013 9.920 10.903 10.474 11.5072014 9.800 10.553 10.104 10.8802015 9.664 10.593 10.199 11.1802016 9.445 10.304 9.968 10.8752017 9.943 10.382 10.260 10.957
“AM–USD”classunits
Bid OfferYear Lowest Highest Lowest Highest
USD USD USD USD
2011 9.944 10.139 10.495 10.7012012 8.635 10.367 9.113 10.9412013 9.945 10.920 10.496 11.5252014 9.821 10.584 10.125 10.9122015 9.686 10.624 10.223 11.2132016 9.449 10.327 9.973 10.8992017 9.964 10.405 10.204 10.982
“AMH–AUD”classunits
Bid OfferYear Lowest Highest Lowest Highest
AUD AUD AUD AUD
2014 9.887 10.281 10.193 10.5992015 9.391 10.319 9.911 10.8912016 9.176 10.052 9.684 10.6092017 9.690 10.123 9.953 10.684
“AMH–EUR”classunits
Bid OfferYear Lowest Highest Lowest Highest
EUR EUR EUR EUR
2014 10.009 10.334 10.319 10.6542015 9.418 10.374 9.940 10.9492016 9.117 9.918 9.622 10.4682017 9.544 9.993 9.736 10.547

102
Performance Record (Unaudited)
“IC–USD”classunits
Bid OfferYear Lowest Highest Lowest Highest
USD USD USD USD
2011 9.947 10.175 10.498 10.7392012 8.778 11.074 9.264 11.6882013 11.077 11.940 11.691 12.6022017 9.799 10.728 10.425 11.322
“ZD–USD”classunits
Bid OfferYear Lowest Highest Lowest Highest
USD USD USD USD
2017 9.711 10.684 10.388 11.276
(b) Totalnetassetvalue(calculatedinaccordancewithHKFRS)
2017 2016 2015 2014USD USD USD USD
Total net asset value 968,077,720 785,400,152 643,721,892 795,853,163
(c) Netassetvalueperunit(calculatedinaccordancewithHKFRS)
Denominationcurrency 2017 2016 2015 2014
Net asset value per unit– “AC – HKD” class HKD 14.496 13.974 12.649 12.668– “AC – SGD” class SGD 16.203 14.805 13.645 12.391– “AC – USD” class USD 14.526 14.267 12.677 12.699– “AM – HKD” class HKD 10.193 10.341 9.860 10.498– “AM – USD” class USD 10.204 10.243 9.886 10.528– “AMH – AUD” class AUD 10.524 10.011 9.586 10.169– “AMH – EUR” class EUR 10.702 9.893 9.586 10.284– “IC – USD” class USD 10.425 N/A N/A N/A– “ZD – USD” class USD 10.388 N/A N/A N/A

103
Performance Record (Unaudited)
(d) Totalexpenseratio
2017
Averagenetassetvalue Totalexpenses
Totalexpenseratio
USD USD %
– “AC – HKD” class 1,213,140 17,010 1.40%– “AC – SGD” class 107,065 1,513 1.41%– “AC – USD” class 9,243,815 130,284 1.41%– “AM – HKD” class 268,858,046 3,803,095 1.41%– “AM – USD” class 571,411,246 8,070,337 1.41%– “AMH – AUD” class 28,176,548 397,712 1.41%– “AMH – EUR” class 13,127,168 186,456 1.42%– “IC – USD” class 7,021,384 71,572 1.02%– “ZD – USD” class 134,667 214 0.16%

104
Administration
Managerandregistrar’sagentHSBC Investment Funds (Hong Kong) LimitedHSBC Main Building1 Queen’s Road CentralHong Kong
DirectorsoftheManagerStuart Glenn BERRYPedro Augusto BOTELHO BASTOSGuillermo Eduardo MALDONADO CODINAChun Pong Stephen TAMKa Yin Joanne LAU
InvestmentadviserHSBC Global Asset Management (Hong Kong) LimitedHSBC Main Building1 Queen’s Road CentralHong Kong
Custodian,trusteeandregistrarHSBC Trustee (Cayman) LimitedP.O. Box 484HSBC House68 West Bay RoadGrand Cayman KY1-1106Cayman Islands
AuditorsKPMGP.O. BOX 493Century YardCricket SquareGrand Cayman KY1-1106Cayman Islands

105
Board of Directors of HSBC Investment Funds (Hong Kong) Limited
Stuart Glenn BERRYPedro Augusto BOTELHO BASTOSGuillermo Eduardo MALDONADO-CODINAChun Pong Stephen TAMKa Yin Joanne LAU

HIF
T071
7A
P
rinte
d in
the
Hon
g Ko
ng S
AR
Issued by HSBC Global Asset Management (Hong Kong) Limited