Embed Size (px)
Citation preview

HSBC Global Investment Funds
Audited Report for the year ended 31 Murch 2007
Audited report for the year ended as at 31 March 2007
Societe d'lnvestissernent a Capital Variable (SICAV), Luxembourg
HSBC Global Investment Funds - .

.. . .....
... . 2 . .... . .
Information concerning the distribution of shares of HSBC Global Investment Funds in Switzerland or from Switzerland. HSBC Private Bank (Suisse) SA, Quai du General Guisan 2, case postale 3580 CH-1211 Geneva 3, is the legal representative of the Fund in Switzerland and the Fund's paying agent. The prospectus, simplified prospectuses, articles and annual and semi-annual reports of the Fund may be obtained free of charge upon request from the HSBC Private Bank (Suisse) S.A. A breakdown of all the transactions carried out on behalf of each sub-fund of HSBC Global Investment Funds in the period under review can be obtained, free of charge, from the Fund's representative in Switzerland.
Information concerning the distribution of shares of HSBC Global Investment Funds in Germany or from Germany. HSBC Trinkaus & Burkhardt AG, 21-23 Konigsallee, 0-40212 Dusseldorf, is the legal representative of the Fund in Germany and the Fund's paying agent. The prospectus, simplified prospectuses, articles and annual and semi-annual reports of the Fund may be obtained free of charge upon request from the HSBC Trinkaus & Burkhardt AG. A breakdown of all the transactions carried out on behalf of each sub-fund of HSBC Global Investment Funds in the period under review can be obtained, free of charge, from the Fund's representative in Germany.
No subscription can be received on the basis of financial reports. Subscriptions are only valid if made on the basis of the current Prospectus accompanied by the latest annual and the most recent semi-annual report, if published thereafter.
Audited report for the year ended as at 31 March 2007
I
I
~
HSBC Global Investment Funds

. -
Table of Contents _. -
Board of Directors.. . . . . . . . . . . . . . . . . . . . . . . . . . . . . . . . . . . . . . . . . . . . . . . . . . . . . . . . . . . . . . . . . . . . . . . . . . . . . . . . . 4
Management and Administration. . . . . . . . . . . . . . . . . . . . . . . . . . . . . . . . . . . . . . . . . . . . . . . . . . . . . . . . . . . . . . . . . . . . . 5
Directors' Report . . . . . . . . . . . . . . . . . . . . . . . . . . . . . . . . . . . . . . . . . . . . . . . . . . . . . . . . . . . . . . . . . . . . . . . . . . . . . . . . . 7
Auditor's Report.. . . . . . . . . . . . . . . . . . . . . . . . . . . . . . . . . . . . . . . . . . . . . . . . . . . . . . . . . . . . . . . . . . . . . . . . . . . . . . . . . . 15
Statement of Net Assets as at 31 March 2007 . . . . . . . . . . . . . . . . . . . . . . . . . . . . . . . . . . . . . . . . . . . . . . . . . . . . . 16
. . . . . . . . . . . . . . . . . . . . . 40
Notes to the Financial Statements. . . . . . . . . . . . . . . . . . . . . . . . . . . . . . . . . . . . . . . . . . . . . . . . . . . . . . . . . . . . . . 51
Comparative Table of Net Assets. . . . . . . . . . . . . . . . . . . . . . . . . . . . . . . . . . . . . . . . . . . . . . . . . . . . . . . . . . . . . . . . . . 84
Portfolio of Investments and Other Net Assets.. . . . . . . . . . . . . . . . . . . . . . . . . . . . . . 97
Currency Conversion Table,. . . . . . . . . . . . . . . . . . . . . . . . . . . . . . . . . . . . . . . . . . . . . . . . . . 235
Dealing Day of the Fund . . . . . . . . . . . . . . . . . . . . . . . . . . . . . . . . . . . . . . . . . . . . . . . . . . . . . . . . . . . . . . . . . 236
Statement of Operations and Changes in Net Assets., . . . . . . . . . . . . . . . .
. . .
. . .
HSBC Global Investment Funds . . . .

Board of Directors 3- Marc-Andre Bechet, Managing Director, RBC Dexia Investor Services Bank S.A., 14, Porte de France, L-4360 Esch-sur-Alzette, Grand Duchy of Luxembourg. (resigned on 19 May 2006)
Simeon Brown, Chief Operating Officer, HSBC Investments (Hong Kong) Limited, Level 22, HSBC Main Building, 1, Queen's Road Central, Hong Kong.
Sylvie Vigneaux, Head of Regulatory and Savings, HSBC Investments (France), 4, Place de la Pyramide, lmmeuble Ile de France, La Defense 9, 92800 Puteaux, France.
Didier Deleage, Chief Operating Officer, HSBC Investments (France), 4, Place de la Pyrarnide, lmmeuble He de France, La Defense 9, 92800 Puteaux, France. (since 19 May 2006)
Deshmukh-Rao Dhondee, Assistant Manager, HSBC Offshore Banking Unit, The Hong Kong and Shanghai Banking Corporation Limited Les Cascades, 5th Floor, Edith Cavell Street, Port Luis, Mauritius. (resigned on 31 May 2007)
David Dibben, Chief Operating Officer, HSBC Group Investment Businesses Limited, 8 Canada Square, London E14 5HQ, United Kingdom. (since 19 May 2006)
George Efthirniou, Global Chief Operating Officer, HSBC Group Investment Businesses Limited, 8 Canada Square, London E14 5HQ, United Kingdom.
Laurent Facque, Chief Operating Officer, HSBC Investments (France), 4, Place de la Pyramide, lmrneuble Ile de France, La DBfense 9, 92800 Puteaux, France (resigned on 19 May 2006)
Bryan Greener, Head of Product Management - Global Products, HSBC Group Investment Businesses Limited, Level 21,8 Canada Square, London E14 5HQ, United Kingdom.
Thies Clernenz, Chief Operating Officer, HSBC Investments Deutschland Gmbh Konigsallee 21/23,40212 Dusseldorf, Germany. (since 28 July 2006)
Jennifer Hau Kau Fong, Vice President, HSBC Offshore Banking Unit, The Hong Kong and Shangai Banking Corporation Limited, Les Cascades, 5th Floor, Edith Cavell Street, Port Luis, Mauritius (since 31 May 2007)
AL- HSBC Global Investment Funds
-. -~ .-
Management and Administration ._
b Registered Office 69, route d’Esch, L-1470 Luxembourg, Grand Duchy of Luxembourg (until 1 June 2006). 40, avenue Monterey, L-2163 Luxembourg, Grand Duchy of Luxembourg (since I June 2006).
b Management Company HSBC Investment Funds (Luxembourg) S.A., 40, avenue Monterey, L-2163 Luxembourg, Grand Duchy of Luxembourg.
Custodian, Administration Agent, Transfer Agent and Central Paying Agent Dexia Banque lnternationale a Luxembourg S.A., 69 route d’Esch, L-1470 Luxembourg (until 1 June 2006). RBC Dexia Investor Services Bank S A , 14, Porte de France, L- 4360 Esch-sur-Alzette, Grand Duchy of Luxembourg (RBC Dexia Investor Services Bank S.A. since I June 2006).
b
b Investment Advisers Halbis Capital Management (Hong Kong) Limited (formerly HSBC Halbis Partners (Hong Kong) Limited), HSBC Main Building, 1, Queen’s Road Central, Hong Kong.
HSBC Investments (USA) Inc., 452 Fifth Avenue, 18th Floor, New York, NY 10018, USA.
Halbis Capital Management (USA) Inc. (formerly HSBC Halbis Partners (USA) Inc.), 452 Fifth Avenue, 18th Floor, New York, NY 1001 8, USA.
Sinopia Asset Management (UK) Limited, 8, Canada Square, London E14 5HQ, United Kingdom (since 21 May 2007) HSBC Investments (UK) Limited, 8, Canada Square, London E14 5HQ, United Kingdom. (until 21 May 2007)
Halbis Capital Management (UK) Limited (formerly HSBC Halbis Partners (UK) Limited), 8, Canada Square, London E14 5HQ, United Kingdom.
Halbis Capital Management (France) (formerly HSBC Halbis Partners (France)), lmmeuble He de France, 4, Place de la Pyramide, La Defense 9, 92800 Puteaux, France.
HSBC Investment FCP (France) (formerly HSBC FCP2 (France)), lmmeuble He de France, 4, Place de la Pyramide, La Defense 9, 92800 Puteaux, France. (since 1 August 2006).
HSBC Bank Brazil SA - Banco Multiplo, Travessa Oliviera Belo, 1 I-B, 80020-030 Curitiba, Brazil.
HSBC Investments Deutschland GmbH, Konigsallee 21/23, D-40212 Dusseldorf, Germany.
Sinopia Asset Management, lmmeuble He de France, 4, Place de la Pyramide, La Defense 9, 92800 Puteaux, France .
b Share Distributor HSBC Investment Funds (Luxembourg) S.A., 40, avenue Monterey, L-2163 Luxembourg, Grand Duchy of Luxembourg.
Austria and Germanv Share Distributor HSBC Trinkaus & Burkhardt AG, Konigsallee 21/23, D-40212 Dusseldotf, Germany.
Honq Konq Remesentative and Share Distributor HSBC Investment Funds (Hong Kong) Limited, HSBC Main Building, I Queen’s Road Central, Hong Kong,
HSBC Global Investment Funds -
-~
Management and Administration (continued)
-
b Share Distributor (continued)
United Kinqdom Representative HSBC Investments (UK) Limited, 8, Canada Square, London E14 5HQ, United Kingdom, Tel: (44) 207 991 8888 Fax: (44) 207 024 1999
Republic of Ireland Representative HSBC Securities Services (Ireland) Limited, HSBC House, Harcourt Centre, Harcourt Street, Dublin 2, Ireland.
Jersey Rewesentative HSBC Funds Nominee (Jersey) Limited, HSBC House, Esplanade, St Helier, Jersey, JEI IHS Channel Islands.
Sinqapore Rewesentative and Share Distributor HSBC Investments (Singapore) Limited, 21, Collyer Quay, # I 3-02 HSBC Building, Singapore 049320, Singapore.
Swiss Representative HSBC Private Bank (Suisse) S.A., Quai du General Guisan 2, Case postale 3580, CH-I211 Geneva 3, Switzerland.
Korea Rewesentative and Share Distributor HSBC Korea Ltd, HSBC Building #25, I-Ka, Bongrae-Dong, Chung-Ku, Seoul, Korea.
Share Distributor for Continental Europe HSBC Investments FCP (France) S.A., lmmeuble Ile de France, 4, Place de la Pyramide, La Defense 9,92800 Puteaux, France.
b Paying Agent in Hong Kong The Hongkong and Shanghai Banking Corporation Limited, HSBC Main Building, 1, Queen’s Road Central, Hong Kong.
b Auditor KPMG Audit S.a r.L, 31, alee Scheffer, L-2520 Luxembourg, Grand Duchy of Luxembourg.
b Legal Advisers
Luxembourg Elvinger, Hoss & Prussen, 2, Place Winston Churchill, B.P. 425, L-2014 Luxembourg, Grand Duchy of Luxembourg.
United Kinqdom Linklaters and Paines, Barrington House, 59-67, Gresham Street, London EC2V 7JA, United Kingdom.
A- HSBC Global Investment Funds
Directors' Report
Asia ex Japan Equity For the year ending March 2007, the fund delivered a return of 25.53% (gross of fees, share class AC) outperforming the benchmark by 160 basis points in US dollar terms. Stock selection amongst the financial and consumer sectors contributed positively, offsetting the negative impact of material stocks exposure. We continue to expect strong growth for the region given attractive valuations. In terms of positioning, we continue to favour domestic consumption plays and interest rate sensitives such as bank and property stocks. We are currently underweight in cyclicals, given expectations for a moderation in global growth, and continue to fund our overweight positions through telecom and utility picks.
Asia ex Japan Equity Smaller Companies For the year ending March 2007, the fund delivered a return of 36.70% (gross of fees, share class AC) strongly outperforming the benchmark by 1064 basis points in US dollar terms. Stock selection in the consumer sector contributed significantly, offsetting the negative impact of our telecom exposure. We continue to expect strong growth for the region given attractive valuations. In terms of positioning, we continue to favour domestic consumption plays and interest rate sensitives such as bank and property stocks. We are underweight in cyclicals, given expectations for a moderation in global growth, and continue to fund our overweight positions through telecom and utility picks.
Asia Pacific ex Japan Equity High Dividend For the year ending March 2007, the fund delivered a return of 23.93% (gross of fees, share class AD) in US dollar terms. Stock selection in the technology sector and material stocks contributed positively during the period, offsetting the poor performance of some industrial stocks. We continue to expect strong growth for the region given attractive valuations. The fund will maintain its strategy of selecting quality high yield and reasonable growth stocks.
Brazil Equity For the year ending March 2007, the fund returned 30.90% (net of fees, share class AD) in US dollar terms. A favourable outlook for the global economy as well as improving fundamentals in Brazil helped support equity markets. Inflation ended the period below the Central Bank's target at 4% and appears under control. As a result interest rates have fallen, dropping from 19.75% in September 2005 to 12.75% at the end of March 2007. These two factors have contributed to the recovery in consumption that benefits a good portion of listed companies, whilst the positive external scenario benefits exporting companies. We remain positive on Brazilian equity prospects that should continue to benefit from better fundamentals through stronger growth and lower risk perception, whilst the global economy remains stable.
BRlC Markets For the year ending March 2007, the fund generated a return of 29.2% (gross of fees, share class ZC) in US dollar terms. Over this same period, the official MSCl BRlC index rose 24.3%. whilst an equally weighted index of MSCl BRlC countries gained 24.2%. China has been the strongest performing country index, rising 43.3%, while Russia has lagged all others with a gain of 16.2%. Our country allocation, in the last year, has generally been skewed in favour of Brazil & Russia, while allocation to China has varied between overweight and neutral. Fund exposure to India has been persistently underweight during this review period.
BRlC Markets Equity Since inception, on 1 June 2006, to the end of March 2007, the fund returned 26.4% (gross of fees, share class EC) in US dollar terms. Within the ERIC markets, China and India have posted the strongest returns. Strong Chinese performance has been led by leading market-cap stocks, particularly China Mobile and China Life Insurance, whilst strong inflows into the technology sector benefited the India economy. Russia underperformed the other BRlC markets, dampened by profit taking in energy stocks such as Gazprom & Surgutneftegaz. Positive country allocation in Brazil and China in the first quarter of 2007 added to fund performance. We remain neutral on the outlook for the BRlC markets, with overweight positions in Brazil and India, and an underweight position in China.
Chinese Equity For the year ending March 2007, the fund delivered a return of 44.92% (gross of fees, share class AD) in US dollar terms, underperforming the benchmark by 152 basis points. The single most important factor for our underperformance was our structural underweight in China Mobile, which represents about 17% of the entire
A-- .- HSBC Global Investment Funds
benchmark, as the stock rose 5.7% for the first quarter 2007 while the index dropped 4.1%. Stock selection in the financial sector and in consumer stocks contributed positively during the period, offsetting the poor performance of some industrial stocks and our underweight in the telecoms sector. Our key overweight positions remain in the financial sector and in domestic consumption plays.
Emerging Europe Equity For the year ending March 2007, the fund returned 14.66% (net of fees, share class AD), slightly underperforming the market in euro terms. Our Underperformance was mainly a result of our zero weighting to Russian stocks as the fund had been structured as a European convergence fund until it changed in October 2006. After the benchmark changed to include Russian and Turkish stocks, the fund began to outperform the market thanks largely to positive stock selection in the energy sector & telecom stocks. As fundamentals in Eastern Europe remain attractive in the long term and valuation levels are not excessive, we see further upside for the equity markets in the region.
Euroland Equity For the year ending March 2007, the fund returned 14.42% (gross of fees, share class AC) in euro terms, underpetforming the MSCl EMU index by 0.47%. There was a strong underperformance in the second quarter 2006 followed by a steady improvement over the following three quarters. The poor performance was due in part to positions in technology stocks, which underperformed as the upturn in corporate technology spending cycle did not materialise. By the fourth quarter, we had started to buy companies that appear most resilient in the face of a cyclical downturn because of their superior business models and these outperformed in early 2007. Looking ahead, we are confident that attractively valued companies, that are improving profitability without jeopardizing long term prospects will eventually be rewarded by the market.
Euroland Equity Smaller Companies For the year ending March 2007, the fund posted a return of 25.29% (gross of fees, share class AC), outperforming the benchmark return of 21.01%, and is ranked 1/19 in its peer group. The market was boosted by the strength of the global economy alongside strong growth in Eastern Europe, infrastructure investments in China, and worries over the scarcity of natural resources. A strong overweight position in cyclical stocks was a key contributor to fund performance over the period, as was stock picking: we purchase stocks only after a due diligence process that involves meeting with the company management. We are highly confident on growth prospects as we believe Euroland smaller company earnings should grow by 17% to 19% in 2007 even after rising by more than 22% in 2006.
Euroland Value Creation For the year ending March 2007, the fund returned 8.73% (gross of fees, share class MIC) compared to the benchmark return of 14.66%. Although the underperformance is significant, it is worth mentioning that 80% of the underperformance came about between April and July 2006 and that, in July, the fund’s investment philosophy was significantly modified. Since that date, the fund has focused on companies that have high growth characteristics and has underperformed by less than 100 basis points. Since the change of philosophy, underperformance can be mainly blamed on the zero exposure to a number of restructuring companies that have strongly outperformed since the beginning of 2007.
Sustainability Leaders For the year ending March 2007, the fund has returned 14.19% (gross of fees, share class MID) in euro terms, outperforming the MSCl Europe Index by 0.2%. The strategy of the fund is to focus on the best SRI-ranked stocks in the Pan European universe with an emphasis on environmental friendly small-caps. Stock selection in the last six months was very beneficial to fund performance, especially in the renewable energy space. Solarworld, which develops and produces solar technologies, was one of the best contributors to returns. Finally, relative to its peer group, the fund has performed reasonably well over the period.
Europe ex UK Equity For the year ending March 2007, the fund gained 11.2% (net of fees, share class AC) in euro terms, underperforming the FT S&P Europe ex UK Index, which rose by 15.6%. Basic materials, lifted by solid demand and rising commodity prices, and restructuring in the industrials sector boosted returns. Market sentiment was also helped by an improvement in the European economy led by Germany. The fund’s underperformance came from a lack of holdings in a number of takeover candidates, such as ABN Amro,
I
HSBC Global Investment Funds ~.
t
I
Arcelor and Endessa. The outlook remains positive but, with forecasts for 2007 growth in the high single digits and market valuations on the expensive side of long term averages, equity markets may need further merger & acquisition activity for support.
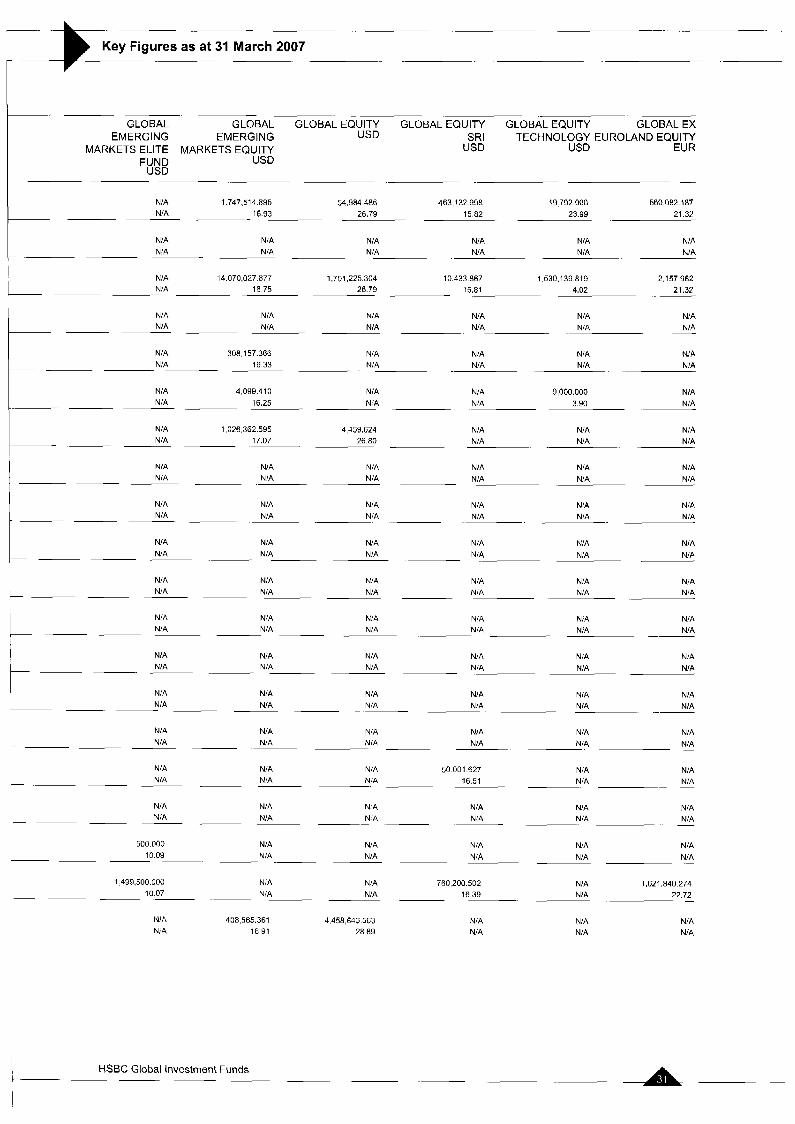
Global Emerging Markets Elite Fund The Global Emerging Markets Elite Fund was launched on the 5th February 2007.
Global Emerging Markets Equity For the year ending March 2007, the fund outperformed and returned 20.22% (net of fees, share class AC). Markets sold off heavily in MaylJune 2006 but recovered well moving to new highs. We saw a further setback in FebruarylMarch 2007, although most Emerging Markets ended March in positive territory and close to their earlier peaks. Volatility is likely to be an issue in the short-term, although levels remain around historical lows. With no clear evidence of Japan's export-led recovery spreading to domestic sectors and with inflation at low levels, it is unlikely that we will see a rate increase in the near-term and fears of a significant unwinding of the carry trade appear to be overdone. Global equity valuations, particularly among Emerging Markets, remain supportive but selective markets, like India and Russia, look expensive.
Global Equity For the year ending March 2007, the fund underperformed and returned 8.63% (net of fees, share class AD). Exposure to selective stocks within Emerging Markets hurt in the MaylJune 2006 correction and our overweight position within global sectors in Japan detracted as Japan lagged. We closed this overweight in late 2006, and now remain underweight in Japan which has helped recent performance. The rate of global economic growth may slow, but the US should have a soft landing and consumer expenditure should remain supported by low unemployment and consistent job creation. We remain underweight in the US and Japan within the global sectors, and retain exposure to selective Emerging Market stocks where we see attractive riskheward opportunities. We will look to add selectively to our key stock positions where we have the greatest conviction in long-term value.
Global Equity SRI For the year ending March 2007, the fund gained 18.86% (gross of fees, share class AC) in US dollar terms, slightly outperforming the MSCl World Index, which rose by 18.6%. Positive growth, rising inflation and the high level of energy prices were the prevailing global economic conditions over the period and should remain so in the near term at least. These conditions provide a neutral background for global equity markets and in this environment the portfolio will maintain exposure to stocks with good value and momentum.
Global Equity Technology For the year ending March 2007, the fund gained 15.56% (gross of fees, share class AC) in US dollar terms, outperforming its customised benchmark, which rose by 12.92%. Positive growth, rising inflation and the high level of energy prices were the prevailing global economic conditions over the period and should remain so in the near term at least. These conditions provide a neutral background for global equity markets and in this environment the portfolio will maintain exposure to stocks with good value and momentum.
Global ex Euroland Equity For the year ending March 2007, the fund returned 2.22% (gross of fees, share class AC) in euro terms, underperforming the benchmark, which rose 3.10%. Performance was slightly behind peer group as the fund is restricted from investing in countries outside the OECD, and was therefore unable to benefit from the outpetformance of Emerging Markets. The fund suffered from its geographical allocation, notably its overweight positions in Japan and North America, but saw positive contributions from stock selection in North America and Europe. This positive stock picking effect is due to a change in the fund's investment philosophy (low number of holdings based on strong fundamental convictions, low turnover) reflecting Halbis' approach to investment management.
Hong Kong Equity For the year ending March 2007, the fund posted a return of 29.31% (gross of fees, share class PD), outperforming the benchmark, the Hang Seng Index, which posted a gain of 28.55%. The Hong Kong equity market benefited from strong liquidity inflows and the robust economic growth in Hong Kong and China. Our holdings in China-related consumer stocks, namely Nine Dragons and Peacemark, added most value as the
G HSBC Global Investment Funds 7
Directors' Report (continued) r- former continued to gain market share in the containerboard industry and the latter was re-rated on the back of increasing contribution from its watch retailing operations in China. In addition, our holdings in financial stocks in China contributed positively to performance as robust premium growth for insurers and strong loan growth for banks provided positive earnings growth momentum.
Indian Equity For the year ended 31 March, 2007, the fund returned 14.2% (gross of fees, share class AC), underperforming the benchmark by 764 basis points. Underweight positions in the energy 8 IT services sectors and an overweight position in industrials hurt performance. Significant underperformance came from significant overweight positions in construction 8 cement after government's direct attempts to curb inflation. The outlook for the economy remains robust although we expect the economy to slow with political uncertainty, high inflation, and possible further monetary tightening potential future factors. Floods of new paper are another issue to be mindful of, especially from the financial services sector, due to new capital adequacy requirements. The fund remains defensively positioned.
Japanese Equity For the year ending March 2007, the fund returned 1.01 % (net of fees, share class PD) in Japanese yen terms, outperforming its peer group average and ranking in the first quartile over the period. The positive alpha generated by Sinopia's Quant strategy mainly derived from positive stock selection. Sector allocation generated negative results, main losses stemming from our underweight position in defensive stocks such as healthcare and utilities which outperformed over the period. We remain positive on the Japanese equity market that will benefit from a sound macro economic environment and from the significant earnings growth anticipated for the remainder of 2007 and 2008.
Korean Equity For the year to the end of March 2007, the fund rose by 15.05% (gross of fees, share class AC) in US dollar terms, outperforming the MSCl Korea by 4.9%. Outperformance came from a combination of stock selection and sector allocation. In terms of sectors, an overweight in industrials and an underweight in technology contributed positively to performance. Positive stock selection in the consumer discretionary and technology sectors contributed most to outperformance at the bottom-up level. The outlook for the Korean market is positive, driven by cheap valuations, currently among the lowest in Asia, upward earnings revisions and improving consumer and corporate sentiment ahead of presidential elections in December 2007.
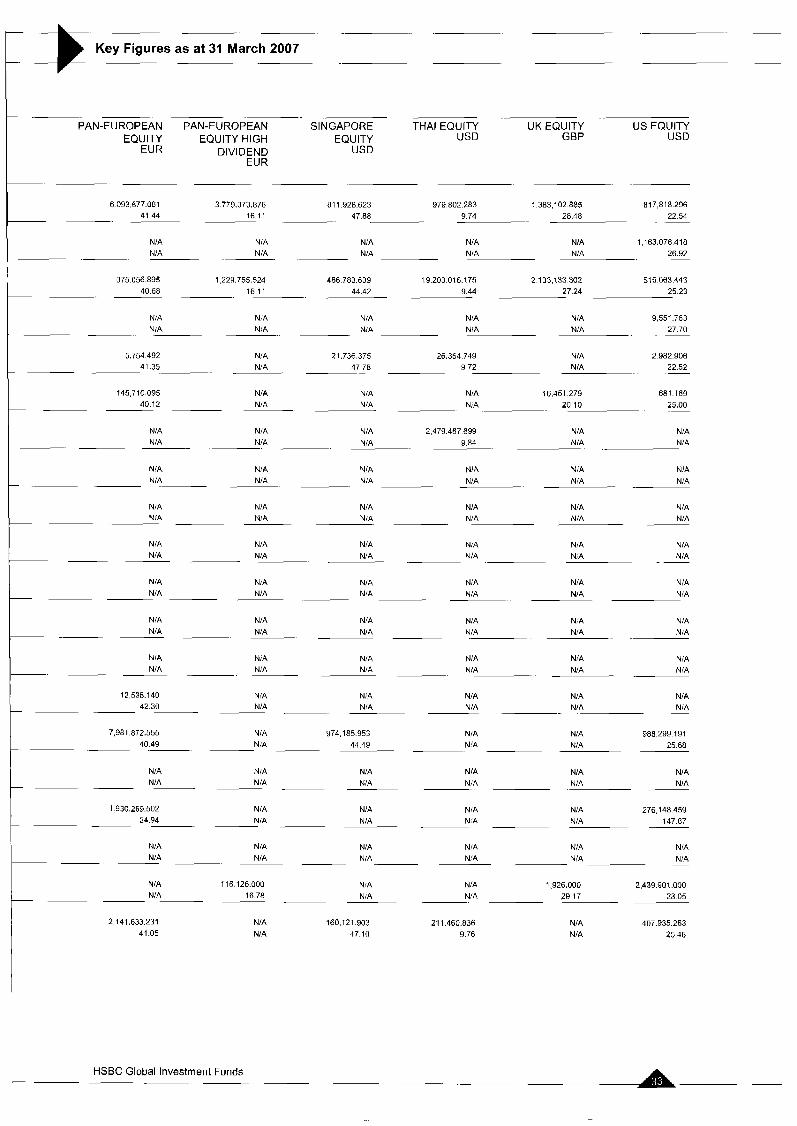
Pan-European Equity For the year ending March 2007, the fund gained 10.7% (net of fees, share class PD) in euro terms, underperforming the FT S&P Europe Index which rose 14.6%. The economic situation was positive with improving economic growth, low inflation and low interest rates. While the ECB did raise interest rates during the period, the levels have not subdued economic activity. Fund underperformance came largely from not owning M&A target stocks and being underweight in the strong performing utilities sector. The outlook for European equity markets remains positive, underpinned by continued growth in earnings and cash flows and reasonable market valuations. The forecast is for single digit growth for 2007, although in past years growth estimates from the start of the year have generally been exceeded.
Pan-European Equity High Dividend For the year ending March 2007, the fund returned 8.94% (net of fees, share class AC) in euro terms, underperforming the MSCl Europe index by 3.04%. The fund is strongly focused on companies with improving dividend prospects and its distinct profile means returns can deviate strongly from the market. In fact the year's entire underperformance came in the second quarter of 2006 from our relatively low exposure to defensive stocks, since these are generally characterised by low dividend yields and below average dividend growth rates. Looking ahead we believe that the strategy should prove resilient. With historically low pay-out ratios (38% of earnings), companies can boost dividend levels if necessary. We also believe that after rising strongly for over 4 years, the market will refocus on income, particularly given the high average dividend yield in Europe.
Singapore Equity For the year ending March 2007, the fund returned 52.5% (share class PD) in US dollar terms, outperforming the MSCl Singapore index, which rose 45.7%, and the peer group average. The fund's key strategy was a
i
HSBC Global Investment Funds

.-
Directors' Report (continued)
large overweight in the niche luxury condominium developers and luxury hotels sectors, which heavily outperformed the index on the back of strong property sales and sharply higher prices. This was partly offset by underperformance from several holdings in quality small-caps following disappointing earning results. The fund remains overweight in luxury hotels, luxury condominium developers, cheap quality small-caps, and high yield shares - positions funded by underweighting most large-cap stocks, especially banks.
Thai Equity For the year ending March 2007, the fund returned 4.0% (net of fees, share class AD) in US dollar terms, lagging the SET total return index, which rose 5.4%, but ahead of its peer group average. The surprise change in government in April 2006 resulted in the fund's holdings in construction companies, including Sino-Thai Engineering and Italian-Thai Development, underperforming. Meanwhile, a price war in the telecoms sector hurt another of our holdings True, whilst an Aapico issued a profit warning. Fund performance benefited heavily from strong returns from Banyan Tree, an Asian hotel operator with a large Thai resort. Given the falling interest rate outlook, the fund remains overweight in banks, property, and hotels, funded by underweight positions in materials and energy.
UK Equity For the year ending March 2007, the fund gained 5.4% (net of fees, share class AC) in sterling terms, underperforming the FTSE All Share Index rise of 11 .I%. Exposure to Daily Mail 8. General Trust was negative following their downturn in cash flows, whilst under-exposure to stocks benefiting from the tremendous rise in commodity prices and in the strong performing utilities sector was negative. On the positive side, the manager correctly identified a number of companies where cash flow returns were high, including lnchcape 8 Homeserve, and management could successfully reinvest in the asset base to grow future cash flow. The outlook for UK equities remains positive underpinned by continued growth in earnings and cash flows and reasonable market valuations with single digit growth predicted for 2007.
US Equity For the year ending March 2007, the fund returned 10.20% (net of fees, share class PD) in US dollar terms, underperforming the S8P 500 Composite, which gained 11.8%. The fund benefited from a good industrial allocation based on our quantitative valuation of the market. Significant gains came from our overweight positions in the energy and materials sectors. The end of period spike in oil prices after inventories declined boosted energy stocks' performance. Successful stock picking also generated positive returns. The outlook for the US remains positive despite the slowdown in company earnings. We expect future earnings to rebound and markets to be sustained by attractive valuations. We think individual companies could offer investors some pleasant surprises.
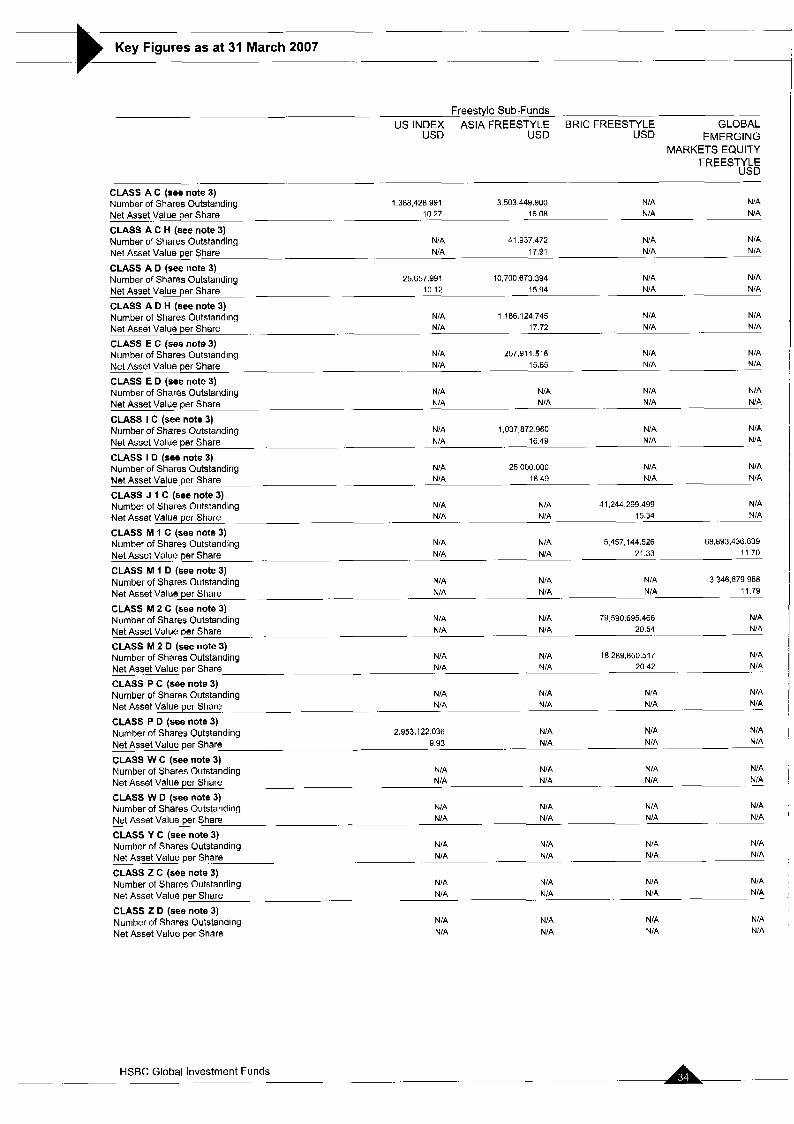
US Index For the year ending March 2007, the fund returned 10.90% (net of fees, share class PD) in US dollar terms, compared with an increase in the S&P500 Composite of 11.8% .The ex-ante BARRA tracking error was around 0.05% over the year. The period saw the run of 17 consecutive interest rate rises in the US come to an end amid signs of slowing economic growth and moderating inflation. Declines in oil prices helped to ease inflation concerns in the US over the year. The US was supported by buoyant merger 8 acquisition activity and the Standard and Poor's index boasted positive performance on strong earnings announcements. Exxon Mobil announced the second highest quarterly earnings in US corporate history during the period.
Asia Freestyle For the year ending March 2007, the fund delivered a return of 25.62% (gross of fees, share class AC), in US dollar terms, and managed to outperform the benchmark by 199 basis points. Stock selection amongst property and consumer stocks contributed positively to performance during the period, offsetting the negative impact of our technology sector exposure. We continue to expect strong growth for the region given attractive valuations. In terms of positioning, we continue to favour domestic consumption plays and interest rate sensitives such as banks and property stocks. We are underweight in cyclicals, given expectations of a moderation in global growth, and continue to fund our overweight positions through telecom and utility stocks.
BRlC Freestyle For the year ending March 2007, the fund gained 20.93% (net of fees, share class M2C). BRlC markets have been among the best performing Emerging Markets over the past 12 months. China was up almost 50% in the
-A HSBC Global Investment Funds ~.

I
12 months to end March 2007 while Emerging Markets overall grew 21%. The Indian equity market corrected sharply in the MaylJune sell-off and more recently has sold off on the back of monetary tightening and a negative Budget. India has been our lowest exposure in the portfolio over the past 12 months though, adding to fund performance. Country allocation and bottom-up stock selection elsewhere in the portfolio added value.
Global Emerging Markets Equity Freestyle For the year ending March 2007 the fund gained 16.62% (net of fees, share class MIW). Markets sold off heavily in May/June 2006 but recovered well with markets moving to new highs. We saw a further setback in FebruarylMarch 2007 although most Emerging Markets ended March in positive territory and close to their earlier peaks. Volatility is likely to be an issue in the short-term, although levels remain around historical lows. With no clear evidence of Japan's export-led recovery spreading to domestic sectors and with inflation at low levels, it is unlikely that we will see a rate increase in the near-term and fears of a significant unwinding of the carry trade appear to be overdone. Global equity valuations, particularly among Emerging Markets, remain supportive but selective markets, like India and Russia, look expensive.
Latin American Freestyle For the year ending March 2007, the fund returned 41.47% (gross of fees, share class MID) in US dollar terms. The positive performance was a consequence of good prospects for the global economy as well as improving fundamentals in the region. The fund benefited from good stock picking across the region, in particular among the smaller markets like Peru and Colombia. We believe the region should continue to benefit from a healthy global economy and the improving economic fundamentals.
UK Freestyle For the year ending 31 March 2007, the fund gained 9.6% (net of fees, share class MID). The aim of the manager was to identify undervalued investments where either cash returns were high and the company could grow, or where returns were too low but should improve through management action. The stronger performers were in the former category. SIG enjoyed good demand growth for its insulation products, while GlaxoSmithKline successfully developed profitable new drugs, and lnchcape acquired new franchises to further grow its profitable asset base. Holdings in Daily Mail, which was effected by a prolonged downturn in the UK advertising, and EMI, which faced weak demand for its music products, were negatives. The outlook for UK equities remains positive, underpinned by continued growth in earnings and cash flows and reasonable market valuations, with high single digit growth predicted for 2007.
Brazil Bond Since its inception in June 2006, the fund has returned 14.60% (net of fees, share class AC). Performance was the result of the high level of interest rates in the Brazilian local market combined with the currency's appreciation, which has risen 9.0% since the fund's inception. The main portion of the portfolio is allocated to certificates of deposit issued by AAA/AA rated Brazilian banks and local sovereign debt, resulting in a very solid credit profile. The strong fundamentals of the Brazilian economy remain very supportive for inflation. Even though the downward path for Brazilian rates will be extended for some time, we believe their levels will remain attractive for investors.
Euro Corporate Bond For the year ending March 2007, the fund returned 4.48% (gross of fees, share class AC) against benchmark returns of 4.21%, ranking it 4th out of 58 funds in its peer group and placing it comfortably in the first quartile over the year and since inception. The ongoing recovery of the European economy and solid corporate fundamentals paired with the search for carry, lead to a further tightening of credit spreads. Our overweight in subordinated names, overweight in the 5-10 year part of the yield curve, and short-duration bias all added to performance. Going forward we expect corporate fundamentals in the Eurozone to stay benign and supportive of spreads. Although risks from inflation and the situation in the Middle East remain, our main focus will be to avoid LBO-candidates and stocks that we fear will return money to shareholders at the expense of bondholders.
Euro Credit Bond For the year to the end of March 2007, the fund returned 1.90% (net of fees, share class AC) against a 2.62% rise for the benchmark. In terms of duration, the portfolio spent most of the year with a small underweight position which proved beneficial as yields increased slightly over the period. On the credit side, the investment
HSBC Global Investment Funds .. -
Directors' Report (continued) 3- strategy was focused on issuer selection. Credit quality remains well oriented for most investment grade issuers but LBO-candidates is paramount. Recognising that most of these LBO targets carry an A credit rating we have maintained a barbell strategy of being overweight AAA/AA, underweight A, and overweight EBB. Since the beginning of 2007 we have also invested around 5% of the fund's assets in high yield issuers, which has contributed positively to performance.
Euro Investment Grade Bond For the year to the end of March 2007, the fund generated a return of 1.18% (net of fees, share class AC) compared with the benchmark return of 2.01%. Credit allocation of the fund has been neutral and is growing more defensive as credit spreads tighten driven by the structured credit bid. In late 2006 we moved to a short A / long BBB credit curve steepening position in view of likely M8A risks for single A-rated entities. BBB rated Hybrid credit and supportive first quarter fundamentals provided better tactical risk I reward. The flight to quality in February 2007 served to validate our cautious overall stance. Our duration exposure has been positive for performance. We do not expect a deep bond bear market as both the Federal Reserve and the ECB are at advanced stages of monetary tightening.
Euro Investment Grade Corporate Bond For the period until its closure on 19 March 2007, the fund returned 4.04% (gross of fees) against benchmark returns of 3.14%, placing it comfortably in the second quartile of its respective peer group. The ongoing recovery of the European economy and solid corporate fundamentals paired with the search for carry, lead to a further tightening of credit spreads. This was supported by a still contained net issuance of corporate debt. Due to our increased overweight in subordinated financial and non-financial investment grade issuers the fund fared well over the period. In addition to the overweight in subordinated names, our curve positioning (overweight in the 5-10 year part) and the short-duration bias over the period added to the fund's relative performance.
Euro High Yield Bond For the year to end March 2007, the fund returned 6.41% (net of fees, share class AC) against the benchmark return of 7.57%. The fund maintained its focus on issuer selection over the period, except at the end of June 2006 when we took advantage of the market sell-off to buy some lower rated bonds at discounted prices, and this resulted in a slightly lower yield than the benchmark most of the time. However, this focus was more than compensated for by our zero or strongly underweight positions in the worst performing bonds. Going forward, the economic outlook in Europe looks supportive for high yield bonds. Lower-rated issuance has picked up recently and we expect a slight increase of default rates from their current very low levels. In this environment we will continue with our issuer focused strategy.
Global Emerging Markets Bond For the year ending March 2007, the fund returned 11.29% (gross of fees, share class AC), outperforming the benchmark's return of 10.86%. The sector experienced some very volatile periods during the 12 month period and we managed to weather this volatility without posting any significant ( ~ 1 % ) monthly losses. In the second half of the fiscal year, the story was primarily of falling yields across local emerging markets. A rush of rate cuts combined with dollar weakness resulted in most of our second half performance attribution being generated by local positions.
Global Investment Grade Bond For the year ending March 2007, the fund returned 7.24% (gross of fees, share class AD), underperforming the benchmark's return of 8.12% but outperforming its peer group. The global economy continued its steady growth despite higher fuel and energy prices. The fund's outperformance was primarily driven by emerging market local currencies positions. Exposures to the Mexican, Brazilian and Polish local currency bonds contributed particularly strongly to returns as interest rates fell and the currencies appreciated. In addition, sector and security selection within the credits added to the overall excess performance of the strategy.
Pan-European Government Bond For the year to the end March 2007, the fund returned 1.96% (net of fees, share class ID) against the benchmark return of 1.95%. Primarily, the fund sources diversified excess returns from duration, yield curve and currency management. Last year, we implemented a new source of excess return, volatility. The fund also seeks returns from investment in EU/euro applicant countries' debt. The main drivers of performance over the period were a successful position in duration, good excess returns from our investments in Eastern European
HSBC Global Investment Funds . . - .

I
countries, and intensive relatives value arbitrages.
Sterling Investment Grade Bond For the year ending March 2007, the fund returned 0.09% (net of fees, share class PD) underperformed its benchmark. Credit markets traded in a narrow range through-out the period but ended the period 4 basis points wider. The fund retained, and benefited from, an underweight and defensive position in credit for much of the period. Buying some selected sectors in the summer sell-off also added value and these positions were reduced into the close of the year. The fund benefited from selective long positions in the first half and weathered the worst of the weakness with a neutral position; however it gave up some gains with a long position in February and March which was neatly compensated for by our underweight position in credit.
US Dollar High Yield Bond For the year ending March 2007, the fund returned 10.57% (gross of fees, share class AC), outperforming the benchmark's return of 10.42%. The sector posted strong returns as spreads tightened. Good earnings, declining defaults rates and robust liquidity were key factors. The healthy liquidity allowed the market to easily absorb an all-time high level of new issuance for the market. The fund's overweight position in the CCC quality sector was a strong positive contributor to performance as they outperformed all other quality sectors in the index. In addition, overweight positions in the wireless and cable sectors proved beneficial as the sectors outperformed the high yield market.
US Dollar Investment Grade Bond For the year ending March 2007, the fund returned 7.34% (gross of fees, share class PD), outperforming the benchmark's return of 6.42%. All spread sectors in the Lehman Aggregate index outperformed treasuries. Allocations within corporate and mortgages over the period contributed positively to fund performance as both sectors performed well. US Investment grade corporate bonds outperformed duration-adjusted treasuries by 87 basis points, whilst US fixed rate mortgage-backed securities outperformed by 76 basis points. Stock selection within high yield and emerging markets were strong positive contributors to performance.
Euro Reserve For the year ending March 2007, the fund returned 2.59% (net of fees, share class AC), against a benchmark return of 3.17%. Despite some fears over the US housing sector, the Euro economic outlook has been strong. Inflation risks were on the upside following the increase of German VAT and added pressure on energy prices. In this context, the European Central Bank continued its normalisation process and interest rates increased to 3.75% in March 2007 from 2.50% in March 2006. As the pace of rate hikes was around every 3 months, we invested in commercial paper in the 30-90 day range in order to take profit on the increases in yields and so as to avoid volatility. Going forward, the ECB should continue to raise rates slightly and yields should increase.
US Dollar Reserve For the year ending March 2007, the fund returned 5.38% (gross of fees, share class PD) compared with the benchmark's 4.91%. Performance was above benchmark for the year due to several subscriptions in the fund and as a result of keeping within our WAM target range of 40-45 days. The Federal Reserve had raised interest rates over the period and they reached 5.25% in June, where they remained whilst the Fed maintained its "Inflation Risk" stance. Going forward, we continue to ladder maturities for the fund for 2007 as we expect the economy to begin to show positive signs of picking up. We continue to invest in commercial paper in the 30-90 day range. With this, yields should either remain stable or rise slightly for 2007.
Turkish Convergence For the year ending March 2007, the fund returned -2.10% (net of fees, share class AC), underperforming the MSCl Emerging Market index. Turkey was one of the worst affected markets during the MaylJune sell-off. Nonetheless, Turkish markets started to recover in the second half of the 2006 and became one of the top performers in the first three months of 2007. Going forward, Turkish debt and equity markets still offer huge potential. Interest rates remain among the highest in emerging markets and from a fundamental perspective Turkish stocks are relatively undervalued and likely to be backed by strong M&A activity. Results of upcoming general elections will be crucial but as long as global environment stays supportive, Turkey is a candidate to be one of the best performing emerging markets in 2007.
I
Ih- HSBC Global Investment Funds
__ - .
Auditor's Report - -. -
To the Shareholders of HSBC Global Investment Funds 40, avenue Monterey L-2163 Luxembourg Grand Duchy of Luxembourg
REPORT OF THE REVISEUR D'ENTREPRISES
Following our appointment by the annual general meeting of the shareholders dated 28 July 2006, we have audited the accompanying financial statements of HSBC Global Investment Funds and each of its sub-funds, which comprise the statement of net assets and the statement of investments in securities and other net assets as at 31 March 2007 and the statement of operations and the statement of changes in net assets for the year then ended, and a summary of significant accounting policies and other explanatory notes.
Responsibility of the board of directors of the SlCA V for the financial statements The board of directors of the SlCAV is responsible for the preparation and fair presentation of these financial statements in accordance with Luxembourg legal and regulatory requirements relating to the preparation of financial statements. This responsibility includes: designing, implementing and maintaining internal control relevant to the preparation and fair presentation of financial statements that are free from material misstatement, whether due to fraud or error; selecting and applying appropriate accounting policies; and making accounting estimates that are reasonable in the circumstances.
Responsibility of the Reviseur d'Entreprises Our responsibility is to express an opinion on these financial statements based on our audit. We conducted our audit in accordance with International Standards on Auditing as adopted by the Institut des Reviseurs d'Entreprises. Those standards require that we comply with ethical requirements and plan and perform the audit to obtain reasonable assurance whether the financial statements are free from material misstatement.
An audit involves performing procedures to obtain audit evidence about the amounts and disclosures in the financial statements. The procedures selected depend on the judgment of the Reviseur d'Entreprises, including the assessment of the risks of material misstatement of the financial statements, whether due to fraud or error. In making those risk assessments, the Reviseur d'Entreprises considers internal control relevant to the entity's preparation and fair presentation of the financial statements in order to design audit procedures that are appropriate in the circumstances, but not for the purpose of expressing an opinion on the effectiveness of the entity's internal control. An audit also includes evaluating the appropriateness of accounting policies used and the reasonableness of accounting estimates made by the board of directors, as well as evaluating the overall presentation of the financial statements. We believe that the audit evidence we have obtained is sufficient and appropriate to provide a basis for our audit opinion.
Opinion In our opinion, the financial statements give a true and fair view of the financial position of HSBC Global Investment Funds and each of its sub-funds as of 31 March 2007, and of the results of its operations and changes in its net assets for the year then ended in accordance with the Luxembourg legal and regulatory requirements relating to the preparation of the financial statements.
Other matter Supplementary information included in the annual report has been reviewed in the context of our mandate but has not been subject to specific audit procedures carried out in accordance with the standards described above. Consequently, we express no opinion on such information. However, we have no observation to make concerning such information in the context of the financial statements taken as a whole.
Luxembourg, 21 June 2007
KPMG Audit S.a r.1. Reviseurs d'Entreprises
R. Beegun
A -~ HSBC Global Investment Funds c -
I
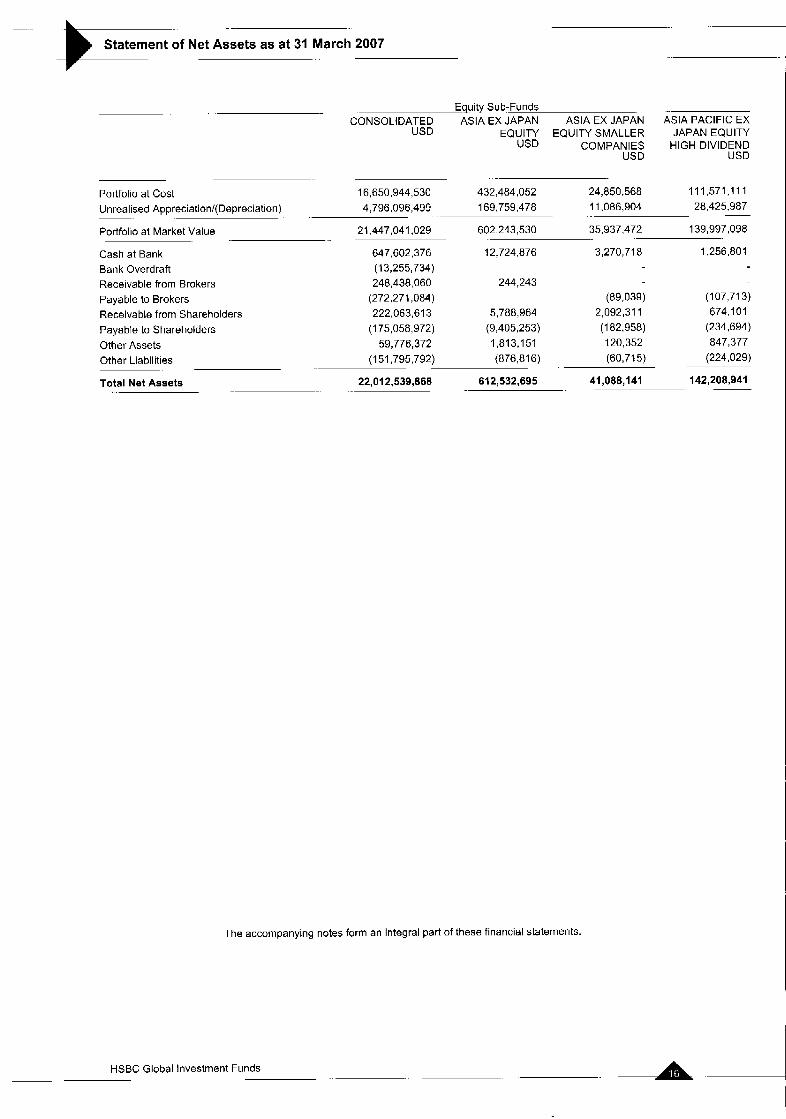
Statement of Net Assets as at 31 March 2007 ._
E-guity Sub-Funds CONSOLIDATED ASIA EX JAPAN ASIA EX JAPAN ASIA PACIFIC EX
USD EQUITY EQUITY SMALLER JAPAN EQUITY USD COMPANIES HIGH DIVIDEND
USD USD
. ..
Portfolio at Cost 16,650,944,530 432,484,052 24,850,568 111,571,111 Unrealised Appreciation/(Depreciation) 4,796,096,499 169,759,478 11,086,904 28.425.987
~
139,997,098 Portfolio at Market Value
Cash at Bank 647,602,376 12,724,876 3,270,718 1,256,801 - -
21,447,041,029 602,243,530 35,937,472 -
Bank Overdraft Receivable from Brokers Payable to Brokers Receivable from Shareholders Payable to Shareholders Other Assets Other Liabilities
Total Net Assets
(13,255,734) 248,438,060 (272,271,084) 222,063,613 (175,056,972) 59,776,372
(151,795,792)
22,012,539,868
~
-_
244,243 (89,039)
5,788,964 2,092,311 (9,405,253) (1 82,958) 1,813,151 120,352 (876,816) (60,715)
61 2,532,695 41,088,141
The accompanying notes form an integral part of these financial statements.
(107,713) 674,lO 1 (234,694) 847,377 (224,029)
142,208,941
HSBC Global Investment Funds Ad

Statement of Net Assets as at 31 March 2007 3
852,624,152 403,062,977 215,706,303 2 800,599,760 21,545,618 498,993.902 21 6.885.368 57,376,400 22,213,405 1,520,416,838 3,275,553 63,955,899
1,069,509,520 460,439,377 237,919,708 4,321,016 598 24,821,171 562,949,80 1
30,422,369 57,153,705 22,576,549 673,929 13,535,031
3,090,505 1,212,359 4,307,632 60.273.045 100,465 10,267,267 (40,421,907) (1,335,565) (3,330,448) (586,134) (9,037,020) 25,974,763 13.334.997 5,543,705 33,064,679 159.268 2,333,075 (3,345.935) (448,559) (40,553,054) (1,306) (1,147,254) 2,361,310 924,165 845,114 1,518,969 I 28,998 896,675 (1,582,930) (450,653) (289,260) (6,370,621) (35,592) (812,614)
- -
-
(12,440,113)
-
1,086,007,695 461,684,567 305,032,045 4,3aa,195,717 25,260,799 578,984,961 - .- - -.
BRAZIL EQUITY BRlC MARKETS BRlC MARKETS CHlNESEkQUlTY EM ERG I NG -E u ROL AN D E Q u ITV EQUITY EUROPE EQUITY
USD USD USD USD EUR EUR
A - HSBC Global Investment Funds 1 -
-

..- -
Statement of Net Assets as at 31 March 2007
.-. ~.
EUROLAND EQUITY EUROLAND VALUE SUSTAINABILITY EUROPE E= SMALLER CREATION LEADERS EQUITY
COMPANIES EUR EUR EUR EUR
- .
Portfolio at Cost 86,671,760 125,335,211 25,257,387 66,037,100 18,458.479 Unrealised Appreciation/(Depreciation) 18,369,186 15,691,629 2,481,592
Portfolio at Market Value 105,040,946 141,026,840 27,738,979 84,495,579
Cash at Bank 1,392,576 9,756,684 737,766 2,638,763
Bank Overdraft Receivable from Brokers Payable to Brokers (3,312,639) (79,716) (24,747) (24,869) Receivable from Shareholders 1,274,647 22,047 14,903 314,880 Payable to Shareholders (51 0,883) (508,175) (200,836) ' Other Assets 100,532 38,427 66.195 178,991
Other Liabilities
Total Net Assets
.~ .
~
(129,715)
103,872,035 149,960,54a 20,419,950 87,272,793
. -- (113:144) (295,559) ( I 13,146)
.. ..
. . .- . - -
The accompanying notes form an integral part of these financial statements.
A- HSBC Global Investment Funds . -
. -.
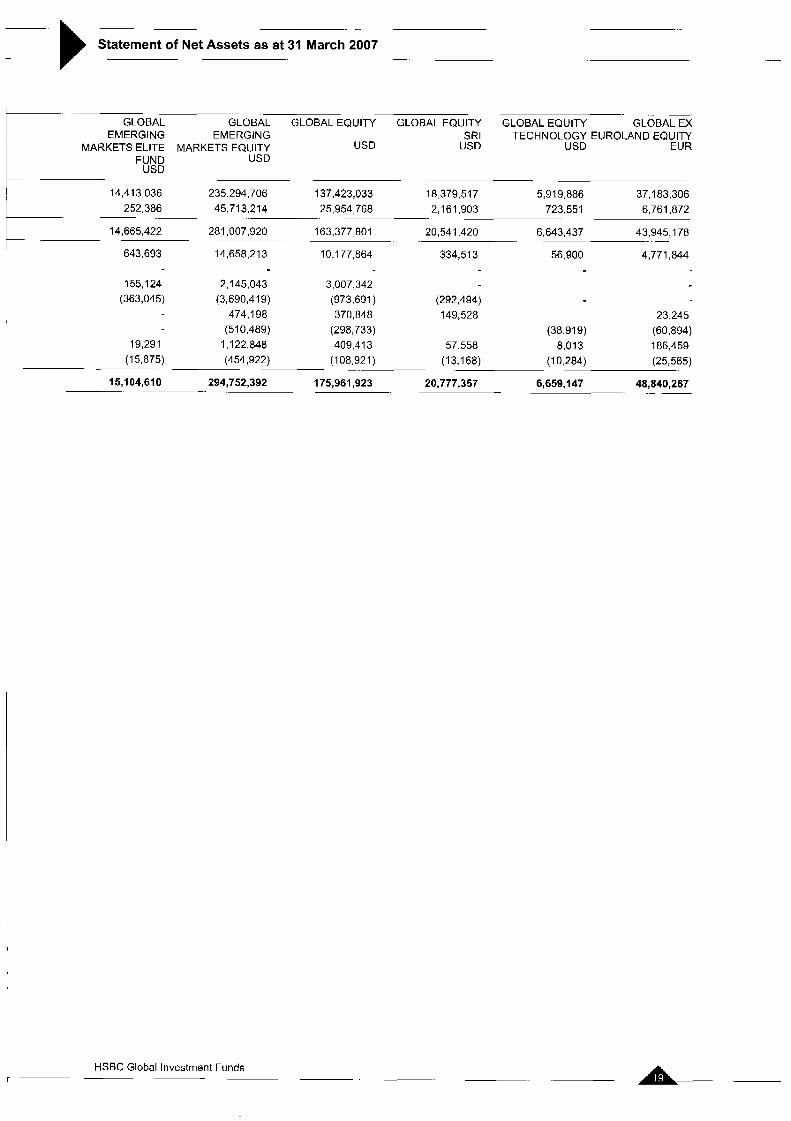
Statement of Net Assets as at 31 March 2007 ._ -
GLOBAL ~ L O B A L GLOBAL EQUITY GLOBAL EQU~TY GLOBAL EQUITY GLOBALEX EMERGING EMERGING SRI TECHNOLOGY EUROLAND EQUITY
MARKETS ELITE MARKETS EQUITY USD USD USD EUR FUND USD
USD
14,413,036 235,294,706 137,423,033 18,379.517 5,919,886 37,183,306 252,3 86 45,713,214 25,954,768 2 161,903 723,551 6,761,872
43,945,178
643,693 14,658.213 10,177,864 334,513 56,900 4,771,844
155,124 2.1 45,043 3,007,342
. - 14,665,422 281,007,920 163,377,801 20,541,420 6,643,437
(363,045) (3,690,419) (973,691) (292,494) 474,198 370,848 149.528 23,245
(51 0.489) (298,733) (38.91 9) (60,894) 19,291 1,122.848 409,413 57.558 8.013 186,459
(15,875) (454,922) (1 08,921) (13,168) (1 0.2 84) (25,565) - -
48,840,267 - -
15,104,610 294,752,392 175,961,923 20,777,357 6,659,147
r A L - HSBC Global Investment Funds - .

Statement of Net Assets as at 31 March 2007
HONG KONG -- INDIAN EQUITY JAPANESE EQUITY KOREAN EQUITY EQUITY
USD USD JPY USD
. . - .
Portfolio at Cost 152,866,172 4,004,275,906 26,815,452,490 126,830,791 53,434,929 1,340,292,828 4,911,640,950 25,246,497 Unrealised Appreciation/(Depreciation)
~. Portfolio at .. Market Value 206,301,101 5,344,568,734 31,727,093,440 152,077,288
Cash at Bank 3,914,726 80,207,003 4,800,855,867 845,861 Bank Overdraft Receivable from Brokers 60,234,478 Payable to Brokers (159,069) (68,476,405) (931,190) Receivable from Shareholders 3,573,247 69,526,224 169:655,877 2,086.865 Payable to Shareholders (395,211) (34,248,129) (51 5,588,260) (1 -287,667)
6,985,210 307,701,927 1,042,550 Other Assets 515.073 Other Liabilities .. . (192,965) (7,996,475) (41,924,401) (178,220)
153,655,487 Total Net Assets
. ..
.- 5,450,800,640 36,447,794,450
. . 213,556,902
. - ~.
I
The accompanying notes form an integral part of these financial statements
HSBC Global Investment Funds
_-
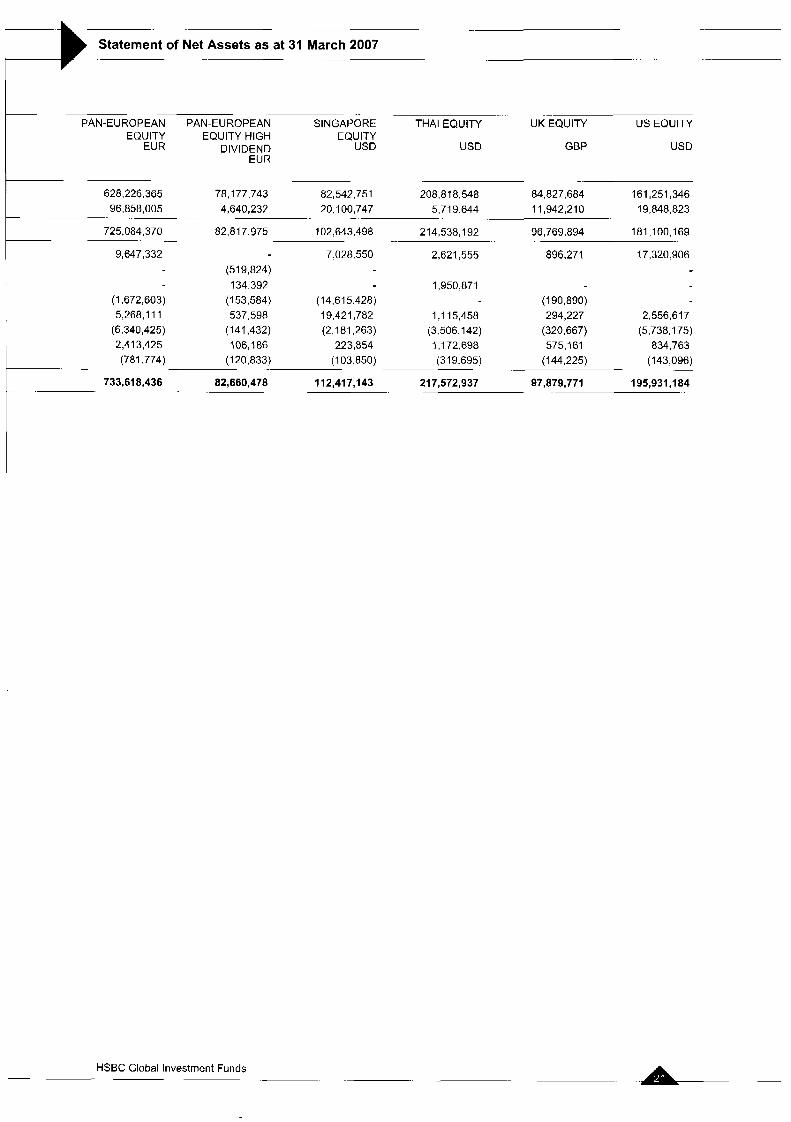
Statement of Net Assets as at 31 March 2007 A .-
I 78,177,743 82,542.75 1
20,100,747
82,817,975 102,643,498
7.028.550
-~ 4,640,232
~
(5 1 9,824) 134,392
(1 53,584) (14.61 5.428) 537,598 19,421,782
~ . ..
PAN-EUROPEAN PAN-EUROPEAN SINGAPORE THAI EQUITY UK EQUITY US EQUITY
EUR DIVIDEND USD USD GBP USD EQUITY EQ U ITY HIGH EQUITY
EUR
628,226,365 96,858,005
725,084,370
9,647,332 - -~
(1,672,603) 5,268,l I1 (6,340,425) 2,413,425
208,818,548 84.827,684 5,719,644 11,942,210
214,538,192 96,769,894
2,621,555 896.271
1,950,871 (1 90,890)
1,115,458 294,227 (3 506,142) (320,667) 1,172,698 575,161
..
161,251,346 19,848,823
181.1 00.169
17,320,906
. .~
~. .
2,556,617 (5,738.175) 834,763
(781,774) (120.833) (1 03.850) (319,695) (1 44,225) (143,096)
733,618,436 82,660,478 1 12,417,143 217,572,937 97,879,771 195,931,184
-
A - HSBC Global Investment Funds

Statement of Net Assets as at 31 March 2007 ~.
.~ Freestyle Sub-Funds - US INDEX ASIA FREESTYLE BRlC FREESTYLE GLOBAL
EMERGING USD USD USD MARKETS EQUITY
FREESTYLE USD
-. .. -
Portfolio at Cost 34,090,119 216,394.935 2,001,649,056 737,404,47a Unrealised Appreciation/( Depreciation) 9,643,438 51,679,308 690,392,280 96.1 77,296
833,581,774 Portfolio at Market Value 43,733,557 268,074,243 2,692,041,336 ._ ..
Cash at Bank Bank Overdraft Receivable from Brokers Payable to Brokers Receivable from Shareholders Payable to Shareholders Other Assets Other Liabilities
Total Net Assets ~ ..
~
960,749
593,845 (521,531) 492,001
(1,479.326) 74,254
(25,088)
1,965,438
80,773
1,172,424 (1,426.142)
994,543 (538,336)
270,322,943
180,049,146
19,089,922 (28,410,043)
7,728,286 (22,309,104)
6,156,467 (97,262,029)
2,757.0a3.9ai
36,033,576
31,472,227 (22,929,179)
1,555,029 (14,660,880)
4,094,746 (23,357,330)
.~
845,7a9,963
The accompanying notes form an integral part of these financial statements
L - HSBC Global Investment Funds . -

.. -.. - - . - -- .- -
Statement of Net Assets as at 31 March 2007 - . - . ._
Bond Sub-Funds -.
LATIN AMERICAN UK FREESTYLE BRAZIL BOND EURO CORPORATE EURO CREDIT EURO FREESTY LE BOND BOND INVESTMENT
USD GBP USD EUR EUR GRADE BOND EUR
45,451,446 160,461,501 31,249,487 1 1,150,619 5,205,682 54,075,163 6,020,770 1,731,698 907,809 (1,265,135) (938,143) (3,183,823)
157,277,678
896,332 25,360 837,806 5,322,533 599,012 2,214,977
466,318 522 462,771 95.625 (749,016) (1,860,832) (1,463,800)
3,775,308 2,922 16,863 96,818 456,520 (1 13,181) (7,341) (5,037) (379,109) (607,598)
26,914 45.222 3,140 1,300,955 881,054 2,765,423 (1,766,297) (1 4,326) (2,207) (63,143) (49,788) (1 18,943)
._ 37,270,257 12,882,517 6,113,491 52,810,048 44,513,303
- .
I
40,555,651 i 2,934,876 6,969,093 59,079,111 43,ao2,458 160,61g,a82
-2- -
~ HSBC Global Investment Funds
-
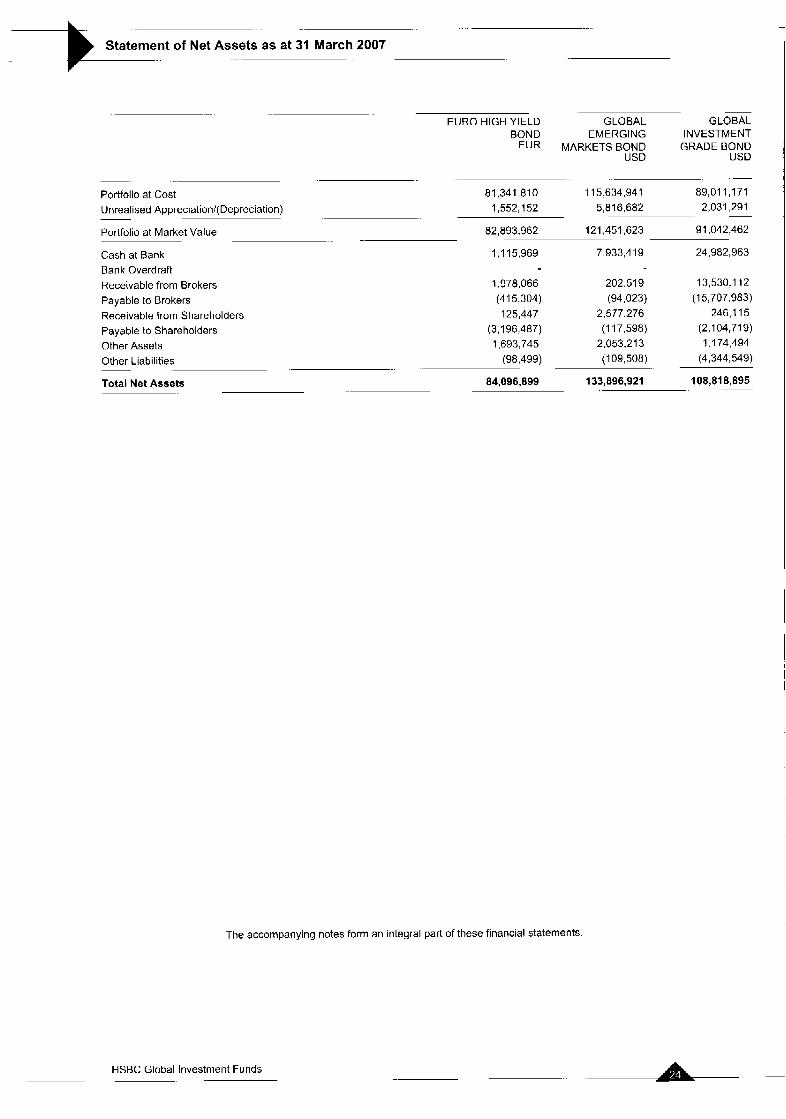
Statement of Net Assets as at 31 March 2007
~ -. EURO HIGH YIELD GLOBAL GLOBAL
BOND EMERGING INVESTMENT EUR MARKETS BOND GRADE BOND
USD USD
.- ~.
Portfolio at Cost 81,341,810 115:634,941 89,011,171
Unrealised Appreciationl(Depreciati0n) 1,552,152 5,816,682 2,031,291
Portfolio at Market Value 82,893,962 121,451,623 91,042.462
Cash at Bank 1:115,969 7,933,419 24,982,963
Bank Overdraft Receivable from Brokers 1,978,066 202,519 13,530,112 Payable to Brokers (41 5,304) (94,023) (1 5,707.983) Receivable from Shareholders 125,447 2.577,276 246,115 Payable to Shareholders (3,196,487) (1 17.598) (2,104,7 1 9)
. .. ~
~
Other Assets 1,693,745 2,053.21 3 1 ,I 74,494
Other Liabilities (98,499) (109,508) (4,344,549) ~
Total Net Assets 84,096,899 133,896,921 108,818,895
The accompanying notes form an integral part of these financial statements.
L- HSBC Global Investment Funds

-)-.merit of Net Assets as at 31 March 2007
I Reserve Sub-Funds
PAN-EUROPEAN STERLING US DOLLAR HIGH US DOLLAR EURO RESERVE GOVERNMENT INVESTMENT YIELD BOND INVESTMENT
BOND GRADE BOND USD GRADE BOND EUR GBP USD
EUR
~~ -
43,693,078 (2,032,386) (932,096) 163.893 6,550 70,423
5,584 652 94.55a.051 43,763.501
1,342,080 1,310,732 (91,816) 31 5,188 3,711,691 17,459,051 1,200 000 (363,726) (3,706,339) (25,734) (34.4 1 5,129) 1.095.722 5,000 401,295 157,144 (751,399) (38,027) (1 29,454) (3.71 1,122) 2 616.829 354,362 116,622 51 3,097 408,505 (1 23,452) (9.071) (1.324) (30,728) (255,641)
26,310,415 5,845,866 79,698,263 42,873,119
139,856,834 26,320,620 5,420,759 94,551,501
137,824,448 25,388.524
609,275 166.650 -II
~~ -
~. ~~-~ ~
140,521,794
HSBC Global Investment Funds -~ ~- - - ~ - -

Statement of Net Assets as at 31 March 2007
Other Sub-Funds us DOLLAR- TURKISH
RESERVE CONVERGENCE USD EUR
- - -
Portfolio at Cost 19,077,026 41,020,235
Unrealised Appreciation/( Depreciation) 83,943 934,329
Portfolio at Market Value 19,160,969 41,954,564
Cash at Bank 40,336 8,854.530 Bank Overdraft Receivable from Brokers 1,672,123 Payable to Brokers (1,052,805) Receivable from Shareholders 309,768 127,021 Payable to Shareholders (315,882) ( I ,136,493) Other Assets 8,290 627,086 Other Liabilities (7,363) (67,575)
Total Net Assets 19,196.1 18 50,978,451
-
-
The accompanying notes form an integral part of these financial statements.
- - HSBC Global Investment Funds


Key Figures as at 31 March 2007
- F - - Equity Sub-Funds
CONSOLIDATED ASIA EX JAPAN ASIA EX JAPAN ASIA PACIFIC EX USD EQUITY EQUITY SMALLER JAPAN EQUITY
USD COMPANIES HIGH DIVIDEND USD USD
- __ CLASS A C (see note 3)
128.669 933 14 28
4 165233.315 273,634,852 Number of Shares Outstanding N/A Net Asset Value per Share NIA 44.36 29 12 - .-
CLASS A C H (see note 3) Number of Shares Outstanding N;A 623 072.137 NIA N/A
Net Asset Value per Share N/A 20.48 N!A NIA
CLASS A 0 (see note 3) 7,331.271.036 Number of Shares Outstanding NiA 6,320,915,936 1.167.688.235
Net Asset Value per Share -- N/A 42.19 28 36 13.45
CLASS A 0 H (see note 3) Number of Shares Outstanding NiA 39,948.433 NIA NIA
N/A 20.36 . . NiA NIA Net Asset Value per Share CLASS E C (see note 3) Number of Shares Outstanding NIA 350.557 N!A NIA Net Asset Value per Share NIA 41.63 NIA NiA
CLASS E 0 (see note 3) Number of Shares Outstanding NIA 106,137,814 N IA NIA
NiA Net Asset Value per Share N8A 41.63 NIA
Number of Shares Outstanding N ;A 2.265.295.459 N;A NiA Net Asset Value per Share NiA 43.00 N /A NIA
2.800 000.000 Number of Shares Outstanding N:A 10,000 000 NiA Net Asset Value per Share N:A 43.00 NIA 13.82
-
. . -.
-
.. ~
CLASS I C (see note 3)
CLASS I D (see note 3)
-.
CLASS J 1 C (see note 3) Number of Shares Outstanding NiA NiA N/A NiA
N/A Net Asset Value per Share N!A N!A NIA . -
CLASS M 1 C (see note 3) Number of Shares Outstanding N ‘A NIA N/A NiA
Net Asset Value per Share NiA NIA N/A N IA
Number of Shares Outstanding N IA NIA NiA NIA N:A Net Asset Value per Share NIA N!A NIA
. - CLASS M 1 D (see note 3)
. -
CLASS M 2 C (see note 3) Number of Shares Outstanding NIA NIA N/A NiA
N /A Net Asset Value per Share NIA NIA N’A
Number of Shares Outstanding N/A NiA NiA N:A NIA NiA N/A
.
CLASS M 2 0 (see note 3)
Net Asset Value per Share CLASS P C (see note 3)
Net Asset Value per Share CLASS P D (see note 3) Number of Shares Outstanding NiA NiA N/A N!A Net Asset Value per Share NIA NiA NIA NiA
CLASS W C (see note 3) Number of Shares Outstanding NIA NiA N!A N!A
NIA Net Asset.Value per Share CLASS W D (see note 3)
. - NIA .~
Number of Shares Outstanding NIA NiA N/A NiA NiA N!A NiA N:A
~. __
. . __
. - N ‘A N/A NIA - . -- . ~.
Number of Shares Outstanding N:A NIA N/A N IA NIA N/A NIA NIA -~ Net Asset Value per Share .
CLASS Y C (see note 3) Number of Shares Outstanding NIA NIA NIA NIA
N/A Net Asset Value per Share NiA NIA NiA
CLASS 2 C (see note 3) Number of Shares Outstanding NIA N!A N/A 671 124.853
NIA 46.35 NIA NIA Net Asset Value per Share CLASS 2 D (see note 3) Number of Shares Outstanding NIA 332,559.91 9 NIA 226,190 973
.- ~.
~ .~ ~. -
Net Asset Value per Share NiA 42 58 NiA 13.57
I
!
A HSBC Global Investment Funds

-
Key Figures as at 31 March 2007 .-
-~ BRAZIL EQUITY BRlC MARKETS ERIC MARKETS- CHINESE EQUITY EMERGING EUROLAND EQUITY
USD USD EQUITY USD EUROPE EQUITY EUR USD EUR
. - I 14,8n2,192.874 940.830.271 18,996.378.742 NiA 6 763.408.460 11 267,558.989
31 16 NIA 12.69 67 10 14.99 33.63 . ~. -
NIA NIA NiA N!A N :A NIA NiA N,A N/A N:A N 'A N/A .~ -
8,120,894.128 NIA 2 210,180.495 49,732,281.707 198.71 I 383 1,138.188.732 31 03 N/A 12.69 66 18 14.99 33.55 - ~ ~.
N/A NIA NiA N,'A N:A NIA NIA N!A N'A N:A N 'A N/A
~. ~ -
265,on8.333 NlA 552 440.975 719 146,759 772.791 459.103
33 58 - 30.99 NIA 12.64 66.41 14 99 ~. ~.
N/A NiA N:A N iA NiA 7.994.310
33.27 N/A NiA NiA N ;A NJA .-
N,A 125 oI1o.uoo 1.861 226,317 335.500.000 1.1 78.488.612 1- 3 . 0 8 6 6 4 7 . 0 F 31.49 N'A 12 74 68.06 15 17 33 71
4,087 457.437 N/A NiA 171.696251 203.200 000 N/A 31.49 N:A NIA 68 06 15 16 NIA
~ ~. ~
N/A NiA 14.286 661 134 N,A NiA N/A NIA NIA 12 78 N/A NiA NIA -
N !A N,A N 'A NIA NIA N/A N/A NiA NIA NIA NiA N'A
NiA NIA N,A N 'A N!A N/A NiA N,A NIA NiA N !A NiA
.- -~ -- ~ ~
N:A NiA N 'A NiA NIA N/A N!A NiA N/A N!A NiA N/A
~~ ~~~
N/A N,A NIA NIA N/A N 'A N!A NiA N 'A N/A NIA NIA
~~ -~~
NIA NIA NIA N:A NiA N/A
N!A N/A NiA N:A NiA NIA - ~.
N!A NiA N,A NiA NiA NIA N!A NiA N,A N/A NIA NIA -- ~. ~ ~ ~
N/A NiA N:A NiA NiA NIA
NiA NIA N!A NiA N!A NIA - - ~. ~ .~ .~ .~
NIA NIA NiA NiA NIA NiA N 'A NiA NIA N,A NIA NI! ~.
N/A 675 000 NIA NIA NiA NIA NJA 21 60 NiA N 'A N !A NiA ~. -~~~~~
243,820.000 21 337,489 000 N:A 204 272 000 NIA 8 798 935 32 65 21 64 NIA 68 20 NIA 35 88 ~~-
NIA NIA
N:A N/A
N'A 2.067.519 401 NIA 68 19
N/A N!A
NIA NiA
.~
HSBC Global Investment Funds ~ ~. . ~ .
-_

- Key Figures as at 31 March 2007
EUROLAND EQUITY EUROLAND VALUE SUSTAINABILITY EUROPE EX UK SMALLER CREATION LEADERS EQUITY
EUR EUR EUR COMPANIES EUR
- CLASS A C (see note 3)
22 933 498 Number of Shares Outstanding 1623219586 N/A N/A Net Asset Value per Share 48 58 N/A NIA 2 2 2 9
CLASS A C H (see note 3) Number of Shares Outstanding NIA NIA NIA N/A Net Asset Value per Share NIA N/A NIA N/A
CLASS A D (see note 3) Number of Shares Outstanding 68 660 659 NIA N /A 3 933 459 51 5 Net Asset Value per Share 40 58 N/A NIA 22 06
CLASS A D H (see note 3) Number of Shares Outstanding NIA NIA N/A N IA Net Asset Value per Share N/A N/A NIA NIA
CLASS E C (see note 3) Number of Shares Outstanding 643 359 N 'A NIA N/A Net Asset Value per Share 48 55 NIA NIA NIA
Number of Shares Outstanding NIA NIA NIA N/A Net Asset Value per Share NIA N /A N 'A NIA
- CLASS E 0 (see note 3)
-
CLASS I C (see note 3) Number of Shares Outstanding 280 100 000 NIA NIA NIA Net Asset Value per Share 40 86 N /A N 'A NIA
Number of Shares Outstanding N,A NIA NIA N/A NIA Net Asset Value per Share N,A N/A NIA
Number of Shares Outstanding N A N/A NIA NIA Net Asset Value per Share N A NIA NIA NIA
Number of Shares Outstanding N 'A 10402217103 929 134 720 NIA Net Asset Value per Share N'A 14 17 12 14 N 'A
CLASS I D (see note 3 )
- - CLASS J 1 C (see note 3)
- __ CLASS M 1 C (see note 3) I
CLASS M 1 D (see note 3) Number of Shares Outstanding NIA 182 385 316 1405605236 NIA
NIA I Net Asset Value per Share NIA 14 23 12 20
CLASS M 2 C (see note 3) Number of Shares Outstanding NIA N/A NIA NIA , Net Asset Value per Share N/A NIA N/A NIA
Number of Shares Outstanding N 'A N8A NIA NIA I Net Asset Value per Share NIA NIA N/A N/A 1 Number of Shares Outstanding N/A NIA N/A NIA ' Net Asset Value per Share NIA NiA NIA N IA
CLASS P D (see note 3) Number of Shares Outstanding NiA NIA N/A N/A Net Asset Value per Share NIA N/A N 'A N 'A
Number of Shares Outstanding N/A NIA N IA N/A
Net Asset Value per Share N 'A N/A NIA N/A
Number of Shares Outstanding NIA NIA NIA N/A
Net Asset Value per Share NIA N /A N/A N/A
Number of Shares Outstanding NIA NIA NIA N'A
Net Asset Value per Share N /A NIA NIA NIA
CLASS 2 C (see note 3) Number of Shares Outstanding 153 913 606 N /A NIA NIA Net Asset Value per Share 51 71 NIA N/A NIA
CLASS 2 0 (see note 3) Number of Shares Outstanding NIA NIA N/A N/A Net Asset Value per Share N/A NIA NIA NIA
CLASS M 2 D (see note 3) I
- CLASS P C (see note 3)
-
CLASS W C (see note 3)
CLASS W D (see note 3)
CLASS Y C (see note 3)
HSBC Global Investment Funds - .~ ~
-- .-
Key Figures as at 31 March 2007 . .
. - ~- ~
GLOBAL GLOBAL GLOBAL EQUITY GLOBAL EQUITY GLOBAL EQUITY GLOBAL EX EMERGING EMERGING USD SRI TECHNOLOGY EUROLAND EQUITY
MARKETS ELITE MARKETS EQUITY USD USD EUR FUND USD
- . .- USD r
N/A 1 747,514 895 54,984 486 463 132 998 19 792 000 560 082 i a7 N/A 16 93 26 79 15 a2 23 99 21 32 I- N/A NIA NIA N/A N/A N /A N IA NIA NIA N/A NIA NIA c
2.157 962 21.32
1.530.13~ a i 9 N/A 14 070,027 a77 1,701,225.304 10.433.a67
.- c- NIA 16 75 26.79 15.81 4.02 - .
N:A N/A NIA N/A N/A NIA N/A N/A NiA NIA N/A NIA
.-
N/A 308.157.366 NIA NiA NIA NIA N/A 16 33 NIA N/A N/A N/A
N /A 4,099.41 0 NiA N/A 9,000.000 NIA N/A 16.25 N!A N /A 3.90 N/A
~
N/A 1,026.362 595 4,459.624 N/A N/A NIA 17.07 26 a0 N IA NIA N/A N/A
. . ~-
NIA NIA NIA N/A NIA NIA NiA N 'A NiA NIA N 'A N/A
~~~~
N/A N!A NIA N:A N 'A NIA N/A N 'A NiA NIA NIA N/A -----
N/A NIA NiA NIA N/A N/A NIA NIA N/A NiA N:A N/A
~~~~
NIA NiA N/A N :A N/A N/A N 'A NiA NiA N/A
N /A N 'A NIA N/A N/A N/A NIA N/A N/A NIA N/A N/A ~~~-~
NIA N/A NIA NIA NIA N/A N/A N/A NiA NIA NIA N/A
~ ~ ~ .~ .~
NIA N/A N:A NIA N/A N/A NIA NIA N IA N:A N/A NIA --
I ~ ~ ~ ~ ~ ~ -~
NIA N/A N,A NIA NIA N/A NIA N/A ~ NIA ~- NiA N/A NIA
N IA NiA NIA 50 001 627 NIA N/A N/A N/A NIA N:A 16 51 NIA
-
- - .~ - ~ - ~ ~ p
N/A NIA NIA NIA NIA NIA N/A NiA N:A N,A NIA N/A -~ - ~ ~ ~ ~- ~ -
500 000 NIA NIA NIA NIA NIA
N/A - 10 09 N/A N/A NIA N/A
1 499.500 000 NiA N IA 760 200 502 N/A 1,621,840 274 22 72 -
10 07 N/A N/A 16 39 N/A
NIA 408,565361 4,458,643 563 NiA 16 91 28 89
NIA N/A
N/A NIA
N/A N/A
A - - - HSBC Global Investment Funds
~ -~ ~ - ~ I

Key Figures as at 31 March 2007 ~ . -
HONG KONG INDIAN EQUITY JAPANESE EQUITY KOREAN EQUITY USD JPY USD EQUITY
USD
CLASS A C (see note 3) Number of Shares Outstanding Net Asset Value per Share . ~
59,992 956 9249636476 1677125211 I950607120 9,989 22 15 30 98 79 135 24
~
NIA NIA
CLASS A C H (see note 3) Number of Shares Outstanding N /A N 'A N:A
NIA NIA NIA ~ Net Asset Value per Share .~
CLASS A D (see note 3) Number of Shares Outstanding Net Asset.Value per Share -
39,104.546 28 583 743.981 316.894.882 4.135.058 862 95.33 135 24 1.489.96 15.30
N 'A N,A NiA NIA NIA NIA N A N A
CLASS A D H (see note 3) Number of Shares Outstanding Net Asset Value per Share .- .~
CLASS E C (see note 3) Number of Shares Outstanding Net Asset Value per Share ~ --
103.68R 98 65
501 704 336 447.330 314 13,911 869 1528 ~- 132 59 1 455.26
CLASS E D (see note 3) Number of Shares Outstanding Net Asset Value per Share CLASS I C (see note 3) Number of Shares Outstanding Net Asset Value per Share CLASS I D (see note 3) Number of Shares Outstanding Net Asset Value per Share . .
.
NIA 142 733 161.467.790 NIA NiA 132.59 1,455 26 NIA
NIA 1 467,143 077 134.548.718 2.784.592 233 NiA 140 0.1 10 057 59 15.46
NiA 110.255.938 N/A 140 00 N 'A NiA .
N:A N IA
CLASS J I C (see note 3) Number of Shares Outstanding Net Asset Value per Share CLASS M 1 C (see note 3) Number of Shares Outstanding Net Asset Value per Share CLASS M 1 D (see note 3) Number of Shares Outstanding Net Asset Value per Share CLASS M 2 C (see note 3) Number of Shares Outstanding Net Asset Value per Share CLASS M 2 D (see note 3) Number of Shares Outstanding Net Asset Value per Share
NIA NIA NIA NIA NiA NIA NIA NIA -~ ~- -
NIA NIA N /A NIA N 'A NIA NIA NIA
NIA NIA NIA NiA N IA N A N 'A NiA
NiA NIA NIA NiA NIA
- - ~~
NIA N 'A N'A ~- -
N A NiA NIA N 'A N,A NIA N,A NiA ~-
~
CLASS P C (see note 3) Number of Shares Outstanding Net Asset Value per Share
NIA 11 336 102 N 'A N 'A N 'A NIA 9,976 79 NIA - -
CLASS P D (see note 3) Number of Shares Outstanding Net Asset Value per Share . .
~
1 675.108 051 NIA 7.855,741.532 N:A 94.36 NIA 1 523.27 NIA . ~ ~.
CLASS W C (see note 3) Number of Shares Outstanding Net Asset Value per Share CLASS W D (see note 3) Number of Shares Outstanding Net-Asset Value per Share CLASS Y C (see note 3) Number of Shares Outstanding Net Asset Value per Share
NIA N:A NIA NIA NIA N:A NIA NIA - - -
~
N:A NIA 179 871 242 NIA NIA NiA N,A 13.849 4 1
- .~
NIA NIA N 'A NiA NIA N,A NIA NIA ~ ~
CLASS 2 C (see note 3) Number of Shares Outstanding Net Asset Value per Share CLASS 2 D (see note 3) Number of Shares Outstanding Net Asset Value per Share
.. ~ .~
NIA N 'A
N;A 212,650 000 10 205 62 NIA -. - -~
NIA NiA -
463,129 969 339.437 363 161 218 686 1 106,464 962 138 08 1 503.79 15 61 98.95
A - - HSBC Global Investment Funds ~ ~. --
~
~
Key Figures as at 31 March 2007 .~
- ~. ~
PAN-EUROPEAN PAN-EUROPEAN SINGAPORE THAI EQUITY UK EQUITY US EQUITY EQUITY EQUITY HIGH EQUITY USD GBP USD
EUR DIVIDEND USD EUR
81 731 8.296 22.54
6.093.677.08 1 3 779.373.876 81 1 928.623 979 802.283 1,383,102 885 16.11 47.88 9.74 28.48
.. .~ -~ 41 44 ~ ~.
1,163.078 418 N/A NiA NiA N/A NIA N!A NiA NIA NIA N/A 26.92
. . .~ .~ -
515 063 443 40 68 16 11 44 42 9 44 27 24 25 23
2 133,133 302 375 056 895 1 229 755 524 486 783 639 19203016175
N'A N:A NIA NIA N/A 9,551 763
27 70 NIA N!A NIA NiA NIA .~
5 754 492 N!A 21 736 375 26 364 749 N/A 2 982 906 47 78 9 72 NIA 22 52 - N:A ~. .~
41 35 ~
145 710 095 N:A NIA NIA 16,451 279 681 169 NIA N ,A NiA 20 10 25 00 ~.
40 12 ~~ -
N/A N/A NiA 2,479.467 699 N/A N!A
N/A N/A NiA NiA 9.84 N/A . . ~. ~ ~- .
NiA NIA NIA NIA NIA NIA
N/A NiA N/A N:A N/A N/A - . .~ ~ .~ ~. ~.
NiA N 'A NiA NIA N/A N/A NIA NIA NiA N/A NIA N/A
~~
NIA N/A N/A NiA NiA N/A
NIA N/A N:A N:A N/A NiA .~ ~~~
N /A NiA NIA NiA N/A N/A N!A NIA N,A N:A NIA NIA
~~~~~
NiA NiA N!A NiA N:A N/A
NIA N/A N:A NIA N/A NIA . . .~ ~ ~. ~
NIA NIA N!A NIA N:A NIA N/A N:A NIA N/A N/A NIA ~. - ~ ~. .~
12,535 140 N!A NiA N/A NIA NiA 42 30 N!A NiA N/A NIA NiA
~~~~~ -
988 299 191 40 49 N:A 4449 N 'A N/A 25 68
7,981,872,555 NiA 974 185 953 N/A NIA
~~~~~
N/A NIA N!A NIA NIA NIA NiA N/A N:A N/A N/A NIA
~~ ~~ i
1 930.269.502 NiA N!A NiA NiA 276,148 459 24.94 NiA N!A N:A N/A 147 87 ~.
I N:A NIA NiA NlA N/A NIA N:A N/A NiA N!A N/A N/A
~~~~ -
2,439 901 000 NIA 116 126000 N'A N:A 1,926 000 N!A 16 78 NIA N!A 29 17 23 05
2,141.633 231 41.05
N/A 160,121 903 21 1,460.836 NIA 47.10 9.76
N/A 407.935.263 N/A 25.46
- - - p p . p - . -A .~ HSBC Global Investment Funds
-
1 Key Figures as at 31 March 2007
Freestyle Sub-Funds US INDEX ASIA FREESTYLE BRlC FREESTYLE GLOBAL
USD USD USD EMERGING MARKETS EQUITY
FREESTYLE USD .-
CLASS A C (see note 3) NIA NIA Number of Shares Outstanding 1,388,428,991 3 503.449.900
Net Asset Value per Share 10 27 1608 N/A NIA
Number of Shares Outstanding NIA 41.937.472 NIA NIA 17.91 N/A NIA
Number of Shares Outstanding 25.657.991 10,700,673.394 NIA N/A Net Asset Value per Share 10.12 15.94 NIA NIA
Number of Shares Outstanding NIA 1 186.12A.745 NIA NIA N/A 17.72 N/A NIA
~. .
CLASS A C H (see note 3)
Net Asset Value per Share N/A . .
CLASS A 0 (see note 3)
. -
CLASS A D H (see note 3)
~. Net Asset Value per Share . . .-
Net Asset Value per Share .-- N/A .. .
CLASS E C (see note 3) Number of Shares Outstanding N/A 257.91 1.516 NIA NIA
NIA .. - - 15.85 NIA
CLASS E D (see note 3) Number of Shares Outstanding NIA N/A NIA N/A Net Asset Value per Share N/A NIA NIA NIA
Number of Shares Outstanding N/A 1,037 872.960 NIA N /A N/A 16.49 NIA NIA
. -
CLASS I C (see note 3)
Net Asset Value per Share . . CLASS I O (see note 3) Number of Shares Outstanding NIA 25,000.000 NIA N/A
N/A 16 49 NIA NIA Net Asset Value per Share
Net Asset Value per Share N/A . ..
Net Asset Value per Share . NIA NIA 21.33
Net Asset Value per Share NIA NIA N/A 11 79
. .
CLASS J 1 C (see note 3) Number of Shares Outstanding N/A N/A 41,244,299 499 NIA
NIA
CLASS M 1 C (see note 3) Number of Shares Outstanding N/A N/A 5 457,144.526 68,693,436 839
11.70
.~ N/A 15.34
. .~
CLASS M 1 D (see note 3) Number of Shares Outstanding NIA N/A NIA 3,346,679 966
CLASS M 2 C (see note 3) Number of Shares Outstanding NIA N/A 79 590,695.466 NIA
NIA Net Asset Value per Share N/A NIA 20.54
CLASS M 2 0 (see note 3) Number of Shares Outstanding N/A N/A 18 289850.517 NIA
NIA
.~
NIA 20.42 N/A .. . Net Asset Value per Share
-. Net Asset Value per Share.
Net Asset Value per Share
Net Asset Value per Share NIA N/A N/A N/A
. .
CLASS P C (see note 3) Number of Shares Outstanding N/A N/A N/A NtA
N/A . .-
NIA NIA N/A .. -
CLASS P D (see note 3) Number of Shares Outstanding 2,953.1 22.036 NIA NIA NIA
NIA N/A N/A 9.93 . - . .
CLASS W C (see note 3) Number of Shares Outstanding N/A NIA N/A NIA
CLASS W 0 (see note 3) Number of Shares Outstanding N/A NIA N/A N/A
N/A Net Asset Value per Share CLASS Y C (see note 3)
. .~ NIA N/A NIA . . _.
Number of Shares Outstanding NIA NIA NIA N/A NIA NIA NIA N/A Net Asset Value per Share . -
CLASS 2 C (see note 3) Number of Shares Outstanding NIA N/A NIA N/A
NIA Net Asset Value per Share NIA N/A NIA
CLASS 2 D (see note 3) Number of Shares Outstanding NIA NIA NIA N/A
N/A N/A NIA NIA Net Asset Value per Share
. -
A- HSBC Global Investment Funds
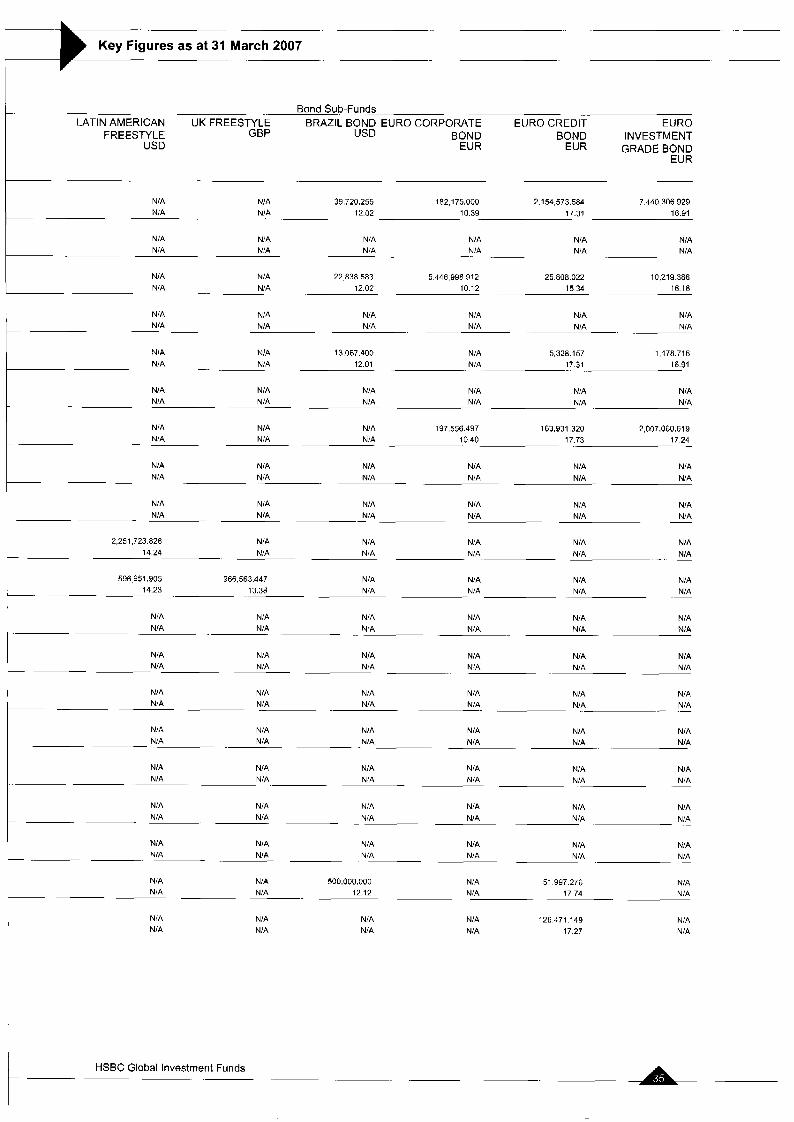
. -~
Key Figures as at 31 March 2007 - .
Bond Sub-Funds LATIN AMERICAN UK FREESTYLE BRAZIL BOND EURO CORPORATE EURO CREDIT EURO
FREESTYLE GBP USD BOND BOND INVESTMENT USD EUR EUR GRADE BOND I- EUR
- - I N/A N/A 39,720.255 182,175.000 2,154,573,584 7,440 306.929 NIA N!A 12.02 10.39 17.31 16.91
N/A NIA NIA N/A N!A NIA NIA N/A NIA N:A N/A N!A
. . - .
N/A N/A 22.838.583 5 446 998.912 25.ao8.022 10,219.386 N/A N/A 12.02 10.12 15 34 16.18 -- .
NIA N/A N/A NIA N,A N/A NIA N/A N/A N/A N,A N/A
NIA NIA 13 067 400 NIA 5.328 157 1.478 716 N/A N/A 12 01 NIA 17 31 16 91
NIA NIA NIA N/A NIA NIA NIA N/A N/A NIA NIA N/A
N/A NIA NIA 197,556.497 163,931 320 2,007,060 619 17 24 NiA N/A N IA 10 40 17 73 - I
N/A NIA NIA N/A N/A N/A NIA NIA NIA N/A NIA NIA
N/A NIA NIA NIA N/A N/A NIA NIA N'A N/A NIA NIA - c ~
2,251,723,026 N/A NIA NIA N/A N/A NIA - - 14 24 NIA NIA N/A NIA
596 951 905 966 563 447 N/A NIA N/A N/A 14 23 13 38 N!A NIA NIA NIA
c k -
N/A N/A N ,A NIA N/A N/A N/A NIA NiA NIA NIA NIA
NIA N/A N/A NIA N/A N/A N/A N/A N:A N/A N 'A N/A
. . .. .
NIA N/A N/A NIA N/A N/A N/A NIA NIA N/A N:A NIA .- .- - . - .~
NIA N/A N/A N/A N/A N/A N/A N/A NIA NIA N/A N/A
NIA N/A NIA NIA NIA NIA N/A N/A N/A. N ,A NIA N/A
NIA N/A N/A N/A N/A N/A N/A N/A N/A N/A NIA N/A
NIA NIA N/A N/A N/A N/A N/A N/A N'A N!A NIA N/A
.-
.-
- -
I N'A N/A 500,000 000 NIA 51 997 276 N/A N/A N!A 12 12 NIA 17 74 N/A
1 NIA N/A
N/A NIA
N/A N/A
NIA 126471.149 N/A 17.21
N/A N/A
A. HSBC Global Investment Funds .- . . . . .

Key figures as at 31 March 2007 3 - -
~
~
EURO HIGH YIELD GLOBAL GLOBAL BOND EMERGING INVESTMENT
EUR MARKETS BOND GRADE BOND USD USD
CLASS A C (see note 3) Number of Shares Outstanding Net Asset Value per Share . -
3,125,423.658 325.217.945 10,133.634 21.60 20.44 13.75
CLASS A C H (see note 3) Number of Shares Outstanding N/A N/A NIA
N/A NIA N/A Net Asset Value per Share . -
CLASS A 0 (see note 3) Number of Shares Outstanding Net Asset Value per Share
49,724 483 4,789,394 235 4,519.438 829 18 81 17 33 13.60
~
CLASS A D H (see note 3) Number of Shares Outstanding Net Asset Value per Share
NIA N/A NIA NIA N/A NIA
~
CLASS E C (see note 3) Number of Shares Outstanding Net Asset Value per Share
~
10,006.482 3.597.554 20.42
. - 21.58
NIA N/A .-
CLASS E 0 (see note 3) NIA NIA NIA Number of Shares Outstanding NIA N/A N/A Net Asset Value per Share . -
~
CLASS I C (see note 3) Number of Shares Outstanding Net Asset Value per Share
449,031 784 90,000 000 5.796 283 22 21 20 57 13 75
NIA NIA
CLASS I 0 (see note 3) Number of Shares Outstanding Net Asset Value per Share CLASS J I C (see note 3) Number of Shares Outstanding Net Asset Value per Share CLASS M I C (see note 3) Number of Shares Outstanding Net Asset Value per Share CLASS M 1 0 (see note 3) Number of Shares Outstanding Net Asset Value per Share CLASS M 2 C (see note 3) Number of Shares Outstanding Net Asset Value per Share CLASS M 2 D (see note 3) Number of Shares Outstanding Net Asset Value per Share CLASS P C (see note 3) Number of Shares Outstanding Net Asset Value per Share CLASS P 0 (see note 3) Number of Shares Outstanding Net Asset Value per Share CLASS W C (see note 3) Number of Shares Outstanding Net Asset Value per Share CLASS W 0 (see note 3) Number of Shares Outstanding Net Asset Value per Share CLASS Y C (see note 3) Number of Shares Outstanding Net Asset Value per Share
N/A NIA NIA NIA -
NIA NIA
NIA NIA NIA NIA -
NIA NIA
~
N/A NIA NIA N/A
~
NIA NIA
NIA NIA NIA N/A -
NIA NIA
NIA NIA NIA N/A
N 'A NIA
NIA NIA NIA N /A
~-
NIA NIA NIA NIA N/A NIA
~
NIA NIA NIA NIA N/A NIA
NIA NIA
NIA N8A NIA N/A -
21 932 577 NIA N/A N/A N/A I 8 5 0
N/A NIA N/A
NIA N/A NIA
~
CLASS 2 C (see note 3) Number of Shares Outstanding Net Asset Value per Share CLASS 2 0 (see note 3) Number of Shares Outstanding Net Asset Value per Share
245,128 775 2,024 895 235 22 24 20.91
N/A N/A
~
N/A N/A
N/A 3,152,335,322 NIA 13.67
-A- HSBC Global Investment Funds - ~

Key Figures as at 31 March 2007 -3 Reserve Sub-Funds
PAN-EUROPEAN - STERLING US DOLLAR HIGH US DOLLAR EURO RESERVE GOVERNMENT INVESTMENT YIELD BOND INVESTMENT EUR
BOND GRADE BOND US0 GRADE BOND t EUR GBP USD
t 2,582.1 14.984
16 06 I 73,47~.77a 7.014 997.527 N/A 3.184 332
. - 16.73 N/A 11.25 12.39 . .
NIA NIA N/A N!A NIA N/A N/A N/A N 'A N/A
88.916.557 N/A 7.391 465 332,468.426 Y0.351.957 13 34 NIA 11.27 10.95 15.42
! N/A N/A NIA NIA NIA NIA NIA NIA N:A N/A
2.562.397 7,299.558 1,743 052 3.051.057 NIA 16.71 5.43 1 1.23 12 38 N /A
NiA N:A NIA NiA NIA NiA NiA NJA NIA NIA -- - .
1,203,084 615 N/A NIA NIA NIA
NIA .- 1705 NIA NiA NIA
93 076 481 N/A NiA NIA N/A 15.21 N ,A NIA NIA N/A - .
N/A NIA N/A N/A NIA NIA N/A NIA N/A N /A
NIA N ,A NIA NIA NIA NIA NiA N/A NIA NIA
I NIA N/A NIA N/A N/A
NIA .~ NIA NIA N/A NIA
N/A N/A N/A N/A N/A - NIA NIA N 'A NIA N/A
N/A N:A N/A N/A N/A
N/A N:A NIA NIA N/A . -. +
I
N/A NIA N/A NIA NIA NiA N 'A N/A N/A N/A
NIA 2628 330847 N/A 3 424,861 231 NIA N/A 5 44 N/A 10 72 NIA
NIA NIA N!A 15Y.249.A93 NIA NIA NIA NiA 14 26 NIA
N/A - NIA 96 76 N/A 10 80 NIA
792 198 189 N/A 123 764 323 NIA
N/A NIA NIA N/A N/A N/A N'A - NIA NIA N/A
N/A N/A 499 500 000 345 721 000 N/A NIA NIA 11 43 12 57 NIA
- ~~
-~
N/A NIA
HSBC Global Investment Funds ~~
NIA N/A
NIA i,99a,1 12.435 NIA 1 1 .oo
N/A N/A

-
Key Figures as at 31 March 2007
Other Sub-Fun& us DOLLAR TURKISH
. .
RESERVE CONVERGENCE USD EUR
~.
CLASS A C (see note 3) Number of Shares Outstanding Net Asset Value per Share- CLASS A C H (see note 3) Number of Shares Outstanding Net Asset Value per Share CLASS A D (see note 3) Number of Shares Outstanding Net Asset Value per Share ~
CLASS A D H (see note 3)
- -
_
Number of Shares Outstanding NtA N/A N/A Net Asset Value per Share _ _ N,A
327.819913 3,246,914 480 16 41 14 67
N/A N/A NIA NIA
93 800 051 219 357 161 8 19 1 4 0 2
CLASS E C (see note 3) Number of Shares Outstanding NiA 19,165 418
Net Asset Value per Share N:A 14.66
Number of Shares Outstanding N 'A NIA
Net Asset Value per Share NIA NIA
Number of Shares Outstanding N 'A NIA
Net Asset Value per Share . NIA NIA
Number of Shares Outstanding NIA NIA
Net Asset Value per Share NIA NIA
Number of Shares Outstanding NIA N/A Net Asset Value per Share N/A NIA
CLASS E D (see note 3)
CLASS I C (see note 3)
- - CLASS I D (see note 3)
CLASS J 1 C (see note 3)
CLASS M I C (see note 3) Number of Shares Outstanding NIA N/A Net Asset Value per Share N/A NIA
CLASS M 1 D (see note 3) Number of Shares Outstanding NIA NIA Net Asset Value per Share N/A NIA
Number of Shares Outstanding NIA N/A Net Assg Value per Share N/A N/A
Number of Shares Outstanding NIA N:A Net Asset Value per Share NIA N/A
Number of Shares Outstanding NIA NIA Net Asset Value per Share NIA NIA
Number of Shares Outstanding 1 523 040 266 NIA Net Asset Value per Share 8 57 N/A
Number of Shares Outstanding N/A NIA Net Asset Value per Share NIA N/A
CLASS W 0 (see note 3) Number of Shares Outstanding NIA NIA Net Asset Value per Share . NIA NIA
CLASS Y C (see note 3) Number of Shares Outstanding N/A NIA Net Asset Value per Share NIA NIA
Number of Shares Outstanding N/A NIA Net Asset Value per Share NIA NIA
Number of Shares Outstanding N/A NIA Net Asset Value per Share NIA NIA
- ~
- ~
CLASS M 2 C (see note 3)
CLASS M 2 D (see note 3)
-
CLASS P C (see note 3)
~
CLASS P D (see note 3)
- CLASS W C (see note 3)
- CLASS 2 C (see note 3)
- CLASS 2 D (see note 3)
HSBC Global Investment Funds
-


Statement of Operations and Changes in Net Assets
for the year ended 31 March 2007
Equity Sub-Funds
CONSOLIDATED ASIA EX JAPAN ASIA EX JAPAN ASIA PACIFIC EX USD EQUITY EQUITY SMALLER JAPAN EQUITY
USD COMPANIES HIGH DIVIDEND USD USD
Net Assets at the Beginning of the Year 19,254,376,617 582,349,188 31,219,270 192.121,007
LNCOME Investment Income Bank Interest
492,733,684 13,285,141 603,801 8,241,363 32,119,399 477,288 37.130 36,889
Other Income 8,994 ..
Total Income 524,862,077 13,762.429 640,931 8,278,252
EXPENSES Management Fees (note 4.2) 261,272,086 7,387,077 461,846 2,159,219 Performance Fees (note 4.3) 1 16,116,938 Operating, Administrative and Servicing Fees (note 4.4) Bank Interest Paid
80,073,715
1,448.159 1,857,252 107,764
75 537,081 9,401
Total Expenses 458,910,898 9,244,329 569,685 2,705,701
Net Investment Profitl(Loss) 65,951,179 451 8,100 71,246 5,572.551 Realised Profit/(Loss) on Sale of Investments
3,160.899.71 1 79,493,365 5,043,954 8,471.846
84,011,465 5.1 15,200 14,044,397 Reaked Profit/(Loss) for the Year before Foreign Currency Movement
3,226,850,890
Profit/(Loss) on Foreign Currency (41,802,825) (2,309,680) (92,891 ) (430,466) Change in unrealised 422,695,661 appreciation!(depreciation) of investments, futures and forward exchange contracts
34,240,676 4,482.91 6 16,465,915 ~.
Change in Total Net Assets as a Result of Operations
Proceeds on Issue of Shares Payments on Redemption of Shares Dividends Paid (note 11) Currency Translation
Net Assets as at 31 March 2007 ..
The accompanying notes form an integral part of these financial statements.
3,607,743:726 115,942,461 9,505,225 30,079,846 - ~ __
13,955,244,434 303,304,455 13,883,309 60,836.451 (1 5,022,292,141 ) (387,628,529) (13,308,733) (1 38,399,634)
(55,847,304) (1,434,880) (21 0,930) (2,428,729) 273,314,536
22,012,53g,a6a 612,532,695 41,088,141 142,208,941
HSBC Global Investment Funds
-

Statement of Operations and Changes in Net Assets
-
BRAZIL EQUITY BRIC MARKETS ERIC MARKETS CHINESE EQUITY EMERGING EUROLANDEQUITV USD USD EQUITY USD EUROPE EQUITY EUR
USD EUR
- ~.
351 , I 02,078 223,573,945 2,891,006,873 29,983,564 292.922,023
10,339,638 1,891,245
12.230.883 .~
10,496,833
2,575,283
13,072,116
5,801,434 690.038 73,266 961,265
5 874,700 1,651,303
3,003,097 1,112,001
750,764 325,857 72,960 67.210
3,826,821 1,505,068
83,430.1 18 6,198,217
759,620 25,678
8,734,842 108,554
89,628,335 785,298 8,843,396
53,575,491
1 4 ~ 764,670 790
68,340,951
336,705
89.315 9,221
. -
435,241
6,731,413
2,042,322 143,676
8,917,411 - - ~ ~
(841,233) 2.047.879 146,235 21,287,384 350,057 (74,015)
35,687,495 18,409,131 8,420,941 507,270,430 2,140,585 42,436,143 ~ ~ -- - ~ .~
42,362,128 528.557.81 4 2,490,642 34,846,262 20,457,010 8,567.176 ~~~ .~ -~
(6,372,812) 1,513,729 (430.495) (10,974,430) (497.081) ( I 81,846)
177,688,346 21,806,638 22 398,884 825.433.496 (22,495) 22,613,654 ~~~~~ ~
64,793,936 1,971,066 206,161,796 43,777,377 30,535,565 1.343.016.880 ~
~ ~ ~ ~ ~ -~ 1,245,904,544 619,019,208 314,309,822 2,832,429,870 18,019,399 463,397,946 (716,787,661) (424,685,963) (39.813.342) (2,662,810,358) (24.71 3.230) (242.1 28,944)
(373,062) (15,447,548)
-
HSBC Global Investment Funds
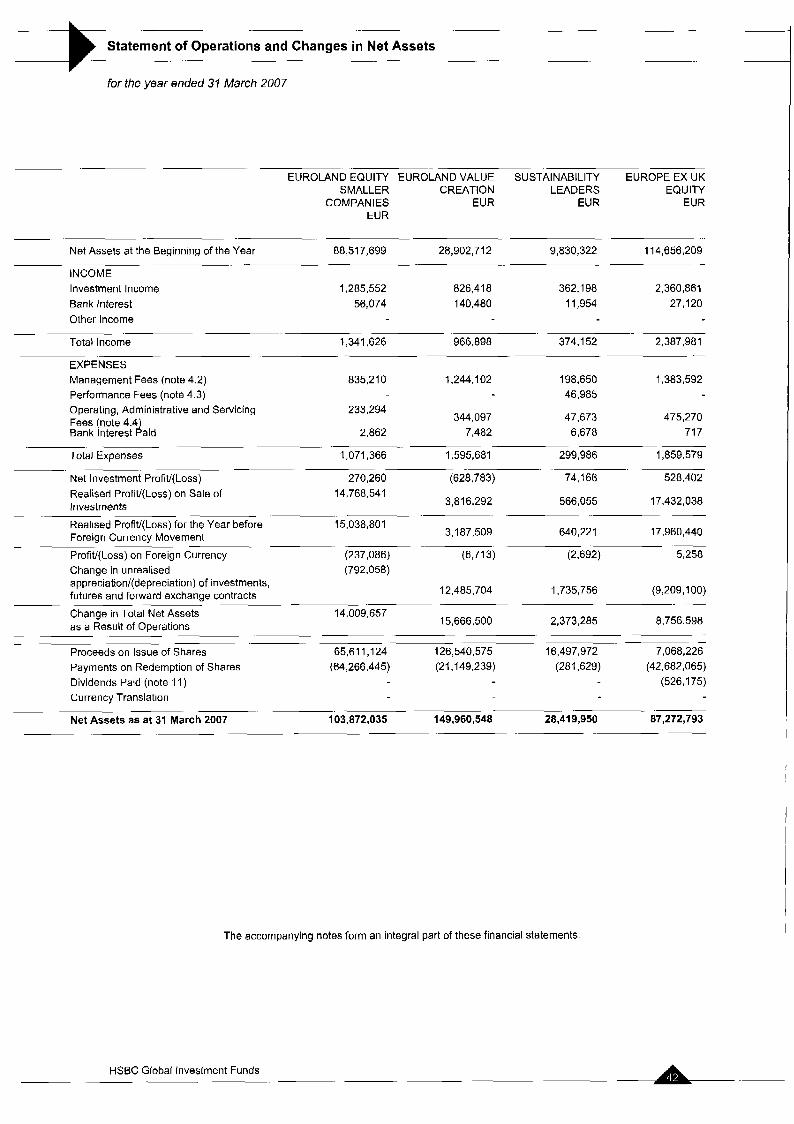
~ - - EUROLAND EQUITY EURO~AND VALUE SUSTAINABILITY EUROPE EX UK
SMALLER CREATION LEADERS EQUITY COMPANIES EUR EUR EUR
EUR
I
Net Assets at the Beginning of the Year 88,517,699 28,902,712 9,830,322 114,656,209 ~.
INCOME 826,418 362,198 2,360,861 Investment Income 1,285,552
Bank Interest 56,074 140,480 I 1,954 27,120 Other Income
- Total Income 1,341,626 966,898 374,152 2,387,981
. -
EXPENSES Management Fees (note 4.2) 835,210 1,244.102 198,650 1,383,592 Performance Fees (note 4.3) 46,985 Operating, Administrative and Servicing Fees (note 4.4 Bank Interest daid
233.294
2,862 344,097
7,482 47.673
6,678 475,270
71 7
Total ixxpenses 1,071,366 1,595,681 299,986 1,859,579
Net Investment Profit/(Loss) 270,260 (628,783) 74,166 528,402 Realised Profitl(Loss) on Sale of Investments
14,768,541 3,816,292 566,055 17,432,038
Realised Profit/(Loss) for the Year before Foreign Currency Movement
15,038,801 3,187,509 640,221 17,960,440
- Profit/(Loss) on Foreign Currency (237,086) (6,713) (2.692) 5,258 Change in unrealised (792,058) appreciation/(depreciation) of investments, futures and forward exchange contracts 12,485,704 1.735,756 (9,209,100)
Statement of Operations and Changes in Net Assets
for the year ended 31 March 2007
Change in Total Net Assets as a Result of Operations
14,009,657 15,666,500 2,373,285 8,756,598
- ~ ~ ~
- 7,068,226 Proceeds on Issue of Shares 65,611,124 126,540,575
Payments on Redemption of Shares (64,266,445) (21,149,239) (281,629) (42,682,065) 16,497,972
Dividends Paid (note 11) Currency Translation
Net Assets as at 31 March 2007
(526,175)
103,872,035 149,960,548 28,419,950 87,272,793
The accompanying notes form an integral part of these financial statements.
A- HSBC Global Investment Funds

... .. ..
Statement of Operations and Changes in Net Assets . . . .. ._
-.
GLOBAL GLOBAL GLOBAL EQUITY GLOBAL EQUITY GLOBAL EQUITY GLOBAL EX EMERGING EMERGING USD SRI TECHNOLOGY EUROLAND EQUITY
MARKETS ELITE MARKETS EQUITY USD USD EUR FUND USD
-. .. - . USD
232,800,507 164,972,157 10,848,034 7,914,102 59,070,237
28,730 5,515,164 2,809,546 247,420 142.745 799,555 9,829 361 :532 210,482 7,967 5,474 122,172
38,559 5,876,696 3,020,028 255.387 148,219 921,727
t 23,762 3.872,654 1,106,305 48,553 110,714 251,456 I 5,351 1,053,413 578,174 39,647 27,185 150,767
9 4,623 564 209 415 94,894
29.1 22 4,930,690 1,685,043 88,409 138,314 497.1 17
9,437 946,006 1.33r985 166,978 9,905 424,610
(1 50,043) 57,645,613 18,982,314 1,584,795 625,285 1,589,579
(1 40,606) 58,591,619 20,317,299 1,751,773 635,190 2,014,189
-
_-
(6,230) (704,590) (123,309) 14.280 (7,999) (298,043)
251,446 (6.21 I ,I 19) (5,342,620) 821,212 206,218 (800,419)
1 04,6 1 0 51,675,910 14,851,370 2,587,265 833,409 915,727
15,000,000 103,677,075 115,589,920 9,194,102 6,426,866 2,218,074 (92,249,344) (119,012,733) (1,852,019) (8,515,230) (1 3,363,771) (1,151 -756) (438,791) (25)
- 15,104,610 294,752,392 175,961,923 20,777,357 6,659,147 48,840,267
HSBC Global Investment Funds . . ~.

_.
Statement of Operations and Changes in Net Assets -
for the year ended 31 March 2007
- HONG KONG INDIANEQUITY JAPANESE EQUITY KOREAN E~U~TY
EQUITY USD J PY USD USD
Net Assets at the Beginning of the Year 194,270.521 6,029,705,648 32,542,790,513 152,431,357
INCOME Investment Income 5,001,002 82,011.218 41 1,668,062 2,194,120 Bank Interest 281,569 4,951,450 6.227.752 54,545 Other Income
Total Income 5.282.571 86,962,668 417,895,814 2,248,665
EXPENSES Management Fees (note 4 2) 1,871,715 80,979,309 408,296 582 1,798,941 Performance Fees (note 4 3)
..
__
Operating, Administrative and Servicing Fees (note 4.4) Bank Interest Paid
699,112 21,823,618
149 554,311 117,850,880
7,848.1 74 550,543
686
533,995,636 2,350,170 Total Expenses 2.570,976 103.357.318
Net Investment Profit/(Loss) 2,711,595 (1 6,394,650) (1 16,099.822) (101,505) - ~
Realised Profit/(Loss) on Sale of Investments
41,734:161 1,340,514,597 3,952,232,651 7,534,942
Realised Profit/(Loss) for the Year before Foreign Currency Movement 44'445'756 I ,324,119,947 3,836,132,829 7,433,437
Profit/(Loss) on Foreign Currency (679,404) (9,514, i 2 q (17,045,705) (531,515) Change in unrealised 8,400,483
(743,439,580) (3,577,634,155) 6,426,402 appreciation/(depreciation) of investments. futures and forward exchange contracts
571,166,241 241,452,969 13.328,324 Change in Total Net Assets as a Result of Operations
Proceeds on Issue of Shares .. 132,121,790 2,399,094,465 35,874,405,149 153.5051230 Payments on Redemption of Shares (1 61,029,770) (3,549.1 38,405) (32,210,854,181) (1 65,577,953) Dividends Paid (note 11) (3,972,474) (27,309) (31,471)
Currency Translation
52,166,835
-. Net Assets as at 31 March 2007 213,556,902 5,450,800,640 36,447,794,450 I 53,655,487
The accompanying notes form an integral part of these financial statements.
HSBC Global Investment Funds I

.- .-. . . . . . .
Statement of Operations and Changes in Net Assets .... .. ... .
7,543,96 1 1,123,783 460.458 3,386.928 2,161 -682 1,216,112
3.628.184 266,882 160,930 809,146 531,227 615.282 354 71,272 237 28,641 18,572 19,845
11,172,499 1,461,937 621,625 4,224,715 2,711,481 1,851,239
6.1 14,291 933,655 906,842 3,064,032 2.273,267 1,900,447
80.505,611 7,689,598 8.378.856 (2,983,135) 15,086,940 11,845,044
86,619,902 8,623.253 9,285,698 80,897 17.360,207 13,745,491
(21 1,988) (44,601 ) (435,450) (56,907) (7.467) 27,530
.. -
-
(1 1,325,806) 9,820,978
73,777,349 5.247.846 23,742,683 1,699,281 6,026,934 23,593,999
479,142,427 46,771,424 -130,868384 21 0,886,261 36,815,894 184,375,481 (383,069,593) (52,663,042) (67,304,121) (254,790,966) (108,641,216) (149,884.51 2)
(4,862,107) (1,132,225) (5,083,198) (1,237,801) (1 07,481 )
(12,630,565) (3,330,806) 14,892,435 1,675,291
~. -
~
733,610,436 02,660,478 112,417,143 217,572,937 97,879,771 195,931,184 ~
- ..- 7 PAN-EUROPEAN PAN-EUROPEAN SINGAPORE THAI EQUITY UK EQUITY US EQUITY
EQUITY EQUITY HIGH EQUITY USD GBP USD EUR DIVIDEND USD
EUR
- -
568,630,360 83,304,250 26,242,522 264,861,559 164,915,960 137,953,697
17,080,298 2,317,751 1.41 3,969 6,985,913 4,918,587 3,118,875 206,492 77,841 114.498 302.834 66.161 632,811
17,286,790 2,395,592 1.528.467 7,288,747 4,984,748 3,751,686 . ..
..A HSBC Global Investment Funds

Statement of Operations and Changes in Net Assets
for the year ended 31 March 2007 T
Freestyle Sub-Funds ~
GLOBAL USD USD USD EMERGING
MARKETS EQUITY FREESTY LE
USD
Net Assets at the Beginning of the Year 101,754,702 374,242,604 3,377,707.464 660,549,914
US INDEX ASIA FREESTYLE BRlC FREESTYLE
... - INCOME Investment Income Bank Interest
1,222,512 7,201,625 110,762.548 21,774,999 3,185 197,736 9,959,451 1,700,988
Other Income
Total Income 1,225,697 7,399,361 120,721 999 23,475,987
EXPENSES Management Fees (note 4 2) 237,738 4,964,264 28,899,454 I 1,342,363 Performance Fees (note 4 3) 93,228,729 21,098,281
.~ -.
Operating, Administrative and Servicing Fees note 4.4) Bank I nterest Paid
175,639
2,035 1,143,928 12,006,432 4,536.945
13,157 998 29,827
Total Expenses 415,412 6,121,349 134,135,613 37,007,416
Net Investment Profitl(Loss) 810,285 1,278.012 (1 3,413,614) (13,531,429) - -
Realised Profit/(Loss) on Sale of Investments
Realised Profitl(Loss) for the Year before Foreian Currencv Movement
-.
9,353,664 73,201,547 567,433,108 85,961,799
10,163,949 - ..
- 74,479,559 554,OI 9,494 72,430,370
Profit/(Loss) on Foreign Currency (8,192) (982,780) (1,946,288) (5,256,517) Chanae in unrealised (8,760,151)
1,395,606
.. appreciation/(depreciation) of investments, futures and forward exchange contracts
Change in Total Net Assets as a Result of Operations
Proceeds on Issue of Shares 26,426,978 59,727.666 .-- 963,143,904 942,413,850 Payments on Redemption of Shares (84,956,593) (221,427,127) (2,130.469.661) (911,340,140) Dividends Paid (note 1 I) (792,232) (1,570,757) Currency Translation
~. - ~. ~ -
___ .
. . .. - . .. - Net Assets as at 31 March 2007 43,828,461 270,322,943 2,757,083,981 a45,789,963
(1 4,146.222) (5,370,932) 86,992,486
59,350,557 546,702,274 154,166.339
-. - -
. -
The accompanying notes form an integral part of these financial statements. I
~
HSBC Global Investment Funds . -
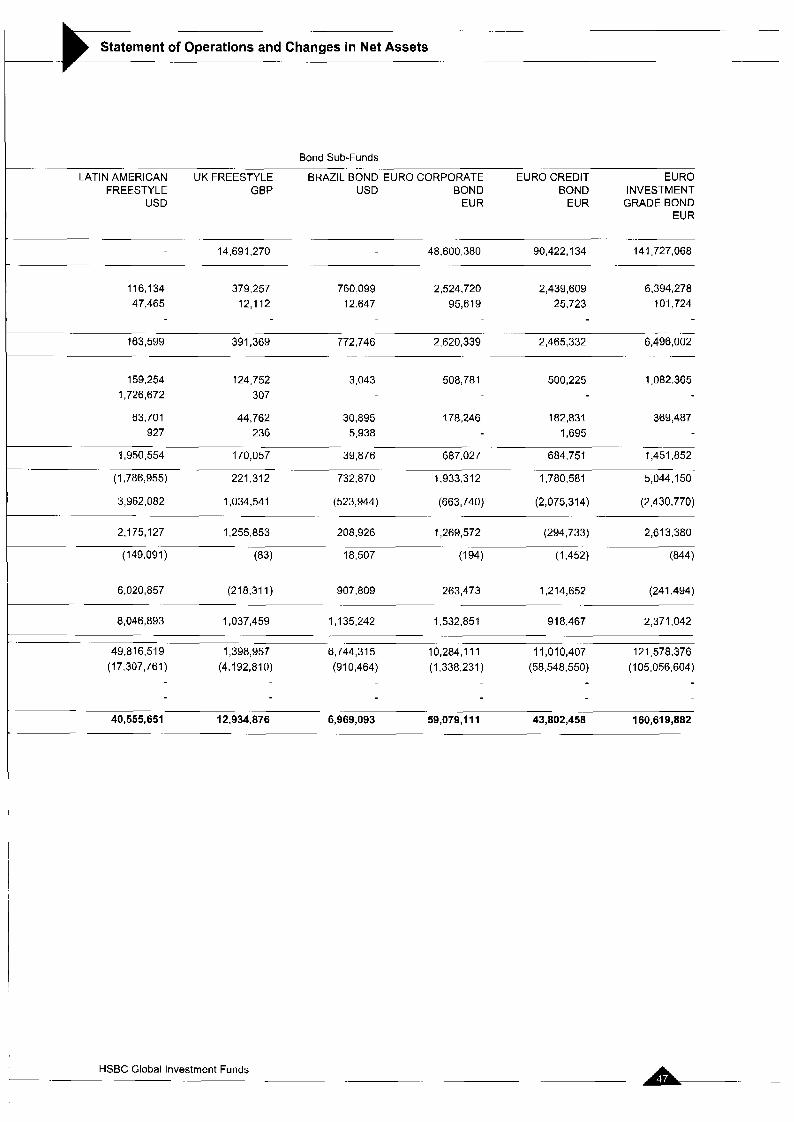
-- - - - -
Statement of Operations and Changes in Net Assets
Bond Sub-Funds ~. .
LATIN AMERICAN UK FREESTYLE BRAZIL-BOND -EURO CORPORATE EURO CREDIT EURO FREESTYLE GBP USD BOND BOND INVESTMENT
USD EUR EUR GRADE BOND EUR
t 14,691,270 48,600,380 90,422,134 141,727,068
t 116,134 379,257 47,465 12,112
760.099 2,524,720 2,439,609 6,394,278 101,724 12.647 95,619 25.723
. -. .. .- -. ...
6,496,002 163,599 391,369 772.746 2,620,339 2,465,332 . .- . -. .. .~
159,254 124,752 3,043 508,781 500,225 1,082,365 1,726,672 307
63.701 44,762 30,895 178,246 182,831 369,487 927 236 5,938 1,695
-.
1,950,554 170,057 39,876 687.027 684,751 1,451,852
(1,786,955) 221,312 732.870 1,933,312 1,780,581 5,044[150-
(523,944) (663,740) (2,075,314) (2,430,770) 3,962,082 1,034,541
2,175,127 1,255,853 208,926 1,269,572 (294,733) 2,613.380
.-
. -
(1491091) (83) 18,507 (194) (1.452) (844)
6,020,857 (218,31 I ) 907,809 263,473 1,214,652 (241.494)
8,046,893 1,037,459 1,135,242 I ,532,851 918,467 2,371,042
49.81 6,519 I ,398,957 6,744,315 10,284~111 11,010,40~ 121,578.376 (58,548,550) (105,056.604)
- . .
- . -~
(17,307,761) (4. I 92,ai 0) (910,464) (I ,338,231)
40,555,651 12,934,876 6,969,093 59,079,111 43,802,458 160,619,882
L- HSBC Global Investment Funds L
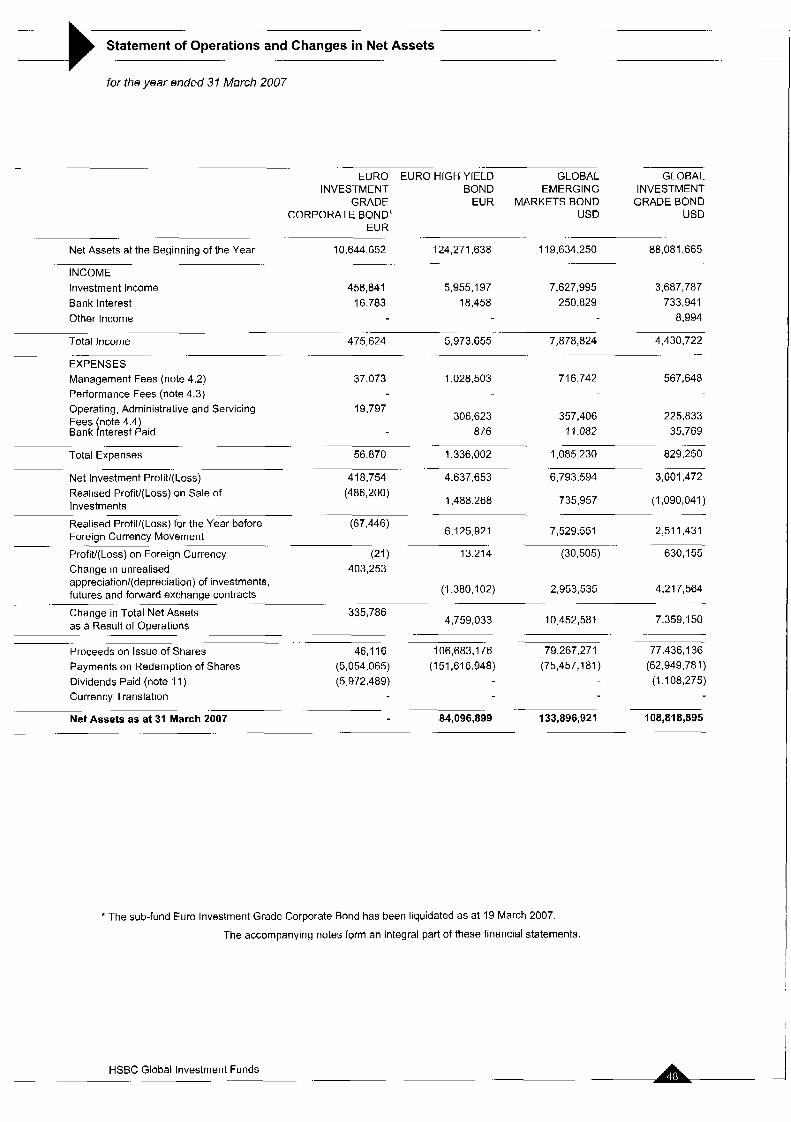
Statement of Operations and Changes in Net Assets
for the year ended 31 March 2007
--
. --I
..
GLOBAL INVESTMENT BOND EMERGING INVESTMENT
GRADE BOND CORPORATE BOND* USD USD
EURO EURO HIGH YIELD GLOBAL
GRADE EUR MARKETS BOND
EUR
10,644,652 124,271,638 119,634,250 88,081,665 Net Assets at the Beginning of the Year ._
INCOME Investment Income Bank Interest Other Income
458,841 5,955,197 7,627,995 3,687,787 16.783 18,458 250,829 733,941
8,994
Total Income 475,624 5,973.655 7,878,824 4,430,722
EXPENSES Management Fees (note 4.2) 37,073 1,028,503 716,742 567.648 Performance Fees (note 4.3)
~ .-
Operating, Administrative and Servicing Fees (note 4.4 Bank Interest Aaid
19,797 306,623
8 76 357,406
1 1,082 225,833
35,769 .-
Total Expenses 56,870 1,336,002 1,085,230 829,250
Net Investment Profit/(Loss)- 418,754 4,637,653 6,793,594 3,601,472 Realised Profit/(Loss) on Sale of Investments
(486,200) 1,488.268 735,957 (1,090,041)
. .. .- ~.
2,511,431 Realised Profit/(Loss) for the Year before Foreign Currency Movement
ProfiV(Loss) on Foreign Currency (21) 13.214 (30,505) 630,155 Chanae in unrealised 403,253
(67,446) 6.1 25,921 7,529.551
~.
" appreciation/(depreciation) of investments, futures and forward exchange contracts
Change in Total Net Assets as a Result of Operations
Proceeds on Issue of Shares Payments on Redemption of Shares Dividends Paid (note 11) Currency Translation
Net Assets as at 31 March 2007
(1,380,102) ~
4,759,033 335,786
46,116 106,683,176 (5,054,065) (151,616.948) (5,972,489)
84,096,899
2,953,535
10,452,581
79,267,271 (75,457,181)
-.
4,217,564
7,359,150
~ -
77,436,136 (62,949,781)
(1,108,275)
133,896,921 108,818,895
* The sub-fund Euro Investment Grade Corporate Bond has been liquidated as at 19 March 2007.
The accompanying notes form an integral part of these financial statements.
I ~
1 HSBC Global Investment Funds . -
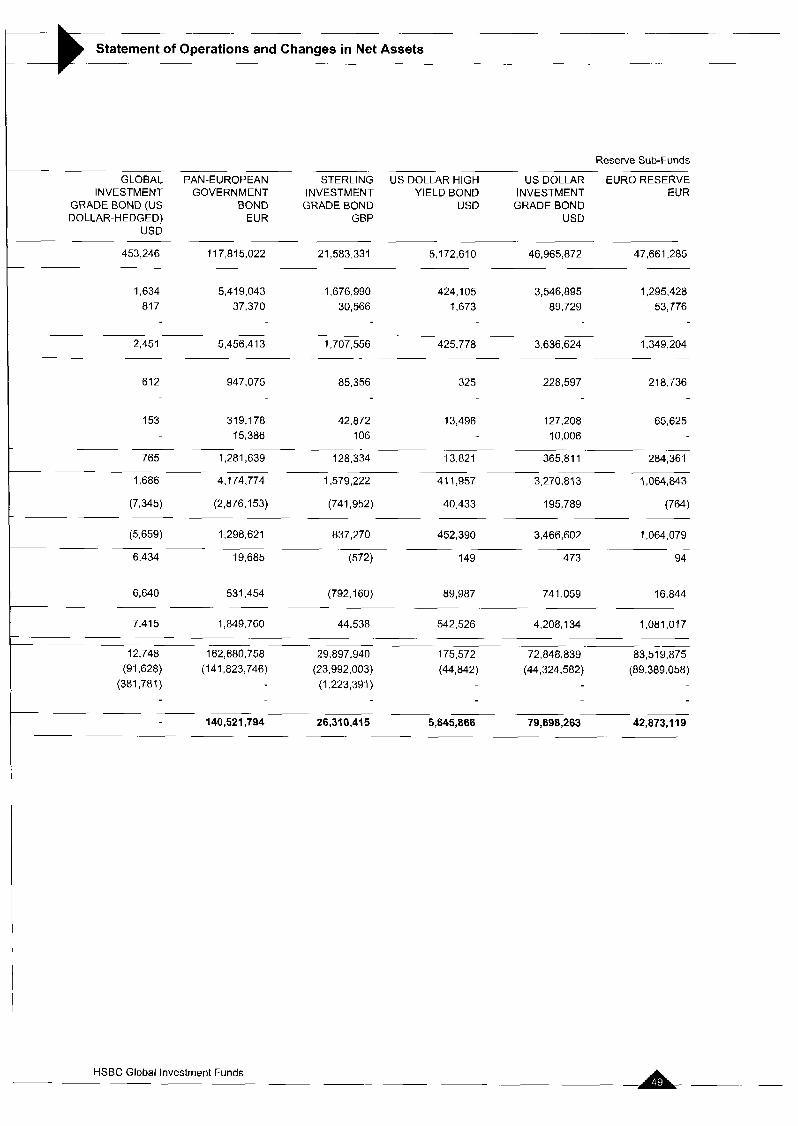
.- .~
Statement of Operations and Changes in Net Assets ~ -~ -
.- - 12.748 162,680,758 29.897,940 175.572 72,848,839 83,519,875
(91,628) (141,823,746) (23,992,003) (44,842) (44,324,582) (89,389,058) (381,781) (1,223,391)
------ -~ 140,521,794 2631 0,415 5,845,866 79,698,263 ea73 ,119
~~~~
-~~ GLOBAL
INVESTMENT GRADE BOND (US
USD
453,246
DOLLAR-HEDGED)
~~~
PAN-EUROPEAN STERLING GOVERNMENT INVESTMENT
BOND GRADE BOND EUR GBP
.~ ~
117,815,022 21,583,331
Reserve Sub-Funds
US DOLLAR HIGH US DOLLAR EURO RESERVE YIELD BOND INVESTMENT EUR
USD GRADE BOND USD
47,661,285 5,172,610 46,965,872
1,634 5,419,043 1,676,990 424,105 3,546,895 1,295,428 817 37,370 30,566 1,673 89,729 53,776
2,451 5,456,413 1,707,556 425,778 3,636,624 1,349,204 -

Statement of Operations and Changes in Net Assets
for the year ended 31 March 2007
-7- -
Other Sub-Funds . . -
TURKISH US DOLLAR RESERVE CONVERGENCE
USD EUR
. .
Net Assets at the Beginning of the Year 22,672,829 67,383,014 . . ~.
INCOME investment Income Bank Interest
962,091 5,180.41 9 75,571 501,952
Other Income
Total Income 1,037,662
EXPENSES Management Fees (note 4.2) 71,526 692,990 Performance Fees (note 4 3)
- .~
5,682,371
Operating, Administrative and Servicing Fees note 4.4) Bank r nterest Paid
29,591 179,471 1.043
~. - Total Expenses 102,160 872,461
Net Investment ProfiV(Loss) 935,502 4,809,910 ~-
Realised Profit/(Loss) on Sale of Investments
8,210 (6,668,629)
. ~ ~-
943,712 (2,058,719) Realised ProfiV(Loss) for the Year before Foreign Currency Movement
Profit/(Loss) on Foreign Currency (349) (662.536)
(658.305) appreciationl(depreciati0n) of investments, futures and forward exchange contracts
(3,379,560) Change in Total Net Assets as a Result of Operations
Proceeds on Issue of Shares 36,974,471 42,529.373 Payments on Redemption of Shares (41,385,423) (55,423,466) Dividends Paid (note 1 I) (130,910) Currency Translation
Net Assets as at 31 March 2007 19,19S,l18 50,978,451
Change in unrealised (9,122)
~. .
934,241 . - .~ ~.
. - -
~. ~. . ~
.- ~ ~
The accompanying notes form an integral part of these financial statements.
A- HSBC Global Investment Funds ~~~~~

-
Notes to the Financial Statements
b 1. Basis of presentation
The Company is incorporated under the laws of the Grand Duchy of Luxembourg as an investment company (Societe d’lnvestissement a Capital Variable or “SICAV). The capital comprises various classes of shares each relating to a separate portfolio (a “sub-fund”) consisting of securities, cash and other sundry assets and liabilities. The accompanying financial statements present the assets and liabilities of the individual sub-funds and of the Company taken as a whole. The financial statements of each individual sub-fund are expressed in the currency designated in the prospectus for that particular sub-fund and the financial statements of the Company are expressed in United States dollars (USD). The financial statements have been prepared in accordance with the format prescribed by the Luxembourg authorities for Luxembourg investment companies.
The Company is an officially registered investment fund under part I of the law of 20 December 2002 and has been certified as a UCITS fund under the directive 85/61 IlCEE of the Council of Europe enabling it to be freely marketed within member states of the European Community from 1 October 1989, subject to member states enacting enabling legislation and complying with local marketing regulations.
The Company has been certified as a recognised collective investment scheme in the United Kingdom under the Financial Services and Markets Act 2000 (the “Act”).
Certain sub-funds of the Company are authorised by the Hong Kong Securities and Futures Commission under Section 104 of the ”Securities and Futures Ordinance”.
In the prospectus and in the reports, the short names of the sub-funds are used. The complete name of each sub- fund consists of ”HSBC Global Investment Funds” plus the short name of the sub-fund.
Since I April 2006, the Company has proceeded to:
1) The opening of new sub-funds: on 1 June 2006, Brazil Bond, on 1 June 2006, BRlC Markets Equity, on 6 July 2006, Latin American Freestyle, on 05 February 2007, Global Emerging Markets Elite Fund.
2) on 1 June 2006, Pan-European Equity Smaller Companies changed its name to Euroland Equity Smaller Companies.
Change in name for the following sub-fund:
3) Investment Funds: (exchange ratio 1) - European Equity merged into Pan-European Equity class WD - Japanese Equity merged into Japanese Equity class WD - US Equity merged into US Equity class WD - UK Fixed Income merged into Sterling Investment Grade Bond class WD - US Dollar Opportunities Bond class D merged into US Dollar Investment Grade Bond class WD - US Dollar Opportunities Bond class C merged into US Dollar Investment Grade Bond class WC - International (Ex UK) Fixed Income merged into Global Investment Grade Bond class WD.
4) On 19 May 2006, Global Investment Grade Bond ( U S Dollar-Hedged) class AC merged into Global Investment Grade Bond class AC (exchange rate 1.218229913). Global Investment Grade Bond (US Dollar-Hedged) class AD merged into Global Investment Grade Bond class AD (exchange rate 1.122148803).
5)
On 3 April 2006, the following sub-funds of HSBC Institutional Client Funds merged into HSBC Global
On 19 March 2007, the sub-fund Euro Investment Grade Corporate Bond was liquidated.
b 2. Accounting Policies
The following accounting policies have been used consistently in dealing with items which are considered material in relation to the Company’s financial statements.
a) Accounting convention The financial statements have been prepared under the historical cost convention modified by the revaluation of investments.
HSBC Global Investment Funds - - - ---
Notes to the Financial Statements (continued) I
b 2. Accounting Policies (continued)
b) Assets and portFolio securities valuation
The assets of each Class within each sub-fund are valued as at 11 .OO a.m. (Luxembourg time) as at 31 March 2007.
In addition, portfolio securities and/or financial derivative instruments which are listed on an official stock exchange are valued at the last available price on the principal market on which such securities are traded. Securities traded on other organised markets are valued at the last available price or yield equivalents obtained from one or more dealers in such organised markets at the time of valuation. If such prices are not representative of their fair value, all such securities and all other permitted assets will be valued at their fair value at which it is expected they may be resold as determined in good faith by or under the direction of the Directors.
The financial derivative instruments which are not listed on any official stock exchange or traded on any other organised market will be valued in accordance with market practice. Shares or units in underlying open-ended investment sub-funds shall be valued at their last available net asset value reduced by any applicable charges.
c) Income and Expenses
Interest is accrued on a day-to-day basis. Dividends are accounted for on an ex-dividend basis.
d) Foreign Exchange
The wst of investments, income and expenses in currencies other than the fund relevant reporting currency have been recorded at the rate of exchange ruling at the time of the transaction. The market value of the investments and other assets and liabilities in currencies other than the relevant reporting currency have been converted at the rates of exchange ruling at 31 March 2007.
e) Realised Profit/(Loss) on Sale of Investments
Realised profit/(loss) on sale of investments is the difference between the historical average cost of the investment and the sale proceeds.
b 3. Share capital
The Company has issued either A, E, I, J, M, P, W, Y or Z Shares to investors in one or several sub-funds as detailed below.
Within each sub-fund, the Company is entitled to create different share classes and/or sub-classes, distinguished by their distribution policy (Capital-Accumulation (C) and Distribution shares (D)), their hedging activity (H) and/or by any other criterion to be stipulated by the Directors.
All share classes are available as both Capital-Accumulation and Distribution Shares.
Shares in existence before 2 October 2000 have been designated Class A Shares and are available to all investors. On 25 November 2002, all Shares in issue in Class A of the sub-funds Pan-European Equity, Hong Kong Equity, Japanese Equity, Singaporean Equity, North American Equity, US Index, US Dollar Bond and US Dollar Reserve were renamed Class P Shares. The rights and obligations relating to such Shares remain unchanged (except that the minimum initial investment amount was increased to USD 50,000).
A-- HSBC Global Investment Funds - ~ ~ ~ - ~ ~ -- .~ ~ ~

Notes to the Financial Statements (continued) x -
b 3. Share capital (continued)
Class A
Class E
Class I
Class J
Class M
Class P
Class W
Class Y
Class Z
E Shares will be available in certain countries, subject to the relevant regulatory approval, through specific distributors selected by the Share Distributor. E Shares will incur annual management fees equivalent to that of the Class A Shares plus 0.3% to 0.5% per annum of the Net Asset Value of Class E Shares, which may be payable to specific distributors in certain countries.
I Shares are available through specific distributors selected by the Share Distributor.
J Shares are available for investment by fund of fund ranges managed by the HSBC Group only.
M Shares are available to all investors.
P Shares are available for subscription in certain jurisdictions or through certain selected distributors.
W Shares are available through specific distributors that will also be members or affiliated entities of the HSBC Group as selected by the Share Distributor provided (in addition) the investors qualify as institutional investors within the meaning of article 129 of the 2002 Law. No Operating, Administrative and Services Expenses will be charged to Class W Shares. All the fees and charges allocated to this Class will be paid directly by members or affiliated entities of the HSBC Group.
Y shares are available to all investors in certain jurisdictions or through certain specific distributors approved by the Share Distributor.
2 Shares are available to investors having entered into a discretionary management agreement with an HSBC Group entity and to investors subscribing via distributors selected by the Share Distributor provided that such investors qualify as institutional investors within the meaning of article 129 of the 2002 law.
USD 5,000
EUR 1,000,000
USD 100,000
USD 5,000
USD 50,000
USD 100,000
USD 1,000
USD 1,000,000
Description Minimum Initial Minimum Investment Holding
USD 5,000 A Shares are available to all investors. USD 5,000
USD 5,000
EUR 1,000,000
USD 100,000
USD 5,000
USD 50,000
USD 100,000
USD 1,000
USD 1,000,000
The Board of Directors of the Company has authority to issue different Classes of Shares in the one or several sub- funds. Details of the characteristics of such Share Classes offered by one or several sub-funds will be determined by the Board of Directors. In case of the creation of additional Classes of Shares, this Prospectus will be updated.
The subscription proceeds of all Shares in a sub-fund are invested in one common underlying portfolio of investments. All Shares of the same class have equal rights and privileges. Each Share is, upon issue, entitled to participate equally in assets of the relevant class of the sub-fund to which it relates on liquidation and in dividends and other distributions as declared for such sub-fund. The Shares will carry no preferential or pre-emptive rights and each whole Share will be entitled to one vote at all meetings of Shareholders.
The minimum initial investment amount may be reduced at the discretion of the Company.
A -~
HSBC Global Investment Funds
-
Notes to the Financial Statements (continued)
I -
b 3. Share capital (continued)
Share Class Denominations:
The Share Classes issued in the different sub-funds are designated by their class name, followed by their distribution characteristics and, if applicable, their specific hedging policy. This means that for example Shares issued in Class A which are distributing income and applying a hedging policy, as defined above, would be identified as ADH whereas Class I Shares accumulating income would be identified as IC.
b 4. Charges and Expenses
1. Explanation of the Charging Structure
Investment in the Company is currently offered via nine charging structures, as represented by the A, E, I, J, M, P, W, Y and Z Classes of Shares.
The Management Company is entitled, in respect of each Class of Shares, to a management fee to cover all investment management, investment advisory and distribution services provided in relation to the relevant class (see 2. “Management Fee” below).
In addition, the Company pays to the Management Company a fee to cover operating administrative and servicing expenses. To preserve Shareholders from fluctuations in a sub-fund’s operating, administrative and servicing expenses, the Company has agreed with the Management Company that the fee charged to cover such operating, administrative and servicing expenses is fixed at an annual rate. The excess of such expenses above such annual rate will be borne directly by the Management Company (see 4. “Operating, Administrative and Servicing Expenses” below).
2. Management Fee
The Company pays to the Management Company an annual management fee calculated as a percentage of the Net Asset Value of each sub-fund or Share Class (“Management Fee”). The Management Fee is accrued daily and payable monthly in arrears at the rates specified in the table page 72.
The maximum rate for Class E, I, J and M Shares is 3.5%.
The maximum rate for Class A, P, Y and Z Shares is as stated in the prospectus.
No Management Fee is currently charged for Class W Shares
The Management Fee covers management and distribution services provided in relation to the relevant sub-fund of the Company by the Management Company, the Investment Advisers and the Share Distributors. The Management Company is responsible for discharging, out of such fee, the fees of the Investment Advisers and the Share Distributors and may pay part of such fee to recognised intermediaries or such other person as the Management Company may determine, at its discretion. The Management Company may instruct the Company to pay a portion of the Management Fee directly out of the assets of the Company to any of such service providers.
3. Performance Fee
For sub-funds issuing Classes J Shares, L Shares and M Shares, the Management Company is also entitled to a Performance Fee, payable annually in arrears after the end of each twelve month period.
Each Dealing Day, the Performance Fee accrual will be calculated as 20% (10% in the case of Global Equity Freestyle) of the difference between the change in the Net Asset Value per share of the relevant Class of the sub- fund since the previous Dealing Day (net of all other fees and expenses and excluding the effect of subscriptions and redemptions) and the simple daily equivalent of the percentage defined below for the relevant sub-funds (hereafter the “Percentage“) provided that on such Dealing Day the Net Asset Value per Share of the relevant Class of the sub- fund is higher than the Low Tide Mark (as defined below). On the first issue of the relevant Class of Shares in a sub- fund, the Low Tide Mark will equal the initial offer price of the relevant Class of Shares of the sub-fund. The Low Tide Mark will not be set at a level below the initial offer price of the relevant Class of Shares of the sub-fund.
1
- A - HSBC Global Investment Funds .~ ~ -
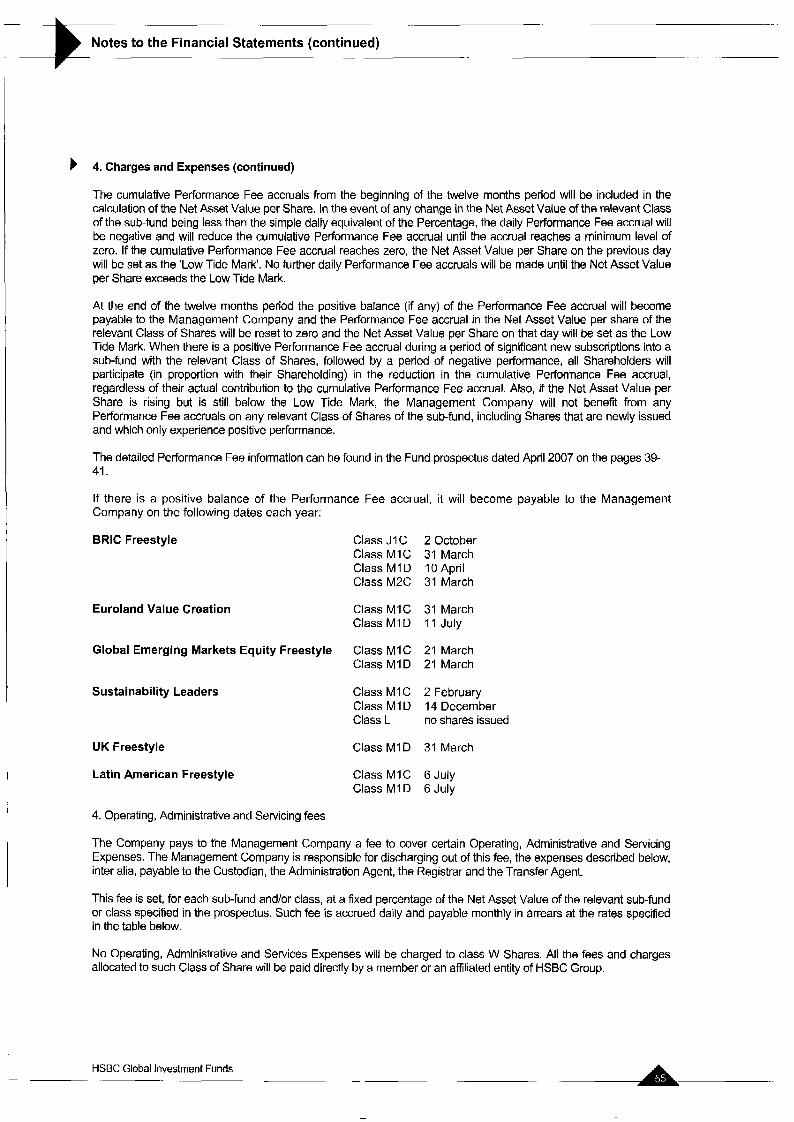
Notes to the Financial Statements (continued) ..-
b 4. Charges and Expenses (continued)
The cumulative Performance Fee accruals from the beginning of the twelve months period will be included in the calculation of the Net Asset Value per Share. In the event of any change in the Net Asset Value of the relevant Class of the sub-fund being less than the simple daily equivalent of the Percentage, the daily performance Fee accrual will be negative and will reduce the cumulative Performance Fee accrual until the accrual reaches a minimum level of zero. If the cumulative Performance Fee accrual reaches zero, the Net Asset Value per Share on the previous day will be set as the 'Low Tide Mark'. No further daily Performance Fee accruals will be made until the Net Asset Value per Share exceeds the Low Tide Mark.
At the end of the twelve months period the positive balance (if any) of the Performance Fee accrual will become payable to the Management Company and the Performance Fee accrual in the Net Asset Value per share of the relevant Class of Shares will be reset to zero and the Net Asset Value per Share on that day will be set as the Low Tide Mark. When there is a positive Performance Fee accrual during a period of significant new subscriptions into a sub-fund with the relevant Class of Shares, followed by a period of negative performance, all Shareholders will participate (in proportion with their Shareholding) in the reduction in the cumulative Performance Fee accrual, regardless of their actual contribution to the cumulative Performance Fee accrual. Also, if the Net Asset Value per Share is rising but is still below the Low Tide Mark, the Management Company will not benefit from any Performance Fee accruals on any relevant Class of Shares of the sub-fund, including Shares that are newly issued and which only experience positive performance,
The detailed Performance Fee information can be found in the Fund prospectus dated April 2007 on the pages 39- 41.
If there is a positive balance of the Performance Fee accrual, it will become payable to the Management Company on the following dates each year:
BRlC Freestyle
Euroland Value Creation
Class J IC 2 October Class M l C 31 March Class M I 0 I O April Class M2C 31 March
Class M I C 31 March Class MID I 1 July
Global Emerging Markets Equity Freestyle Class M I C 21 March Class M I D 21 March
Sustainability Leaders Class M I C 2 February Class M I D 14 December Class L no shares issued
UK Freestyle Class M I D 31 March
Latin American Freestyle Class M I C 6 July Class M I D 6 July
4. Operating, Administrative and Servicing fees
The Company pays to the Management Company a fee to cover certain Operating, Administrative and Servicing Expenses. The Management Company is responsible for discharging out of this fee, the expenses described below, inter alia, payable to the Custodian, the Administration Agent, the Registrar and the Transfer Agent.
This fee is set, for each sub-fund andlor class, at a fixed percentage of the Net Asset Value of the relevant sub-fund or class specified in the prospectus. Such fee is accrued daily and payable monthly in arrears at the rates specified in the table below.
No Operating, Administrative and Services Expenses will be charged to class W Shares. All the fees and charges allocated to such Class of Share will be paid directly by a member or an affiliated entity of HSBC Group.
HSBC Global Investment Funds -
-

Notes to the Financial Statements (continued) 3 b 4. Charges and Expenses (continued)
The maximum rate for class A, E, I, J, M, P, Y and 2 Shares is 1.0%. However, the Board of Directors reserves the right to amend the fixed level of the Operating, Administrative and Servicing Expenses applicable to each class of Share. In the event of an increase in such expenses, the concerned Shareholders will be given at least three months prior notice of such increase. During this three months notice, such Shareholders may request the redemption of their shares, free of charge.
Operating, Administrative and Servicing Expenses cover the ongoing custody fees and safekeeping charges payable to the Custodian and its correspondent banks, fees for fund accounting and administration services (including domiciliary services) payable to the Administrative Agent and transfer agency fees for registrar and transfer agency services payable to the Registrar and Transfer Agent.
Operating, Administrative and Servicing Expenses also cover expenses relating to the creation of new sub-funds; the costs of the Subsidiary (see below); the Luxembourg asset-based taxe d’abonnement, at the rate referred to under “Taxation” below; attendance fees and reasonable out-of-pocket expenses incurred by the Company’s Directors; legal, auditing fees and other expenses; ongoing registration and listing fees, including translation expenses; the costs and expenses of preparing, printing, and distributing the Company’s prospectus, financial reports, statements and other documents made available directly or through intermediaries to its shareholders.
b 5. Transaction expenses and extraordinary expenses
The transaction expenses linked to security dealing are written off against the realised profitlloss from the sale of investments.
Each sub-fund bears the costs and expenses of buying and selling portfolio securities and financial instruments, brokerage fees and commissions, interest or taxes payable, and other transaction related expenses. These transaction fees are accounted for on a cash basis and are paid when incurred or invoiced from the net assets of the sub-fund to which they are attributable. Transaction fees are allocated across each sub-fund’s Share Classes.
The Company bears any extraordinary expenses including, without limitation, litigation expenses and the full amount of any tax, levy, duty or similar charge and any unforeseen charges imposed on the Company or its assets.
b 6. Indian Equity
The Company wholly owns a subsidiary in Mauritius namely HSBC Global Investment Funds Mauritius Limited, 10, Frere Felix de Valois Street, Port Louis, Mauritius (“the Subsidiary”). The Subsidiary manages the Indian Equity sub- fund’s investments in India.
The Subsidiary is a company incorporated in Mauritius on 3 October 1995. The accounts of the Indian Equity sub- fund and the Subsidiary have been consolidated.
The Subsidiary has appointed Multi Consult Limited, 10 Frkre Felix de Valois Street, Port Louis, Mauritius, to provide administrative services to the Subsidiary in Mauritius, including maintenance of its accounts, books and records. The Subsidiary has appointed KPMG Mauritius of KPMG Centre, 30 St George Street, Port Louis, Mauritius, as auditors of the Subsidiary in Mauritius to perform the auditor’s duties required by Mauritius law.
b 7. Taxation
Belgium
The Belgian government has enacted a law which charges an annual net asset value tax on foreign investment funds registered with the Belgian Banking and Finance Commission. Until 1 January 2007, an annual tax of 0.07% has been charged on the net outstanding amounts of sub-funds placed in Belgium through Belgian financial intermediaries, or where that figure is not substantially documented, the tax authorities may calculate the tax on the total assets of those sub-funds.
-A HSBC Global investment Funds

.~
Notes to the Financial Statements (continued) .. .~ .
b 7. Taxation (continued)
The tax increased to 0.08% as at 1 January 2007.
The Company understands that the validity of this tax charge is being questioned on the basis that it is contrary to European law and further developments are awaited. To date as the amounts are small, the Management Company has paid this tax cost on behalf of the Company out of the Operating, Administration and Servicing Expenses it receives. However, should the cost become substantial or long term the Management Company may require the sub-funds concerned to bear that tax charge for future periods.
India
On the basis that it is a Mauritian tax resident, the Subsidiary will benefit from the tax advantages available to it under the India-Mauritius double taxation treaty, which became effective on 1 July 1983. The Subsidiary will file, through its Custodian, a declaration of Mauritian residency with the registrar of each Indian company in which it invests. Capital gains resulting from the purchase and sale by the Subsidiary of stocks on the Indian stock exchanges will be exempt from tax on the basis that the Subsidiary is able to benefit from the provisions of the India-Mauritius double taxation treaty.
Interest on certain notified securities and bonds and on deposits in foreign currency with scheduled banks is exempt from income tax. The sale and purchase of stocks and securities is exempt from Indian sales tax.
The above-stated tax treatment under the India-Mauritius tax treaty will be available provided that the Subsidiary does not have a permanent establishment or its effective management and control in India. No guarantee or warranty can be given or should be assumed that the tax benefits of the treaty will continue to be available to the Indian Equity sub-fund in future periods due to, among others, changes in the regulatory environment in Mauritius, India or the European Union.
The Indian Central Board of Direct Taxes has confirmed the availability of the treaty benefits to companies holding a certificate of Mauritian tax residence. The Supreme Court of India confirmed on 7 October 2003 the validity of this position.
Luxembourg
The Company is not liable to any Luxembourg tax on profits or income nor are dividends paid by the Company liable to any Luxembourg withholding tax. The Company is, however, liable in Luxembourg to a tax of 0.05% per annum of its Net Asset Value, such tax being payable quarterly on the basis of the value of the net assets of the Company at the end of the relevant calendar quarter. The tax rate is reduced to 0.01 % per annum for the U S Dollar Reserve and Euro Reserve sub-funds and Classes J Share, W Share and Z Share in the relevant sub-funds. No stamp duty or other tax is payable in Luxembourg on the issue of Shares.
The Class or sub-funds may be exempted of this 0.01% tax if they comply with the requirements of the Luxembourg law of 19 December 2003.
No Luxembourg tax is payable on the realised or unrealised capital appreciation of the assets of the Company.
The Company paid a tax of EUR 1,239.46 on its incorporation.
Mauritius
The Subsidiary is registered with the Mauritius Offshore Business Activities Authority as an offshore company. As a result it is subject to a reduced rate of Mauritian income tax on its income. In addition, no Mauritian capital gains tax will be payable in respect of the Subsidiary's investments in India and any dividends and redemption proceeds paid by the Subsidiary to the Indian Equity sub-fund will be exempt from Mauritian withholding tax. A certificate of Mauritian tax residence has been granted to the Subsidiary by the Commissioner of Income Tax in Mauritius. On the basis that it is Mauritian tax resident, the Subsidiary will qualify for certain reliefs from Indian tax as set out in the Indian tax section below. No guarantee or warranty can be given or should be assumed that the tax benefits of the treaty will continue to be available to the Indian Equity sub-fund in future periods due to, among others, changes in the regulatory environment in Mauritius, India or the European Union.
~
HSBC Global Investment Funds -- r - - - -

Notes to the Financial Statements (continued) -
b 7. Taxation (continued)
Turkey
A new tax system took effect from 1 January 2006 which charges a 10% withholding tax on dividends received by the Company and a 15% withholding tax on all other investment returns received by the Company from investments made in Turkey. The costs of this tax will be borne by shareholders in sub-funds investing in Turkey.
Thailand
Where possible Thai stocks of the Thai Equity sub-fund are held through custody arrangements in London which enables the Company to benefit from the United Kingdom-Thailand double tax treaty and therefore gains realised by the sub-fund are currently not liable to tax in Thailand. Although the Company will seek to maintain this favorable position, no guarantee or warranty can be given or should be assumed that the tax benefits of the treaty will continue to be available to the sub-fund in future periods. Should the sub-fund become subject to Thai tax on its gains this will have an adverse effect on investment returns and a possible impact on the Net Asset Value.
United Kingdom
It is the intention of the Board of Directors to conduct the affairs of the Company so that it does not become resident in the United Kingdom. On the basis that the Company is not resident in the United Kingdom for tax purposes it should not be subject to United Kingdom corporation tax on its income and capital gains.
The Company has received certification as a distributing fund under Schedule 27 of the Income and Corporation Taxes Act 1988.
General
Dividends and interest received by the Company on its investments are generally subject to non-recoverable withholding taxes in the countries of origin. Investors and potential investors should note the paragraph concerning Emerging Markets in the “Risk Factors” section of the Prospectus.
8. Public and bank holidays in Hong Kong
HSBC Investment Funds (Hong Kong) Limited has been appointed by the Company as its Representative and Share Distributor in Hong Kong. There will be no dealing for the Shares of the Company in Hong Kong on a day which is a public or bank holiday in Hong Kong.
9. Forward foreign exchange contracts
b
b
As at 31 March 2007, the Company had entered into various forward foreign currency contracts for the purpose of hedging the portfolio which oblige the Company to deliver currencies at specified future dates. Open contracts are as follows:
Contracts with a settlement date of 30 March 2007 still appear because they were open at the time of the preparation and publication of the net asset value of 30 March 2007.
Sub-funds Contract In exchange Settlement Contract to Date for deliver
Unrealised Gainl(loss) by
Sub-Fund
Asia Ex Japan Equity
2211 212006 2911 212006 03101 12007 0510112007 09/01 12007 1 1 IO 1 I2007 12/01 12007 12101 12007 1510112007
USD USD USD EUR EUR USD EUR USD USD
29,767,652 440,359 559,200 260,000 640,000
6,501 371,000 22,030
305,077
3010312007 3010312007 30103l2007 3010312007 3010312007 30103l2007 3010312007 3010312007 3010312007
EUR EUR EUR USD USD EUR USD EUR EUR
22,467,000 333,000 420,000 341,354 836,800
5,000 480,779
17,000 235,000
HSBC Global Investment Funds

-.
Notes to the Financial Statements (continued)
b 9. Forward foreign exchange contracts
Sub-funds
Asia Ex Japan Equity
BRlC Markets
Global Emerging Markets Elite Fund
Global Emerging Markets Equity
Global Equity
Global Equity SRI
Contract Date
16l01l2007 USD 22l01l2007 USD 2510112007 USD 2610112007 USD
29l0112007 EUR 01102l2007 USD 02102l2007 USD 0510212007 USD 0610212007 USD 0710212007 EUR 14l02l2007 EUR I610212007 USD 27/02/2007 EUR 27/02/2007 USD 28102/2007 EUR 05l03l2007 EUR 0610312007 EUR 0710312007 USD 09/03/2007 USD 13l03l2007 USD 14103l2007 USD 14l03l2007 EUR 15l03l2007 EUR 16/03/2007 USD 19/03/2007 USD 20l0312007 USD 21103l2007 USD 2310312007 USD 26/03/2007 EUR 2710312007 EUR 2710312007 USD 2810312007 USD 29/03/2007 USD 2910312007 EUR
2710312007 EUR
2610312007 USD 27/03/2007 USD
2610312007 USD 2710312007 EUR 27/03/2007 USD 2710312007 USD 2810312007 EUR 2910312007 USD
27/03/2007 USD 2710312007 JPY 2810312007 SGD
2710312007 GBP 28/03/2007 EUR 2910312007 USD 2910312007 GBP
HSBC Global investment Funds
In exchange for Settlement
492,548 30103l2007 EUR 6,506 3010312007 EUR
549,613 30l03l2007 EUR 20,704 3010312007 EUR
587,000 22,192
6,524 720,889 22,047 6,000
443,000 531,300
14,403,000 51,589
107,000 1,257,000
333,000 183,876 274,898 113,271 10,561
371,000 245,000
7,992 101,194
11,967 115,784 215,898 103,000
6,993,000 9,365,026 3,867,889
8,024 126,000
3010312007 30103l2007 3010312007 30l03l2007 3010312007 3010312007 3010312007 30l0312007 30103l2007 3010312007 30l03l2007 30103l2007 30l03l2007 3010312007 30103l2007 30l0312007 3010312007 30103l2007 30l0312007 3010312007 3010312007 30l03l2007 30l0312007 30/03/2007 3010312007 3010312007 2910612007 2910612007 2910612007 2910612007
USD EUR EUR EUR EUR USD USD EUR USD EUR USD USD USD EUR EUR EUR EUR USD USD EUR EUR EUR EUR EUR USD USD EUR EUR EUR USD
9,999,999 30l0312007 USD
134,984 30/03/2007 ZAR 11,293 02l04l2007 ZAR
2,612,575 30103l2007 ZAR 26,035 3010312007 USD 19,498 30l03l2007 SGD
2 16,066 02/04/2007 ZAR 101,841 02l0412007 USD
816 03/04/2007 EUR
64,667 3010312007 SGD 214,194,479 02/04/2007 USD
153.200 0210412007 USD
1,785 30103l2007 USD 106,863 02/04/2007 USD
966 0310412007 EUR 1,374 03l04l2007 USD
Contract to deliver
379,000 5,000
422,000 16,000
759,825 17,000 5,000
555,000 17,000 7,799
581,127 404,000
19,052,288 39,000
141,422 1,653,081
437,795 140,000 209,000 86,000 8,000
489,757 323,731
6,000 76,000
9,000 87,000
162,000 136,599
9,331,460 6,993,000 2,890,000
6,000 168,512
13,340,998
974,250 81,646
18,856,258 34,734 29,578
1,562,158 135,998
61 2
98,100 1,813,670
100,909
3,507 142,705
725 2,697
... .-
-
Unrealised Gainl(loss) by
Sub-Fund
USD 5,743
USD 6,000
USD (941)
USD ( I 8,003)
USD (4,575)
USD 188

b 9. Forward foreign exchange contracts (continued)
~
Notes to the Financial Statements (continued) -
I
Su b-funds Contract Date
In exchange Settlement for
Global Ex Euroland Equity 01/0312007 USD 2,590,000 01/06/2007 CAD
Pan-European Equity
UK Equity
US Equity
Asia Freestyle
2710312007 EUR 2810312007 EUR 29/03/2007 EUR
2710312007 GBP 2810312007 GBP 29/03/2007 GBP
09/03/2007 USD 13/03/2007 USD 2210312007 USD
22/12/2006 USD 0310112007 USD 0910112007 EUR 1010112007 EUR 11/01/2007 EUR 16/0112007 USD 17/01/2007 USD 19/01/2007 EUR 22101/2007 USD 2310112007 USD 25/0112007 USD 29101/2007 EUR 31/0112007 USD 01/02/2007 EUR 02/02/2007 USD 05/02/2007 USD 06102/2007 USD 08/02/2007 USD 09/02/2007 USD 14/0212007 EUR 15/02/2007 USD 16102/2007 USD 28/02/2007 EUR 0510312007 EUR 06/03/2007 EUR 0710312007 USD 09/03/2007 USD 1310312007 USD 15/0312007 EUR 19/03/2007 USD 2010312007 USD 22/03/2007 USD 23/03/2007 USD 27/03/2007 EUR 27lO312007 USD
12,367 30/03/2007 SGD 27,900 0210412007 SGD 40,030 03/0412007 SGD
16,211 3010312007 EUR 6,482 02104/2007 EUR 7,245 03/04/2007 EUR
28,932,508 11/06/2007 EUR 17,214 11/06/2007 EUR
804,000 11/0612007 EUR
18,131,941 528,577 382,000 255,000
9,000 370,386
7,779 1 1,000
188,662 9,107
217,501 361,000
15,565 6,000
233,550 301,345
1,888,286 53,353
228,043 415,000 235,698 444,504 203,000 550,000 685,000 281,068 466,932 297,665 335,000 209,046 219,393 20,049
574,393 15,655,000 20,965,176
3010312007 30/0312007 30/0312007 3010312007 30/03/2007 3010312007 3010312007 3010312007 30103/2007 3010312007 3010312007 3010312007 3010312007 3010312007 30/03/2007 30/03/2007 30/03/2007 30/03/2007 3010312007 30/0312007 30103/2007 30/03/2007 3010312007 3010312007 3010312007 3010312007 3010312007 3010312007 30103/2007 3010312007 3010312007 30/0312007 3010312007 3010312007 2910612007
EUR EUR USD USD USD EUR EUR USD EUR EUR EUR USD EUR USD EUR EUR EUR EUR EUR USD EUR EUR USD USD USD EUR EUR EUR USD EUR EUR EUR EUR USD EUR
Contract to deliver
3,033,149
25,000 56,567 81,000
23,875 9,543
10,668
21,973,000 13,000
600,000
13,685,000 397,000 499,465 332,158
11,701 285,000
6,000 14,314
145,000 7,000
167,000 467,285
12,000 7,832
179,000 232,000
1,456,000 41,000
175,000 544,397 179,000 338,000 268,305 723,305 900,569 214,000 355,000 226,000 442,652 157,000 165,000 15,000
431,000 20,890,032 15,655,000
Unrealised Gainl(loss) by
Sub-Fund
EUR 31,298
EUR 89
GBP 19
USD 449,203
USD 163,004
~
HSBC Global Investment Funds ~. - -

-
Notes to the Financial Statements (continued) -4 b 9. Forward foreign exchange contracts (continued)
Sub-funds
BRlC Freestyle
Global Emerging Markets Equity Freestyle
Latin American Freestyle
Global Emerging Markets Bond
Global Investment Grade Bond
US Dollar Investment Grade Bond
Contract Date
27/03/2007 EUR 27/03/2007 SGD
29/03/2007 USD 29/03/2007 SGD
2a10312007 USD
26/03/2007 USD 27/03/2007 SGD 27/03/2007 USD 27/03/2007 USD 28/03/2007 USD 2910312007 USD 29/03/2007 HUF 29/03/2007 PLN 29/03/2007 USD 29/03/2007 ZAR
27/03/2007 EUR 28/03/2007 EUR 29/03/2007 EUR
26/02/2007 EUR 29/03/2007 SGD
14/02/2007 USD 14/02/2007 EUR 07/03/2007 GBP 08/03/2007 GBP 09/03/2007 EUR 13/03/2007 USD 14/03/2007 EUR 16/03/2007 EUR 16/03/2007 USD 20/03/2007 USD 22/03/2007 USD 27/03/2007 EUR 27/03/2007 GBP 28/03/2007 GBP 09/03/2007 USD
27/03/2007 EUR
In exchange for Settlement
18,403 3010312007 USD 136,115 30/03/2007 USD 424,916 03/04/2007 HKD 375,035 03/04/2007 EUR 332,237 03/04/2007 USD
7,939,986 19,524 57,708
664,837 83,946 26,828
72,206,066 I, 103,982
48,831 16,120,466
30/03/2007 3010312007 30/03/2007 02/04/2007 02/04/2007 03/04/2007 03/04/2007 03/04/2007 03/04/2007 04/05/2007
ZAR USD EUR ZAR SGD EUR USD USD SGD USD
1 1,198 30103/2007 USD 46,290 02/04/2007 USD 13,323 03/04/2007 USD
269,010 30/03/2007 USD 19,893 03/04/2007 USD
728,563 414,000
3,024,000 610,000 141,000
3,455,061 859,000
1,004,000
1,668,886 2,081,426
470,000 60,000 60,000
5,265,380
384,387
15/05/2007 15/05/2007 12/06/2007 12/06/2007 15/05/2007 15/06/2007 15/05/2007 15/05/2007 15/05/2007 12/06/2007 15/05/2007 15/05/2007 12/06/2007 12/06/2007 18/06/2007
EUR USD USD USD USD JPY USD USD EUR GBP EUR USD USD USD EUR
8,713 30/03/2007 USD
Contract to deliver
24,552 89,727
3,320,085
218,836 281,178
57,306,848 12,870 43,256
4,806,773 127,446 20,114
387,788
74,135 2,207,736
380,395
14,939 61,815 17,770
354,663 13,103
555,000 543,677
5,829,743 1,178,569
185,357 400,000,000
1 , I 39,214 1,339,888
290,000 854,000
1,551,000 628,397 119,120 117,920
4,000,000
1 1,625
Unrealised Gain/( loss) by
Sub-Fund
USD (345)
USD (59,666)
USD sa
USD (4,079)
USD (69,734)
USD 5
HSBC Global Investment Funds ~. ~.

I O . Futures
As at 31 March 2007, the Company had entered into the following outstanding futures contracts:
ERIC Markets Equity HSCEI - HKD China Ent
Euroland Value Creation Dow Jones Euro Stoxx 50
Global Ex Euroland Equity S&P 500 Indices Topix Index SP ASX 200 Finance Index
Japanese Equity Topix Index (Tokyo)
Pan-European Equity High Dividend Daw Jones Euro Stoxx 50
Number of
contracts
208
121
2 26 5
31 0
9
Currency Commitments Maturity Unrealised gain (loss) Date in sub-fund currency
HKD 99,840,000 27/04/2007 185,477 USD 185,477
EUR 4,956,160 15/06/2007 700 EUR 700
USD 715,450 14/06/2007 JPY 446,290,000 07/06/2007
8,830 53,767
AUD 754,250 21/06/2007 15,366 EUR 77,963
JPY 5,321 , I 50,000 07/06/2007 116,200,000 JPY 116,200,000
EUR 368,640 15/06/2007 5,850 EUR 5,850
HSBC Global Investment Funds ~.

..
Notes to the Financial Statements (continued)
b 10. Futures (continued)
US Equity S&P 500 Indices
Euro Corporate Bond Euro Bund
Euro Credit Bond Euro Bund Euro Schatz Euro BOBL
Euro investment Grade Bond Euro Bund Euro Schatz Euro BOBL
Global Investment Grade Bond Euro Bund Euribor 3 Months Long Gilt Sterling Future 3 Months Euro Yen Future Japanese Gov. Bds Future 10 Y I O Y Treasury Notes USA 2 Y Treasury Notes USA 5 Y Treasury Notes USA Treasury Bonds USA
Pan-European Government Bond Euro Bund Euro Schatz Euro BOBL Long Gilt Sterling Futures
Currency
USD
EUR
EUR EUR EUR
EUR EUR EUR
EUR EUR GBP J PY J PY USD USD USD USD
EUR EUR EUR GBP
. ...
Commitments Maturity Unrealised gain (loss) Date in sub-fund currency
14,315,000 14/06/2007 121,000 USD 121,000
(4,604,800) 07/06/2007 24,560 EUR 24,560
(345,360) 07/06/2007 430
(974,700) 07/06/2007 3,810 EUR (4,860)
3,616,900 07/06/2007 (9,100)
(1,611,680) 07/06/2007 14,420 4,546,960 07/06/2007 (1 I ,440)
(6,173,100) 07/06/2007 37,050 EUR 40.030
1,610,840 959,000 863,520
99,305,000 (268,360,000)
(2,056,750) 10,451,813 5,081,250
07/06/2007 (23,523) 18/06/2007 (533) 27/06/2007 (4,239) 15/06/2007 0 11/06/2007 849 20/06/2007 2,969 29/06/2007 11,266 29/06/2007 40,500
(1,115,625) 20/06/2007 (3,048) USD 24,241
(1,726,800) 07/06/2007 4,210
(324,900) 07/06/2007 1,390 863,040 27/06/2007 (1 9,574)
EUR (14,454)
310,020 07/06/2007 (480)
b 11. Dividends
At the Annual General Meeting held at the Company’s Registered Office, the following dividends were declared, out of the profits for the year ended 31 March 2006, for the classes of shares listed below.
Name Currency Dividend Ex-date Payment Number Total amount per share date of shares paid
Asia Pacific ex Japan Equity High Dividend A D USD 0.029243 31/03/2006 18/04/2006 13,533,871 395,771 Asia Pacific ex Japan
Euro Corporate Bond A D EUR 0.261782 31/03/2006 18/04/2006 4,818,335 1,261,353 Euro Credit Bond A D EUR 0.977134 31/03/2006 18/04/2006 14,329 14,001 Euro Credit Bond 2 D EUR 0.458083 31/03/2006 18/04/2006 94,245 43,172
Equity High Dividend I D USD 0.057609 31/03/2006 18/04/2006 1,274,002 73,394
HSBC Global Investment Funds ~ -. ~. ~~~
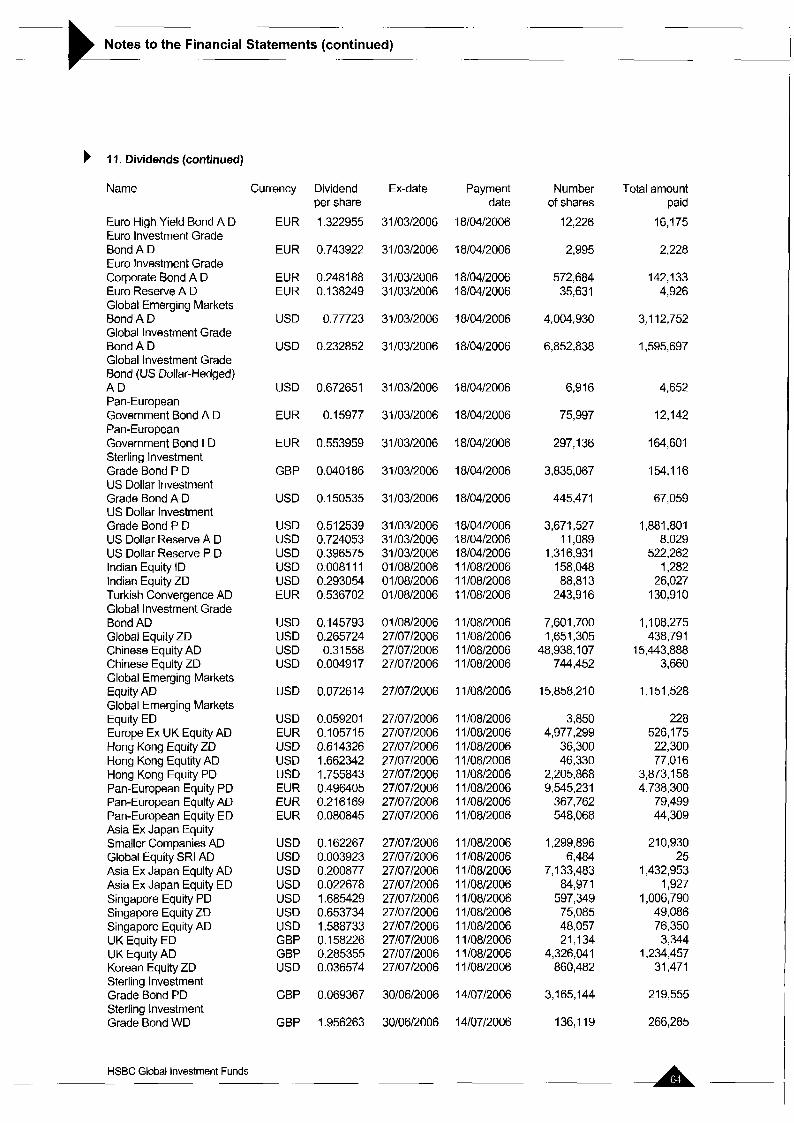
Notes to the Financial Statements (continued)
b 1 I . Dividends (continued)
Name
Euro High Yield Bond A D Euro Investment Grade Bond A D Euro Investment Grade Corporate Bond A D Euro Reserve A D Global Emerging Markets Bond A D Global Investment Grade Bond A D Global Investment Grade Bond (US Dollar-Hedged) A D Pan-European Government Bond A D Pan-European Government Bond I D Sterling Investment Grade Bond P D US Dollar Investment Grade Bond A D US Dollar Investment Grade Bond P D US Dollar Reserve A D US Dollar Reserve P D Indian Equity ID Indian Equity ZD Turkish Convergence AD Global Investment Grade Bond AD Global Equity ZD Chinese Equity AD Chinese Equity ZD Global Emerging Markets Equity AD Global Emerging Markets Equity ED Europe Ex UK Equity AD Hong Kong Equity ZD Hong Kong Equtity AD Hong Kong Equity PD Pan-European Equity PD Pan-European Equity AD Pan-European Equity ED Asia Ex Japan Equity Smaller Companies AD Global Equity SRI AD Asia Ex Japan Equity AD Asia Ex Japan Equity ED Singapore Equity PD Singapore Equity ZD Singapore Equity AD UK Equity ED UK Equity AD Korean Equity ZD Sterling Investment Grade Bond PD Sterling Investment Grade Bond WD
Currency Dividend Ex-date Payment per share date
EUR 1.322955 31/03/2006 18/04/2006
EUR 0.743922 31/03/2006 18/04/2006
EUR 0.248188 31/03/2006 18/04/2006 EUR 0.138249 31/03/2006 18/04/2006
USD 0.77723 31/03/2006 18/04/2006
USD 0.232852 31/03/2006 18/04/2006
USD 0.672651 31/03/2006 18/04/2006
EUR 0.15977 31/03/2006 18/04/2006
EUR 0.553959 31/03/2006 18/04/2006
GBP 0.040186 31/03/2006 18/04/2006
USD 0.1 50535 31/03/2006 18/04/2006
USD 0.512539 31/03/2006 18/04/2006 USD 0.724053 31/03/2006 18/04/2006 USD 0.396575 31/0312006 18/04/2006 USD 0.0081 I1 01/08/2006 11/08/2006 USD 0.293054 01/08/2006 11/0812006 EUR 0.536702 01/08/2006 1110812006
USD 0.145793 01/08/2006 11/08/2006 USD 0.265724 2710712006 1110812006 USD 0.31 558 27/07/2006 11/08/2006 USD 0.004917 27/07/2006 11/08/2006
USD 0.072614 27/07/2006 11l08/2006
USD EUR USD USD USD EUR EUR EUR
USD USD USD USD USD USD USD GBP GBP USD
0.059201 0.105715 0.614326 1.662342 1.755843 0.496405 0.21 61 69 0.080845
0.162267 0.003923 0.200877 0.022678 1.685429 0.653734 1.588733 0.158226 0.285355 0.036574
27/07/2006 27/07/2006 27/07/2006 27/07/2006 27/07/2006 27/07/2006 2710712006 27/07/2006
27/07/2006 27/07/2006 27/07/2006 27/07/2006 27/07/2006 27/07/2006 27/07/2006 27/07/2006 27/07/2006 27107/2006
1 1/08/2006 I 110812006 1 I /08/2006 1 1/08/2006 1 1/08/2006 1 1/08/2006 1 1 IO812006 I 1/08/2006
1 1/08/2006 11/08/2006 1 1/08/2006 1 1/08/2006 I 110812006 I 1/08/2006 1110812006 I 1/08/2006 1 1/08/2006 I 1/08/2006
GBP 0.069367 30/06/2006 14/07/2006
GBP 1.956263 3010612006 14107/2006
HSBC Global Investment Funds -.
Number of shares
12,226
2,995
572,684 35,631
4,004,930
6,852,838
6,916
75,997
297,136
3,835,067
445,471
3,671,527 11,089
1,316,931 158,048 88,813 243,916
7,601,700 1,651,305 48,938,107 744,452
15,858,210
3,850 4,977,299 36,300 46,330
2,205,868 9,545,231 367,762 548,068
1,299,896 6,484
7,133,483 84,971 597,349 75,085 48,057 21,134
4,326,041 860,482
3,165,144
136,119
~
Total amount paid
16,175
2,228
142,133 4,926
3,112,752
1,595,697
4,652
12,142
164,601
154,116
67,059
1,881,801 8,029
522,262 1,282 26,027 130,910
1,108,275 438,791
15,443,888 3,660
1,151,528
228 526,175 22,300 77,016
3,873,158 4,738,300 79,499 44,309
210,930 25
1,432,953 1,927
1,006,790 49,086 76,350 3,344
1,234,457 31,471
21 9,555
266,285
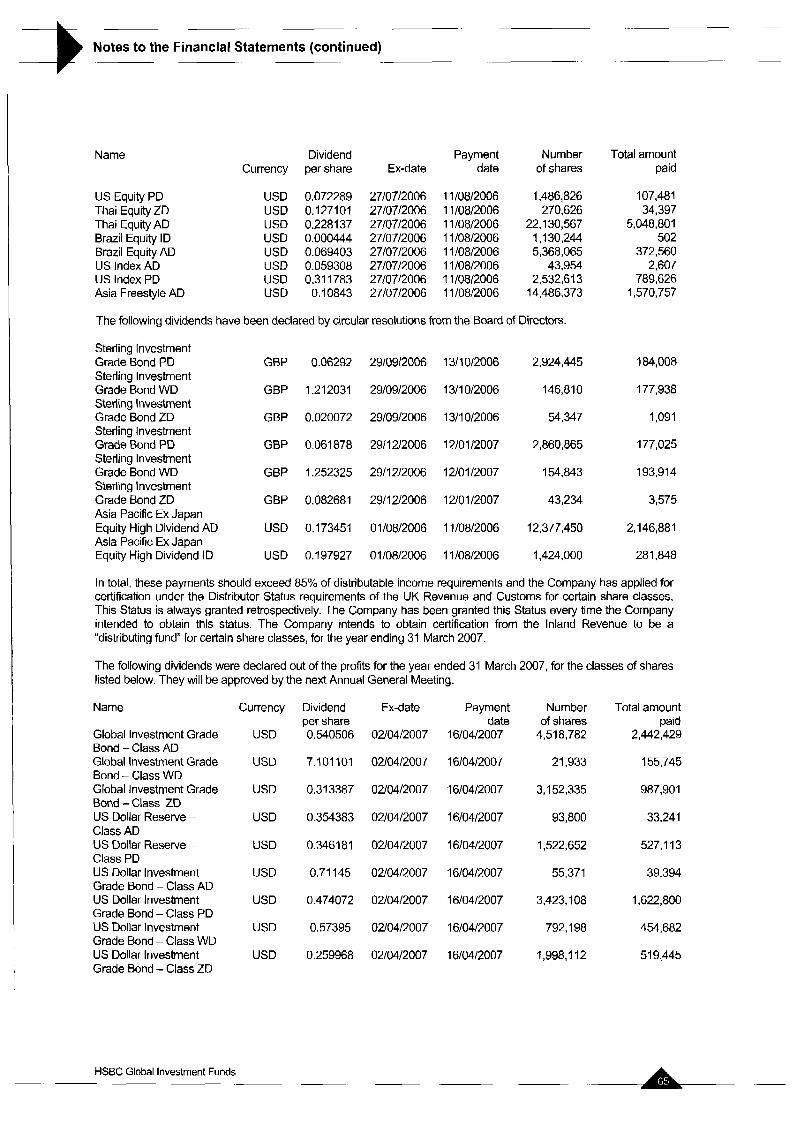
- -.- -
Notes to the Financial Statements (continued) ~
Name
US Equity PD Thai Equity ZD Thai Equity AD Brazil Equity ID Brazil Equity AD US Index AD U S Index PD Asia Freestyle AD
Dividend Payment Number Currency per share Ex-date date of shares
USD USD USD USD USD USD USD USD
0.072289 0.1271 01 0.228137 0.000444 0.069403 0.059308 0.31 1783
0.10843
2710712006 2710712006 27/07/2006 27/07/2006 2710712006 27/07/2006 27/07/2006 27/07/2006
1 110812006 11/08/2006 11/08/2006 11/08/2006 11/08/2006 11/08/2006 I 110812006 1 1/08/2006
1,486,826 270,626
22,130,567 1,130,244 5,368,065
43,954 2,532,613
14,486,373
The following dividends have been declared by circular resolutions from the Board of Directors.
Sterling Investment Grade Bond PD Sterling Investment Grade Bond WD Sterling Investment Grade Bond ZD Sterling Investment Grade Bond PI3 Sterling Investment Grade Bond WD Sterling Investment Grade Bond ZD Asia Pacific Ex Japan Equity High Dividend AD Asia Pacific Ex Japan Equity High Dividend ID
GBP
GBP
GBP
GBP
GBP
GBP
USD
USD
0.06292
1.212031
0.020072
0.061 878
1.252325
0.082681
0.1 73451
0.197927
2910912006
29/09/2006
2910912006
2911212006
2911 212006
2911 212006
0 1 IO812006
01/08/2006
1311 012006
1311 012006
1311 012006
12101 12007
12/01/2007
12/01 12007
11/08/2006
11/08/2006
2,924,445
146,810
54,347
2,860,865
154,843
43,234
12,377,450
1,424,000
Total amount paid
107,481 34,397
5,048,801 502
372,560 2,607
789,626 1,570,757
184,008
177,938
1,091
177,025
193,914
3,575
2,146,881
281,848
In total, these payments should exceed 85% of distributable income requirements and the Company has applied for certification under the Distributor Status requirements of the UK Revenue and Customs for certain share classes. This Status is always granted retrospectively. The Company has been granted this Status every time the Company intended to obtain this status. The Company intends to obtain certification from the Inland Revenue to be a “distributing fund” for certain share classes, for the year ending 31 March 2007.
The following dividends were declared out of the profits for the year ended 31 March 2007, for the classes of shares listed below. They will be approved by the next Annual General Meeting.
Name Currency Dividend Exdate Payment Number Total amount per share date of shares paid
Global Investment Grade USD 0.540506 02/04/2007 16/04/2007 4,518,782 2,442,429 Bond - Class AD Global Investment Grade USD 7.101 101 02/04/2007 1610412007 21,933 155,745 Bond - Class WD Global Investment Grade USD 0.31 3387 02/04/2007 16/04/2007 3,152,335 987,901 Bond - Class ZD US Dollar Reserve - USD 0.354383 02/04/2007 16/04/2007 93,800 33,241 Class AD US Dollar Reserve - USD 0.3461 81 0210412007 16l04l2007 1.522,652 527,113 . . Class PD US Dollar Investment USD 0.71 145 02/04/2007 16/04/2007 55, Grade Bond - Class AD US Dollar Investment USD 0.474072 02/04/2007 16/04/2007 3,423, Grade Bond - Class PD US Dollar Investment USD 0.57395 02/04/2007 16/04/2007 792, Grade Bond - Class WD US Dollar Investment USD 0.259968 02/04/2007 16/04/2007 1,998, Grade Bond - Class ZD
71
08
98
12
39,394
,622,800
454,682
51 9,445
A- HSBC Global Investment Funds ~~~ ~~

- Notes to the Financial Statements (continued)
Name
Global Emerging Markets Bond - Class AD Euro Investment Grade Bond - Class AD Euro Credit Bond - Class AD Euro Credit Bond - Class ZD Euro High Yield Bond - Class AD Pan-European Government Bond - Class AD Pan-European Government Bond - Class ID Euro Reserve - Class AD Brazil Bond - Class AD Sterling Investment Grade Bond - Class PD Sterling Investment Grade Bond - Class WD Euro Corporate Bond - Class AD Asia Pacific Ex Japan Equity High Dividend - Class AD Asia Pacific Ex Japan Equity High Dividend - Class ID Asia Pacific Ex Japan Equity High Dividend - Class ZD US Dollar High Yield Bond - Class AD
Currency
USD
EUR
EUR
EUR
EUR
EUR
EUR
EUR USD GBP
GBP
EUR
USD
USD
USD
USD
Dividend per share 0.750821
0.338822
0.364685
0.635605
0.355756
0.371681
Ex-date Payment date
02/04/2007 16/04/2007
02/04/2007 16/04/2007
02/04/2007 16/04/2007
02/04/2007 16/04/2007
02/04/2007 16/04/2007
02/04/2007 16/04/2007
1 ,132748 02/04/2007 16/04/2007
0.271455 02/04/2007 16/04/2007 0.576546 02/04/2007 16/04/2007 0.065409 02/04/2007 16/04/2007
1.461 893 02/04/2007 16/04/2007
0.344748 02/04/2007 16/04/2007
0.245153 02/04/2007 16/04/2007
0.298695 02/04/2007 16/04/2007
0.16089 02/04/2007 16/04/2007
0.1 1 3482 02/04/2007 16/04/2007
Number of shares
4,787,808
10,308
25,808
126,471
49,724
88,917
93,076
90,352 22,839
2,612,486
123,764
5,421,199
7,333,595
2,800,000
226,591
4,918
Total amount paid
3,594,786
3,493
9,412
80,386
17,690
33,049
105,432
24,526 13,167
170,880
180,930
1,868,947
1,797,853
836,346
36,456
558
b 12. Information concerning the Swiss Investors. Publication of TER (Total Expenses Ratio) and Portfolio Turnover Ratio (PTR)
Please refer to table page 83.
b 13. Equalisation received/(paid)
Equalisation is calculated for Bond and Reserve sub-funds only and is included in the profitl(loss) on investment.
Name
Brazil Bond Euro Corporate Bond Euro Credit Bond Euro Investment Grade Bond Euro High Yield Bond Global Emerging Markets Bond Global Investment Grade Bond Pan-European Government Bond Sterling Investment Grade Bond US Dollar High Yield Bond US Dollar Investment Grade Bond Euro Reserve US Dollar Reserve Turkish Convergence
Currency
USD EUR EUR EUR EUR USD USD EUR GBP USD USD EUR USD EUR
Total amount Received/(paid)
29,148 199,517
(310,263) (52,328)
(366,172) 572,779
(533,072) 270,773
(304,113) 4,893
13,601 2,517
(41,118) (467,265)
HSBC Global Investment Funds ~. ~. ~. A

~
Notes to the Financial Statements (continued) ~
Equalisation received reflects the amounts received by the sub-fund in respect of undistributed income on the shares issued during the accounting period. Equalisation paid reflects the amounts paid by the sub-fund in respect of undistributed income on shares purchased during the period.
b 14.Swaps
Euro Reserve
As at 31 March 2007, the Company entered into the following Eonia floating rate swaps:
Eligible securities HSBC France 3.76% 1012007 Societe Generale 3.69% 0412007 Societe Generale 3.68% 0412007 Bred 3.70% 0412007 Societe Generale 3.80% 0412007
Currency Net notional amount Unrealised gain (loss) in EUR EUR 1,004,269 (511) EUR 990,785 (136) EUR 990,988 (97) EUR 596,406 (32) EUR 996,924 (23)
(799)
BRlC Markets Equity
As at 31 March 2007, the Company entered into the following index swaps:
Eligible securities
MSCl DTR Net emerg. Mkt Russia 5.32% 0311 012007 MSCl DTR Net emerg. Mkt Russia 5.32% 0311 012007 MSCl DTR Net emerg. Mkt Russia 5.32% 0311 012007 MSCl DTR Net emerg. Mkt Russia 5.32% 0311 012007 MSCl DTR Net emerg. Mkt Russia 5.32% 0311 012007 MSCl DTR Net emerg. Mkt Russia 5.32% 0311 012007 MSCl DTR Net emerg. Mkt Russia 5.32% 0311 012007 MSCl DTR Net emerg. Mkt Russia 5.32% 0311 012007 MSCl DTR Net emerg. Mkt Russia 5.32% 0311 012007 MSCl DTR Net emerg. Mkt Russia 5.32% 0311 012007 MSCl DTR Net emerg. Mkt Russia 5.32% 0311 012007
Currency
USD
USD
USD
USD
USD
USD
USD
USD
USD
USD
USD
Net notional amount
9,993,663
4,276,764
3,756,570
3,618,666
2,182,023
3,508,692
1,658,337
5,481,241
8,859,oi I
5,620,890
2,147,110
Unrealised gain (loss) in USD
913,613
390,979
343,423
330,816
199,479
320,762
151,604
501,091
809,884
306,012
39,968
4,307,631
b 15. Securities lending
HSBC Global Investment Funds has entered an exclusive stock lending agreement with HSBC Bank plc. As at 31 March 2007, the value of securities lent is as follows:
Euroland Equity Euroland Value Creation Europe Ex UK Equity Global Emerging Markets Equity Global Equity Pan-European Equity Pan-European Equity High Dividend UK Equity US Equity US Index
194,939,181 EUR 33,563,122 EUR 44,479,153 USD 13,600,000 USD 13,834,929 USD 236,543,066 EUR 7,141,835 EUR 15,088,432 GBP 14,995,417 USD 541,453 USD
A - HSBC Global Investment Funds ~ ~ ~

Notes to the Financial Statements (continued)
-
~-
b 16. Transactions with connected persons and soft commissions
The following is a summary of transactions with connected persons for the period. All such transactions were entered into in the ordinary course of business and on normal commercial terms.
All the figures are expressed in USD
HSBC Bank plc ASIA EX JAPAN EQUITY Total Aggregate value of transactions for the period Percentage of such transactions in value for the period Total Brokerage commission paid Average rate of commission
ASIA EX JAPAN EQUITY SMALLER COMPANIES Total Aggregate value of transactions for the period Percentage of such transactions in value for the period Total Brokerage commission paid Average rate of commission
ASIA FREESTYLE Total Aggregate value of transactions for the period Percentage of such transactions in value for the period Total Brokerage commission paid Average rate of commission
ASIA PACIFIC EX JAPAN EQUITY HIGH DIVIDEND Total Aggregate value of transactions for the period Percentage of such transactions in value for the period Total Brokerage commission paid Average rate of commission
BRlC FREESTYLE Total Aggregate value of transactions for the period Percentage of such transactions in value for the period Total Brokerage commission paid Average rate of commission
CHINESE EQUITY Total Aggregate value of transactions for the period Percentage of such transactions in value for the period Total Brokerage commission paid Average rate of commission
56,548,412 6.26%
153,471 0.27%
1,564,661
3,229 0.21 Yo
2.75%
15,100,179 2.02% 37,355 0.25%
3,569,153 2.08% 7,365
0.21%
133,411,330 4.20%
255,788 0.19%
254,637,416 5.63%
509,275 0.20%
I HSBC Global Investment Funds ~. - . .

- -
Notes to the Financial Statements (continued) -
b 16. Transactions with connected persons and soft commissions (continued)
HONG KONG EQUITY Total Aggregate value of transactions for the period Percentage of such transactions in value for the period Total Brokerage commission paid Average rate of commission
INDIAN EQUITY Total Aggregate value of transactions for the period Percentage of such transactions in value for the period Total Brokerage commission paid Average rate of commission
KOREAN EQUITY Total Aggregate value of transactions for the period Percentage of such transactions in value for the period Total Brokerage commission paid Average rate of commission
10,983,886 3.45% 21,968 0.20%
296,158,995 3.58%
508,179 0.17%
9,488,856
28,467 2.38%
0.30%
The Investment Advisers and their connected persons have entered into soft commission arrangements with brokers for the Asia ex Japan Equity, Asia ex Japan Equity Smaller Companies, Asia Freestyle, Asia Pacific ex Japan Equity High Dividend, BRlC Freestyle, Chinese Equity, Thai Equity, Hong Kong Equity, Korean Equity sub- funds under which certain goods and services used to support investment decision making are received by it or its connected persons. It or its connected persons do not make direct payment for these services but transact an agreed amount of business with the brokers on behalf of the Fund. Commission is paid from the Fund on these transactions.
The goods and services utilised for the Fund include the following:
* research and advisory services, * economic and political analysis, * portfolio analysis, including valuation and performance measurement,
market analysis, data and quotation services, * computer hardware and software incidental to the above goods and services, * clearing and custodian services and investment related publications.
A - HSBC Global Investment Funds r - -

~
Notes to the Financial Statements (continued)
b 17. Subsequent events
On 16 April 2007 the name of the following sub-funds changed:
Euro Credit Bond in Euro Core Credit Bond Euro Corporate Bond in Euro Strategic Credit Bond Euro Investment Grade Bond in Euro Core Bond Pan-European Government Bond in European Government Bond
On 21 May 2007, the name of the following sub-funds changed:
Global Investment Grade Bond in Gobal Core Plus Bond US Dollar Investment Grade Bond in US Dollar Core Plus Bond
On 21 May 2007, the following Investment Advisers have been added as Advisers to the sub-funds listed:
HSBC Investments (Singapore) Limited: Indian Equity, Singapore Equity, Thai Equity Sinopia Asset Management (UK) Limited: BRlC Markets, Global Equity SRI, US Index
On 20 April 2007, the sub-fund Sterling Investment Grade Bond merged into the sub-fund Global Investment Grade Bond.
On 25 May 2007, the sub-fund Global Equity Technology has been liquidated.
! A -- - HSBC Global Investment Funds
. - .~ .~ ~
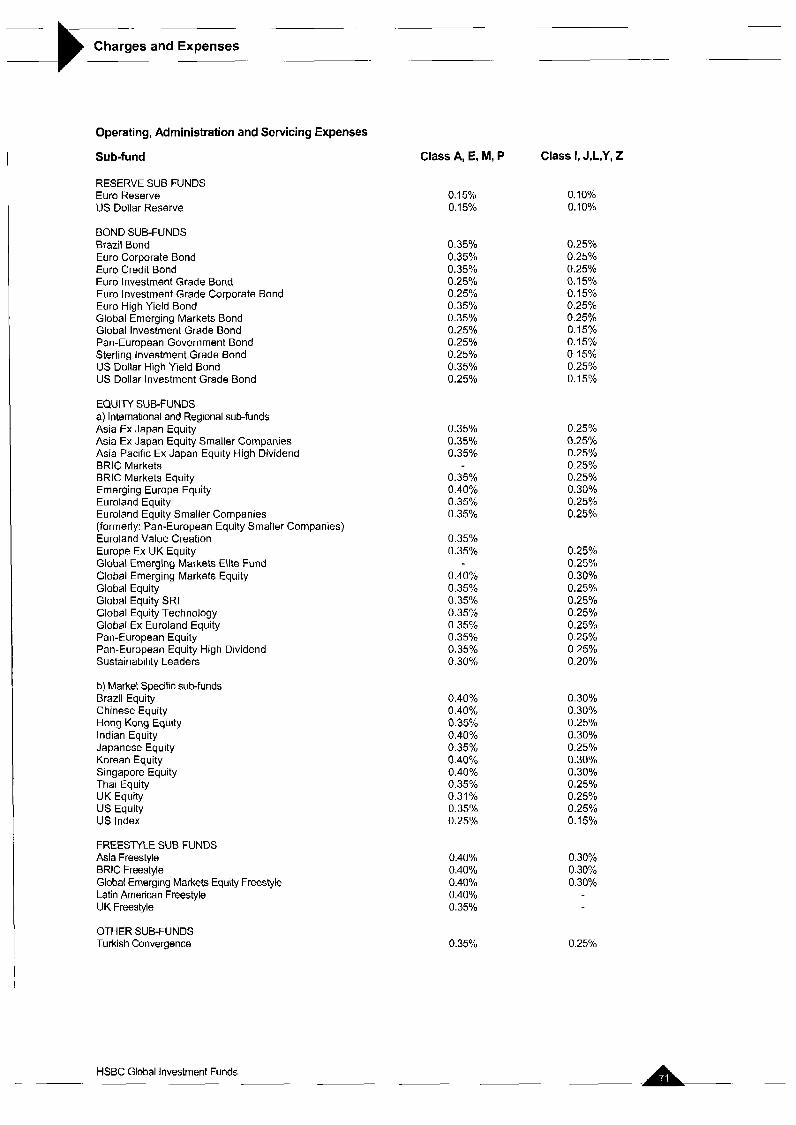
. .
Charges and Expenses _ _ __
Operating, Administration and Servicing Expenses
Sub-fund
RESERVE SUB-FUNDS Euro Reserve US Dollar Reserve
BOND SUB-FUNDS Brazil Bond Euro Corporate Bond Euro Credit Bond Euro Investment Grade Bond Euro Investment Grade Corporate Bond Euro High Yield Bond Global Emerging Markets Bond Global Investment Grade Bond Pan-European Government Bond Sterling Investment Grade Bond US Dollar High Yield Bond US Dollar Investment Grade Bond
EQUITY SUB-FUNDS a) International and Regional sub-funds Asia Ex Japan Equity Asia Ex Japan Equity Smaller Companies Asia Pacific Ex Japan Equity High Dividend BRlC Markets BRlC Markets Equity Emerging Europe Equity Euroland Equity Euroland Equity Smaller Companies (formerly: Pan-European Equity Smaller Companies) Euroland Value Creation Europe Ex UK Equity Global Emerging Markets Elite Fund Global Emerging Markets Equity Global Equity Global Equity SRI Global Equity Technology Global Ex Euroland Equity Pan-European Equity Pan-European Equity High Dividend Sustainability Leaders
b) Market Specific sub-funds Brazil Equity Chinese Equity Hong Kong Equity Indian Equity Japanese Equity Korean Equity Singapore Equity Thai Equity UK Equity US Equity US Index
FREESTYLE SUB-FUNDS Asia Freestyle BRlC Freestyle Global Emerging Markets Equity Freestyle Latin American Freestyle UK Freestyle
OTHER SUB-FUNDS Turkish Convergence
Class A, E, M, P Class I, J,L,Y, 2
0.15% 0.15%
0.35% 0.35% 0.35% 0.25% 0.25% 0.35% 0.35% 0.25% 0.25% 0.25% 0.35% 0.25%
0.35% 0.35% 0.35%
0.35% 0.40% 0.35% 0.35%
0.35% 0.35%
0.40% 0.35% 0.35%
0.35% 0.35%
0.35%
0.35% 0.30%
0.40% 0.40% 0.35% 0.40% 0.35%
0.40% 0.35% 0.31 % 0.35% 0.25%
0.40%
0.40%
0.40% 0.40%
0.40% 0.35%
0.10% 0.10%
0.25% 0.25%
0.15% 0.25%
0.15% 0.25% 0.25% 0.15% 0.15% 0.15% 0.25% 0.15%
0.25% 0.25% 0.25% 0.25% 0.25% 0.30% 0.25% 0.25%
0.25% 0.25%
0.25% 0.25%
0.25% 0.25% 0.25% 0.20%
0.30%
0.25%
0.30% 0.30%
0.30% 0.25%
0.30% 0.25% 0.25% 0.25% 0.15%
0.25%
0.30%
0.30% 0.30% 0.30%
0.35% 0.25%
HSBC Global Investment Funds -~ ~ ~-
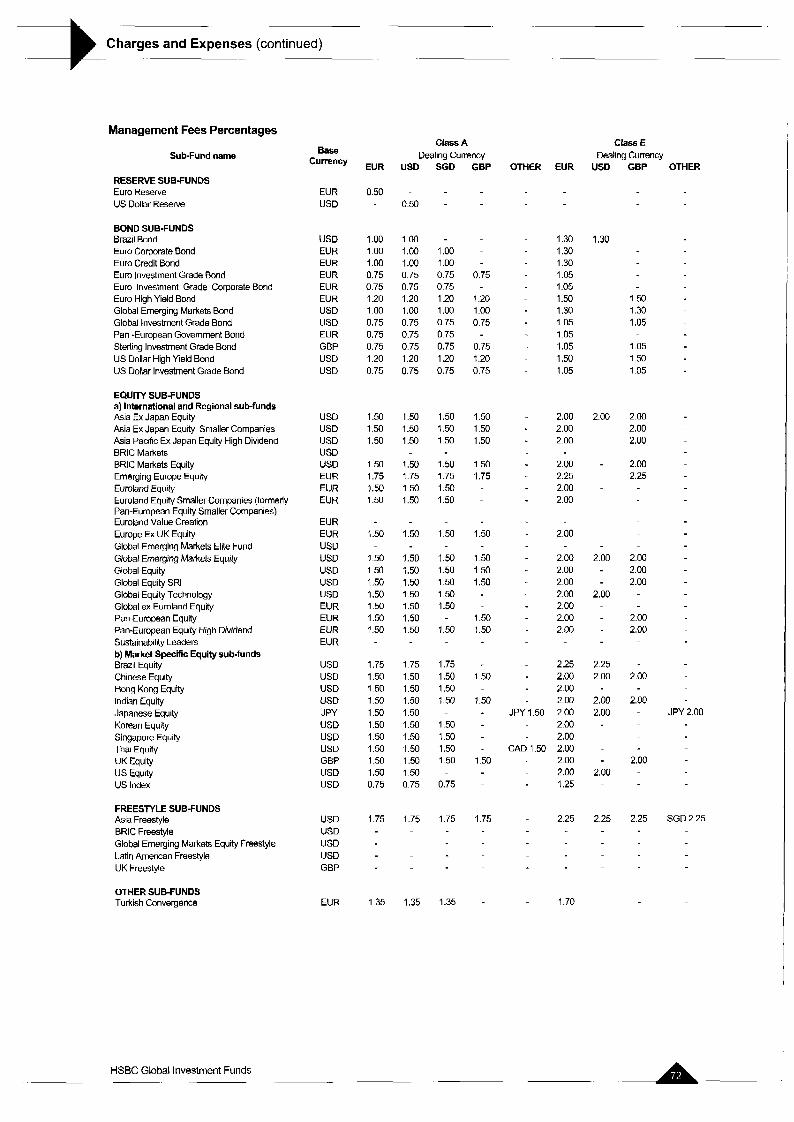
Charges and Expenses (continued) 3- Management Fees Percentages
Sub-fund name
RESERVE SUB-FUNDS Euro Reserve US Dollar Reserve
BOND SUB-FUNDS Brazil Bond Euro Corporate Bond Euro Credit Bond Euro Investment Grade Bond Euro Investment Grade Corporate Bond Euro High Yield Bond Global Emerging Markets Bond Global Investment Grade Bond Pan -European Government Bond Sterling Investment Grade Bond US Dollar High Yield Bond US Dollar Investment Grade Bond
EQUITY SUB-FUNDS a) International and Regional sub-funds Asia Ex Japan Equity Asia Ex Japan Equity Smaller Companies Asia Pacific Ex Japan Equity High Dividend BRlC Markets BRlC Markets Equity Emerging Europe Equity Euroland Equity Euroland Equity Smaller Companies (formedy Pan-European Equity Smaller Companies) Euroland Value Creation Europe Ex UK Equity Global Emerging Markets Elite Fund Global Emerging Markets Equity Global Equity Global Equity SRI Global Equity Technology Global ex Euroland Equity Pan-European Equity Fan-European Equity High Dividend Sustainability Leaders b) Market Specific Equity sub-funds Brazil Equity Chinese Equity Hong Kong Equity Indian Equity Japanese Equity Korean Equity Singapore Equity Thai Equity UK Equity US Equty US Index
FREESTYLE SUE-FUNDS Asia Freestyle BRlC Freestyle Global Emerging Markets Equity Freestyle Latin American Freestyle UK Freestyle
OTHER SUB-FUNDS Turkish Convergence
Base Currency
EUR US0
USD EUR EU R EUR EUR EUR USD USD EUR GBP USD USD
USD USD US0 USD USD EUR EUR EUR
EUR EUR USD USD USD USD USD EUR EUR EUR EUR
US0 USD USD USD JPY USD USD USD GBP USD USD
USD USD USD USD GBP
EUR
EUR
0.50
1-00 1 .oo 1 .00 0.75 0.75 1.20 1 .oo 0.75 0.75 0.75 1.20 0.75
1.50 1.50 1.50
1 . 5 0 1.75 1.50 1.50
1.50
1 . 5 0 1.50 1.50 1.50 1.50 1.50 1.50
1.75 1.50 1.50 1 . 5 0 1.50 1.50 1.50 1.50 1.50 1.50 0.75
1.75
1.35
Class A Dealing Currency
USD
0.50
1 .XI 1 .oo 1 .oo 0.75 0.75 1.20 1 .XI 0.75 0.75 0.75 1.20 0.75
1 . 5 0 1.50 1.50
1.50 1.75 1.50 1.50
1.50
1.50 1.50 1.50 1.50 1.50 1.50 1.50
1.75 1.50 1.50 1.50 1.50 1.50 1.50 1.50 1.50 1.50 0.75
1.75
1.35
SGD
1 .oo 1.00 0.75 0.75 1.20 1 .oo 0.75 0.75 0.75 1.20 0.75
1.50 1.50 1 . 5 0
1.50 1.75 1.50 1.50
1 . 5 0
1.50 1.50 1.50 1.50 1.50
1.50
1.75 1.50 1.50 1.50
1.50 1.50 1.50 1.50
0.75
1.75
1.35
GBP
0.75
1.20 1.00 0.75
0.75 1.20 0.75
1.50 1 . 5 0 1.50
1.50 1.75
1.50
1.50 1.50 1.50
1.50 1.50
1.50
1.50
1.50
1.75
OTHER
JPY 1.50
CAD 1.50
EUR
1.30 1.30 1.30 1.05 1.05 1.50 1.30 1.05 1.05 1.05 1.50 1.05
2.00 2.00 2.00
2.00 2.25 2.00 2.00
2.00
2.00 2.00 2.00 2.00 2.00 2.00 2.00
2.25 2.00 2.00 2.00 2.00 2.00 2.00 2.00 2.00 2.00 1.25
2.25
1.70
Class E Dealing Currency
USD
1.30
2.00
2.00
2.00
2.25 2.00
2.00 2.00
2.00
2.25
GBP
1-50 1.30 1.05
1.05 1.50 1.05
2.00 2.00 2.00
2.00 2.25
2.00 2.00 2.00
2.00 2.00
2.00
2.00
2.00
2.25
OTHER
JPY 2.00
SGD 2.25
HSBC Global Investment Funds
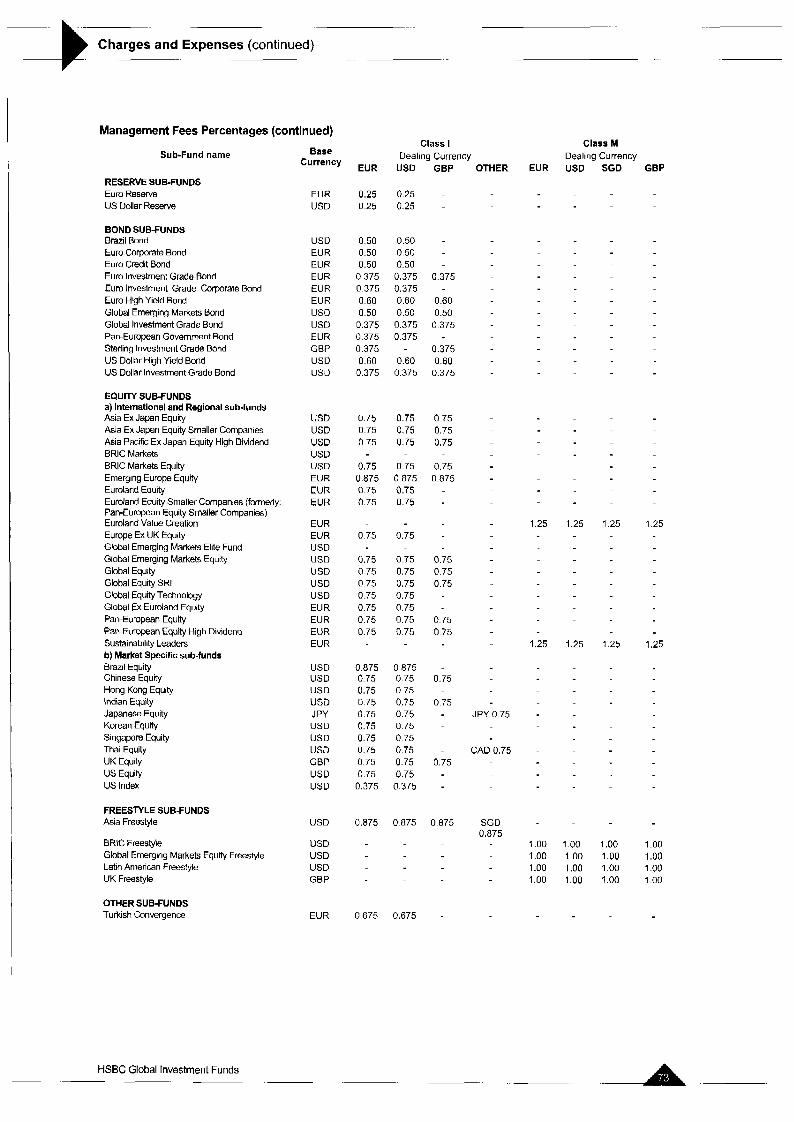
Charges and Expenses (continued)
Management Fees Percentages (continued)
Sub-Fund name
RESERVE SUB-FUNDS Euro Reserve US Dollar Reserve
BOND SUB-FUNDS Brazil Bond Euro Corporate Bond Euro Credit Bond Euro Investment Grade Bond Euro Investment Grade Corporate Bond Euro H'gh Yield Bond Global Emerging Markets Bond Global Investment Grade Bond Pan-European Government Bond Sterling Investment Grade Bond US Dollar High Yield Bond US Dollar Investment Grade Bond
EQUITY SUB-FUNDS a) International and Regional sub-funds Asia Ex Japan Equity Asia Ex Japan Equity Smaller Companies Asia Pacific Ex Japan Equity High Dividend BRlC Markets BRlC Markets Equity Emerging Europe Equity Euroland Equity Euroland Equity Smaller Companies (formerly: Pan-European Equity Smaller Companies) Euroland Value Creation Europe Ex UK Equity Global Emerging Markets Elite Fund Global Emerging Markets Equity Global Equity Global Equity SRI Global Equity Technology Global Ex Euroland Equity Pan-Eumpean Equity PawEuropean Equiv High Dividend Sustainability Leaders b) Market Specific sub-funds Brazil Equity Chinese Equity Hang Kong Equity Indian Equity Japanese Equity Korean Equity Singapore Equity Thai Equity UK Equity US Equity US Index
FREESTYLE SUB-FUNDS Asia Freestyle
BRlC Freestyle Global Emerging Markets Equity Freestyle Latin American Freestyle UK Freestyle
OTHER SUB-FUNDS Turkish Convergence
Base Currency
EUR USD
USD EUR EUR EUR EUR EUR USD USD EUR GBP USD USD
USD USD USD USD USD EUR EUR EUR
EUR EUR USD USD USD USD USD EUR EUR EUR EUR
USD USD us0 USD JPY USD USD USD GBP USD USD
USD
USD US0 US0 GBP
EUR
EUR
0.25 0.25
0.50 0.50 0.50 0.375 0.375 0.60 0.50 0.375 0.375 0.375 0.60 0.375
0.75 0.75 0.75
0.75 0.875 0.75 0.75
0.75
0.75 0.75 0.75 0.75 0.75 0.75 0.75
0.875 0.75 0.75 0.75 0.75 0.75 0.75 0.75 0.75 0.75 0.375
0.875
0.675
Class I Dealing Currencv
USD
0.25 0.25
0.50 0.50 0.50 0.375 0.375 0.60 0.50 0.375 0.375
0.60 0.375
0.75 0.75 0.75
0.75 0.875 0.75 0.75
0.75
0.75 0.75 0.75 0.75 0.75 0.75 0.75
0.875 0.75 0.75 0.75 0.75 0.75 0.75 0.75 0.75 0.75 0.375
0.875
0.675
GBP
0.375
0.60 0.50 0.375
0.375 0.60 0.375
0.75 0.75 0.75
0.75 0.875
0.75 0.75 0.75
0.75 0.75
0.75
0.75
0.75
0.875
OTHER
JPY 0.75
CAD 0.75
SGD 0.875
EUR
1.25
1.25
1 .oo 1 .oo 1.00 1 .oo
Class M Dealing Currencv US0 SGD
1.25
1.25
1 .oo 1 .oo 1 .oo 1 .oo
1.25
1.25
1 .oo 1 .oo 1 .oo 1 .oo
GBP
1.25
1.25
1 .oo 1 .oo 1-00 1.00
-A HSBC Global Investment Funds ~ -- ~.

-~ .. ...
Charges and Expenses (continued) .~
Sub-Fund name Base Currency Class P
Dealing Currency
Class Y
Dealing Currency USD
0.25
0.50
0.50
0.50
0.50
1 .oo
1.00
1 .oo
1 .oo
1 .oo
0.30
EUR
1.50
OTHER GBP
0.50
0.50
0.50
0.50
1 .oo
1 .oo
1.00
OTHER USD
1.50
GBP
RESERVE SUB-FUNDS Euro Reserve US Dollar Reserve
EUR USD EUR 0.25
BOND SUB-FUNDS Brazil Bond Euro Corporate Bond Euro Credit Bond Euro investment Grade Bond Euro Investment Grade Corporate Bond Euro High Yield Bond Global Emerging Markets Bond Global Investment Grade Bond Pan-European Government Bond Sterling Investment Grade Bond US Dollar High Yield Bond US Dollar Investment Grade Bond
EQUITY SUB-FUNDS a) International and Regional sub-funds Asia Ex Japan Equity Asia Ex Japan Equity Smaller Companies Asia Pacific Ex Japan Equity High Dividend BRlC Markets BRlC Markets Equity Emerging Europe Equity Euroland Equity Euroland Equity Smaller Companies (formerly: Pan-European Equity Smaller Companies) Euroland Value Creation Europe Ex UK Equity Global Emerging Markets Elite Fund Global Emerging Markets Equity Global Equity Global Equity SRI Global Equity Technology Global Ex Euroland Equity Pan-European Equity
Pan-European Equity Hlgh Dividend Sustainability Leaders b) Market Specific sub-funds Brazil Equity Chinese Equity
Hang Kong Equity
Indian Equity Japanese Equity
USD EUR EUR EUR EUR EUR USD USD EUR GBP USD USD
EUR 0.50
EUR 0.50
EUR 0.50
SGD 0.50 EUR 0.50
USD USD USD USD US0 EUR EUR EUR
EUR EUR USD USD USD USD USD EUR EUR
EUR EUR
USD USD
USD
USD J PY
SGD 1.50
EUR 1 .OO SGD 1 .OO
SGD 1.00 EUR 1 .OO
JPY 1 .OO SGD 1.00 EUR 1 .OO
SGD 1.00 EUR 1 .OO
Korean Equity Singapore Equity
Thai Equity UK Equity
US Equity
US Index
FREESTYLE SUB-FUNDS Asia Freestyle BRlC Freestyle Global Emerging Markets Equity Freestyle Latin American Freestyle UK Freestyle
Turkish Convergence OTHER SUB-FUNDS
USD USD
USD GBP
USD
USD
SGD 1-00 EUR 1 .OO SGD 0.30 EUR 0.30
US0 USD USD USD GBP
EUR
A HSBC Global Investment Funds

Sub-Fund name
RESERVE SUB-FUNDS Euro Reserve US Doliar Reserve
BOND SUB-FUNDS Brazil Bond Euro Corporate Bond Euro Credit Bond Euro Investment Grade Bond Euro Investment Grade Corporate Bond Euro High Yield Bond Global Emerging Markets Bond Global Investment Grade Bond Pan-European Government Bond Sterling Investment Grade Bond US Dollar High Yield Bond US Dollar Investment Grade Bond
a) International and Regional sub-funds Asia Ex Japan Equity Asia Ex Japan Equity Smaller Companies Asia Pacific Ex Japan Equity High Dividend BRlC Markets
BRlC Markets Equity Emerging Europe Equity Euroland Equity Euroland Equity Smaller Companies (formerly: Pan-European Equity Smaller Companies) Euroland Value Creation Europe Ex UK Equity Global Emerging Makts Elite Fund Global Emerging Markets Equity Global Equity Global Equity SRI Global Equity Technology Global Ex Euroland Equity Pan-European Equity Pan-European Equity High Dividend Sustainability Leaders b) Market Specific sub-funds Brazil Equity Chinese Equity
Hong Kong Equity Indian Equity Japanese Equity Korean Equity Singapore Equity
Thai Equity UK Equity
US Equity US Index FREESTYLE SUB-FUNDS Asia Freestyle BRlC Freestyle Global Emerging Markets Equity Freestyle Latin American Freestyle UK Freestyle
Turkish Convergence
EQUITY SUB-FUNDS
OTHER SUB-FUNDS
Base Currency
EUR USD
USD EUR EUR EUR EUR EUR USD USD EUR GBP USD USD
USD USD USD USD
US0 EUR EUR EUR
EUR EUR USD USD USD USD USD EUR EUR EUR EUR
USD US0
USD USD JPY USD USD
USD GBP
USD USD
USD USD USD USD GBP
EUR
EUR
0.00
0.00 0.00 0.00 0.00 0.00 0.00
0.00 0.00
0.00
0.00 1 .oo 0.00 0.00 0.00 0.00
0.00 1.25
0.00 0.00 0.00
0.00
0.00
0.00
USD
0.00
0.00
0.00 0.00
0.00 0.00
0.00 0.00
1 .oo 0.00
0.00
1.25 0.00 0.00 0.00 0.00
0.00
0.00 0.00
0.00 0.00 0.00 0.00 0.00
0.00
0.00 0.00
0.00
0.00
HSBC Global Investment Funds ~. ~. -. -
Class 2
Dealing Currency GBP
0.00 0.00 0.00
0.00 0.00 0.00
0.00 0.00 0.00
0.00 0.00 0.00
0.00 0.00
0.00
0.00
0.00
0.00
OTHER
SGD 1 .OO CAD 1.00
SGD 1.25
JPY 0.00
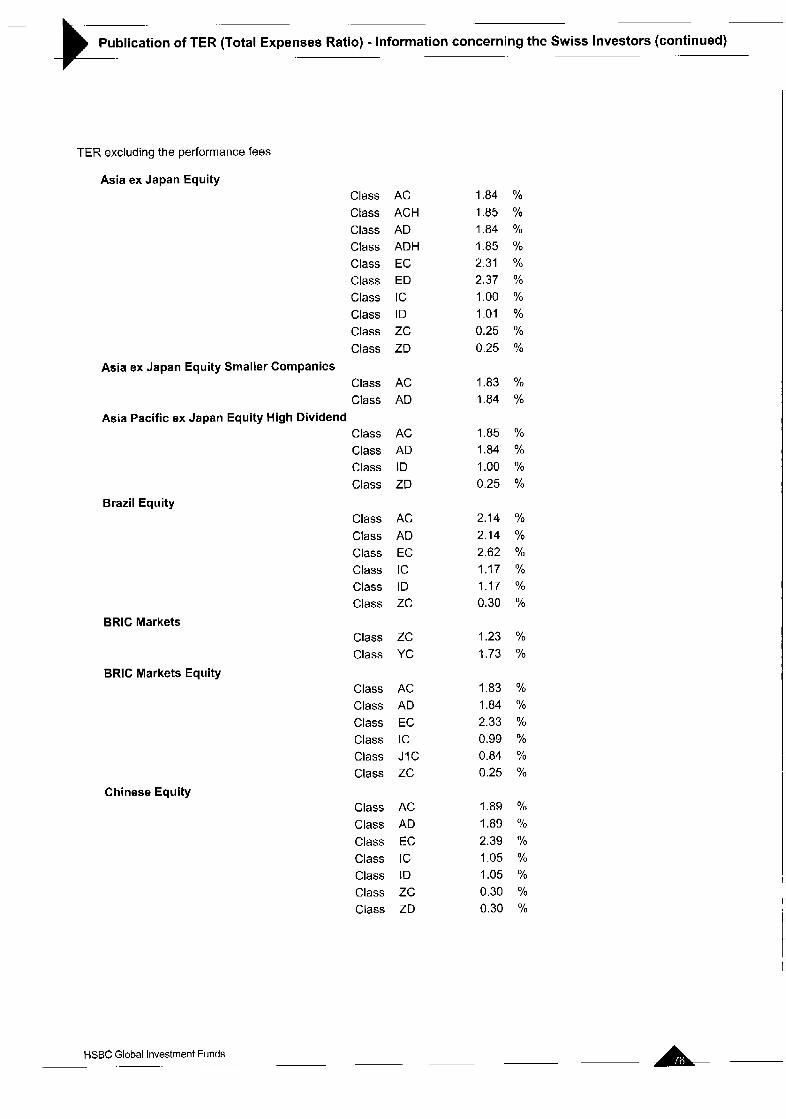
Publication of TER (Total Expenses Ratio) - Information concerning the Swiss Investors (continued)
- -t- TER excluding the performance fees
Asia ex Japan Equity Class Class Class Class Class Class Class Class Class Class
Class Class
Class Class Class Class
Asia ex Japan Equity Smaller Companies
Asia Pacific ex Japan Equity High Dividend
Brazil Equity
ERIC Markets
BRlC Markets Equity
Chinese Equity
AC ACH AD ADH EC ED IC ID zc ZD
AC AD
AC AD ID ZD
Class AC Class AD Class EC Class IC Class ID Class ZC
Class ZC Class YC
Class AC Class AD Class EC Class IC Class J I C Class ZC
Class AC Class AD Class EC Class IC Class ID Class ZC Class ZD
1.84 % 1.85 % 1.84 % 1.85 Yo 2.31 % 2.37 Yo
1.00 % 1-01 % 0.25 % 0.25 %
1.83 % 1.84 %
1.85 % 1.84 % 1.00 % 0.25 %
2.14 Yo 2.14 % 2.62 % 1.17 % 1.17 % 0.30 %
1.23 % 1.73 %
1.83 Yo 1.84 % 2.33 % 0.99 % 0.84 % 0.25 %
1.89 % 1.89 % 2.39 % 1.05 Yo 1.05 % 0.30 Yo 0.30 %
A HSBC Global Investment Funds .~

Publication of TER (Total Expenses Ratio) - Information concerning the Swiss Investors (continued) -x- Emerging Europe Equity
Class AC Class AD Class EC Class IC Class ID Class ZC
Euroland Equity Class Class Class Class Class Class
Class Class Class Class Class
Class Class
Class Class
Class Class
Class Class
Class Class Class Class Class Class
Euroland Equity Smaller Companies
Euroland Value Creation
Sustainability Leaders
Europe ex UK Equity
Global Emerging Markets Elite Fund
Global Emerging Markets Equity
Global Equity
Global Equity SRI
Global Equity Technology
AC AD EC ED IC zc
AC AD EC IC zc
M I C M I D
MIC M I D
AC AD
YC zc
AC AD EC ED IC ZD
Class AC Class AD Class IC Class ZD
Class AC Class AD Class ZC
2.15 % 2.14 % 2.33 % 1.17 % 1-18 % 0.32 %
1.85 % 1.85 % 2.35 % 2.35 % 0.99 % 0.27 %
1.85 % 1.85 % 2.30 % 1-00 % 0.25 Yo
1.60 % 1.60 %
1.54 1.55 Yo
1.85 % 1.85 %
0.25 % 1.26 %
1.89 % 1.89 % 2.40 %
1.05 % 0.30 %
2.40 Yo
1.85 % 1.84 % 1.05 % 0.25 %
1.84 % 1.85 % 0.25 %
A HSBC Global Investment Funds - - - . ~ .~
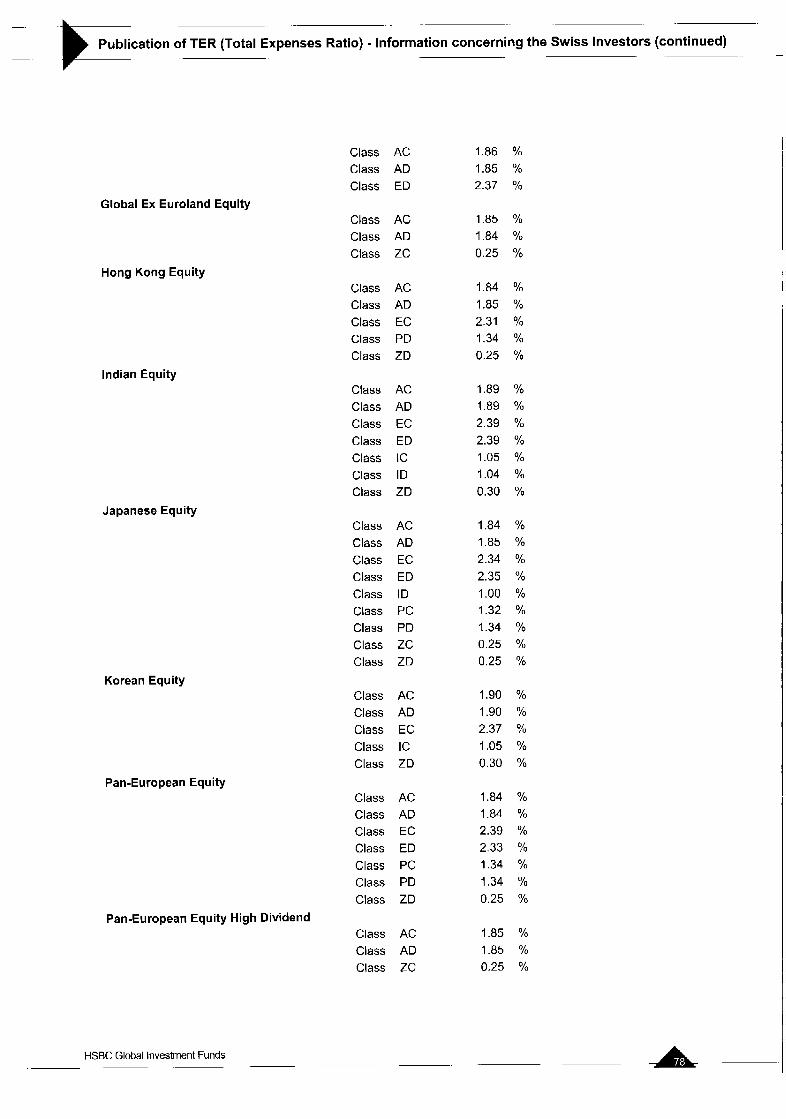
Publication of TER (Total Expenses Ratio) - Information concerning the Swiss Investors (continued) -
Global Ex Euroland Equity
Hong Kong Equity
Indian Equity
Japanese Equity
Class AC Class AD Class ED
Class AC Class AD Class ZC
Class AC Class AD Class EC Class PD Class ZD
Class AC Class AD Class EC Class ED Class IC Class ID Class ZD
Class AC Class AD Class EC Class ED Class ID Class PC Class PD Class ZC Class ZD
Korean Equity Class AC Class AD Class EC Class IC Class ZD
Pan-European Equity Class Class Class Class Class Class Class
Class Class Class
Pan-European Equity High Dividend
AC AD EC ED PC PD ZD
AC AD zc
1.86 % 1.85 % 2.37 %
1.85 % 1.84 Yo 0.25 %
1.84 % 1.85 % 2.31 YQ 1.34 % 0.25 %
1.89 % 1.89 % 2.39 % 2.39 % 1.05 % 1.04 % 0.30 %
1.84 % 1.85 % 2.34 Yo 2.35 % 1.00 % 1.32 % 1.34 Yo 0.25 % 0.25 %
1.90 % 1.90 Yo 2.37 % 1.05 Yo 0.30 %
1.84 % 1.84 2.39 % 2.33 % 1.34 % 1.34 % 0.25 %
1.85 % 1.85 % 0.25 %
HSBC Global Investment Funds .~ -

-
Publication of TER (Total Expenses Ratio) - Information concerning the Swiss Investors (continued)
Singapore Equity
Thai Equity
UK Equity
US Equity
Class AC Class AD Class EC Class PD Class ZD
Class AC Class AD Class EC Class IC Class ZD
Class AC Class AD Class ED Class ZC
Class AC Class ACH Class AD Class ADH Class EC Class ED Class PD Class ZC Class ZD
US Index Class AC Class AD Class PD
Asia Freestyle Class AC Class ACH Class AD Class ADH Class EC Class IC Class ID
BRlC Freestyle Class J I C Class M I C Class M2C Class M2D
Class M I C Class M I D
Global Emerging Markets Equity Freestyle
1.89 % 1.87 % 2.35 % 1.39 Yo 0.30 %
1.86 Yo
1.84 Yo 2.33 % 1.00 % 0.25 %
1.81 % 1.81 % 2.32 % 0.25 %
1.83 % 1.83 % 1.83 % 1.84 % 2.33 % 2.33 % 1.33 % 0.25 % 0.25 %
1.00 % 1.00 Yo 0.55 %
2.14 % 2.14 % 2.14 % 2.14 % 2.62 % 1.17 Yo
1.16 %
0.90 % 1.40 % 1.40 % 1.40 %
1.40 % 1.39 %
HSBC Global Investment Funds ~ -
~ -
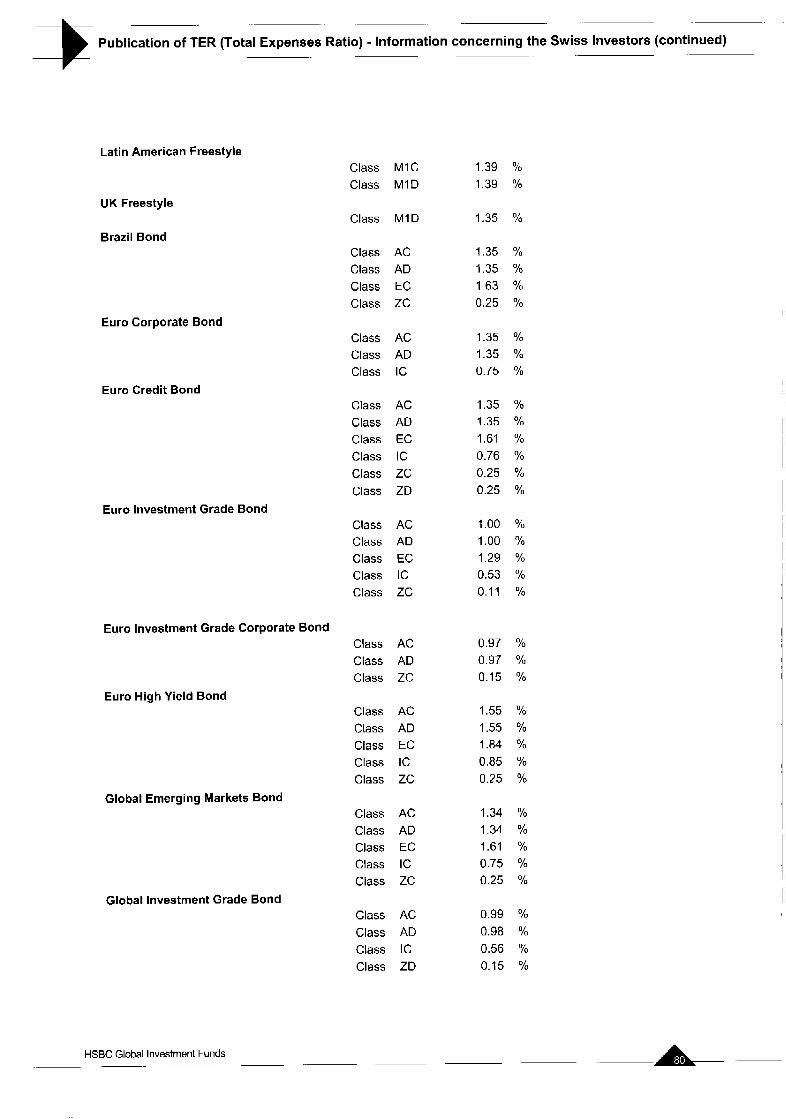
Publication of TER (Total Expenses Ratio) - Information concerning the Swiss Investors (continued) 3 Latin American Freestyle
UK Freestyle
Brazil Bond
Euro Corporate Bond
Euro Credit Bond
Euro Investment Grade Bond
Class MIC Class M I D
Class M I D
Class AC Class AD Class EC Class ZC
Class AC Class AD Class IC
Class AC Class AD Class EC Class IC Class ZC Class ZD
Class AC Class AD Class EC Class IC Class ZC
Euro Investment Grade Corporate Bond Class AC Class AD Class ZC
Class AC Class AD Class EC Class IC Class ZC
Euro High Yield Bond
Global Emerging Markets Bond
Global Investment Grade Bond
Class AC Class AD Class EC Class IC Class ZC
Class AC Class AD Class IC Class ZD
1.39 % 1.39 %
1.35 Yo
1.35 % 1.35 Yo
1.63 % 0.25 %
1.35 % 1.35 Yo
0.75 %
1.35 % 1.35 % 1.61 Yo
0.76 % 0.25 Yo 0.25 Yo
1.00 % 1.00 % 1.29 Yo
0.53 % 0.11 Yo
0.97 % 0.97 % 0.15 %
1.55 Yo
1.55 % 1.84 % 0.85 yo 0.25 %
1.34 % 1.34 Yo 1.61 % 0.75 % 0.25 Yo
0.99 %
0.56 % 0.15 Yo
0.98
HSBC Global Investment Funds - - -

~.
Publication of TER (Total Expenses Ratio) - Information concerning the Swiss Investors (continued) -
Pan-European Government Bond Class AC Class AD Class EC Class IC Class ID
Sterling Investment Grade Bond Class EC Class PD Class ZD
US Dollar High Yield Bond
US Dollar Investment Grade Bond
Euro Reserve
US Dollar Reserve
Turkish Convergence
Class AC Class AD Class EC Class ZC
Class AC Class AD Class EC Class PD Class ZC Class ZD
Class AC Class AD
Class AC Class AD Class PD
Class AC Class AD Class EC
1.00 % 1.00 % 1.27 % 0.52 % 0.53 %
1.28 Yo
0.74 % 0.14 %
1.53 % 1.53 % 1.83 % 0.25 %
0.98 Yo 0.99 % 1.27 % 0.74 %
0.15 % 0.15 Yo
0.65 % 0.66 Yo
0.65 % 0.64 % 0.40 %
1.70 % 1.70 % 2.01 %
HSBC Global Investment Funds ------

Publication of TER (Total Expenses Ratio) - Information concerning the Swiss Investors (continued) r- TER including the performance fees
BRlC Freestyle Class Class Class Class
Latin American Freestyle Class
Euroland Value Creation Class Class
Class Class
Class
Class Class
Sustainability Leaders
UK Freestyle
Global Emerging Markets Equity Freestyle
J IC M I C M2C M2D
M I C M I D
M I C M I D
M I C M I D
M I D
M l C M I D
3.90 Yo
5.25 Yo
4.81 % 5.14 %
5.47 Yo
6.32 %
1.60 % 1.78 Yo
1.94 Yo 1.57 %
1.35 %
4.01 O h 1.40 %
HSBC Global Investment Funds .~ p p p p ~p -

- .
Publication of PTR (Portfolio Turnover Ratio) - Information concerning the Swiss Investors -.
Asia ex Japan Equity Asia ex Japan Equity Smaller Companies Asia Pacific ex Japan Equity High Dividend Brazil Equity BRlC Markets BRlC Markets Equity* Chinese Equity Emerging Europe Equity Euroland Equity Euroland Equity Smaller Companies Euroland Value Creation Sustainability Leaders Global Equity Global Equity SRI Global Equity Technology Global ex Euroland Equity Hong Kong Equity Japanese Equity Korean Equity Pan-European Equity High Dividend Singapore Equity Thai Equity UK Equity US Index Asia Freestyle BRlC Freestyle Global Emerging Markets Equity Freestyle Latin American Freestyle* UK Freestyle Brazil Bond* Euro Corporate Bond Euro Credit Bond Euro Investment Grade Bond Euro High Yield Bond Global Emerging Markets Bond Global Investment Grade Bond Pan-European Government Bond Sterling Investment Grade Bond US Dollar High Yield Bond US Dollar Investment Grade Bond Euro Reserve US Dollar Reserve Turkish Convergence Global Emerging Markets Elite Fund * Global Emerging Markets Equity US Equity Pan-European Equity Europe ex UK Equity Indian Equity
* The PTR have been annualised
% 81.08
124.17 44.31
124.59 5.30
45.27 64.67
127.46 159.86 173.24 74.86
132.43 149.90 201.35
70.56 (4.44) 81.12 56.91
118.73 380.52
50.89 11.06 91.22 24.63
136.32 102.49 246.24 482.67 157.22 149.99 114.39 243.73 170.78 219.39 130.02 491.11 223.86 287.80
20.82 875.39 936.18
1200.20 1438.40 413.60 247.34 60.96
105.21 11 1.99 105.78
HSBC Global Investment Funds - ~ ~ - -. ~ ~ ~ .~ .~

Comparative Table of Net Assets .~
at 31 March 2005 at 31 March 2006 at 31 March 2007 -. . -
ASIA EX JAPAN EQUITY USD
~ .~ -
Net Asset Value per Share
CLASS A C
CLASS A C H
CLASS A D
CLASS A D H
CLASS E C
CLASS E D
CLASS I C
CLASS I D
CLASS z c CLASS Z D
27.55
NIA
26.53
NIA
NIA
26.17 NIA
NIA
27.89 NIA
35.98 15.54
34.42
NIA
NIA
33.97 34.59
34.59 37.00
NIA
Total Net Assets 354,554,804 582,349,188
ASIA EX JAPAN EQUITY SMALLER COMPANIES USD
44.36
20.48 42.19
20.36
41.63 41.63
43.00 43.00 46.35
42.58
61 2,532,695 .~ ~
Net Asset Value per Share
CLASS A C
CLASS A D
16.87 16.67
Total Net Assets 32,023.474
ASIA PACIFIC EX JAPAN EQUITY HIGH DIVIDEND USD
~ ~ .~
. - ~ - ~
Net Asset Value per Share
CLASS A C 10.17 CLASS A D 10.17
CLASS I D NIA
CLASS Z D NIA
Total Net Assets 234,747,567
BRAZIL EQUITY USD
~~ ~. ~ --
~~~
Net Asset Value per Share
CLASS A C 12.30
CLASS A D 12.30
CLASS E C NIA
CLASS I C NIA
CLASS I D NIA
CLASS z c 12.42
Total Net Assets 39,199,791
21.57 21.17
29.12
28.36
31,219,270 41,088,141 .. ~ ~
- - ~~
11.71 14.28 11.21 13.45
11.44 13.82 NIA 13.57
142,208,941 192,121,007 ~ --
23.80
23.78
23.79
23.82 23.82
24.49
351 ,I 02,078
~~
31.16
31.03
30.99 31.49
31.49
32.65
1,086,007,695
HSBC Global Investment Funds
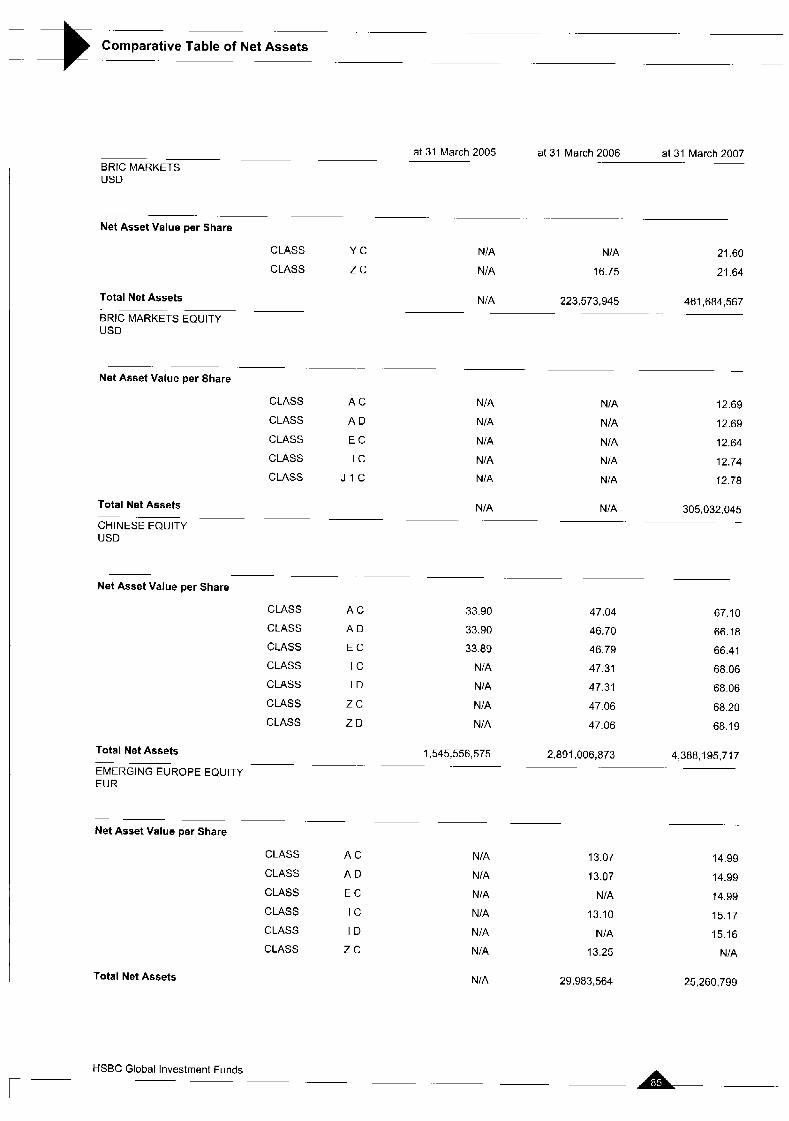
Comparative Table of Net Assets -* -. ~
at 31 March 2005 at 31 March 2006 at 31 March 2007 BRlC MARKETS USD
~
~-~
Net Asset Value per Share
CLASS Y C
CLASS z c
Total Net Assets
BRlC MARKETS EQUITY USD
.~
~- ~ - ~
Net Asset Value per Share
CLASS A C
CLASS A D
CLASS E C
CLASS I C
CLASS J I C
Total Net Assets
CHINESE EQUITY USD
- - ~ ~
Net Asset Value per Share
CLASS
CLASS
CLASS
CLASS
CLASS
CLASS
CLASS
Total Net Assets
A C
A D
E C
I C
I D
z c Z D
NIA
NIA
NIA
16.75
21.60
21.64
NIA 223,573,945 461,684,567 . -
N/A
NIA
NIA
NIA
NIA
NIA
N/A
NIA
NIA
NIA
NIA NIA
33.90
33.90
33.89
NIA
NIA
NIA
NIA
47.04
46.70
46.79
47.31
47.31
47.06
47.06
1,545,556,575 2,891,006,873
305,032.045 - -
. . .~ - - .~ ~ - EMERGING EUROPE EQUITY EUR
Net Asset Value per Share
CLASS A C
CLASS A D
CLASS E C
CLASS I C
CLASS I D
CLASS z c
Total Net Assets
N/A
NIA
NIA
NIA
NIA
NIA
13.07
13.07
NIA
13.10
N/A
13.25
NIA 29,983,564
12.69
12.69
12.64
12.74
12.78
67.10
66.18
66.41
68.06
68.06
68.20
68.19
4,388,195,717
14.99
14.99
14.99
15.17
15.16
NIA
25,260,799
L HSBC Global Investment Funds - - ~ -~ r---
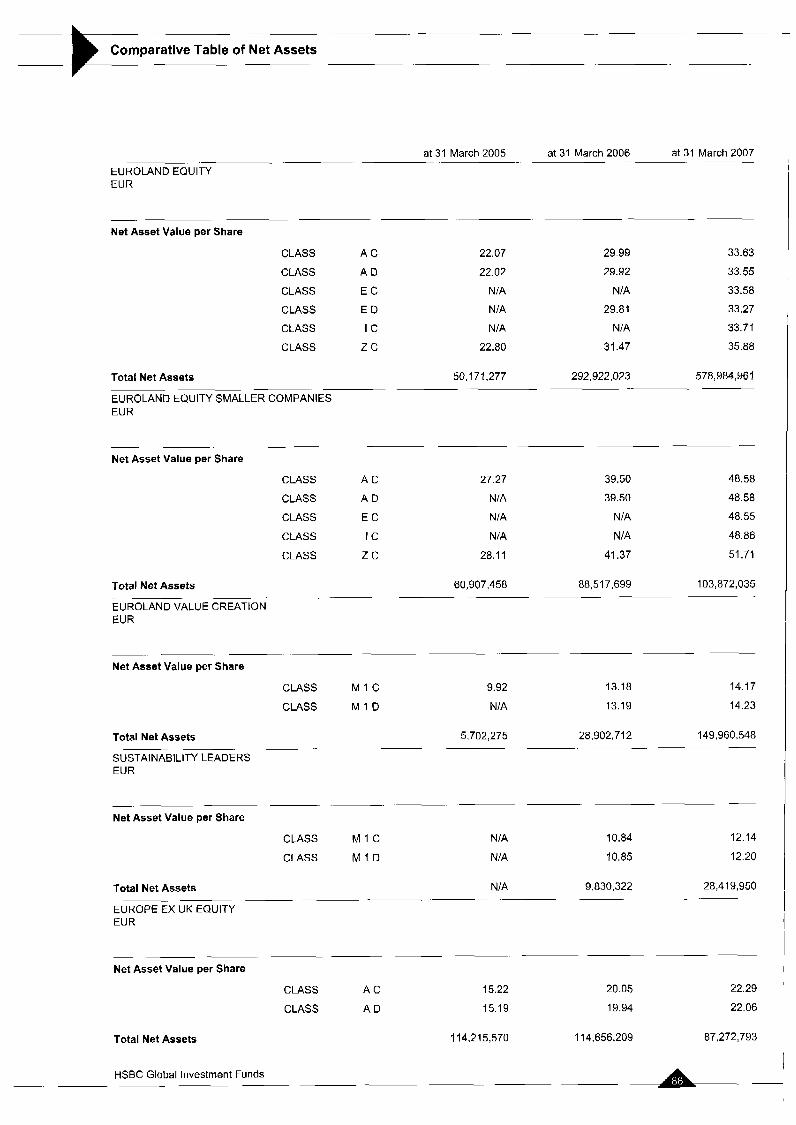
-
Comparative Table of Net Assets .~
at 31 March 2005 at 31 March 2006 at 31 March 2007
EUROLAND EQUITY EUR
- .~
Net Asset Value per Share
CLASS A C
CLASS A D
CLASS E C
CLASS E D
CLASS I C
CLASS z c
22.07
22.02
NIA
NIA
NIA
22.80
29.99
29.92
NIA
29.81
NIA
31 -47
33.63
33.55
33.58
33.27
33.71
35.88
Total Net Assets 50,171,277 292,922.023 578,984,961
EUROLAND EQUITY SMALLER COMPANIES EUR
- . -
Net Asset Value per Share
CLASS A C
CLASS A D
CLASS E C
CLASS IC
CLASS z c
27.27
NIA
NIA
NIA
28.1 1
39.50
39.50
NIA
NIA
41.37
48.58
48-58
48.55
48.86
51.71
Total Net Assets 60,907,458 88,517,699 103,872,035
EUROLAND VALUE CREATION EUR
-
~.
Net Asset Value per Share
CLASS M I C 9.92 13.18 14.17
CLASS M I D NIA 13.19 14.23
5,702,275 28,902,712 149,960,548 Total Net Assets
SUSTAINABILITY LEADERS EUR
. - .~
~
Net Asset Value per Share
CLASS M I C NIA 10.84 12.14
CLASS M I D NIA 10.85 12 20
Total Net Assets NIA 9,830,322 28,419,950
EUROPE EX UK EQUITY EUR
~.
~ ~
Net Asset Value per Share
CLASS A C 15.22 20.05 22.29
CLASS A D 15.19 19.94 22.06
Total Net Assets 114,215,570 114,656,209 87,272,793
HSBC Global Investment Funds ~. ~. ~.
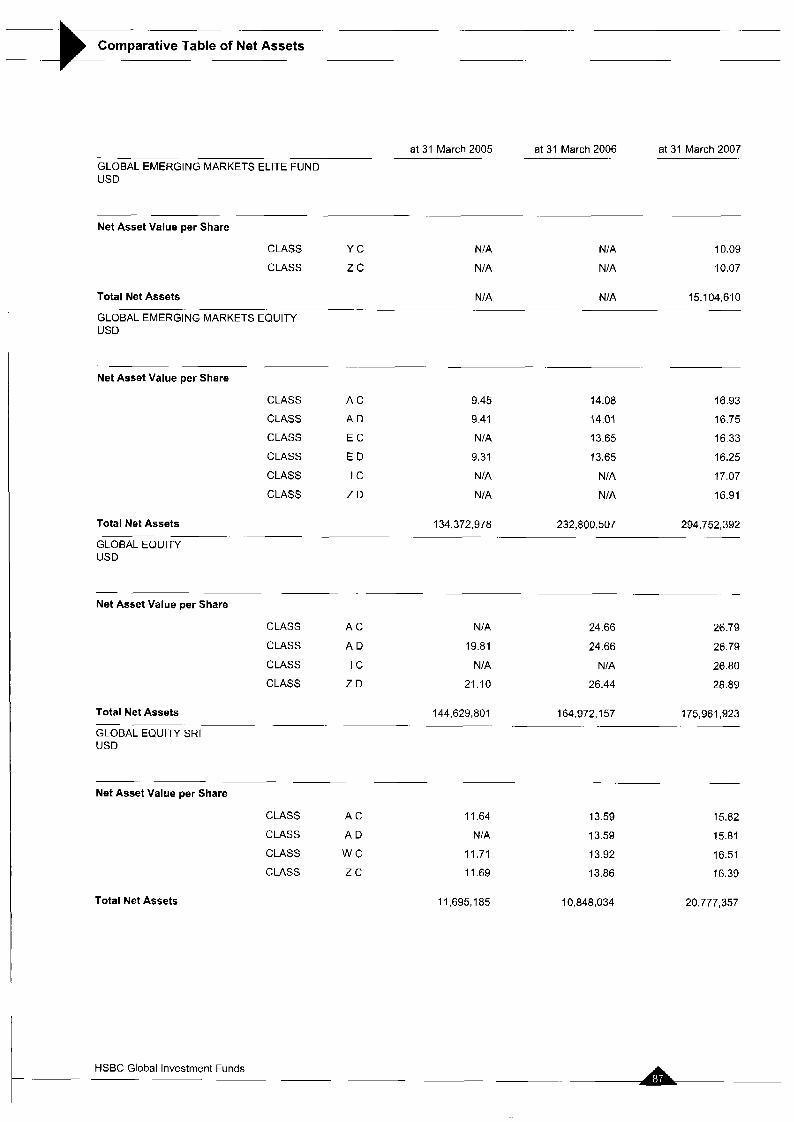
Comparative Table of Net Assets ~.
at 31 March 2006 at 31 March 2007 - .
at 31 March 2005
GLOBAL EMERGING MARKETS ELITE FUND USD
Net Asset Value per Share
CLASS Y C
CLASS z c NIA
NIA
NIA
NIA
10.09
10.07
Total Net Assets NIA NIA 1 5 1 04,610
GLOBAL EMERGING MARKETS EQUITY USD
. . .- -
.-
Net Asset Value per Share
CLASS A C
CLASS A D
CLASS E C
CLASS E D
CLASS IC CLASS Z D
9.45
9.41
NIA
9.31
NIA
NIA
14.08
14.01
13.65
13.65
NIA
NIA
16.93
16.75
16.33
16.25
17.07
16.91
134,372,978 232,800.507 294,752,392 Total Net Assets
GLOBAL EQUITY USD
.- ~- Net Asset Value per Share
CLASS A C
CLASS A D
CLASS I C
CLASS Z D
NIA
19.81
NIA
21.10
24.66
24.66
NIA
26.44
26.79
26.79
26.80
28.89
164,972,157 175,961,923 Total Net Assets 144,629,801
GLOBAL EQUITY SRI USD
Net Asset Value per Share
CLASS A C
CLASS A D
CLASS w c CLASS z c
Total Net Assets
11.64
NIA
11.71
11.69
13.59
13.59
13.92
13.86
15.82
15.81
16.51
16.39
11,695,185 10,848,034 20,777,357
HSBC Global Investment Funds - .

-
Comparative Table of Net Assets
at 31 March 2005 at 31 March 2006 at 31 March 2007 ~
GLOBAL EQUITY TECHNOLOGY USD
. -
Net Asset Value per Share
CLASS A C
CLASS A D
CLASS E D
Total Net Assets
GLOBAL EX EUROLAND EQUITY EUR
~
~
Net Asset Value per Share
CLASS A C
CLASS A D
CLASS z c
Total Net Assets
19.48
3.26
3.20
9,044,946
17.24
NIA
17.80
93,199,546
21.17
3.55
3.46
23.99
4.02
3.90
7,914,102 6,659,147
21.17
21.17
22.21
21 -32
21.32
22.72
59,070,237 4a,840,267 .~
HONG KONG EQUITY USD
Net Asset Value per Share
CLASS A C
CLASS A D
CLASS E C
CLASS P D
CLASS Z D
62.84
62.70
NIA
61.60
NIA
77.94
76.83
NIA
75.70
77.42
98.79
95.33
98.65
94.36
90.95
Total Net Assets
INDIAN EQUITY USD
. .
Net Asset Value per Share
Total Net Assets
179,118,104 1 94,270,521 21 3,556,902 .~ . .
CLASS A C
CLASS A D
CLASS E C
CLASS E D
CLASS I C
CLASS I D
CLASS Z D
70.41
70.41
69.72
NIA
71.66
NIA
NIA
120.49
120.49
118.72
NIA
123.69
123.69
121.42
135.24
135.24
132.59
132.59
140.01
140.00
138.08
2,763,872,800 6,029,705,648 5,450:800,640
&- HSBC Global Investment Funds
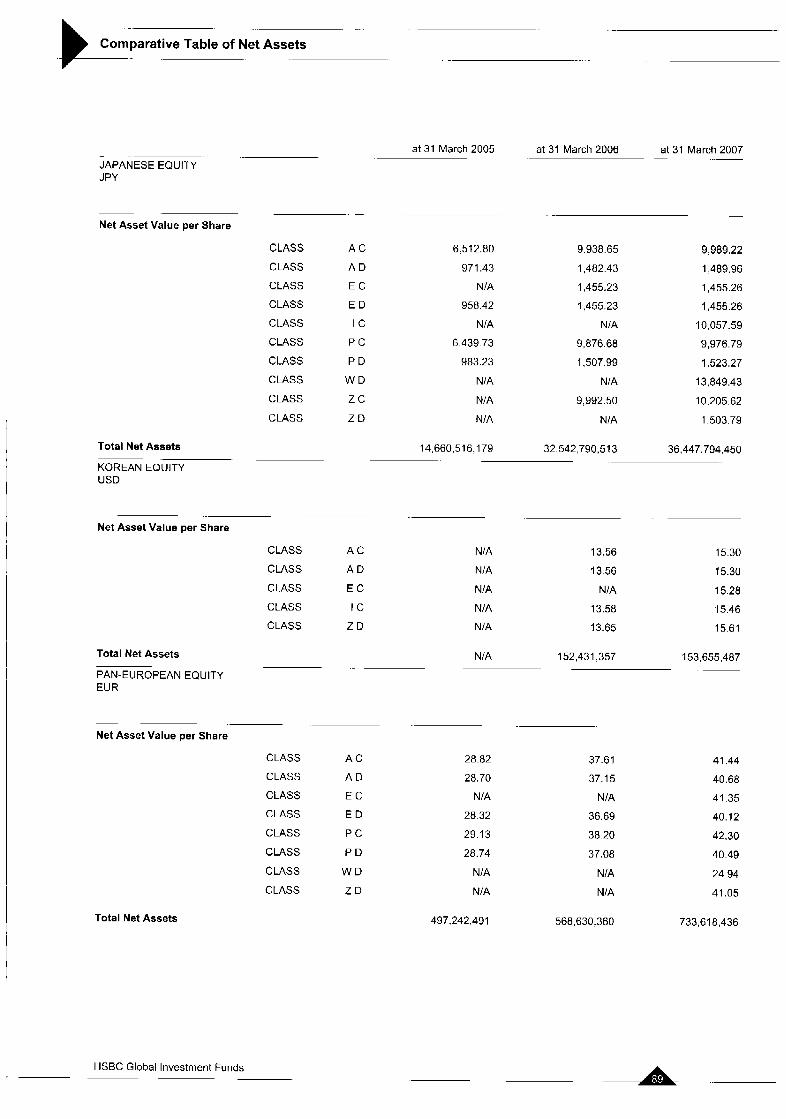
__
Comparative Table of Net Assets ..
- ..
JAPANESE EQUITY J PY
. -.
Net Asset Value per Share
CLASS A C
CLASS A D
CLASS E C
CLASS E D
CLASS I C
CLASS P C
CLASS P D
CLASS W D
CLASS z c CLASS Z D
at 31 March 2007 at 31 March 2006 -. at 31 March 2005
6.512.80
971.43
N IA
958.42
NIA
6.439.73
983.23
NIA
NIA
NIA
9:938.65
1,482.43
1,455.23
1,455.23
NIA
9,876.68
1,507.99
NIA
9,992.50
NIA
9,989.22
1,489.96
1,455.26
1,455.26
10,057.59
9,976.79
1,523.27
13.849.43
10,205.62
1.503.79
Total Net Assets 14,660,516,179 32,542.790,5 1 3 36,447,794,450
USD
~.
KOREAN EQUITY
Net Asset Value per Share
CLASS A C
CLASS A D
CLASS E C
CLASS I C
CLASS Z D
NIA
NIA
NIA
NIA
NIA
13.56
13.56
NIA
13.58
13.65
15.30
15.30
15.28
15.46
15.61
Total Net Assets NIA 152,431,357 153,655,487
EUR PAN-EUROPEAN EQUITY
~
Net Asset Value per Share
CLASS
CLASS
CLASS
CLASS
CLASS
CLASS
CLASS
CLASS
Total Net Assets
A C
A D
E C
E D
P C
P D
W D
Z D
28.82
28.70
NIA
28.32
29.13
28.74
NIA
NIA
37.61
37.15
NIA
36.69
38.20
37.08
NIA
NIA
41.44
40.68
41.35
40.12
42.30
40.49
24.94
41.05
497,242,491 568,630,360 733,618,436
HSBC Global Investment Funds

Comparative Table of Net Assets ..
at 31 March 2005 at 31 March 2006 at 31 March 2007
PAN-EUROPEAN EQUITY HIGH DIVIDEND EUR
Net Asset Value per Share
CLASS A C
CLASS A D
CLASS z c
11.25
NIA
11.35
14.79
14.79
15.16
16.11
16.1 1
16.78
Total Net Assets
SINGAPORE EQUITY USD
-
Net Asset Value per Share
Total Net Assets
THAI EQUITY USD
76,520,434 83,304,250 82,660,478 . -
CLASS A C
CLASS A D
CLASS E C
CLASS P D
CLASS Z D
24.08
24.08
NIA
23.98
NIA
31.55
31.02
NIA
31.02
31.26
47.88
44.42
47.78
44.49
47-10
112,417.143 20,725,989 26,242,522 . . . -. --
Net Asset Value per Share
CLASS A C 8.58 9.36 9 74
CLASS A D 8 58 9 32 9.44
CLASS E C NIA NIA 9.72
CLASS I C NIA 9.38 9 84
CLASS Z D NIA 9.37 9.76
264,861,559 21 7,572,937 Total Net Assets 21 3,816,074
UK EQUITY GBP
Net Asset Value per Share
CLASS
CLASS
CLASS
CLASS
Total Net Assets
A C 21.53 27.03 28.48
A D 21.48 26.14 27.24
E D NIA 19.34 20.10
z c NIA 27.25 29.17
28,272,884 164,915.960 97,879,771
A - HSBC Global Investment Funds
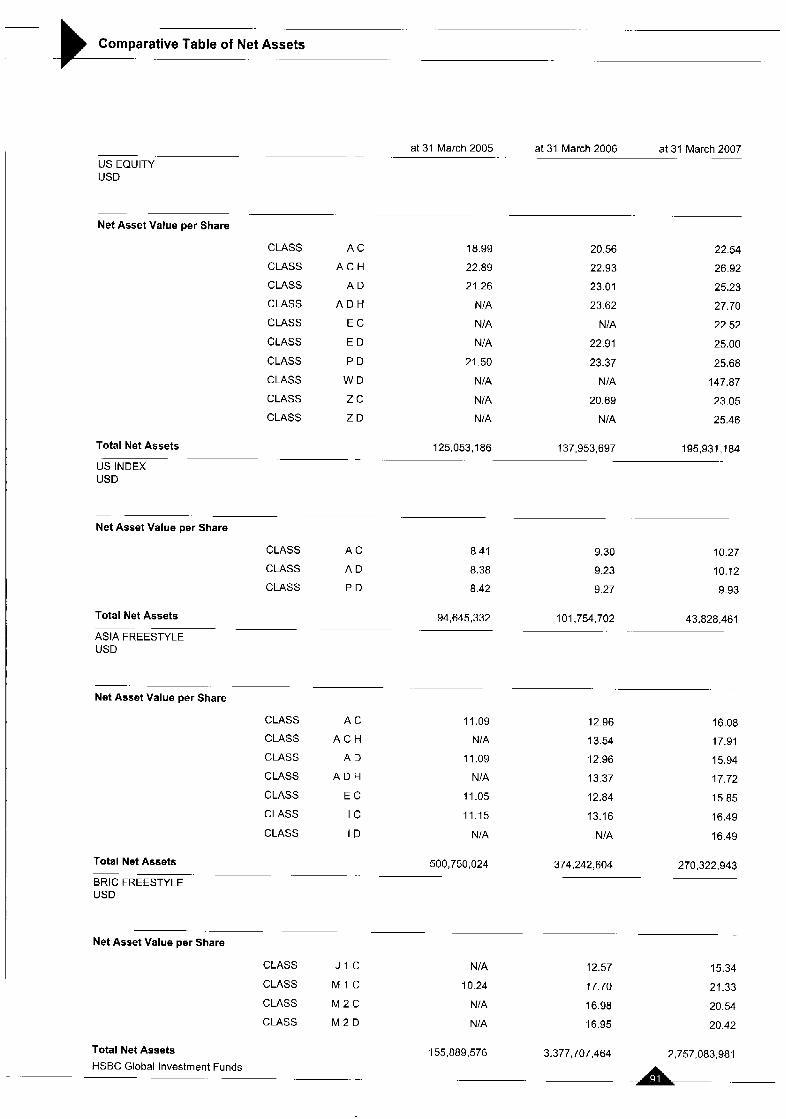
Comparative Table of Net Assets ~-
at 31 March 2007 -~
-. at 31 March 2005 at 31 March 2006 US EQUITY USD
- . ~.
Net Asset Value per Share
CLASS A C
CLASS A C H
CLASS A D
CLASS A D H
CLASS E C
CLASS E D
CLASS P D
CLASS W D
CLASS z c CLASS Z D
18.99
22.89
21.26
NIA
NIA
NIA
21.50
NIA
NIA
NIA
20.56
22.93
23.01
23.62
NIA
22.91
23.37
NIA
20.69
NIA
22.54
26.92
25.23
27.70
22.52
25.00
25.68
147.87
23.05
25.46
Total Net Assets 125,053,186 137,953,697 195,931,184
US INDEX USD
- .
-
Net Asset Value per Share
CLASS A C 8 41 9.30 10.27
CLASS A D 8.38 9.23 10.12
CLASS P D 8 42 9 27 9.93
101,754,702 43,828,461 Total Net Assets 94,645,332
ASIA FREESTYLE USD
- .. ~-
- - Net Asset Value per Share
CLASS A C
CLASS A C H
CLASS A D
CLASS A D H
CLASS E C
CLASS I C
CLASS I D
Total Net Assets
BRlC FREESTYLE USD
. . ~.
Net Asset Value per Share
CLASS J I C
CLASS M I C
CLASS M 2 C
CLASS M 2 D
Total Net Assets
HSBC Global Investment Funds . -. - .
11.09
NIA
11.09
NIA
11.05
11.15
NIA
500,750,024
12.96
13.54
12.96
13.37
12.84
13.16
NIA
374,242:604
16.08
17.91
15.94
17.72
15.85
16.49
16.49
270,322,943
NIA
10.24
NIA
NIA
155,889,576
12.57 15.34
17.70 21.33
16.98 20.54
16.95 20.42
3,377,707.464 2,757,083,981
..&. ~

Comparative Table of Net Assets 3 GLOBAL EMERGING MARKETS EQUITY FREESTYLE USD
Net Asset Value per Share
Total Net Assets
LATIN AMERICAN FREESTYLE USD
-
-.
Net Asset Value per Share
CLASS M I C
CLASS M I D
CLASS M 1 C
CLASS M I D
Total Net Assets
UK FREESTYLE GBP
. -
at 31 March 2007 . -
at 31 March 2005 at 31 March 2006
NIA
NIA
10.11
10.1 1
11.70
11 -79
NIA 660,549,914 845,789,963 .~
NIA
NIA
NIA
NIA
14.24
14.23
NIA NIA 40,555.651
~ . -
Net Asset Value per Share
CLASS M I D 10.06 12.21 13.38
Total Net Assets 5,308,976 14,691,270 12,934,876
BRAZIL BOND USD
.~
Net Asset Value per Share
CLASS A C NIA NIA 12.02
CLASS A D NIA NIA 12.02
CLASS E C NIA NIA 12 01
CLASS z c NIA NIA 12 12
Total Net Assets NIA NIA 6,969,093
EURO CORPORATE BOND EUR
-.
~
Net Asset Value per Share
CLASS A C NIA 10 08 10.39
CLASS A D NIA 9.82 10.12
CLASS I C NIA NIA 10 40
Total Net Assets NIA 48,600,380 59,079,111
HSBC Global Investment Funds -

Comparative Table of Net Assets .. ~
EURO CREDIT BOND EUR
Net Asset Value per Share
CLASS
CLASS
CLASS
CLASS
CLASS
CLASS
CLASS
A C
A D
E C
I C
I D
z c Z D
at 31 March 2005 at 31 March 2006 at 31 March 2007
Total Net Assets
EURO INVESTMENT GRADE BOND EUR
~.
Net Asset Value per Share
Total Net Assets
16.78
16.21
NIA
16.98
16.47
16.83
NIA
16.99
15.05
NIA
17.30
NIA
17.22
16.77
17.31
15.34
17.31
17.73
NIA
17.74
17.27
98,866,400 90,422,134 43,802,458
.-
CLASS A C 16.44 16.72 16 91
CLASS A D NIA 15 97 16.16
CLASS E C NIA NIA 16.91
CLASS I C 16 60 16 95 17.24
CLASS z c 16.72 17.15 NIA
125,768,237 141,727,066 160.61 9,682
EURO INVESTMENT GRADE CORPORATE BOND* EUR
~.
Net Asset Value per Share
CLASS A C
CLASS A D
CLASS z c
Total Net Assets
EURO HIGH YIELD BOND EUR
.~ ~. ~
~-
Net Asset Value per Share
CLASS A C
CLASS A D
CLASS E C
CLASS I C
CLASS I D
CLASS z c
Total Net Assets
NIA 10.01 10.32
NIA 9.76 10 06
NIA 10.09 10.49
NIA 10,644,652 NIA -
18.95 20.30 21.60
18.69 17.67 18.81
NIA NIA 21.58
19.22 20.73 22.21
18.16 NIA NIA
19.01 20.63 22.24
126.066.364 124,271,638 84,096,699
* The sub-fund Euro Investment Grade Corporate Bond has been liquidated as at 19 March 2007
A HSBC Global Investment Funds 1

- - -
Comparative Table of Net Assets
at 31 March 2007 -. -
at 31 March 2005 at 31 March 2006 ~.
GLOBAL EMERGING MARKETS BOND USD
. ..
Net Asset Value per Share
CLASS A C 16.08 18.59
CLASS A D 15.13 15.76
CLASS E C N/A N/A
CLASS I C NIA 18.60
CLASS z c 16.09 18.81
Total Net Assets 45,943,698 119,634,250
GLOBAL INVESTMENT GRADE BOND USD
- . -
Net Asset Value per Share
CLASS A C 13 79 13.29
CLASS A D 13.79 12.82
CLASS I C NIA NIA
CLASS W D NIA N/A
CLASS Z D NIA NIA
88,081,665 Total Net Assets 109,990,135
20.44
17.33
20.42
20.57
20.91
133,896,921
13.75
13.60
13.75
185.20
13.67
1 0 8 , 8 i a m
GLOBAL INVESTMENT GRADE BOND ( u s DOLLAR-HEDGED) -
USD
~.
Net Asset Value per Share
CLASS
CLASS
CLASS
CLASS
CLASS
CLASS
CLASS
CLASS
A C 15.88
A D 15.51
E C NIA
E D N/A
I C NIA
I D NIA
z c N/A
Z D N/A
15.97
14.71
N/A
NIA
NIA
N /A
N/A
N IA
~
NIA
N/A
NIA
N/A
NIA
NIA
NIA
N/A
Total Net Assets 20,535,844 453,246 N/A --
PAN-EUROPEAN GOVERNMENT BOND EUR
Net Asset Value per Share
CLASS A C
CLASS A D
CLASS E C
CLASS I C
CLASS I D
16.17
15.74
NIA
16.32
15.65
16.49
13.15
NIA
16.72
14.92
16.73
13.34
16.71
17.05
15.21
Total Net Assets 78,232,337 117:815,022 140,521,794
- HSBC Global Investment Funds
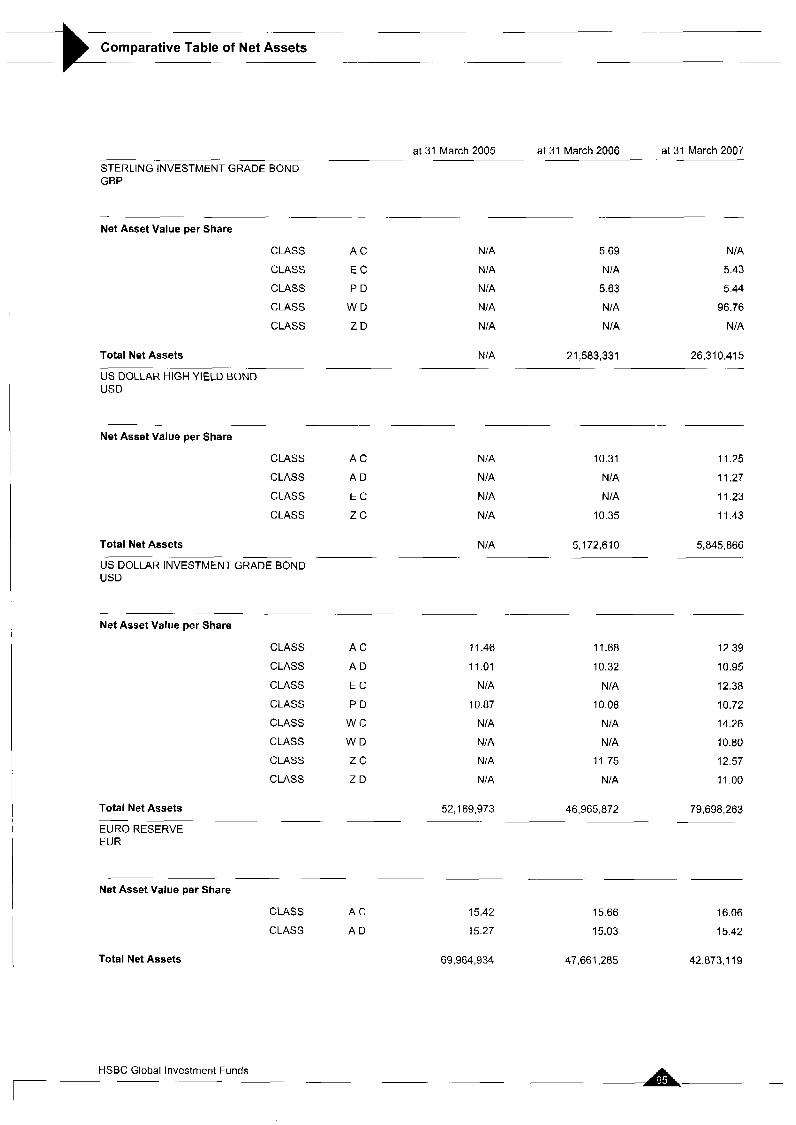
-.
Comparative Table of Net Assets =k- __
at 31 March 2005 at 31 March 2006 at 31 March 2007
STERLING INVESTMENT GRADE BOND GBP
- . .. - Net Asset Value per Share
CLASS A C
CLASS E C
CLASS P D
CLASS W D
CLASS Z D
NIA
NIA
NIA
NIA
NIA
5.69
N/A
5.63
N/A
NIA
NIA
5.43
5.44
96.76
NIA
NIA 21,583,331 26,310,415 Total Net Assets
US DOLLAR HIGH YIELD BOND USD
.-
- . -- . - .
Net Asset Value per Share
CLASS A C NIA 10.31 11.25
CLASS A D NIA N/A 11.27
CLASS E C NIA NIA I 1 23
CLASS z c NIA 10.35 11.43
Total Net Assets NIA 5,172,610 5,845,666
USD
-~
Net Asset Value per Share
CLASS
CLASS
CLASS
CLASS
CLASS
CLASS
CLASS
CLASS
Total Net Assets - ~ ~
EURORESERVE EUR
~ ~ ~
Net Asset Value per Share
CLASS A C
CLASS A D
Total Net Assets
A C
A D
E C
P D
w c W D
z c Z D
US DOLLAR INVESTMENT GRADE BOND
~
11.46
11.01
NIA
10.87
NIA
NIA
NIA
NIA
11.68
10.32
NIA
10.08
NIA
NIA
11 -75
NIA
12.39
10.95
12.38
10.72
14.26
10.80
12.57
1 1-00
52,169,973 46,965,872 79,698,263
.
15.42
15.27
15.66
15.03
16.06
15.42
69,964,934 47,661,285 42,873,119
HSBC Global Investment Funds ~. 7 -~ ~ -~ .~ -~ -

Comparative Table of Net Assets .~
at 31 March 2007 . -
at 31 March 2005 ai 31 March 2006 -.
U S DOLLAR RESERVE USD
- -.
Net Asset Value per Share
CLASS
CLASS
CLASS
Total Net Assets
TURKISH CONVERGENCE EUR
~
A C
A D
P D
15.20
8.34
8.33
15.67
7.82
8.16
51,859,445 22,672,829 - -
Net Asset Value per Share
CLASS A C 10.14 14.98
CLASS A D NIA 14.98
CLASS E C NIA NIA
CLASS Z C 10.15 NIA
Total Net Assets 7,252,084 67,383,014
16.41
8.19
8.57
19,196,118
-
14.67
14.02
14.66
NIA
50,978,451
I
HSBC Global Investment Funds a -

Portfolio of Investments and Other Net Assets
ASIA EX JAPAN EQUITY Statement of Investments as at 31 March 2007 (expressed in USD)
- .~
Description Quantity Currency Evaluation "/. net assets
- ~ .- .~ -
INVESTMENTS
TRANSFERABLE SECURITIES ADMITTED TO AN OFFICIAL STOCK EXCHANGE LISTING
SHARES
BERMUDA ISLANDS - - ESPRIT HOLDINGS LTD
FIRST PACIFIC CO LTD
CAYMAN ISL4NDS - - NORSTAR FOUNDERS GROUP LTD OIN JIA YUAN MEDIA SERVICES CO XlNYl GLASS HOLDING CO LTD
CHINA
AIR CHINA LTD
BANK OF COMMUNICATIONS CO LTD CHINA COMMUNICATIONS CONSTR-H- CHINA CONSTRUCTION BANK CORP CHINA LIFE INSURANCE CO LTD-H- CHINA MENGNIU DAIRY CO LTO CHINA PETROLEUM 8. CHEM CORP -H- CHINA SHENHUA ENERGY CO -H- CHINA SHIPPING DEVELOPMENT -H- CHINA TELECOM CORP LTD - H- DATANG INT POWER GENERATION-H- JlANGXl COPPER CO LTD -H-
NINE DRAGONS PAPER HLDGS LTD PETROCHINA CO LTD !-H-
PlCC PROPERTY & CASUALTY -H- ZlJlN MINING GROUP -H-
HONG KONG
BANK OF EAST ASIA LTD
BElJlNG ENTERPRISES HLD
CHEUNG KONG HOLDINGS
CHINA MERCHANTS HOLDINGS CHINA MOBILE LTD
750,500
3 528.000
7,992,000
7.940 000
4 852,000
5.614 000
5 262.000
1,5Y2,000
16.024,OOO
3 064.000
735 000
6,784.000
1.565.500
1.860.000
6,788,000
4.566 000
1,197.000
2,777,000
7.712,OOO
4.260.000
3.570 000
697 400
702.000
894.000
394,000
2.314 500
HKD 8,801.790 144
HKD 2.157.964 0 35
10 959.754 1 79
-.
-
HKD 3,579409 058
HKD 2,143,832 0 35
HKD 2,390393 039
8113,634 132 -
-
HKD 3 886.489 0.63
HKO 5.406.973 0.88
HKD 1,919.030 0.31
HKD 9.165 714 1.50
HKD 8,802.234 144
HKD 2 102.097 0.34
HKD 5.738 192 0.94
HKD 3786.192 062
HKD 2.837 115 0.46
HKD 3.335.499 0 54
HKD 4323.699 071
HKD 1.44Y 016 0.24
HKD 5,792.303 095
HKD 9.148.178 1.49
HKD 2442.167 040
HKD 2,078,5a3 0.34 ~~
72,213481 11.79 ~.
HKD 4.056 053 0.66
HKD 1787,631 029
HKD 11.314 142 1.85
HKD 1 fi58.746 027
HKD 21,043,069 344
- Description Quantity Currency
~- CHINA OVERSEAS LAND AND 3,670 500 HKD INVESTMENT CHINA RESOURCES 1,334,000 HKD ENTERPRISE LTD ClTlC INTL FIN HLD 2 642.000 HKD
ClTlC PACIFIC LTD 486000 HKD
CNOOC LTD 4519.000 HKD
COSCO PACIFIC LTD 960,000 HKD
DAH SING BANKING GROUP 879200 HKD LTD GREAT EAGLE HOLDINGS LTD 1 610.604 HKD
HONGKONG & CHINA GAS
HONGKONG LAND HLDS LTD
HONGKONG+SHANGH.HOTELS
HUTCHISON WHAMP
IND & COM BOC -H-
KINGBOARD CHEMICALS HOLDINGS MASS TRANSIT RAILWAY CORP NEW WORLD DEVELOPMENT CO. LTD SHANGHAI INDUSTRIAL HOLDINGS SUN HUNG KAI PROPERTIES LTD WING HANG BANK
INDONESIA
BANK NIAGA TBK -A.
PT ASTRA INTERNATIONAL TBK PT BANK MANDlRl PERSERO TBK TELKOM INDONESIA /S-B.
UNITED TRACTORS
hlALAYSlA - COMMERCE ASSET-HOLDING BHD'FOR REG GAMUDA BHDFOR REG
GENTING BERHADjFOR REG
PHILIPPINES ~.
AYALA LAND INC.
METROPOLITAN BANK & TRUST PHLLONG DISTANCELSADR (IACT) UNIVERSAL ROBINA CORP
SINGAPORE
ALLGREEN PROPERTIES LTD
BANYAN TREE HOLDINGS LTD
CITY DEVELOPMENTS LTD
INDOFOOD AGRl RESOURCES LTD KEPPEL CORP LTD
OVERSEA-CHINESE BK CORP
SEMBCORP INDUSTRIES LTD
1,249,000
398.000
2.207.343
882 720
14,391,000
885.500
1,499,500
918000
642.000
643,000
70,000
25,457,500
1,771 000
5,509.000
4 484.000
753.500
4 045.800
3243,200
1 181,000
4,000,000
1.607.000
22.700
2.358 179
3.R30.000
6 037.000
129,000
5,292
236 000
1,868.200
904,000
- -- Evaluation
4,612,374
4 455,374
2,288 808
1 797.306
3,961 145
2.378 288
1,966.604
5.461 632
- "lo net
assets
0.75
0.73
0.37
0.29
0 65
0.39
0.32
0.89
-.
HKD 2,790.580 0.46
US0 1.854.680 0 30
HKD 3485,562 0.57
HKD 8,488,672 1.39
HKD 8.065901 132
HKD 3,722,303 0.61
HKD 3.753212 0.61
HKD 2,081.585 0.34
HKD 1,482,038 0.24
HKD 7,438.189 1.21
HKD 861.710 0.14 .-
1 io,sos,604 ia.09 -. .
IDR 2,062821 0 3 4
IDR 2 559.803 0.42
IDR 1.508089 025
IDR 4836.331 078
IDR 610,561 010
11.577 605 1 89 -
~ --
MYR 11,651,452 190
MYR 7,509,591 123
MYR 13,587,500 222
32,748,543 5.35
~~
~. .-
PHP 1.367.190 022
PHP 2.080 563 0.34
US0 1.198.560 0.20
PHP 842,657 0.14
5,488,970 0.90 ~
SGD 4,419,280 0 72
SGD 8717,260 142
SGD 1241 816 0.20
SGD 4.082 000
SGD 2 956.516 048
SGD 11.086146 181
SGD 3.039,85a 050
A . - HSBC Global Investment Funds

Portfolio of Investments and Other Net Assets 3 .~ . ~ . . . . -
Description Quantity Currency Evaluation % net Description Quantity Currency Evaluatian net assets assets
SINGAPORE AIRLINES LTD
SINGAPORE TELELBOARD LOT 1090 UTDOVERSEASBANKILOCAL
WING TAI HLDS
SOUTHKOREA
CHElL INDUSTRIAL INC
DAELIM INDUSTRIAL CO LTD
DAEWOO MOTORS SALES CORP DAlSHlN SECURITIES CO LTD
DONGEU INSURANCE GO LTD
HOTEL SHILLA
HYUNDAI DEPARTMENT STORE CO HYUNDAI ENGINEERING+CONSTR CO KOOKMIN BANK
KOREA INVESTMENT HOLDINGS CO KOREAN AIR
KTB. G CORP
LG CORP
LG PETROCHEMICAL CO LTD
MEGASTUDY CO LTD
NHN CORPORATION
ORION CORPORATION
POSCO
SAMSUNG ELECTRONICS CO LTD SAMSUNG ENGINEERING CO LTD SAMSUNG TECHWIN CO LTD
SHINHAN FINANCIAL GROUP
SHINSEGAE CO LTD
SK CORPORATION
S-OIL CORP
WOORI FINANCE HOLDINGS CO LTD WOORI INVESTMENT&SECURIT CO
233,000 SGD 2.550 226 0.42 FORMOSA CHEMICALS & 2 575.000 TWO 4,943.146 0.81
HON HA1 PRECISION IND !GDR 445 421 US0 5 968.641 0.97
494,000 SGD 6,840 076 1.12 HON HA1 PRECISION IND.CO 1,269284 TWD 8.518.524 1 39
292 197 TWO 3,356.695 0.55
2.360.750 SGD 5 105,503 0.83 F18ER co
2 101.666 SGD 4,406,619 0.72 lCITEDOIATEK lNCORPORATION
73 920
27.333
178 280
i ia,930
170,270
268 670
26.520
101 890
I 78 400
25,670
109,740
144 660
in0.800
63 250
35 649
42.04C
6 248
29,670
57,343
114,600
33 990
11 1,420
5 892
44.590
35,480
90,700
101 760
-
KRW
KRW
KRW
KRW
KRW
KRW
KRW
KRW
KRW
KRW
KRW
KRW
KRW
KRW
KRW
KRW
KRW
KRW
KRW
KRW
KRW
KRW
KRW
KRW
KRW
KRW
KRW
50.367.382
2,966 280
2,617.854
5 628.496
2,774 976
4 832.620
4269,663
2,227,070
5,491 270
16,005,548
1,350,717
4,287.021
9,457 075
3,412,740
1,865.764
6,252 656
6 167,016
1,547 498
12 457.988
34,318,009
7,138.640
1,295 310
6,395.731
3,382 126
4 379.683
2 443,948
2.1 93,421
2 136,375
8.22 -
0.48
0 43
0.92
0.45
0.79
0.70
0 36
0.90
2.61
0.22
0.70
1.54
0.56
0.30
1.02
1.01
0.25
2 03
5.61
117
0.21
1.04
0.55
0 72
0.40
0.36
0.35
.. -
157,295,495 25.68 ~. ~
TAIWAN
ACER INC
ASIA CEMENT CORP
ASUSTEK COMPUTER INC
AU OPTRONICS CORP
CATCHER TECHNOLOGY CO LTD CATHAY FINANCIAL HOLDING
CATHAY FIN HLDiGDR REG-S
CHAhrG HWA COMMERCIAL BANK CHINA STEEL
CHUNGHWA TELECOM CO iSADR FAR EASTERN TEXTILE LTD
FAR EASTONE TELECOM CO LTD FIRST FINANCIAL HOLDING COMP.
301,000
2 507,560
1,003,515
3,926.504
370 213
1 793.992
233,993
3,579,000
5.389 592
125.300
3,769,000
1,786,000
5.087 303
TWD 577820 0.09
TWO 2.425.793 040
TWO 2.366.306 0.39
TWD 5.614 611 0.92
TWO 2 909,896 0.48
TWD 3.725.888 0.61
US0 4.801.630 0.78
TWD 2.158 525 0.35
TWD 6 077.393 0.99
USD 2,498,482 0.41
TWD 3247,308 0.53
TWO 2.030 120 0.33
TWD 3.568 027 0.58
NAN YA PLASTICS CORP. 2.580860 TWD 4837363 0.79
SILICONWARE PRECISION 3.144.000 TWO 5.892.868 0 96 INDUSTR. TAINAN SPINNING CO LTD 3,061,000 TWO 1332,534 022
TAIWAN CEMENT CORP 3,673,712 TWD 3,098,574 0.51
943,000 TWO 1 567,931 0.26 TAIWAN FERTILIZER CO LTD
TAIWAN 481,859 USD 5,204077 0.85
SEMICONDUCT MANUFISADR TAIWAN SEMICONDUCTOR 7,073,476 TWD 14,519.618 2.36 MANUFACT. TRIPOD TECHNOLOGY CO LTD 319.723 TWD 1.314.514 0 21
UNITED MICROELECTRONICS 7,934,731 TWD 4,581.610 0 75
CORP. YANG MlNG MARINE 4,979,000 TWO 3,431 859 0.56
TRANSPORT ~.
110,569,753 1805 ~~
THAILAND
AROMATICS THAILAND 1,970800 THB 2.418 859 039 PUBLICIFOR. BANGKOK BANK PUBLIC /FOR. 1.512.800 THE 4,879.324 0.80 REG ITALIAN-THAI DEV. PUB. ;FOR. 5,432,100 THE 759,737 0.12
REG. THAI AIRWAYS INTL;FOR.REG 2,534,800 THE 3 185,347 0 52
THAI OIL PUBLIC COiFOR.REG. 1 585 700 THB 2,647.747 0.43
13,871 014 2 26
TOTAL SHARES 584.011.235 95.34
INVESTMENT COMPANIES
. -
~. ~
BERMUDA ISLANDS
MACQUARIE INTL 12,068 000 SGD 8,832,283 1.44
INFRASTRUCTURE ~~
TOTAL INVESTMENT COMPANIES 8~32,283 1.44
AN OFFICIAL STOCK EXCHANGE LISTING 592,a43,518 96 78
8,832 283 144 -. -
TOTAL TRANSFERABLE SECURITIES ADMITTED TO
TRANSFERABLESECURITIESTRADEDONANOTHERREGULATEO MARKET
SHARES
CHINA -
GLORIA MAT TECHNOLOGY 1644000 TWO 2494.928 0.41
CORP ~~
2,484,928 0.41
TOTAL SHARES 2,494,928 0.41
TOTAL TRANSFERABLE SECURITIES TRADED ON ANOTHERREGULATEDMARKET 2,494,928 0.41
~~
HSBC Global Investment Funds -

~
Portfolio of Investments and Other Net Assets . ..
- - Description Quantity Currency Evaluatian % net
OTHERTRANSFERABLESECURITES
SHARES
HONG KONG - .~
SWIRE PAC,FIC LTD - A - 481.500
MALAY S IA - .~
ROAD BUILDERS M HLDS BHD 1.441 000
TOTAL SHARES
TOTAL OTHER TRANSFERABLE SECURITIES
TOTAL INVESTMENTS
OTHER NET ASSETS LESS LIABILITIES
TOTALNETASSETS
assets ~
HKD 5,403,606 0.88
5,403.606 0 88
~ .-
~.
MYR 1501,478 0.25
1,501,478 0.25
6,905,084 1.13
. 6,905,084 1.13
602,243,530 98.32
- .
10,284,165. 1.68
612,532,695 100.00
I L- HSBC Global Investment Funds ~ ~
~- r
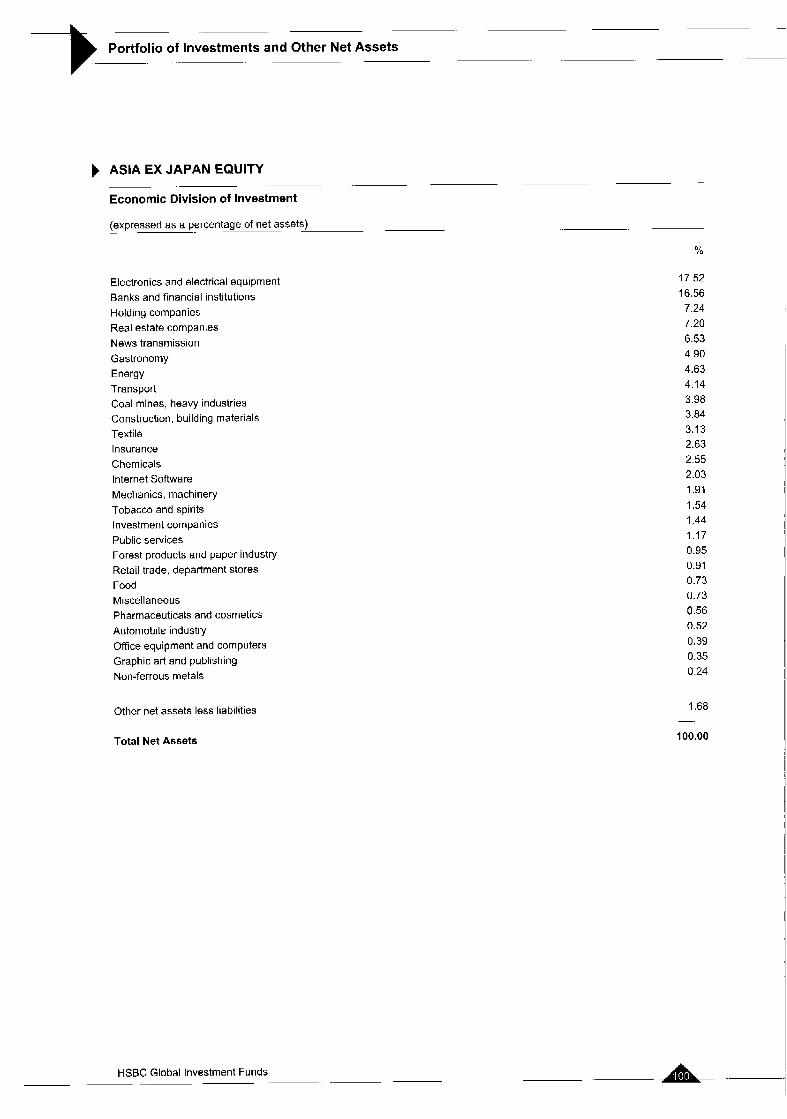
-
Portfolio of Investments and Other Net Assets
ASIA EX JAPAN EQUITY
Economic Division of Investment
(expressed as a percentage of net assets)
-
- -
Yo
Electronics and electrical equipment Banks and financial institutions Holding companies Real estate companies News transmission Gastronomy Energy Transport Coal mines, heavy industries Construction, building materials Textile Insurance Chemicals Internet Software Mechanics, machinery Tobacco and spirits Investment companies Public services Forest products and paper industry Retail trade, department stores Food Miscellaneous Pharmaceuticals and cosmetics Automobile industry Office equipment and computers Graphic art and publishing Non-ferrous metals
Other net assets less liabilities
Total Net Assets
17.52 16.56 7.24 7.20 6.53 4.90 4.63 4.14 3.98 3.84 3.13 2.63 2.55 2.03 1.91 1.54 1.44 1.17 0.95 0.91 0.73 0.73 0.56 0.52 0.39 0.35 0.24
1.68
100.00
-.
1 HSBC Global Investment Funds ~
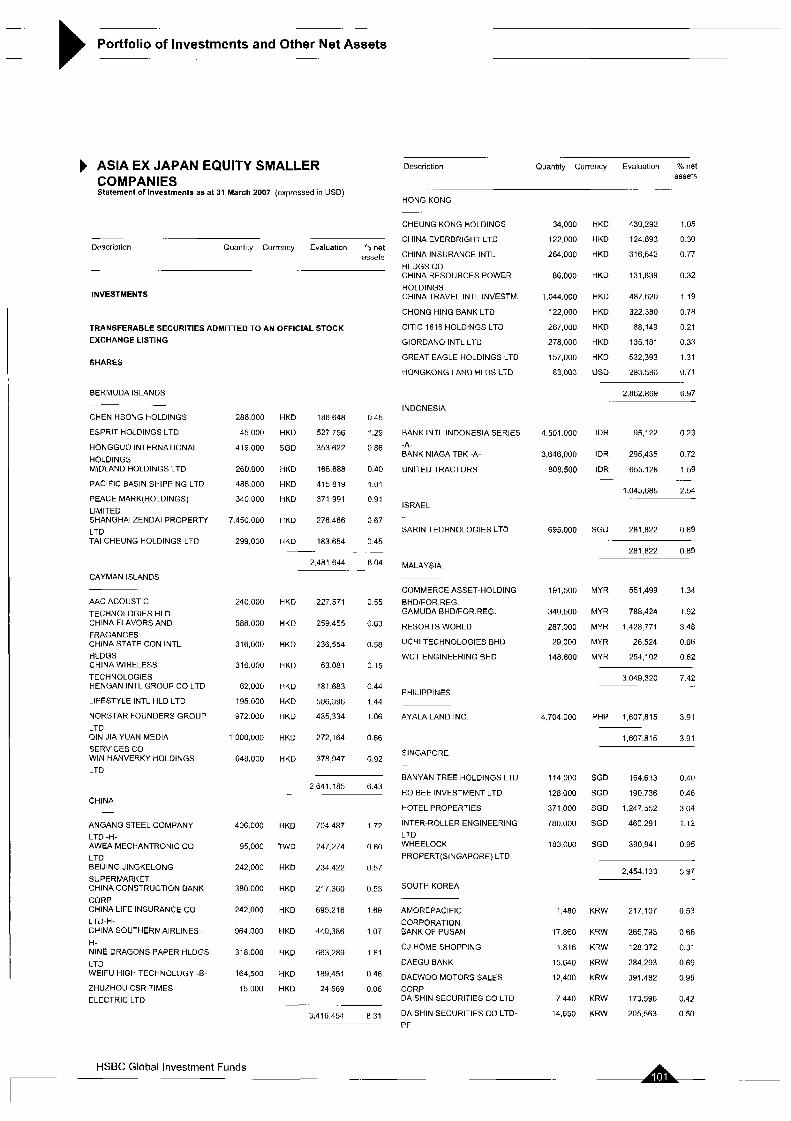
Portfolio of Investments and Other Net Assets
ASIA EX JAPAN EQUITY SMALLER COMPANIES Statement of Investments as at 31 March 2007 (expressed in USD)
Description Quantity Currency Evaluation Yo net assets
HONG KONG _- CHEUNG KONG HOLDINGS
CHINA EVERBRIGHT LTD
CHINA INSURANCE INTL HLDGS CO CHINA RESOURCES POWER HOLDINGS CHINA TRAVEL INTL INVESTM.
CHONG HlNG BANK LTD
ClTlC 1616 HOLDINGS LTD
GIORDANO INTL LTD
GREAT EAGLE HOLDINGS LTD
HONGKONG LAND HLDS LTD
HKD 430,292 1.05
HKD 124893 0.30
HKD 316,542 0.77
HKD 131,839 0.32
HKD 487.620 1.19
HKD 322.380 078
HKD 88,149 0.21
HKD 135181 0.33
HKD 532.393 1.31
USD 293.580 0.71
34,000
122.000
264,000
86,000
1.044,OOO
122,000
267,000
278.000
157,000
63 000
4.501 000
3,646,000
808.500
695,000
191,500
340 500
287.000
29,000
148 800
4.704 000
114 000
128 000
371 000
780.000
183 000
1,480
17 860
1.816
15,640
12,400
7 440
14,650
-.
Description Quantity Currency Evaluation Ob net assets
.-
INVESTMENTS
TRANSFERABLE SECURITIES ADMITTED TO AN OFFICIAL STOCK EXCHANGE LISTING
SHARES
2,862.869 6.97 BERMUDA ISLANDS - .-
CHEN HSOUG HOLDINGS
ESPRIT HOLDINGS LTD
HONGGUO INTERNATIONAL HOLDINGS MIDLAND HOLDINGS LTD
PACIFIC BP.SIN SHIPPING LTD
PEACE MARK(H0LDINGS) LIMITED SHANGHAI ZENDAI PROPERTY LTD TAI CHEUNG HOLDINGS LTD
INDONESIA ._
BANK INTL INDONESIA SERIES .A- BANK NIAGA TBK -A-
UNITED TRACTORS
286.000 HKD 186.6A8 0.45
45,000 HKD 527,756 1.29
419,000 SGD 353.622 086
260.000 HKD 165.688 0.40
485.000 HKD 415,819 1.01
340000 HKD 371,991 0.91
7.450.000 HKD 276.466 067
299,000 HKD 183.654 0.45
2.481 644 6.04
-. - . -
. -.
IDR 95,122 0.23
IDR 295.435 0.72
IDR 655.128 159
1,045,685 2.54
-
ISRAEL
SARIN TECHNOLOGIES LTD SGD 281.822 069
281 822 069
MALAYSIA CAYMAN ISLANDS
COMMERCE ASSET-HOLDING BHDlFOR.REG. GAMUDA BHD/FOR.REG.
RESORTS WORLD
UCHl TECHNOLOGIES BHD
WCT ENGINEERING BHD
MYR 551.499 134
MYR 788,424 192
MYR 1.428771 348
MYR 26.524 0 0 6
MYR 254,102 062
AAC ACOUSTIC TECHNOLOGIES HLD CHINA FLAVORS AND FRAGANCES CHINA STATE CON INTL HLDGS CHINA WIRELESS TECHNOLOGIES HENGAN INTL GROUP CO LTD
LIFESTYLE INTL HLD LTD
NORSTAR FOUNDERS GROUP
240.000 HKD 227,571 0 5 5
586.000 HKD 259455 0.63
316,000 HKD 236.554 0.58
316.000 HKD 63081 0 15
62000 HKD 181 683 0.44
195000 HKD 586,396 1.44
972000 HKD 435,334 1.06
1008,000 HKD 272,164 066
648.000 HKD 378947 0.92
3,049,320 7.42
PHILIPPINES
AYALA LAND INC PHP 1,607,815 3.91 L I V QIN JIA YUAN MEDIA SERVICES CO WIN HANVERKY HOLDINGS LTD
1,607.815 3.91
SINGAPORE -
BANYAN TREE HOLDINGS LTD
HO BEE INVESTMENT LTD
HOTEL PROPERTIES
INTER-ROLLER ENGINEERING LTD WHEELOCK PROPERT(SINGAP0RE) LTD
SGD 164,613 040
SGD 190.736 046
SGD 1.247 552 3.04
SGD 460291 112
SGD 390.941 095
2 641.185 6.43
CHINA
ANGANG STEEL COMPANY LTD -H- AWEA MECHANTRONIC CO LTD BElJlNG JINGKELONG SUPERMARKET CHINA CONSTRUCTION BANK CORP CHINA LIFE INSURANCE CO LTD-H- CHINA SOUTHERN AIRLINES - H- NINE DRAGONS PAPER HLDGS LTD WEIFU HIGH TECHNOLOGY -E-
ZHUZHOU CSR TIMES ELECTRIC LTD
406 000 HKD 704487 1.72
95,000 TWD 247.274 060
242,000 HKD 234422 0.57
380000 HKD 217360 0.53
242.000 HKD 695,216 169
964.000 HKD 440,386 1.07
318000 HKD 663.289 1.61
164.500 HKD 189,451 046
15.000 HKD 24,569 0.06
-. . .~
3,416.454 8 31
2,454.133 5.97 - ~. SOUTHKOREA
AMOREPACIFIC
CORPORATION BANK OF PUSAN
CJ HOME SHOPPING
DAEGU BANK
DAEWOO MOTORS SALES CORP DAlSHlN SECURITIES CO LTD
DAlSHlN SECURITIES CO LTD- PF
KRW 217.107 0.53
KRW 265,793 0.65
KRW 128372 0.31
KRW 284.293 0.69
KRW 391.482 0.95
KRW 173,596 0.42
KRW 205.563 0.50
HSBC Global investment Funds -. 7 -

-. . -.
Portfolio of Investments and Other Net Assets - --
__ Description Quantity Currency Evaluation % net
assets -
INVESTMENT COMPANIES
~ . -
Description Quantity Currency Evaluation % net assets
- - . -
DONGBU INSURANCE CO LTD
HANA TOUR SERVICE INC
HOTEL SHILLA
HYUNDAI DEPARTMENT STORE CO HYUNDAI MlPO DOCKYARD CO LTD KOREA INVESTMENT HOLDINGS CO MEGASTUDY CO LTD
MODETOUR NETWORK INC
ORION CORPORATION
SAMSUNG ENGINEERING GO LTD SAMSUNG TECHWIN CO LTO
WOONG JIN COWAY CO LTD
11,400
3,073
37,890
4,530
2,610
7 380
4,263
16.589
1,212
17.240
5,200
7.400
293,760
141,730
20,955
375,000
219.918
27 547
83.000
316.700
122.000
92.694
136,200
264.000
262,695
143,000
556,000
196,370
43.000
479 192
97,553
501 000
175.200
818.500
226 200
3.04i.aoo
77,200
75 900
KRW 323,556 0.79
KRW 237.808 0.58
KRW 602,142 1.47
KRW 380.416 0.93
KRW 481,384 1.17
KRW 388.325 0.95
KRW 747,708 1.82
KRW 703,601 1.71
KRW 300,187 0.73
KRW 1,073,910 2.61
KRW 198,164 0.48
KRW 207,668 0.51
BERMUDA ISLANDS ~. -
MACQUARIE INTL 1,533,000 SGD 1,121,966 2.73 INFRASTRUCTURE
1,121,966 2 7 3
1,121,980 2.73 TOTAL INVESTMENT COMPANIES
TOTAL TRANSFERABLE SECURITIES ADMITTED TO AN OFFICIAL STOCK EXCHANGE LISTING
TRANSFERABLESECURITIESTRADEDONANOTHERREGULATED MARKET
SHARES
34,887,275 84.eo ~.
CHINA 7,311.055 1780
TAIWAN GLORIA MAT.TECHNOLOGY 248.000 TWD 376364 0.92 CORP
376,364 0.92
SOUTH KOREA
ASIA CEMENT CORP
AU OPTSONICS CORP
CATCHER TECHNOLOGY CO LTD CHUNG HWA PULP CORP
FAREASTERNDEPARTMENT STORES FORMOSA INTL HOTELS CORP
GEM TEK TECHNOLOGY CO LTD GOLDSUN DEVPT 8 CONSTRUCTION G-SHANK ENTERPRISE CO LTD HON HA1 PRECISION IND.CO LTD HOTA INDUSTRIAL MANUFACTURING SHlHLlN ELEC.&ENGINEERING CORP SILICONWARE PRECISION INDUSTR. SINCERE NAVIGATION CORP
TAINAN SPINNING CO LTD
TAIWAN CEMENT CORP
TAIWAN FERTILIZER CO LTD
TAIWAN SEMICONDUCTOR MANUFACT. TRIPOD TECHNOLOGY CO LTD
YANG hllNG MARINE TRANSPORT
TWD
TWO
TWD
TWD
TWO
TWO
TWD
TWO
TWO
TWO
TWO
TWD
TWO
TWO
TWD
TWD
TWO
TWD
TWO
TWO
0 69
0 49
0 40
0 40
0 36
0 75
0.50
0 40
0.59
1.51
0.48
0 64
1 20
0.50
0 55
0 40
0.17
2.38
0 98
0.84
284.181
202.663
164,708
163.814
146,596
306,461
205 752
164.676
241,207
622.096
196,815
260.978
492,375
203.399
242,041
165,627
71,456
983,630
401,081
345.323
JVM CO LTD 4.888 KRW 245.768 0.60
245.768 0.60
-
TAIWAN
INTL GAMES SYSTEM CO LTD 14,000 TWD 136,281 0.33
136,281 0.33
TOTAL SHARES 750.413 1.85
TOTAL TRANSFERABLE SECURITIES TRADED ON
~-
-
ANOTHERREGULATEDMARKET
OTHER TRANSFERABLE SECURITES
SHARES
758.413 1.85
HONG KONG
SWIRE PACIFIC LTD .A- 26,000 HKD 291 784 0.71
291,784 0.71
291.704 0.71
~. -
~
TOTAL SHARES
TOTAL OTHER TRANSFERABLE SECURITIES
TOTAL INVESTMENTS
291,704 0.71 35,931,472 07.46
OTHER NET ASSETS LESS LIABILITIES 5,150,669 12.54 5,864 919 14 27
~ -~ THAILAND
TOTALNETASSETS 41,088,141 100.00
AROMATICS THAILAND PUBLICIFOR. ASIAN PROPERTY DVPT P /FOR. REG. BANGKOK EXPRESSWAY /FOR.REG. QUALITY HOUSES PUBLIC /FOR.REG THAI AIRWAYS INTL/FOR.REG
UNlVANlCH PALM OIL PUBL.CO/FOR
THB 215,032 053
THB 103,262 025
THE 149,143 036
THB 107,659 0 2 6
THE 96,404 0.23
THE 76.908 0 15
~ .~
748.408 182
33,765,309 82 17 . -
TOTAL SHARES
A HSBC Global Investment Funds

Portfolio of Investments and Other Net Assets .-. .
ASIA EX JAPAN EQUITY SMALLER COMPANIES
Economic Division of Investment
. (expressed as a percentage of net assets) ~.
Electronics and electrical equipment Gastronomy Real estate companies Mechanics, machinery Banks and financial institutions Transport Construction, building materials Textile Insurance Retail trade, department stores Investment companies Internet Software Holding companies Forest products and paper industry Coal mines, heavy industries Other services Automobile industry Chemicals Consumer goods Clock and watch-making industry Food Precious metals Graphic art and publishing Pharmaceuticals and cosmetics Other business houses News transmission Office equipment and computers Public services Agriculture and fishing
Other net assets less liabilities
Total Net Assets
. . . -
%
13.02 10.67 8.10 7.38 5.86 5.72 4.24 3.66 3.25 3.06 2.73 2.70 2.41 2.01 1.72 1.70 I .59 1.23 1 . O l 0.91 0.73 0.69 0.66 0.63 0.48 0.46 0.33 0.32 0.19
12.54
100.00
- .. &-. HSBC Global Investment Funds
~

- . - - ..
Portfolio of Investments and Other Net Assets . -- - -
ASIA PACIFIC EX JAPAN EQUITY HIGH DIVIDEND Statement of investments as at 31 March 2007 (expressed in USD)
.. ... - Description Quantity Currency Evaluation % net
assets . .
INDONESIA
BANK RAKYAT INDONESIA
PT ASTRA INTERNATIONAL TBK PT BANK MANDlRl PERSERO TBK TELKOM INDONESIA :$-E-
IDR 795,178 0.57
IDR 366409 0.26
IDR 360666 0.25
IDR 689209 0.48
2.21 1 462 1.56
.- ...
I 438.000
253,500
1,317 500
639,000
243,400
201,300
843,400
151,200
12,520
547,000
1.282,OOO
1.368,OOO
35 000
1,178.950
876,750
975 000
432 000
1,415.000
5ia.000
2.510,OOO
236 000
448.650
1 197.000
a59 000
223.000
3,930,000
35.350
87,060
16.630
12.550
38 410
92.810
5.811
5,895
4.248
.. ...
Description Quantity Currency Evaluation "/o net assets
INVESTMENTS
MALAYSIA TRANSFERABLE SECURITIES ADMITTED TO AN OFFICIAL STOCK EXCHANGE LISTING
SHARES
BRITISH AMERICAN TOBACCO
COMMERCE ASSET-HOLDING BHD/FOR.REG. MAXIS COMMUNICATIONS BHD
RESORTS WORLD
MYR 3,240,641 2.28
MYR 579721 0.41
MYR 2 904913 2.04
MYR 752.719 0.53
7.477.994 5 26
.~ .- BERMUDA ISLANDS
ESPRIT HOLDINGS LTD
CHINA
HKD 1,811,961 127 154,500
294 000
3 009.000
562,000
1,272 000
1,314,000
2 484,000
1 784,000
77.000
169.000
251 600
42,000
106.000
367,500
982 ooo 2,233 000
159,000
323,000
379.500
694 000
109 500
190 500
558.500
2,462 500
21 1 600
2,148.000
164.000
143,500
PHILIPPINES
GLOBAL TELECOM INC PHP 319,003 0 22
319 003 0.22 . .-
0.56
0.20
1 26
0.31
1.20
1.33
1 24
1 3 1
0.60
1.16
1.29
0 48
0.68
0.83
1 1 7
2 17
2.36
CHINA COAL ENERGY CO LTD -H- CHINA CONSTRUCTION BANK CORP CHINA SHIPPING DEVELOPMENT -H- DATANG INT.POWER GENERATION-H- JIANGSU EXPRESSWAY CO -H-
MAANSHAN IRON R STEEL CO H PETROCHINA CO LTD ;A-
ZHUZHOU CSR TIMES ELECTRIC LTD
HKD 314 139 0 2 2
HKD 1,721,145 1 2 1
HKD 857,236 0 6 0
HKD 1204,500 0 8 5
HKD 1025683 0.72
HKD 1,630,635 1 15
HKD 2,116,227 1 4 9
HKD 126,121 0 0 9
SINGAPORE
BANYAN TREE HOLDINGS LTD
CHUAN HUP HOLDINGS LTD
COMFORTDELGRO CORPORATION LTD KEPPEL CORP. LTD
MOBILEONE LTD
PARKWAY HOLDINGS LTD
SINGAPORE AIRPORT TERMIN.SERV SINGAPORE EXCHANGE LTD
SINGAPORE FOOD
INDUSTRIES SINGAPORE PETROLEUM CO LTD SINGAPORE POST LTD
SINGAPORE PRESS HOLDINGS LTD SINGAPORE TELECiBOARD LOT 1000 SMRT CORPORATION LTD SMRT UNISTEEL TECHNOLOGY LTD
UTDOVERSEASBANKILOCAL
YELLOW PAGES (SINGAPORE) LTD
sGD 789,853
SGD 287.397
SGD 1794956
SGD 438466
SGD 1,702,371
SGD 1,896.113
SGD 1767,877
SGD 1865,691
SGD 849009
SGD 1,653,065
SGD 1837009
SGD 684,667
SGD 970.278
SGD 1175,967
SGD 1665,157
SGD 3,087 727
SGD 3.342.697
HONG KONG
ASM PACIFIC TECHNOLOGY LTD BANK OF EAST ASIA LTD
HKD 996,955
HKD 1,463.296
HKD 36.976
HKD 446262
HKD 3 341.252
HKD 458,661
HKD I 934.485
HKD 588007
HKD 106,638
HKD 2,770.481
HKD 1,940.433
HKD 1.555.338
HKD 1.856319
HKD 2,865,863
HKD 2,331.824
HKD 3,677082
HKD 1,203916
HKD 1,025.171
HKO 1766.505
0 70
1.03
0.03
0.31
2.35
0.32
1.36
0.41
0.07
1 95
1.36
1.09
1.31
2 02
1.64
2.59
0.85
0 72
1.24
CHINA AGRl INDUSTRIES HOLDINGS CHINA MERCHANTS HOLDIhGS CHINA MOBILE LTD
CHINA TRAVEL INTL INVESTM
ClTlC INTL FIN.HLD
ClTlC PACIFIC LTD
ClTlC 1616 HOLDINGS LTD
CLP HOLDINGS LTD
HANG LUNG PROPERTIES LTD
HANG SENG BANK LTD
HONG KONG EXCHANGES & CLEARING HONGKONG ELECTRIC HOLDINGS LTD HOPEVI'ELL HIGHWAY INFRASTR. HSEC HOLDINGS PLC
IND & COM BOC -H-
TELEVISION BROADCASTS LTD WING HANG BANK
SOUTH KOREA
DAEGU BANK
DONGBU INSURANCE CO LTD
KOOKMIN BANK
KOREA ELECTRIC POWER CORP. KT& G CORP
LG PETROCHEMICAL CO LTD
POSCO
SAMSUNG ELECTRONICS CO LTD SK TELECOM CO LTD
KRW 642 568 0.45
KRW 2,470,946 1.74
KRW 1,491.997 1.05
KRW 500,941 0.35
KRW 2,511,035 1 77
KRW 2,737,732 1.93
KRW 2.439.952 1.72
KRW 3,52i,974 247
KRW 864742 0.61
30.365.463 21.35

Portfolio of Investments and Other Net Assets - - . -* .lI
~. ~.
Description
S-OIL COR2
TAIWAN - ACER INC
AU OPTRONICS CORP
CHINA STEEL
CHUNGHWA TELECOM CO LTD
DELTA ELECTRONIC INDUSTRIAL ELAN MICROELECTRONINCS CORP FAR EASTERN TEXTILE LTD
FAR EASTONE TELECOM CO LTD FORMOSA CHEMICALS 8. FIBER CO FU SHENG INDUSTRIAL CO LTD FUBON FINANCIAL HOLDING CO LTD GIANT MANUFACTURE CO LTD
HIGH TECH COMPUTER CORP
HON HA1 PRECISION IND.CO LTD MEDIA TEK INCORPORATION
MEGA FINANCIAL HOLDING COMPANY NAN YA PLASTICS CORP.
PHOENIXTEC POWER
SILICONWARE PRECISION INDUSTR. TAIWAN CEMENT CORP
TAIWAN FERTILIZER CO LTD
TAIWAN MCBILE CORP
TAIWAN SEMICONDUCTOR MANUFACT WISTRON CORP
THAILAND -
BANGKOK EXPRESSWAY /FOR REG KlATNAKlN BANK PUELIC:FOR.REG KRUNG THAI BANK :FOR REG,
THAI PLAST 8 CHEMIC PUB !FOR REG.
TOTAL SHARES
INVESTMENT COMPANIES
BERMUDA ISLANDS -~ -
MACQUARIE INTL INFRASTRUCTURE
HONG KONG - - PROSPERITY REAL EST. INV TRUST THE LINK RElT
Quantity Currency Evaluation Oh net assets
20,690
301.000
641,000
1.591 216
456 120
640 551
2.012 899
415 000
741 000
992 000
~10 ,200
1 528 000
1.132000
45 000
62 000
129.000
1.376 000
1 107.250
1 292 000
309,000
612.000
232,000
987.000
956 749
1 062,423
2 135 300
1 643,700
3 499,000
4 991,900
KRW 1425.177 100
16,613 064 13 09
-
TWO 577.820
TWO 916583
TWO 1,794,281
TWO 883.873
TWD 2,072,001
TWO 2364.098
TWD 357557
TWD 842.284
TWO 1,904 311
TWO 766,660
TWD 1,376,550
TWO 1,755,563
TWO 693.801
TWD 416099
TWD 1.481 924
l W D 898,514
TWO 2.075.343
TWD 1.218624
TWO 579,166
TWO 684877
TWO 365,748
TWO 1.057.757
TWD 1.963.904
TWO 1.612329
28 701.687
0 41
0.64
1.26
0 62
1.46
167
0.25
0 59
1.34
0.55
0.97
1 23
n 49
0.29
1 04
0.83
147
0.86
0 41
0.48
0.27
0 74
1.38
1 1 3 -
20.18 ~
THB 1407,896 0 9 9
THE 1348,639 0 9 5
THE 1208451 0 8 5
THE 2.493466 1 7 5
- 6,458.652 4 54
130,763,272 91 95 -
8.895.000 SGD 6.510.039 4.56
-
6.510.039 4.58 -.
1278,603 HKD 289,599 0 2 0
674.000 HKD 1,621 457 1 14
1911,056 134
~-
-
Description Quantily Currency Evaluation % net assets
THAILAND
CPN RETAIL GROWTH 2905500 THB 812731 0 5 7 PROPERTY FD
812731 0 5 7
TOTAL INVESTMENT COMPANIES 9,233,826 6.49
TOTAL TRANSFERABLE SECURITIES ADMITTED TO AN OFFICIAL STOCK EXCHANGE LISTING 139.997.098 98 44
TOTAL INVESTMENTS 139,997,098
OTHER NET ASSETS LESS LIABILITIES -. 2,211,843 2
TOTALNETASSETS 142.208.941 100.00
HSBC Global Investment Funds r - - ~

-
of Investments and Other Net Assets __
ASIA PACIFIC EX JAPAN EQUITY HIGH DIVIDEND
Economic Division of Investment
(expressed as a percentage of net assets)
~.
~
Yo
Banks and financial institutions Electronics and electrical equipment News transmission Transport Chemicals Investment companies Public services Coal mines, heavy industries Tobacco and spirits Holding companies Energy Graphic art and publishing Textile Insurance Office equipment and computers Real estate companies Gastronomy Mechanics, machinery Photography and optics Food Construction, building materials Other services Automobile industry Internet Software Agriculture and fishing
Other net assets less liabilities
Total Net Assets
18.69 13.05 9.53 8.68 6.76 6.49 5.17 4.35 4.05 3.96 3.65 2.84 2.12 1.74 1.62 1.36 1.09 0.81 0.72 0.60 0.48 0.32 0.26 0.07 0.03
1.56
100.00
-
HSBC Global Investment Funds -

Portfolio of Investments and Other Net Assets t BRAZIL EQUITY Statement of Investments as at 31 March 2007 (expressed in USD)
- ..
Description Quantity Currency Evaluation '/o net assets
.-
INVESTMENTS
TRANSFERABLE SECURITIES ADMITTED TO AN OFFICIAL STOCK EXCHANGE LISTING
SHARES
BERMUDA ISLANDS
DUFRY SOJTH AMERICA LTDA
GP INVESTMENTS LTD !BDR
BRAZIL -
ALL AMERICA LATINA !UNIT
AMBEV CIA DE BEDIDAS 'PREF ANHANGUERA EDUCACIONAL PART BANCO BRADESCO SA 'PREF
BANCO BRADESCO /SADR
BRADESPAR SA BRASIL /PREF BRASIL DlSTR PA0 ,ADR
BRASILAGRO
CIA VALE DO RIO DOCE AlPREF CIA VALE RIO DOCE/SADR(lORDSH) COMPANY SA
C O N T N PhRTlClPACOES SA
CONTAX PARTICIPACOESPFD SHS COSAN SA INDUSTRIA E COMERCIO DATATSUL SA
DIAGNOST DAAMERICASA BRL DURATEX SA (PRIV
EMBRAER EMPR BRASIL AERONAUT EMBRAER PREF/SADR
GERDAU 'PREF
GERDAUSA:SADRPFDSHS
GUARARAPES CONFECCOES SA GVT HOLDING SA
INVESTIMENTOS ITAU !PREF
ITAU HOLDING 'PFD SHS/SADR
ITAU HOLDING SA/PREF
JBS AS
LA FONTE PARTlClPACOESlPREF LOCALIZA RENTA A CAR
LOJAS AMERICANAS SA (PRIV
LOJASRENNERSA
MARCOPOLO POMO iPREF
1 016.200
1,497.200
6.867 799
12 549,382
1,000.000
668.500
1 381.400
116400
100.000
15,900 639 400
2,164 300
2.426 400
2,807.500
9,218 334
1,053.800
2.065 000
738.300
3,415,700 2 253.500
97 500
1,143,050
170,000
100
1441,700
2.394 900
518.000
148 800
10 100,000 2 568,000
a75 700
302,000.000
2.21 2,000
9,094,900
HSBC Global Investment Funds
BRL 17469,906 161 BRL 47.793.593 440
65 263.499 6 01 -
BRL 81.972.312
BRL 6834.075
BRL 11.051.618
BRL 13,715,423
US0 56.554 516
BRL 3430.422
USD 2,935000
BRL 9.762,262
ERL 19,942.963
USD 80.122 386
BRL 25,016.017
BRL 4.136.989
6RL 8829.383
BRL 19.358 563
BRL 22 821.590
6RL 16.210.026
BRL 68619,311
ERL 25,137,265
USD 4372.875
BRL 20,492.806
USD 3,046,400
ERL 4.273
BRL 17,236,092
BRL 13 292.576
US0 18,202,520
BRL 5.234.565
BRL 35,222.733
ERL 1,387494
ERL 26 538,Y56
ERL 18.838 833
BRL 28.987.735
BRL 28,099.067
7.56
0 63
1.02
1 26
9.21
0.32
0.27
0.90
1 84
7.3Y
2 30 0.38
0.81
1.78
2 10
1.49
6.32
2.31
0.40
1 89 0.28
0.00
1.59
1 22 1.68
0.48
3 24
0.13
2.44
1.73 2.67
2 59
-.
Descriptian Ouantity Currency Evaluation % net assets
OBRASCON HUARTE LAIN 1.171 400 BRL 16.685.781 1.54 BRASIL SA ODONTOPREV S.A. 354,300 BRL 7 135,072 0.66 P.ACUCAR-CBD !PREF. 373 724,500 BRL 11,014 027 1 01
PERDIGAO SA 1,684,564 BRL 22,853,594 2.10
PETROLEO BRASlLElRO 577200 BRL 13,069.849 1.20 /PREF.SHS PETROLEO BRASlLElRO 'SADR 696.167 US0 70,535,640 6.50
PROFAMA SA 1.380.400 BRL 23 052.986 2.12
SADIA SA,PREF. 6,374 982 BRL 24,330.067 2.24
SA0 CARLOS 914.400 BRL 7,630,850 0.70 EMPREENDIMENTOS SA0 MARTINHO SA 3,032 300 BRL 40.214.184 3.70
SARAIVA SA LlVRElROS ;PAW 1,735,600 BRL 21,269,606 1.96
SOUZA CRUZ 414,000 BRL 8.439 015 0.78
UNIBANCO !ADR 117,900 US0 10.464.804 0.96
UNIBANCO 65.000 BRL 579,473 0.05 (UNIT(1 UBBPN+IUBHDBNI USlMlNAS /PREF.-A- 20000 BRL 958 789 0.09
975 640,983 89.84
TOTAL SHARES 1,040,904,482 95.85
TOTAL TRANSFERABLE SECURITIES ADMITTED TO
- -. . .-
.. ..
._
AN OFFICIAL STOCK EXCHANGE LISTING
OTHER TRANSFERABLE SECURITES
SHARES
BRAZIL -
GAFISA SA !GDR 144A 50,000
SA0 CARLOS 1 650,000 EMPREENDIMENTOSiGDR
TOTAL SHARES
TOTAL OTHER TRANSFERABLE SECURITIES
TOTAL INVESTMENTS
OTHER NET ASSETS LESS LIABILITIES
TOTALNETASSETS
I,040,904,4SZ 95.85
US0 1288,595 0.12
US0 27.316.443 2.51
28.605 038 2.63 28,605,038 2.63
28,605,038 2.63
1.069.509,520 98-48
~. -
16,488,175 . 1.52
-. 1,086,007,695 100.00
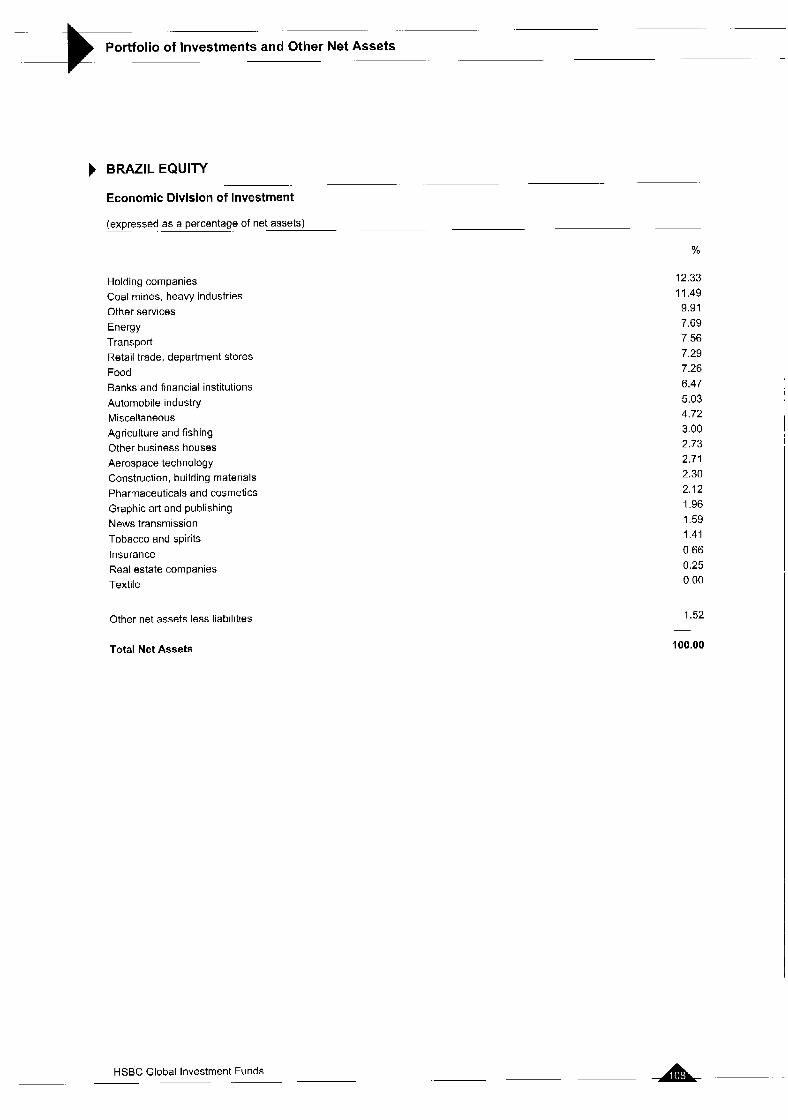
Portfolio of Investments and Other Net Assets -
BRAZIL EQUITY
Economic Division of Investment
~
(expressed as a percentage of net assets) .~
%
Holding companies Coal mines, heavy industries Other services Energy Transport Retail trade, department stores Food Banks and financial institutions Automobile industry Miscellaneous Agriculture and fishing Other business houses Aerospace technology Construction, building materials Pharmaceuticals and cosmetics Graphic art and publishing News transmission Tobacco and spirits Insurance Real estate companies Textile
Other net assets less liabilities
Total Net Assets
12.33 11.49 9.91 7.69 7.56 7.29 7.26 6.47 5.03 4.72 3.00 2.73 2.71 2.30 2.12 1.96 1.59 1.41 0.66 0.25 0.00
1.52
100.00
-
HSBC Global Investment Funds ~ ~.
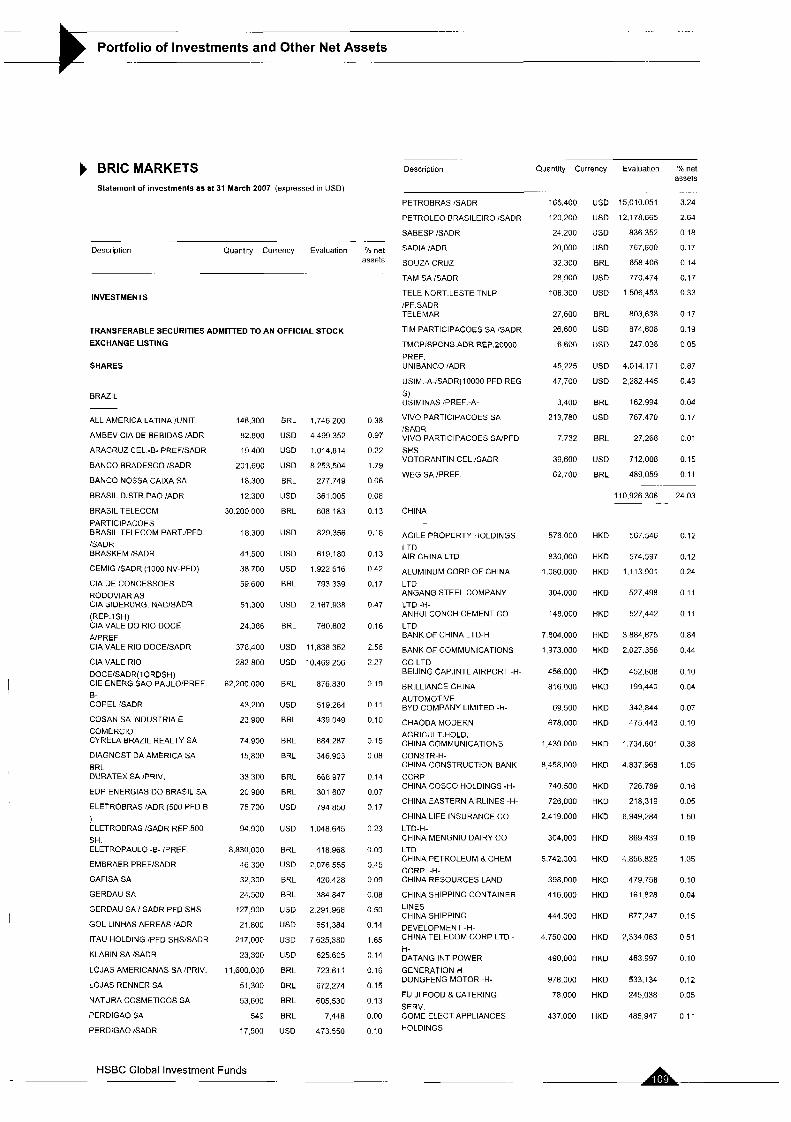
. .
Portfolio of Investments and Other Net Assets .-.
BRlC MARKETS Statement of investments as at 31 March 2007 (expresscd in USD)
Description Quantity Currency Evaluation
INVESTMENTS
TRANSFERABLE SECURITIES ADMITTED TO AN OFFICIAL STOCK EXCHANGE LISTING
SHARES
BRAZIL
ALL AMERICA LATINA /UNIT
AMBEV CIA DE BEBIDAS /ADR
ARACRUZ CEL -E- PREFiSADR
BANCO BRADESCO ISADR
BANCO NOSSA CAIXA SA
BRASIL DISTR.PA0 IADR
BRASIL TELECOM PARTICIPACOES BRASlL TELECOM PART./PFD ISADR BRASKEM EADR
CEMlG ISADR (1000 NV-PFD)
CIA DE CONCESSOES RODOVIAR AS CIA SIDERURG NAClSADR (REP ISH) CIA VALE DO RIO DOCE AlPREF CIA VALE RIO DOCEiSADR
CIA VALE RIO DOCEISADR(1ORDSH) CIE ENERG SA0 PAULO'PREF - B- COPEL 'SADR
COSAN SA NDUSTRIA E COMERCIO CYRELA BRAZIL REALTY SA
DIAGNOST DA AMERICA SA BRL DURATEX SA IPRIV
EDP ENERGIAS DO BRASIL SA
ELETROBRAS 'ADR (500 PFD B
) ELETROBRAS ISADR REP 500 SH ELETROPAULO -6- /PREF
EMBRAER PREF/SADR
GAFISA SA
GERDAU SA
GERDAU SA I SADR PFD SHS
GOL LINHAS AEREAS 'ADR
ITAU HOLDIYG 'PFD SHSiSADR
KLABIN SA ISADR
LOJAS AMERICANAS SA PRIV
LOJASRENNERSA
NATURA COSMETICOS SA
PERDIGAO SA
PERDIGAO 'SADR
146.300
H2 800
19 400
201,600
18.300
12,300
30 200 on0
18,300
41.500
3n 700
59 600
51,300
24.386
378.400
282 800
62,2110.000
43,2(10
23 900
74,900
15,800
33 300
20 900
75,700
94.900
a,a:w,oon 46,300
32,300
24.500
127,9011
21 800
217,000
23,300
11,600 000
51,300
53.600
549
17 500
BRL 1.746200
USD 4.499 352
USD 1,014,814
USD 8253,504
BRL 277.749
US0 361 005
BRL 608183
USD 829356
USD t i iy. ino
USD 1.922616
BRL 793,339
USD 2 i67.9:m
BRL 760.602
US0 11,836 352
USD 10,469,256
BRL 876.830
US0 519264
BRL 43Y,049
BRL 684.287
BRL 346.903
BRL 668977
BRL 301 607
USD 794,850
US0 1048.645
BRL 418968
USD 2076,555
BRL 420.428
BRL 384 847
USD 2291 968
USD 651,384
US0 7625,380
US0 625605
BRL 723611
BRL 672.274
BRL 605.530
BRL 7448
USD 473550
O h net assets
0.38
0.97
0.22
1.79
o n6
0.08
0.13
0.18
0.13
0.42
0.17
0.47
0.16
2.56
2.27
0 19
0.11
0.10
0 15
0 08
0.14
0.07
0.17
0 23
0.OY
0.45
0 09
0.08
0.511
0.14
1.65
0 14
0.16
0.15
0 13
0.00
0.10
.
Descrlpllon Quantity Currencv Evaluation '10 net
PETROBRAS GADR
PETROLEO BRASILEIRO GADR
SABESP 'SADR
SADIA /ADR
SOUZA CRUZ
TAM SA iSADR
TELE NGRT LESTE TNLP IPF SADR TELEMAR
TIM PARTICIPACOES SA (SADR
TMCPiSPGNS ADR REP 20000 PREF UNIBANCO 'ADR
USlM -A-,SADR(10000 PFD REG
USlMlNAS .PREF -A-
VIVO PARTICIPACOES SA ISADR VIVO PARTICIPACOES SA/PFD SHS VOTORANTIN CEL (SADR
WEG SA 'PREF
S )
CHINA
AGILE PROPERTY HOLDINGS LTD AIR CHINA LTD
ALUMINUM CORP OF CHINA LTD ANGANG STEEL COMPANY LTD -H- ANHUI CONCH CEMENT CO LTD BANK OF CHINA LTD-H
BANK OF COMMUNICATIONS CO LTD BEIJING CAP.INTL AIRPORT -H-
BRILLIANCE CHINA AUTOMOTIVE BY0 COMPANY LIMITED -H-
CHAODA MODERN AGRICULT.HOLD. CHINA COMMUNICATIONS CONSTR-H- CHINA CONSTRUCTION BANK CORP CHINA COSCO HOLDINGS -H-
CHINA EASTERN AIRLINES -H-
CHINA LIFE INSURANCE CO LTD-H- CHINA MENGNIU DAIRY CO LTD CHINA PETROLEUM 8 CHEM C O W -H- CHINA RESOURCES LAND
CHINA SHIPPING CONTAINER LINES CHINA SHIPPING DEVELOPMENT -H- CHINA TELECOM CORP LTD - H- DATANG INT POWER GENERATION-H- DONGFENG MOTOR -H-
FU JI FOOD 8 CATERING SERV. GOME ELECT APPLIANCES HOLDINGS
165,400
120,200
24.2011
20,000
32.300
28 900
108 300
27.600
26.600
6.600
45 22s
47 700
3.400
213.780
7.732
39,600
62,700
576 000
830.000
1,080.000
304.000
148,000
7.804.000
1,973.000
456 000
816 aoo
69.500
678.000
1,439 000
8 458.000
740.500
726,000
2,419 000
30A,OOO
s.742.000
3Y8.000
416.000
444.000
4.750.000
490,000
978.000
78,000
437.000
assets
US0 15,010.051 3.24
US0 12.17R665 264
. -
USD 836352 o i a USD 767,800 0 17
BRL 658406 0 14
USD 770,474 0.17
USD 1506,453 033
BRL 803,638 017
USD 874,608 019
USD 247038 005
USD 4,014,171 0.87
USD 2,282.445 0.49
BRL 162.994 on4
US0 767470 0 17
BRL 27.268 001
USD 712.008 0 15
BRL 489.059 0 11
110.926 306 24 03 ~ .- .
HKD 567.546
HKD 574.597
HKD 1.113901
HKD 527.498
HKD 527,442
HKD 3884,675
HKD 2,027358
HKD 452.808
HKD 199,440
HKD 342844
HKD 475443
HKD 1734,601
HKD 4,837968
HKD 726 789
HKD 218,319
HKD 6,949.284
HKD 869439
HKD 4856.825
HKD 479758
HKD 161 828
HKD 677,247
HKD 2,334.063
HKD 463997
HKD 533.134
HKD 245,038
HKD 485,947
0.12
0.12
0 24
0.1 1
0.1 1
0 84
0.44
0.10
0.04
0 07
0.10
0.38
1 05
0.16
0.05
1.50
0 19
1 .os
0 10
0.04
0.15
0.51
0.10
0.12
0.05
0.11
HSBC Global Investment Funds r

..
Portfolio of Investments and Other Net Assets
Description
-.
GUANGSHEN RAILWAY CO LTD -H- GUANGZHOU R t F PROP.-H- /NEW HUADIAN POWER INTL CORP - H- HUANENG POWER INTL H
HUNAN NONFERROUS METALS CORP-H JIANGSU EXPRESSWAY CO -H-
JlANGXl COPPER CO LTD -H
LI NlNG COMPANY LTD
MAANSHAN IRON 8 STEEL CO H NINE DRAGONS PAPER HLDGS LTD PETROCHINA CO LTD '-H-
PlCC PROPERTY & CASUALTY -H- PING Ah INSUR.(GRP)CO -H-
SHANGHAI ELECTRIC GROUP
GO -H- SHANGHAI FORTE LAND CO - H- SHENZHEN EXPRESSWAY H
SHlMAO PROPERTY HLD LTD
SINOFERT HOLDINGS LTD
SINOPEC SHANGHAI PETROCHEM -H- SINOTRANS LTD
TPV TECHNOLOGY LTD
TRAVELSKY TECHNOLOGY LTD -H- TSINGTAO BREWERY CO LTD H WElCHAl POWER CO LTD I-H-
WElPlAO TEXTILE COMPANY
LTD YANZHOU COAL MINING CO - H- ZHEJIANG EXPRESSWAY CO LTD -H- ZlJlN MINING GROUP -H-
ZTE CORP H
FEDERATION OF RUSSIA ~. .-
AFK SISTEMA rSGDR
AKSBEqEGATELNYBANK
SBERBANK COMSTAR ISGDR REP REG S
GAZPROM OAO/SADR
JSC SURGUTNEFTEGAZ ISADR
JSC SUqGUTNEFTEGAZ 'SADR PFD LUKOIL 'SADR
MECHEL OJSC IADR
MMC NORILSK NICKEL ISADR
MOBILE TELESYSTEMS OJSISADR NOVATEK OAO ISGDR
NOVOLIPETSK STEEL GDR
REGS RAO UNIFIED ENER SYS 'GDR
ROSTELECOM ISADR REP.6 SHS SEVERSTALCHEREPOVETS MET'SGDR
Quantity Currency Evaluation 90 net assets
. . ..
586.000
315,800
490 000
1,046,000
466,000
500.400
568 200
274 000
710,000
426,000
6,498 000
828.000
481.500
966.000
532,000
256 000
262.000
504 000
954,000
520.000
39a.000
96.000
154,000
59.000
141 500
670 000
5aa.000
1,370 000
54,800
HKD
HKD
HKD
HKD
HKD
HKD
HKD
HKD
HKD
HKD
HKD
HKD
HKD
HKD
HKD
HKD
HKD
HKD
HKD
HKD
HKD
HKD
HKD
HKD
HKD
HKD
HKD
HKD
HKD -
371,935
703.152
175,567
910 182
309.486
390.602
687,829
542,762
466.083
888,556
7,708,099
474 675
2,359 842
451.188
222.61 1
160,846
518.991
278.613
496 a56
208 274
254.139
169.035
258 945
306,525
204.608
641,304
471.020
797,664
257 356
57.954.532
~.
0 08
0.15
0.04
0.20
0.07
0.08
0.15
0.12
0.10
0.19
1.66
0.10
0.51
0.10
0.05
0.03
0 11
0 06
0.1 1
0.05
0 06
0.04
0.06
0 07
0 04
0.14
0 10
0.17
0.06
12.55
-
66 050
3,378
114,400
564 330
99.950
48.110
189 700
19,000
42,280
136 500
51 gao
82,100
56,190
42 400
137,650
HSBC Global Investment Funds
USD 1892,333
USD 12,110 130
USD 966680
USD 23,849,207
USD 6296850
USD 4068,213
USD 16,446 990
USD 625860
US0 8,012,060
usD 7861 035
USD 3,061 622
USD 2,380,900
USD 7726,125
USD 2229816
USD 1 a99,570
0 41
2 62
0.21
5 17
1 36
0 88
3.56
0 14
1 74
1.70
0 66
0 52
167
0 48
0 41
.. ...
Description
SIBIRTELECOM JSC
TATNEFT EGDR REP.20 SHS REG.S URALSVYAZINFORM /SADR(ZOOACT.) VIMPEL COMMUNICATIONSIS.ADR WIMM-BILL-DANN FODDS 'SADR
HONG KONG ~
BElJlNG ENTERPRISES HLD
CHlNAAGRl INDUSTRIES HOLDINGS CHINA EVERBRIGHT LTD
CHINA MERCHANTS HOLDINGS CHINA MOBILE LTD
CHINA OVERSEAS LAND AND INVESTMENT CHINA RESOURCES ENTERPRISE LTD CHINA RESOURCES POWER
HOLDINGS CHINA TRAVEL INTL INVESTM.
ClTlC PACIFIC LTD
CNOOC LTD
COFCO INTL LTD
COSCO PACIFIC LTD
DENWAY MOTORS LTD
GLOBAL BIO-CHEM
TECHNOLOGY GUANGDONG INVESTMENT LTD GUANGZHOU INVESTMENT CO
LTD HOPSON DEVELOPMENT HLDGS LTD IND & COM BOC -H-
LENOVO GROUP LTD
SEMICONDUC MANUFACT.INTL CORP SHANGHAI INDUSTRIAL HOLDINGS SHENZHEN INVESTMENT LTD
XINAO GAS HOLDINGS LTD
INDIA ~
ABB LTD/DEMAT
ASHOK LEYLAND LTD/DEMAT
ASIAN PAINTS 'DEMAT
ASSOC CEMENT 'DEMAT
BAJAJ AUTO LTD IGDR REG S
BAJAJ HINDUSTHAN LTD
BANK OF BARODA XIEMAT.
BHARAT ELECTRONICS LTD IDEMAT BHARAT FORGE LTD 'DEMAT.
BHARAT PETROL !DEMAT.
CIPLA LTD IDEMAT.
DISH TV INDIA LIMITED
OR REDDY S LAB0RATORIES:ADR GAIL INDIA LTD IGDR REGS
Quantity Currency Evaluation 9t net
- --
3.288.940
45.050
40 100
63.200
15,000
106,000
3ao.000
242 000
357,939
1 706,000
1 194.500
400 000
392,000
1 166.000
376 000
5,190,000
258.000
380.000
1,672 000
702.000
824,000
1,156000
220.000
9,948.000
1.166 000
4,095 000
i7a.000
514 000
214 000
6,000
311,800
17 000
31 000
18.000
56,400
57 900
10 800
68.520
60 300
184.200
83.030
73.400
28 100
assets
USD 416,351 0.09
US0 4 349.487 0.94
US0 521.300 0.11
USD 6.081,736 1.32
USD 1.180.500 0.26
11 1,976.465 24 25
HKD 269.927
HKD 334.549
HKD 2A7.738
HKD 1506,929
HKD 15,510,683
HKD 1,501,016
HKD 1.335.944
HKD 600.939
HKD 544.602
HKD 1,390508
HKD 4,549312
HKD 193.136
HKD 941 406
HKD 729589
HKD 179661
HKD 439,695
HKD 284,019
HKD 552344
HKD 5,575,678
HKD 426729
HKD 565.93A
HKD 410,908
HKD 262,436
HKD 227,290
0.06
0.07
0 05
0.33
3.35
0.33
0 29
0.13
0.12
0 30
0.99
0.04
0.20
0 16
0.04
0.10
0 06
0.12
1.21
0 09
0.12
0.09
0 06
0 05
38.580.972 8.36
INR 489,391 0.11
INR 274.653 0.06
INR 299493 006
INR 528.757 011
US0 1,005,065 0.22
INR 247,626 0.05
INR 285,265 006
INR 365152 0.08
INR 496,467 0.11
INR A22,365 009
INR 998067 0.22
INR 421.721 0.09
US0 1,210.366 0.26
USD 1,039 192 0.23

.-
Portfolio of Investments and Other Net Assets ..
Descriptioi
-
GLAXOSNITHKLINE PHARMA 'DEMAT GRASIM IND /GDR 144A
GUJARAT AMBUJA CEMENTS 'GOR HINDUSTAN PETR :DEMAT
HOUSING DEVT FIN CORP 'ADR IClCl BK 'SADR
INDIABULLS FINANCIAL SERVICES DEMAT INDIABULLS REAL ESTATE :DEMAT. INDIAN HOTELS CO LTD 'DEMAT. INDIAN PETROCHEM ;DEMATERIALISE D INFOSYS -ECHNOL./ SADR
INFRASTRUCTURE DVPT FIN'DEMAT ITC iGDR
JAIPRAKABH ASSOCIATES LTD
JINDAL STEEL & POWER IDEMAT. KOTAK MAHINDRA BANK LTDiDEMAT. LARSEN & TOUBRO /GDR
MAHANAGAR TELE NIGAM iADR MAHINDRA&MAHINDRA!DEMAT
MARUTI UDYOG LTD 'DEMAT
NESTLE INDIA 'DEMAT
RANBAXY LABORAT.'GDR (EQ SHS) RECEIPTS R RELIANCE CAPITAL LTD /DEMAT RELIANCE COMMUNICATI0NS:DEMAl RELIANCE NATURAL RESOURCES: DEMAT SATYAM COMPUTER 'ADR
SIEMENS LTD 'DEMATERIALISED STATE EK OF INDIA :GOR (REGS) SUN PHARMACEUTICAL IND LTD 'DEMAT TATA lROh R STEEL'DEMAT
TATA MOTORS LTD 'ADR
TATA POWER CO 'DEMAT
TATA TEA LTD 1 DEMAT
ULTRA TECH CEMENT LTD :DEMAT UTI BANK LTD 'GDR REGS
VIDESH SANCHAR NlGAMlSADR WIPRO LTD 'SADR
ZEE NEWS LTD 'DEMATERALISED ZEE TELEFILMS LTD !DEMAl
TOTAL SHARES
Quantity Currency Evaluation
12,oou
23.400
322,0flU
16 100
44 600
195.660
91,000
91,000
178,300
63.200
251.400
182,400
686,900
35.200
7.300
67,600
67.500
65 300
83 800
41.100
13.700
86.200
66.290
383,200
129 800
135.400
24 000
12.000
27.800
a2 567
121 650
39 500
22,400
18,400
67.700
15,900
105.000
30 245
144,400
INR 309.007
US0 1,128,682
USD 789 515
INR 90.934
USD 2.999350
USD 7.726613
INR 849 658
INR 637.400
INR 596.696
INR 392,233
US0 12610224
INR 355692
US0 2398.961
INR 433.765
INR 399063
INR 744599
US0 2522.481
USD 434898
INR 1,507,120
INR 782.786
INR 292648
USD 668912
INR 1020.076
INR 3.730 169
INR 66.037
USD 3,100660
INR 602 991
US0 756.000
INR 674935
INR 848865
USD 2051,019
INR 467247
INR 312819
INR 329.207
USD 760,930
US0 292.878
USD 1.683150
INR 27,406
INR 828.518
% net assets
0 07
0.24
0.17
0 02
0 65
1.68
0.18
0.14
0 13
0.08
2 74
0.08
0.52
0.09
0 OY
0.16
0.55
0.09
0.33
0 17
0.06
0.14
0 22
0.82
0 01
0 68
0.13
0.16
0 15
0.18
0 44
0.10
0.07
0 07
0.16
0.06
0 36
0.01
0 18
13.93
-
- 64.308 724
383,748,999 63.12
.. .
Dcscription Quantity Currency Evaluation % net assets
INDEX TRACKER
FRANCE
LYXOR INTL ETF RUSSIA -A- 161,000 EUR 8,686499 188
8,686499 188 - ~
-. __ HONG KONG
-
ISHARE MSCl CHINA TRACKER 1 536 000 HKD 9 984 877 2 16
9,984,877 2 16
UNITED STATES -
ISHARES'MSCI BRAZIL ilNDEX 295,500 USD 14,574.060 3 16 FD
14,574 060 3 16
33.245.436 7.20 ~ . . .-.
TOTAL INDEX TRACKER
WARRANTS I EQUITY LINKED SECURITIES
CAYMAN ISLANDS - -
MSDW ASIA SECURITIES PRODUCTS 04-09 12 07 'ON TATA CONSULTANCY 0 0001 MSDW 05-22 08 08 'ON EHARAT HEAVY 0
41 500 USD 2344.742 051
34.600 USD 1.808 605 039
.
4.153.347 0 90
GREAT BRITAIN
DEUT BK 04-8 10 07 WRT;RELEN 0
HONG KONG
RIGHTS ClTlC PACIFIC 07
INDIA
73.695 USD 833,085 0.18
833.085 0.18
000 0 0 0
000 000
376000 HKD
DEUTSCHE BANK AG 04- 27 08 07 'ON HINDUSTAN LEVER LTD 0.00001 MSDW ASIA 04-10 8 07 !ON HINDUSTAN PETROLEUM 0 0001
446700 USD 2 074.284 045
42.500 US0 240514 0.05
2,314.798 0 50
NETHERLANDS ANTILLES
MERR LYN INTL flfi- 02.05.1 1:WRT HERO 0
46.700 US0 748.960 0 16
UNlTED STATES ~.
MERRILL LYNCH INTL & CO 04- 23.U3.09 ;ON OIL & NATURAL GASCORP 0
748.960 0.16
144.750 US0 2,906,474 0.63
~
2,906474 063
TOTAL WARRANTS I EQUITY LINKED SECURITIES 10,956,664 2.37
HSBC Global Investment Funds r -
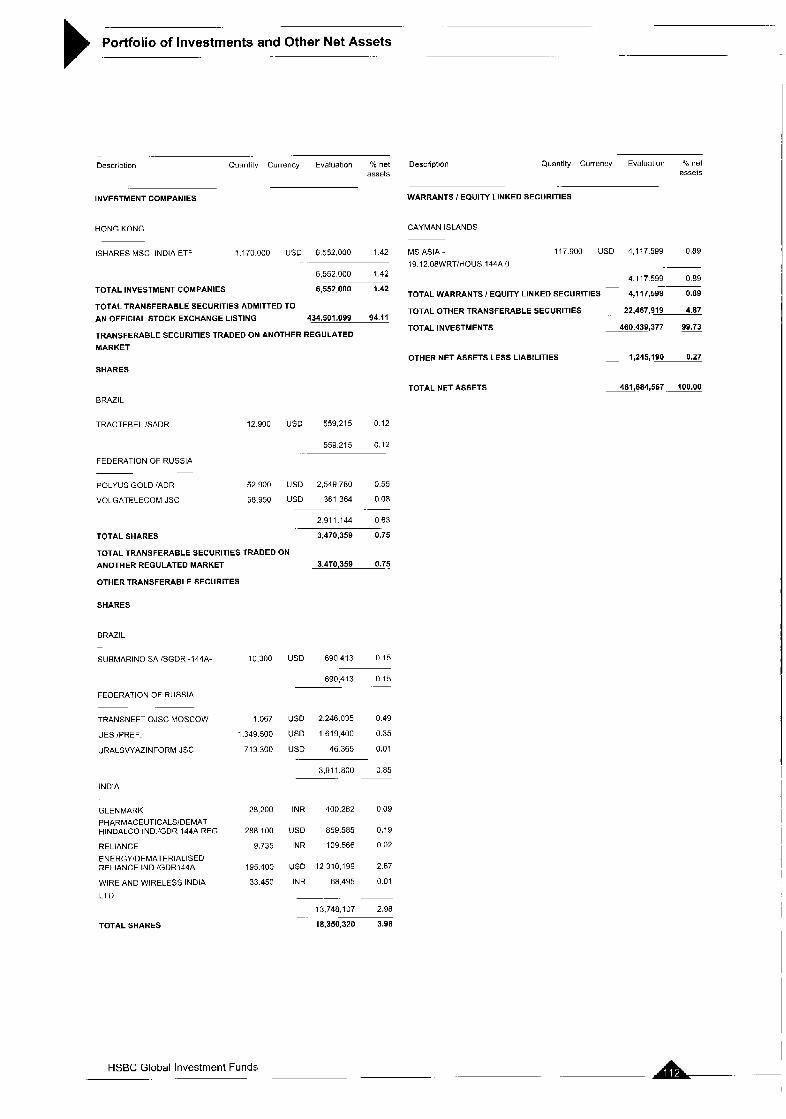
Portfolio of Investments and Other Net Assets 1 b - .- -
Descriptiori Quantity Currency Evaluation Oh net Description Quantity Currerrcy Evaluation "IO nct assets assets
INVESTMENT COMPANIES WARRANTS I EQUITY LINKED SECURITIES
HONG KONG CAYMAN ISLANDS
ISHARES MSCl INDIA ETF 1.170000 USD 6552.000 142
6.552 000 1.42
TOTAL INVESTMENT COMPANIES 6,552,000 1.42
TOTAL TRANSFERABLE SECURITIES ADMITTED TO AN OFFICIAL STOCK EXCHANGE LISTING 434.501.099 94.11
TRANSFERABLE SECURITIES TRADED ON ANOTHER REGULATED MARKET
SHARES
117900 USD 4117599 089 MS ASIA - 19 12 08WRTjHOUS 144A 0
4117599 0 8 9
TOTAL WARRANTS I EQUITY LINKED SECURITIES 4,117,599 0.89
TOTAL OTHER TRANSFERABLE SECURITIES 22,467,919 4.67
TOTALINVESTMENTS 460,439,377 99.73
- -~
OTHER NET ASSETS LESS LIABILITIES 1,245,190 0.27 -
TOTALNETASSETS BRAZIL
TRACTEBEL !SADR 12,900 USD 559.215 0.12
559215 0.12
FEDERATION OF RUSSIA -
POLYUS GOLD 'ADR 52900 US0 2,549,780 055
VOLGATELECOM JSC 58.950 USD 361 364 0 0 8
2911 144 0 6 3
TOTAL SHARES 3,470,359 0.75
TOTAL TRANSFERABLE SECURITIES TRADED ON
~. .~
ANOTHERREGULATEDMARKET
OTHER TRANSFERABLE SECURITES
SHARES
BRAZIL -
SUBMARINO SA lSGDR -144A- 1U,300
. 3.470.359 0.75
USD 690,413 0.15
FEDERATION OF RUSSIA ~
TRANSNEFT OJSC Moscow 1,067
UES jPREF 1 349 500
URALSVYAZINFORM JSC 713 300
690,413 0.15 .-
US0 2.246 035 0.49
US0 1619,400 0.35
USD 46365 0.01
3,911.80U 0 85 ~. .~
INDIA
GLENMARK 28,200
PHARMACEUTICALSOEMAT HINDALCO IND :GDR 144A REG 288 100
RELIANCE 9.735
ENERGYOEMATERIALISED RELIANCE IND 'GDR144A 195.400
WIRE AND WIRELESS INDIA 33.450
LTD
TOTAL SHARES
INR 400,262 0 0 9
US0 859.585 0.19
INR 109566 0 0 2
US0 12,310,199 2.67
INR 68.495 0 0 1
.~
13.748 107 2.98
18.350.320 3.98 -.
461,684,567 100.00 ~
L- HSBC Global Investment Funds
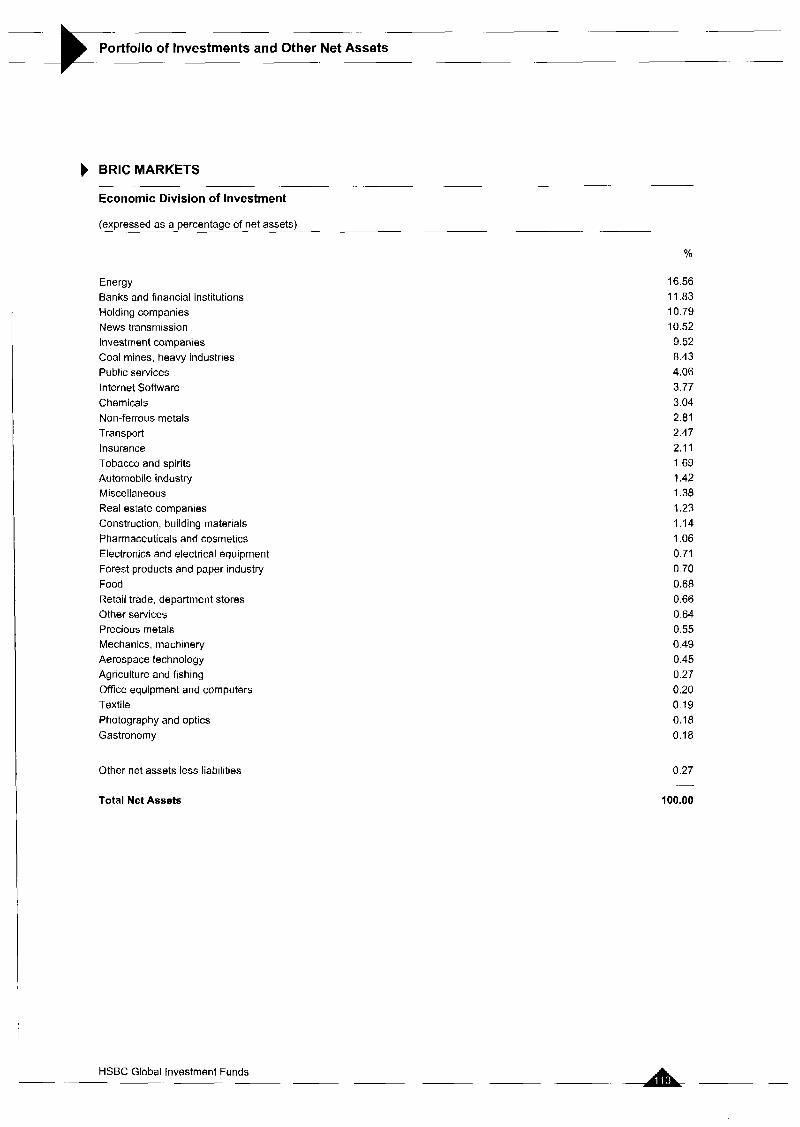
Portfolio of Investments and Other Net Assets :E- BRlC MARKETS
Economic Division of Investment - .~ .
. .- (expressed as a percentage of net assets) -.
Energy Banks and financial institutions Holding companies News transmission Investment companies Coal mines, heavy industries Public services Internet Software Chemicals Non-ferrous metals Transport Insurance Tobacco and spirits Automobile industry Miscellaneous Real estate companies Construction, building materials Pharmaceuticals and cosmetics Electronics and electrical equipment Forest products and paper industry Food Retail trade, department stores Other services Precious metals Mechanics, machinery Aerospace technology Agriculture and fishing Office equipment and computers Textile Photography and optics Gastronomy
Other net assets less liabilities
Total Net Assets
16.56 11.83 10.79 10.52 9.52 8.43 4.06 3.77 3.04 2.81 2.47 2.1 1 1.69 1.42 1.38 1.23 1.14 1.06 0.71 0.70 0.68 0.66 0.64 0.55 0.49 0.45 0.27 0.20 0.19 0.18 0.18
0.27
100.00
.-
HSBC Global Investment Funds -
~~

Portfolio of Investments and Other Net Assets -
ERIC MARKETS EQUITY Statement of investments as at 31 March 2007 (expressed in USD)
-. .. .
Deacrlption Quantity Currency Evaluation
INVESTMENTS
TRANSFERABLE SECURITIES ADMITTED TO AN OFFICIAL STOCK EXCHANGE LISTING
SHARES
BRAflL
ALL AMERICA LATINA /UNIT
AMBEV CIA DE BEDIDAS lPREF ARACRUZ CELULOSE B PREF.NOM. BANCO BRADESCO SA /PREF.
BRASIL TELECOM PARTICIPPREF CIA DE CONCESSOES RODOVIARIAS CIA ENERGET.MIN.GERAISIPRIV, CIA VALE DO RIO DOCE AiPREF CIE ENERG SA0 PAULOlPREF - B- COSAN SA INDUSTRIA E COMERCIO CYRELA BRAZIL REALTY SA
ELETROB EL BRASIL lPREF B
ELETROBRASCENTRELETRB RAS EMERAER EMPR BRASIL AERONAUT GERDAU IPREF
GOL LINHAS AEREAS INTELIGENTES ITAU HOLDING SA lPREF
KLABIN RIOCELL SA jPREF
LOJAS AMERICANAS SA PR lV
LOJAS RENNER SA
NATURA COSMETICOS SA
PETROBRAS PETR BRASILEIRO SA PETROLEO BRASILEIRO /PREF SHS SABESP CIA SANEAMBASESTADO SADIA SNPREF
SI0 NACIONAL
SUEMARINO SA
TAM SA
TELEMAR
TEMARjPREF
TIM PARTICIPACOES SA/PREF
UNIBANCO IUNIT(1 UBBPN+l UBHDBN) USlMlNAS lPREF -A-
VALE RIO DOCE lNAM
VIVO PARTICIPACOES SA'PFD SHS
135 000
6,854,000
141 400
267.600
70,816 900
6.300
30,846,700
269,000
64.120 100
3 800
71 700
36,942,600
43,226,700
136 600
88.800
19,100
114.800
188.000
9 270.400
50 aoo 105.000
317,000
436.800
5,827,300
150,000
35 200
16.500
23 500
21.500
79 000
195 858.522
316,100
32,000
189 500
161.300
BRL 1611.326
BRL 3,732,514
BRL 737594
BRL 5,490,273
BRL 642.114
BRL 83,860
BRL 1,543,168
BRL 8390,141
BRL 903898
BRL 69.807
BRL 655.051
BRL 801,309
ERL 973285
BRL 1.523.741
BRL 1.592.022
BRL 570,401
BRL 4038,495
BRL 517117
BRL 578290
BRL 665722
BRL 1.186.207
BRL 8,020.364
BRL 9,890.696
BRL 812169
BRL 572,474
BRL 1.486 045
BRL 557.510
BRL 626 774
BRL 626,023
BRL 1103.958
BRL 646.480
BRL 2,818.022
BRL 1.534.063
BRL 7008,862
BRL 568.856
- % net
assets -
0.53
1.22
0.24
1.80
0.21
0.03
0.51
2.75
0.30
0.02
0 21
0.26
0 32
0.50
0 52
0.19
1.32
0.17
0 19
0.22
0 39
2.63
3 24
0.27
0.19
0.49
0.18
0.21
0.21
0.36
0 21
0.92
0 50
2.30
0 19
Description
. -
VOTORANTIM iPREF.
Quantity Currency Evaluation % net assets
28,200 BRL 509,869 0 1 7
73,088,500 23.97
-. ~
-. ~
_ _ ~ CHINA
AGILE PROPERTY HOLDINGS LTD AIR CHINA LTD
ALUMINUM CORP OF CHINA LTD ANGANG STEEL COMPANY LTD -H- ANHUl CONCH CEMENT CO LTD BANK OF CHINA LTD-H
BANK OF COMMUNICATIONS CO LTD BElJlNG CAPJNTL AIRPORT -H-
CHAODA MODERN AGRICULT.HOLD. CHINA COMMUNICATIONS CONSTR-H- CHINA CONSTRUCTION BANK CORP CHINA COSCO HOLDINGS -H-
CHINA LIFE INSURANCE CO LTD-H- CHINA MENGNIU DAIRY CO LTD CHINA PETROLEUM & CHEM CORP -H- CHINA RESOURCES LAND
CHINA SHIPPING DEVELOPMENT -H- CHINA TELECOM CORP LTD - H- DATANG INT POWER GENERATION-H- DONGFENG MOTOR -H-
GOME ELECT APPLIANCES HOLDINGS GUANGZHOU RBF PROP.-H- /NEW HUANENG POWER INTL H
JlANGXl COPPER CO LTD -H-
LI NlNG COMPANY LTD
MAANSHAN IRON 8. STEEL CO H NINE DRAGONS PAPER HLDGS LTD PETROCHINA CO LTD I-H-
PlCC PROPERTY 8 CASUALTY -H- PING AN INSUR.(GRP)CO -H-
SHANGHAI ELECTRIC GROUP CO -H- SHIMAO PROPERTY HLD LTD
SINOPEC SHANGHAI PETROCHEM -H- ZHEJIANG EXPRESSWAY CO LTD -H- ZlJlN MINING GROUP -H-
FEDERATION OF RUSSIA -
AFK SISTEMA ISGDR
GAZPROM OAOiSAOR
JSC SURGUTNEFTEGAZ 6ADR
LUKOIL ISADR
MMC NORILSK NICKEL /SADR
426,000
756,000
758 000
234.000
114 000
5,127.000
1.318,OOO
462,000
668 000
1,064,000
5.537 000
E85 000
1.578.000
274.000
3,880,000
298,000
400,000
3.066 000
438.000
754.000
298.000
248.000
812 000
245,000
186,000
476.000
304 000
4,312,000
608,000
320,500
964,000
195.500
634 000
530 000
1.000.000
HKD
HKO
HKD
HKD
H KD
HKD
HKD
HKD
HKD
HKD
HKD
HKD
HKD
HKD
HKD
HKD
HKD
HKD
HKD
HKD
HKD
HKD
HKD
HKD
HKD
HKD
HKD
HKD
HKD
HKD
HKD
HKD
HKD
HKD
HKD -
419.748
523.368
781 794
406 035
406 273
2,552,118
1,354,312
458.766
468.430
1,202,568
3,167 159
672.316
4.533,266
783,639
3,281,867
359,215
61C 132
1,506 576
41L,757
41' 025
33: ,378
552.190
706,566
296.582
368.444
312,473
634.087
5,115.009
348,553
1,570,777
450,254
387.263
330,196
424.559
582.236 - .-
0.14
0.17
0.26
0.13
0.13
0.84
0.44
0.15
0.15
0.42
1.04
0.22
1 49
0.26
1.08
0 12
0.20
0.49
0.14
0.13
0.11
0.18
0.23
0.10
0.12
0.10
0.21
1.68
0 11
0.51
0.15
0.13
0 11
0.14
0.19 -.
36 803,931 12 07 ~-
28900 USD 827.985 027
331 500 US0 14.009.555 460
26.300 USD 1,656,900 0 54
70.800 USD 6.138.360 2 02
14.700 US0 2,785 650 0.91
HSBC Global Investment Funds

Portfolio of Investments and Other Net Assets
. . - . - Description Quantily Currency Evaluation % net
assets
MOBILE TELESYSTEMS OJWSADR NOVATEK OAO SGDR
NOVOLIPETSK STEEL GDR REGS RAO UNIFIED ENER.SYS.!GDR
VIMPEL COMMUNICATIONS/S.ADR
HONG KOhG
CHINA MERCHANTS HOLDINGS CHINA MOBILE LTD
CHINA OVERSEAS LAND AND INVESTMENT CHINA RESOURCES ENTERPRISE LTD CHINA RESOURCES POWER HOLDINGS CHINA TRAVEL INTL INVESTM.
ClTlC PACIFIC LTD
CNOOC LTD
COSCO PACIFIC LTD
DENWAY MOTORS LTD
GUANGDONG INVESTMENT LTD GUANGZHOU INVESTMENT CO LTD HOPSON DEVELOPMENT HLDGS LTD IND 8 COM BOC -H-
LENOVO GROUP LTD
SEMIC0NDUC.MANUFACT.lNTL CORP SHANGHAI INDUSTRIAL HOLDINGS
INDIA
BAJAJ AUTO LTD OEMAT
BHARAT HEAVY EL IDEMAT
CIPLA LTD I5EMAT
OR REDDY S LABORATORIES IDEMAT. DR REDDY S LABORATORIESIADR GRASIM INDUST /DEMAT
GUJARAT AMBUJA CEMENT IDEMAT. H D F C BANK IDEMAT.
HERO HONDA MOTORS IDEMAT. HINDALCO INDUSTRIES / DEMAT. HINDUSTAN LEVER LTD !DEMAT. HOUSING DEVTiDEMAT.
IClCl BK /SADR
INDIABULLS FINANCIAL SERVICES /DEMAT. INDIABULLS REAL ESTATE IDEMAT. INDIAN HOTELS CO LTD /DEMAT. INFOSYS TECH LTD /DEMAT
INFOSYS TECHNOL./ SADR
ITC LTD /DEMAT
39.400
18,100
38.200
12,400
19,800
272.000
1.101.500
812.000
282 000
336.000
794 000
290,000
3,515.000
308,000
1 248,000
766,000
466,000
160 000
6 500.000
1.336.000
4,397 000
165.000
12,500
23,600
160 200
58.100
28,300
15 800
280,200
76.300
35.500
242.900
312,100
64,220
102 900
53.000
19.200
149,200
145,800
10,800
430,400
HSBC Global Investment Funds
US0 2,269,046 0 74
USD 1,066,090 0 35
US0 1107.800 036
USD 1,705,000 056
USD 1905.354 062
33,471,740 10 97 -
HKD 1,145,124
HKD 10,014,665
HKD 1,020,364
HKD 941,841
HKD 515,091
HKD 370852
HKD 1.072.466
HKO 3.081 085
HKD 763,034
HKD 544.574
HKD 408745
HKD 114,492
HKD 401 705
HKD 3,643,135
HKD 488.945
HKD 607,670
HKD 380.898
0 38
3.29
0.33
0.31
0.17
0.12
0.35
1.01
0.25
0 18
0.13
0.04
0.13
1.19
0.16
0.20
0 12
--
25,514.686 8 36 -
INR 698,085
INR 1.234.263
INR 868.026
INR 978 188
USD 466,667
INR 763853
INR 690,252
INR 1,697330
INR 569,067
INR 725292
INR 1,449.496
INR 2,248,890
USD 4063,521
INR 494856
INR 134.484
INR 499.310
INR 6,777.632
US0 541.728
INR 1504,133
0 23
0 40
0 28
0 32
0 15
0 25
0 23
0 56
0 19
0 24
0 48
0 74
1 34
0 16
0 04
0 16
2 23
0 18
0 49
Description
KOTAK MAHINDRA BANK LTDIDEMAT.
OEMAT. MAHlNDRA8MAHINDRNDEMAT
LARSEN a TOUBRO LTD I
MARUTI UDYOG LTD IDEMAT.
OlLkNATURAL GASDEMAT
RELIANCE CAPITAL LTD /DEMAT RELIANCE COMMUNICATIONS/DEMAT RELIANCE INDUS !DEMAT
SATYAM COMPUTER rADR
SATYAM COMPUTER SERVICES /DEMAT. SIEMENS LTD /DEMATERIALISED SUN PHARMACEUTICAL IND LTD /DEMAT. TATA CONSULTANCY SERViDEMAT. TATA IRON 8 STEEL!DEMAT
TATA MOTORS LTDIDEMAT
TATA POWER CO iDEMAT.
UTI BANK LTD IDEMAT.
WlPRO LTD :DEMAT
TOTAL SHARES
INDEX TRACKER
UNITED STATES
ISHARESIMSCI BRAZIL /INDEX FD ISHARES/MSCI EMERG.MKT INDX
~
Quantiry Currency Evaluation % net assets
51 ZOO
41 000
55.100
30 900
99,000
46.300
237.400
210.800
14,600
189,700
22,200
28,800
58.000
70.300
75,100
43,500
50,000
67,100
330 580
9.880
TOTAL INDEX TRACKER
WARRANTS / EQUITY LINKED SECURITIES
HONG KONG
INR 563,957
INR 1,535,016
INR 990.958
INR 588,518
INR 1991,509
INR 712,468
INR 2,310,914
INR 6,627.545
USD 334.340
INR 2,039.179
INR 557,767
INR 699,213
INR 1,640,673
INR 722,749
INR 1259.402
INR 514563
INR 562,741
INR 875.466
0.18
0.50
0.32
0.19
0.65
0.23
0.76
2.18
0 11
0.67
0.18
0.23
0.54
0.24
0.41
0.17
0.18
0.29 -. ..
50,932.053 16.70
219,810,910 72.07 _-
USD 16304.206 534
US0 1150,328 038
-
17 454,534 5.72
17.454.534 5.72 - --
CHINA OVS LD 06-18 7.07 WRT 4 5
10,750 HKD 7,112 0.00
- - - 7,112 0.00
- 7,112 0.00
-. 237,272,556 77.79
TOTAL WARRANTS I EQUITY LINKED SECURITIES
TOTAL TRANSFERABLE SECURITIES ADMITTED TO AN OFFICIAL STOCK EXCHANGE LISTING
OTHER TRANSFERABLE SECURITES
SHARES
BRAZIL
B2W COMPANHIA GLOBAL DO VAREJO
0 00 0.00 13500 BRL
- 000 000
-

Portfolio of Investments and Other Net Assets ~
~. - . . . -
Description Quantity Currency Evaluation YO net
INDIA
RELIANCE 57,500 ENERGY/DEMATERIALISED
TOTAL SHARES
TOTAL OTHER TRANSFERABLE SECURITIES
TOTAL INVESTMENTS
OTHER NET ASSETS LESS LIABILITIES
TOTAL NET ASSETS
assets . -
INR 647 152 0.21
~
647,152 021
647,152 0 2 1
647,152 0.21 237,919,708 78.00
67,112,337 22.00
305,032.045 100.00
. - HSBC Global Investment Funds

-
Portfolio of Investments and Other Net Assets -
BRlC MARKETS EQUITY
Economic Division of Investment ~
(expressed as a percentage of net assets) . . -.
Energy Holding companies Banks and financial institutions Coal mines, heavy industries News transmission Investment companies Internet Software Public services Chemicals Transport Insurance Non-ferrous metals Pharmaceuticals and cosmetics Tobacco and spirits Automobile industry Real estate companies Construction, building materials Forest products and paper industry Retail trade, department stores Electronics and electrical equipment Aerospace technology Miscellaneous Food Office equipment and computers Textile Gastronomy Other services Agriculture and fishing Mechanics, machinery
Other net assets less liabilities
12.85 9.20 8.36 7.58 7.35 5.72 4.02 2.63 2.29 2.12 2.1 1 2.02
1.71 1.52 1.11 0.99 0.79 0.71 0.53 0.50 0.50 0.47 0.27 0.20 0.16 0.16 0.15 0.13
1 .a5
22.00
Total Net Assets 100.00
-A- HSBC Global Investment Funds ~ ~
~ -

I Portfolio of Investments and Other Net Assets ._
CHINESE EQUITY Statement of investments as at 31 March 2007 (expressed in USD)
. -
Description Quantity Currency Evaluation % net assets
INVESTMENTS
TRANSFERABLE SECURITIES ADMITTED TO AN OFFICIAL STOCK EXCHANGE LISTING
SHARES
BERMUDA ISLANDS
CHINAYURUN FOOD GROUP LTD
CAYMAN ISLANDS
AJISEN CHINA HOLDINGS LTD
LIFESTYLE INTL HLD LTD
CHINA - AIR CHINA LTD
ALUMINUM CORP OF CHINA LTD BANK OF CHINA LTD-H
BANK OF COMMUNICATIONS CO LTD BElJlNG CAP.INTL AIRPORT -H-
BYD COMPANY LIMITED -H-
CHINA COMMUNICATIONS CONSTR-H- CHINA CONSTRUCTION BANK
CORP CHINA EASTERN AIRLINES -H-
CHINA INTL MARINE -6-
CHINA LIFE INSURANCE CO LTD-H- CHINA MENGNIU DAIRY CO LTD CHINA PETROLEUM & CHEM CORP -H- CHINA RESOURCES LAND
CHINA SHENHUA ENERGY CO -H- CHINA SHIPPING DEVELOPMENT -H- CHINA SOUTHERN AIRLINES -
H- CHINA TELECOM CORP LTD - H- DATANG INT.POWER GENERATION-H- DONGFENG MOTOR -H-
GUANGSHEN RAILWAY CO LTD -H- GUANGZHOU R&F PROP -H- /NEW HARBIN POWER EQUIPMENT CO H HUANENG POWER INTL H
JIANGSU EXPRESSWAY CO -H-
JlANGXl COPPER CO LTD -H-
31,852 000
2.218,OOO
9,184.000
121,324,000
30.000.000
266,000,000
104 600.000
22.010.000
7.000,OOO
18,385,000
267.000.000
ao,ooo.ooo 9,999,987
123,830,000
24,681 000
308 370.000
25 000,000
39,871,500
51 916.000
47.150.000
205,952,000
39 188,000
114,074,000
55 080,000
27,568.000
20.000,000
59.672,OOO
47,172.000
65.585.000
HKD 34685.966 079
__ 34,685.988 0.79
~ -~
HKD 2.015.151 005
HKD 27,617 703 0.63 -
29,632,854 0.68
HKD a3.990,814
HKD 30,941,695
HKD 132.409 469
HKD i o 7 4 8 1 . m
HKD 21,855,944
HKD 34,531.085
HKD 22,161 663
HKD 152 723,754
HKD 24,057 232
HKD 21.920.205
HKD 355.737 a i 0
HKD 70,587,546
HKD 260 832.310
HKD 30,135.522
HKD 96,430.004
HKD 79.189.078
HKD 21,539,604
HKD 101,201,056
HKD 37,108,434
HKD 62,184 776
HKD 34,959.355
HKD 61.382 181
HKD 22 521.864
HKD 51,923,901
HKD 36,821 539
HKD 79 393,229
1.91
0.71
3.02
2.45
0.50
0.79
0.51
3.48
0.55
0.50
8.11
1.61
5.94
0.69
2.20
1 60
0.49
2.31
0 85
1.42
0.80
1.40
0.51
1.18
0.84
181
Quantlty Currency Evaluation % net assets
Description
MAANSHAN IRON 8 STEEL GO H PETROCHINA CO LTD 1-H-
PING AN INSUR.(GRP)CO -H-
SHENZHEN EXPRESSWAY H
WElQlAO TEXTILE COMPANY LTD YANZHOU COAL MINING GO - H- ZlJlN MINING GROUP -H-
ZTE CORP H
81.102 000
274,670,000
25,339,500
21 992,000
11,805.500
30 000,000
78,750.000
6,000,000
HKD $3,239,639 1.21
HKD 325,820,773 7.42
HKD 124,169,427 2.83
HKD 13,817645 0.31
HKD 16,781,474 0.38
HKD 28,715 122 065
HKD 45851,101 104
HKD 28,177,673 0.64
2,670,614,750 60.66
-
HONG KONG
CHINA AGRl INDUSTRIES HOLDINGS CHINA EVERBRIGHT LTD
CHINA MOBILE LTD
CHINA OVERSEAS LAND AND INVESTMENT CHINA POWER INTL DEVELOP LTD CHINA RESOURCES ENTERPRISE LTD CHINA RESOURCES POWER HOLDINGS CHINA TRAVEL INTL INVESTM.
ClTlC 1616 HOLDINGS LTD
CNOOC LTD
COFCO INTL LTD
COSCO PACIFIC LTD
HOPEWELL HOLDINGS
IND & COM BOC -H-
JlAN EPAYMENT SYSTEM LTD
LENOVO GROUP LTO
SEMlCONDUC.MANUFACT.INTL CORP SHANGHAI INDUSTRIAL H 0 L D I N G S SHENZHEN INVESTMENT LTD
TlNGYl HLD CORP.(CAYMAN ISL.)
TOTAL SHARES
19.305 000
30.000.000
45,400,000
103 464,500
44.999.709
45,286,000
27 386.000
100,000 000
9.967.000
219.000,OOO
ia,ooo.ooo 28,010.000
15.600.000
460.176.000
7.800 000
56,000,000
85,000 000
15,284.000
25,444,000
8,204.000
HKD 16 995,974
HKD 30.71 1,360
HKD 412 769,637
HKD 130,014 161
HKD 21 824,119
HKD 151 248,918
HKD 41,962,977
HKD 46706860
HKD 3,297179
HKD 191,965 195
HKD 13.474 609
HKD 69,391 499
HKD 60 685,647
HKD 257,920,512
HKD 1197743
HKD 20,494,714
HKD 11 747,095
HKD 35 282,664
HKD 12,991 105
HKD 7905119
0 39
0 70
9 40
2 96
0 50
3 45
0 96
1 06
0 06
4.37
0.31
1.58
1 38
5.87
0 03
0.47
0 27
0 80
0.30
0 18
1 536.607.087 35 06
4,273,540,678 97.39 . -
TOTAL TRANSFERABLE SECURITIES ADMITTED TO AN OFFICIAL STOCK EXCHANGE LISTING - 4,273,540.679 97.39
TRANSFERABLE SECURITIES TRADED ON ANOTHER REGULATED MARKET
SHARES
CHINA -. -
SHANGHAI ZHENHUA PORT 31,608,468 US0 47,475 919 1 08 MACH -B-
47475919 108
47,475,919 108 -
TOTAL SHARES
TOTAL TRANSFERABLE SECURITIES TRADED ON 47,475319 1.08 ANOTHER REGULATED MARKET
TOTAL INVESTMENTS 4,321 ,016,588 98.47
__
OTHER NET ASSETS LESS LIABILITIES 67,179,119 1.53
HSBC Global Investment Funds

Portfolio of Investments and Other Net Assets -= Description Quantity Currency Evaluation Yo net
assets
TOTALNETASSETS 4,388,195,717 100.00
HSBC Global Investment Funds - . -~ c
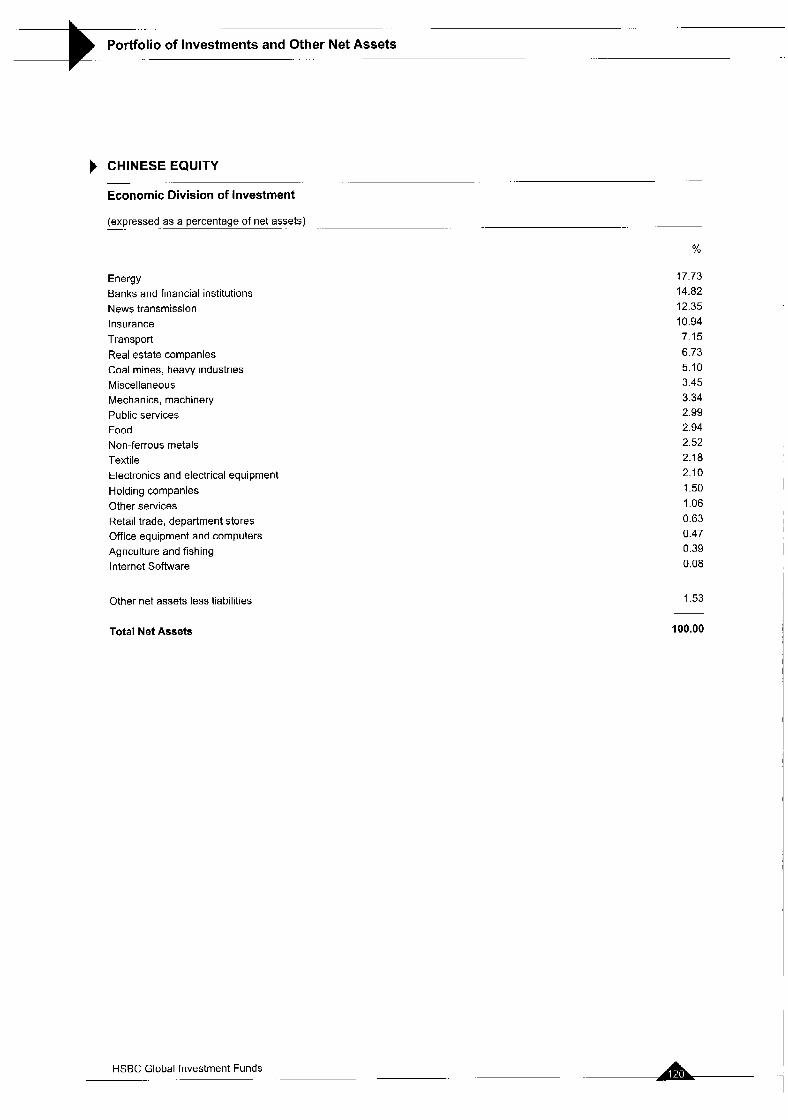
. .
Portfolio of Investments and Other Net Assets - =E .-
CHINESE EQUITY
Economic Division of Investment ~
(expressed as a percentage of net assets) -- .- -.
Energy Banks and financial institutions News transmission Insurance Transport Real estate companies Coal mines: heavy industries Miscellaneous Mechanics, machinery Public services Food Non-ferrous metals Textile Electronics and electrical equipment Holding companies Other services Retail trade, department stores Office equipment and computers Agriculture and fishing Internet Software
Other net assets less liabilities
Total Net Assets
17.73 14.82 12.35 10.94 7.15 6.73 5.10 3.45 3.34 2.99 2.94 2.52 2.18 2.10 1.50 1.06 0.63 0.47 0.39 0.08
1.53
I
100.00
I HSBC Global Investment Funds
~-
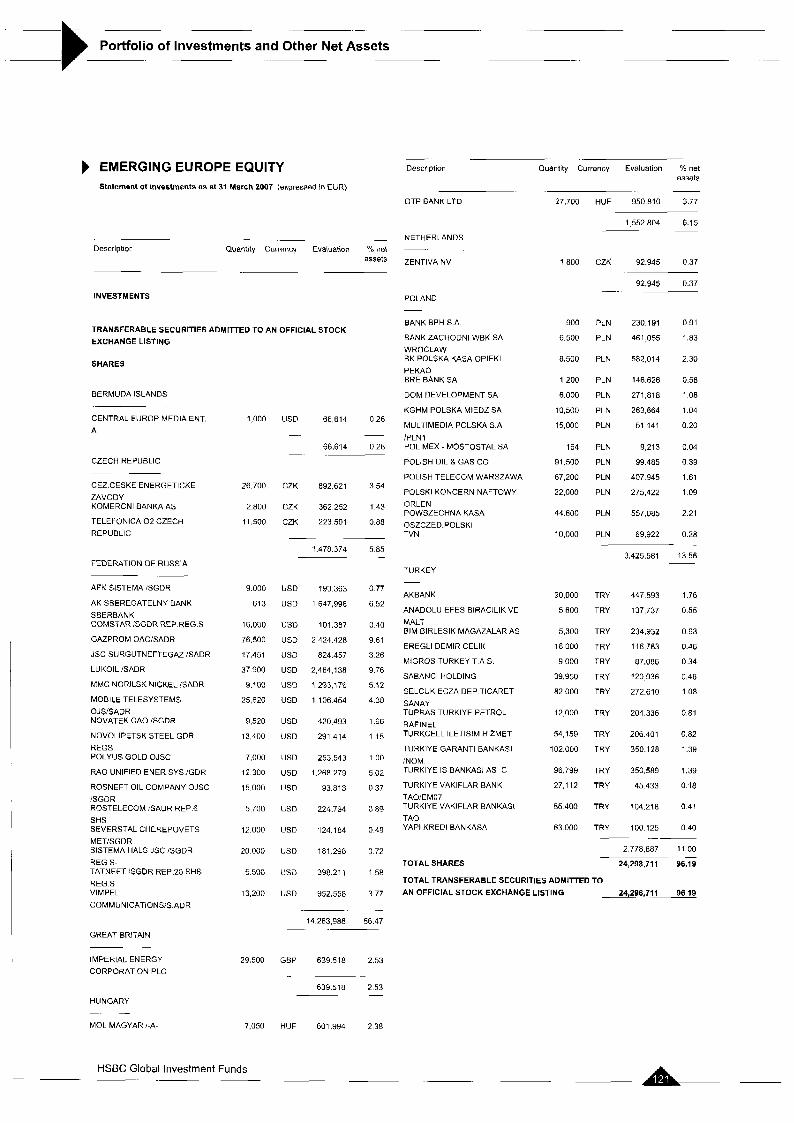
-
Portfolio of Investments and Other Net Assets -
EMERGING EUROPE EQUITY Statement of investments as at 31 March 2007 (expresand in EUR)
- Descriptior Quantity Currency Evaluation O b net
assets ~. . . .
INVESTMENTS
TRANSFERABLE SECURITIES ADMITTED TO AN OFFICIAL STOCK EXCHANGE LISTING
SHARES
BERMUDA ISLANDS
CENTRAL EUROP.MEDIA ENT. A
CZECH REPUBLIC ~~
CEZ.CESKE ENERGETICKE ZAVODY KOMERCNI BANKA AS
TELEFONICA 0 2 CZECH REPUBLIC
FEDERATION OF RUSSIA
AFK SISTEMA 'SGDR
~-
AK SEEREGATELNY BANK SBERBANK COMSTAR SGDR REP REG.5
GAZPROM OAOiSADR
JSC SURGUTNEFTEGAZ /SADR
LUKOIL ISADR
MMC NORILSK NICKEL SADR
MOBILE TELESYSTEMS OJS/SADR NOVATEK OAO /SGDR
NOVOLIPETSK STEEL GDR REGS POLYUS GOLD OJSC
RAO UNIFIED ENER SYS :GDR
ROSNEFT OIL COMPANY OJSC 'SGDR ROSTELECOM (SADR REP 6 SHS SEVERSTALCHEREPOVETS MET/SGDR SISTEMA HALS JSC /SGDR - REG S- TATNEFT 6GDR REP.20 SHS REG S VIMPEL COMMUNIC.4TIONSiS.ADR
GREAT BRITAIN
IMPERIAL ENERGY CORPORAT'ON PLC
HUNGARY -- - MOL MAGYAR /-A-
i ,000
26.700
2 800
11,500
9,000
613
16,000
76.500
17.451
37 900
9,100
25,620
9,520
13 400
7,000
12 300
15,000
5 700
12.000
20 000
5.500
13,200
29,500
7,050
HSBC Global Investment Funds - ~ -- .- ~
US0 66614 026
-
66.614 026 - .
CZK 892.621 354
CZK 362 252 143
CZK 223501 088
- 1.478 374
USD 193363
USD 1647,998
US0 101,387
USD 2424.428
US0 824.457
USD 2,464,138
US0 1.293.176
US0 1,106,454
US0 420.493
US0 291 414
US0 253,543
USD 1.268279
US0 93.813
USD 224.794
USD 124.184
US0 181 298
USD 398.211
USD Y52,558
5.85 -
0.77
6.52
0.40
9.61
3 26
9.76
5 12
4 38
1.66
1 1 5
1 .oo 5 02
0.37
0 89
0 49
0.72
1 58
3.77
.-
_- Description Quantity Currency Evaluation Yo net
assets
OTP BANK LTD
NETHERLANDS
ZENTIVA NV
POLAND
BANK BPH S.A.
BANK ZACHODNI WBK SA WROCLAW BK POLSKA KASA OPlEKl PEKAO ERE BANK SA
DOM DEVELOPMENT SA
KGHM POLSKA MIEDZ SA
MULTIMEDIA POLSKA S.A iPLNl POLIMEX - MOSTOSTAL SA
POLISH OIL & GAS CO
POLISH TELECOM WARSZAWA
POLSKI KONCERN NAFTOWY ORLEN POWSZECHNA KASA 0SZCZED.POLSKI TVN
TURKEY
AKBANK
ANADOLU EFES BlRAClLlK VE MALT BIM BlRLESlK MAGAZALAR AS
EREGLI DEMIR CELIK
MIGROS TURKEY T.A S
SABANCI HOLDING
SELCUK ECZA DEP.TICARET SANAY TUPRAS TURKIYE PETROL RAFINEL TURKCELL ILETlSlM HIZMET
TURKIYE GARANTI BANKASI /NOM TURKIYE IS BANKASI AS C
TURKIYE VAKIFLAR BANK TAOIEM07 TURKIYE VAKIFLAR BANKASI TAO YAP1 KREDI BANKASA
TOTAL SHARES
27.700
1 800
900
6.500
8.500
1,200
6.000
10 500
15,000
164
91.500
67,200
22,000
44.600
10,000
90,000
5,600
5,300
16 000
9,000
39,950
82.000
12,000
54,159
102.000
96.799
27,112
55 400
63 000
HUF 950.810 3.77
1.552.804 6.15 .~
CZK 92.945 0 3 1
92,945 0.37 -.
PLN 230.191 0.91
PLN 461,055 1.83
PLN 582,014 2.30
PLN 146.626 0.58
PLN 271 818 1.08
PLN 263.664 1.04
PLN 51 141 0.20
PLN 9,213 0.04
PLN 99485 0.39
PLN 407945 161
PLN 275,422 1.09
PLN 557085 2.21
PLN 69,922 0.28
3,425.581 13 56
TRY 447.593 1.76
TRY 137,737 0.55
TRY 234,932 0.93
TRY 116,763 0.46
TRY 87.086 0.34
TRY 120936 0.A8
TRY 272.610 1.08
TRY 204336 0.81
TRY 206.401 0.82
TRY 350.128 1.39
TRY 350.589 1.39
TRY 45433 0.18
TRY 104.218 0.41
TRY 100 125 040
2 778,887 11.00
24,298.711 96.19
-
. -
TOTAL TRANSFERABLE SECURITIES ADMITTED TO
AN OFFICIAL STOCK EXCHANGE LISTING 24,298,711 96.19
14263,988 56 47 - .
GBP 639518 2 5 3
.. - ..
639518 2.53 -
HUF 601.Y94 238
A -

Portfolio of Investments and Other Net Assets ~
- Descriptlon Quantity Currency Evaluation % net
assets - - -
TRANSFERABLE SECURITIES TRADED ON ANOTHER REGULATED MARKET
SHARES
VIRGIN ISLANDS - -
CHAGALA GROUP LTO lGDR 29.000 USD 234.871 093
REG S
234871 0.93 __
TOTAL SHARES 234,871 0.93
TOTAL TRANSFERABLE SECURITIES TRADED ON ANOTHERREGULATEDMARKET
OTHER TRANSFERABLE SECURITES
SHARES
FEDERATION OF RUSSIA
KRASNY KOTELSHIK JSC 200.000
TRANSNEFT OJSC MOSCOW 100
~ .~
234,871 ..0.83
US0 129.734 0 5 1
US0 157,855 0.63
TOTAL SHARES
TOTAL OTHER TRANSFERABLE SECURITIES
TOTAL INVESTMENTS
OTHER NET ASSETS LESS LIABILITIES
TOTAL NET ASSETS
287,589 1.14
287.589 1.14 .~
2a7,5ag j . f 4 __ 24.821,171 98.26
439,628 1.14
25,260,799 . 100.00
~
HSBC Global Investment Funds

.. _- -
Portfolio of Investments and Other Net Assets .. . - -_
EMERGING EUROPE EQUITY
Economic Division of Investment . - -
._ . - - (expressed as a percentage of net assets)
%
Banks and financial institutions Energy News transmission Holding companies Public services Non-ferrous metals Miscellaneous Coal mines, heavy industries Real estate companies Precious metals Food Transport Tobacco and spirits Mechanics, machinery Graphic art and publishing Pharmaceuticals and cosmetics Retail trade, department stores Construction, building materials
Other net assets less liabilities
Total Net Assets
25.08 19.64 12.96 11.75 8.56 6.16 5.36 2.10 1.80 1 .oo 0.93 0.63 0.55 0.51 0.48 0.37 0.34 0.04
1.74
100.00 - -
HSBC Global Investment Funds 7-

~
Portfolio of Investments and Other Net Assets ~
EUROLAND EQUITY Statement of investments as at 31 March 2007 (expressed in EUR)
Description Quantity Currency Evaluation 7b net assets
280000 EUR 22,304,800 384
-. .~ -. .
SIEMENS AG INAM.
126.344 450 21.82 -
GREECE
COSMOTE MOBILE TELECOMMUNICAT.
. . . -
Description Quantity Currency Evaluation % net assets
-. . . .~ 430,000 EUR 9,847,000 1.70
. -
9,847.000 1.70 ~. INVESTMENTS
IRELAND
C&C GROUP PLC
SMURFIT KAPPA PLC
TRANSFERABLE SECURITIES ADMITTED TO AN OFFICIAL STOCK EXCHANGE LISTING
SHARES
779904 EUR 8890,906 1.53
443,700 EUR a.208,450 1 42 -.
17,099.356 2 95 ~~
ITALY - ASSlCURAZlONl GENERAL1 SPA AUTOGRILL SPA
CAPlTALlA SPA
SEAT PAGINE GIALLE SPA
UNICREDITO ITALIAN0 SPA
AUSTRIA 360,000 EUR 11,498,400 1.99
848,600 EUR 12202,868 2.11
2,541.000 EUR 17,075,520 2.95
17,492,219 EUR 8 090,151 1.40
2.613.000 EUR 18 500.040 3.19
67.366.979 11.64
.~
. --
OMV AG
WIENER STAEOTISCHE VERSICHER. ZUMTOBEL AG
105.268
105 000
215.000
53 577
603,000
470 000
11 5.000
300.000
1 000,000
5a.000
320.000
440.000
297.201
260,000
260,000
314,000
304.000
11 3.000
552,728
107.000
254 000
360,000
a6.000
200,000
187.000
95.000
43,000
EUR 4973,913 0.86
EUR 5571.300 096
EUR 5.461.000 0 94
16,006,213 2.76
~-
__ BELGIUM -
UMICORE NETHERLANDS
EUR 7,156816 1.24
7 156,816 1.24
. .~ ARCELOR MITTAL N.V CLASS A HEINEKEN NV
ING GROEP NV/ CERT. OF SHS
KONINKLIJKE DSM NV
KONINKLIJKE KPN NV
KONINKLIJKE NUMICO NV
QIAGEN NV
REED ELSEVIER NV
VEDIOR NV
200,000
322,000
481.198
120 000
1754,000
305,800
630.000
1,050.000
335 000
EUR 7900,000
EUR 12,467,840
EUR 15.176985
EUR 4,048.eoo
EUR 20,539,340
EUR 11 813.054
EUR 8,045,100
EUR 13,828,500
EUR 5,607900
1 36
2 15
2.62
0 70
3 55
2 04
1 39
2 39
0 97
17 17
~
-
FINLAND -
NOKIA OY
OK0 OSUUSPANKK. KESKUSPANKKI A STOCKMANN -B-
EUR 10,269,090 I 78
EUR 6.039.500 1.04
EUR 3770.850 065 -
20,079,440 3.47 - - FRANCE
BOUYGUES
BULL ACT NOUV PROV. DE
REGROUP CIE GEN GEOPHYSIQUE ’ VERITAS NEUF CEGETEL
NRJ GROUP
PARROT SA
PEUGEOT SA
SAFRAN SA
SANOFI-AVENTIS
SUEZ
TOTAL SA
VI V E N 0 I
99.427 519 EUR 17.205,OOO 2.97
EUR 5060.000 087
EUR 9,175,020 1.58
EUR 8896,000 154
EUR 5,561,600 0.96
EUR 11,287694 195
EUR 13.585.000 2.35
EUR 4,737 200 0.82
EUR 20 246.720 3.49
EUR 12,114,400 2.09
EUR 5.942.670 1 03
EUR 16.742.131 2.89 . -
130,553,435 22 54
PORTUGAL
MOTA ENGIL SGPS SA 303,200 EUR 1794,944 031
1,794.944 0.31
~.
. - SPAIN
ALTADIS SA/REG 338,000 EUR 16,264560 282
CINTRA 640000 EVA 8921,600 154 CONC INFRAEST TRANSPORT GRIFOLS SA -A- 1 187.000 EUR 14.244.000 246
REPSOL YPF SA MADRID 326,000 EUR 8,192.380 1 41
47,622,540 8.23
-
- SWEDEN
GERMANY -. -
ALLIANZ AG :NAM
BAYER AG
COMMERZBANK AG
OEUTSCHE BOERSE AG /NAM
DEUTSCHE POST AG. BONN
FRESENIUS MEDICAL CARE AG MUENCHENER RUECKVERSICHER INAM. PUMA AG
NORDEA BANK AB 1,133,500 EUR 13,533,990 2 34
13 533,990 2 34 .-
SWITZERLAND
LONZA GROUP AG /NOM 86,000 CHF 6117,119 106 ~~
6117119 106
TOTAL SHARES 562,949,801 97 23
TOTAL TRANSFERABLE SECURITIES ADMITTED TO AN OFFICIAL STOCK EXCHANGE LISTING - 582,949,801 97.23
-
EUR 16,425,570 284
EUR 12,128.500 2.09
EUR 12.006000 207
EUR 14629,460 253
EUR 4.548000 0.79
EUR 20485.a50 354
EUR 12,017,500 2 0 8
EUR 11 798.770 2 04
- ~~ A . - HSBC Global Investment Funds

..
Portfolio of Investments and Other Net Assets - =- ._..
Description Quantity Currency Evalualion Yo nct assets
TOTAL INVESTMENTS 562,949,801 97 23
-
OTHER NET ASSETS LESS LIABILITIES 16,035,160 2 2
TOTAL NET ASSETS 578,984,961 100.00
A L - HSBC Global Investment Funds
~ ~.
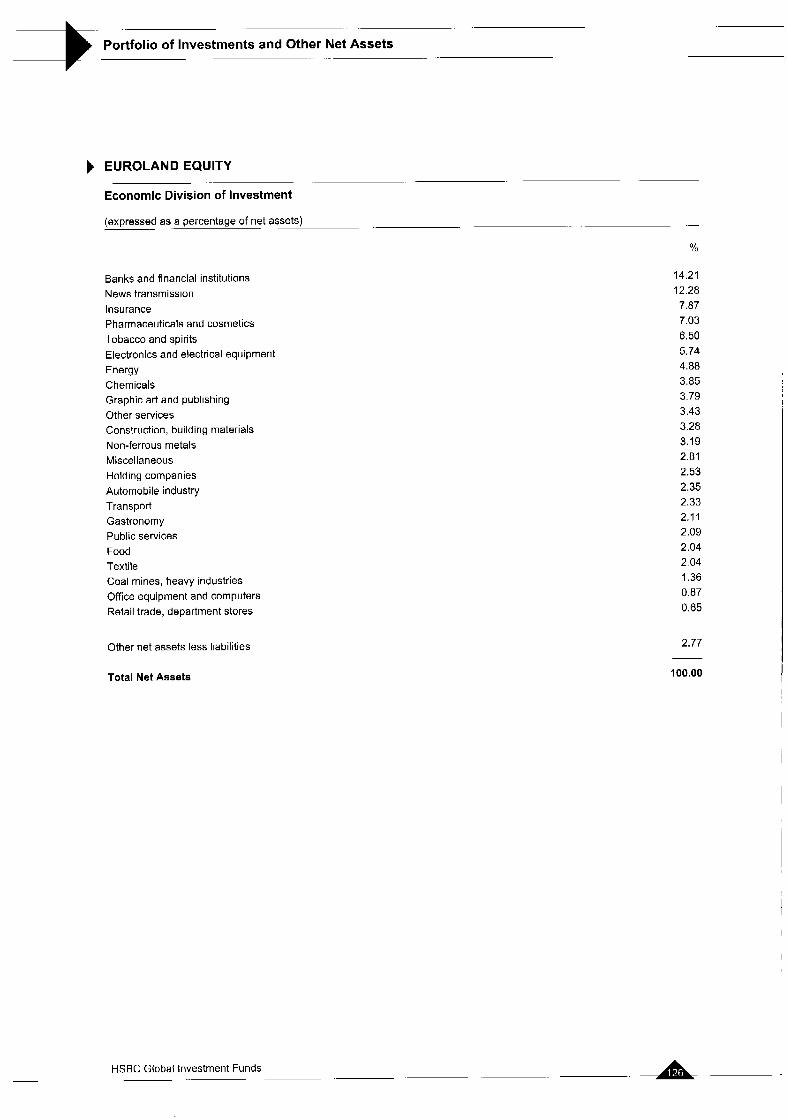
Portfolio of Investments and Other Net Assets . -
EUROLAND EQUITY
Economic Division of Investment
(expressed as a percentage of net assets) ~.
Banks and financial institutions News transmission Insurance Pharmaceuticals and cosmetics Tobacco and spirits Electronics and electrical equipment Energy Chemicals Graphic art and publishing Other services Construction, building materials Non-ferrous metals Miscellaneous Holding companies Automobile industry Transport Gastronomy Public services Food Textile Coal mines, heavy industries Office equipment and computers Retail trade, department stores
Other net assets less liabilities
.-
Yo
14.21 12.28
7.03 6.50 5.74 4.88 3.85 3.79 3.43 3.28 3.19 2.81 2.53 2.35 2.33 2.1 1 2.09 2.04 2.04 1.36 0.87 0.65
7.87
2.77
Total Net Assets 100.00
HSBC Global Investment Funds ~. -

..
Portfolio of Investments and Other Net Assets ~
EUROLAND EQUITY SMALLER COMPANIES Statement of Investments as at 31 March 2007 (expressed in EUR)
. -
Description Quantity Currency Evaluation % net assets
.-
ElLFlNGER BERGER AG
CONERGY AG
DEMAG CRANES AG
DEUTSCHE EUROSHOP /NAMENAKTIE DIC ASSET AG
EPCOS AG. MUENCHEN
ERSOL SOLAR ENERGY AG
IWKA AG
K 8 S A G
MTU AERO ENGINES HLDS INAMEN. OSC AG
SGL CARBON AG
SOFTWARE AG
STADA ARZNEIMITTEL AG
UNITED INTERN.8CO:NAMENSAKT WINCOR NIXDORF AG
20,000
17,600
31,500
26,000
42,052
115.000
15,000
65.000
18 400
36,500
260,000
55 000
24,600
33,000
110,000
24,000
87.000
135,000
130.000
84,000
163,000
500,000
88.366
200,000
600,000
318,000
19,224
65 000
23.500
31.000
20,500
30.000
60,000
300,000
97,970
37,000
90.000
57 000
30.000
80 000
EUR 1358,800 1.31
EUR 978,736 094
EUR 1536,570 148
EUR 1518400 146
EUR 1251,888 121
EUR 1,496 150 144
EUR 826,350 080
EUR 1,524250 147
EUR 1507,880 145
EUR 1624250 156
EUR 1541 800 148
EUR 1,357,950 131
EUR 1586,454 1.53
EUR 1509750 145
EUR 1,542200 148
EUR 1677,361 162
-.
Description Quantity Currency Evaluation YO net assets
INVESTMENTS
TRANSFERABLE SECURITIES ADMITTED TO AN OFFICIAL STOCK EXCHANGE LISTING
SHARES
AUSTRIA - IMMOEAST AG
WIENERBERGER AG
90.000 EUR 997.200 0.96
20,000 EUR 917,600 0.88
1,914.800 1 84
-
24,115,503 23 22 BELGIUM -. -
C.F.E (CIE D ENTREPRISES)
DEVGEN NV ZWIJNAARDE
KINEPOLIS GROUP
TELENET GROUP HOLDING
UMICORE
GREECE 1400 EUR 1,598800 154
48000 EUR 1049760 101
16980 EUR 954785 092
63,000 EUR 1521 450 146
8400 EUR 1.122072 108
6246,867 601
-~
- .
HELLENIC EXCH H CLEAR.SETT REG HELLENIC TECHNODOMI TEV SA;REG METKA SA
EUR 1,513800 1.46
EUR 1466,100 1.41
EUR 1,783 600 1.72
4 763.500 4.59 ~
IRELAND DENMARK
FLSMIDTH 8 CO. AIS B
SYDEANK AIS
MCINERNEY HOLDINGS PLC EUR 1317.120 1.27
1,317120 1 2 1
. .
.-
15,000 DKK 753.019 072
38710 DKK 1,556 191 150
2309.210 222
-
-
ITALY
CEMENTIR CEM DEL TIRRENO SPA C I R CIE INDUSTRIAL1 RlUNlTE
ESPRINET SPA
IGD IMMOB GRANDE DISTR SPA IMMSI SPA TORINO
IMPREGIL0:POST RAGGRUPPAMENTO ITALMOBILIARE SPA jRISP /N- cv MARIELLA BURANI FASHION GR SPA TOD S SPA
VALENTINO FG
FINLAND EUR 1507,750 1.45
EUR 1511,250 1.45
EUR 1,399,717 135
EUR 820.000 0.79
EUR 1443,000 1.39
EUR 1,648 035 1.58
EUR 1,391.241 1.34
EUR 1.461.850 1.41
EUR 1,524.680 1.47
EUR 943,330 0.91
13,650,853 13.14
-
~. .
KCI KONECRANES PLC
OUTKUMPU TECHNOLOGY OYJ RAMIRENT OYJ
WARTSILA CORPORATION
YIT OYJ
66000 EUR 1658.580 1.60
54.000 EUR 1,483,920 143
30,000 EUR 1,781,100 1.70
32.000 EUR 1 470,400 1.42
55000 EUR 1.408550 1.36
7802.550 751
-
- . FRANCE
CIE GEN.GEOPHYSIQUE i VERITAS GEODIS [EX-CALBERSON) SA
GROUPE STERIA VELIZY VILLAC. HAULOTTE GROUP
ILIAD
MAISONS F3ANCE CONFORT
NEXANS PARIS
ORPEA
SOITEC. BERNIN
TELEPERFORMANCE
8,000 EUR 1,265520 122
9500 EUR 1524750 147
31.400 EUR 1498.722 144
NETHERLANDS 35000 EUR
11,000 EUR
25.745 EUR
15.61Y EUR
22,000 EUR
50000 EUR
35.000 EUR -
-
838 Y50
849.420
1.518 698
1534.254
1612,600
885 500
1.144.850
0 E l
0 82
146
148
155
0 85
110
AALBERTS INDUSTRIES
ARCADIS NV
DRAKA HOLDING NV
HAGEMEYER NV (EUR 1.2)
KONINKLIJKE BAM GROEP NV
KON VOPAK NV
ORDINA NV EUR 0.1
SBM OFFSHORE NV
SMlT INTL NV
UNIT 4 AGRESSO NV
EUR 1,515.565 1.46
EUR 1,440,000 1 39
EUR 1638.600 1.58
EUR 1,065,000 1.03
EUR 1.726231 1.65
EUR 1,5A3.640 1.49
EUR 1,588 500 1.53
EUR 1.539.000 1.48
EUR 1.440.000 1.39
EUR 1,466,400 1.41
12.673 264 12.20 -
GERMANY - -
AWD HOLDING AG HANNOVER 36.045 EUR 1.276.714 1.23
HSBC Global Investment Funds

._
Portfolio of Investments and Other Net Assets _-
- . -~ .. .
Ocscription Quarrtlty Currency Evaluation YO net assets
USG PEOPLE NV 50 000 EUR 1,552,000 1.49
16,514,936 15.90 ~. ~
NORWAY
AKER YARDS ASA
PETROLEUM GEO-SERVICES
ASA
120,350 NOK 1.542253 148
85,000 NOK 1,683,628 1.63
- 3,225881 3 11
SPAIN - GRUPO CATALANA OCCIDENTE SA RENTA CORPORACION REAL ESTATE VOCENTO SA’REG
20000 EUR 644400 0.62
40.000 EUR 1.446.000 1.40
75000 EUR 1145.250 1.10
SWITZERLAND
BANK SARASIN & CIE SAiNAM
B- FISCHER GEORG AG/NAM
KOMAX HOLDING AG
PUBLIGROUPE SA INAM.
SULZER AG !NAM (CHFGO)
3,235,650 3 12 ... --
600 CHF 1,625,812 157
3000 CHF 7 608.267 155
15000 CHF 1.625813 156
3.340 CHF 913.263 088
1439 CHF 1.497.663 144
TOTAL SHARES
7.270.812 7 00
105,040,946 101.13 ~. ~
TOTAL TRANSFERABLE SECURITIES ADMITTED TO AN OFFICIAL STOCK EXCHANGE LISTING 105,040,946 101.13
105,040,846 I 0 1 .I 3 TOTAL INVESTMENTS -.
OTHER NET ASSETS LESS LIABILITIES (1,168,911) (1.13)
TOTAL NET ASSETS 103,872.035 100.00
- HSBC Global Investment Funds
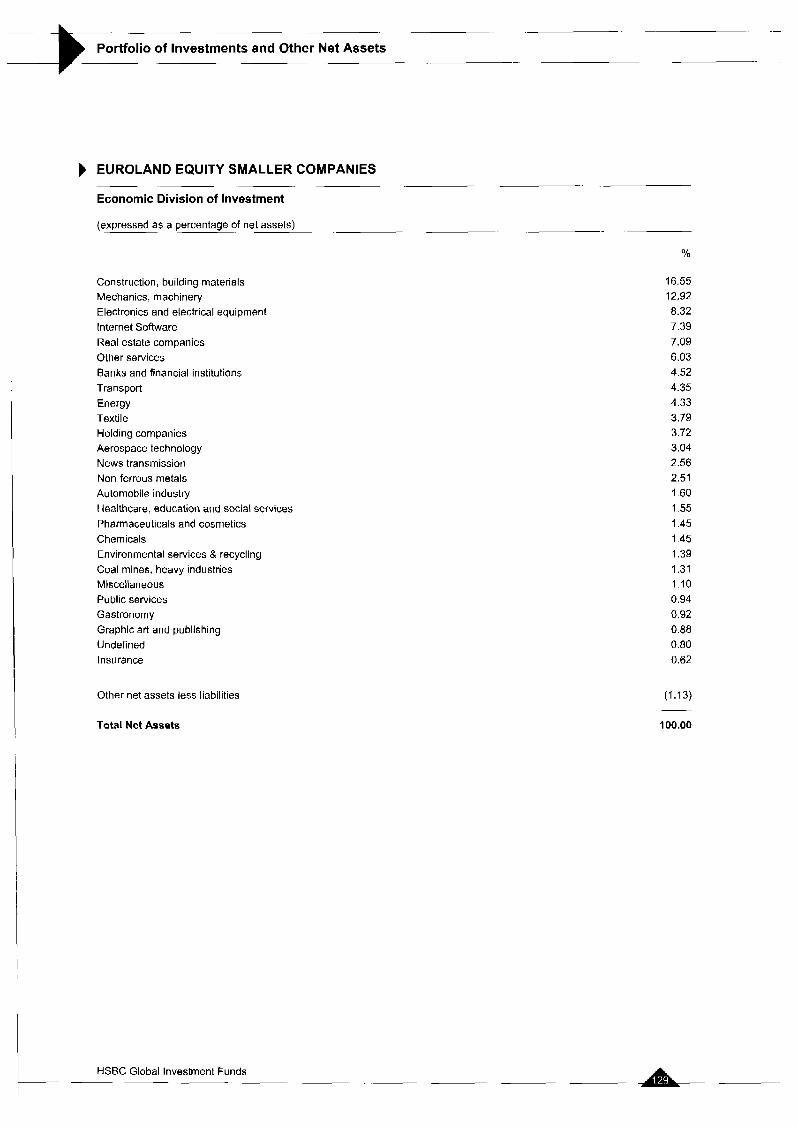
- -
Portfolio of investments and Other Net Assets -.
EUROLAND EQUITY SMALLER COMPANIES
Economic Division of Investment ~.
(expressed as a percentage of net assets)
Total Net Assets 100.00
Construction, building materials Mechanics, machinery Electronics and electrical equipment Internet Software Real estate companies Other services Banks and financial institutions Transport Energy Textile Holding companies Aerospace technology News transmission Non-ferrous metals Automobile industry Healthcare, education and social services Pharmaceuticals and cosmetics Chemicals Environmental services & recycling Coal mines, heavy industries Miscellaneous Public services Gastronomy Graphic art and publishing Undefined Insurance
16.55 12.92 8.32 7.39 7.09 6.03 4.52 4.35 4.33 3.79 3.72 3.04 2.56 2.51 I .60 1.55 1.45 1.45 1.39 1.31 1-10 0.94 0.92 0.88 0.80 0.62
Other net assets less liabilities (1.13)
HSBC Global Investment Funds ~~~~~ ~
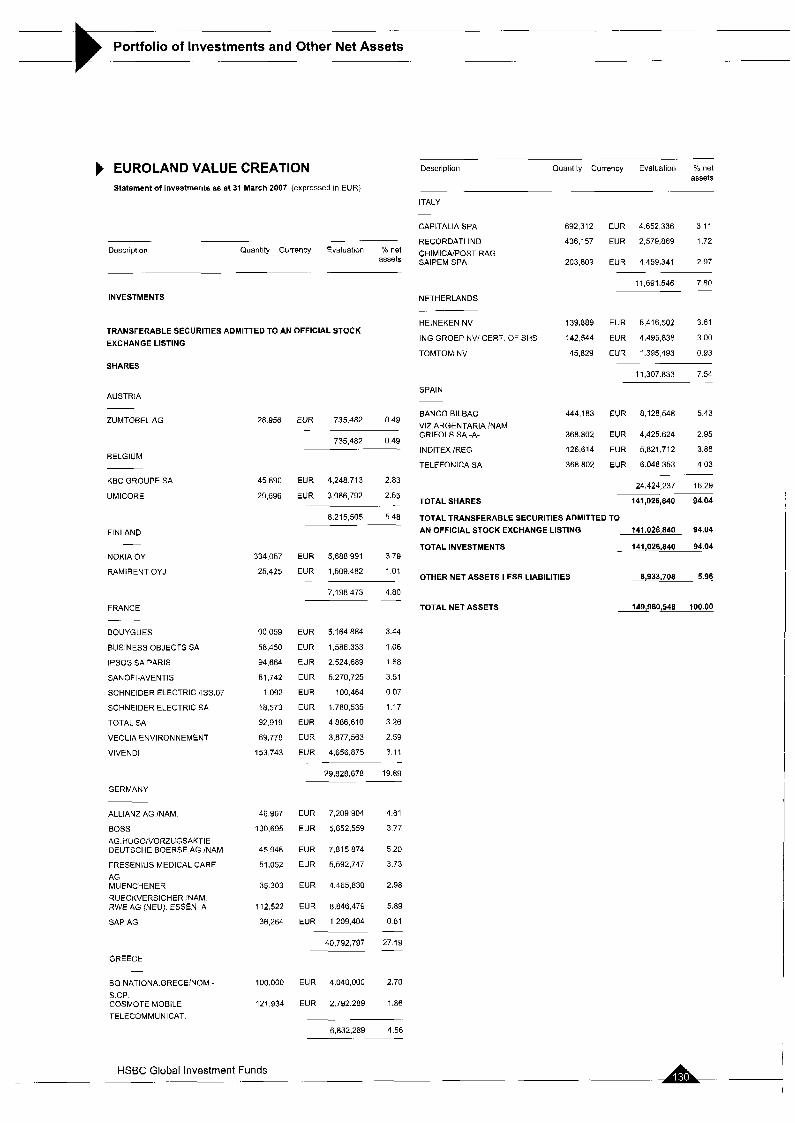
-
Portfolio of Investments and Other Net Assets
EUROLAND VALUE CREATION Statement of investments as at 31 March 2007 (expressed in EUR)
.~
Description Quantity Currency Evaluation % net assets
.~ ~. ITALY -
CAPlTALlA SPA
RECORDATI IND CHIMICA/POST RAG SAIPEM SPA
692,312 EUR 4652,336 3 11
436,157 EUR 2,570,869 1.72
203,809 EUR 4459,341 297
17,691,546 7 80
~. -
-
.~ ~. .
Description Quantity Currency Evaluation % net assets
INVESTMENTS NETHERLANDS - --
HEINEKEN NV
ING GROEP NVI CERT OF SHS
TOMTOM NV
139.889 EUR 5.416.502 361
142,544 EUR 4,495,838 300
45,829 EUR 1,395,493 093
11.307.833 7 54 -
TRANSFERABLE SECURITIES ADMITTED TO AN OFFICIAL STOCK EXCHANGE LISTING
SHARES
SPAIN AUSTRIA
BANCO BILBAO VITARGENTARIA INAM GRIFOLS SA -A-
INDITEX /REG
TELEFONICA SA
ZUMTOBEL AG 444,183 EUR 8.128.548 543
368.802 EUR 4,425624 2 95
126.614 EUR 5,821.712 3.88
368802 EUR 6048353 403
24,424,237 16.29
141,026,840 9A 04 ~~
28,956 EUR 735.482 0 4 9
735,482 049
-
BELGIUM
KBC GROUPE SA
UMICORE
45690 EUR 4,248713 2.83
29,696 EUR 3,966,792 2.65 .- TOTAL SHARES
8.215305 5.48 TOTAL TRANSFERABLE SECURITIES ADMITTED TO 141,026,840 94.04 AN OFFICIAL STOCK EXCHANGE LISTING
TOTAL INVESTMENTS - 141,026.840 94.04
FINLAND
NOKIA OY
RAMIRENT OYJ
334,057 EUR 5,688 991 3.79
25,425 EUR 1,508,482 1 01
7,198,413 4.80
-
.-
OTHER NET ASSETS LESS LIABILITIES .. 8,933,708 5.96
FRANCE - -
BOUYGUES
BUSINESS OBJECTS SA
IPSOS SA PARIS
SANOFI-AVENTIS
SCHNEIDER ELECTRIC ilSS.07
SCHNEIDER ELECTRIC SA
TOTAL SA
VEOLIA ENVIRONNEMENT
VIVENDI
TOTAL NET ASSETS 149,960,548 100.00
90 059
58.450
94,664
81,742
1 092
18,573
92.919
69,178
153.743
EUR
EUR
EUR
EUR
EUR
EUR
EUR
EUR
EUR
-
5.164 884
1,586,333
2524,689
5,270,725
100.464
1.760 535
4 886.610
3377,563
4,656,875
3.44
1 06
1 68
3 51
0 07
117
3 26
2 59
3 11
19 89
-
29,826,678 --
GERMANY
ALLIANZ AG INAM.
BOSS AG.HCIGOiVORZUGSAKTIE DEUTSCHE BOERSE AG iNAM
FRESENIUS MEDICAL CARE AG MUENCHENER RUECKVERSICHER :NAM. RWE AG (NEU). ESSEN A
SAP AG
GREECE
46967 EUR 7,209,904 481
130695 EUR 5,652,559 377
45946 EUR 7815874 520
51,052 EUR 5,592,747 373
35303 EUR 4,465,830 2 9 8
112,522 EUR 8.846479 5.89
36,264 EUR 1209,404 081
40,792,797 27 19
-
__
BQ NATIONA.GRECE!NOM- S.CP. COSMOTE MOBILE TELECOMMUNICAT.
100,000 EUR 4.040000 2.70
121,934 EUR 2.792.289 1.86
-
6,832289 4.56 ~~
I
- HSBC Global Investment Funds

-- -
Portfolio of Investments and Other Net Assets ~~~~ -
EUROLAND VALUE CREATION
Economic Division of Investment -
~~~~
~. (expressed as a percentage of net assets) -~~~
%
Banks and financial institutions News transmission Pharmaceuticals and cosmetics Public services Insurance Textile Energy Holding companies Construction, building materials Tobacco and spirits Other services Electronics and electrical equipment Non-ferrous metals Internet Software Graphic art and publishing
Other net assets less liabilities
Total Net Assets
17.07 12.79 8.96 6.40 7.79 7.65 6.23 5.20 4.45 3.61 2.95 2.66 2.65 1.67 1.68
5.96
100.00
-
HSBC Global Investment Funds - _ _ _ ~ --A- ~ -

~- ~ .~ -
Portfolio of Investments and Other Net Assets ~~
SUSTAINABILITY LEADERS Statement of investments as at 31 March 2007 (expressed in EUR)
Description Qusntity Currency Evaluation “h net assets
- ~ ~ -. ~ .-
INVESTMENTS
TRANSFERABLE SECURITIES ADMITTED TO AN OFFICIAL STOCK EXCHANGE LISTING
SHARES
AUSTRIA
WIENERBERGER AG
BELGIUM -.
DEXIA SA
UMICORE
FINLAND
NOKIA OY
FRANCE - - ACCOR SA
AXA
GROUPE DANONE
L‘ OREAL
MlCHELlN B INOM.
PEUGEOT SA
SAINT-GOBAIN
SANOFI-AVENTIS
SCHNEIDER ELECTRIC IiSS.07
SCHNEIDER ELECTRIC SA
VlNCl
VIVENDI
GERMANY - - ALLIANZ AG /NAM
HENKEL PREF
MUENCHENER RUECKVERSICHER INAM. SCHMACK BIOGAS AG
SOLARWORLD AG BONN
VERB10 VEREINIGTE BIOENERGIE
GREAT BRITAIN ~. -
BARCLAYS PLC
BP PLC
BT GROUP PLC
7.127
25.204
3.194
36,034
9 785
25.682
4.523
7 543
7,460
10.a20
7.770
9.351
339
6,509
6 559
20,159
3,898
5,717
4.624
5.348
5 528
22.000
73,850
77.892
136.190
EUR 326987 I 15
326,987 1.15 .~ ~
EUR 569,106 200
EUR 426655 150
995.761 350
EUR 613.659 2.16
613.659 2.16 -. ~ -
EUR 696,594 245
EUR 809,754 2 8 5
EUR 550766 194
EUR 610,606 2 15
EUR 615450 217
EUR 565,345 199
EUR 565,811 199
EUR 602952 212
EUR 31 188 011
EUR 616,988 217
EUR 759,401 267
EUR 610,616 2 15
7,035,471 24 76 --
EUR 590,362 2.11
EUR 629.842 2.22
EUR 584.936 2.06
EUR 338.154 1.19
EUR 319,408 1.12
EUR 168.080 059
-. - - 2,638.802 9.29 -
GBP 786.353 2.76
GBP 638686 2.25
GBP 610,449 2.15
- ~- ~.
Quantity Currency Evaluation Yo net assets
Descriplion
DIAGEO PLC
HSBC HOLDINGS PLC
IMPERIAL CHEMICAL INDUSTRIES MARKS AND SPENCER
PEARSON PLC
ROYAL BK OF SCOTLAND PLC
ROYAL DUTCH SHELL PLC-A-
SCOTTISH POWER PLC
YELL GROUP PLC
IRELAND - .-
CRH PLC
ITALY
ASM BRESCIA SPA
CAPlTALlA SPA
HERA SPA
NETHERLANDS -. - REED ELSEVIER NV
NORWAY ~
RENEWABLE ENERGY AS
STATOIL ASA
SPAIN
EERO PULEVA SA
ENAGAS
GRUPO FERROVIAL SA FER
SOL MELIA SA
SWEDEN _ - HENNES & MAURITZ AB
SKFAB B
SWITZERLAND - - HOLCIM LTD INAM.
ROCHE HOLDING AG lGENUSSSCHElN UBS AG INAMENSAKTIEN
TOTAL SHARES
40 912
41.095
75,862
53 253
49.884
20,005
21.875
55,507
51.078
19,686
107,023
92,253
170,697
45,854
20 246
18.700
29,905
32.296
10,274
35 963
13,225
28 000
8.283
4,049
13,746
GBP 613554 216
GBP 536,766 1.89
GBP 556,567 196
GEP 532,159 187
GBP 640,185 2.25
GBP 584.717 206
EUR 550,156 194
GBP 654.756 230
GBP 449.534 158
7.153882 25 17 ~-
EUR 626.999 221
626999 221 ~-
EUR 511 570 I 8 0
EUR 619,940 2.18
EUR 543,243 191
1.674.753 5 89
-. -- -
. .- ~
EUR 603.897 2.12
603,897 2.12
~
~ .- -
NOK 348,256 1.23
NOK 384.799 1.35
734055 2.58 -
EUR 525730 185
EUR 617,500 2 1 7
EUR 771.577 272
EUR 647,334 2 2 8
2562,141 902 --
SEK 569.683 2.00
SEK 429,048 1.51
998,731 3.51
~ - .-
--
CHF 618,239 z i a CHF 540.597 190
CHF 615005 2 16
1773,841 6 2 4
27,738,979 97 60
TOTAL TRANSFERABLE SECURITIES ADMITTED TO AN OFFICIAL STOCK EXCHANGE LISTING 2 7 , 7 3 6 , 9 7 9 97.60
TOTAL INVESTMENTS 27,738,979 97.so
680.971 2.40 - - .~ OTHER NET ASSETS LESS LIABILITIES

.. -.
Portfolio of Investments and Other Net Assets -t - -
~ .. - Descripllon Quantity Currency Evaluarlon net
assets
TOTALNETASSETS 28,419,950 100.00
- .
-d HSBC Global Investment Funds r

Portfolio of Investments and Other Net Assets 3 SUSTAINABILITY LEADERS
Economic Division of Investment
(expressed as a percentage of net assets)
%
Construction, building materials Banks and financial institutions Public services Insurance News transmission Graphic art and publishing Energy Holding companies Gastronomy Consumer goods Pharmaceuticals and cosmetics Retail trade, department stores Food Mechanics, machinery Electronics and electrical equipment Tyres and rubber Automobile industry Chemicals Non-ferrous metals Index Options
Other net assets less liabilities
11.77 11.16 10.53 7.02 6.46 5.95 5.54 5.20 4.73 4.37 4.02
3.79 2.70 2.28 2.17 1.99 1.96 1.50 0.59
3.87
2.40
Total Net Assets 100.00
HSBC Global Investment Funds A- . - -

Portfolio of Investments and Other Net Assets ._. -.
EUROPE EX UK EQUITY Statement of Investments as at 31 March 2007 (expressed in EUR)
Description Quantity Currency Evaluation % net assets
LANXESS AG
PORSCHE AG NZ.A. SDV
40,278 EUR 1,544,259 1.77
725 EUR 840,862 0.96
12,185,699 13.96 ~ .. - Description Quantity Currency Evaluation % net
assets GREAT BRITAIN
JAZZTELPLC 616,073 EUR 381.965 044
381.965 044
- .
INVESTMENTS
GREECE . -
BANK OF PIRAEUS
HELLENIC TELECOM
OPAP
TRANSFERABLE SECURITIES ADMITTED TO AN OFFICIAL STOCK EXCHANGE LISTING
SHARES
45,040 EUR 1,170.139 1.34
90,250 EUR 1,833.8ai 2.10
29,723 EUR 856.022 0.98
3.860.042 4.42
-. .
BELGIUM
DEXIA SA
UCB
IRELAND
62,312
20.244
208,047
16,378
49 553
72,461
106,889
26.835
21,955
45.473
9.745
8.749
25.344
40,909
21.476
36,109
57,439
i o 918
16,420
18.205
27.528
13 907
83.305
17.819
30 503
EUR 1,407.005 1 62
EUR 884,460 1.01
2,291.465 2.63 -
BANK OF IRELAND
SMURFIT KAPPA PLC
110.280 EUR 1,761.171 2.01
36.611 EUR 677,304 0.78
2.438.475 2.79 CYPRUS ITALY
MARFIN POPULAR BANK PUBLIC CO
EUR 1.668.537 191
1668.537 1.91 ~ .~
EN1 SPA ROMA
INTESA SANPAOLO SPA
UNICREDITO ITALIAN0 SPA
81.354 EUR i.97364a 2 2 6
227,922 EUR 1,291,178 148
383 042 EUR 2,711.938 3.11 -
5.976764 6 8 5
DENMARK
NOVO NORDISK AiS B
FINLAND
DKK 1,127 772 1.29 NETHERLANDS
.~
ARCELOR MITTAL N.V. CLASS A BUHRMANN NV
KONINKLIJKE NUMICO NV
1,127,772 1.29 -.
36.126 EUR 1,426.977 1.63
88,926 EUR 905,267 i o 4
36,837 EUR 1,423.013 1.63
3,755,257 4.30 - -~
NESTE OIL OYJ
NOKIA OY
EUR 1.285.405 1.48
EUR 1234.011 1.41
2,519,416 2.89 ~ .~ PORTUGAL FRANCE
BCO COMM PORTUG./NAM AXA
BNP PARIBAS
CASINO GUICHARD-PERRACH
CREDIT AGRICOLE SA.
GROUPE DANONE
LAFARGE SA
LEGRAND HOLDING ACT.PROV.OP0 NEUF CEGE-EL
SAINT-GOBAIN
SANOFI-AVENTIS
TOTAL SA
VALLOUREC
VEOLIA ENVIRONNEMENT
803,343 EUR 2.169.026 2.49 EUR 3 370,210 3.87
EUR 2,083.738 2 39
EUR 1,653,212 1.89
EUR 1329,176 1.52
EUR 1,186.649 136
EUR 1,021,446 1.17
EUR 627,771 0.72
EUR 1,137,270 130
EUR 1,563,882 1.79
EUR 2.328.308 2.67
EUR 3,020,717 346
EUR 2,143 203 2.46
EUR 912,459 1.05
22,378.041 25.65
~-
2,169,026 2.49
SPAIN
ACCIONA SA
ALTADIS SNREG.
BANCO BILBAO VIZARGENTARIA /NAM ENDESA SA
GAMESA CORP TECNOLOGICA SA TELEFONICA SA
14,359 EUR 2,313,235 2.65
11,550 EUR 555.786 0.64
161.340 EUR 2,952,522 3.38
28,477 EUR 1 147,054 1.31
62,021 EUR 1,648,518 1.89
130,778 EUR 2,144,759 2.46
10,761,874 12.33 - -~ SWEDEN -
BOLIDEN AB
ERICSSON TEL. -E.
38,728 SEK 637,009 0.73
m . 2 7 8 SEK 1,574.103 1.80 -.
2.211.112 2.53
GERMANY
ALLIANZ AG ,NAM
COMMERZBANK AG
CONTINENTAL AG
DEUTSCHE POSTAG. BONN
E.ON AG
HEIDELBERGER DRUCKMASCHINEN AG
EUR 2 794,650 3.21
EUR 918.059 105
EUR 1,343,972 1.54
EUR 1.894.356 2 17
EUR 1,807.559 2 07
EUR 1.041 982 1.19
SWITZERLAND --
CREDIT SUISSE GROUP /NOM.
JULIUS BAER HOLDING INAMENAKT. NOVARTIS AG EASEL INAM.
ROCHE HOLDING AG /GENUSSSCHEIN
37,027 CHF 2,000 931 2.29
20700 CHF 2,105,944 2.41
54,273 CHF 2,312.898 2.66
11.271 CHF 1504,833 1.72
HSBC Global Investment Funds

Portfolio of Investments and Other Net Assets -_
_ _ Descrlptlori Quantity Currency Evaluatlon % net
assets ~
SYNGENTA AG lNAM 14,553 CHF 2036,232 2 3 3
ZURICH FINANCIAL SERVICES 3752 CHF 809296 0 9 3
/NAM ~~
10,770 134 12 34
84,495,579 96.82 ..
TOTAL SHARES
TOTAL TRANSFERABLE SECURITIES ADMITTED TO AN OFFICIAL STOCK EXCHANGE LISTING 84,495,579 96.82
TOTAL INVESTMENTS 64.495.579 96 a2
OTHER NET ASSETS LESS LIABILITIES 2,777,214 3.16
TOTAL NET ASSETS 87.272.793 100.00
A HSBC Global Investment Funds

Portfolio of Investments and Other Net Assets -3 EUROPE EX UK EQUITY
Economic Division of Investment ~
(expressed as a percentage of net assets) _-
Banks and financial institutions News transmission Pharmaceuticals and cosmetics Insurance Energy Construction, building materials Public services Chemicals Mechanics, machinery Food Electronics and electrical equipment Coal mines. heavy industries Transport Real estate companies Tyres and rubber Office equipment and computers Gastronomy Automobile industry Miscellaneous Tobacco and spirits
Other net assets less liabilities
27.00 9.51 9.35 8.01 7.20 5.61 4.43 4.10 3.65 2.99 2.61 2.36 2.17 1.89 1.54 1.04 0.98 0.96 0.78 0.64
3.18
Total Net Assets 100.00
A --
HSBC Global Investment Funds
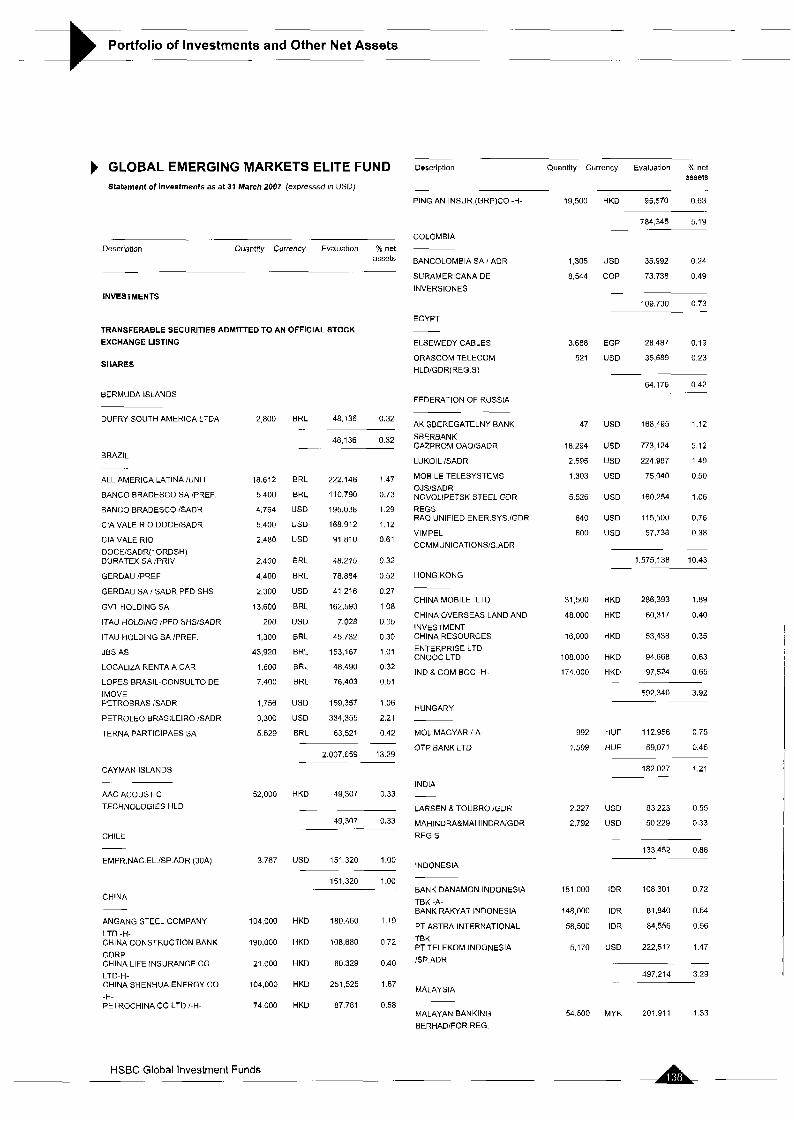
.- ~
Portfolio of Investments and Other Net Assets .~
GLOBAL EMERGING MARKETS ELITE FUND Statement of investments as at 31 March 2007 (expressed in USD)
... - Quantitv Currencv Evaluation % net Description
assets -.
19,500 HKD 95,570 063
784,345 5 19 -
-.
PING AN INSUR (GRP)CO -H-
COLOMBIA Description Quantity Currency Evaluation % net
assets BANCOLOMBIA SA I ADR
SURAMERICANA DE INVERSIONES
1,305 US0 35.992 024
8 544 COP 73.738 0 4 9
-
109.730 073 -
- -
INVESTMENTS
EGYPT __ ELSEWEDY CABLES
ORASCOM TELECOM HLD/GDR(REG.S)
TRANSFERABLE SECURITIES ADMITTED TO AN OFFICIAL STOCK EXCHANGE LISTING
SHARES
3,688 EGP 28487 0.19
521 US0 35,689 0.23
64,176 0.42 ~ BERMUDA ISLANDS FEDERATION OF RUSSIA
~ --
AKSBEREGATELNYBANK SBERBANK GAZPROM OAOISADR
LUKOIL ISADR
MOBILE TELESYSTEMS OJSlSADR NOVOLIPETSK STEEL GDR REGS RAO UNIFIED ENER.SYS.lGDR
VIMPEL C0MMUNICATIONSF.ADR
DUFRY SOUTH AMERICA LTDA 48.136 0.32 2 800
18.612
5 400
4.764
5.400
2.480
2.400
4,AOO
2.300
13,600
200
1,300
43,920
1,600
7,400
1,756
3,300
5 529
52,000
3.767
104 000
190.000
21 000
104.000
74 000
BRL -.
-
BRL
BRL
USD
USD
US0
BRL
BRL
USD
BRL
USD
BRL
BRL
BRL
BRL
USD
USD
BRL
47 USD 168495 1.12
18.294 US0 773,124 512
2.595 USD 224,987 149
1,303 USD 75,040 050
5526 USD 160.254 106
840 USD 115,500 0.76
600 US0 57.738 0 38
~
1.575 138 10.43 ~
48,136 0.32
BRAZIL -.
ALL AMERICA LATINA /UNIT
BANCO BRADESCO SA IPREF.
BANCO BRADESCO ISADR
CIA VALE RIO DOCElSADR
CIA VALE RIO DOCEGADR(1 ORDSH) DURATEX SA /PRIV.
GERDAU !PREF.
GERDAU SA! SADR PFD SHS
GVT HOLDING SA
ITAU HOLDING !PFD SHSISADR
ITAU HOLDING SA IPREF.
JES AS
LOCALIZA RENTA A CAR
LOPES BRASIL-CONSULT0 DE IMOVE PETROBRAS EADR
PETROLEO BRASILEIRO iSADR
TERNA PARTICIPAES SA
222.148
110.790
195.038
168,912
91,810
48.215
78,884
41,216
162,593
7,028
45.732
153,167
48.490
76,403
159,357
334,355
63.521
1 41
0.73
1.29
1.12
0.61
0 32
0.52
0.27
1 08
0.05
0.30
1.01
0.32
0 51
1.06
2.21
0.42
HONG KONG
CHINA MOBILE LTD
CHINA OVERSEAS LAND AND INVESTMENT CHINA RESOURCES ENTERPRISE LTD CNOOC LTD
IND a COM BOG -H-
31,500 HKD 286,393 1.89
48000 HKD 60,317 0.40
16,000 HKD 53438 0.35
108000 HKD 94.668 0.63
174.000 HKD 97,524 065
592.340 3.92 -
~. ~
HUNGARY
MOL MAGYAR :-A-
OTP BANK LTD
992 HUF 112.956 075
1.509 HUF 69,071 046
182027 1.21
~~ 2,007 659 13.29 ~-
CAYMAN ISLANDS -~
AAC ACOUSTIC TECHNOLOGIES HLD
INDIA HKD 49307 0.33
- 49,307 0.33 -~
LARSEN a TOUBRO /GDR
MAHlNDRA&MAHINDRAiGDR REG.S
2,227 USD 83223 0 55
2.792 USD 50229 0 3 3
-
133,452 0.88 ~- ~
CHILE
EMPR.NAC ELJSP.ADR (30A) USD 151.320 1.00
151.320 1.00
-~ INDONESIA
BANK DANAMON INDONESIA TBK -A- BANK RAKYAT INDONESIA
PT ASTRA INTERNATIONAL TBK PT TELEKOM.INDONESIA 'SP.ADR
151 000 IDR 108301 072
148,000 IDR 81,840 0.54
58,500 IDR 84,556 056
5,170 US0 222,517 147
-
497.214 329
CHINA .-
ANGANG STEEL COMPANY LTD -H- CHINA CONSTRUCTION BANK CORP CHINA LIFE INSURANCE CO LTD-H- CHINA SHENHUA ENERGY CO -H- PETROCHINA GO LTO !-H-
HKD 180.460 1.19
HKD 108,680 0.72
HKD 60.329 0.40
HKD 251,525 1.67
HKD 87781 0.58
MALAYS I A
MALAYAN BANKING BERHADlFOR REG
54.500 MYR 201.911 1.33
HSBC Global Investment Funds

.. ._ r) Portfolio of Investments and Other Net Assets
- Description Quantity Currency Evaluation % net
assets Descripllon
~ ~~
Quantity Currency Evaluation Yo net assets
43,800 MYR 150.860 1.00
26.000 MYR 75,253 0.50
- .
428 024 2.83
-. .-
MAXIS COMMUNICATIONS BHD
TELEKOM MALAYSIA BHDiFOR.REG
SAMSUNG ELECTRONICS CO LTD
790
61,000
4.000
91,000
69,000
133.000
199,000
50,000
1,068
45.000
4.000
148.000
126.000
59.000
5.700
8,000
31,966
135 400
21.100
110,900
44,672
18.148
KRW 472.790 3 14
~ -
2,448 500 16 22
TAIWAN
MEXICO ASUSTEK COMPUTER INC
CATCHER TECHNOLOGY CO LTD CATHAY FINANCIAL HOLDING
CHI ME1 OPTOELECTRONIC CORP CHINA STEEL
FAR EASTERN TEXTILE LTD
FAR EASTONE TELECOM. CO LTD HON HA1 PRECISION IND IFOR
HON HA1 PRECISION IND GO LTD MEDIA TEK INCORPORATION
TAIWAN CEMENT CORP
TAIWAN SEMICONDUCTOR MANUFACT WISTRON CORP
TWO 143.839 0.95
TWD 31 440 021
TWO 188 995 125
TWD 71 965 048
TWO 149973 099
TWD 171 455 114
TWD 56,834 038
US0 14311 009
TWD 302,009 2 0 0
TWO 45,951 030
TWD 124830 083
TWD 258,638 171
TWO 89538 059
CEMEX lADR
CONTROLADORA COM.SABi(1
CORP.MOCTEZUMA SA DE CV B2 CORPORACION GEO SAB DE CV B EMPRESAS ICA SAB DE CV
FOMENT0 ECONOMIC0 MEXICANOIADR GRUPO AEROPORTUARIO -B- SADR
C+3 B)
2.154 US0 70,651 0.47
43790 MXN 122641 0.81
27.717 MXN 78,933 0.52
31,700 MXN 183,859 1.22
41,600 MXN 160.386 1.06
1,233 USD 137.874 091
4.847 USD 126,AlO 0.84
880,754 $83 - - .
PHILIPPINES
AYALA LAND INC.
POLAND
296,400 PHP 101.309 0.67
101,309 067 -
1,649,778 10.92 --
THAILAND BK POLSKA KASA OPlEKl PEKAO POWSZECHNA KASA OSZCZED POLSKI
972 PLN 88.751 059
2,534 PLN 42,207 028
130958 0.87 ~ -~
BANPU PUBLIC CO LTD'FOR REG BANPU PUBLIC CO 'NVDR
KASIKORNBANK PUBL COM LTDNVDR KlATNAKlN BANK PUBLICIFOR REG KRUNG THAI BANK 'FOR REG
KRUNG THAI BK PUBL.COINVDR
THB 32,864 0.22
THB 45.669 0.30
THE 59306 0.39
THE 111.111 0.74
THE 7.287 0.05
THB 38.302 0.25
.- .-
294.539 1.95 -
SOUTH AFRICA - .-
ABSA GROUP LTD
BIDVEST GROUP LTD
GOLD FIELDS
IMPALA PLATINUM HOLDINGS LTD MASSMART HOLDINGS LTD
MURRAY AND ROBERTS HOLDINGS SASOL LTD !REG.
STANDARD BK GROUP LTD
5.631 ZAR 109,442 072
5.717 ZAR 108343 072
3,524 ZAR 65.935 044
4.319 ZAR 134,653 089
15141 ZAR 174.856 1.16
9,099 ZAR 70.450 047
12,770 ZAR 433,986 287
10,094 ZAR 147.248 0.97
TURKEY
TOFAS TURK OTOMOBIL FABRlKASl TURKIYE GARANTI BANKASI iNOM
TRY 170,670 1.13
TRY 83.071 055
-
253 741 168
13,627,360 90.22 1,244 913 8.24
-
140
0.87
0.89
1.03
0 74
0.24
0.99
0.38
2.82
0.44
0.71
0 97
0.24
1.36
TOTAL SHARES SOUTH KOREA - -
DAEGU BANK
DAELIM INCUSTRIAL CO LTD
DAlSHlN SECURITIES CO LTD
DONGBU INSURANCE CO LTD
DOOSAN HEAVY
WARRANTS I EQUITY LINKED SECURITIES 11.610 KRW 211.038
1370 KRW 131.214
5.790 KRW 135,097
5.500 KRW 156102
1,740 KRW 112.457
300 KRW 35,876
2700 KRW 148.958
290 KRW 57 955
2,300 KRW 424,189
940 KRW 66.048
2,740 KRW 107,476
1,640 KRW 147136
400 USD 36,420
490 KRW 205.744
GERMANY
DEUT BK 07- 1,869 17.1.17WRT!INFOSYS 0.000001
USD 86.668 0.57
~ .- - 86668 0.57
- INDUST.€iCONSTR. HlTE BREWERY CO LTD
GREAT BRITAIN
DE BK LN 06-23.1.09 10,820 WRT/RELIAN 0 UBS LDN 06- 1,645 2 7 07WRTiLARS&TOUB 0
-. .- HYUNDAI DIVELOPM.CO- ENG.&CONS. HYUNDAI HEAVY INDUSTRIES
HYUNDAI MlPO DOCKYARD CO LTD HYUNDAI MOTOR CO LTD
HYUNDAI MOTOR /PFD ISSUED 99 KOOKMIN BANK
KOOKMIN BANK iSADR
POSCO
US0 105248 0.70
USD 59.766 0.40
- .- 165014 1.10
.- TOTAL WARRANTS / EQUITY LINKED SECURITIES 251,682 1.67
TOTAL TRANSFERABLE SECURITIES ADMITTED TO
AN OFFICIAL STOCK EXCHANGE LISTING 13,879,042 91.89
HSBC Global Investment Funds r

Portfolio of Investments and Other Net Assets -
-. -.
Description Quantity Currency Evaluation Yo net assets
-~ ..
TRANSFERABLESECURITIESTRADEDONANOTHERREGULATED MARKET
SHARES
EGYPT -
ORASCOM CONSTR INWSGDR 2.41 1
SOUTHKOREA
US0 243,993 1.62
243,993 1.62
. -
~.
INDUSTRIAL BANK OF KOREA 12 350 KRW 247.464 1.63
TAIWAN -
CAPITAL SECURITIES CORP 117,000
TOTAL SHARES
247464 1 6 3 ~
TWD 57,477 0.38
57.477 0 38
-.
. .- 548,934 3.63
TOTAL TRANSFERABLE SECURITIES TRADED ON ANOTHERREGULATEDMARKET 548.934 3.63
OTHERTRANSFERABLESECURITES
SHARES
FEDERATION OF RUSSIA - .
MAGNIT JSC
TOTAL SHARES
WARRANTS I EQUITY LINKED SECURITIES
GERMANY
1,389 us0 60,144 0.40 -. .
60.144 0 4 0
60,144 0.40 ~
DT BK AG 07- 3,209 US0 34.672 023
17,01,17WRT/SATYAM 0.000001
34,672 0.23 ~. ~
GREAT BRITAIN
UBS LON 06-17 11 07WRTIICICI 7.171 USD 142.630 094
0 .. -
142,630 0 9 4
TOTAL WARRANTS I EQUITY LINKED SECURITIES 177.302 1.17 ~. ~
TOTAL OTHER TRANSFERABLE SECURITIES 237,446 1.57
TOTAL INVESTMENTS 14,665,422 -97.09
OTHER NET ASSETS LESS LIABILITIES -. 439,188 2.91
TOTALNETASSETS 15,104,610 100.00
HSBC Global Investment Funds . .~

Portfolio of Investments and Other Net Assets -E GLOBAL EMERGING MARKETS ELITE FUND
Economic Division of Investment -.
(expressed as a percentage of net assets) ~. .
Banks and financial institutions Energy Coal mines, heavy industries Electronics and electrical equipment News transmission Construction, building materials Holding companies Automobile industry Mechanics, machinery Real estate companies Public services Insurance Transport Retail trade, department stores Office equipment and computers Food Precious metals Tobacco and spirits Textile Miscellaneous Other services
Other net assets less liabilities
Total Net Assets
20.31 9.59 8.79 8.26 7.62 7.38 7.10 4.21 3.94 2.80 2.70 2.55 2.31 2.29 1.54 1.41 1.33 1.15 1.14 0.35 0.32
2.91
100.00
.. .- HSBC Global Investment Funds

Portfolio of Investments and Other Net Assets - z- . . . -
.. - Description Quantity Currency Evaluation % net
assets GLOBAL EMERGING MARKETS EQUITY Statement of investments as at 31 March 2007 (expressed in USD)
.~
Description Quantity Currency Evaluation % net assets
INVESTMENTS
TRANSFERABLE SECURITIES ADMITTED TO AN OFFICIAL STOCK EXCHANGE LISTING
SHARES
COLOMBIA
BANCOLOMBIA SA I ADR
SURAMERICANA DE INVERSIONES
25,100
166,795
3.300
71,425
9,578
956
185.609
156,494
52 286
25.240
99.487
15.331
12.100
605,500
936 000
324,835
2,120,456
3,385.000
19,427
27 119
11,726
41 936
51.825
2,925,500
2,872 500
1.118500
88.477
US0 692.258 0.23
COP 1 439,508 0.49
-. .~
2,131 766 0.72
CZECH REPUBLIC ~-
CEZ.CESKE ENERGETICKE ZAVODY
CZK 147117 0.05
147,117 0.05 - EGYPT
ELSEWEDY CABLES
ORASCOM TELECOM HLD/GDR(REG.S)
EGP 551 710 0 1 9
US0 656,093 022
1207.803 0 4 1 .-
BERMUDA ISLANDS
DUFRY SOUTH AMERICA LTDA
BRAZIL
59.800
357 500
114.600
86.267
103 637
45,595
51 200
83,307
44.100
262,400
25 360
35.200
152 944
38.424
57 925
105,466
1,062 899
134.993
1,439.961
2.015 739
3,743,000
404 000
1,980,300
1,429,363
357.000
BRL 1,028,046 0.35
1,028,046 0.35 ~
FEDERATION OF RUSSIA ~. .
AK SBEREGATELNY BANK SBERBANK GAZPROM OAO
GAZPROM OAOlSADR
LUKOIL ISADR
MOBILE TELESYSTEMS OJSISADR NOVOLIPETSK STEEL GDR REGS RAO UNIFIED ENER.SYS./GDR
VIMPEL COMMUNICATIONS/S.ADR
USD 3427,260 116
USD 1,954463 066
US0 6,613 608 2.24
US0 4533,196 154
USD 1,453,572 0 49
US0 2,885 123 0.98
USD 2,108013 072
USD 1,164383 040
- -
24139618 819 ~-
ALL AMERICA LATINA /UNIT
BANCO BRADESCO SA IPREF.
BANCO BRADESCO iSADR
CIA VALE RIO DOCEISADR
CIA VALE RIO DOCE/SADR( 1 ORDSH) DURATEX SA PRIV.
GERDAU IPREF.
GERDAU SA / SADR PFD SHS
GVT HOLDING SA
ITAU HOLDING SA IPREF.
LOCALIZA RENTA A CAR
LOPES BRASIL-CONSULT0 DE IMOVE PETROBRAS ISADR
PETROLEO BRASILEIRO lSADR
TERNA PARTICIPAES SA
BRL 4,267,030 1.45
BRL 2,351.215 0.80
US0 3531,771 120
US0 3,241,765 1.10
USD 1,687,927 0 5 7
ERL 1 028.577 0.35
BRL 1,493,543 0.51
US0 790.272 0.27
BRL 3,137,095 1.06
ERL 892.127 030
BRL 1,066.771 0.36
BRL 1,579096 0.54
USD 3,486.978 1.18
USD 5,868961 1.99
BRL 1,211,675 0.41
HONG KONG . -
CHINA MOBILE LTD
CHINA OVERSEAS LAND AND INVESTMENT CHINA RESOURCES ENTERPRISE LTD CNOOC LTD
IND & COM BOC -H-
HKD 5,505,109 1 87
HKD 1 176,184 0.40
HKD 1,084,904 0 37
HKD 1,858,683 0 63
HKD 1,897.233 0 64
11,522,123 391
~~
-
35,634,803 12.09
CAYMAN ISLANDS ~ .. AAC ACOUSTIC TECHNOLOGIES HLD KINGDOM HOTEL INV.EGDR REGS
HUNGARY
MOL MAGYAR I-A-
OTP BANK LTD
HKD 1,007,855 0.34
USD 1,187,938 0.40
2,195,793 0 74 .-
HUF 2,212,084 0 7 5
HUF 1,241 311 0.42
3,453,395 1.17 __ CHILE INDIA
RIPLEY CORP SA
CHINA
IClCl BK /SADR
LARSEN 8 TOUBRO /GDR
MAHINDRABMAHINDRPJGDR REG S
USD 463,060 0.16
USD 1,567152 0 5 3
USD 932.344 0.32
CLP 2,030,884 0 69
2,030.884 0.69
~.
~.
ANGANG STEEL COMPANY LTD -H- CHINA CONSTRUCTION BANK CORP CHINA LIFE INSURANCE CO LTD-H- CHINA SHENHUA ENERGY CO -H. PETROCHINA CO LTD I-H-
PING AN INSUR.(GRP)CO -H-
2.962556 101 ~- HKD 3497,694 119
HKD 2,140.993 073
HKD 1.160 608 0.39
HKD 4,789,393 162
HKD 1.695548 0 5 8
HKD 1,749,665 0 59
15,033 901 5 10
-
-
INDONESIA - - BANK DANAMON INDONESIA TBK -A- BANK RAKYAT INDONESIA
PT ASTRA INTERNATIONAL TBK PT TELEKOM.INDONESIA /SP.ADR
IDR 2.098 242 0.71
IDR 1,588421 0.54
IDR 1,616680 0 5 5
US0 3,808.049 1.29
1 a- I HSBC Global Investment Funds ~.
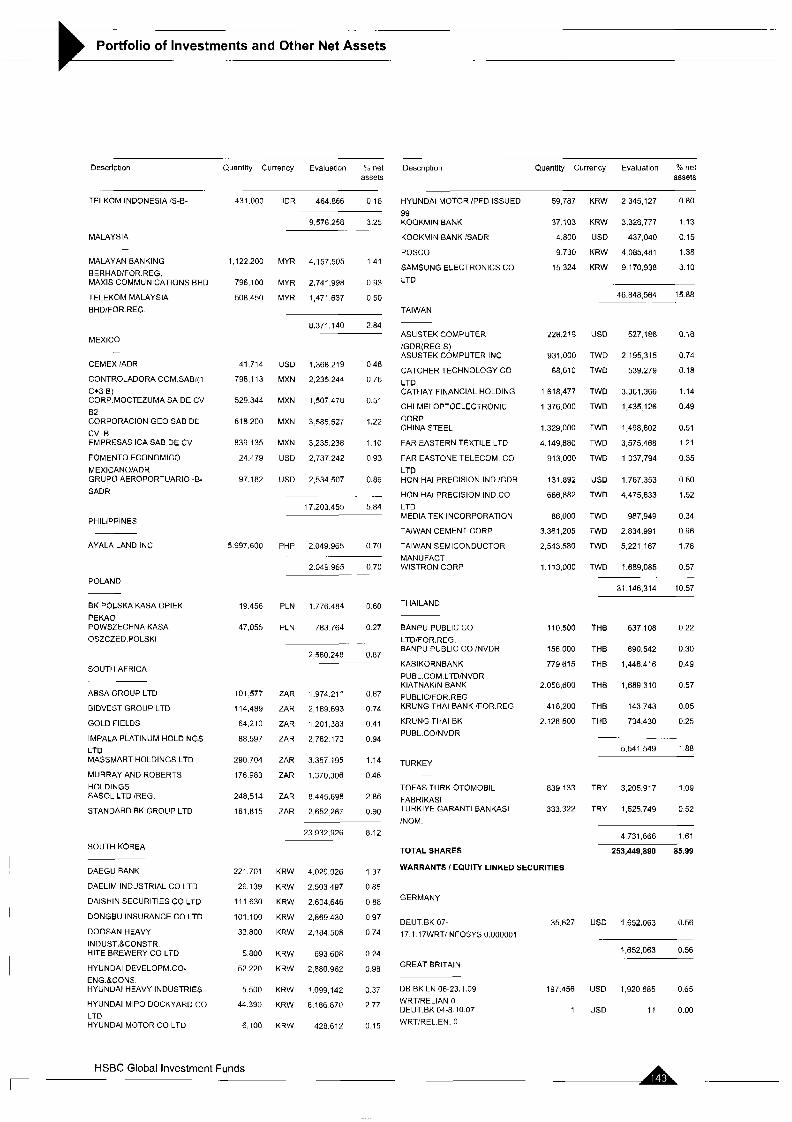
_ -
Portfolio of Investments and Other Net Assets
__ Descriptian Quantity Currency Evaluation % net
assets -
Description Quantity Currency Evaluation ?" net assets
431.000
1.122 200
796,100
508.450
41,714
798,113
529.344
618 200
839 135
24.479
97 182
5 997,600
19.456
47 05s
101 577
114,489
64.210
88.597
290 704
176 983
248.514
181.815
221.701
26 13Y
111 630
101.100
33 800
5 800
52 220
5 500
44 390
6 100
IDR 464.866 0 16 HYUNDAI MOTOR P F D ISSUED
99 KOOKMIN BANK
KOOKMIN BANK !SADR
POSCO
SAMSUNG ELECTRONICS CO
LTD
59.787
37,103
4.800
9 730
15 324
228.219
931.000
68,610
1 618,477
1.376.000
1.329 000
4.149.880
913,000
131.892
666,882
86,000
3,361,205
2 543,580
1.113000
110.500
156,000
779 615
2 058,600
416,200
2.126,500
839 133
333.322
KRW 2,345.127 0.80 TELKOM INDONESIA is-B-
KRW 3,328,777 1.13
USD 437,040 0.15
KRW 4.085.481 1.38
KRW 9 170,938 3.10
9,576258 3 2 5 . _
MALAYS I A ._ -
MALAYAN BANKING BERHADIFOR.REG. MAXIS COMMUNICATIONS BHD
TELEKOM MALAYSIA BHDiFOR.REG
MYR 4,157,505 1.41
MYR 2,741.998 0 93
MYR 1.471.637 0.50 46.848 564 15 88 ~ . .~
TAIWAN
8.371.140 2.84 ASUSTEK COMPUTER /GDR(REG S) ASUSTEK COMPUTER INC
CATCHER TECHNOLOGY CO LTD CATHAY FINANCIAL HOLDING
CHI ME1 OPTOELECTRONIC CORP CHINA STEEL
FAR EASTERN TEXTILE LTD
FAR EASTONE TELECOM. GO LTD HON HA1 PRECISION IND !GDR
HON HAIFRECISION IND CO LTD MEDIA TEK INCORPORATION
TAIWAN CEMENT CORP
TAIWAN SEMICONDUCTOR MANUFACT. WISTRON CORP
US0 527186 0 1 8
TWD 2 195,315 0 7 4
TWO 539.279 0.18
TWO 3,361,366 1 1 4
TWD 1,435126 0 4 9
TWD 1,498,602 0.51
TWD 3575,468 1 2 1
TWO 1037794 035
MEXICO -
CEMEX /ADR
CONTROLADORA COM SAB'(1 c+3 B) CORP.MOCTEZUMA SA DE CV 82 CORPORACION GEO SAB DE
cv B EMPRESAS ICA SAB DE CV
FOMENT0 ECONOMIC0 MEXICANO/ADR GRUPO AEROPORTUARIO -B- SADR
USD 1,368.219 0 4 6
hlXN 2,235244 0 7 6
MXN 1,507478 0.51
MXN 3.585,527 1.22
MXN 3,235.238 1 10
US0 2,737.242 0.93
USD 2,534 507 0.86
. .-
17,203.455 5.84
USD 1.767353 0 6 0
TWD 4,475,633 1 5 2
TWD 987.949 0 3 4
TWO 2834,991 0 9 6
TWO 5,221,167 1 7 8
TWD 1,689,085 0 5 7
31 146.314 10 57
...
PHILIPPINES
AYALA LAND INC. PHP 2.049 965 0 7 0
2049 965 0 7 0
POLAND
BK POLSKA KASA OPlEKl PEKAO POWSZECHNA KASA 0SZCZED.POLSKI
THAILAND PLN 1.776.484 0.60
PLN 783764 0 2 7
-
2 560.248 0.87
BANPU PUBLIC CO LTD/FOR.REG BANPU PUBLIC CO /NVDR
KASIKORNBANK PUBL COM.LTDiNVDR KlATNAKlN BANK PUBLlClFOR REG KRUNG THAI BANK 'FOR REG
KRUNG THAI BK PUBL CO/NVDR
THE 637,108 0 2 2
THE 890.542 0 3 0
THB 1,446.416 0 4 9
THB 1,689,310 0.57
THE 143,743 0.05
THB 734.430 0 2 5
- -.
5,541 549 188
SOUTH AFRICA
ABSA GROUP LTD
BIDVEST GROUP LTD
GOLD FIELDS
IMPALA PLATINUM HOLDINGS LTD MASSMART HOLDINGS LTD
MURRAY AND ROBERTS HOLDINGS SASOL LTD ;REG.
STANDARD BK GROUP LTD
ZAR 1.974 211 0.67
ZAR 2 169,693 0.74
ZAR 1201.383 0 4 1
ZAR 2,762.173 0 9 4
ZAR 3.357 195 1.14
ZAR 1 370,306 0.46
ZAR 8,445.698 2 86
ZAR 2.652 267 0.90
TURKEY -
TOFAS TURK OTOMOBIL FABRlKASl TURKIYE GARANTI BANKASI !NOM.
TRY 3,205,917 1.09
TRY 1.525.749 0 5 2
23 932.926 8.12 4 731.666 1.61
253,449,890 85.99 SOUTH KOREA TOTAL SHARES
DAEGU BANK
DAELIM INDJSTRIAL CO LTD
DAlSHlN SECURITIES CO LTD
DONGBU INSURANCE CO LTD
DOOSAN HEAVY INDUST.&CONSTR HlTE BREWERY CO LTD
HYUNDAI DEVELOPM CO- ENG.&CONS. HYUNDAl HEAVY INDUSTRIES
HYUNDAI MlPO DOCKYARD CO LTD HYUNDAI MOTOR CO LTD
WARRANTS I EQUITY LINKED SECURITIES KRW 4,029,926 1 37
KRW 2.503497 0.85
KRW 2604.646 0 8 8
KRW 2,869.430 0 97
KRW 2.184.508 0.74
KRW 693.608 0.24
KRW 2,880.962 0 98
KRW 1,099,142 0.37
KRW 8 186870 2.77
KRW 428.612 0 15
GERMANY ~.
DEUT BK 07- 35.627 17.1.17WRTlINFOSYS 0.000001
US0 1,652.063 0.56
1,652,063 0.56
GREAT BRITAIN
DB BK LN 06-23.1.09 WRT/RELIAN 0 DEUT.BK 04-8.10.07 WRT:REL.EN. 0
197.456
1
US0 1.920685 0 6 5
11 0.00 US0
HSBC Global Investment Funds

. -
Portfolio of Investments and Other Net Assets -. . -
.
DescriDtion Quantity Currency Evaluation Yo net assets
UBS LDN 06- 38.175 US0 1 386.974 0.47
2 7 07WRT/LARS&TOUB 0
3.307.670 1 12
TOTAL WARRANTS I EQUITY LINKED SECURITIES 4,959,733 1.68
TOTAL TRANSFERABLE SECURITIES ADMITTED TO AN OFFICIAL STOCK EXCHANGE LISTING 258,409,623 .. 87.67
TRANSFERABLE SECURITIES TRADED ON ANOTHER REGULATED MARKET
SHARES
EGYPT
ORASCOM CONSTR.IND./SGDR 46,695 US0 4725,534 1.60
4,725 534 1.60
SOUTH KOREA
INDUSTRIAL BANK OF KOREA 223,313 KRW 4,474,645 1.52
4,474,645 1.52
TAIWAN
CAPITA- SECURITIES CORP 2,610,526 TWO 1,282,431 0 44
1 282.431 0.44
TOTAL SHARES 10,482,610 3.56
TOTAL TRANSFERABLE SECURITIES TRADED ON ANOTHER REGULATED MARKET 10.482.610 3.56
OTHER TRANSFERABLE SECURITES
SHARES
FEDERATION OF RUSSIA
MAGNIT JSC
TOTAL SHARES
WARRANTS I EQUITY LINKED SECURITIES
GERMANY
26,473 USD 1146,281 039
1.146281 0 3 9
1,146,281 0.39
~
0EUT.BK 06-03 R OSWRTICHINA 1,097,902 US0 1 237.029 0.42 ST 0.00001 DT BK AG 07- 59,572 USD 643652 0.22
17.01.17WRTiSATYAM 0.000001 DT.BK 06-2.2 11 WRT 6 US0 6.322.020 2.14
GAZPROM 0
8,202.701 2.78 .~
GREAT BRITAIN
UBS LON 06-17.11 07WRT/ICICI 139,101 US0 2,766,705 0.94 0
~ .~
2,766 705 0.94
TOTAL WARRANTS / EQUITY LINKED SECURITIES 10.969.406 3.72
TOTAL OTHER TRANSFERABLE SECURITIES 12,115,687 4.11
TOTAL INVESTMENTS 281,007,920 95.34
OTHER NET ASSETS LESS LIABILITIES 13,744,472 .4.66
TOTAL NET ASSETS 294.752,392 IO=
- HSBC Global Investment Funds
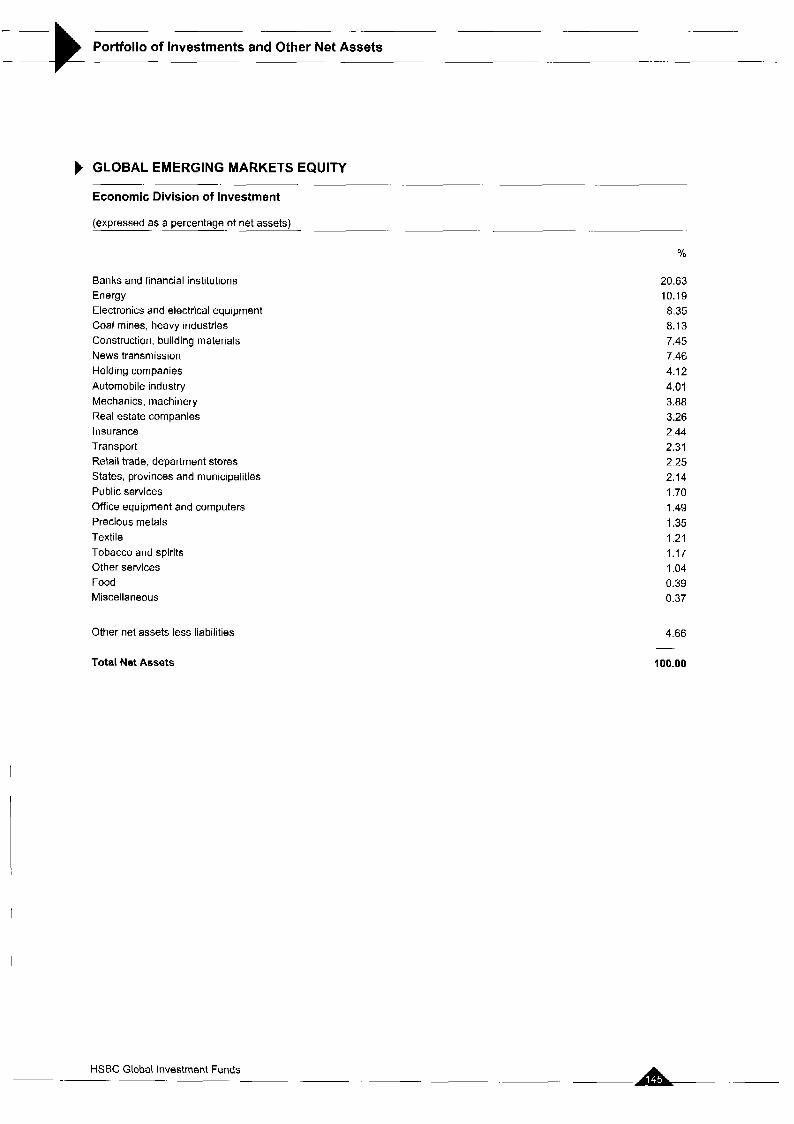
- .
Portfolio of Investments and Other Net Assets . . .
GLOBAL EMERGING MARKETS EQUITY
Economic Division of Investment . .
(expressed as a percentage of net assets)
%
Banks and financial institutions Energy Electronics and electrical equipment Coal mines, heavy industries Construction, building materials News transmission Holding companies Automobile industry Mechanics, machinery Real estate companies Insurance Transport Retail trade, department stores States, provinces and municipalities Public services Office equipment and computers Precious metals Textile Tobacco and spirits Other services Food Miscellaneous
Other net assets less liabilities
Total Net Assets
20.63 10.19 8.35 8.13 7.45 7.46 4.12 4.01 3.88 3.26 2.44 2.31 2.25 2.14 1.70 1.49 1.35 1.21 1.17 1.04 0.39 0.37
4.66
100.00
-. ..
L- HSEC Global Investment Funds .~ ~

-
Portfolio of Investments and Other Net Assets t GLOBAL EQUITY Statement of investments as at 31 March 2007 (expressed in USD)
_- .. -. . -
Description Quantity Currency Evaluation YO net assets -
RIO TINTO PLC /REG
SHIRE PLC
VODAFONE GROUP PLC
WOOD GROUP (JOHN) PLC
26818
107.647
585 125
452,699
1 158.500
1,315,000
97,536
51 300
156,222
293.999
73 100
30 300
140,000
203 000
73 500
33.000
227,000
37.600
403
49 697
19.751
379.033
33.327
48,366
6 075
99 627
GEP 1,517 371 0.86
GBP 2,224,595 1.26
GBP 1574,198 089
GBP 2,369,925 1 36
13,463.086 7.65 -
- -
__ . - . -
Description Quantity Currency Evaluation YO net assets
- - INDONESIA -. - BANK DANAMON INDONESIA TBK -A- TELKOM INDONESIA IS-B-
INVESTMENTS IDR 830.905 0.47
IDR 1,418,326 081
2249.231 1 2 8
TRANSFERABLE SECURITIES ADMITTED TO AN OFFICIAL STOCK EXCHANGE LISTING
SHARES ISRAEL
ECI TELECOM LTD
NICE SYSTEMS LTD I SADR
US0 803,697 0.46
USD 1,737,531 0.98
2,541.228 1.44
-
BERMUDA ISLANDS
ESPRIT HOLDINGS LTD
BRAZIL
108.500 HKD 1272.477 U72
1,272477 072 -. --
ITALY ~
CAMPARI AZlPOST FRAZIONAMENTO UNICREDITO ITALIAN0 SPA
EUR 1541.583 088
EUR 2,775698 157
4317,281 245
~
-
ALL AMERICA LATINA IUNIT
CHINA
107 930 BRL 1.288,225 0.73
1,288,225 0.73
-~
.-
JAPAN . .-
CASIO COMPUTER CO.LTD
JAFCO CO LTD
MARUBENI CORP.
MAZOA MOTOR CORP
MEDICEO PALTAC HOLDINGS CO LTD MlTSUBlSHl ESTATE CO
NIPPON EXPRESS CO LTD
OMRON CORP
RESONA HOLDINGS INC
CHAODA MODERN AGRICULT.HOLD. CHINA MERCHANTS BANK I-H-
CHINA SHENHUA ENERGY CO -H-
1,564000 HKD 1096,744 062
765,500 HKD 1.543 793 o m 324,000 HKD 783,600 045
-.
3.424.137 1 9 5 -
JPY 16C0,254 091
JPY 1,676,263 0.94
JPY 850,536 048
JPY 1,123,041 064
JPY 1,400,089 0 80
JPY 1,083619 062
JPY 1.423.384 081
JPY 1,011 344 0 57
JPY 1,083,967 0.62
11 252 497 6.39
-
~
DENMARK
NOVO NORDISK AIS B 25.500 DKK 2.341.497 1 33
2,341,497 1.33 . --
FRANCE - --
AXA
GROUPE DANONE
STE GEN PARIS -A-
SUEZ
TOTAL SA
VEOLIA ENVIRONNEMENT
57.362 EUR
11,042 EUR
6.902 EUR
25,333 EUR
14,506 EUR
35.389 EUR
.-
2.411 800 137
1 793.003 1.02
1,186,372 0.67
1346.195 077
1017,288 058
2,622,417 1 49
10,377,075 5 90 ~-
JERSEY
MEINL EUROPEAN LAND LIMITED
EUK 1,375.785 078
1.375 785 0.78 ~
I
MEXICO
AMERICA MOVIL SA /ADR WI-L-
CONTROLADORA COM SABI(1
C+3 B)
USD 945.678 0.54
MXN 1.061.543 0.60
-. .~ --
2,007,221 1.14 .~
GERMANY I
BASF AG
DEUTSCHE BANK AG /NAM
HENKEL PREF
LINDE A.G.
MAN AG
PORSCHE AG NZ A. SDV
14 182 EUR 1.576.101 0.90
13,429 EUR 1,810.276 1.03
11 858 EUR 1,742079 0.99
18.747 EUR 2,009.430 1.14
21 193 EUR 2,448521 1.39
1,229 EUR 1,900,780 1.08 - .~
11.487,iw 6.53 ~ .-
NETHERLANDS - -
ARCELOR MITTAL N V CLASS EUR 1755,441 1.00
EUR 1.837.493 1.04
.~
3,592.934 2.04
A ROYAL PHILIPS ELECTRONICS NV
SPAIN - --
ACCIONA SA
GREAT BRITAIN
EUR 1,305.073 0.74
1,305 073 0.74
~
~.
BAE SYSTEMS PLC
BARCLAYS PLC
GLAXOSMITHKLINE PLC
KAZAKHMYS LIMITED
142.862 GBP 1,291,822 0.73
186,464 GBP 2647.613 1.51
39612 GBP 1,081 899 061
32.980 GBP 755,663 043
SWITZERLAND - .~
ABB LTD ZUERICH INAMEN. CHF 1.701.766 097
HSBC Global Investment Funds

-~
Portfolio of Investments and Other Net Assets
Description
~.
CIE FIN RICHEMONT UNITS -A-
GIVAUDAN SA /REG
NESTLElNOH
ROCHE HOLDING AG lGENUSSSCHElN
TAIWAN . -
FAR EASTERN TEXTILE LTD /GDRS TAIWAN SEMICONDUCT.MANUF/SADR
THAILAND - -
KASIKORNBANK PUBL COM.LTD/NVDR
TURKEY
ClMSA CIMENTO SANAYI VE TICAR. TURKIYE GARANTI BANKASI /NOM.
UNITED STATES -~
ABERCROMBIE a FITCH "A'
ACCENTURE LTD /-A-
AKAMAI TEC-INOLOGIES INC
ALLERGAN INC.
ALTRIA GROUP
A T B T
BANK OF NEW YORK CO
BOEING CO
CISCO SYSTEMS INC
CIT GROUP INC
ClTlGROUP INC
CONOCOPHILLIPS
CYMER INC
ELECTRONIC ARTS
EMBARP CORP
EMERSON ELECTRIC CO.
EXXON MOBI- CORP
GENERAL MOTORS CORP.
GILEAD SCIENCES INC.
GOOGLE INC A
HONEYWELL INTERNATIONAL INC. MCDONALDS CORP.
MERRILL LYNCH & CO INC
METLIFE INC
MICROSOFT CORP
MOODY S CORP / WHEN ISSUED MORGAN STANLEY
NVlDlA CORP.
OMNICOM GROUP INC.
PEPSICO INC
SCHLUMBERGER LTD
Quantity Currency Evaluation 9t net assets . -
24 725
1.685
8,764
8 376
1
60,700
502.700
92.377
450 154
31,405
62,500
31 993
7 598
24,351
76,995
35 440
11,498
57,589
21 208
33,601
i a 707
19.802
29,646
16,272
16 544
72.852
35 221
26,660
5,052
40.579
51 a72
30,918
52 208
121.082
15 594
30.690
86,381
15.827
20,517
22,937
CHF 1.380717 078
CHF 1563.644 089
CHF 3,373675 1.92
CHF 1491.267 0.85
~- 9,511 069 541
-
USD Y 0.00
US0 655,560 0.37
~ .-
655,569 0.37 -
THE 932,657 0.53
932,657 0.53 ~~
TRY 662.571 038
TRY 2.060 537 1.17
2,723,108 1 55 ~-
US0 2,387,094
US0 2417,500
US0 1,602,849
US0 841.099
US0 2,121.946
USD 3,015.894
US0 1,437,446
USD 1.032.060
US0 1,464,387
us0 1.12847a
US0 1,727.091
US0 1,293,963
USD 812.27a
US0 1.520 543
USD 913,998
USD 709.738
USD 1,087 977
USD 2,032.a25
USD i a64.199
USD 5,554.235
US0 2.328.568
US0 2,327497
USD 2520,126
USD 3.308855
USD 3,360.026
USD 968,231
US0 2,407,017
USD 2,479,135
US0 1,619,419
US0 1.304676
USD 1,620.958
1 36
137
0 91
0 48
121
171
0 82
0 59
o a3
0.64
0 98
0 74
0 46
0 86
0 52
0 40
3 16
0 62
116
1 32
1 06
1 32
143
1 88
191
0 55
1 37
1 4 1
0 92
0.74
D 92
_-- - Description Quantity Currency Evaluation % net
assets
SYSCO CORP 37,865 USD 1,277,565 0 7 3
TEXAS INSTRUMENTS INC 28557 USD 867,847 049
-. -~
TOLL BROTHERS 56 a97 USD 1,576047 090
UNITED TECHNOLOGIES 11 107 USD 721,844 041 CORP WALT DISNEY /DISNEY SER 57,297 USD 1970444 1 12
WELLPOINT INC 21 709 USD 1,745,621 0 9 9
WELLS FARGO & CO 62.078 USD 2 834,974 161
WYETH 31,442 USD 1,568956 089 - -~
71 771,406 40 79
TOTAL SHARES 157,aaa,743 89.72
INVESTMENT COMPANIES
SINGAPORE -. .
CAPITACOMMERCIAL TRUST 641,000 SGD 1.153813 0.66 /REIT
1,153.813 0.66
TOTAL INVESTMENT COMPANIES 1,153,813 0.66
TOTAL TRANSFERABLE SECURITIES ADMllTED TO AN OFFICIAL STOCK EXCHANGE LISTING 159,042,556 9%
TRANSFERABLE SECURITIES TRADED ON ANOTHER REGULATED MARKET
-
SHARES
JAPAN
OSAKA SECURITIES 359 JPY 2.068312 118
EXCHANGE CO ~~
2.068312 1 18
TOTAL SHARES 2,068,312 1.18
TOTAL TRANSFERABLE SECURITIES TRADED ON ANOTHERREGULATEDMARKET 2,068,312 1.18
OTHER TRANSFERABLE SECURITES
- -
SHARES
HONG KONG
SWIRE PACIFIC LTD - A - 202,000 HKD 2,266,933 1 29
2,266,933 1 29
TOTAL SHARES 2,266,933 1.29
TOTAL OTHER TRANSFERABLE SECURITIES 2,266,933 1.29
-
-- .
TOTAL INVESTMENTS 163,377,aoi 92.85
OTHER NET ASSETS LESS LIABILITIES 12,564,122 7.15
TOTALNETASSETS -. 175,961,923 100.00
I HSBC Global Investment Funds

~
Portfolio of Investments and Other Net Assets -
GLOBAL EQUITY
Economic Division of Investment
.- ~
(expressed as a percentage of net assets)
%
Banks and financial institutions Holding companies Internet Software News transmission Pharmaceuticals and cosmetics Electronics and electrical equipment Energy Food Insurance Aerospace technology Mechanics, machinery Chemicals Miscellaneous Automobile industry Public services Tobacco and spirits Retail trade, department stores Other services Coal mines, heavy industries Transport Real estate companies Gastronomy Other business houses Biotechnology Construction, building materials Consumer goods Graphic art and publishing Non-ferrous metals Office equipment and computers Textile Investment companies Agriculture and fishing
Other net assets less liabilities
11.19 11.12 6.41 5.91 5.42 5.21 4.66 3.68 3.25 2.79 2.53 2.53 2.35 2.34 2.26 2.09 1.96 1.92 1.88 1.54 1.40 1.32 1.21 1.16 1.12 0.99 0.92 0.86 0.83 0.72 0.66 0.62
7.15
Total Net Assets 100.00
I 1 HSBC Global Investment Funds
. ~. ~~ -
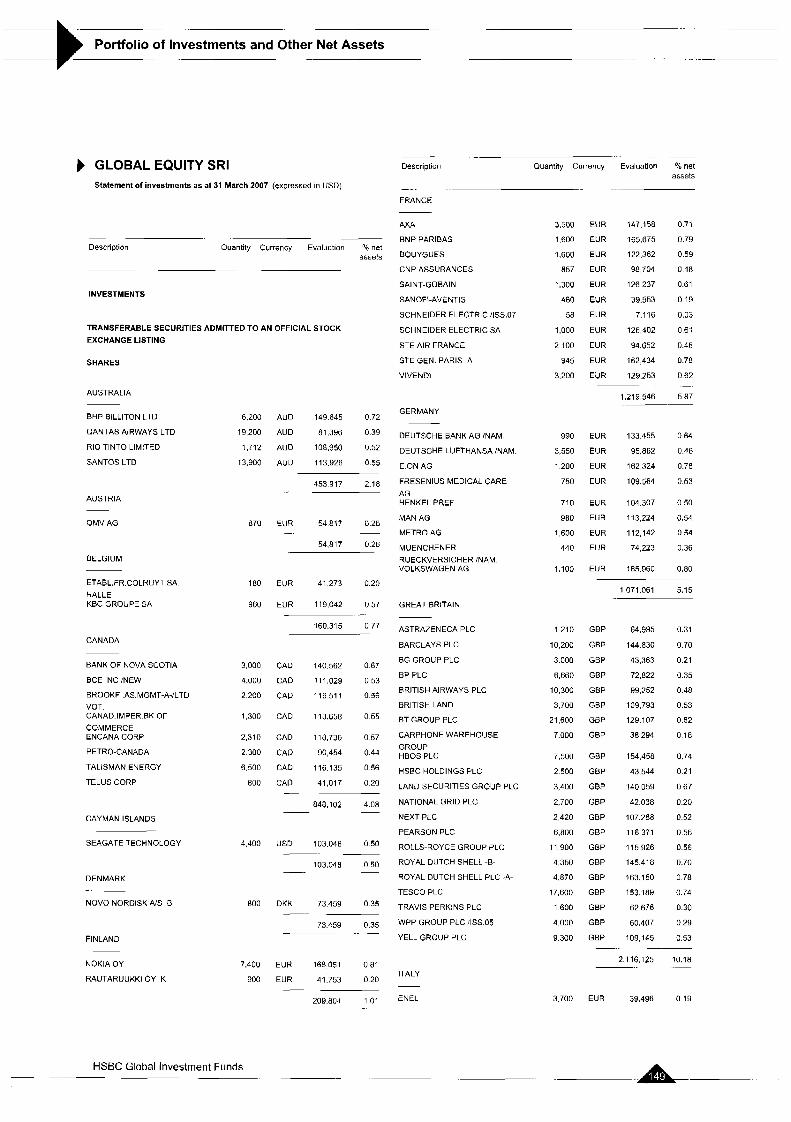
Portfolio of Investments and Other Net Assets - ._
GLOBAL EQUITY SRI Statement of investments as at 31 March 2007 (expressed in USD)
- Description Quantity Currency Evaluation % net
assets ~.
INVESTMENTS
TRANSFERABLE SECURITIES ADMlnED TO AN OFFICIAL STOCK EXCHANGE LISTING
SHARES
AUSTRALIA
BHP BILLITON LTD
QANTAS AIRWAYS LTD
RIO TINTO LIMITED
SANTOS LTD
AUSTRIA
OMV AG
BELGIUM
ETABL.FR.COLRUYT SA. HALLE KBC GROUPE SA
CANADA
BANK OF NOVA SCOTIA
BCE INC /NEW
BRO0KFI.AS.MGMT-A-/LTD VOT. CANAD.IMPER EK OF COMMERCE ENCANA CO2P
PETRO-CANADA
TALISMAN EUERGY
TELUS CORP
CAYMAN ISLANDS
SEAGATE TECHNOLOGY
DENMARK -. ~
NOVO NORDISK N S B
FINLAND .~
NOKlA OY
RAUTARUUKKI OY K
6.200
19,200
1,712
13,900
870
180
960
3.000
4.000
2 200
1,300
2,310
2 300
6.500
800
4,400
800
7,400
900
AUD 149.645 072
AUD 81,396 0.39
AUD 108,950 0.52
AUD 113,926 055
453.917 2.18
EUR 5481’1 026
54.817 0.26
-. .
EUR 41 273 0 2 0
EUR 119,042 0.57
160.315 077
-.
CAD 140.562 067
CAD 111,029 0 53
CAD 116511 0 %
CAD 113.658 0 5 5
CAD 118,736 057
CAD 90,454 044
CAD 116.135 0 5 6
CAD 41,017 0 2 0
848,102 408
-
-
USD 103.048 050
103.048 0 5 0
-- -
-.
DKK 73459 0 35
73.459 0.35
--
- .. -
EUR 168051 0.81
EUR 41.753 020
209.804 101
-
~- -
.. . ... .~
Quantity Currency Evaluation % net assets
Description
FRANCE
AXA
BNP PARIBAS
BOUYGUES
CNP ASSURANCES
SAINT-GOBAIN
SANOFI-AVENTIS
SCHNEIDER ELECTRIC 11SS.07
SCHNEIDER ELECTRIC SA
STE AIR FRANCE
STE GEN. PARIS -A-
VIVENDI
GERMANY -
DEUTSGHE BANK AG /NAM
DEUTSCHE LUFTHANSA /NAM
E ON AG
FRESENIUS MEDICAL CARE AG HENKEL PREF
MAN AG
METRO AG
MUENCHENER RUECKVERSICHER /NAM VOLKSWAGEN AG
GREAT BRITAIN
ASTRAZENECA PLC
BARCLAYS PLC
BG GROUP PLC
BP PLC
BRITISH AIRWAYS PLC
BRITISH LAND
ET GROUP PLC
CARPHONEWAREHOUSE GROUP HBOS PLC
HSBC HOLDINGS PLC
LAND SECURITIES GROUP PLC
NATIONAL GRID PLC
NEXT PLC
PEARSON PLC
ROLLS-ROYCE GROUP PLC
ROYAL DUTCH SHELL -8-
ROYAL DUTCH SHELL PLC -A-
TESCO PLC
TRAVIS PERKINS PLC
WPP GROUP PLC :ISS.O5
YELL GROUP PLC
ITALY
ENEL
3,500
1 600
1,600
657
1,300
460
58
1,000
2 100
9A5
3.200
990
3,550
1 200
750
710
980
1,600
440
1,100
1210
10,200
3 000
6,660
10.300
3,700
21,600
7.000
7,500
2 500
3,400
2,700
2 420
6,800
11 YO0
4,350
4.870
17,600
1 600
4.000
9 300
3 700
EUR
EUR
EUR
EUR
EUR
EUR
EUR
EUR
EUR
EUR
EUR
147,158
165.675
122.362
98,704
126 237
39,553
7.116
126,402
94.652
162,434
129.253
1,219,546
0.71
0.79
0.59
0.48
0.61
0.19
0.03
0.61
0.46
0.78
0.62
5.87
EUR
EUR
EUR
EUR
EUR
EUR
EUR
EUR
EUR
133.455
95.862
162,324
109.564
104 307
11 3,224
112,142
74,223
165.960
0.64
0.46
0.78
0.53
0 50
0.54
0.54
0.36
0.80
1,071.061 5.15
GBP
GBP
GBP
GBP
GBP
GBP
GBP
GBP
GBP
GBP
GBP
GBP
GBP
GBP
GBP
GBP
GBP
GBP
GBP
GBP
GBP
64.995
144.830
43,363
72,822
99,252
109,793
129,107
38 294
154.458
43 544
140.059
42.038
107.288
116371
115,926
145,418
163.1 50
153,189
62 676
60,407
109,145
0.31
0 70
0.21
0.35
0 48
0.53
0.62
0 18
0.74
0.21
0 67
0.20
0.52
0.56
0.56
0.70
0 78
0.74
0.30
0 29
0.53 ~. -~
2,116,125 10.18 .-
EUR 39.496 0.19
HSBC Global Investment Funds - - r -~

- -
Portfolio of Investments and Other Net Assets
...
Dcscription Quantity Currency Evaluation % net assets
EN1 SPA ROMA
JAPAN
AEON CO LTO
AlSlN SElKl CO LTD
ASAHl BREWERIES
ASAHl KASEI CORP
BENESSE CORP
CANON INC
CANON MARKETING JAPAN INC DAIWA H INDUSTR CO. LTD
ElSAl CO LTD
FUJI PHOTO FILM CO LTD
FUJITSU LTD
KAWASAKI KEEN
KOMATSU LTD
MlTSUBlSHl ELECTRIC CORP
MlTSUBlSHl MATERIALS CORP
MlTSUl OSK LINES LTD
NIPPON STEEL CORP
NIPPON TEL 8. TEL
NOMURA RESEARCH INSTITUTE LTD OMRON CORP
RlCOH CO LTD
SOMPO JAPAN INSURANCE
INC SONY CORP
TDK CORP
TOKYO ELECTRIC POWER
TOKYO GAS CO LTD
TOKYU CORP
TOSHIBA CORP
TOYOTA MOTOR CORP
WEST JAPAN RAILWAY CO
YAMAHA MOTOR CO LTD
NETHERLANDS
AEGON NV
HEINEKEN NV
ING GROEP NV/ CERT OF SHS
NORWAY -
DNB NOR ASA
NORSK HYDRO AS
SPAIN
BCOPOPULARESPANOL /REG. BCOSANTANDERCENTR HlSP /REG. ENDESA SA
INDRA SISTEMAS SA
4,300
3,600
3,100
2,500
15,000
2.700
2.200
4,700
6,000
1,200
2,800
16 000
4.000
5,200
10.000
14.000
3.000
21,000
22
2,000
2,000
4,000
8,000
2.900
1 300
2.300
19,000
6,000
9,000
3 600
22
1.300
6.200
2.100
3,780
7.000
3 500
5.600
9,450
1930
4.40C
EUR 139.1oa 0.67
178 604
JPY
JPY
J PY
JPY
JPY
JPY
J PY
JPY
JPY
JPY
JPY
JPY
JPY
JPY
JPY
JPY
JPY
J PY
JPY
JPY
JPY
JPY
JPY
JPY
JPY
JPY
JPY
JPY
JPY
JPY
JPY
75,771
108.633
40,092
109.202
100,344
i i a 162
98,502
98.409
57,528
114.514
106,572
37,945
109,423
103 008
66 404
33.295
147.537
116,295
58.866
53.795
90,111
99 716
147.393
112732
78.647
105.9ia
46,735
60 099
230.622
101 548
36,401
0.86 -
0.36
0.52
0.19
0 53
0.48
0.57
0.47
0.47
0.28
0.55
0.51
0 18
0.53
0.50
0.32
0.16
0.72
0.56
0.28
0.26
0.43
0 48
0.71
0.54
o 38
0.51
0.22
0.29
1.12
0.49
0.18
EUR 123,023 059
EUR 108.430 0.52
EUR 158,981 0.77
390.434 1.80 -
NOK 98.456 047
NOK 115 ,a~ i 056
214.337 103 ..
EUR 114,030 0.55
EUR 167.475 0.81
EUR 103667 0.50
EUR 110.248 0.53
.-
Description Quantity Currency Evaluation YO net assets
TELEFONICA SA
SWEDEN
SANDVIK AB
SCANIA AB - B-
SKANDINAV.ENSK.BANKEN A
SKFAB B
VOLVO -6-
SWITZERLAND - -
CREDIT SUISSE GROUP /NOM.
SWISSCOM INAM.
UNITED STATES
ACE LTD
ADOBE SYSTEMS INC
AETNA INC
AIR PRODUCTS & CHEMICALS
ALCOA INC
AMERICAN EXPRESS CO
AMERICAN INTERNATIONAL GP AMERICAN STANDARD ClES INC AMGEN INC
ANHEUSER-BUSCH COS INC
AT & T
BANK OF AMERICA CORP
BAXTER INTL INC.
BEA SYSTEMS INC
BECTON DICKINSON & CO.
BMC SOFTWARE INC.
BRISTOL MYERS SQUIBB CO
CAMERON INTERNATIONAL CORP CAPITAL ONE FINANCIAL CORP CISCO SYSTEMS INC
ClTlGROUP INC
COCA-COLA CO
COUNTRYWIDE FINANCIAL CORP CUMMINS INC
DELL INC
DONNELLEY AND SONS.RR
DOW JONES + CO INC.
DU PONT (E I )DE NEMOURS.
DUKE ENERGY HOLDING
CORP EATON CORP
FPL GROUP INC
GAP INC
GENENTECH INC
GENERAL ELECTRIC CO
GENERAL MILLS INC
GENWAORTH FINANCIAL /-A-
HSBC Global Investment Funds -
6,100
7,000
1,100
3,200
2.000
1,450
2 100
270
2,000
2,500
2 400
470
3,700
1,500
1870
2,000
1.900
2 510
6.980
3,254
2 400
2,100
1,500
3 400
3.260
640
I ,280
7.800
3.600
3,300
2,860
870
1 600
2.300
2,600
780
3,400
1,200
580
5 800
300
7 700
2 000
910
EUR 177143 0.85
672.563 3.24
._ . _-
SEK 122029 0 5 9
SEK 65,506 041
SEK 102,424 049
SEK 40,867 0 2 0
SEK 121 000 058
471,826 227
CHF 151 331 073
CHF 97,117 047 ~-
248,448 1.20 -.
USD
u50
u50
USD
u50
u50
USD
u50
u50
USD
USD
u50
u50
USD
u50
USD
USD
u50
u50
USD
u50
USD
USD
u50
USD
u50
u50
USD
u50
USD
USD
u50
u50
u50
USD
u50
114760
103.825
104,280
34 663
124,616
84,690
125 664
106,160
106,077
125,902
273,406
166,572
127 728
23,213
114.165
106 216
90,987
40,627
96,632
199,354
185,040
98811
i26.oao
84,548
158,763
37,424
86.996
38,516
69 598
99,516
35.786
100,514
24,469
273.734
115,640
31 850
0.55
0.50
0 50
0.17
0.60
0.41
0.60
0.51
0.51
0.61
1.32
0.80
0.61
0.12
0.55
0.51
0.44
0.20
0 47
0.95
0.89
0 76
0.47
0.61
0.18
0.41
0.43
0 19
0.33
0.48
0.17
0.48
0.12
1.33
0.56
0.15
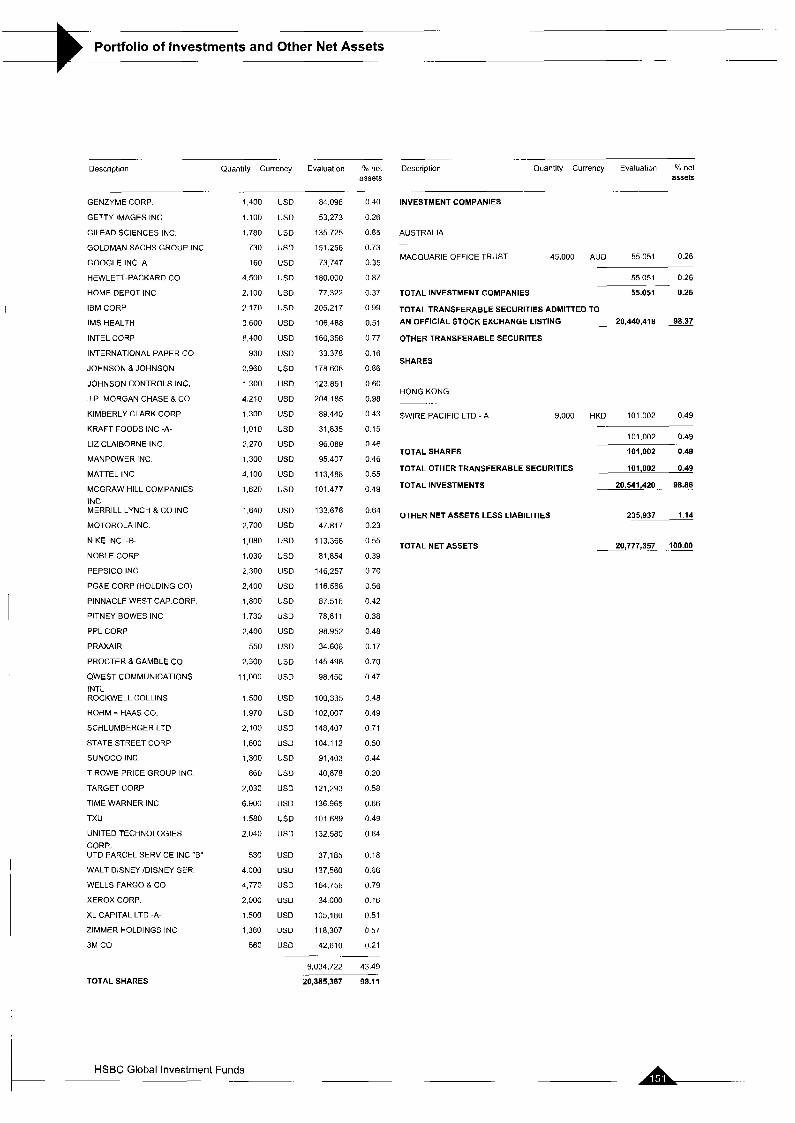
- .-
Portfolio of Investments and Other Net Assets . - ..
..
Description
GENZYME CORP
GETTY IMAGES INC
GILEAD SCIENCES INC
GOLDMAN SACHS GROUP INC
GOOGLE INC A
HEWLETT-PACKARD CO
HOME DEPOT INC
IBM CORP
IMS HEALTH
INTEL CORP
INTERNATIONAL PAPER CO
JOHNSONBJOHNSON
JOHNSON CONTROLS INC
J P MORGAN CHASE & CO
KIMBERLY CLARK CORP
KRAFT FOODS INC -A-
LIZ CLAIBORNE INC
MANPOWER INC
MATTEL INC
MCGRAW HILL COMPANIES INC MERRILL LYNCH & CO INC
MOTOROLA INC
NlKE INC -6-
NOBLE CORP
PEPSICO INC
PG&E CORP (HOLDING CO)
PINNACLE WEST CAP CORP
PITNEY BOWES INC
PPL CORP
PRAXAIR
PROCTER &GAMBLE CO
QWEST COMMUNICATIONS INTL ROCKWELL COLLINS
ROHM + HAAS CO
SCHLUMBERGER LTD
STATE STREET CORP
SUNOCO INC
T ROWE PRICE GROUP INC
TARGET CORP
TIME WARNER INC
TXU
UNITED TECHNOLOGIES CORP. UTD PARCEL SERVICE INC "6"
WALT DISNEY /DISNEY SER
WELLS FARGO & GO
XEROX CORP
XL CAPITAL LTD -A-
ZIMMER HOLDINGS INC
3M CO
TOTAL SHARES
Quantity Currency Evaluation
1,400 USD
1.100 USD
1,780 USD
730 USD
160 US0
4.500 US0
2.100 USD
2 170 US0
3600 USD
8,400 US0
930 US0
2,960 US0
1300 USD
4,210 USD
1.300 US0
1010 US0
2,270 USD
1.300 US0
4,100 US0
1,620 US0
1640 USD
2.700 US0
1,080 US0
1030 USD
2,300 USD
2,400 US0
1,800 USD
1730 US0
2.400 US0
550 US0
2,300 USD
11,000 USD
1.500 USD
1970 USD
2,100 USD
1,600 US0
1,300 USD
860 US0
2030 USD
6.900 USD
1580 US0
2040 US0
530 USD
4000 US0
4,770 US0
2.000 us0 1.500 USD
1380 US0
560 US0
84 098
53,273
135 725
151,256
73,747
180.000
77.322
205,217
106,488
160,356
33 378
178 606
123,851
204.185
89 440
31,835
96,089
95.407
113,488
101 477
133.676
47 817
113368
81.854
146,257
116568
87.516
78.61 1
98.952
34 606
145 498
98.450
100 33s
102,007
148,407
104 112
91,403
40.678
121,293
136 965
101 689
132.580
37 185
137.560
164.756
34 000
105,180
118,307
42,610 .-
9,034,722 43 49
20,385,367 98-11
4.0 net assets _.
0.40
0.26
0.65
0.73
0 35
0 87
0.37
0.99
0.51
0 77
0.16
0.86
0.60
0.98
0 43
0.15
0.46
0 46
0.55
0.49
0.64
0 23
0.55
0.39
0.70
0 56
0.42
0.38
0 48
0.17
0.70
0.47
0.48
0.49
0 71
0 50
0.44
0.20
0 58
0.66
0.49
0 64
0.18
0.66
0.79
0.16
0.51
0 57
0.21
._
Descriplion Quantity Currency Evaluation % net assets
-. .. .- ..
INVESTMENT COMPANIES
AUSTRALIA -.
MACOUARIE OFFICE TRUST 45,000 AUD 55051 0 2 6
55051 026
TOTAL INVESTMENT COMPANIES 55,051 0.26
TOTAL TRANSFERABLE SECURITIES ADMITTEO TO
-
AN OFFICIAL STOCK EXCHANGE LISTING
OTHER TRANSFERABLE SECURITES
SHARES
HONG KONG
SWIRE PACIFIC LTD - A - 9,000
TOTAL SHARES
TOTAL OTHER TRANSFERABLE SECURITIES
TOTAL INVESTMENTS
OTHER NET ASSETS LESS LIABILITIES
TOTALNETASSETS
20,440.418 90.37
HKD 101.002 0 4 9
101,002 0.49
101,002 0.A9
101.002 0.49
20,541,420 ... 98.86
235,937 1.14
-. 20,777,357- -100.00
A- HSBC Global Investment Funds

Portfolio of Investments and Other Net Assets .- - -
GLOBAL EQUITY SRI
Economic Division of Investment
(expressed as a percentage of net assets) . -
%
Banks and financial institutions Holding companies Energy News transmission Electronics and electrical equipment Public services Office equipment and computers Pharmaceuticals and cosmetics Insurance Automobile industry Graphic art and publishing Transport Mechanics, machinery Retail trade, department stores Consumer goods Food Chemicals Internet Software Construction, building materials Other services Aerospace technology Coal mines, heavy industries Investment companies Non-ferrous metals Tobacco and spirits Miscellaneous Biotechnology Textile Forest products and paper industry Real estate companies Healthcare, education and social services Index Options
Other net assets less liabilities
12.74 8.35 6.83 6.68 5.05 4.68 4.67 4.63 4.28 3.89 3.34 3.02 2.98 2.91 2.21 2.17 2.1 1 2.01 1.97 1.76 1.68 1.64 1.46 1.44 1.32 1.21 1.05 I .01 0.59 0.56 0.50 0.12
1.14
Total Net Assets 100.00

- .~
Portfolio of Investments and Other Net Assets .- -
GLOBAL EQUITY TECHNOLOGY Statement of Investments as at 31 March 2007 (expressed in USD)
Description Quantity Currency Evaluation % net assets
68.125
2.600
8.500
2 000
1,500
5,900
3.100
2 250
800
600
1000
1 400
3,000
17
8
12
3,000
1 500
2,000
2,150
4 700
1,100
1,650
18 707
350
900
2,700
17.000
17,000
25 000
GBP 183282 276
346,630 521
__ .. ~
VODAFONE GROUP PLC
HONG KONG .-
ASM PACIFIC TECHNOLOGY LTD KINGBOARD CHEMICALS HOLDINGS TELEVISION BROADCASTS LTD
- .
Description Quantity Currency Evaluation YO net assets HKD 15,338 0.23
HKD 35731 053
HKD 12.502 0.19
.
63571 0 9 5
.-
INVESTMENTS
TRANSFERABLE SECURITIES ADMITTED TO AN OFFICIAL STOCK EXCHANGE LISTING ITALY
~
MEDIASET SPA
TELECOM ITALIA SPA
SHARES EUR 16.232 024
EUR 16,797 0.26
33.029 050
-. ~ BELGIUM
BARCO NV
BELGACOM SA
MOBISTAR
190
1,060
190
400
4,100
600
2 000
99.300
6.950
1 058
210
540
2 890
3 000
1.200
500
180
16 300
1100
2.170
3 400
EUR 17472 026
EUR 47070 071
EUR 16063 024
80605 121
- .
JAPAN -
ALPS ELECTRIC CO
CANON INC
ELPIDA MEMORY INC
FUJI SOFT INC.
IBIDEN CO LTD
KONAMI CORP
KONICA MINOLTA HOLDINGS INC NIPPON TEL & TEL
NTT DATA CORP
NTT DOCOMO INC
RlCOH CO LTD
SHINKO ELECTRIC INDUSTRIES CO TAIYO YUDEN CO LTD
JPY 36299 055
JPY 120849 180
JPY 31.021 0.47
JPY 17869 027
JPY 51,843 078
JPY 37.419 056
JPY 39404 0.59
JPY 89,866 135
JPY 40.660 0.61
JPY 22,197 0.33
JPY 67,583 101
JPY 33.855 051
JPY 41 661 0.63
CANADA
ASTRAL MEDIA INC -A
CGI GROUP INCJSUB.VOT - A -
SHAW C0MMUNIC.-B/NON- VOT.
CAD 13.961 0.21
CAD 35,544 0.53
CAD 22495 0.34
~. . -
72.000 1.08
CAYMAN ISLANDS
SEAGATE TECHNOLOGY
SOLOMON SYSTECH (INTL) LTD
US0 46.840 0.71
HKD 15.629 0.23
62,469 0.94 -
FINLAND 630 526 9.46 - ._
NETHERLANDS NOKIA OY EUR 157831 2 3 7
157.831 237
-.
-
ASML HOLDING NV
KONINKLIJKE KPN NV
OCE NV
WOLTERS KLUWER NV
EUR 52,983 080
EUR 73.391 110
EUR 20.140 030
EUR 49418 074
195,932 2.94 ~
FRANCE -
FRANCE TELECOM SA
LAGARDERE SCA /NOM
METROPOLE TELEVISION SA M6 VIVENDI
EUR 27,653 0.42
EUR 16,178 0.24
EUR 19673 030 NEW ZEALAND -. .-
TELECOM CORP.OF NEW ZEALAND
EUR 116,731 1.75
180.235 271
~. - ~
NZD 63,120 0.95
-. ..
63120 0.95 GERMANY - - OEUTSCHE TELEKOM /NAM
INFINEON TECHNOLOGIES /NAM. SAP AG
WINCOR NIXDORF AG
NORWAY EUR 49.606 075
EUR 18,514 028
EUR 22,236 033
EUR 16776 02.5
107132 1.61 ~ . .-
SCHIBSTED
TANDBERGASA
TELENOR AS
NOK 15,412 0.23
NOK 18670 028
NOK 47,581 0.72
81,663 1.23
.-
SINGAPORE GREAT BRITAIN -- ~
BT GROUP PLC
CSR PLC
DAILY MAIL 8 GENERAL TR. -A-
SAGE GROUP PLC
CHARTERED SEMICONDUCTOR MANUF. SINGAPORE PRESS HOLDINGS LTD STATS CHIPPAC LTD
SGD 16.253 0.24
SGD 49.319 0.75
SGD 30.000 0.45
95,572 144
-. .
GBP 97,428 1.46
GBP 14.281 0.21
GEP 34,474 0.52
GBP 17165 0.26
HSBC Global Investment Funds A -~

. -. _ _
Portfolio of Investments and Other Net Assets
.. .. ..
Description Quantity Currency Evaluation net assets
. -
SPAIN
PROMOTORA DE INFORMACIONES SA TELEFONICA SA
SWEDEN
ENIRO AB
ERICSSON TEL. -8-
MODERN TIMES GROUP AB B- TELELOGIC
SWITZERLAND
LOGITECH INTERNATIONAL SA
UNITED STATES
ACCENTURE LTD /-A-
APPLE INC
APPLIED MATERIALS INC
A T & T
AUTODESK INC.
AUTOMATIC DATA PROCES.
AVNET INC
BMC SOFTWARE INC.
CADENCE DESIGN SYSTEMS
CISCO SYSTEMS INC
COMCAST CORPI-A-
COMPUTER SCIENCES CORP
CONVERGYS CORP
CORNING INC.
DELL INC
DIRECTV GROUP INC
EBAY INC
ECHOSTAR COMMUNICATIONS A ELECTRONIC DATA SYSTEMS
EMBARQ CORP
FISERV INC.
GANNETT CO INC
GOOGLE INC A
HEWLETT-PACKARD CO
IBM CORP
IDEARC INC
INTEL CORP
LAM RESEARCH CORP
LEXMARK INTL INC.
MCGRAW HILL COMPANIES INC MEMC ELECTRONIC MATERIALS MICRON TECHNOLOGY INC
MICROSOFT CORP
MOTOROLA INC.
NEWS CORP -A-
OMNICOM GROUP INC.
2,750
8.313
900
11,800
275
9,200
700
1,800
790
3,600
9 215
870
580
1,000
1 300
1.900
9 350
1,400
840
2,200
900
2,610
3,000
570
1.000
1,800
900
940
540
230
4,480
2,370
190
9,600
1,300
930
1,200
940
3.800
11,870
1 530
1.200
610
HSBC Global Investment Funds
EUR 60,911 0.91
EUR 181 800 2.73
242,711 3.64
._
SEK 11 478 0 17
SEK 43,587 066
SEK 15.973 024
SEK 17418 026
88,456 133
- -
- --
CHF 19,459 0.29
19.459
USD
USD
USD
US0
US0
US0
USD
USD
US0
USD
USD
us0 US0
US0
US0
US0
USD
USD
US0
USD
US0
US0
USD
US0
US0
USD
US0
USD
USD
US0
USD
US0
US0
USD
USD
US0
69,624
74,063
66,600
363,301
32,321
28,298
36.320
40 612
39.786
237 770
36,204
43,940
55,792
20,547
G I 048
68.610
18,833
42,870
50.184
50,553
49.81 1
30,343
106.012
179,200
224,130
6,599
183,264
61,295
54,275
75,168
56,400
44.992
329,392
27.096
27,492
62.415
0.29 ._
1 05
1.11
1 .oo 5.45
0.49
0.42
0.55
0.61
0.60
3.56
0.54
0.66
0.84
0.31
0 92
1.03
0.28
0 64
0.75
0.76
0.75
0.46
1.59
2.69
3.36
0.10
2 74
0.92
0.82
1.13
0.85
0 68
4.94
0.41
0 41
0.94
Description Quantity Currency Evaluation % net ass&
ORACLE CORP 7500 US0 136,200 205
QUALCOMM INC 1,530 USD 64,643 097
QWEST COMMUNICATIONS 7,650 US0 68468 103 INTL SPRINT NEXTEL CORPlFON 2,107 US0 40,033 0 6 0 SER 1 TEXAS INSTRUMENTS INC 980 USD 29,782 045
TIME WARNER INC 7,420 USD 147287 221
VERIZON COMMUNICATIONS 4 140 US0 155540 2 3 4 INC VIACOM INC -E- 1,600 USD 65056 098
WALT DISNEY IDISNEY SER 3,570 USD I22772 184
WESTERN DIGITAL CORP 2,750 US0 47053 071
WESTERN UNION COMPANY 3,350 US0 74404 1 12
YAHOO INC
TOTAL SHARES
INVESTMENT COMPANIES
CANADA
560 USD 17550 026
3,923,948 58 92
~ u . 8 8 9 96.78
YELLOW PAGES INCOME FUND
TOTAL INVESTMENT COMPANIES
INDEX TRACKER
2,100 CAD 24.789 037
~
24,789 0.37
24.789 0.37
UNITED STATES - - ISHARESISW 3,050 US0 173,759 2.61 GL INF TECH S IND
173,759 261
TOTAL INDEX TRACKER 173,759 2.61
TOTAL TRANSFERABLE SECURITIES ADMITTED TO AN OFFICIAL STOCK EXCHANGE LISTING 6,643,437 99.76
TOTAL INVESTMENTS 6.643.437 99.76
-
OTHER NET ASSETS LESS LIABILITIES 15,710 .. 4.24
TOTALNETASSETS ~. 6,659,147 100.00
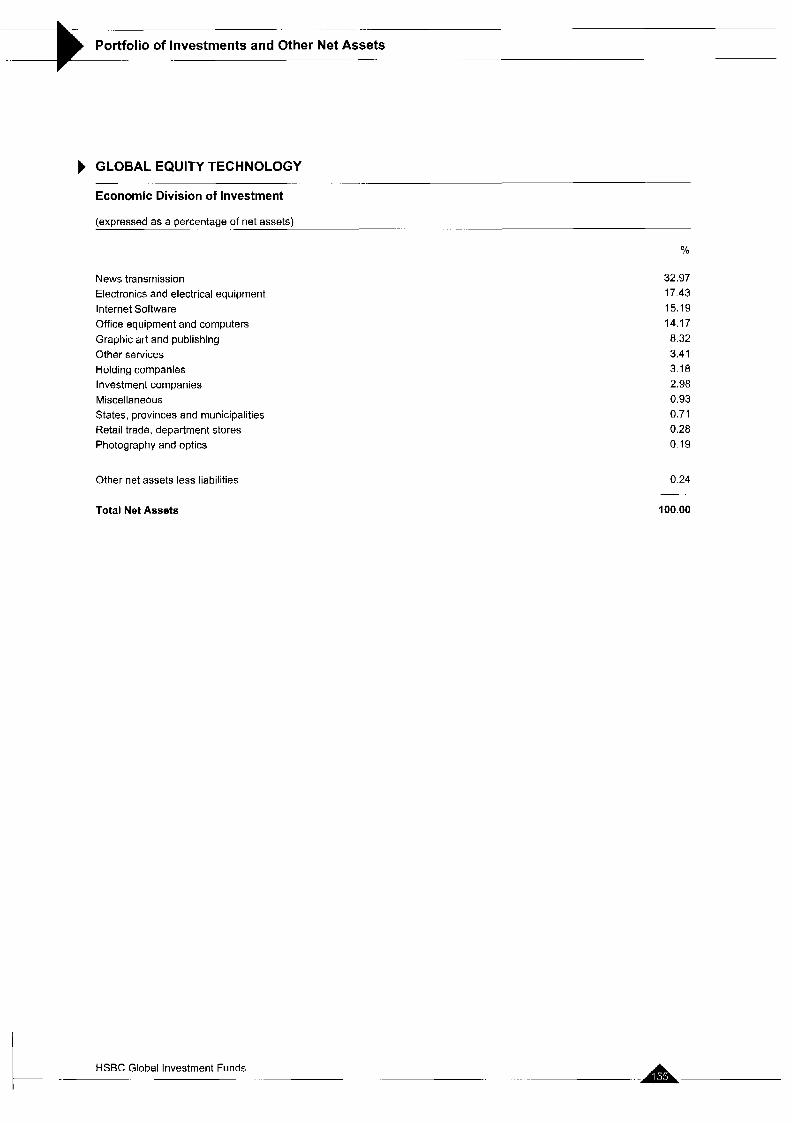
.
Portfolio of Investments and Other Net Assets .. - ._
GLOBAL EQUITY TECHNOLOGY
Economic Division of Investment ~ ._
-.- .... (expressed as a percentage of net assets)
%
News transmission Electronics and electrical equipment Internet Software Office equipment and computers Graphic art and publishing Other services Holding companies Investment companies Miscellaneous States, provinces and municipalities Retail trade, department stores Photography and optics
Other net assets less liabilities
Total Net Assets
32.97 17.43 15.19 14.17 8.32 3.41 3.18 2.98 0.93 0.71 0.28 0.19
0.24
100.00
-
A HSBC Global Investment Funds I ._

Portfolio of Investments and Other Net Assets \-- ._
GLOBAL EX EUROLAND EQUITY Statement of investments as at 31 March 2007 (expressed in EUR)
.. . -
Description Quantity Currency Evaluation % net assets
. . _- NORWAY
...
ACERGY SA
DNB NOR ASA
NORSK HYDRO AS
ORKLAAS A
11.914
26.912
6 129
3 117
8.609
127,799
6,048
6 846
10.178
10.155
3 100
3 977
1,378
7.792
3.180
2 547
1,155
7.302
929
7.473
8.160
16 972
12 830
21 471
18,971
23.457
14,415
16 140
37,888
23.120
8,767
10 826
12,113
40.585
5 916
4,389
13,216
14.411
11,341
28.032
2,796
44,023
10 906
NOK 189.375 0 3 9
NOK 283.855 0 5 8
NOK 152174 0 3 1
NOK 165,343 0 3 4
..
Description Quantity Cmency Evaluation Yo net assets
790.747 1.62 INVESTMENTS
SWEDEN
ELEKTA AB
ERICSSON TEL. -8-
HENNES R MAURITZ AB
NORDEA BANK AB
SKANSKA B
SKFAB B
TRANSFERABLE SECURITIES ADMITTED TO AN OFFICIAL STOCK EXCHANGE LISTING
SHARES
SEK
SEK
SEK
SEK
SEK
SEK
115,312 0.24
353.996 0.72
260525 0.53
83,064 0 17
166,320 0.34
155.607 0.32 AUSTRALIA
BRAMBLES LTD
CANADA
31 349 AUD 258,364 0.53 1.134.824 2.32
258.364 0.53 SWITZERLAND
ALCON INC /NOM
CREDIT SUISSE GROUP /NOM.
NESTLE/NOM
NOVARTIS AG BASEL /NAM.
PHONAK HOLDING AG /NOM.
ROCHE HOLDING AG lGENUSSSCHElN SYNGENTA AG INAM.
UBS AG INAMENSAKTIEN
ZURICH FINANCIAL SERVICES /NAM
USD 307699 0.63
CHF 214,916 0.44
CHF 397.792 0.81
CHF 332,064 0.68
CHF 182,030 0.37
CHF 34C.059 0.70
CHF 161.606 0.33
CHF 326,696 0.67
CHF 200,383 0.41
CANADIAN NATIONAL RAILWAY
9894 CAD 328,873 0.67
328,873 0.87
DENMARK -
A.P. MOELLER - MAERSK A/$ B DANISCO AIS
10 DKK 79.463 0.16
1956 DKK 115,128 0 2 4
194591 0.40
GREAT BRITAIN
2 463,245 5.04 ASTRAZENECAPLC
BAE SYSTEMS PLC
BG GROUP PLC
BHP BILLITON PLC
BIFFA PLC BIRMINGHAM
BP PLC
BRITISH AMERICAN TOBACCO
BRITISH SKY BROADCASTING GROUP BT GROUP PLC
CABLE R WIRELESS PLC /GBP
0.25 COMPASS GROUP PLC
GALLAHER GROUP PLC
GLAXOSMITHKLINE PLC
HSBC HOLDINGS PLC
INTERNATIONAL POWER PLC
LAND SECURITIES GROUP PLC
PRUDENTIAL PLC
RIO TINTO PLC /REG
ROYAL BK OF SCOTLAND PLC
ROYAL DUTCH SHELL -B-
SCHRODERS PLC
SCOTTISH POWER PLC
SEVERNTRENTPLC
VODAFONE GROUP PLC
WPP GROUP PLC /ISS.05
0.54
0.59
0.32
0.34
0 07
1.19
0.70
0.32
0 32
0.25
0.31
0.31
0.96
0 98
0.37
0.30
0.30
0 77
1.07
0.68
0.33
0.14
0 20
0.83
0.37
6582 GBP
42.556 GBP
14,579 GBP
10,057 GBP
6.884 GBP
71.482 GBP
14,633 GBP
18,885 GBP
35.007 GBP
49,000 GBP
265,131
288,572
158 026
167 697
34,332
586,126
340.481
155 922
156,913
120.936
151,310
151 256
468.664
467.004
182.939
146,581
148418
373.893
523,074
330 384
159 690
69 089
96,938
403.109
178,900
UNITED STATES
ACCENTURE LTD I-A-
AKAMAI TECHNOLOGIES INC
ALTRIA GROUP
AMGEN INC
ARCHER-DANIELS MIDLAND co A T R T
BANK OF AMERICA CORP
BEST BUY CO INC
BOSTON SCIENTIFIC CORP.
CISCO SYSTEMS INC
ClTlGROUP INC ClTRlX SYSTEMS INC
COACH INC
COUNTRYWIDE FINANCIAL CORP CVSCAREMARK CORP
DEAN FOODS CO
DEERE & CO.
DOW CHEMICAL CO
EMC CORP
EXELON CORP
EXXON MOBIL CORP
FREEPORT MCMO.COPPRGOLD -B- GENERAL ELECTRIC CO
GOLDMAN SACHS GROUP INC
USD
US0
US0
USD
USD
USD
US0
USD
USD
USD
US0
US0
US0
USD
US0
US0
USD
USD
USD
US0
US0
USD
USD
US0
216.765
306.574
1 109,066
537 157
59:.881
557,251
900.460
528 928
115 985
722.147
89: ,165
208 015
404,301
307 480
1,039,658
205,186
357 012
456 291
147,622
587.674
1,602,669
137 022
1.173.617
1,694,581
0.44
0.63
2 27
1.10
1.21
1.14
1 .E4
1.08
0.36
1.48
1 .e2
0.43
0 83
0.63
2.13
0.42
0.73
0.93
0.30
1.20
3 29
0.28
2.41
3.48
30.283 GBP
9.079 GBP
22882 GBP
35,754 GBP
31.459 GBP
4145 GBP
14,065 GBP
8,812 GBP
17.896 GBP
13,179 GBP
8.537 GBP
5,857 GBP
4.590 GBP
199,804 GBP
15197 GBP
6,125,385 12 54 ~. -~
HSBC Global Investment Funds ..Ap.. --
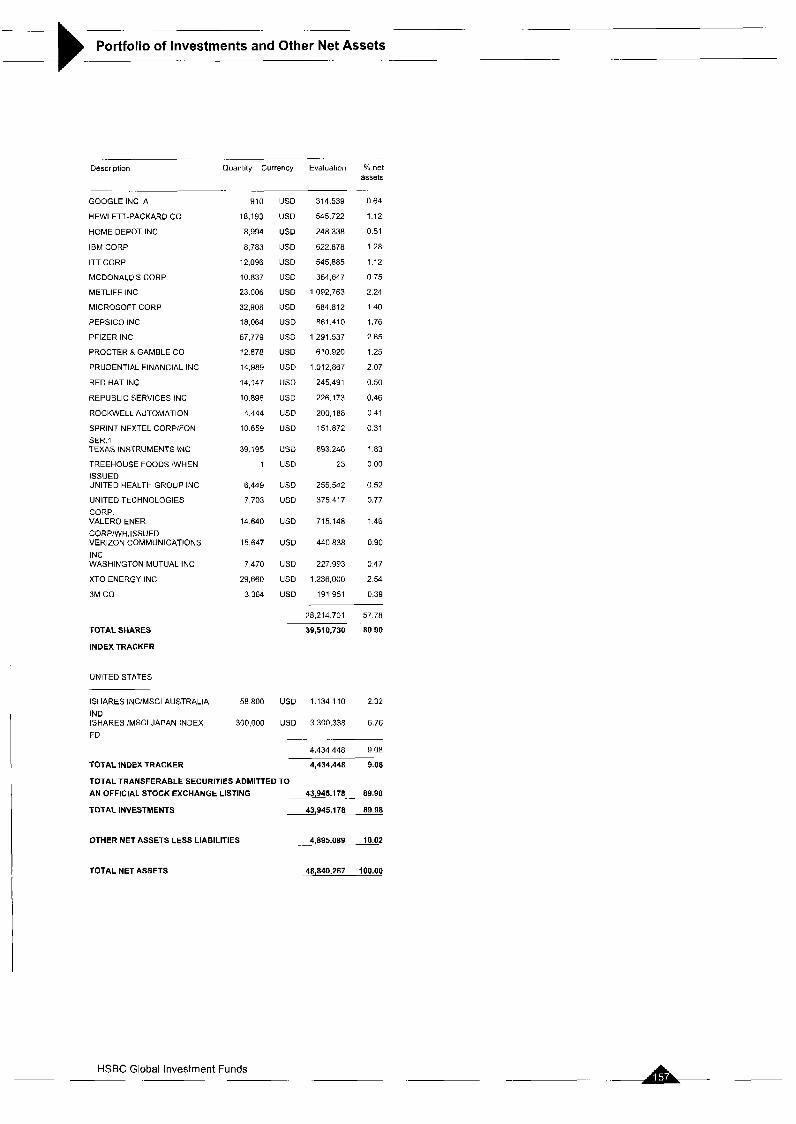
Portfolio of Investments and Other Net Assets __
.-
Description Quantity Currency Evalualion % net
-. ...
GOOGLE INC A
HEWLETT-PACKARD CO
HOME DEPOT INC
IBM CORP
ITT CORP
MCDONALO'S CORP.
METLIFE INC
MICROSOFT CORP
PEPSICO INC
PFIZER INC
PROCTER & GAMBLE CO
PRUDENTIAL FINANCIAL INC
RED HAT INC
REPUBLIC SERVICES INC
ROCKWELL AUTOMATION
SPRINT NEXTEL CORPlFON SER.l TEXAS INSTRUMENTS INC
TREEHOUSE FOODS /WHEN ISSUED UNITED HEALTH GROUP INC
UNITED TECHNOLOGIES CORP. VALERO ENER CORPIWH.lSSUED VERIZON COMMUNICATIONS INC WASHINGTON MUTUAL INC
XTO ENERGY INC
3M CO
TOTAL SHARES
INDEX TRACKER
UNITED STATES
910
18,193
8,994
8 783
12.096
10.837
23 006
32,908
18.064
67,779
12 878
14,989
14.147
10.896
4.444
10659
39,195
1
6 449
7,703
14 640
15.647
7 470
29,660
3 364
US0 314,539
US0 545722
US0 248338
US0 622878
USD 545,885
US0 364,647
US0 1,092,763
USD 684812
USD 861.410
US0 1,291,537
US0 610.920
USD 1,012867
USD 245.491
US0 226.173
USD 200,188
USD 151 872
USD 893.240
US0 23
USD 255,542
US0 375.417
US0 715.148
US0 440,838
US0 227,993
US0 1,236,000
USD 191 951
28,214,701
39,510,730
asset5 -.
0.64
1.12
0.51
1.28
1.12
0 75
2 24
1.40
1.76
2 65
1 25
2.07
0.50
0.46
0 41
0.31
1 83
0 00
0.52
0.77
1 46
0.90
0 47
2.54
0.39
57 78
80.90
-
ISHARES INC/MSCI AUSTRALIA IND ISHARES lMSCl JAPAN INDEX FD
58800 US0 1.134.110 2 3 2
300,000 US0 3 300,338 6.76
_ _ 4.434.448 9 08
TOTAL INDEX TRACKER 4,434,448 9.08
TOTAL TRANSFERABLE SECURITIES ADMITTED TO AN OFFICIAL STOCK EXCHANGE LISTING 43,445,178. 89.98
TOTAL INVESTMENTS 4 3 , 9 4 5 , 1 7 8 89.98
OTHER NET ASSETS LESS LIABILITIES 4,895,089 10.02
TOTALNETASSETS 48,840,267 100.00
A - HSBC Global Investment Funds - -- .

..-
Portfolio of Investments and Other Net Assets __ ._ _ _
GLOBAL EX EUROLAND EQUITY
Economic Division of Investment - -
(expressed as a percentage of net assets) -.
Energy Investment companies Banks and financial institutions Holding companies Pharmaceuticals and cosmetics News transmission Food Retail trade, department stores Office equipment and computers Internet Software Tobacco and spirits Insurance Electronics and electrical equipment Mechanics, machinery Chemicals Public services Aerospace technology Other services Consumer goods Gastronomy Textile Non-ferrous metals States, provinces and municipalities Precious metals Healthcare, education and social services Environmental services & recycling Construction, building materials Agriculture and fishing Transport Miscellaneous
Other net assets less liabilities
%
9.87 9.38 9.03 8.30 8.23 4.79 4.54 4.25 4.18 3.60 3.28 2.95 2.61 2.17 1.57 1.54 1.36 1.34 1.25 1.06 0.83 0.77 0.67 0.62 0.52 0.46 0.34 0.24 0.16 0.07
10.02
Total Net Assets 100.00
_ - . -- HSBC Global Investment Funds

..
Portfolio of Investments and Other Net Assets -. . .. - .-
HONG KONG EQUITY Statement of investments as at 31 March 2007 (expressed in USD)
__ Description Quantity Currency Evaluation % net
assets
1.04
9.23
2.21
1.18
1.95
0.93
0.07
1.77
3.39
1.40
I 22
0.96
8.56
4.53
1.57
1.67
0 94
1 77
2.76
3 42
1.17
1.82
CHINA MERCHANTS HOLDINGS CHINA MOBILE LTD
CHINA NETCOM GROUP CORP HK LTD CHINA RESOURCES ENTERPRISE LTD CHINA UNICOM LTD
ClTlC INTL F N H L D
ClTlC 1616 HOLDINGS LTD
CLP HOLDINGS LTD
CNOOC LTD
HANG LUNG PROPERTIES LTD
HONG KONG EXCHANGES a CLEARING HONGKONG+SHANGH.HOTELS
HSBC HOLDINGS PLC
HUTCHISON WHAMP
IND & COM BOC -H-
KINGBOARO CHEMICALS HOLDINGS LI & FUNG LTD
MASS TRANSIT RAILWAY CORP NEW WORLD DEVELOPMENT CO. LTD SUN HUNG KAI PROPERTIES LTD WING HANG BANK
WING LUNG BANK LTD
530,000
2 165,000
1,809.000
752.000
2.890.000
2,300.000
477.000
518,000
8.250.000
1,072.000
268,000
1,303,703
1051.072
1,006,261
6,000,000
850 000
637,000
1,510,000
2,600.000
631,700
203,000
352,000
HKD
HKD
HKD
HKD
HKD
HKO
HKD
HKD
HKD
HKD
HKD
HKD
HKD
HKD
HKD
HKD
HKD
HKD
HKD
HKD
HKD
HKD -
2.231.308
19,683.839
4,722,332
2,511,575
4,164,128
1,992,527
157 480
3.781.579
7,231,566
2,997,326
2,611,515
2,058,646
18,265,015
9,676 703
3,362 894
3,573,075
2,001,146
3,779,494
5,895.557
7.307.471
2.498.958
3,882.735 ~.
Description Quantity Currency Evaluation YO net assets
INVESTMENTS
TRANSFERABLE SECURITIES ADMITTED TO AN OFFICIAL STOCK EXCHANGE LISTING
SHARES
BERMUDA ISLANDS
ESPRIT HOLDINGS LTD
KERRY PROPERTIES LTD
PEACE MARK(H0LDINGS) LIMITED
740 000
578,000
2 400.000
2,160.000
106,000
648.000
1,716.000
7,664,000
16,120,000
5,484,000
8.707.000
8 300,000
2,580,000
1,188 000
6 770.000
2.984 000
3.240.000
699.934
988,000
2 971.000
2,550,000
961.000
383,000
1.426 000
1 030.000
782.000
HKD 8,678,647 4 06
HKD 2 969.622 1.39
HKD 2,625,821 1 23
-- .. .-
14 274,090 6 68
CAYMAN ISLANDS
AAC ACOUSTIC TECHNOLOGIES HLD AJISEN CHINA HOLDINGS LTD
LIFESTYLE INTL HLD LTD
PANVA GAS HOLDINGS LTD
OIN JIA YUAN MEDIA SERVICES CO TONGDA GROUP HOLDINGS LTD XlNYl GLASS HOLDING CO LTD
HKD 2,048 141 0 9 6
HKD 96,306 005
HKD 1,948.636 091
HKD 944,221 0 4 4
HKD 2,074,711 0.97
HKD 1196,412 056
HKD 2.701 754 127
132.762 621 62.17
201,087,860 94.16 TOTAL SHARES
INVESTMENT COMPANIES
11 010.181 5.16 . - HONG KONG
CHINA
THE LINK REI1 893.500 HKO 2,149,514 1.01 BANK OF CHINA LTD-H
CHINA CONSTRUCTION BANK CORP CHINA LIFE INSURANCE CO LTD-H- CHINA MENGNIU DAIRY CO LTD CHINA PETKOLEUM 8 CHEM CORP -H- CHINA RESOURCES LAND
OONGFENG MOTOR -H
HANGZHOU STEAM TURBINE - B- HARBIN POWER EQUIPMENT CO H NINE DRAGONS PAPER HLDGS LTD SHANGHAI JIN JIANG INT HOT - H- ZHUZHOU CSR TIMES ELECTRIC LTD
HKD 4,334,170 2.03
HKD 4,747,592 2.22
HKD 7.411 803 3.47
HKD 3 397.675 1.59
HKD 5,726,351 2.68
HKD 3.596.976 1.68
HKD 1,766.210 0.83
HKD 1,691,908 079
HKD 1 112.570 0.52
HKD 6,196,951 2.90
HKD 1.484.702 0.70
HKD 1,574,060 0.74
- 43,040,968 20.15
--
2,149,514 1.01
TOTAL INVESTMENT COMPANIES 2.~149.514 1.01
TOTAL TRANSFERABLE SECURITIES ADMITTEO TO AN OFFICIAL STOCK EXCHANGE LISTING
OTHER TRANSFERABLE SECURITES
SHARES
~. 203,237,374 95.17
HKD 3,063,727 1.43
HONG KONG ~
SWIRE PACIFIC LTD - A - 273.000
3,063.727 1.43
3,063.727 1.43
3.063,727-- 1.43
206,301,101 96 60
~. .- TOTAL SHARES
TOTAL OTHER TRANSFERABLE SECURITIES
TOTAL INVESTMENTS
OTHER NET ASSETS LESS LIABILITIES -. . 7,255,801 3.40 HONG KONG
BANK OF EAST ASIA LTD
BElJlNG ENTERPRISES HLD
CATHAY PACIFIC AIRWAYS
CHEUNG KONG HOLDINGS
TOTALNETASSETS HKD 2,227514 1.04
HKD 3,631,286 1.70
HKD 2,620,242 1.23
HKD 9,896,710 4.64
213356.902 I O O Q O
HSBC Global Investment Funds c .. .

_.
Portfolio of Investments and Other Net Assets ..
HONG KONG EQUITY
Economic Division of Investment
~ -
-. ~. (expressed as a percentage of net - . assets) .- . .
Yo
Banks and financial institutions Real estate companies News transmission Holding companies Energy Electronics and electrical equipment Textile Insurance Transport Forest products and paper industry Public services Gastronomy Food Mechanics, machinery Clock and watch-making industry Miscellaneous Investment companies Graphic art and publishing Other business houses Retail trade, department stores Internet Software
Other net assets less liabilities
20.56 15.29 13.39 8.70 6.07 5.77 4.06 3.47 3.00 2.90 2.21 1.66 1.64 1.57 1.23 1-18 1.01 0.97 0.94 0.91 0.07
3.40
Total Net Assets 100.00
A- HSBC Global Investment Funds

Portfolio of Investments and Other Net Assets -3 INDIAN EQUITY Statement of investments as at 31 March 2007 (expressed in USD)
- . - ..
Description QuantityIFace Currency Evaluation “h net Value assets
. .
INVESTMENTS
TRANSFERABLE SECURITIES ADMITTED TO AN OFFICIAL STOCK EXCHANGE LISTING
SHARES
GREAT BRITAIN ~~
CAIRN ENERGY PLC
INDIA ~
ABE LTOIDEMAT.
ADITYA BlRLA NUVO LTD/DEMATER. ALLAHABAD BANK IDEMAT.
ALOK IND LTWDEMAT
AMBIKA COTTON MILLS LTD IDEMAT AMTEK AUTO LTD IDEMAT.
ANANT RAJ INDUSTRIES IDEMAT. ANDHRA BANK I DEMAT.
APOLLO TYRES LTD / DEMAT.
ASHAPURA MINECHEM LTD /DEMAT ASSOC.CEMENT IDEMAT.
BAJAJ AUTO LTD /DEMAT
BAJAJ HINDUSTHAN LTD
BALRAMPUR CHIN1 MILLS IDEMAT. BANK OF BARODA /DEMA1
BANK OF INDIA/DEMAT
BF UTILITIES LTD IDEMAT.
BHARAT FORGE LTD /DEMAT.
BHARAT HEAVY EL./DEMAT.
BHARTI AIRTEL LTD
BOMBAY DYEING & MANUFACTIDEMAT. C 8 C CONSTRUCTIONS LTWDEMAT. CADILA HEALTHCARE LTD IDEMAT. CAIRN INDIA -1MITED
CANARA BANK /DEMAT
CASTROL INDIA IDEMAl
CEAT LTD
CENTURION BANK LIMITED /DEMAT. CESC LTD /DEMAT.
CHENNAI PETROLEUM CORP IDEMAT. CROMPTON GREAVES LTDIDEMAT. CUMMINS INDIA LTD IDEMAT.
3,142,370
49,890
2,551,435
3,821,596
4 605,632
202,228
3,429,352
86,759
6,281.307
1,754,033
1,982.255
4.467 861
230.622
2,354 105
4 868.467
1,500 000
2,374.604
221,634
3.081.120
1,364,206
4.739 193
1,663,856
57.942
2,349.888
22,163,774
10,538 409
1,176,071
898,575
20,691,457
4.750.437
4,265,654
2.896.282
5 347.578
GBP 96,329,450 1 77
96,329,450 1 77
-- -
~. ~
INR 4,069.289
INR 62,706,184
INR 6,390.256
INR 6,029,845
INR 608.956
INR 29,144,451
INR 2222,832
INR 11,008208
INR 11 081.320
INR 9,606.918
INR 76 350.991
INR 12,879,507
INR 10.335.755
INR 7,307,687
INR 7,390,276
INR 9,190,374
INR 11,734,090
INR 22,324,474
INR 71.346.970
INR 83 491,420
INR 20,770,998
INR 226.181
INR 18.135458
INR 66,333,088
INR 47,491,528
INR 5,718,689
INR 2,244,531
INR 17,941.143
INR 41.451 948
INR 17 836,860
INR 13.171 891
INR 32.488.143
0 07
1.15
0 12
0.11
0.01
0.53
0.04
0.20
0.20
0 18
1.40
0.24
0.19
0 13
0.14
0.17
0.22
0.41
1.31
1.53
0.38
0.00
0.33
1.22
0.87
0.10
0.04
0.33
0.76
0.33
0.24
0 60
- ..
Description QuantitylFace Currencv Evaluation % net Value
-. - DHAMPUR SUGAR MILLS LTD DEMAT. DR REDDY S LABORATORIES IDEMAT. OR REDDY S LABORATORIESIADR EMCO LTD IDEMAT.
ERA CONSTRUCTION LTD /DEMAT. EVEREADY INDUSTRIES (I)/DEMAT. FINANCIAL TECHN0,INDIA /DEMAT. GAMMON INDIA LTD IDEMAT.
GANESH HOUSCORP LTDIOEMATER. GATEWAY DISTRIPARKS LTD
GODREJ INDUSTRIES LTDIDEMATER. GRASIM INDUST./DEMAT.
GUJARAT AMBUJA CEMENT IDEMAT. GUJARAT NRE COKE LTD I DEMAT GUJARAT STATE PETRONET IDEMAT. H D F C BANK /DEMAT.
HAVELL S INDIA LTD IDEMAT.
HCL INFOSYSTEMS LTD /DEMAT. HCL TECHNOLOGIES /DEMAT
HEXAWARE TECHIDEMAT.
HINDALCO IND LTD IDEMAT
HINDALCO INDUSTRIES / DEMAT. HINDUJA TMT LTD /DEMAT
HINDUSTAN CONSTR. LTD IDEMAT. HINDUSTAN LEVER
HINDUSTAN LEVER LTD IDEMAT. HINDUSTAN PETR./DEMAT
HINDUSTAN ZINC/DEMAT
HOTEL LEELA VENTURE LTD
HUTCHISON TELECOM.INTL ISADR HUTCHISON TELECOMM.INTERNAT. IEP CO LTD /DEMAT.
IClCl BK LTD /DEMAT.
IClCl BK /SADR
IDEA CELLULAR LTD
IND.DEV.BK INDIAIDEMAT.
INDIA CEMENTS LTDIDEMAT.
INDIAN OIL CORPIDEMAl
INDIAN PETROCHEM IDEMATERIALISE D INFOSYS TECH LTD IDEMAT.
INFOSYS TECHNOL./ SADR
ITC IGDR
ITC LTD IDEMAT
IVRCLINFRASTRUCTVRES AND PROJ JAlN IRRIGATION SYSTEMSIDEMAT JET AIRWAYS INDIA LTD IDEMAT.
762.544
6,450 000
4 398,800
218,000
1,430,000
8.913.429
128,591
6,008.321
1,350,000
1,267,764
1,252,561
2 490,330
2.610.378
12 000,000
36,458 000
1,250,000
310,621
13,092,076
24.000.000
1898,789
5,431,527
11,637,100
158.759
5.447 762
755
2.876 807
4 400.001
1,214 429
7,397,060
6,255 400
28 000,000
1,913,472
2,936.009
995,200
37 711.984
5.000 000
6.719 074
2.856 193
2 700,000
521 934
380.000
7,232 788
38,426.500
7,635,165
655.430
2,453,926
assets -
INR 1,293,473
INR 108,593,887
US0 72,536 212
INR 4.045852
INR 10,446,565
INR 10,536,018
INR 5,493,708
INR 41,677,548
INR 10,015,632
INR 4,804680
INR 4.689.522
INR 120.395 380
INR 6,430,471
INR 11,149 153
INR 40 111,642
INR 27,806,846
INR 3,113,206
INR 39,092,552
INR 162,069,264
INR 7281,238
INR 10.067 869
INR 34,748.031
INR 2,125,383
INR 11,249.155
INR 3506
INR 13,360.846
INR 24,851,545
INR 15 537,080
INR 9,548,553
US0 185 159,841
HKD 56,754 593
INR 17 953,795
INR 57,652,054
USD 39,300.448
INR 83,025,899
INR 8.934.941
INR 25,163.573
INR 26,175.955
INR 16,756.804
INR 24,262,525
US0 19,060,800
USD 25,260,122
INR 134.290.371
INR 50 244,108
INR 6.300.338
INR 35,678,555
0.02
1.99
1.33
0.07
0.19
0.19
0.10
0 76
0.18
0.09
0.09
2.21
0.12
0.20
0.74
0 51
0.06
0.72
2.97
0.13
0.18
0.64
0.04
0.21
0.00
0.25
0 46
0.29
0 18
3.40
1.04
0.33
1 06
0.72
1.52
0.16
0.46
0.48
0.31
0.45
0.35
0.46
2 46
0.92
0.12
0.65
HSBC Global Investment Funds
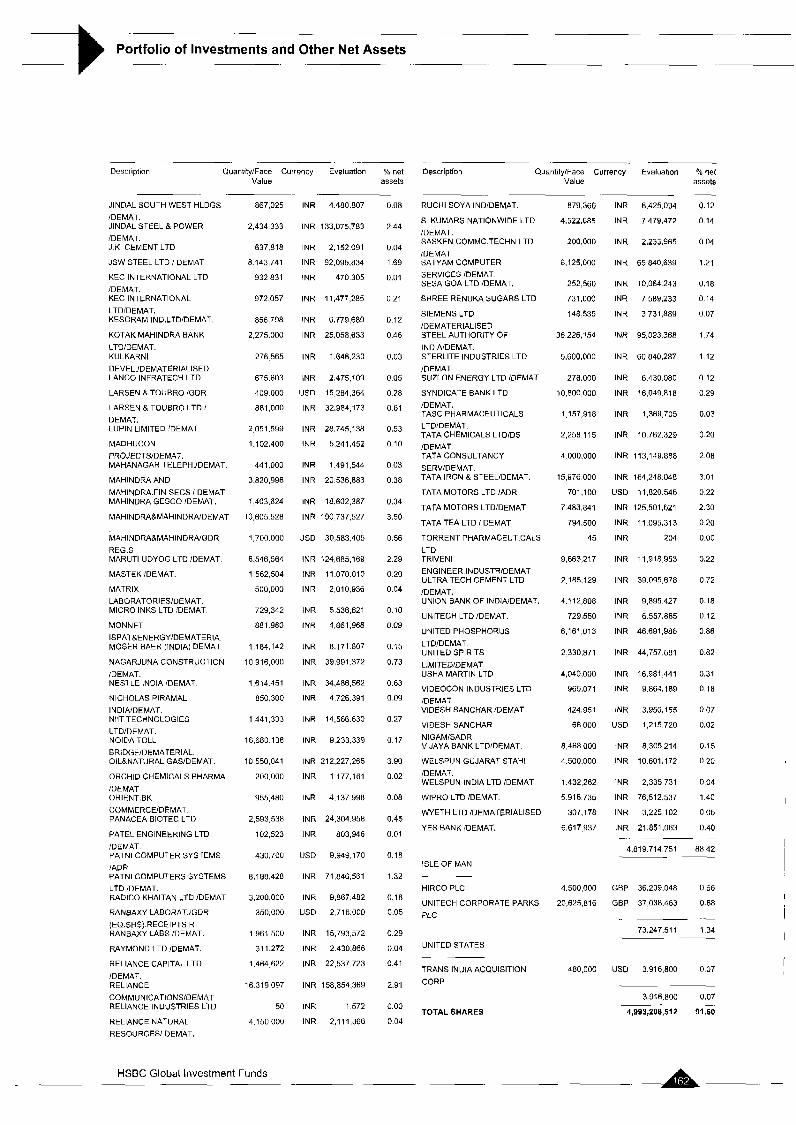
.~
Portfolio of Investments and Other Net Assets
-. - Description Quantity/Face Currency Evaluation % net
Value assets .. . .. ..
JINDAL SOUTH WEST HLDGS lDEMAT JINDAL STEEL & POWER /DEMAT J K CEMENT LTD
JSW STEEL LTD I DEMAT
KEC INTERNATIONAL LTD /DEMAT KEC INTERNATIONAL LTDIDEMAT. KESORAM IND.LTDIDEMAT
KOTAK MAHINDRA BANK
LTD/DEMAT KULKARNI DEVEL IDEMATERIALISED LANCO INFRATECH LTD
LARSEN & TOUBRO IGDR
LARSEN a TOUBRO LTD I DEMAT. LUPIN LIMITED 'DEMAT.
MADHUCON PROJECTSIDEMAT. MAHANAGAR TELEPH.IDEMAT.
MAHINDRAAND MAHlNDRA.FIN SECS I DEMAT MAHINDRA GESCO IDEMAT.
MAHINDRA&MAHINDRNDEMAl
MAHINDRA&MAHINDRAiGDR REG.S MARUTI UDYOG LTD IDEMAT
MASTEK IDEMAT
MATRIX LABORATORIESIDEMAT MICRO INKS LTD IDEMAT
MONNET ISPATLENERGYIDEMATERIA MOSER BAER (INDIA) DEMAT
NAGARJUNA CONSTRUCTION iDEMAT NESTLE INDIA IDEMAT
NICHOLAS PIRAMAL INDIAIDEMAT NllT TECHNOLOGIES LTD/DEMAT NOIDA TOLL BRIDGEIDEMATERIAL OILBNATURAL GAWDEMAT.
ORCHID CHEMICALS PHARMA IDEMAT ORIENT BK COMMERCEDEMAT. PANACEA BIOTEC LTD
PATEL ENGINEERING LTD IDEMAT. PATNi COMPUTER SYSTEMS /ADR PATNI COMPUTERS SYSTEMS LTD rDEMAT. RADICO KHAITAN LTD IDEMAT
RANBAXY LABORATJGDR (EQ.SHS) RECEIPTS R RANBAXY LABS IDEMAT.
RAYMOND LTD IDEMAT
RELIANCE CAPITAL LTD lDEMAT RELIANCE COMMUNICATIONSlDEMAT RELIANCE INDUSTRIES LTD
RELIANCE NATURAL RESOURCES/ DEMAT.
867,025
2,434 333
637,818
8 143,741
932 831
972.057
856,798
2,275.000
276 565
675.603
409 000
881,000
2 051.599
1.102.400
441.000
3,820,996
1403.624
10 605 528
1.700.000
6,546 564
1 562.504
500,000
729,342
aa i 980
1,184.142
10 916,000
1,614.451
850.300
1441,333
16,680 138
10 550,041
200 000
955,480
2,593,538
102,523
430 700
8.188 428
3,200,000
350,000
1961.500
31 1,272
1.464 622
16 319,097
50
4.1 50,000
INR 4.480807
INR 133 075.783
INR 2,152091
INR 92 095,834
INR 470305
INR 11,477,285
INR 6.779.689
INR 25,058,633
INR 1646.230
INR 2,475,109
USD 15 284,364
INR 32,984,173
INR 28,745,138
INR 5,241,452
INR 1,491,544
INR 20 536,883
INR 18,602,387
INR 190 737,527
US0 30,583,405
INR 124,685.169
INR 11.070.010
INR 2,010,936
INR 5.536621
INR 4861,968
INR 8.171 807
INR 39,991.372
INR 34,486,562
INR 4726.391
INR 14,566 630
INR 9233.339
INR 212,227.265
INR 1177.161
INR 4.137998
INR 24.304.958
INR 803,946
USD 9349,170
INR 71,846,561
INR 9,867482
USD 2,716.000
INR 15,793,572
INR 2430.866
INR 22,537 723
INR 158,854,369
INR 1 572
INR 2,111,368
0.08
2.44
0.04
1 .E9
0.01
0.21
0.12
0.46
0.03
0 05
0.28
0.61
0.53
0.10
0 03
0.38
0.34
3.50
0.56
2.29
0.20
0.04
0.10
0.09
0.15
0.73
0.63
0.09
0.27
0.17
3 90
0.02
0 08
0.45
0.01
0.18
1.32
0.18
0.05
0.29
0.04
0.41
2.91
0.00
0.04
. -
Description QuantitylFace Currency Evaluation % net Value assets
RUCHI SOYA INDIDEMAT.
S. KUMARS NATIONWIDE LTD IDEMAT. SASKEN COMMC TECHN.LTD IDEMAT. SATYAM COMPUTER SERVICES IDEMAT SESA GOA LTD IDEMAT.
SHREE RENUKA SUGARS LTD
SIEMENS LTD IDEMATERIALISED STEEL AUTHORITY OF INDINDEMAT STERLITE INDUSTRIES LTD /DEMAT SUZLON ENERGY LTD JDEMAT.
SYNDICATE BANK LTD /DEMAT. TASC PHARMACEUTICALS LTDIDEMAT. TATA CHEMICALS LTDIDS /DEMAT. TATACONSULTANCY SERVIDEMAT. TATA IRON 8 STEEL/DEMAT.
TATA MOTORS LTD IADR
TATA MOTORS LTD/DEMAT
TATA TEA LTD I DEMAT
TORRENT PHARMACEUTICALS LTD TRlVENl ENGINEER.INDUSTR/DEMAT ULTRA TECH CEMENT LTD /DEMAT. UNION BANK OF INDIA'DEMAT.
UNITECH LTD /DEMAT.
UNITED PHOSPHORUS LTD/DEMAT. UNITED SPIRITS LIMITEDlDEMAT USHA MARTIN LTD
VIDEOCON INDUSTRIES LTD IDEMAT. VIDESH SANCHAR (DEMAT
VIDESH SANCHAR NIEAMISADR VIJAYA BANK LTDIDEMAl
WELSPUN GUJARAT STAHL IDEMAT. WELSPUN INDIA LTD IDEMAT.
WIPRO LTD IDEMAT
WYETH LTD IDEMATERIALISED
YES BANK IDEMAT.
ISLE OF MAN - --
HIRCO PLC
UNITECH CORPORATE PARKS PLC
UNITED STATES - -
TRANS INDIA ACQUISITION
CORP
TOTAL SHARES
879.366 INR 6,425.034 0.12
4,522,685 INR 7,479,472 0.14
200,000 INR 2,233,965 0.04
6,125.000 INR 65,840,639 1.21
252,560 INR 10,064243 0.18
731,000 INR 7,589233 0.14
148535 INR 3,731,889 0 0 7
36 226,154 INR 95,023.368 1.74
5,600,000 INR 60.840.287 1 12
278.000 INR 6.430.080 0.12
1o.800 ooo INR 16,049.8ia o 29
1 157,918 INR 1,369,705 0.03
2,258 115 INR 10762,329 020
4 000,000 INR 113,149.888 2.08
15,976 000 INR 164 248.048 3.01
701.100 USD 11,820.546 0.22
7.483.841 INR 125,501,521 2.30
794.500 INR 11 095,313 0.20
45 INR 204 0.00
9,663,217 INR 11.918 953 0.22
2 185.129 INR 39,095,678 0.72
4,112,808 INR 9,895.427 0.18
729,550 INR 6 557,865 0.12
6,161,013 INR 46,691,386 086
2 330.871 INR 44,757.581 0.82
4,040,000 INR 16.981 441 0.31
965,071 INR 9.a64.189 0.18
424.951 INR 3,950,155 0.07
66000 US0 1.215720 0.02
8.468000 INR 8,3C5214 0.15
4 5oo.000 INR io.aoi. i72 0.20
1,432,262 INR 2 335 731 0.04
5 916.735 INR 76,512,537 1.40
307,178 INR 3,225 102 0.06
6,617 937 INR 21,851,063 0.40
4,819 714,751 88 42
.-
~-
4,500,000 GBP 36,209,048 0.66
20,625,816 GBP 37,038,463 0.68
.-
73.247.51 1 1.34 ~. .-
480,000 US0 3.916.800 0.07
-~ 3,916,800 0.07
4,993,206,512 91.60
HSBC Global Investment Funds

- .-
Portfolio of Investments and Other Net Assets -. . -.
~. .. . .-
Description Quantity/Face Currency Evaluation YO net Value assets
. . .. .
WARRANTS I EQUITY LINKED SECURITIES
Descriptian Quantlty/Face Currency Evaluation % net Value assets
TRANSFERABLE SECURITIES TRADED ON ANOTHER REGULATED MARKET
BERMUDA ISLANDS SHARES
CLSA FIN.05- 27.09.lOWRT/GAMMON 0
317000 USD 2,206,563 0.04
2 206,563 0.04 ~
INDIA
SUBEX AZURE LTD /GDR 783.699 US0 10,174,372 0.19
10,174,372 0 19
~. .~ CAYMAN ISLANDS - _ _ _ _ MSDW AS SEC 05- 19 9 OBWRT’ICIC 0
1,570,432 USD 30 800.638 0.57
-
30.800 638 0 57 -
TOTAL SHARES 10,174,372 0.18
TOTAL TRANSFERABLE SECURITIES TRADED ON ANOTHER REGULATED MARKET
OTHER TRANSFERABLE SECURITES
SHARES
10,174,372 0.19 GERMANY
-
DT BKAG 07-2 1.17WRT/CARN IND 0.000001
14 000,000 US0 41.900 31Y 0 76
~. -~
41,900,319 0 76 INDIA
GREAT BRITAIN -- .-
UBS LON 07-23.02 10 WRT/PATNI 0
BROOKE BOND LIPTON INRI0 60
GLENMARK 9,057.923 PHARMACEUTICALS/DEMAT HINDUSTAN LEVER LTD 50
KESORAM TEXT.MILLS LTD I 1,014,882 DM MCDOWELL HOLDINGS LTD 463.854
RELIANCE 1.398.432 ENERGY/DEMATERIALISED RELIANCE IND IGDR144A 165,470
INR 0.00
INR 128,565,384
INR 232
INR 5,828
INR 440.554
INR 15,739.086
US0 10,424,610
0.00
2.36
0.00
0.00
0.01
0.29
0.19
2.85
2.85
-
-
339.641 US0 2,931,000 0.05
2,931,000 0.05 .~
INDIA .-
DEUTSCHE BANK AG 04- 06.08.07 /ON HCL- INFOSYSTEMS LTD 0.000001 MERRILL LYNCH INTL 04- 22 06 09 /ON AMTEK 0.000001 MERR.L.04-13.3.09 PATNI COMPUTER SYSTEMS LTD 0.00001 MSDW ASIA 04-10.8.07 /ON HINDUSTAN PETROLEUM 0.0001
2,167,525 USD 6,474.313 0.12
92.808 USD 789,846 0.01
124,923 USD 1,097.175 002 155.1 75,694
155.1 75,694 ~. .-
TOTAL SHARES
BONDS 1,164,567 USD 6,590,450 0.12
INDIA -
14.951.784 0.27 -
NETHERLANDS HINDUSTAN LEVER NCD 000 000
000 0 0 0
0.00 0.00
4530 INR ~. .~
ABN AMRO 05- 18 12 OGWRTIHCL INF 0 ABN AMRO C’5- 22.12.0EWRT/JINDAL 0
71 769 USD 214372 001
27.862 US0 144.039 000
~-
358,411 001 -.
TOTAL BONDS
WARRANTS I EQUITY LINKED SECURITIES
AUSTRALIA NETHERLANDS ANTILLES ~. ~
MERR.LYNCH 06- 2.5.1 IWRTIGRASIM 0.00001
MACP.07-20.3 09 WRT !IDEA 12,058.928 CELL
29,200 USD 1,409,799 0.03 USD 26,378 905 0.48
~
26378,905 0.48 - 1.409.799 0 03
-. GREAT BRITAIN UNITED STATES
- -
ClTlGRP GMH-17 01 06WRT/IPC UBS LN 06-19 12.07 WRT 119,805 /JINDAL 0 UBS LN06- 1,075,151 13.12.07WRT/DR.REDDYS 0 UBS LN06-15.12 07WRT/JSW 304,000 STEEL 0
US0 6,580,661 0.12
USD 17254.023 0.32
US0 3 303,963 0.06
~. ~
27 138,847 0.50
500.000 US0 2,240,350 0 04
16,300.000 USD 35 693.740 0.66
~
37,934 090 0 70
0.00010 ClTlGRP 07-02 03.09WT/IPC
IDEA 0.000010
TOTAL WARRANTS I EQUITY LINKED SECURITIES 132,492,604 2.43
TOTAL TRANSFERABLE SECURITIES ADMITTED TO
AN OFFICIAL STOCK EXCHANGE LISTING 5,125,701,116 94.03
~. ~
TOTAL WARRANTS I EQUITY LINKED SECURITIES 53.517.552 0.98
TOTAL OTHER TRANSFERABLE SECURITIES - 208,693,246 3.83
5,344,566,734 98.05 TOTAL INVESTMENTS -
.106,231.906 1.95 OTHER NET ASSETS LESS LIABILITIES
A- -
HSBC Global Investment Funds r

-
Portfolio of Investments and Other Net Assets -.
.~
Description PuantlrylFace Currency Evaluation YO net Value assets
TOTALNETASSETS ~ 5,450,800,640 100.00
I
HSBC Global Investment Funds ... ~.
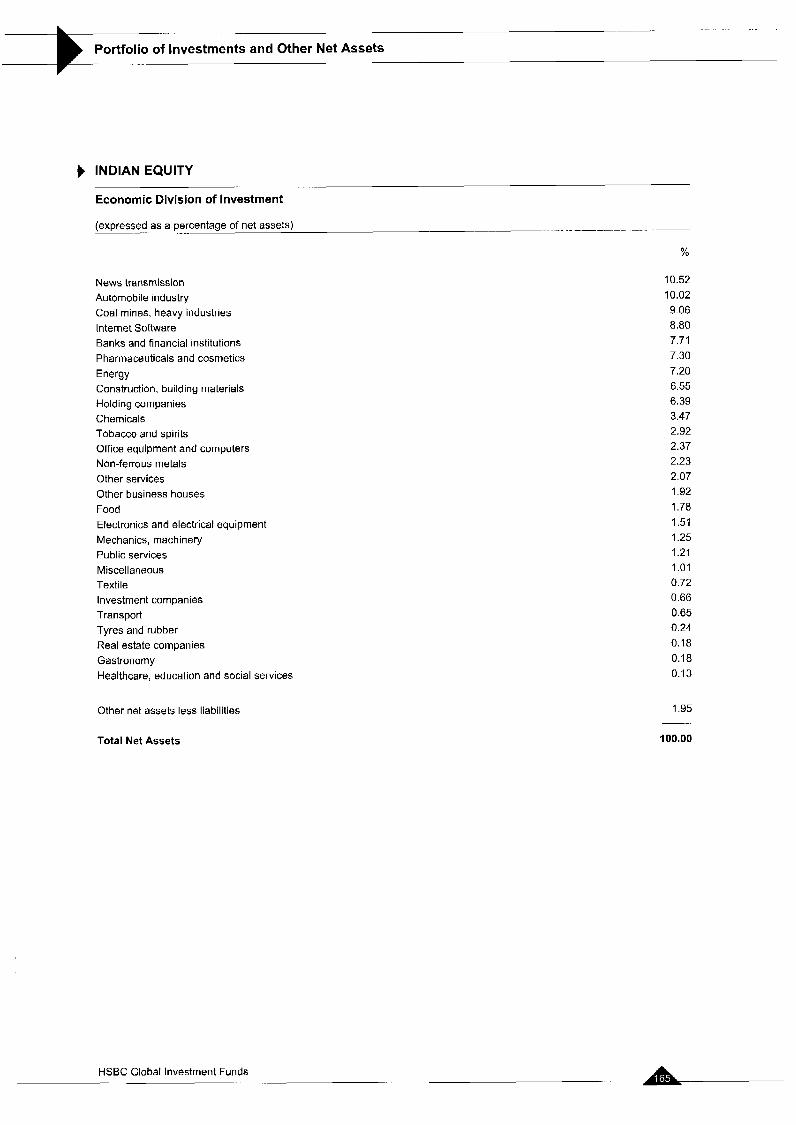
_.
Portfolio of Investments and Other Net Assets
INDIAN EQUITY
Economic Division of Investment
(expressed as a percentage ..-. of net assets) . _. . -~ ~ .- . ..
%
News transmission Automobile industry Coal mines, heavy industries Internet Software Banks and financial institutions Pharmaceuticals and cosmetics Energy Construction, building materials Holding companies Chemicals Tobacco and spirits Office equipment and computers Non-ferrous metals Other services Other business houses Food Electronics and electrical equipment Mechanics, machinery Public services Miscellaneous Textile Investment companies Transport Tyres and rubber Real estate companies Gastronomy Healthcare, education and social services
Other net assets less liabilities
10.52 10.02 9.06 8.80 7.71 7.30 7.20 6.55 6.39 3.47 2.92 2.37 2.23 2.07 1.92 1.78 1.51 1.25 1.21 1.01 0.72 0.66 0.65 0.24 0.18 0.18 0.13
1.95
Total Net Assets 100.00
... A HSBC Global Investment Funds

- - __
Portfolio of Investments and Other Net Assets ... -
JAPANESE EQUITY Statement of Investments as at 31 March 2007 (expressed in JPY)
Description Quantity Currency Evaluation
INVESTMENTS
TRANSFERABLE SECURITIES ADMITTED TO AN OFFICIAL STOCK EXCHANGE LISTING
SHARES
JAPAN
ACOM CO LTD
AEON CO LTD
AEON CREDIT SERVICE LTD
AJINOMOTO CO INC
ALFRESA HLD CORP TOKYO
ASKS CORP
ASTELLAS PHARMA INC
BENESSE CORP
CANON INC
CENTRAL JAPAN RAILWAY CO
CIRCLE K SUNKUS CO LTD
DAIMARU INC
DAlNlPPON SCREEN MANUFACT DAITO TRUST CONSTRUCT
DAIWA SECURITIES GROUP INC DENKl KAGAKU KOGYO KK
DOWA HOLDINGS CO LTD
ElSAl CO LTD
ELPIDA MEMORY INC
FAMILYMART CO LTD
FUJI ELECTRIC HOLDINGS GO LTD FUJI TELEVISION NETWORK INC FUJIKURA LTD
HASEKO CORP
HlTACHl CONSTR MACHIN
HlTACHl HIGH-TECHNOLOGIES CORP HOKUHOKU FINANCIAL GROUP HONOA MOTOR CO LTD
HOYA CORP
IBIDEN CO LTD
INPEX HOLDINGS INC TOKYO
ISETAN CO LTD
ITOCHU CORP
ITOCHU TECHNO-SOLUTIONS
CORP JFE HOLDINGS INC
KANSAI ELECTR POWER CORP KAO CORP
KAWASAKI KISEN
700
89,400
14,500
27,000
3,600
68.000
55,600 25 800
61 300
377
8.700 54,000
43.000
35.200
151 000
105,000
41,000
19.600 27.200
12,800 143 000
1,035
85.000 322.500
23.200
13,800
183.000
87.000
94,021
30,600 186
37 900
337.000
8.200
63,300
104,300
41 000
121,000
HSBC Global Investment Funds
JPY 3.507,OOO
JPY 210 090,000
JPY 28,797.000
JPY 36,612,000
JPY 27 000,000
JPY 89,692,000 JPY 282,448 000
JPY 113.004 000
JPY 388,029,000
JPY 505.180000 JPY 19,140,000
JPY 82 458.000
JPY 38,313,000
JPY 195 360.000
JPY 214,873,000
JPY 57,960 000
JPY 49,118.000 JPY 110 740,000
JPY 124 304.000
JPY 41,984,000
JPY 78.221 000
JPY 282,555 000
JPY 70,635,000
JPY 138 675.000
JPY 74 008,000
JPY 44,436.000
JPY 74,298 000
JPY 357,570,000
JPY 367.622.1 10
JPY 186,966,000
JPY 189 720.000
JPY 77384,500
JPY 393,616 000 JPY 46,330 000
JPY 441.201.000
JPY 353,577.000
JPY 141,450,000 JPY 135 278 000
. ... .. ..
YO net assets
0.01
0.58
0.08 0.10
0.07
0.25
0.77
0.31
1.06
1.39 0 05
0.23
0.1 1
0.54
0.59
0.16
0 13 0 30
0.34
0.12
0.21
0.78
0 19
0.38
0.20
0.12
0.20
0.98
1.01 0.51
0.52
0.21
1.08
0.13
121
0.97
0.39
0.37
Quantity Currencv Evaluation % net assets
KIKKOMAN CORP.
KOKUYO CO LTD
KOMATSU LTD
KONICA MINOLTA HOLDINGS INC KYOCERA CORP
MAKITA CORP
MARUBENI CORP.
MARUI CO LTD
MATSUSHITA ELECTR IND.
MElJl DAIRIES CORP
MILLEA HOLDINGS INC
MINEBEA CO LTD
MlTSUBlSHl CORP
MlTSUBlSHl ELECTRIC CORP
MlTSUBlSHl ESTATE CO
MlTSUBlSHl GAS CHEMICAL
MlTSUBlSHl UFJ FINANCIAL GROUP MlTSUBlSHl UFJ SECURIT. CO
MlTSUl & CO LTD
MlTSUl CHEMICALS INC.
MlTSUl FUDOSAN CO
MlTSUl OSK LINES LTD
MIZUHO FINANCIAL GROUP INC NIKON CORP.
NINTENDO CO.LTD
NIPPON ELECTRIC GLASS
NIPPON MINING HOLDINGS INC NIPPON STEEL CORP
NIPPON TEL & TEL
NIPPON YUSEN K K
NISSAN MOTOR CO LTD
NlTORl CO LTD
NOMURA HOLDINGS INC.
NTT DOCOMO INC
OKUMA CORP
OLYMPUS CORP
ORlX CORP
OTSUKA CORP
RlCOH CO LTD
ROUND ONE CORP SAKAI
SANWA SHUTTER CORP.
SEI HOLDINGS INC
SECOM LTD (SECURITY PATROLS) SEGA SAMMY HOLDING INC
SEVEN & I HOLDINGS CO LTD
SHIN-ETSU CHEMICAL CO
SHINKO SECURITIES CO LTD
SHOWA SHELL SEKIYU KK
SOMPO JAPAN INSURANCE
INC SONY CORP
STANLEY ELECTRIC CO LTD
SUMCO CORP
SUMITOMO CORP.
16,000
25.800 201,200
109,000
37.000
46,200
342 000
2 200
414.000
30 000
30,000
75,000
302,400 432.000
157,000 337,000
1,265
20,000
347.000
300,000
113,000
261.000
1,395
127,000
20.700
76,500
199,000
834.000
687
251,000 197 200
9,250
210 000
1.858 34,000
34,000
10,800
9.400
152.000
139
52.000
1,292
62,400
80.000
11 5.600
46 300
50 000
85.200
140,000
120.000
13,600 27,400
238.000
JPY 24,160,000
JPY 40,222,200 JPY 498,976,000
JPY 168.732.000
JPY 41 1,070,000
JPY 201,894.000
JPY 244 872.000
JPY 3 179,000
JPY 983,250,000
JPY 27.750,OOO
JPY 130,800 000
JPY 54.750.000
JPY 827.064,OOO JPY 524.448.000
JPY 607,590,000
JPY 380,810.000
JPY 1.682,450.00
JPY 26 920,000
JPY 763.400,OOO
JPY 309.000.000
JPY 390,980,000
JPY 341,388,000
JPY 1.058.805.00
JPY 31 5.595.000
JPY 708.975.000
JPY 157,972,500
JPY 202 383 000
JPY 690,552,000
JPY 428.001.000 JPY 237.195.000
JPY 249,063,600
JPY 54205000
JPY 515 550.000
JPY 405,044 000 JPY 46.852.000
JPY 137.020.000 JPY 331,560,000
JPY 106,032,000
JPY 403,560,000
JPY 33,082,000 JPY 38 168,000 JPY 57,752,400
JPY 341,328.000
JPY 220,000,000
JPY 415,004,000
JPY 332 897 000
JPY 29850000
JPY 122.943.600 JPY 205,660,000
JPY 718.800.000
JPY 32,572,000 JPY 134 260 000
JPY 504,560,000
0.07 0.11
1.37
0.46
1.13 0.55
0 67
0.01
2.71
0.08
0.36
0.15 2.27
1.44
1.67
1.04
4 63
0.07
2.09
0.85
1.07
0.94
2.91
0.87
1.95
0.43 0.56
1.89
1.17
0.65
0.68
0.15
1.41 1.11
0.13
0.38
0.91
0.29
1 1 1
0.09
0.10 0.16
0.94
0.60 114
0.91
0.08
0.34
0.56
1.97
0.09
0 37
1.38
..-A- ....
I
.. . ..

. . . .-
Portfolio of Investments and Other Net Assets t- - .-
Descriplion Ouanllty Currency Evaluation Yo net assets
SUMITOMO HEAVY INDUSTRIES SUMITOMO METAL INDUSTRIES SUMITOMO MlTSUl FINANCIAL
GR. SUMITOMO RUBBER IND
SUMITOMO TR + BANKING
SURUGA BANK LTD
TAKEDAPHARMACEUTICAL CO LTD TANABE SE,YAKU CO LTD
TAD HOLDINGS INC TOKYO
TERUMO CORP
TOKUYAMA
TOKYO ELECTRIC POWER
TOKYO ELECTRON CO LTD
TOKYO GAS CO LTD
TOSHIBA CORP
TOYOTA MOTOR CORP
UNI-CHARM CORP
USS CO LTD TOKAl
YAMADA DENKI CO LTD
YASKAWA ELECTRIC CORP
128.000
622,000
902
15400
185 000
104.000
119.400
23,000
39.200
25.400
61,000
146.900
58,817
407,000
580.000
287 197
2 800
9,190
21 370
42,000
JPY 150,272.000
JPY 378 798,000
JPY 965.140 000
JPY 13.881.400
JPY 227.365.000
JPY 159,744,000
JPY 922.962 000
JPY 36,869,000
JPY 318 696.000
JPY 116,586,000
JPY 125,660 000
JPY 592,007,000
JPY 484 652.080
JPY 267 399,000
JPY 456.460 000
JPY 2.168.337.35
JPY 20,888,000
JPY 70 671,100
JPY 234.642 600
JPY 58.464.000
0.41
1 04
2.66
0.05
0.62
0 44
2.54
0.10
0.87
0.32
0.34
1.62
1.33
0 73
1.25
5.96
0.06
0.19
0.64
0.16
TOTAL SHARES
31.727.093,440
31,727,093,440 ~ . .-
67.05
87.05
TOTAL TRANSFERABLE SECURITIES ADMITTED TO AN OFFICIAL STOCK EXCHANGE LISTING -. 31,727,093,440 87.05
TOTAL INVESTMENTS 31.727.093.440 .87.05
OTHER NET ASSETS LESS LIABILITIES 4.720,701,010 12 95
TOTALNETASSETS 36,447,794,450 . j O O s
L - HSBC Global Investment Funds - - I

.-
Portfolio of Investments and Other Net Assets - _. -&- .. -
JAPANESE EQUITY
Economic Division of Investment - -
__ (expressed as a percentage of net assets) ..
%
Holding companies Electronics and electrical equipment Automobile industry Other business houses Pharmaceuticals and cosmetics Transport Public services Chemicals News transmission Coal mines, heavy industries Banks and financial institutions Real estate companies Mechanics, machinery Retail trade, department stores Other services Office equipment and computers Construction, building materials Insurance Photography and optics Energy Textile Food Non-ferrous metals Internet Software Gastronomy Tyres and rubber
Other net assets less liabilities
18.26 17.24 7.90 7.61 4.48 3.35 3.32 3.30 3.06 2.93 2.80 2.74 2.13 1.94 1.54 1.25 1.02 0.56 0.38 0.34 0.25 0.25 0.13 0.13 0.09 0.05
12.95
Total Net Assets 100.00
I . -- -
HSBC Global Investment Funds
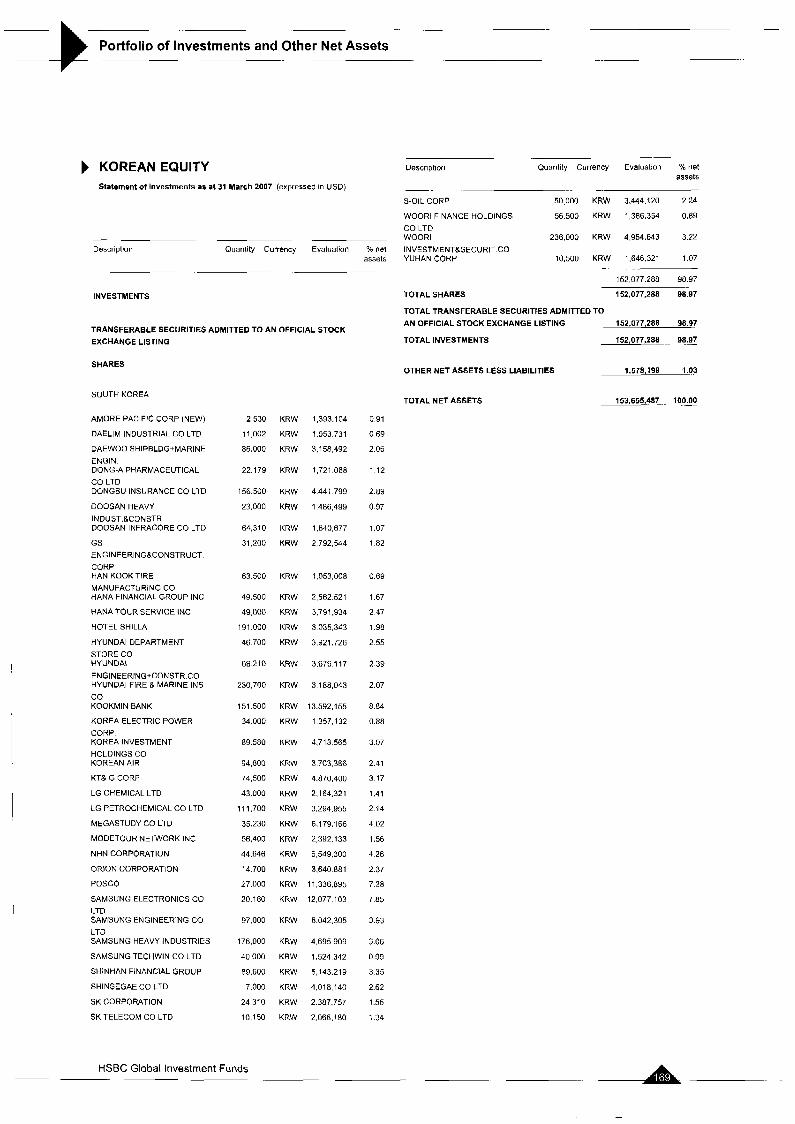
_- -
Portfolio of Investments and Other Net Assets _.
KOREAN EQUITY Statement of Investments as at 31 March 2007 (expressed in USD)
-. - . .
Description Quantity Currency Evaluation % net assets
INVESTMENTS
TRANSFERABLE SECURITIES ADMITTED TO AN OFFICIAL STOCK EXCHANGE LISTING
SHARES
SOUTHKOREA
AMORE PACIFIC CORP (NEW)
DAELIM INDUSTRIAL CO LTD
DAEWOO SHIPELDG+MARINE ENGIN. DONG-A PHARMACEUTICAL CO LTD DONGBU INSURANCE CO LTD
DOOSAN HEAVY INDUST.LC3NSTR. DOOSAN IkFRACORE CO LTD
GS ENGINEERINGLCONSTRUCT. CORP HAN KOOK TIRE MANUFACTURING CO HANA FINANCIAL GROUP INC
HANA TOUR SERVICE INC
HOTEL SHILLA
HYUNDAI DEPARTMENT STORE CO HYUNDAI ENGINEERING+CONSTR.CO HYUNDAI FIRE a MARINE INS
co KOOKMIN BANK
KOREA ELECTRIC POWER CORP. KOREA INVESTMENT HOLDINGS CO KOREAN AIR
KT8 G CORP
LG CHEMICAL LTD
LG PETROCHEMICAL CO LTD
MEGASTUDY CO LTD
MODETOUR NETWORK INC
NHN CORPORATION
ORION CORPORATION
POSCO
SAMSUNG ELECTRONICS CO LTD SAMSUNG ENGINEERING CO LTD SAMSUNG HEAVY INDUSTRIES
SAMSUNG TECHWIN CO LTD
SHINHAN FINANCIAL GROUP
SHINSEGAE CO LTD
SK CORPORATION
SK TELECOM CO LTD
2,530 KRW 1,393.104
1 1 002 KRW 1.053 731
86,000 KRW 3,158,492
22.179 KRW 1,721 068
156500 KRW 4441 799
23.000 KRW 1486.499
64,310 KRW 1,640,677
31.200 KRW 2792.544
63.500 KRW 1,053,008
49.500 KRW 2,562.521
49.000 KRW 3,791,934
191 000 KRW 3,035,343
46.700 KRW 3,921.726
68210 KRW 3.676117
230.700 KRW 3,188,043
151.500 KRW 13,592,155
34.000 KRW 1357,132
89580 KRW 4.713565
94.800 KRW 3.703.386
74,500 KRW 4,870,400
43000 KRW 2,164,321
1 1 1.700 KRW 3,294.955
35.230 KRW 6.179.166
56,400 KRW 2.392.133
44.646 KRW 6,549.300
14700 KRW 3.640 881
27.000 KRW 1 1 336.895
20.180 KRW 12,077.103
97,000 KRW 6.042.305
176.000 KRW 4.695 909
40000 KRW 1.524 342
89.600 KRW 5,143.219
7.000 KRW 4,018,140
24310 KRW 2387.757
10.150 KRW 2,066.180
0 91
0.69
2.06
112
2.89
0 97
1.07
1.82
0.69
1 67
2.47
1.98
2 55
2.39
2.07
8.84
0 88
3.07
2.41
3.17
1.41
2 14
4.02
1.56
4.26
2.37
7.38
7 85
3.93
3 06
0.93
3 35
2.62
1.55
1 34
-. ..
Description Quantity Currency Evaluation % net assets
S-OIL CORP
WOORI FINANCE HOLDINGS CO LTD WOORI INVESTMENTLSECURIT CO YUHAN CORP
TOTAL SHARES
. .
50.000 KRW 3,444,120 2.24
56 500 KRW 1,366,354 0.69
236.000 KRW 4,954.643 322
10,500 KRW 1.646.321 1.07
152,077.288 98.97
152,077,288 98.97
TOTAL TRANSFERABLE SECURITIES ADMITTED TO AN OFFICIAL STOCK EXCHANGE LISTING 152,077,288 98.97
TOTAL INVESTMENTS 152,077,288_.. 98.97
OTHER NET ASSETS LESS LIABILITIES 1.578.199 1.03
TOTALNETASSETS 153,655,481. 100.00
HSBC Global Investment Funds r
-
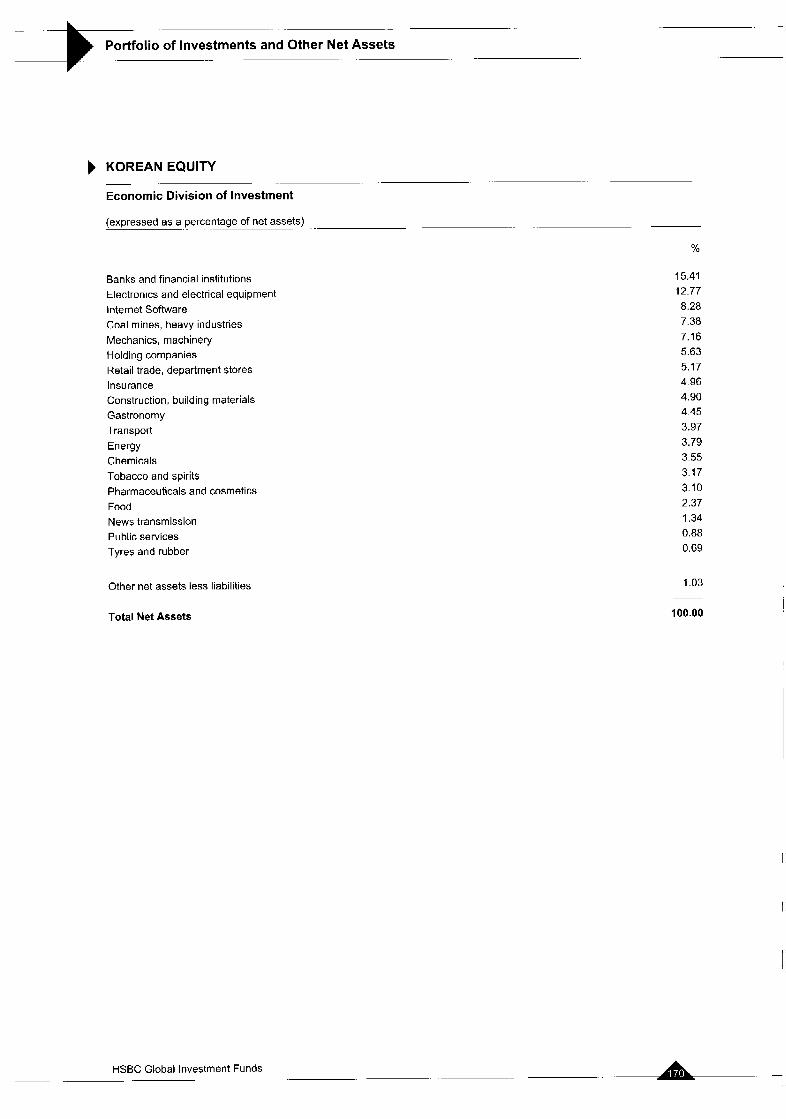
-
Portfolio of Investments and Other Net Assets
KOREAN EQUITY
Economic Division of Investment ~
(expressed as a percentage of net assets) -. - -
%
Banks and financial institutions Electronics and electrical equipment Internet Software Coal mines, heavy industries Mechanics, machinery Holding companies Retail trade, department stores Insurance Construction, building materials Gastronomy Transport Energy Chemicals Tobacco and spirits Pharmaceuticals and cosmetics Food News transmission Public services Tyres and rubber
Other net assets less liabilities
15.41 12.77 8.28
7.16 5.63 5.17 4.96 4.90 4.45 3.97 3.79 3.55 3.17 3.10 2.37 1.34 0.88 0.69
7.38
1.03
Total Net Assets 100.00
A -- HSBC Global Investment Funds
~- -

Portfolio of Investments and Other Net Assets t ~
PAN-EUROPEAN EQUITY Statement of Investments as at 31 March 2007 (expressed in EUR)
~
Evaluatian ~
% net assets
Descriwtion Quantity Currency
GREAT BRITAIN
ANGLO AMERICAN PLC
ASTRAZENECAPLC
BAE SYSTEMS PLC
BARCLAYS PLC
BP PLC
CARPHONEWAREHOUSE GROUP EM1 GROUP PLC
FKI PLC
GKN PLC
HSBC HOLDINGS PLC
JAZZTEL PLC
KAZAKHMYS LIMITED
LADBROKES PLC
NEXT PLC
PUNCH TAVERNS LTD
RESOLUTION PLC
SHIRE PLC
UNILEVER PLC
XSTRATAPLC
241,574 GEP
386887 GBP
2.484.378 GBP
1749.966 GBP
3.157.376 GBP
2,065,744 GBP
1,760,374 GBP
3,757,992 GBP
2 121,788 GBP
1,424.074 GBP
4,850,139 EUR
246.734 GBP
1 GBP
355689 GBP
197.607 GBP
1,574,666 GBP
626,381 GBP
894.253 GBP
262,650 GBP
9.528 243
15,584,281
16,846.546
18,633,567
25,889,317
8 474,600
5.861 670
6,360.358
11.835.021
18,600,678
3,007,086
4 239,491
6
11 825,364
3,612.033
14,250,867
9 707,218
19,952,047
9,982.644
1.30
2 12
2.30
2.54
3.54
1.16
0 80
0.87
1.61
2.54
0.41
0.58
0.00
1.61
0.49
1.94
1.32
2.72
1.36
~. .
Description Quantity Currency Evaluation Yo net assets
INVESTMENTS
TRANSFERABLE SECURITIES ADMITTED TO AN OFFICIAL STOCK EXCHANGE LISTING
SHARES
BELGIUM - _
DEXIA SA
UCB
513,313
169 606
1 255,520
112,962
457,620
423 870
570,756
177,192
170,533
292,545
57,596
230.433
188.988
208.763
336.264
77.167
129,055
250,392
653,220
80.594
312,981
287.967
EUR 11,590,608 1.58
EUR 7,410086 1.01
19,000,694 2.59
-.
-- - CYPRUS
MARFIN POPULAR BANK PUBLIC co
EUR 10,069.270 137
-~ 10.069.270 1 37
.- 214,191,037 29.21 ~ .. ~ DENMARK GREECE
NOVO NORDISK AIS B
FINLAND
DKK 7,778,445 1.06
7,778,445 1.06
- .~
~ .-
BANK OF PIRAEUS
HELLENIC TELECOM
OPAP
148.130 EUR 3,848,417 0.52
620,143 EUR 12,601 306 1.73
250,822 EUR 7,223,674 0.98
23,673,397 3.23
~
NESTE OIL OYJ
NOKIA OY
EUR 11,870,663 1 62
EUR 7.218 506 0.98
19,089.169 2.60
~.
-
IRELAND ~
BANK OF IRELAND
SMURFIT KAPPA PLC
405,943 EUR 6.482.909 0.88
317,283 EUR 5,869,736 0.80
12.352.645 1.68
- .
.~
FRANCE
AXA
BNP PARIBAS
CASINO GUICHARD-PERRACH
CREDIT AGRICOLE SA
GROUPE DANONE
LEGRAND HOLDING ACT.PROV.OP0 SAINT-GOBAIN
SANOFI-AVENTIS
TOTAL SA
VALLOUREC
EUR 17,995936 2.44
EUR 13,758959 188
EUR 12841.135 1.75
EUR 8,551,090 1.17
EUR 7,013,465 0.96
EUR 5,707,825 0.78
EUR 13.762.106 1.88
EUR 13,462,328 1.84
EUR 17.684 124 2.41
EUR 15 147,882 2.06
125,924 850 17.17
~
-
ITALY
EN1 SPA ROMA
INTESASANPAOLOSPA
UNlCREDlTO ITALIAN0 SPA
745,559 EUR 18.087261 247
2.071 279 EUR 11.733.796 1 60
3 055,075 EUR 21,629,931 2.94
51 450,988 7.01 ~ -~
NETHERLANDS -. ~
ARCELOR MITTAL N.V. CLASS A BUHRMANN NV
KONINKLIJKE NUMICO NV
170 174 EUR 6721.873 0.92
865,731 EUR 8.813.142 120
332,965 EUR 12862,438 1.75
28397,453 3 87 GERMANY
PORTUGAL -.
BCO COMM PORTUG./NAM
ALLIANZ AG lNAM
COMMERZBANK AG
DEUTSCHE POSTAG BONN
E.ON AG
HEIDELBERGER DRUCKMASCHINEN AG LANXESS AG
EUR 19.811.233 2.71
EUR 8 350,573 1.14
EUR 14,854223 2 0 2
EUR 8,175.455 1.11
EUR 10.691,431 1.46
EUR 11.040.655 1.50
72.923 570 9.94
-. .
~ --
2.909.075 EUR 7,854,503 I 07
7,854.503 1.07
~
. SPAIN
ACCIONA SA
ALTADIS SNREG.
BANCO BILBAO VIZ.ARGENTARIA lNAM ENDESA SA
108,871 EUR 17.539.118 2.39
100,279 EUR 4.825425 0.66
1.196.849 EUR 21,902.338 2.98
186,828 EUR 7.525432 1.03
HSBC Global Investment Funds

Portfolio of Investments and Other Net Assets E- .. -
-. . . -
Doscription Quantity Currency Evaluation % net assets
GAMESA CORP TECNOLOGICA 435,440 EUR 11,573.995 1.58 SA TELEFONICA SA 1.017.068 EUR 16,679,915 2.27
80.046.223 10 91
- - . -
.-
SWEDEN
ERICSSON TEL. -8- 3 024,482 SEK 8,377,673 1.14 ~
8,377.673 1.14
SWITZERLAND
JULIUS BAER HOLDING 131.675 CHF 13,396,146 1.83
INAMENAKT NOVARTIS AG EASEL INAM 390439 CHF 16,638,945 2 2 6
SYNGENTA AG /NAM 99,482 CHF 13.919 362 1.90
TOTAL SHARES
43 954.453 5 99
725,084,370 98.84
TOTAL TRANSFERABLE SECURITIES ADMITTED TO AN OFFICIAL STOCK EXCHANGE LISTING 725,084,370 . 98.84
TOTAL INVESTMENTS .725.084.370 98.84
OTHER NET ASSETS LESS LIABILITIES 8.534.066 -1.16
TOTAL NET ASSETS 733,618,436. 100.00 ~.
- HSBC Global Investment Funds
. -

- -
Portfolio of Investments and Other Net Assets ._
PAN-EUROPEAN EQUITY - - - .
Economic Division of Investment
-. (expressed as a percentage of net assets) -. .
%
Banks and financial institutions Energy Pharmaceuticals and cosmetics Insurance News transmission Food Mechanics, machinery Construction, building materials Chemicals Electronics and electrical equipment Coal mines, heavy industries Holding companies Miscellaneous Aerospace technology Public services Transport Real estate companies Gastronomy Non-ferrous metals Office equipment and computers Retail trade, department stores Graphic art and publishing Tobacco and spirits
Other net assets less liabilities
Total Net Assets
21.50 10.04 9.61 7.09 6.53 5.43 5.13 4.27 3.40 3.23 2.86 2.54 2.41 2.30 2.14 2.02 1.75 1.47 1.30 1.20 1.16 0.80 0.66
1.16 .-
100.00
A HSBC Global Investment Funds r

- -
Portfolio of Investments and Other Net Assets .- --
PAN-EUROPEAN EQUITY HIGH DIVIDEND Statement of Investments as at 31 March 2007 (expressed in EUR)
Description Quantity Currency Evaluation % net assets
58500 EUR 820,170 099
- . .~
. --
15 294,766 18 50
~
UNITED INTERN.&CO/NAMENSAKT
GREAT BRITAIN _. .-
ASTRAZENECAPLC
BARCLAYS PLC
BRITISH LAND
CARPHONEWAREHOUSE GROUP FIRST CHOICE HOLIDAYS
HOME RETAIL GROUP PLC
VODAFONE GROUP PLC
-. . -.
Description Quantity Currency Evaluation % net assets
73.575 GBP 2.963690 3.59
121,149 GBP 1289.990 156
74925 GBP 1.667272 2.02
254.145 GBP 1.042616 1.26
209,396 GBP 679.837 106
280,550 GBP 1,838.409 2.22
921.583 GBP 1.859.312 2.25
11 541,126 1396 ~~
. .-
- .
INVESTMENTS
TRANSFERABLE SECURITIES ADMITTED TO AN OFFICIAL STOCK EXCHANGE LISTING
SHARES
AUSTRIA
OMV AG
ZUMTOBEL AG
GREECE
29 700
37,155
158 500
61,894
46,691
68311
19.868
75,226
17.636
41,277
19 110
22,770
24.700
67.758
38.217
10,110
12,275
48 571
14 520
10.346
87,081
44,793
23,802
58,380
20,168
BQ NATIONA GRECElNOM - S.CP. HELLENIC TELECOM
OPAP
EUR 1,403 325 1.70
EUR 943,737 114
2,347.062 2.84 ~
-.
37.425 EUR 1 511.970 1.83
63,500 EUR 1,290,320 1.56
37.638 EUR 1,083,974 1.31
3386,264 4 70
.-
. -
BERMUDA ISLANDS ~ .-
CATLIN GROUP LTD IRELAND GBP 1,159,347 1.40
1,159,347 1.40 ~. C&C GROUP PLC
ITALY
125304 EUR 1428466 1.73
1,428,466 I 73
.-
-
CZECH REPUBLIC
TELEFONICA 0 2 CZECH REPUBLIC
CZK 1,202,901 1.46
1.202,901 1.46 ASSlCURAZlONl GENERAL1 SPA BCA POPOLARE Dl MILANO
CAPlTALlA SPA
EN1 SPA ROMA
69.200 EUR 2.210248 2.67
62,133 EUR 720743 0.87
282.276 EUR 1,898,885 2.29
121,589 EUR 2,949,749 3.58
7,771,635 9.41
- .
.
FINLAND .~
KEMIRA OYJ EUR 797,015 096
797,015 0 9 6
~-
~~
FRANCE
AXA
BNP PARIBAS
NATlXlS
NEOPOST
NEUF CEGETEL
RENAULT SA
SAINT-GOBAIN
STE AIR FRANCE
SUEZ
VIVENDI
WENDEL INVESTISSEMENT
NETHERLANDS
EUR 2,153846 260
EUR 1542,750 187
EUR 1367,609 1 65
EUR 1.865.889 2 26
EUR 1,147.501 139
EUR 1,678622 2.03
EUR 1.658,111 201
EUR 834.860 1.01
EUR 2,700 156 3.26
EUR 1157,593 140
EUR 1,271,939 154
ARCELOR MITTAL N.V. CLASS A ING GROEP NV/ CERT. OF SHS
KONINKLIJKE KPN NV
SNS REAAL NV
USG PEOPLE NV
48,964 EUR 1934,078 234
70,213 EUR 2,214,518 268
121,220 EUR 1419,486 172
52,099 EUR 902,355 109
24.222 EUR 751,851 0.91
7,222,288 8 74
~
- NORWAY _ - NORSKE SKOGINDUSTRIER AS
STATOIL ASA
92,771 NOK 1.194,551 1.45
140,660 NOK 2,694,432 3.50
4,088 983 4.95
.~
- 17,378,876 21.02
~. GERMANY SPAIN
.-
BCO SANTANDER CENTR. HlSP /REG.
ALLIANZ AG INAM.
COMMERZBANK AG
DEUTSCHE BANK AG INAM.
DEUTSCHE BOERSE AG lNAM
DEUTSCHE POST AG. BONN
HEIDELBERGER ORUCKMASCHINEN AG HYPO REAL ESTATE HOLDING AG PROSIEBEN SAT lMED NORZ.
RWE AG (NEU). ESSEN A
EUR 1,884.335 2 2 8
EUR 1,619843 196
EUR 1,467827 178
EUR 1759.958 213
EUR 1,980,222 2 3 9
EUR 1,530,129 185
EUR 1,121,788 136
EUR 1,524,886 184
EUR 1585,608 192
100863 EUR 1340469 1.62
1.340.469 1 62
SWEDEN
ENlRO AB
HENNES R MAURITZ AB
NORDEA BANK AB
SKFAB B
21,461 SEK 205,244 0 2 5
34,333 SEK 1,478,938 179
100,260 SEK 1,198,957 145
56,230 SEK 861.620 104 . -
3,744,759 4.53
HSBC Global Investment Funds
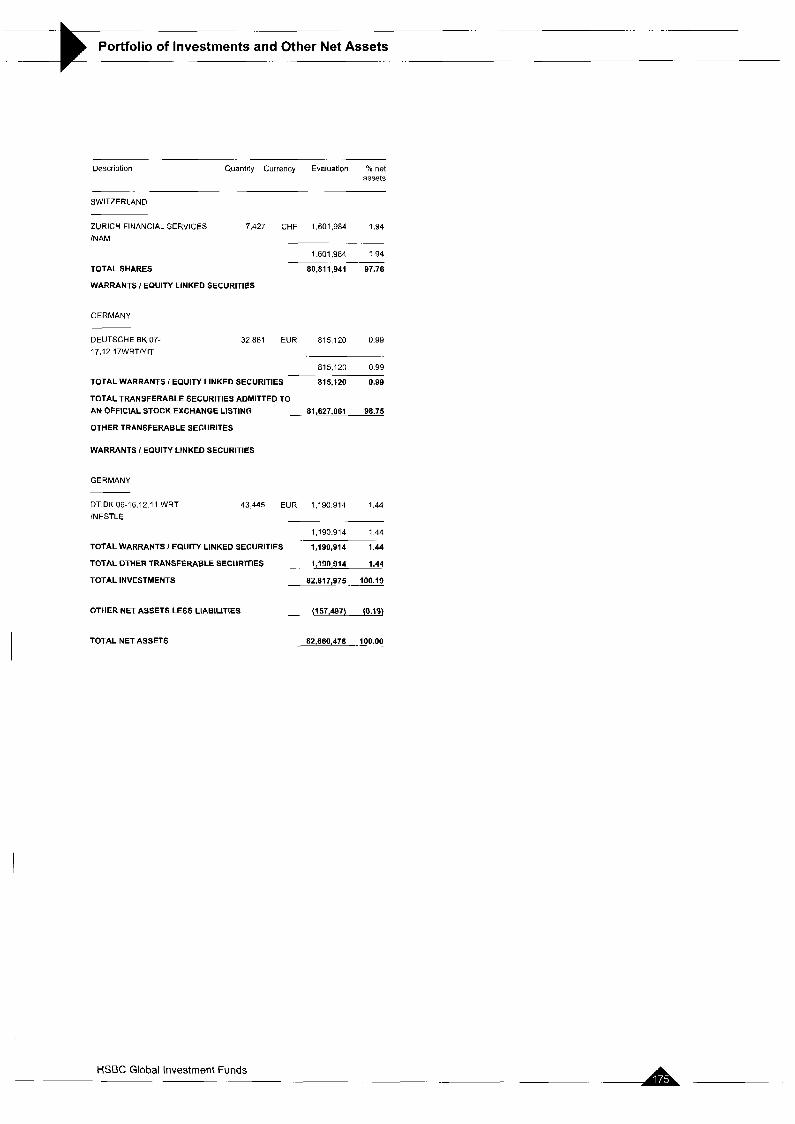
__
Portfolio of Investments and Other Net Assets - .
Description Quantity Currency Evaluation YO net assets
-. ..
SWITZERLAND
ZURICH FINANCIAL SERVICES 7.427 CHF 1,601,984 1.94 INAM
~
TOTAL SHARES
WARRANTS / EQUITY LINKED SECURITIES
I .mi ,984 1.94 - -~ 80.811.941 97.76
GERMANY
DEUTSCHE BK 07- 32,881 EUR 815,120 0 9 9 17 12 17WRTIYIT
815,120 099
TOTAL WARRANTS / EQUITY LINKED SECURITIES 815,120 0.99
TOTAL TRANSFERABLE SECURITIES ADMITTED TO
-
AN OFFICIAL STOCK EXCHANGE LISTING - a i , m , o m 98.75
OTHER TRANSFERABLE SECURITES
WARRANTS / EQUITY LINKED SECURITIES
GERMANY
DT BK 06-16.12 11 WRT 43445 EUR 1,190914 1.44 /NESTLE -~
1,190914 144
TOTAL WARRANTS I EQUITY LINKED SECURITIES 1,190,914 1.44
TOTAL OTHER TRANSFERABLE SECURITIES - 1-,190,914 1.44
TOTAL INVESTMENTS 82,817,975 100.19
OTHER NET ASSETS LESS LIABILITIES
TOTAL NET ASSETS
- (157,497) (0.19)
82.660.478 .lJO.OO
I
A HSBC Global Investment Funds -~

Portfolio of Investments and Other Net Assets - . -
PAN-EUROPEAN EQUITY HIGH DIVIDEND ~
Economic Division of Investment
(expressed as a percentage of net assets) . -
YO
Banks and financial institutions Insurance News transmission Energy Public services Coal mines, heavy industries Pharmaceuticals and cosmetics Transport Electronics and electrical equipment Retail trade, department stores Mechanics, machinery Gastronomy Miscellaneous Holding companies Graphic art and publishing Automobile industry Investment companies Construction, building materials Other services Tobacco and spirits Forest products and paper industry Chemicals
Other net assets less liabilities
24.44 10.89 9.78 8.78 5.18 3.88 3.59 3.40 3.40 3.05 2.89 2.37 2.22 2.13 2.09 2.03 2.02 2.01 1.90 1.73 1.45 0.96
(0.19)
Total Net Assets 100.00
I
. - HSBC Global Investment Funds
- -

- -
Portfolio of Investments and Other Net Assets .- --
SINGAPORE EQUITY Statement of Investments as at 31 March 2007 (expressed in USD)
- .. - - Description Quantity Currency Evaluation net
assets
INVESTMENTS
TRANSFERABLE SECURITIES ADMITTED TO AN OFFICIAL STOCK EXCHANGE LISTING
SHARES
ISRAEL
SARIN TECHNOLOGIES LTD
SINGAPORE
ALLGREEN PROPERTIES LTD
BANYAN TREE HOLDINGS LTD
HO BEE INVESTMENT LTD
HOTEL PROPERTIES
HTL INTERNHTL HLDGS LTD
INTER-ROLLER ENGINEERING LTD JARDINE CYCLE 8 CARRIAGE LTD KEPPEC C O W LTD
MEIBAN GROUP
OVERSEA-CHINESE BK CORP
SC GLOBAL DEVELOPMENTS LTD SINGAPORE AIRLINES LTD
SINGAPORE PRESS HOLDINGS LTD SINGAPORE TELECBOARD LOT 1000 STRAITS ASIA RESOURCES LTD STRAITS TRADING CO STCL
SUNNINGDALE TECH LTD
UNITED TEST & ASSEMBLY CENTER UTD OVERSEAS BANK /LOCAL
VENTURE CORPORATION LTD
WHEELOCK PROPERT(SINGAP0RE) LTD
TOTAL SHARES
INVESTMENT COMPANIES
BERMUDA ISLANDS
9,787.000 SGD 3,968,619 3.53
3.968 619 3.53 - .-
6 419,500
2.740 000
5.680,OOO
2 882,000
2,259.500
7,650 000
376,000
389,000
1,700.000
821,000
370,000
436 000
1.276.000
2,252.300
6,457 000
639,000
1,287.000
4,900,000
355,000
495,000
2,570,000
SGD
SGD
SGD
SGD
SGD
SGD
SGD
SGD
SGD
SGD
SGO
SGD
SGD
SGD
SGD
SGD
SGD
SGD
SGD
SGD
SGD
7,407 198
3,956,484
8 463.918
9,691.229
1,355,715
4,514,391
2,950.1 87
4.073 241
325,059
4 871.922
1,131.969
4.772 097
3,701.843
4,670,962
4 427.706
1,744,219
246.088
2 940.033
A,915.439
4,765 108
5,490,259
6 59
3 52
7.53
8 63
121
4 02
2 62
4 33
0 29
4.33
101
4 24
3 29
4.33
3 94
1 55
0 22
2.62
4 37
4 24
4 88
87.415 127 77.76
91,383,746 81.29
MACQUARIE NTL INFRASTRUCTURE
11 190,000 SGD 8,189,696 7 29
-~ 8 189,696 729
TOTAL INVESTMENT COMPANIES 8,189,696 7.29
~- Description Quantity Currency Evaluation % net
assets ..
WARRANTS I EQUITY LINKED SECURITIES
SINGAPORE
SC GLOBAL DEVTS 05- 1,502,000 SGD 3,070,056 2.73 10 12 lOWRT
3,070,058 2 73
TOTAL WARRANTS I EQUITY LINKED SECURITIES 3,070,056 2.73
TOTAL TRANSFERABLE SECURITIES ADMITTED TO AN OFFICIAL STOCK EXCHANGE LISTING 102L643,498 91.31
TOTAL INVESTMENTS 102,643,498 91.31
OTHER NET ASSETS LESS LIABILITIES 9,773.645 8.69
112,417,143 100.00 TOTALNETASSETS
HSBC Global Investment Funds r
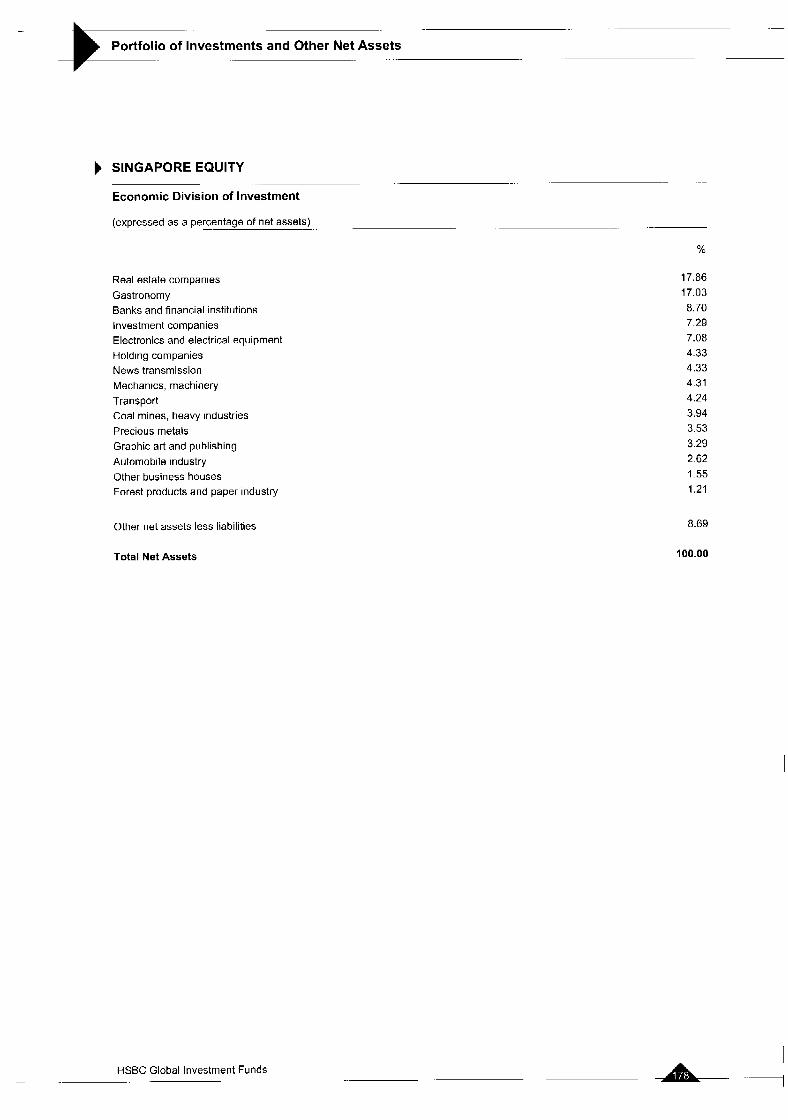
-
Portfolio of Investments and Other Net Assets -
SINGAPORE EQUITY
Economic Division of Investment
(expressed as a percentage .. - of net assets) - -
%
Real estate companies Gastronomy Banks and financial institutions Investment companies Electronics and electrical equipment Holding Companies News transmission Mechanics, machinery Transport Coal mines, heavy industries Precious metals Graphic art and publishing Automobile industry Other business houses Forest products and paper industry
Other net assets less liabilities
17.86 17.03 8.70 7.29 7.08 4.33 4.33 4.31 4.24 3.94 3.53 3.29 2.62 1.55 1.21
8.69
Total Net Assets 100.00
HSBC Global Investment Funds -
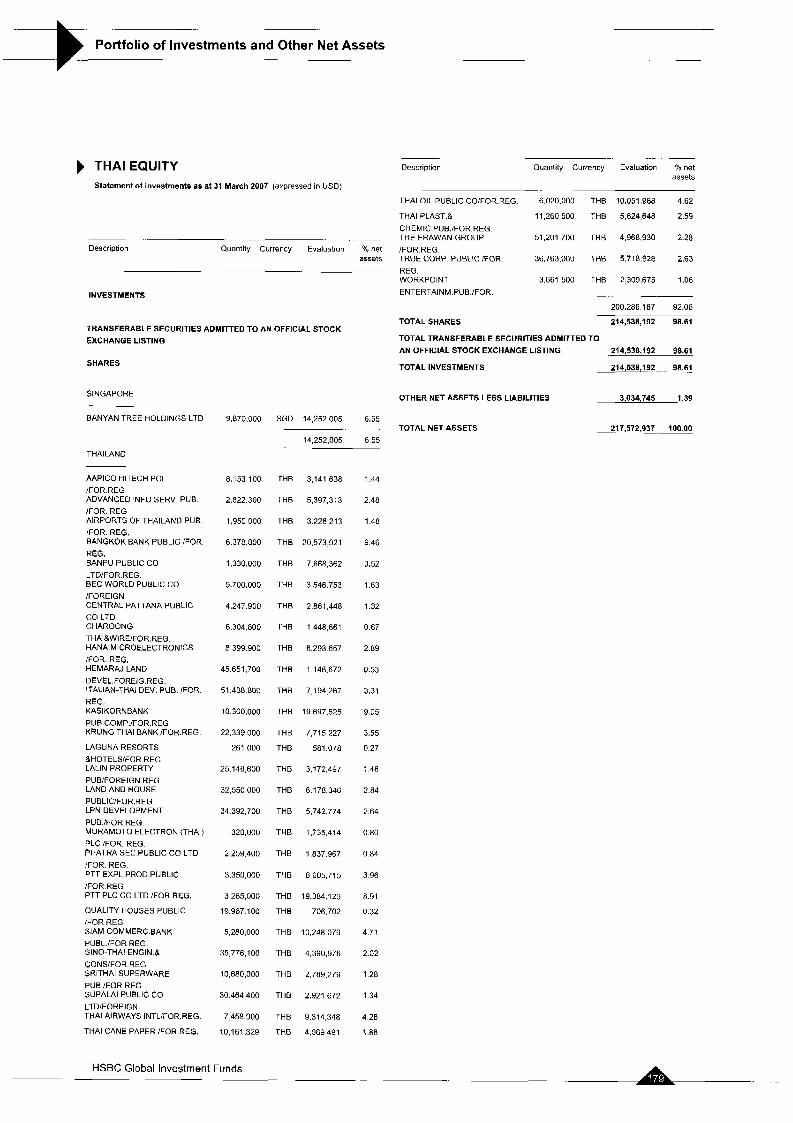
- .-
Portfolio of Investments and Other Net Assets
THAI EQUITY Statement of investments as at 31 March 2007 (QXpreSSed in USD)
~. .. . . . ._
Description Quantity Currency Evaluation % net assets
- .
INVESTMENTS
TRANSFERABLE SECURITIES ADMITTED TO AN OFFICIAL STOCK EXCHANGE LISTING
SHARES
SINGAPORE - - BANYAN TREE HOLDINGS LTO
THAILAND
AAPICO HITECH PCL /FOR.REG ADVANCED INFO SERV PUB. /FOR. REG AIRPORTS OF THAILAND PUB. /FOR REG. BANGKOK B.4NK PUBLIC /FOR. REG. BANPU PUBLIC CO LTD/FOR.REG. EEC WORLD PUBLIC CO /FOREIGN CENTRAL PATTANA PUBLIC CO LTD CHAROONG THAIBWIREIFOR.REG HANA MICROELECTRONICS /FOR REG HEMARAJ LAND DEVEL FOREIG REG ITALIAN-THAI DEV PUB /FOR
REG KASIKORNEANK PUB COMP /FOR REG KRUNG THAI BANK /FOR REG
LAGUNA RESORTS &HOTELS/FOR REG LALIN PROPERTY PUB/FOREIGN REG LAND AND HOUSE PUELIC/FOR REG LPN DEVELOPMENT PUB /FOR REG MURAMOTO ELECTRON (THAI) PLClFOR REG PHATRA SEC PUBLIC CO LTD
/FOR REG PTT EXPL PROD PUBLIC /FOR REG PTT PLC CO LTD /FOR.REG.
QUALITY HOUSES PUBLIC /FOR REG SlAM COMMERC.BANK PUBL./FOR REG. SINO-THAI ENGIN.& CONS/FOR.REG SRlTHAl SUPERWARE PUB./FOR.REG SUPALAI PUBLIC CO LTD/FOREIGN THAI AIRWAYS INTL/FOR.REG.
THAI CANE PAPER /FOR.REG.
9.870.000
8.1 53,100
2,822.300
1,950 000
6.378.800
1,330,000
5,700,000
4,247 900
6.304.800
8,399.900
45.651.700
51.438 800
10.300.000
22,339,000
261,000
25,146,600
32,550,000
34 392,700
320,000
2,259.400
3,350 000
3 265,000
19.967 100
5,280.000
35,776,100
10,680,000
30.464.400
7.458.900
10,161,329
..-
Description Quantity Currency Evaluation
THAI OIL PUBLIC CO/FOR.REG
THAI PLAST.&
CHEMIC.PUB./FOR.REG. THE ERAWAN GROUP /FOR.REG. TRUE CORP. PUBLIC IFOR. REG WORKPOINT ENTERTAINM.PUB./FOR.
.. -.
6,020,000 THB 10,051,968
11,260 500 THB 5.624.648
51,201,700 THE 4,968,930
36,763,000 THE 5,718,828
3.661 500 THE 2 309.675
__ 200.286.187
~
% net assets
~
4.62
2.59
2.28
2.63
1.06
TOTAL SHARES 214,538,192 98.61
AN OFFICIAL STOCK EXCHANGE LISTING 214,538,192 98.61 TOTAL TRANSFERABLE SECURITIES ADMITTED TO
TOTALINVESTMENTS 214,538,192 98.61-
THE 3,141,638
THE 5,397,313
THE 3.228.213
THE 20,573,921
THE 7,668,362
THE 3,546.753
THE 2.861.448
THE 1,448.661
THE 6,293657
THE 1146,672
THE 7,194267
THE 19 697,525
THE 7,715,227
THE 581.078
THE 3.172497
THE 6.178.346
THE 5,742,774
THE 1,735,414
THE 1,837967
THE 8605.715
THE 19,384 123
THE 706,702
THE 10.248.079
THE 4,390,976
THB 2,789.279
THE 2.921 672
THE 9,314,348
WE 4.089491
1.44
2.48
1.48
9 46
3.52
163
1.32
0 67
2.89
0.53
3.31
9.05
3.55
0.27
1.46
2.84
2.64
0.80
0 84
3.96
8.91
0.32
4 71
2.02
1 28
1.34
4.28
1.88
92.06
OTHER NET ASSETS LESS LIABILITIES 3,034,745 1.39
SGD 14,252,005 6.55
14,252,005 6 55 TOTALNETASSETS 217,572,937 100.00 -.
HSBC Global Investment Funds

-.
Portfolio of Investments and Other Net Assets
THAI EQUITY
Economic Division of Investment
(expressed as a percentage of net assets) -
Yo
_ _
Banks and financial institutions Energy Real estate companies Construction, building materials Gastronomy News transmission Electronics and electrical equipment Transport Public services Chemicals Forest products and paper industry Other services Aerospace technology Mechanics, machinery Consumer goods Graphic art and publishing Holding companies Tyres and rubber
Other net assets less liabilities
26.77 17.49 9.36 8.17 6.82 5.1 1 4.36 4.28 3.52 2.59 1.88 1.63
1.44 1.28 1.06 0.84 0.53
I -48
1.39
Total Net Assets 100.00
2 HSBC Global Investment Funds

Portfolio of Investments and Other Net Assets -r UKEQUITY Statement of Investments as at 31 March 2007 (expressed in GBPI
Description Quantity Currency Evaluation 70 net assets
INVESTMENTS
TRANSFERABLE SECURITIES ADMITTED TO AN OFFICIAL STOCK EXCHANGE LISTING
. ....
. _-_
~. .... .-
Description Quantity Currency Evaluation
~. .
SCOTTISH POWER PLC
SHIRE PLC
SIG PLC
SOCO INTL PLC
TRADING EMISSIONS PLC
UNILEVER PLC
UTD BUSINESS MEDIA PLC
VODAFONE GROUP PLC
XSTRATAPLC
31 GROUP PLC
185,546
168.107
162.026
43,731
600,000
144,195
177.941
1,312,447
89.399
145.020
GEP
GBP
GBP
GBP
GEP
GEP
GBP
GBP
GBP
GEP
-.
1487,151
1.770 167
2,051 249
691.387
733,164
2.185 996
1,423 528
1 799.168
2,308.729
1,646 209
% net assets
1.52
181
2.10
0.71
0.75
2 23
1.45
1.84
2.36
1.68
SHARES 94 950.401 97.01
GUERNSEY
GREAT BRITAIN
ANGLO AMERICAN PLC
ASTRAZENECA PLC
AVIVA PLC
BAE SYSTEMS PLC
BARCLAYS PLC
EEA AVIATION PLC
BG GROUP PLC
EP PLC
BRITISH AMERICAN TOBACCO
BT GROUP PLC
CARPHONEWAREHOUSE GROUP CENTRICA PLC
CLIPPER WINDPOWER PLC
DANA PETROLEUM PLC
DOMESTIC 8 GENERAL GROUP PLC ECONERGY INTERNATIONAL PLC EM1 GROUP PLC
EXPERIAN GROUP LTD
FIBERWEB PLC
FKI PLC
GKN PLC
GLAXOSMITHKLINE PLC
HANSON PLC
HBOS PLC
HELPHIRE GROUP LONDON
HOMESERVE
HSBC HOLDINGS PLC
ICAP PLC
INCHCAPE PLC
JOHNSON MATTHEY PLC
KAZAKHMYS LIMITED
LEGAL & GENERAL GROUP PLC MARKS AND SPENCER
NEXT PLC
PETROFAC LTD
PUNCH TAVERNS LTD
RECKITT BENCKISER PLC
RESOLUTION PLC
ROYAL DUTCH SHELL -B-
119,901
120,237
235.885
712,102
714,001
1
279 708
1,436,334
70 253
250 848
398,281
545.694
193,183
65.068
171,858
626,326
409.471
228 303
1
784.588
548 us7
104 492
227.295
426.210
501,828
80.71 1
723 468
305.498
341.141
145 942
83.133
1,139.582
175 276
71.217
223 704
67,229
36,242
353.169
i 75 a65
HSBC Global Investment Funds - . . - -.
GBP 3,213.347
GEP 3,290,887
GBP 1,767,253
GBP 3281.010
GBP 5,165.797
GBP 3
GBP 2.060.049
GEP 8,002.430
GBP 1.110700
GBP 763,989
GBP 1 110,208
GBP 2,067,416
GBP 1,358,076
GEP 646.776
GBP 2.027924
GBP 53a.640
GBP 926,428
GBP 1,337,011
GBP 2
GEP 902.276
GEP 2,077288
GBP 1454.194
GBP 1,854.727
GEP 4,472,482
GBP 2,218.080
GBP 1,437,382
GBP 6.420779
GBP 1605.392
GBP 1.944.504
GEP 2.293,479
GEP 970.578
GBP 1.788.574
GBP 1.190.124
GBP 1,608.792
GBP 990.449
GBP 834,984
GBP 954,252
GBP 2,171,739
GEP 2995.632
3 2a
3 36
1.81
3.35
5 28
0.00
2.10
8 19
1.13
0.78
1.13
2.11
1.39
0.66
2.07
0.55
0.95
1.37
0.00
0 92
2.12
1.49
1 89
4.57
2.27
1 47
6.56
1 64
1 99
2.34
0.99
1 a3
1.22
1 64
1.01
0.85
0.97
2.22
3.06
RAVEN RUSSIA PLC 996,983 GBP 1,203,857 123
1203.857 123
-. .-
_____
TOTAL SHARES 96,154,258 98.24
TOTAL TRANSFERABLE SECURITIES ADMITTED TO
AN OFFICIAL STOCK EXCHANGE LISTING >j.54,258
TRANSFERABLE SECURITIES TRADED ON ANOTHER REGULATED MARKET
SHARES
GREAT BRITAIN
TRADING EMISSIONS PLC -C- 552.140 GBP 615,636 0.63
615,636 0.63
.. .
~
TOTAL SHARES 615.636 0.63
TOTAL TRANSFERABLE SECURITIES TRADED ON ANOTHER REGULATED MARKET - 615,636 0.63
TOTAL INVESTMENTS 96,769,894 98.07
OTHER NET ASSETS LESS LIABILITIES 1,109.877 1.13
TOTALNETASSETS - .. 97,1179,771 100.00

.. _-
Portfolio of Investments and Other Net Assets -.
UKEQUITY
Economic Division of Investment .. ..
(expressed as a percentage of net assets) - -
Yo
Energy Holding companies Banks and financial institutions Insurance Pharmaceuticals and cosmetics Public services Miscellaneous Coal mines, heavy industries Aerospace technology Non-ferrous metals News transmission Graphic art and publishing Retail trade, department stores Precious metals Food Mechanics. machinery Other services Other business houses Tobacco and spirits Consumer goods Electronics and electrical equipment Gastronomy Transport
Other net assets less liabilities
Total Net Assets
14.72 12.32 12.12 7.93 6.66 6.48 5.63 4.36 3.35 3.28 2.62 2.40 2.35 2.34 2.23 2.12 2.10 1.99 1.13 0.97 0.92 0.85 0.00
1.13
100.00
-
A HSBC Global Investment Funds -.
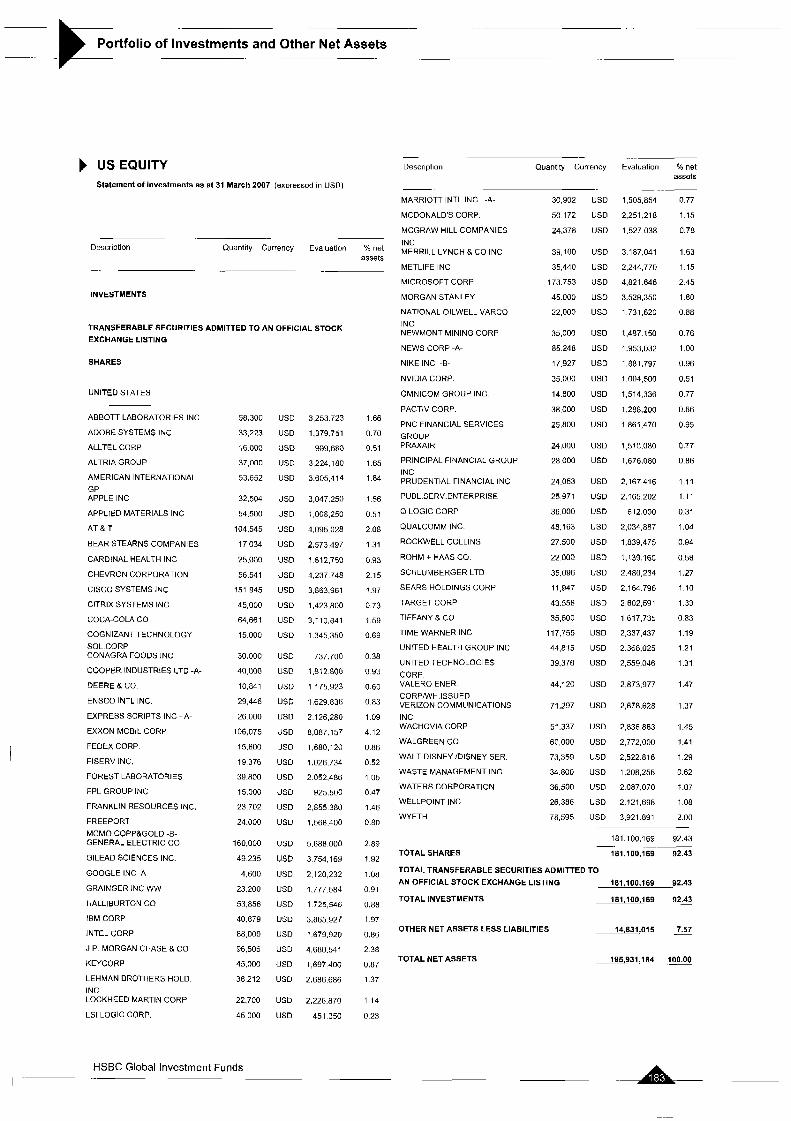
__ ..
Portfolio of Investments and Other Net Assets
USEQUITY Statement of Investments as at 31 March 2007 (expresscd in USD)
Description Quantity Currency Evaluation % n d assets
- . -. .
INVESTMENTS
TRANSFERABLE SECURITIES ADMITTED TO AN OFFICIAL STOCK EXCHANGE LISTING
SHARES
UNITED STATES
ABBOTT LABORATORIES INC
ADOBE SYSTEMS INC
ALLTEL CORP.
ALTRIA GROUP
AMERICAN INTERNATIONAL GP APPLE INC
APPLIED MATERIALS INC
A T & T
BEAR STEARNS COMPANIES
CARDINAL HEALTH INC
CHEVRON CORPORATION
CISCO SYSTEMS INC
ClTRlX SYSTEMS INC
COCA-COLA CO
COGNIZANT TECHNOLOGY SOL.CORP CONAGRA FOODS INC
COOPER INDUSTRIES LTD -A-
DEERE a co. ENSCO INTL INC
EXPRESS SCRIPTS INC - A -
EXXON MOBIL CORP
FEDEX CORP.
FISERV INC.
FOREST LABORATORIES
FPL GROUP INC
FRANKLIN RESOURCES INC.
FREEPORT MCMO.COPP&GOLD -E- GENERAL ELECTRIC CO
GILEAD SCIENCES INC.
GOOGLE INC A
GRAINGER INC WW
HALLIBURTON CO
IBM CORP
INTEL CORP
J.P. MORGAN CHASE t CO
KEYCORP
LEHMAN BROTHERS HOLD. INC LOCKHEED MARTIN CORP
LSI LOGIC CORP.
58.300
33,223
16,000
37,000
53.652
32,504
54,500
104.545
17034
25,000
56.541
151 945
45,000
64,661
15,000
30.000
40 000
10.841
29,446
26 000
106,075
15,600
19 376
39.800
15.000
23 702
24.000
160,000
49 235
4.600
23 200
53.856
40.879
88 000
96.506
45,000
38 212
22.700
45 000
US0 3,253.723
USD 1.379751
USD 999,680
US0 3.224.180
US0 3,605,414
USD 3.047.250
USD 1,008,250
US0 4,095.028
USD 2.573.497
USD 1812,750
US0 4.237.748
USD 3,863.961
US0 1,423.800
US0 3,110,841
US0 1.345.350
US0 737.700
USD 1312a00
US0 1175.923
USD 1,629.836
US0 2,126,280
USD 8.087.157
US0 1,680,120
US0 1.026.734
USD 2052.486
US0 925.500
USD 2,855 380
USD 1,568.400
US0 5.688000
USD 3754.169
USD 2,120,232
US0 1.777 584
USD 1725,546
US0 3.865927
USD 1.679.920
USD 4,680.541
USD 1,697 4110
USD 2.686.686
USD 2,226.870
US0 451 350
HSBC Global Investment Funds
1 66
0.70
0.51
1 fi5
1.84
1.56
0 51
2 08
1.31
0 93
2.15
1.97
0 73
1.59
0.69
0 38
0.93
0.60
0 83
1.09
4.12
0 86
0.52
1.05
0.47
1.46
0.80
2.89
1.92
1 08
0.91
0.88
197
0.86
2.38
0.87
1.37
114
0.23
- ...
Description Quantity Currency Evaluation To net assots
MARRIOTT INTL INC -A-
MCDONALD'S CORP
MCGRAW HILL COMPANIES INC MERRILL LYNCH a co INC
METLIFE INC
MICROSOFT CORP
MORGAN STANLEY
NATIONAL OILWELL VARCO INC NEWMONT MINING CORP
NEWS CORP -A-
NlKE INC -B-
NVlDlA CORP
OMNICOM GROUP INC
PACTIV CORP
PNC FINANCIAL SERVICES GROUP PRAXAIR
PRINCIPAL FINANCIAL GROUP INC PRUDENTIAL FINANCIAL INC
PUBL SERV ENTERPRISE
Q LOGIC CORP
QUALCOMM INC
ROCKWELL COLLINS
ROHM + HAAS CO
SCHLUMBERGER LTD
SEARS HOLDINGS CORP
TARGET CORP
TIFFANY 8 CO
TIME WARNER INC
UNITED HEALTH GROUP INC
UNITED TECHNOLOGIES CORP VALEROENER CORPNVH ISSUED VERIZON COMMUNICATIONS INC WACHOVIA CORP
WALGREEN GO.
WALT DISNEY IDISNEY SER
WASTE MANAGEMENT INC.
WATERS CORPORATION
WELLPOINT INC
WYETH
30.902
50 172
24.378
39,100
35,440
173.753
45 000
22,000
35,000
85 248
17.927
35.000
14 800
38,000
25,800
24,000
28 000
24.053
25 971
36 000
48.163
27.500
22 000
35.096
11,947
43 558
35,500
117.755
44,815
39.376
44,120
71,297
51 337
60,000
73,359
34 800
36,500
26.386
78.595
US0 1,505,854
US0 2,251 218
USD 1.527038
USD 3 187.041
US0 2,244,770
USD 4.821 646
USD 3,529,350
USD 1731,620
USD 1.487150
USD 1,953,032
USD 1,881.797
US0 1,004,500
USD 1,514,336
USD 1,288,200
US0 1861,470
USD 1,510oao USD 1.676.080
US0 2.167416
USD 2.165202
USD 612.000
US0 2,034,887
USD 1,839,475
USD 1,139,160
US0 2480,234
US0 2.164796
USD 2,602,591
US0 1617,735
US0 2,337,437
USD 2 368,025
US0 2,559.046
US0 2.873977
USD 2,678,628
USD 2,836,883
USD 2 772,000
USD 2.522816
USD 1,208,256
USD 2087,070
US0 2,121,698
USD 3,921 891
0.77
115
0.78
1.63
1.15
2.45
1 .BO
0.88
0.76
1 .oo 0.96
0.51
0.77
0.66
0.95
0.77
0.86
1.11
1.11
0.31
1.04
0.94
0.58
1.27
1.10
1.33
0.83
1.19
1.21
1.31
1.47
1.37
1.45
1.41
1 29
0.62
1.07
1 08
2.00
TOTAL SHARES
181,100,169 92.43 -. 181,100,169 92.43
TOTAL TRANSFERABLE SECURITIES ADMITTED TO
AN OFFICIAL STOCK EXCHANGE LISTING 181.100.169 92.43
TOTALINVESTMENTS 181.100,169 92&
OTHER NET ASSETS LESS LIABILITIES 14,831,015 7.57
TOTALNETASSETS l e s , 9 3 1 , 1 8 4 100.00
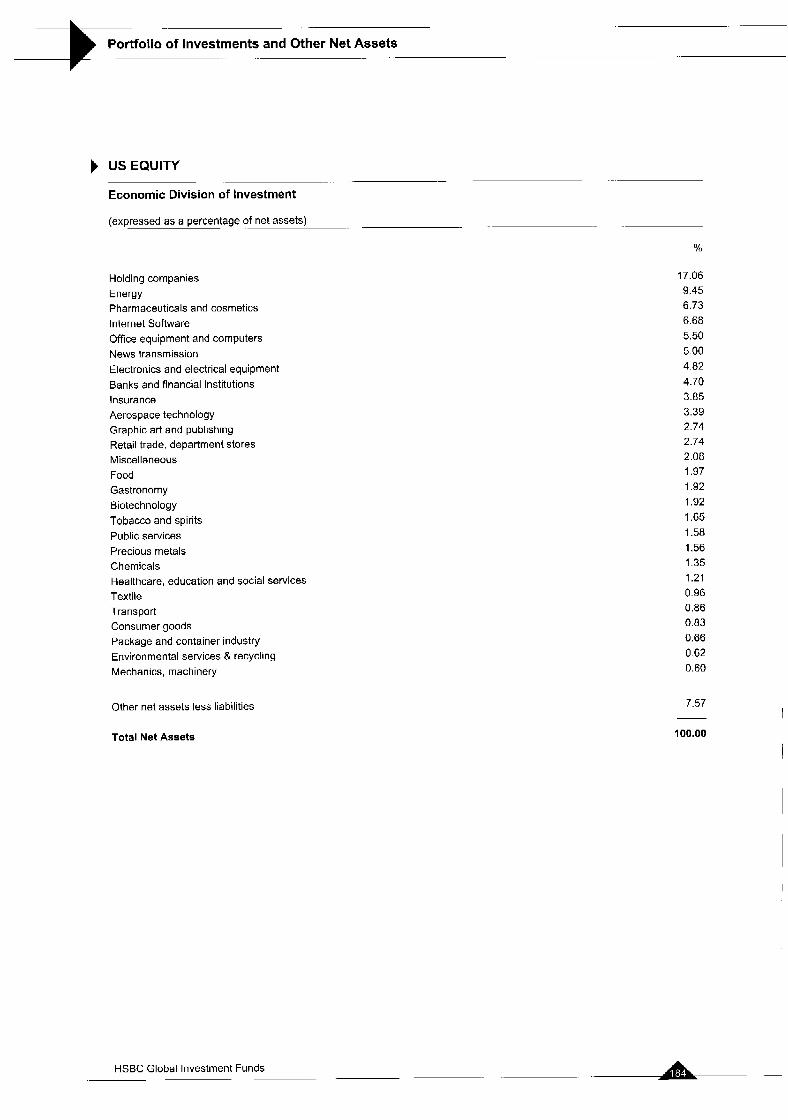
- ..
Portfolio of Investments and Other Net Assets
USEQUITY
Economic Division of Investment
(expressed as a percentage - - of net assets) ..
Holding companies Energy Pharmaceuticals and cosmetics Internet Software Office equipment and computers News transmission Electronics and electrical equipment Banks and financial institutions insurance Aerospace technology Graphic art and publishing Retail trade, department stores Miscellaneous Food Gastronomy Biotechnology Tobacco and spirits Public services Precious metals Chemicals Healthcare, education and social services Textile Transport Consumer goods Package and container industry Environmental services & recycling Mechanics, machinery
Other net assets less liabilities
- .
%
17.06 9.45 6.73 6.68 5.50 5.00 4.02 4.70 3.85 3.39 2.74 2.74
2.08 1.97 1.92 1.92 1.65 1.58 1.56 I .35 1.21 0.96 0.86 0.83 0.66 0.62 0.60
7.57
Total Net Assets 100.00
HSBC Global Investment Funds - -

Portfolio of Investments and Other Net Assets I= . .-
USINDEX Statement of investments as at 31 March 2007 (expressed in USD)
. . . .
Description Quantity Currency Evaluation "le net assets
~ ..
INVESTMENTS
TRANSFERABLE SECURITIES ADMITTED TO AN OFFICIAL STOCK EXCHANGE LISTING
SHARES
BERMUDA ISLANDS
WEATHERFORD INTERNATiONAL LTD
UNITED STATES
ABBOTT LABORATORIES INC
ABERCROHBIE a FITCH "A"
ACE LTD
ADC TELECOMMUNICATIONS INC ADOBE SYSTEMS INC
ADVANCED MICRO DEVICES INC AES CORP
AETNA INC
AFFILIATED COMPUTER SERV
AFLAC INC
AGILENT TECHNOLOGIES
AIR PRODUCTS & CHEMICALS
ALCOA INC
ALLEGHENY ENERGY INC
ALLEGHENY TECHNOLOGIESWHEN ISS ALLERGAN INC.
ALLIED WASTE INDUSTRIES INC. ALLSTATE CORP
ALLTEL CORP
ALTERA CORP
ALTRIA GROUP
AMAZON COM INC
AMBAC FINANCIAL GROUP INC
AMEREN CORP
AMERICAN ELECTRIC POWER CO INC AMERICAN EXPRESS CO
AMERICAN INTERNATIONAL GP AMERICAN STANDARD CIES INC AMERIPRISE FINANCIAL INC/WH I AMERISOURCEBERGEN CORP
AMGEN INC
ANADARKO PETROL CORP.
ANALOG DEVICES INC
1,126 USD 51.965 012
51,965 0.12 -. .~
5,225 US0
300 USD
1,039 US0
345 US0
1995 us0 1.672 US0
2116 USD
1,785 US0
331 USD
1660 USD
1.371 USD
755 US0
2928 USD
520 US0
323 US0
517 USD
949 US0
2082 USD
1,171 US0
1 107 USD
7081 USD
1.033 US0
362 USD
718 US0
1,35A US0
4,042 US0
8,793 USD
588 USD
736 US0
671 US0
3.952 US0
1,575 USD
i.oaa USD
HSBC Global Investment Funds 7-
291 607
22,803
59.618
5 765
82,a52
21.870
46,044
77.558
19 532
77,887
46.216
55,681
9a.615
34 784
25.709
57.232
12.052
125,253
73.164
22,251
617.038
41 124
31,251
36.726
66,387
228.21 1
59o.ago
31,211
42,173
35,a7s
220.640
68.182
37.384
0.67
0.05
0 14
0 01
0.19
0 05
0.1 1
o i a 0.04
0.18
0 11
0.13
0.23
0 06
0.08
0 13
0.03
0.29
0 17
0.05
141
0 09
0.07
0.08
0.15
0 52
1.35
0.07
0.10
0.08
0 50
0.16
0 09
.. - . . .._ . .-
Description Ouantiry Currency Evaluation % net assets
-. ... ~
ANHEUSER-BUSCH COS INC
AON CORP
APACHE CORP
APARTMENT INV +MANAG A
APOLLO GROUP INC A
APPLE INC
APPLERA !APPLIED BIOSYSTEMS GR APPLIED MATERIALS INC
ARCHER-DANIELS MIDLAND
CO ARCHSTONE SMITH TRUST
ASHLAND INC
A T B T
AUTODESK INC
AUTOMATIC DATA PROCES
AUTONATION INC
AUTOZONE INC
AVALONBAY COMMUNITIES INC AVAYA INC
AVERY DENNISON CORP
AVONPRODUCTSINC
BAKER HUGHES INC
BALL CORP
BANK OF AMERICA CORP
BANK OF NEW YORK CO
BARD (C R ) INC
BARR PHARMACEUTICALS INC
BAUSCH 8 LOMB INC
BAXTER INTL INC
BEAT CORPORATION
BEAR STEARNS COMPANIES
BECTON DICKINSON 8 CO
BED BATH & BEYOND INC
BEMlS CO INC
BEST BUY CO INC
BIG LOTS
BIOGEN IDEC INC
BIOMET INC
BJ SERVICES CO
BLACK 8 DECKER CORP
BLOCKINC H+R
BMC SOFTWARE INC
EOEING CO
BOSTON PROPERTIES
BOSTON SCIENTIFIC CORP
BRISTOL MYERS SOUIBB CO
BROADCOM CORP -A-
BROWN-FORMAN CORP B /NON-VOT BRUNSWICK CORP
BURLINGTON NORTHERN SANTA FE CAMPBELL SOUP CO
CAPITAL ONE FINANCIAL CORP CARDINAL HEALTH INC
CARNIVAL CORP
2.568
1,017
1.140
383
463
2,904
603
4.728
2,214
760
21 1
21.078
778
1,877
624
144
250
1,348
328
1 484
i , o i a 336
15 117
2,532
331
339
159
2.178
1.822
424
a33
965
320
1,376
343
1,174
795
gag
219
979
663
2,651
402
3.995
6,832
1 603
256
287
1.217
727
1.407
1 365
1,503
USD
USD
US0
US0
USD
US0
US0
USD
USD
US0
USD
USD
US0
us0 USD
USD
USD
USD
USD
us0 USD
USD
USD
USD
USD
USD
USD
USD
USD
USD
USD
USD
US0
USD
USD
USD
USD
USD
USD
USD
USD
USD
USD
us0 USD
US0
US0
USD
USD
USD
US0
USD
US0
128 811
38.727
21 a54
81.510
20,539
272,250
17 740
87.46~
81,387
40,379
13.913
825.624
28,903
91.579
13.1A1
i a 386
31 455
15,718
21 133
55.264
68,369
15 516
773,839
102,698
26 358
15.719
7.977
115,913
75.358
64 058
63,400
38,291
10 726
67.328
11 010
51,985
33.780
27 a50
17838
20,402
20 712
237 954
46.089
5~ 087
190,681
49 773
16 758
9,066
97 384
28.084
106 440
g a , m
70,476
0.29
0.09
0.19
0 05
0.05
0.62
0 04
0.20
0.19
0.09
0.03
1.87
0.07
0.21
0.03
0.04
0.07
0.04
0.05
0.13
0.16
0 04
1.77
0.23
0 06
0.04
0.02
0.26
0.17
0.15
0 14
0.09
0.02
0.15
0.03
0 12
0.08
0.06
0 04
0.05
0.05
0 54
0.11
0 13
0.44
0.11
0 04
0.02
0.22
0.06
0.24
0.23
0.16

r)r!!!!r!!!! Portfolio of Investments and Other Net Assets
- - -.
Description Quantity Currency Evaluation % net assets
CATERPILLAR INC.
CB RICHARD ELLIS GROUP INC -A- CES CORP -6- /WHEN ISSUED
CELGENE CORP
CENTERPOINT ENERGY INC
CENTEX CORP
CENTURYTEL
CHARLES SCHWAB CORP
CHESAPEAKEENERGY
CHEVRON CORPORATION
CHICAGO MERCANTILE EX.HLDGS-A- C.H.ROEINSON WORLDWIDE INC CHUEE CORP
CIENA CORP
CIGNA CORP.
CINCINNATI FINANCIAL CORP
CINTAS
CIRCUIT CITY STORES
CISCO SYSTEMS INC
CIT GROUP INC
ClTlGROUP INC
CITIZENS COMMUNICATIONS co ClTRlX SYSTEMS INC
CLEARCHANNEL COMMUNICATIONS CLOROX CO
CMS ENERGY CORP.
COACH INC
COCA COLA ENTERPRISE
COCA-COLA CO
COGNIZANT TECHNOLOGY SOL.CORP COLGATE-PALMOLIVE CO.
COMCAST CORPI-A-
COMERICA INC
COMMERCE BANCORP
COMPASS BANCSHARES INC.
COMPUTER ASSOCIATES INTL INC COMPUTER SCIENCES CORP
COMPU’NARE CORP.
CONAGRA FOODS INC
CONOCOPHILLIPS
CONSOL ENERGY INC
CONSOLIDATED EDISON INC
CONSTELLATION BRAND -A-
CONSTELLATION ENERGY GROUP INC CONVERGYS CORP
COOPER INDUSTRIES LTD -A-
CORNING INC.
COSTCO WHOLESALE CORP
COUNTRYWIDE FINANCIAL CORP COVENTRY HEALTH CARE INC
CSX CORP.
CUMMINS INC
2,175
600
2.404
1,250
1115
437
353
3,448
1,367
7.293
110
550
1,364
242
324
526
437
479
20,406
588
16,561
1.175
588
1,664
479
697
1.248
9 64
6,789
500
1,723
10,518
529
565
377
1317
599
1152
1,762
5.568
565
834
622
630
426
616
5,299
1,550
1.886
580
1,498
172
HSBC Global Investment Funds
US0
USD
US0
US0
USD
USD
USD
US0
USD
US0
USD
USD
US0
USD
USD
US0
USD
USD
US0
USD
USD
US0
USD
USD
USD
USD
US0
USD
USD
USD
USD
USD
USD
USD
USD
USD
USD
US0
USD
US0
USD
USD
USD
USD
USD
USD
USD
US0
USD
US0
USD
US0
143.963
20.478
73 322
65,875
20,182
18262
15,860
63.305
42,459
546,610
58,422
26 169
70,942
6,720
45 927
22,287
15,793
8,828
518.925
31.287
851,234
17,378
18.804
57 924
30,885
12 448
62.150
19.299
326,619
44,845
115,165
271,995
31,523
18,984
25,881
34.295
31,334
10,898
43,328
385,139
21,956
42 743
12,956
54,823
10.803
27.917
120,976
83.235
63 841
32.283
59 785
24.926
0.33
0.05
0.17
0.15
0.05
0.04
0.04
0.14
0.10
125
0.13
0.06
0.16
0.02
0.10
0.05
0.04
0.02
1.18
0.07
1 93
0.04
0.04
0 13
0.07
0.03
0.14
0.04
0.75
0.10
0.26
0.62
0.07
0.04
0.06
0.08
0.07
0.02
0 10
0.88
0.05
0.10
0.03
0.13
0.02
0.06
0.28
0.19
0.15
0.07
0 14
0.06
Description Quantity Currency
CVSKAREMARK CORP
DANAHER CORP
DARDENRESTAURANTS
DEAN FOODS CO
DEERE 8 CO
DELL INC
DEVELOPERS DIVERSIFIED REALTY DEVON ENERGY CORP (NEW)
DILLARDS INC A
DIRECTV GROUP INC
DOLLAR GENERAL CORP
DOMINION RESOURCES INC
DONNELLEY AND SONS RR
DOVER CORP
DOW CHEMICAL CO
DOW JONES + CO INC
OR HORTON INC
DTE ENERGY COMPANY
DU PONT [E I )DE NEMOURS
DUKE ENERGY HOLDING CORP DYNEGYINC A
E TRADE FINANCIAL CORP
EASTMAN CHEMICAL CO
EASTMAN KODAK CO
EATON CORP
EEAY INC
ECOLAE INC
EDISON INTERNATIONAL
EL PAS0 ENERGY CORP
ELECTRONIC ARTS
ELECTRONIC DATA SYSTEMS
EMBARQCORP
EMC CORP
EMERSON ELECTRIC CO.
ENSCO INTL INC
ENTERGY CORP
EOG RESOURCES INC
EQUIFAX INC
EQUITY RESIDENTIAL SEI
ESTEE LAUDER COS A
E W SCRIPPS CO A
EXELON CORP
EXPRESS SCRIPTS INC - A -
EXXON MOEIL CORP
FAMILY DOLLAR STORES INC
FANNIE MAE
FEDERATED DEPARTM STORES FEDERATED INVESTORS INC. E FEDEX CORP
FIDELITY NATIONAL INFORM SERV FIFTH THIRD EANCORP
FIRST DATA CORP
FIRST HORIZON NATL CORP
FIRSTENERGY CORP
5.204
750
533
377
776
7.686
870
1.503
249
2 600
1,047
1.170
752
707
3,225
113
904
620
3 138
4.218
1,000
1 374
334
930
483
3,855
580
1.121
2,172
1,042
1,726
465
6,983
2,716
500
690
817
407
956
383
264
2.286
460
19,169
50 I
3,276
1 787
255
1,050
500
1 879
2,552
369
1,121
USD
u50
u50
USD
u50
u50
u50
USD
u50
u50
u50
USD
USD
USD
USD
USD
USD
u50
u50
USD
u50
USD
u50
u50
USD
USD
u50
USD
u50
u50
USD
u50
USD
USD
u50
USD
USD
u50
USD
USD
u50
USD
u50
u50
u50
u50
USD
u50
USD
u50
USD
USD
u50
USD
Evaluation % net assets
177 769
52,950
22:99
17,436
84 173
179.776
54.593
105 285
8.195
59.462
22 123
104.262
27,644
34,473
148,479
3.868
19,960
29,872
154,954
86.342
9.470
29,101
20 985
21.337
40.055
127 369
24,778
55.512
31 820
53.444
48.121
26119
95.388
116516
27 675
72 560
58 718
14 876
45 573
18679
11 774
157,963
37.619
1,461,444
14 659
180,802
81.058
9.379
11 3,085
22.750
73 262
67,526
15,343
74 905
0.41
0.12
0.05
0 04
0.13
0.41
0 12
0.24
0.02
0.14
0.05
0.24
0.06
0.08
0.34
0 01
0.05
0.07
0.35
0.20
0.02
0.07
0.05
0.05
0.09
0.29
0.06
0.13
0.07
0 12
0.1 1
0.06
0 22
0.27
0.06
0 17
0.13
0.03
0.10
0.04
0.03
0.36
0.09
3 32
0.03
0.41
0 18
0.02
0.26
0.05
0.17
0.15
0 04
0.17
I

-~
Portfolio of Investments and Other Net Assets - - -
-- ..
Descriotion
- .. FISERV INC
FLUOR CORP (NEW)
FORD MOTOR CO
FOREST LABORATORIES
FORTUNE BRANDS
FPL GROUP INC
FRANKLIN RESOURCES INC
FREDDIE UAC
FREEPORT MCMO COPPRGOLD -B- GANNETT CO INC
GAP INC
GENERAL DYNAMICS CORP
GENERAL ELECTRIC CO
GENERAL MILLS INC
GENERAL MOTORS CORP
GENUINE PARTS GO
GENWAORTH FINANCIAL /-A-
GENZYME CORP
GILEAD SCIENCES INC
GOLDMAN SACHS GROUP INC
GOODRICb CORP
GOODYEAR TIRE a RUBBER
GOOGLE INC A
GRAINGER INC WW
HALLIBURTON CO
HARLEY DAVIDSON INC
HARMAN INTL INDUSTRIES INC
HARRAHS ENTERTAINMENT INC HARTFORD FIN SERV GROUP
HASBRO INC
HEINZ (H J I CO
HERCULES INC
HESS CORP
HEWLETT-PACKARD CO
HILTON HOTELS GORP
HOME DEPOT INC
HONEYWELL INTERNATIONAL INC HOSPIRA INC
HOST HOTELS & RESORTS INC
HUDSON CITY BANCORP INC
HUMANA INC
HUNTINGTON BANCSHARES INC IAChNTERACTlVE CORPlWHEN ISS. IBM CORP
ILLINOIS TOOL WORKS
IMS HEALTH
INGERSOLL-RAND COMPANY - A- INTEGRYS ENERGY GROUP INC INTEL CORP
INTERNATIONAL PAPER CO
INTERPUBLIC GROUP
INTL FLAVORS R FRAGR
INTL GAME TECHNOLOGY
Quantity Currency Evaluation % net assets
Descridlon .
Quantity Currency Evaluation % net assets
536
289
6,388
1090
498
1.389
579
2,365
1,249
808
1,600
1.365
34.729
1.197
1,857
620
1,392
823
1,557
1.396
354
674
735
246
3.388
806
208
620
1.089
627
1.128
332
a57
9 036
1,304
6.915
2,703
566
1,650
1,650
575
686
750
5.102
1,380
697
994
243
19,467
1,487
1.558
283
1.138
USD
US0
US0
US0
USD
US0
US0
USD
US0
us0 US0
USD
USD
US0
US0
USD
US0
USD
US0
US0
USD
USD
US0
USD
USD
US0
USD
US0
USD
US0
US0
USD
USD
USD
USD
US0
USD
US0
USD
US0
USD
USD
US0
us0 USD
USD
US0
USD
USD
USD
US0
USD
US0
28,403
25,975
50 785
56,211
39.198
85,701
69,752
141,474
81 622
45.402
27.728
104,627
1,234.615
69,330
57 363
30,225
48 720
49,438
118,721
289.251
18.281
20,894
338.776
18.849
108,552
47,030
20,126
52,291
104,283
18 064
53,039
6,564
48,772
361,440
46,918
254.610
124.176
22 991
42.983
22,490
32.936
15.085
28.193
482,496
71,153
20,617
43,070
13.572
371,625
53,368
19 148
13.352
46.203
0.06
0.06
0.12
0.13
0.09
0.20
0.16
0 32
0.19
0.10
0.06
0.24
2.81
0.16
0.13
0.07
n 11
0.1 1
0.27
0 66
0.04
0.05
0 77
0.04
0.25
0.11
0.05
0 12
0.24
0 04
0.12
0.01
0.11
0.82
0 11
0.58
0.28
0.05
0.10
0.05
0.08
0.03
0.06
110
0.16
0.05
0.10
0.03
0.85
0.12
0.04
0.03
0 11
INTUIT
ITT CORP
JABlL CIRCUIT INC
JANUS CAPITAL GROUP INC
JDS UNIPHASE CORP
JOHNSON&JOHNSON
JOHNSON CONTROLS INC
JONES APPAREL GROUP LTD
J.P MORGAN CHASE B CO
JUNIPER NETWORKS INC
KB HOME
KELLOGG CO
KEYCORP
KEYSPAN CORP
KIMBERLY CLARK CORP
KIMCO REALTY CORP
KINDER MORGAN INC
KING PHARMACEUTICALS INC
KLA TENCOR CORPORATION
KOHL'S CORP
KROGER CO
LABORATORY CORP OF AMER.HLD LEGG MASON INC
LEGGETT + PLATT INC
LEHMAN BROTHERS HOLD INC LENNAR CORP -A-
LEXMARK INTL INC
LlLLY (ELI) & GO
LIMITED BRANDS INC
LINCOLN NATIONAL CORP
LINEAR TECHNOLOGY
LIZ CLAIBORNE INC
LOCKHEED MARTIN CORP
LOEWS GORP
LOWE S COMPANIES INC
LSI LOGIC CORP
L-3 COMMUNICATIONS HLDS INC MANOR CARE INC
MARATHON OIL CORP
MARRIOTT INTL INC -A-
MARSH & MC-LENNAN COS INC MARSHALL & ILSLEY CORP
MASCO CORP
MATTEL INC
MAXIM INTEGRATED PRODUCTS MBlA INC
MC-CORMICK&CO/N VOTING
MCDONALD'S CORP
MCGRAW HILL COMPANIES INC MCKESSON CORP
MEADWESTVACO CORP
MEDCOHEALTH SOLUTIONS
MEDIMMUNE INC
1,144 US0
650 US0
611 USD
712 US0
536 US0
9,763 USD
677 US0
373 USD
11.712 USD
1.970 US0
223 US0
823 USD
1.366 US0
554 US0
1516 USD
778 US0
353 US0
870 USD
753 US0
1,131 USD
2.274 USD
358 US0
465 USD
573 US0
1,770 USD
465 USD
292 US0
3,354 USD
1.164 US0
923 USD
1.040 US0
320 US0
1193 USD
1.542 USD
5.139 US0
1,549 USD
427 US0
260 USD
1,176 USD
1.087 USD
1,756 US0
872 USD
1,260 USD
1,385 USD
1,106 USD
469 USD
432 USD
4,080 US0
1,177 USD
1,032 US0
515 US0
1.005 USD
799 US0
30 945
39.117
13.069
14,966
8,104
589.099
64,498
1 1.488
568.032
39,223
9 598
42.121
51.526
22.764
104,301
37 577
37,531
17,078
40,263
86.205
63.672
26 059
44,073
12 898
124 449
20,018
17041
179.137
30,613
62.349
32,729
13 546
11 7.033
70 577
160,028
15,536
37,405
14.087
119,787
52.970
51,802
40,609
34,310
38.337
32.892
30.846
16,615
183 070
73,727
59,990
15,723
72.189
28 540
0.07
0.09
0.03
0.03
0.02
I .34
0.15
0.03
1.30
0.09
0 02
0.10
0.12
0.05
0.24
0.09
0 09
0.04
0.09
0.20
0.15
0.06
0.10
0.03
0.28
0.05
0 04
0.41
0.07
0.14
0.07
0.03
0.27
0.16
0 37
0.04
0.09
0.03
0.27
0.12
0.12
0.09
0.08
0.09
0.08
0 07
0.04
0.42
0.17
0.14
0.04
0.16
0 07
HSBC Global Investment Funds
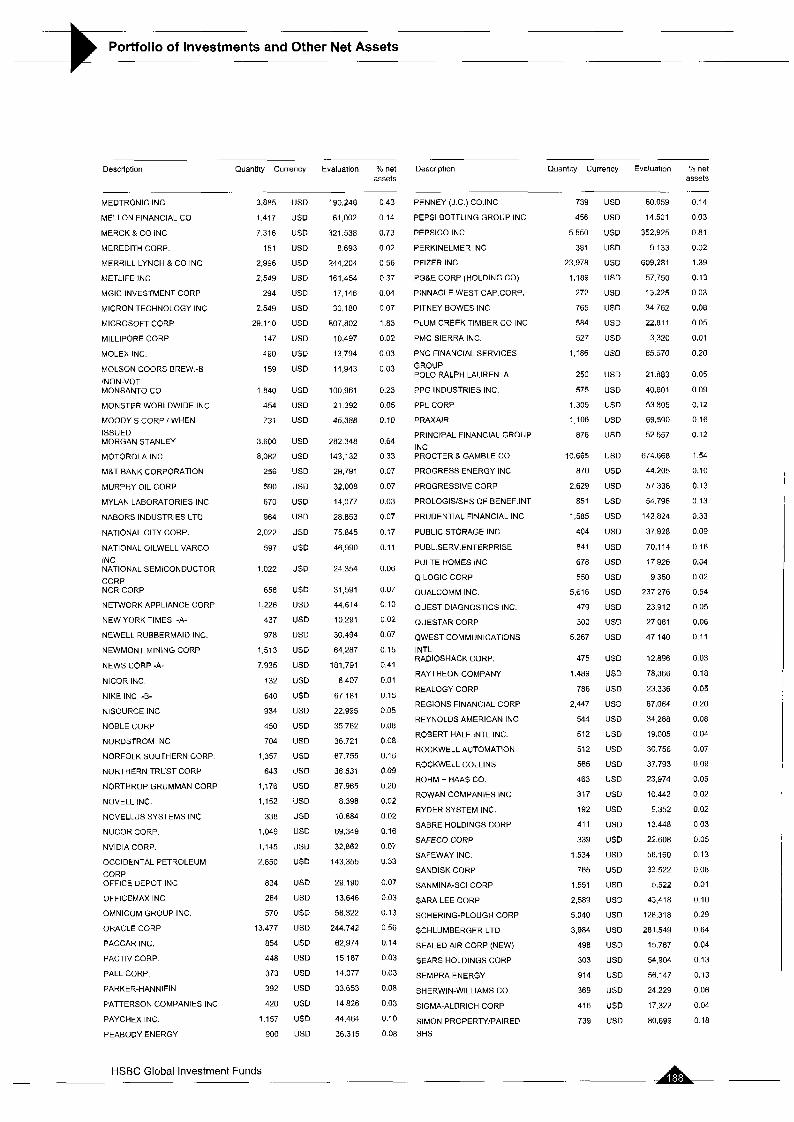
Portfolio of Investments and Other Net Assets -
Description Ouantity Currency Evaluation % net Description Quantity Currency Evaluation YO net
~
MEDTRONIC INC
MELLON FINANCIAL CO
MERCK 8 CO INC
MEREDITH CORP
MERRILL LYNCH & CO INC
METLIFE INC
MGlC INVESTMENT CORP
MICRON TECHNOLOGY INC
MICROSOFT CORP
MILLIPORE CORP
MOLEX INC
MOLSON COORS BREW.-6- INON-VOT MONSANTO CO
MONSTER WORLDWIDE INC
MOODY S CORP I WHEN ISSUED MORGAN STANLEY
MOTOROLA INC
M&T BANK CORPORATION
MURPHY OIL CORP
MYLAN LABORATORIES INC
NAEORS INDUSTRIES LTD
NATIONAL CITY CORP
NATIONAL OILWELL VARCO INC NATIONAL SEMICONDUCTOR CORP NCR CORP
NETWORK APPLIANCE CORP
NEW YORK TIMES -A-
NEWELL RUBBERMAID INC
NEWMONT MINING CORP
NEWS CORP -A-
NICOR INC
NlKE INC -E-
NISOURCE INC
NOBLE CORP
NORDSTROM INC
NORFOLK SOUTHERN CORP
NORTHERN TRUST CORP
NORTHROP GRUMMAN CORP
NOVELL INC
NOVELLUS SYSTEMS INC
NUCOR CORP
NVlDlA CORP
OCCIDENTAL PETROLEUM CORP OFFICE DEPOT INC
OFFICEMAX INC
OMNICOM GROUP INC
ORACLE CORP
PACCAR INC
PACTIV CORP
PALL CORP
PARKER-HANNIFIN
PATTERSON COMPANIES INC
PAYCHEX INC
PEABODY ENERGY
3,885 USD
1.417 US0
7316 USD
151 USD
2,996 US0
2,549 USD
294 USD
2.549 US0
29,110 US0
147 USD
490 US0
159 US0
1.840 US0
454 US0
731 USD
3.600 USD
8.082 US0
256 US0
590 USD
670 US0
964 USD
2,022 USD
597 US0
1.022 USD
658 US0
1,226 USD
437 US0
978 USD
1,513 USD
7.935 US0
132 USD
640 USD
934 US0
450 USD
704 US0
1357 US0
643 US0
1,176 US0
1 152 USD
338 US0
1,049 US0
1,145 USD
2.850 USD
834 USD
264 US0
570 USD
13.477 USD
854 US0
448 USD
373 USD
392 USD
420 US0
1157 US0
900 USD
190,24n
61,002
321.538
8 693
244,204
161,454
17,146
30 180
807.802
10.497
13 794
14,943
100,961
21 392
45.388
282.348
143,132
29,791
32,008
14,077
28.853
75 845
46,990
24 354
31,591
44,614
10 291
30.494
64 287
181,791
6 407
67 181
22,995
35 762
36 721
67.755
38 831
87.965
8 398
10 884
69,349
32,862
143.355
29 190
13.646
58.322
244.742
62,974
15,187
14,077
33.653
14 826
44,464
36 315
0 43
0 14
0.73
0.02
0 56
0.37
0.04
0.07
1 .a3
0.02
0.03
0.03
0.23
0.05
0.10
0.64
0 33
0.07
0.07
0.03
0.07
0.17
0.1 1
0.06
0.07
0.10
0 02
0.07
0.15
0.41
0.01
0 15
0.05
0.08
o oa 0.15
0.09
0.20
0.02
0 02
0.16
0.07
0.33
0.07
0.03
0.13
0 56
0.14
0.03
0.03
0.08
0.03
0.10
0.08
assets ~
PENNEY (J C ) CO INC
PEPS1 BOTTLING GROUP INC
PEPSICO INC
PERKINELMER INC
PFIZER INC
PG&E CORP (HOLDING CO)
PINNACLE WEST CAP CORP
PITNEY BOWES INC
PLUM CREEK TIMBER CO INC
PMC-SIERRA INC
PNC FINANCIAL SERVICES
GROUP POLO RALPH LAUREN A
PPG INDUSTRIES INC
PPL CORP
PRAXAIR
PRINCIPAL FINANCIAL GROUP INC PROCTER 8 GAMBLE CO
PROGRESS ENERGY INC
PROGRESSIVE CORP
PROLOGISISHS OF BENEF INT
PRUDENTIAL FINANCIAL INC
PUBLIC STORAGE INC
PUBL SERV ENTERPRISE
PULTE HOMES INC
Q LOGIC CORP
OUALCOMM INC
QUEST DIAGNOSTICS INC
QUESTAR CORP
QWEST COMMUNICATIONS INTL RADIOSHACK CORP
RAYTHEON COMPANY
REALOGY CORP
REGIONS FINANCIAL CORP
REYNOLDS AMERICAN INC
ROBERT HALF INTL INC
ROCKWELL AUTOMATION
ROCKWELL COLLINS
ROHM + HAAS CO
ROWAN COMPANIES INC
RYDER SYSTEM INC
SABRE HOLDINGS CORP
SAFECO CORP
SAFEWAY INC
SANDISK CORP
SANMINA-SCI CORP
SARA LEE CORP
SCHERING-PLOUGH CORP
SCHLUMBERGER LTD
SEALED AIR CORP (NEW)
SEARS HOLDINGS CORP
SEMPRA ENERGY
SHERWIN-WILLIAMS CO
SIGMA-ALDRICH CORP
SIMON PROPERTYPAIRED SHS
739
456
5 550
381
23.978
1,189
272
765
584
527
1.186
250
575
1,305
1106
878
10.665
870
2.629
851
1,585
404
841
678
550
5,616
479
300
5.267
475
1.489
786
2,447
544
512
512
565
463
317
192
41 1
339
1,534
765
1.551
2,589
5.040
3,984
498
303
914
369
416
739
USD
US0
USD USD
US0
USD
USD
US0
USD
USD
us0
USD
USD
USD
USD
US0
US0
USD
US0
USD
USD
US0
USD
U S 0
US0
USD
US0
US0
USD
US0
USD
USD
US0
USD
US0
USD
US0
US0
USD
USD
US0
USD
US0
USD
US0
US0
USD
US0
USD
USD
US0
USD
US0
US0
60 059
14,501
352.925
9 133
609,281
57.750
13 225
34 762
22.811
3 320
85 370
21.a~
40,601
53 305
69,590
52 557
674.668
44.205
57 338
54.796
142,824
37,928
70.114
17 926
9 350
237 276
23 912
27 081
47 140
12 896
78,366
23.336
87.064
34 288
19.005
30 756
37.793
23,974
10 442
9.352
13.448
22 608
56.160
32 522
5,522
A3,418
128.318
281.549
15 787
5C,904
56.147
24 229
17.322
80,699
0.14
0 03
0.81
0.02
1.39
0.13
0.03
0.08
0 05
0.01
0.20
0.05
0.09
0.12
0 16
0.12
1 54
0.10
0.13
0 13
0.33
0.09
0.16
0.04
0 02
0.54
0.05
0.06
0.1 1
0 03
0.18
0.05
0 20
0.08
0.04
0.07
0.09
0.05
0.02
0.02
0.03
0.05
0.13
0.08
0.01
0 10
0.29
0.64
0 04
0.13
0.13
0.06
0.04
0 18
assets
- HSBC Global Investment Funds
. -- .~

..
Portfolio of Investments and Other Net Assets
Descriptior Quantity Currency Evaluation net assets
- . .- .-
Quantity Currency Evaluation % net assets
Description
SLM CORP
SMITH INTERNATIONAL INC
SNAP-ON INC
SOLECTRON CORP
SOUTHERN CO
SOUTHWEST AIRLINES CO
SOVEREIGN BANCORP INC
SPECTRA ENERGY CORP
SPRINT NEXTEL CORPlFON
SER.l ST JUDE MEDICAL INC
STANLEY WORKS
STAPLES INC
STARBUCKS CORP
STARWOOD HOTELS RESORTS WW STATE STREET CORP
STRYKER CORP
SUN MICROSYSTEMS
SUNOCO INC
SUNTRUST BANKS INC
SUPERVALU INC
SYMANTEC CORP
SYNOVUS FINANCIAL CORP
SYSCO CORP.
T ROWE PRICE GROUP INC
TARGET CORP
TECO ENERGY INC
TEKTRONIX INC
TELLABS INC.
TEMPLE-INLAND INC
TENET HEALTHCARE CORP
TERADYNE INC
TEREX CORP
TEXAS INSTRUMENTS INC
TEXTRON INC.
THE HERSEY CO
THERM0 FISHER SCIENTIFIC INC TIFFANY & CO
TIME WARNER INC
TJX COS INC
TORCHMARK CORP
TRANSOCEAN INC
TRAVELERS COMPANIES INC
TRIBUNE CO
TXU
TYCO INTL LTD (NEW)
TYSON FOODS INC -A-
UNION PACIFIC CORP
UNlSYS CORP
UNITED HEALTH GROUP INC
UNITED STATES STEEL
UNITED TECHNOLOGIES CORP UNUM GROUP
US BANCORP
UST INC
1,393
650
174
2.865
2.536
2,627
1.194
2,134
9,783
1,099
245
2.419
2,559
747
1.139
953
12 125
415
1,191
699
3 033
1,098
2,104
861
2.908
591
275
1,502
369
1.389
580
400
4 898
422
546
1,398
437
12,931
1,475
328
994
2.301
629
1.568
6.698
823
890
998
4,569
409
3.351
1 085
5,998
494
USD
USD
USD
US0
US0
USD
US0
US0
USD
US0
USD
USD
USD
USD
US0
US0
USD
US0
USD
US0
USD
USD
US0
USD
US0
US0
USD
USD
USD
US0
US0
US0
US0
USD
US0
USD
us0 USD
USD
USD
USD
US0
US0
US0
US0
USD
US0
USD
USD
USD
USD
USD
USD
USD
56,807
31.571
8.380
8.824
93 604
38,433
30,328
55 399
185.877
41,267
13.553
62.870
80,173
48.480
74,115
62.717
72.265
29 179
99.973
27.023
52.926
35.795
70 989
40,725
173,753
10.189
7.728
14 885
21,967
8,945
9,535
28.552
148.850
38.018
29 833
64,196
19.914
256.680
39.604
21 454
82.254
119.238
19.832
100,91fi
208 576
15.604
90 157
8.463
241.426
41,399
217.781
24.879
209.990
28.514
0 13
0.07
0.02
0 02
0.21
0.09
0.07
0.13
0.42
0 09
0.03
0 14
0.18
0.1 1
0 17
0.14
0.16
0.07
0.23
0 06
0.12
0.08
0.16
0.09
0.40
0.02
0.02
0 03
0.05
0.02
0.02
0.07
0.34
0.09
0 07
0.15
0 05
0.59
0.09
0.05
0.19
0 27
0.05
0.23
0.48
0.04
0.21
0.02
0 55
0.09
0 50
0.06
0.48
0.07
UTD PARCEL SERVICE INC "8"
VALERO ENER. CORP:WH.lSSUED VARIAN MEDICAL SYSTEMS INC VERlSlGN INC
VERIZON COMMUNICATIONS INC VF CORP
VIACOM INC -E-
VORNADO REAL.TRUST/BEN.IN VULCAN MATERIALS CO
WACHOVIA CORP
WAL- MART STORES INC
WALGREEN CO.
WALT DISNEY !DISNEY SER
WASHINGTON MUTUAL INC
WASTE MANAGEMENT INC.
WATERS CORPORATION
WATSON PHARMACEUTICALS INC. WELLPOINT INC
WELLS FARGO 8 CO
WENDY S INTERNATIONAL INC
WESTERN UNION COMPANY
WEYERHAEUSER CO
WHIRLPOOL CORP
WHOLE FOODS MARKET INC.
WILLIAMS COMPANIES INC
WINDSTREAM CORP
WRIGLEY JR CO .WM
WYETH
WYNDHAM WORLDWIDE CORP
XCEL ENERGY INC
XEROX CORP.
XlLlNX INC.
XL CAPITAL LTD -A-
XTO ENERGY INC
YAHOO INC
YUM BRANDS
ZIMMER HOLDINGS INC
ZIONS BANCORP
3M CO
TOTAL SHARES
INDEX TRACKER
UNITED STATES
ISHARES TRUSTlSBP 500 INDEX FD
TOTAL INDEX TRACKER
3 616
2.028
400
791
9,853
306
2.370
458
305
6,434
8 294
3.376
6.924
3 015
1.815
339
328
2,083
11.434
339
2 602
701
274
415
2.097
1611
727
4.559
629
1.284
3.225
1.111
661
1,236
4,129
928
818
393
2,481
US0
US0
USD
US0
US0
USD
US0
USD
US0
USD
USD
US0
USD
USD
US0
USD
US0
US0
USD
US0
US0 US0
US0
USD
USD
USD
US0
US0
USD
USD
US0
US0
US0
USD
US0
US0
US0
US0
USD
253.699
132.1 OA
18,828
19,838
370 177
25,184
96.364
53 788
35,645
355 543
387,496
155,971
238,116
122.71 1
63,017
19.384
8.715
167 494
394.930
10,553
57.790
52.316
23.150
18,368
60 687
23.553
36.982
227.494
21.386
31 959
54,825
28 364
46,349
68,685
129 403
53.546
70.127
33,326
188.779
0.58
0.30
0.04
0.05
0 84
0.06
0.22
0.12
0.08
0.81
0.88
0.36
0.54
0.28
0 14
0.04
0.02
0 38
0.90
0.02
0.13
0.12
0.05
0.04
0.14
0.05
0.08
0 52
0.05
0.07
0.13
0.06
0.11
0.16
0 30
0.12
0.16
0 08
0.43
42,813,558 97.68
4 2 , 8 6 5 , 5 2 3 97.80
6.105 US0 868,009 1.98
~- 868.009 1.98
868.009 1.98 -
HSBC Global Investment Funds 7-
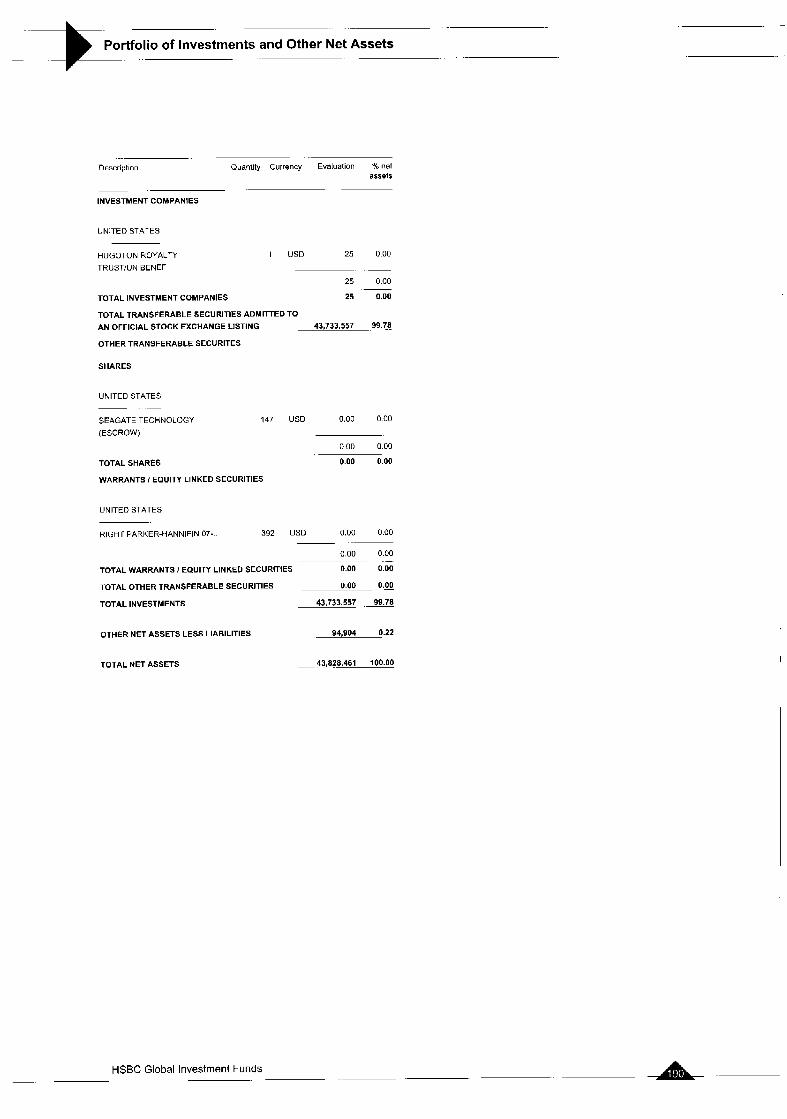
Portfolio of Investments and Other Net Assets -.
Description Quantity Currency Evaluation YO net assets
~
INVESTMENT COMPANIES
UNITED STATES
HUGOTON ROYALTY 1 USD 25 000
TRUSTlUN BENEF
25 000
TOTAL INVESTMENT COMPANIES 25 0.00
TOTAL TRANSFERABLE SECURITIES ADMITTED TO
-. ~
AN OFFICIAL STOCK EXCHANGE LISTING 43,733.557 99.78
OTHER TRANSFERABLE SECURITES
SHARES
UNITED STATES
SEAGATE TECHNOLOGY
(ESCROW)
TOTAL SHARES
WARRANTS I EQUITY LINKED SECURITIES
147 us0 0.00 0.00
UNITED STATES
0.00 0 00
0.00 0.00
RIGHT PARKER-HANNIFIN 07- 392 US0 0.00 000 ~ .~
000 0 0 0
TOTAL WARRANTS I EQUITY LINKED SECURITIES 0.00 0.00
TOTAL OTHER TRANSFERABLE SECURITIES .. 0 00 0.03
-
TOTAL INVESTMENTS 43,733,557 ...
OTHER NET ASSETS LESS LIABILITIES 94,904 0.22
TOTALNETASSETS - 43,828,461 100.00
A- HSBC Global Investment Funds . -
~

-
Portfolio of Investments and Other Net Assets - . -
USINDEX
Economic Division of Investment - -
(expressed as a percentage of net assets) - .
Holding companies Pharmaceuticals and cosmetics Banks and financial institutions Energy News transmission Retail trade, department stores Internet Software Office equipment and computers Insurance Public services Electronics and electrical equipment Food Aerospace technology Consumer goods Chemicals Investment companies Tobacco and spirits Graphic art and publishing Transport Gastronomy Miscellaneous Mechanics, machinery Healthcare, education and social services Other services Real estate companies Biotechnology Automobile industry Forest products and paper industry Textile Construction, building materials States, provinces and municipalities Precious metals Coal mines, heavy industries Non-ferrous metals Package and container industry Environmental services & recycling Other business houses Index Options Tyres and rubber Photography and optics
Other net assets less liabilities
13.21 9.03
7.31 5.41 5.37 5.26 5.08 4.06 3.74 3.30 2.73 2.43 2.40 2.39 2.10 2.04 1.89
1.73 I .25 1.23 1.03 0.92 0.87 0.61 0.55 0.51 0.50 0.48 0.41 0.34 0.33 0.23 0.18 0.17 0.16 0.15 0.05 0.05
8.43
1 .a5
0.22
Total Net Assets 100.00
HSBC Global Investment Funds 7- ~ ~ ~ ~ ~

Portfolio of investments and Other Net Assets ~
ASIA FREESTYLE Statement of investments as at 31 March 2007 (expressed in USD)
- . . .-
Description OuantitylFace Currency Evaluation % net Value assets
. .
SUN HUNG KAI PROPERTIES LTD
169000 HKD 1.954.983 0.72
~. .~
35.285.358 13.05 .. -
INDIA Description GluantitylFace Currency Evaluation YO net
Value asset5 HUTCHISON TELECOMM INTERNAT
590,000 HKD 1195.900 0 4 4
- -
1,195,900 0.44 ~ .- INVESTMENTS
INDONESIA - - BANK NIAGA TBK -A-
PT ASTRA INTERNATIONAL TBK TELKOM INDONESIA IS-E-
TRANSFERABLE SECURITIES ADMITTED TO AN OFFICIAL STOCK EXCHANGE LISTING
16 094,000 IDR 1,304,397 0 48
1,416000 IDR 2046.686 076
2 729,500 IDR 2,943,971 1.09
6.294 754 2.33
- SHARES
BERMUDA ISLANDS ~-
ESPRIT HOLDINGS LTD
PEACE MARK(H0LDINGS) LIMITED TAI CHEUNG HOLDINGS LTD
ISRAEL 453.500
2.520 000
2,049 000
2,476.000
5,966,000
3,904,000
8 870,000
1 152,000
1,308,000
4,500.000
814 000
2,760 000
2 107.000
1,726,000
136,000
4 135.000
316,000
900,500
854,000
744 000
1 402 000
707 000
293,000
6,553,000
740.000
51 1.500
HKD 5318,603 196
HKD 2,757,112 102
HKD 1258.552 047
9,334267 345
~~
-~
SARIN TECHNOLOGIES LTD 2,577.000 SGD 1.044 971 0.39
1,044,971 0.39 - -
~~
MALAYSIA _ - COMMERCE ASSET-HOLDING BHDjFOR REG. GAMUDA BHDIFOR.REG.
RESORTS WORLD
CAYMAN iSLANDS -~
AAC ACOUSTIC TECHNOLOGIES HLD WIN HANVERKY HOLDINGS LTD
1.767 500 MYR 5,090,202 1 88
1.375.600 MYR 3,185 185 1.18
1,161,100 MYR 5.780304 2.14
14,055 691 5.20
- -
HKD 2,347776 087
HKD 3.488 890 1.29
__ ~.
5836.666 2 16 ~- PHILIPPINES
CHINA AYALA LAND INC 3,518,000 PHP 1.202444 0.44
1,202,444 0.44
- -.
~- AIR CHINA LTD
CHINA CONSTRUCTION BANK CORP CHINA LIFE INSURANCE CO
LTD-H- CHINA MERCHANTS BANK I-H-
CHINA PETROLEUM & CHEM CORP -H- CHINA SHIPPING DEVELOPMENT -H- CHINA TELECOM CORP LTD - H- NINE DRAGONS PAPER HLDGS LTO PETROCHINA CO LTD :-H-
ZHUZHOU CSR TIMES ELECTRIC LTD ZlJlN MINING GROUP -H-
HKD 2,702,682 1.00
HKD 5,073,631 1.87
HKD 3.309.456 1.22
SINGAPORE - -
BANYAN TREE HOLDINGS LTD
HO BEE INVESTMENT LTD
HOTEL PROPERTIES
KEPPEL CORP. LTD
MEIBAN GROUP
OVERSEA-CHINESE BK GORP
UTDOVERSEASBANKrLOCAL
WHEELOCK PROPERT(SINGAP0RE) LTD
624,000
2,941,000
1,110,000
185.000
4,694 000
569.000
263 000
1,347.000
SGD
SGD
SGD
SGD
SGD
SOD
SGD
SGD
-
-
901 039
4,382,462
3 732.569
2,317,608
897,544
3378,521
3 641.579
2,877,579
~~
22 126 901 - _ _ _ _ _ _
0.33
1.63
1.38
0.86
0.33
1.25
1 35
1.06
HKD 2.637.860 0.98
HKD 3.806.289 1 41
HKD 1,241,619 0.46
HKD 1 356.214 0.50
HKD 4.394.808 163
HKD 2,047.427 0.76
HKD 222.760 008
HKD 2.407.547 0.89
29,200.293 10.80
~~
- .~
8.19 . -
SOUTH KOREA -~
DONGKUK STEEL MILL CO LTD
HYUNDAI
92,480 KRW 2,555.962 0.95
72,130 KRW 3,887,381 144 HONG KONG
ENGINEERING+CONSTR.CO HYUNDAI MOTOR /SGDR 144A CHEUNG KONG HOLDINGS
CHINA MOBILE LTD
CHINA OVERSEAS LAND AND INVESTMENT CHINA RESOURCES POWER HOLDINGS GREAT EAGLE HOLDINGS LTD
HONGKONG LAND HLDS LTD
HUTCHISON WHAMP
IND 8 COM BOC -H-
KINGBOARD CHEMICALS HOLDINGS MASS TRANSIT RAILWAY CORP
HKD 3,999.182 148
HKD 8,187.204 3.03
HKD 1,073.142 0.40
HKD 1.140,558 0.42
HKD 4754.246 176
USD 3.294620 1.22
HKD 2817,633 1.04
HKD 3,672841 1.36
HKD 3 110.677 1.15
HKD 1.280272 047
35,350
11 8,570
36.592
85 690
16.310
32,551
9,519
24 753
US0
KRW
KRW
KRW
KRW
KRW
KRW
KRW
1,24’1.768
10 637 769
1.429.476
5,601 942
2.860.692
4.775 037
3.996.885
14.81 3,904
0.46
3 93
0.53
2.06
1.06
1.77
1.48
5.47
KOOKMIN BANK
KOREAN AIR
KT& G CORP
MEGASTUDY GO LTD
NHN CORPORATION
POSCO
SAMSUNG ELECTRONICS CO LTD SAMSUNG ENGINEERING CO LTD SAMSUNG FIREBMARINE INSUR. SAMSUNG TECHWIN CO LTD
I
22.870 KRW 1,424,613 0.53
15.120 KRW 2,531,428 0.94
36.710 KRW 1,398,965 0.52
HSBC Global Investment Funds

-
Portfolio of Investments and Other Net Assets . _. - - ..
-. ..
% net assets -
0.29
0.59
0.81
0.94
- . . . .
Descrlptlon Quantitv/Face Currency Evaluation % net Description QuantitylFace Currency Evaluation Value
~. . -. ..
UBS LO 06-4.9.07 IVRCL INFR R 117,000 US0 777 465 PRY LTD UBS LDN 07-23 2 10 78,996 USD 1,583,491 WRTi0.N.G. UBS LN 06-18.12.07WRT 243,000 USD 2,200,681 UNITECH 0 UBS LN 06-21.12.07 WRT/TATA 249,637 USD 2 554,535
Value -. .
assets
KRW 2,235,808 083
KRW 969,541 036
KRW 1,267,436 047
KRW 1 562.602 0.58
-
~.
63.191 209 23.38 ~~
SHINSEGAE CO LTD
SK CORPO3ATION
S-OIL CORP
WOORI 1NVESTMENTRSECURIT.CO
3.895
9.871
18,400
74.430
2,573,680
480.300
1 669.050
265.376
1 727.178
3,626,000
110,500
224.000
1 036,000
1,186,850
134.200
1.011,ooo
735.000
4.083 095
463,150
1,624,400
762.400
1216,100
144,000
6.867 000
3.86
0 29
0.80
0.30
0.35
-.
1.74
10.434.668 TAIWAN
INDIA .-
JP MORGAN INTERNATIONAL DERIVATIVES LTD 04-30.04 07 /ON ITC LTD 0 JP MORGAN INTERNATIONAL DERIVATIVES LTD 7.4.08 /ON MAHINDRA MERRILL LYNCH 04-17.03.09 /ON IBP CO LTD 0.000001 MSDW ASIA 05- 21.02.08WT/HINDUSTAN ZINC LTD 0.000001
ASIA CEMENT CORP
ASUSTEK COMPUTER INC
AU OPTRONICS CORP
CATCHER TECHNOLOGY CO LTD CATHAY FINANCIAL HOLDING
CHANG HWA COMMERCIAL BANK CHUNGHWA TELECOM CO /SADR FAR EASTERN TEXTILE LTD /GDRS FORMOSA CHEMICALS & FIBER CO HON HA1 PRECISION IND.CO LTD MEDIA TEK INCORPORATION
SILICONWARE PRECISION INDUSTR. TAIWAN FERTILIZER CO LTD
TAIWAN SEMICONDUCTOR MANUFACT TRIPOD TECHNOLOGY CO LTD
TWO 2,489 757 0.92
TWD 1.132.556 0.42
TWO 2,386,618 088
TWO 2.085 871 0.77
TWO 3,567,124 1 33
TWD 2,186 871 0.81
US0 2 203.370 0.82
USD 1,904,000 0.70
TWD 1,988,777 0.74
TWD 7,965,285 2.95
TWO 1,541,660 0.57
TWO 1.894.940 0.70
TWO 1.222.088 0.45
TWD 8 381.308 3.10
TWO 1,904,202 0.70
42 874,427 15.86
~ .~
~~
224,200 US0 783,006
119,500 US0 2,149,889
86,556 USD 812,410
73,500 USD 951.538
4,696,843
NETHERLANDS ~ .-
638,744 USD 1 907.903 0.71 ABN AMRO 05- 18 12.06WRTIHCL INF 0 -
1,907,903 0 71 ~
UNITED STATES
ClTlGR GLBL 04-20 1 10/IND 24410 USD 600,728 022 R81 .-. -
600128 0 2 2
TOTAL WARRANTS I EQUITY LINKED SECURITIES 17,640,142 6.53
TOTAL TRANSFERABLE SECURITIES ADMITTED TO AN OFFICIAL STOCK EXCHANGE LISTING
TRANSFERABLE SECURITIES TRADED ON ANOTHER REGULATED MARKET
261,207,509 96.63
THAILAND - AROMATICS THAILAND PUBLIC/FOR. BANGKOK BANK PUBLIC /FOR REG THAI AIRWAYS INTL/FOR.REG.
THE 1,993.706 0 74
THE 2.459.014 0 91
THE 1,518,612 0 56
5,971,332 2 21
237.614.213 87.90
~ -~
-.
SHARES
TOTAL SHARES
BONDS
CHINA -
GLORIA MAT.TECHNOLOGY 367,000 TWO 556.958 0.21 CORP -- .
556,958 0 2 1 ~-
SOUTH KOREA
JERSEY
JPM INTL DER.O% 06-2.3 09 IVRC
USD 927,360 034
927.360 034
927,360 034 -
JVM CO LTD
TAIWAN
21 259 KRW 1.068.900 039
1,068,900 0 39
-~
-. TOTAL BONDS
INVESTMENT COMPANIES
WISTRON CORP /GDR
TOTAL SHARES
15 000
15 0.00
1,625,873 0.60
1 USD ~.
~-
BERMUDA ISLANDS -~ MACOUARIE INTL INFRASTRUCTURE
SGD 5025,794 1.86
- ~ ..
5025,794 1.86
5,025,794 1.86 -.
TOTAL TRANSFERABLE SECURITIES TRADED ON ANOTHER REGULATED MARKET -. 1,625,873 0.60
TOTAL INVESTMENT COMPANIES
WARRANTS ! EQUITY LINKED SECURITIES
GREAT BRITAIN - -
DT.BK LN 05- 70.000 19.8.08WRT/ASS.CEM 0 JP MORG DERIV.-31.03.08 WCL 314.732
USD 1,193.888 0.44
US0 2.124.608 0.79
HSBC Global Investment Funds

. . -
Portfolio of Investments and Other Net Assets
~
Description QuantityIFace Currency Evaluation "h net Value assets
. . ~.
OTHER TRANSFERABLE SECURITES
SHARES
HONG KONG -. -
SWIRE PACIFIC LTD - A - 249,500
MALAYSIA
ROAD BUILDERS M HLDS EHD 703,800
TOTAL SHARES
WARRANTS I EQUITY LINKED SECURITIES
GREAT BRITAIN
HKD 2.800,OOO 104
2,800.000 I 04
- --
-
MYR 733.338 0.27
733.338 0.27
3,533,338 1.31
~ .~
-
UBS LN06- 106.401 13.12.07WRTIDR.REDDYS 0
USD 1.707.523 063
1.707 523 0.63 ~.
TOTAL WARRANTS I EQUITY LINKED SECURITIES 1,707,523 0.63
TOTAL OTHER TRANSFERABLE SECURITIES 5,240,861 1.94 TOTAL INVESTMENTS 268.074.243 99.1.1
OTHER NET ASSETS LESS LIABILITIES 2,248,700 0.83
270,322,943 100 00 TOTAL NET ASSETS ~.
I
HSBC Global Investment Funds .~ - -~
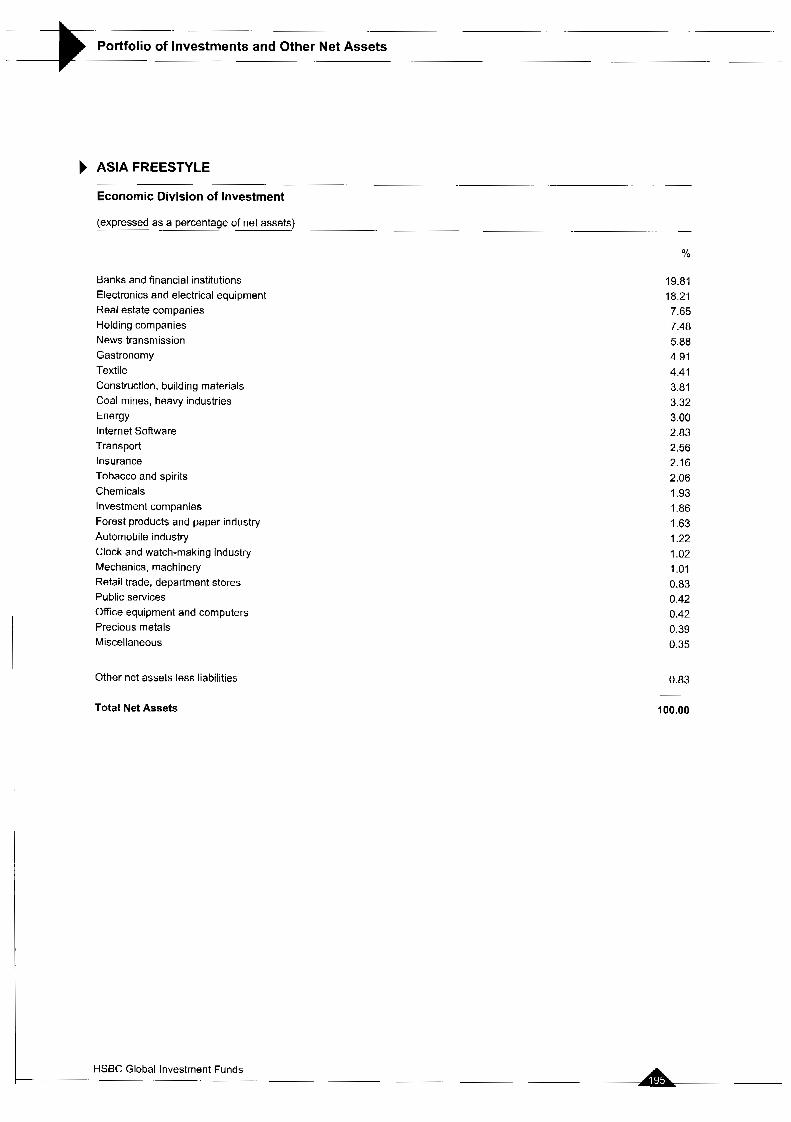
Portfolio of Investments and Other Net Assets - .
ASIA FREESTYLE - . - - - . ~.
Economic Division of Investment
(expressed as a percentage of net assets)
Banks and financial institutions Electronics and electrical equipment Real estate companies Holding companies News transmission Gastronomy Textile Construction, building materials Coal mines, heavy industries Energy Internet Software Transport Insurance Tobacco and spirits Chemicals Investment companies Forest products and paper industry Automobile industry Clock and watch-making industry Mechanics, machinery Retail trade, department stores Public services Office equipment and computers Precious metals Miscellaneous
Other net assets less liabilities
%
19.81 18.21 7.65 7.48
4.91 4.41 3.81 3.32 3.00 2.83 2.56 2.16 2.06 1.93 1.86 1.63 1.22 1.02 1.01
0.42 0.42 0.39 0.35
5.88
0.83
0.83
Total Net Assets 100.00
HSBC Global Investment Funds - A. ~

- - -
Portfolio of Investments and Other Net Assets
BRlC FREESTYLE Statement of Investments as at 31 March 2007 (expressed in USD)
~
DeSGrlptlDn Quantity Currency Evaluation Yo net assets
INVESTMENTS
TRANSFERABLE SECURITIES ADMITTED TO AN OFFICIAL STOCK EXCHANGE LISTING
SHARES
BERMUDA ISLANDS _- ~
CHINA YURUN FOOD GROUP LTD DUFRY SOUTH AMERICA LTDA
GP INVESTMENTS LTD /BDR
BRAZIL
ALL AMERICA LATINA /UNIT
ANHANGUERA EDUCACIONAL PART. BANCO BRADESCO SA PREF
BANCO BRADESCO ISADR
BRADESPAR SA BRASlL IPREF. BRASILAGRO
CIA VALE DO RIO DOCE AIPREF CIA VALE RIO DOCE’SADR
CIA VALE RIO DOCE/SADR(I ORDSH) COSAN SA INDUSTRIA E COMERCIO DIAGNOST DA AMERICA SA BRL DURATEX SA (‘PRIV
GVT HOLDING SA
ITAU HOLDING IPFD SHSISADR
JBS AS
LOJAS AMERICANAS SA :PRIV
MARCOPOLO POMO IPREF.
PERDIGAO SA
PETROBRAS SADR
PETROLEO BRASILEIRO /SADR
SADIA SNPREF.
SA0 CARLOS EMPREENDIMENTOS
CAYMAN ISLANDS
AJISEN CHINA HOLDINGS LTD
ENRIC ENERGY EQUIPMENT
CHINA
AIR CHINA LTD
13,700 000
779.200
1,201,000
4 548.420
400,000
422.688
1.978 700
1 475,200
35,500
100.000
2.817.400
895.600
1 300,000
1,362 665
2 131.700
950,000
1 367.635
5,150,000
452,100,000
4,098 400
367.500
1 663,200
9.300
6.608.300
2.140.300
282,000
15 544.000
37 372,000
HSBC Global Investment Funds
HKD 14918.939 054
BRL 13.395543 049
BRL 38.338.301 139 ~. ~
- 66.652 783
BRL 54.288.790
BRL 4,420,647
BRL 8,672.169
USD 81,007,978
BRL 43,475,590
BRL 21,796,246
BRL 3,119,012
USD 86,128,272
US0 33,155,112
BRL 23,881 317
BRL 29 918.509
BRL 42.824.541
BRL 11.357.625
US0 48.058.694
BRL 17,707,147
BRL 28.202 107
BRL 12 662,175
BRL 4,985,679
US0 150,935,400
USD 942276
BRL 32 853,507
BRL 17,861,230
~-
760 254,023
2 42 -
1 97
0.16
0 31
2.94
1 58
0.79
0.11
3.20
1.20
0.87
1.09
1 55
0.41
1 74
0.64
1.02
0.46
0.18
5.47
0.03
1.19
0.65
- 27.56
HKD 256210
HKD 8513.229
0.01
0.31 . -
8,769,439 0.32 ~. .~
HKD 25 872.084 0.94
DescrlDtion
-. ..
BANK OF COMMUNICATIONS CO LTD CHINA LIFE INSURANCE CO LTD-H- CHINA MENGNIU DAIRY CO LTD CHINA NATL BLDING MATERIAL -H- CHINA RESOURCES LAND
CHINA SHENHUA ENERGY CO -H- CHINA SHIPPING DEVELOPMENT -H- DATANG INT.POWER GENERATION-H- DONGFENG MOTOR -H-
JlANGXl COPPER CO LTD -H-
PETROCHINA CO LTD I-H-
ZHEJIANG EXPRESSWAY CO LTD -H- ZlJlN MINING GROUP -H-
FEDERATION OF RUSSIA -.
GAZPROM OAO/SADR
JSC SURGUTNEFTEGAZ /SADR
JSC SURGUTNEFTEGAZ ISADR PFD LUKOIL ISADR
MMC NORILSK NICKEL ‘SADR
MOBILE TELESYSTEMS OJSISADR RAO UNIFIED ENER SYSJGDR
TATNEFT 6GDR REP20 SHS REG S TNK-BP HOLDING
TRUBNAYA METALL.KOMP ISGDR REG
GREAT BRITAIN -~
CAIRN ENERGY PLC
HONG KONG -. - CHINA MOBILE LTD
CHINA OVERSEAS LAND AND
INVESTMENT CHINA RESOURCES ENTERPRISE LTD CHINA RESOURCES POWER HOLDINGS ClTlC 1616 HOLDINGS LTD
IND 8 COM BOG -H-
INDIA
ADITYA BIRLA NUVO LTDIDEMATER. AMTEK AUTO LTD IDEMAT
BAJAJ HINDUSTHAN LTD
BALRAMPUR CHIN1 MILLS !DEMAT. BOMBAY DYEING & MANUFACTIDEMAT. BRITANNIA INDUSTRIES LTDIDEMAT.
Quantity Currency Evaluation % net assets
.. .
32 489,000
9.700 000
5,194,000
27,000 000
28.986.000
12,515000
4 800,000
10,000,000
20.158,OOO
14.400 000
45 920,000
40,000,000
48,750.000
1,020 550
570.745
596 909
760.184
421,000
545.000
1.472 910
543,435
18.057 193
200,000
517 949
12,450,000
4,270,000
11 078.000
3.982 000
1,274,000
20,554,000
58 686
597 600
314 716
1,308.200
685 000
396 101
HKD 33.384 102 1.21
HKD 27,866.080 1 01
HKD 14,854,816 054
HKD 23,770,593 086
HKD 34,940330 1.27
HKD 30,267773 110
HKD 7.321 588 0.27
HKD 9.469336 034
HKD 10,988,663 0 4 0
HKD 17431 768 063
HKD 54,471,510 197
HKD 32,042,166 1 16
HKD 28.384.015 103
351 064,844 12 73
- -
USD 43,129566 1.56
USD 35956,935 1.30
USD 50475,020 1 83
US0 65.907.953 2.39
USD 79.779 500 2.89
US0 31.386.550 1.14
USD 202525,124 7.36
USD 52,467,562 1.90
USD 39,906,397 1.45
US0 6,700,000 0.24
- -. .
608.234.607 22.06 ~-
GBP 15.877.743 0.58
15,877,743 0.58
-.
HKD 113,193.434 411
HKD 5,365,710 0 19
HKD 36.998.974 1 34
HKD 6,104441 022
HKD 420.607 002
HKD 11,520154 0 4 2
173 603,320 6 30 ~
INR 1,442316 005
INR 5078.722 0 18
INR 1,381.768 005
INR 1963,640 007
INR 8,551301 031
INR 11 372555 041
I

-. -.
Portfolio of Investments and Other Net Assets
Description
-
CESC LTD DEMAT
DHAMPUR SUGAR MILLS LTD DEMAT OR REDDY S LABORATORIES /DEMAT DR REDDY S
LABORATORIESIADR DWARIKESH SUGAR IND LTD
ELECTROSTEEL CASTING LTDIDEMAT GAMMON INDIA LTD IDEMAT
GRASIM INDUST IDEMAT
H D F C BANK OEMAT
HCL INFOSYSTEMS LTD /DEMAT HCL TECHNOLOGIES /DEMAT
HINDUJA TMT LTD /DEMAT
HINDUSTAN OIL EXPLORAT IDEMAT HINDUSTAN PETR lDEMAT
HUTCHISON TELECOM INTL /SADR HUTCHISON TELECOMM INTERNAT IBP CO LTD /DEMAT
INDIA CEMENTS LTD/DEMAT
INDO RAMA SYNTHETICS LTD/DEMAT ITC IGDR
ITC LTD IDEMAT.
IVRCLINFRASTRUCTURES AND PROJ JET AIRWAYS INDIA LTD IDEMAT. JINDAL STEEL a POWER IDEMAT. J.K. CEMENT LTD
JSW STEEL LTD I DEMAT
KEI INDUSTRIES LTD /DEMAT
LARSEN 8 TOUBRO :GDR
MAHINDRA UGlNE STEEL IDEMAT. MAHINDRA&MAHlNDRAIDEMAT
MICRO INKS LTD IDEMAT
NAGARJUNA CONSTRUCTION IDEMAT. OILBNATURAL GASIDEMAT.
PATNl COMPUTER SYSTEMS IADR PATNl COMPUTERS SYSTEMS LTD /DEMAT. RAYMOND LTD IDEMAT.
RELIANCE CAPITAL LTDIGDR REGS RELIANCE COMMUNICATION /GDR RELIANCE
COMMUNICATIONS/DEMAl RELIANCE NATURAL RESOURCE 'GDR RlCO AUTO IND LTD /DEMATERIAL STEEL AUTHORITY OF INDIAIDEMAT. STERLITE INDUSTRIES LTD /DEMAT TATA IRON & STEEL/DEMAT
TATA MOTORS LTD/DEMAT
TATA POWER CO jDEMAT
Quantity Currency Evaluation "lo net assets
442,600
158.409
1251,430
485,000
820.971
538.631
754,615
424.307
250.000
964 652
3 456.000
203.100
2,226,619
566.802
33 920
12.000.000
300,000
1,399 054
1.341 457
3 813,466
1,399 000
2,170,431
170.000
243,162
2,700,000
1.842 033
2 763,578
233 000
2316.587
442.000
645 372
1.750.484
1,272,999
5,550
1,063.000
497,192
5.205
526 316
800.000
52,054
1 056,441
5,400 000
187,590
1.551 315
720.920
120.000
INR 3862.094
INR 268.703
INR 21.069 422
USD 7.997.650
INR 1,390.695
INR 4.701.290
INR 5,234.491
INR 20.513.186
INR 5,561,369
INR 2.880.422
INR 23,337.975
INR 2.718.998
INR 3.677,197
INR 3,201341
US0 1.004032
HKD 24 323,398
INR 2.814851
INR 5,239,591
INR 1557,543
US0 13.318324
INR 4.889.132
INR 14,282.778
INR 2,471 694
INR 13 292.747
INR 9,110 194
INR 20 831.159
INR 4,261,498
US0 8.707229
INR 4.948.501
INR 7,949.249
INR 4899.183
INR 6,412.995
INR 25,607 967
USD 128.205
INR 9.326.930
INR 3 882,801
US0 78710
USD 4736.844
INR 7.787.410
USD 48.410
INR 1.131 981
INR 14 164.523
INR 2,038,041
INR 15,948,952
INR 12.089.588
INR 1.419484
0.14
0 01
0.76
0.29
0 05
0.17
0.19
0 74
0.20
0.10
0 85
0.10
0.13
0 12
0.04
0.89
u.10
0.19
0.06
0 48
0.18
0.52
0.09
0.48
0 33
0.76
0 16
0.32
0.18
0 29
0.18
0.23
0.94
0.00
0.34
0.14
0 00
0.17
0.28
0.00
0.04
0.51
0 07
0.58
0 44
0.05
-. .. .
Description Quantity Currency Evaluation Yo net assets
- -. -.
TRlVENl 2,470.000 INR 3,046,585 0.11 ENG1NEER.INDUSTRIDEMAT VISA STEEL LTD !DEMAT 2.945.584 INR 1 823,359 0.07
WIPRO LTD iDEMAT. 360,000 INR 4,655,357 0 17
394,454,380 14.31
2,378,911,139 86.28 TOTAL SHARES
WARRANTS I EQUITY LINKED SECURITIES
BERMUDA ISLANDS
CLSA FIN.05- 27.09 10WRT:GAMMON 0
59,675 US0 415.384 0.02
415,384 002 -
CAYMAN ISLANDS
MSDW ASIA SEC04-20.7 07WRT ITC 0.0001 MSDW AS.SEC 05- 19.9.08WRT!ICIC 0
GERMANY
DT BK AG 07-2.1 17WRTICARN IND 0.000001 DT.BK 06-18.05.09WRTIAOITYA 6. 0
GREAT BRITAIN
DT BK LDN 05- 3 1 OEWRTjNAG CON 0 000001 DT BK 06-18 05 09 WRTIINFRAST 0 JP MORG INTL 0%06-27 1 09
NGCN 0 UBS LDN 07- 13 3 10WRT:NAGARJ 0 UBS LDN 07- 20.2.08WRTIHINDALCO 0 UBS LON 07-23 02 10 WRTPATNI 0 UBS LN 06-18 12 07WRT NNITECH 0
INDIA
37,079 US0 1.920512 007
7,517 USD 147.430 0.01
2,067,942 0.08
2 304,375 US0 6.896718 025
150,000 USD 3,689,055 0 13
10,585 773 0 38 .~
40,204 USD 148,194 0.01
343.750 US0 2308,899
320 612 USD 1,147.791
195,000 US0 717971
660 000 USD 1,990,890
257,706 US0 2,223 925
100000 US0 905.630
9,443 300
0 08
0 04
0 03
0 07
0 08
0 03
0 34
DEUTSCHE BANK AG 04- 06 08 07 'ON HCL- INFOSYSTEMS LTD 0 000001 DEUTSCHE BANK AG 04- 31 05 07 /ON MAHINDRA a MAHINDRA LTD 0 000001 DEUTSCHE BANK AG 05- 29 04 08 'ON BRITAIN INDUSTRIES LTD 0 JP MORGAN INTERNATIONAL DERIVATIVES LTD 04-30 04 07 /ON ITC LTD 0 JP MORGAN INTERNATIONAL DERIVATIVES LTD 04-30.04 07 !ON RANBAXY LABORATORIES LTD 0 MERRILL LYNCH INTL 05- 07 01.10,ON BRITANNIA INDUSTRIES LTD 0 000001 MERRILL LYNCH INTL 04-
22 06 09 ION AMTEK 0 000001 MERRILL LYNCH 04-1 7 03 09 :ON IBP CO LTD 0 000001
734.500 US0 2,193,923 0 08
235,000 US0 4,227,813 0.15
23,531 USD 675,829 0.02
2,000,000 USD 6,984.891 0.25
750,000 US0 6.044 288 0.22
5,018 USD 144.121 0.01
92.808 US0 789846 0.03
200000 USD 1,877.190 0.07
HSBC Global Investment Funds .. . A -

-_ -
Portfolio of Investments and Other Net Assets
.. .
Description Quantity Currency Evaluation 'In net assets
MERRILL LYNCH 05-08.01 . I O 505,727 US0 1,077,746 0 0 4 /ON MAHINDRA UGINE STEEL
co 0.000001 MERR.L.04-13.3.09 PATNI 637,500 USD 5.599.043 0.20 COMPUTER SYSTEMS LTD
0.00001 . . --. 29,614,690 1.07
NETHERLANDS
ABN AMRO 05- 928.767 US0 2,774 191 0.10
18 12 06WRTlHCL INF 0 ABN NV 07-30.6.09WRT/IDEA 3 000,000 US0 6 514,140 0.24
CELL 0
9,288,331 0 34
TOTAL WARRANTS I EQUITY LINKED SECURITIES 61,415.420 2.23
TOTAL TRANSFERABLE SECURITIES ADMITTED TO AN OFFICIAL STOCK EXCHANGE LISTING 2,440.326.559 88.51
OTHER TRANSFERABLE SECURITES
-
SHARES
FEDERATION OF RUSSIA
TRANSNEFT OJSC MOSCOW 32.289 US0 67,968345 2.46
67,968,345 2.46 . -
INDIA
HINDALCO IND /GDR 144A REG 300.000 USD 895 090 0.04
MCDOWELL HOLDINGS LTD 59.036 INR 56071 0.00
RELIANCE ENERGYlGDR 144A 2,603 US0 88,796 0.00
TOTAL SHARES
WARRANTS I EQUITY LINKED SECURITIES
GERMANY
DT.BK 06-2.2.1 1 WRT GAZPROM 0
GREAT BRITAIN
UBS LN 06-19.12.07 WRT /JlNDAL 0 UBS LN 06-8.12.07WRT /TATA MOT 0 UBS LN06- 13.12 O7WRTIDR.REDDYS 0 UBS LN06-15.12.07WRTlJSW STEEL 0
JERSEY
JP MORGAN 07-1 1 .I .I 1 WRTICAIRN 0 JPM INTL DER.06-
19.1.O9WRT!EP 0
NETHERLANDS ~ -
ABN AMRO 05- 7 12 OGWRTIJIND P 0 ABN AMROO6- 30 6 OSWRTISTERLITE 0
1,039 957 0.04
69,008,302 2.50
147 USD 154,889.490 5.62
154.889.490 5 62
50,000 US0 2,746,405 0 10
24 199 USD 403746 001
400.000 US0 6,419,200 0.24
150 000 USD 1,630.245 0.06
~ .~
11 199.596 041
1395.625 US0 4.033356 0 15
94 500 USD 900 585 0.03
-
4,933,941 0 18 ~. ~
23.079 US0 1,262.060 0.05
150.000 USD 1,626,745 0.05
.
2,888.805 0.10 .. --
HSBC Global Investment Funds -. - - ~.
.
Description Quantity Currency Evaluation % net assets
UNITED STATES
JPM INTL 07-23 3 12WRT 837,585 USD 8794643 032
/SATYAM 0
8,794 643 0.32
TOTAL WARRANTS I EQUITY LINKED SECURITIES 182.706.475 6.63
TOTAL OTHER TRANSFERABLE SECURITIES 251.714.777 9.13
TOTAL INVESTMENTS 2,692,041,336 97.64
OTHER NET ASSETS LESS LIABILITIES 65,042,665 2.36
TOTALNETASSETS 2,757.083.981 100.00
I

..
Portfolio of Investments and Other Net Assets
BRlC FREESTYLE
Economic Division of Investment
(expressed as a percentage of net assets) -.
%
Energy Holding companies Coal mines. heavy industries Public services News transmission Banks and financial institutions Transport States, provinces and municipalities Food Non-ferrous metals Construction, building materials Other services Miscellaneous Retail trade, department stores Real estate companies Automobile industry Pharmaceuticals and cosmetics Internet Software Insurance Mechanics, machinery Agriculture and fishing Textile Tobacco and spirits Office equipment and computers Electronics and electrical equipment Chemicals Other business houses
Other net assets less liabilities
Total Net Assets
16.67 10.64 9.22 8.28 7.04 6.86 6.63 5.61 4.31 3.62 2.64 2.64 1.58 1.51 1.46 1.37 1.05 1.04 1.01 0.99 0.97 0.72 0.66 0.44 0.27 0.24 0.17
2.36
100.00
A- .- HSBC Global Investment Funds 7

..
Portfolio of Investments and Other Net Assets _ _ -.
GLOBAL EMERGING MARKETS EQUITY . . ..... ~ .... ~.
Description Quantity Currency Evaluation assets % net
FREESTYLE Statement of investments as at 31 March 2007 (expressed in USD)
GAZPROM OAOISADR
LUKOIL lSADR
MOBILE TELESYSTEMS OJSISADR RAO UNIFIED ENER.SYS./GDR
SEVERSTALCHEREPOVETS MET/SGDR VIMPEL COMMUNICATIONSIS.ADR
467.ao7 USD 19.770038 2.34
131 510 US0 11,401.917 1 3 5
73,651 US0 4241.561 0 5 0
2a 121 USD 3,866,638 046
362.811 US0 5,006792 0 5 9
35,300 USD 3,396,919 0 4 0
~.
Doscription Quantity Currency Evaluarlon % net assets
INVESTMENTS
TRANSFERABLE SECURITIES ADMITTED TO AN OFFICIAL STOCK EXCHANGE LISTING
SHARES
HONG KONG
CHINA MOBILE LTD
IND & COM BOC -H-
1,811,500 HKD 16.469873 1.95
13,720 000 HKD 7.689.817 0 91
24.159.690 2 86
-
- ARGENTINA HUNGARY
PAMPA HOLDING SAISGDR REGS
USD 5,921 072 0 7 0
.~
5.921.072 0.70
306 046
424.800
1,358,193
247,100
489.095
250 600
131.042
34a,ooo
538 399
2.552 754
314.541
3,041.871
10 086.692
13,321 000
7 085,000
4 722.000
478 000
1,141,070
8.877
2.725 542
MOL MAGYAR /-A-
INDIA
97,311 HUF 11.080.459 1 31 ~
I I oao 459 I 31
BERMUDA ISLANDS
DUFRY SOUTH AMERICA LTDA
BRAZIL
IClCl BK !SADR BRL 7,302 909 0.86
7,302,909 0.86
.. ~
76,974 US0 3039703 0.36
3,039 703 0.36
.- ~.
- - - INDONESIA -. --
BANK DANAMON INDONESIA TBK -A- BANK RAKYAT INDONESIA
PT TELEKOM.INDONESIA
/SP.ADR TELKOM INDONESIA IS-B-
ALL AMERICA LATINA /UNIT
BANCO BRADESCO SA IPREF.
BANCO BRADESCO ISADR
CIA VALE RIO DOCEEADR
CIA VALE RIO DOCEISADR(1 ORDSH) DURATEX SA IPRIV.
GERDAU SA! SADR PFD SHS
JBS AS
PETROBRAS ISADR
BRL 16,211,048 1 92
BRL 5.069680 0 6 0
US0 20,023,549 2 37
USD 7,838,768 0.93
USD 4,851 175 0.57
BRL 6,991,106 0 8 3
US0 9,648.110 1 1 4
ERL 8,902 473 1.05
USD 28.544 595 337
108,080.5o4 12 7a
~- .~
5164,500 IDR 3,704109 0 4 4
14.992000 IDR 8,290201 0 9 8
226,340 USD 9.741.673 I 15
7,667,000 IDR a 269.435 0.98
30,005,418 3 55
MALAYSIA -_ MALAYAN BANKING BERHADIFOR.REG. RESORTS WORLD
I 3 542.000 MYR 13,122,334 1 55
502000 MYR 2499 106 0 3 0
15,621,440 1.85 CHILE _-
CENCOSUDSA MEXICO
CLP 10.388 111 1 23
103aa , i i i 1.23 . -
I CEMEX /ADR
CONSORCIO ARA SAB DE CV
CONTROLADORA COM SABI(1 C+3 E) EMPRESAS ICA SAB DE CV
FOMENT0 ECONOMIC0 MEXICANOIADR
121 725 US0 3.992580 0 4 7
3 104,700 MXN 5,341,587 0.63
2 101,374 MXN 5885237 0 7 0
3,513914 MXN 13547701 1 6 0
78076 usD a,730458 1.03
-
37,497,563 4 43 ~~
CHINA .-
ANGANG STEEL COMPANY LTD -H- CHINA CONSTRUCTION BANK
CORP CHINA SHENHUA ENERGY CO -H- PETROCHINA CO LTD /-H-
PING AN INSUR (GRP)CO -H-
HKD 17,502,346 2.07
HKD 7 619,600 0.90
HKD 17,135,211 2 0 3
HKD 5,601,360 0.66
HKD 2,342,688 028 ~.
50.201 205 5 94
POLAND
BK POLSKA KASA OPlEKl PEKAO POWSZECHNA KASA 0SfCZED.POLSKI
81,670 PLN 7,457,106 088
214299 PLN 3569,436 0 4 2
-
11.026.542 1 30 -
COLOMBIA
SURAMERICANA DE INVERSIONES
COP 9,847,891 1.16
SOUTH AFRICA
9,047,891 1 16 .-
BIDVEST GROUP LTD
IMPALA PLATINUM HOLDINGS LTD MASSMART HOLDINGS LTD
SASOL LTD IREG.
693,173 ZAR 13,136392 155
276,622 ZAR a.62~.194 1.02
1,005,604 ZAR 11 613,217 137
999.610 ZAR 33,971 543 4 0 2
FEDERATION OF RUSSIA ~ .~
AKSBEREGATELNYBANK SBERBANK GAZPROM OAO
USD 31.a24.045 376
US0 28.699.957 3.39
HSBC Global Investment Funds
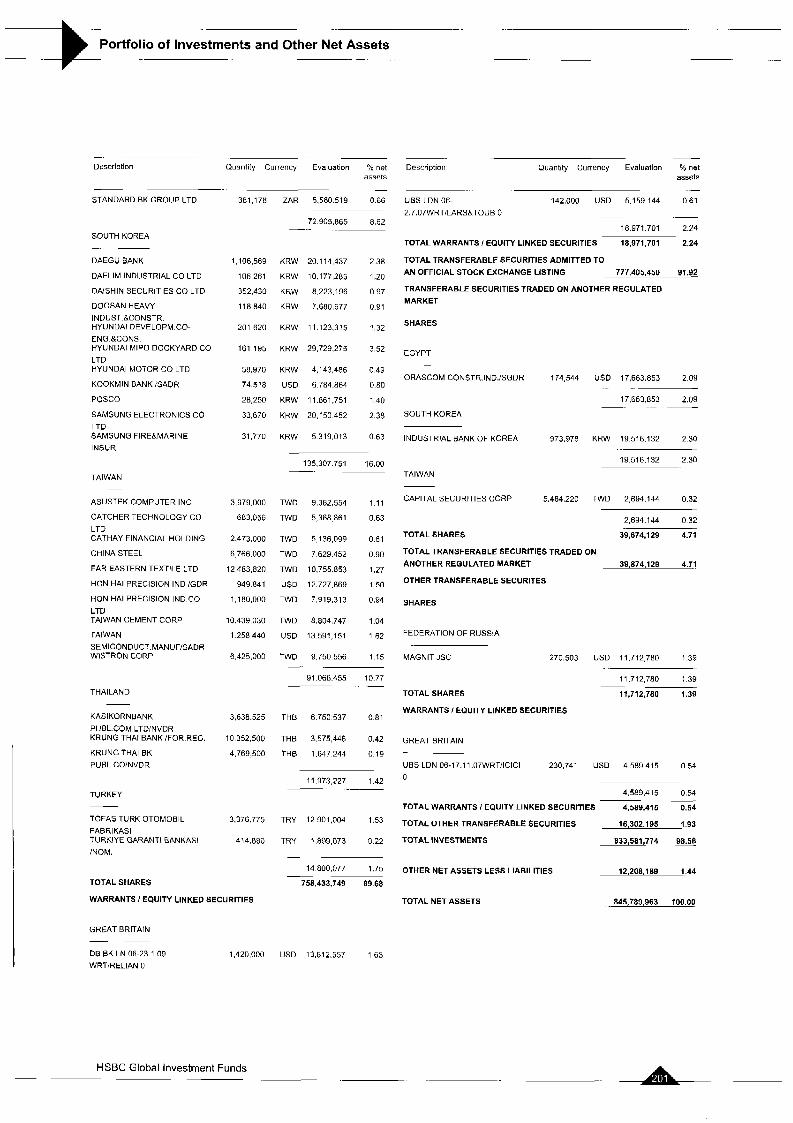
-. -.
Portfolio of Investments and Other Net Assets .. -
- Description Quantity Currency Evaluation Yo net
assets - -
~.
Description Quantity Currency Evaluation % net assets .- .. .
UBS LON 06- 142,000 US0 5.159.144 061
2.7.07WRTILARS&TOUB 0 ~
18.971.701 2.24
STANDARD BK GROUP LTD 381.178 ZAR 5.560519 0.66
72 905.865 8.62 -.
SOUTHKOREA -~
DAEGU BANK
DAELIM INDUSTRIAL CO LTD
DAlSHlN SECURITIES CO LTD
DOOSAN HEAVY INDUST ACONSTR. HYUNDAI DEVELOPM.CO- ENG &CONS HYUNDAI hllP0 DOCKYARD CO LTD HYUNDAI MOTOR CO LTD
KOOKMIN BANK /SADR
POSCO
SAMSUNG ELECTRONICS CO LTD SAMSUNG FIRE&MARINE INSUR.
TOTAL WARRANTS I EQUITY LINKED SECURITIES 18,971,701 2.24
TOTAL TRANSFERABLE SECURITIES ADMITTED TO
AN OFFICIAL STOCK EXCHANGE LISTING 777,405,450 91.92
TRANSFERABLE SECURITIES TRADED ON ANOTHER REGULATED MARKET
SHARES
1,106,569 KRW 20,114,137 2.38
106,261 KRW 10 177.285 1.20
352.430 KRW 8.223.196 0 97
118.840 KRW 7,680,677 0.91
201,620 KRW 11123,315 1.32
161.195 KRW 29,729,275 3.52
58,970 KRW 4,143,486 0.49
74.518 USD 6 784.864 0.80
28,250 KRW 11 861,751 1 40
33670 KRW 20.150452 2.38
31.770 KRW 5319.013 0.63
EGYPT -
ORASCOM CONSTR.IND./SGDR 174,544 US0 17,663 853 2 09
17,663.853 2.09 ~. .._ -
SOUTH KOREA
INDUSTRIAL BANK OF KOREA 973.978 KRW 19,516,132 230
19 516.132 2.30 135.307 751 16.00 -. TAIWAN TAIWAN
.-
ASUSTEK COMPUTER INC
CATCHER TECHNOLOGY CO LTD CATHAY FINANCIAL HOLDING
CHINA STE!L
FAR EASTERN TEXTILE LTD
HON HA1 PRECISION IND lGDR
HON HA1 PRECISION IND.CO LTD TAIWAN CEMENT CORP
TAIWAN SEMICONDVCT.MANUF:SADR WISTRON CORP
CAPITAL SECURITIES CORP 5.484.220 TWD 2.694.144 0.32 3,979.000 TWO 9,382.554 1 11
683,056 TWD 5,368 861 0.63
2,473,000 TWD 4 136,099 0.61
6 766.000 TWO 7 629.452 0.90
12 483 820 TWD 10,755 853 1.27
949 841 US0 12.727.869 1.50
1 180,000 TWO 7.919.313 0.94
10,439,030 TWD 8,804,747 1.04
1.258440 USD 13591,151 162
6,425,000 TWO 9.750 556 1.15
91 066.455 10.77
.
~. . -
2,694.144 0.32
TOTAL SHARES 39,874,129 4.71
TOTAL TRANSFERABLE SECURITIES TRADED ON
ANOTHERREGULATEDMARKET 39.874.129 4.71
OTHER TRANSFERABLE SECURITES
SHARES
FEDERATION OF RUSSIA
MAGNIT JSC 270,503 US0 11.712780 139
11,712,780 1.39
11,712,780 1.39 ~
THAILAND TOTAL SHARES
WARRANTS I EQUITY LINKED SECURITIES KASIKORNBANK PUBL.COM.LTD/NVDR KRUNG THAI BANK /FOR.REG.
KRUNG THAI EK PUBL.CO/NVDR
3.638525 THE 6.750537 081
10 352.500 THB 3,575,446 0.42
4,769,500 THE 1.647 244 0 19
GREAT BRITAIN .~
UBS LDN 06-17.11.07WRT!ICICI 230,741 US0 4.589 415 0.54 0
4,589,415 0.54
TOTAL WARRANTS / EQUITY LINKED SECURITIES 4,588,415 0.54 -
11,973,227 1.42 - TURKEY
TOFAS TURK OTOMOBIL FABRlKASl TURKIYE GARANTI RANKAS1 /NOM.
3,376 775 TRY 12 901,004 1.53
414.680 TRY 1,899,073 022
-
14 800,077 1.75
758,433,749 89 68
16,302,195 1.93 TOTAL OTHER TRANSFERABLE SECURITIES
TOTAL INVESTMENTS 833,581,774 98.56
12.208.189 1.44 OTHER NET ASSETS LESS LIABILITIES TOTAL SHARES
WARRANTS / EQUITY LINKED SECURITIES
GREAT BRITAIN -~ 08 EK LN 06-23 1 09 WRTlRELlAN 0
TOTALNETASSETS . 845,789363 100.00
1420,000 US0 13,812.557 163
. A.. HSBC Global Investment Funds r

.
Portfolio of Investments and Other Net Assets -E . -
GLOBAL EMERGING MARKETS EQUITY FREESTYLE
Economic Division of Investment . -
- (expressed as a percentage of net assets) - ._
%
Banks and financial institutions Energy Coal mines, heavy industries Construction, building materials Electronics and electrical equipment News transmission Mechanics, machinery Automobile industry Holding companies Food Retail trade, department stores Office equipment and computers Insurance Other services Transport Textile Tobacco and spirits Precious metals Real estate companies Public services Gastronomy
Other net assets less liabilities
24.70 14.10 9.63 7.72 7.07 4.98 4.43 3.57 3.27 3.14 2.93 2.26 2.07 2.06 1.92 1.27 1.03 1.02 0.63 0.46 0.30
1.44
Total Net Assets 100.00
- HSBC Global Investment Funds
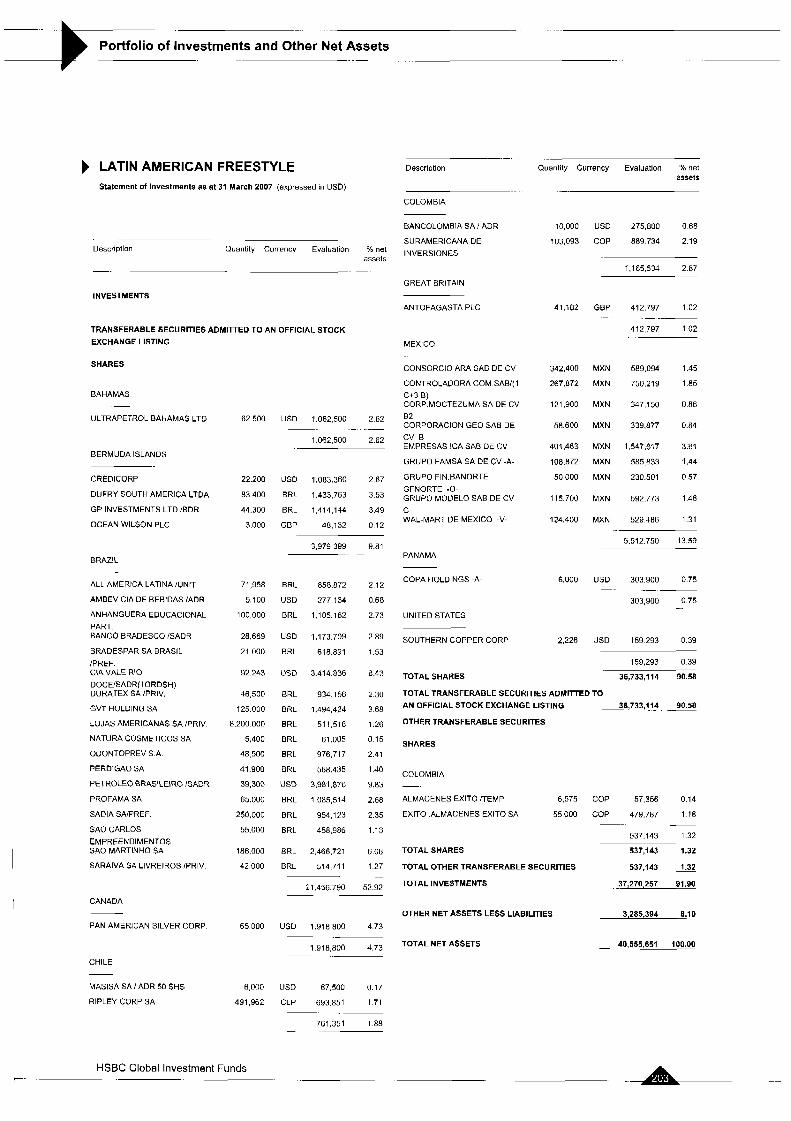
. ..
Portfolio of Investments and Other Net Assets . -.
LATIN AMERICAN FREESTYLE Statement of Investments as at 31 March 2007 (expressed in USD)
Description Quantity Currency Evaluation % net assets
COLOMBIA
BANCOLOMBIA SA / ADR
SURAMERICANA DE INVERSIONES
10.000
103.093
41.182
342,400
267,872
121.900
58.600
401.463
108.872
50,000
115,700
124,400
6,000
2,226
US0 275,800 0.68
COP 889.734 2.19 . . .. .-.
Description Ouantity Currency Evaluation % net assets
1,165.534 2 87
GREAT BRITAIN
ANTOFAGASTA PLC INVESTMENTS
GBP 412.797 102
412 797 102
- .-
TRANSFERABLE SECURITIES ADMITTED TO AN OFFICIAL STOCK EXCHANGE LISTING
SHARES
MEXICO
CONSORCIO ARA SAB DE CV
CONTROLADORA COM SAB/(l C+3 B) CORP.MOCTEZUMA SA DE CV 82 CORPORACION GEO SAB DE CV B EMPRESAS ICA SAE DE CV
GRUPO FAMSA SA DE CV -A-
GRUPO FIN.BANORTE GFNORTE -0- GRUPO MODEL0 SAB DE CV C WAL-MART DE MEXICO -V-
MXN 589.094 145
MXN 750,219 185
MXN 347,150 086
MXN 339,877 084
MXN 1,547,817 3.81
MXN 585833 144
MXN 230.501 0.57
MXN 592.773 146
MXN 529486 131
5.512.750 13 59
BAHAMAS
ULTRAPETROL BAHAMAS LTD 62 500
22 200
83 400
44.300
3.000
71,958
5 100
100,000
28.669
21 000
92,243
46,500
125 000
8.200 000
5,400
48 500
41 900
39,300
65.000
250,000
55.000
i86.000
42,000
65 000
6 000
491.962
US0 1.062,500 262
1.062.500 2 62
~. _ _-
BERMUDA ISLANDS
CREDICORP
DUFRY SOUTH AMERICA LTDA
GP INVESTMENTS LTD lBDR
OCEAN WILSON PLC
US0 1.083.360
BAL 1.433.763
BRL 1414,144
GBP 48,132
2 67
3.53
3.49
0 12
9.81
~
_.
2 12
0.68
2.73
2.89
1.53
8.43
2 30
3.68
1.26
0.15
2 41
1.40
9.83
2.68
2.35
1.13
6 08
1.27
52.92
__
~
4.73
3,979 399 PANAMA BRAZIL
COPA HOLDINGS -A-
UNITED STATES
US0 303,900 075
303,900 0 7 5
.- - -. ALL AMERICA LATINA /UNIT
AMBEV CIA DE BEBIDAS /ADA
ANHANGUERA EDUCACIONAL PART. BANCO BRADESCO ISADR
BRADESPAR SA BRASIL /PREF. CIA VALE RIO
BRL 858.872
USD 277,134
BRL 1.105.162
US0 1,173,709
BRL 618.891
USD 3.414.836
BRL 934,156
BRL 1,494,424
BRL 511.518
BRL 61.005
BRL 976.717
BRL 568.435
USD 3,981,876
BRL 1085,514
BRL 954,123
BRL 458,986
BRL 2,466,721
BRL 514,711
SOUTHERNCOPPERCORP
TOTAL SHARES
USD 159293 039
159,293 0.39
36,733,114 90.58 DOCEISADR(1 ORDSH) DURATEX SA /PRIV. TOTAL TRANSFERABLE SECURITIES ADMITTED TO
AN OFFICIAL STOCK EXCHANGE LISTING
OTHER TRANSFERABLE SECURITES
SHARES
36,733,114 -90.58 GVT HOLDING SA
LOJAS AMERICANAS SA /PRIV
NATURA COSMETICOS SA
ODONTOPREV S.A.
PERDIGAO SA
PETROLEO RRASILEIRO lSADR
PROFAMA SA
SADIA SAIPREF.
SA0 CARLOS EMPREENDIMENTOS 5.40 MARTINHO SA
SARAIVA SA LlVRElROS /PRIV.
COLOMBIA
ALMACENES EXIT0 /TEMP 6,575
EXIT0 .ALMACENES EXIT0 SA 55 000
COP 57,356 0.14
COP 479.787 1.18
537.143 1.32
.-
TOTAL SHARES
TOTAL OTHER TRANSFERABLE SECURITIES
TOTALINVESTMENTS
537,143 1.32
537,143 1.32
.. 37,270,257 91.90 21 456.790 ~ .-
CANADA
PAN AMERICAN SILVER CORP. OTHER NET ASSETS LESS LIABILITIES 3.285.394 8.10
US0 1.918.800 ~ .~
1 918,800 4.73 TOTAL NET ASSETS 40,555,651 100.00 _.
CHILE
MASISA SA I ADR 50 SHS
RIPLEY CORP SA
USD 67.500 0.17
CLP 693.851 1.71
761,351 1.88
~. ~
- .
HSBC Global Investment Funds - . r-
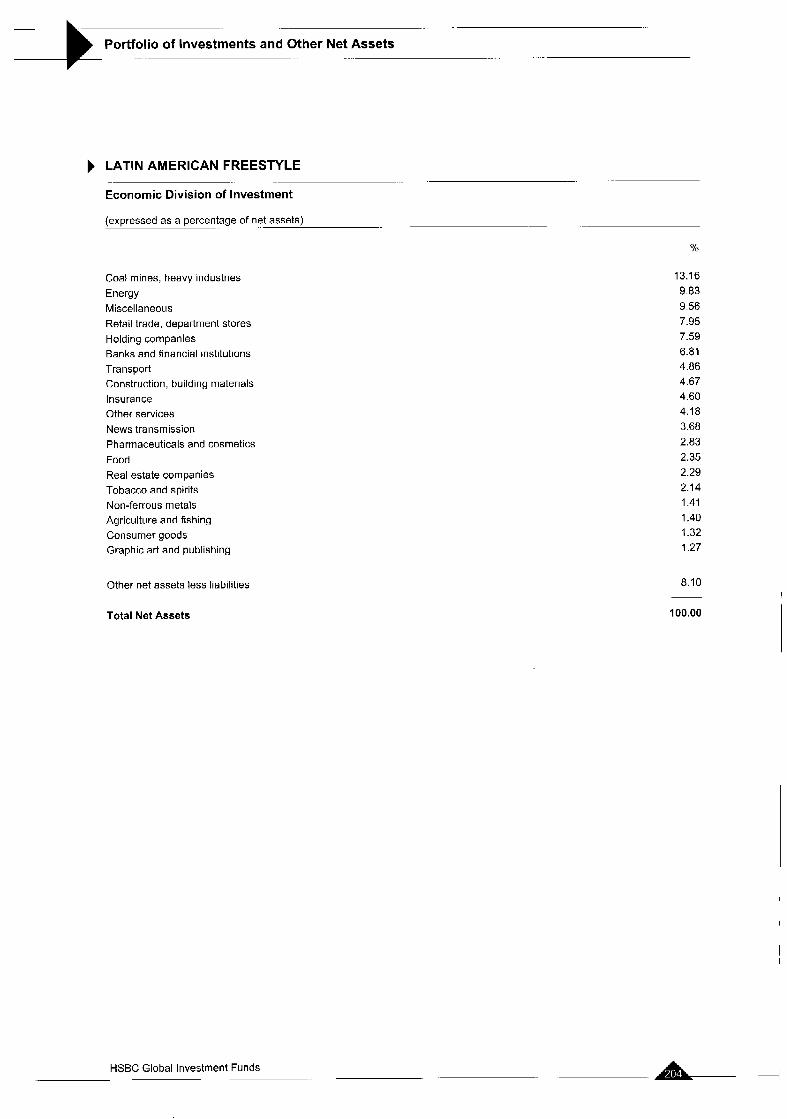
. . .. . __ .- _. . -.
Portfolio of Investments and Other Net Assets .. . . . .. ... . . . .
LATIN AMERICAN FREESTYLE
Economic Division of Investment ... ...
(expressed as a percentage of net assets) - .
Coal mines, heavy industries Energy Miscellaneous Retail trade, department stores Holding companies Banks and financial institutions Transport Construction, building materials Insurance Other services News transmission Pharmaceuticals and cosmetics Food Real estate companies Tobacco and spirits Non-ferrous metals Agriculture and fishing Consumer goods Graphic art and publishing
Other net assets less liabilities
13.16 9.83 9.56 7.95 7.59 6.81 4.86 4.67 4.60 4.18 3.68 2.83 2.35 2.29 2.14 1.41 1.40 1.32 1.27
8.10
Total Net Assets 100.00
A + HSBC Global Investment Funds

Portfolio of Investments and Other Net Assets
UK FREESTYLE Statement of Investments as at 31 March 2007 (expressed in GBP)
Descriptior Quantity Currency Evaluation
~-
INVESTMENTS
TRANSFERABLE SECURITIES ADMITTED TO AN OFFICIAL STOCK EXCHANGE LISTING
SHARES
GREAT BRITAIN ~ -
BAE SYSTEMS PLC
BARCLAYS PLC
EG GROUP PLC
BP PLC
CENTRICA PLC
DOMESTIC 8 GENERAL GROUP PLZ EM1 GROUP PLC
HBOS PLC
HELPHIRE GROUP LONDON
HOMESERVE
HSBC HOLDINGS PLC
ICAP PLC
INCHCAPE PLC
JOHNSON MATTHEY PLC
LEGAL 8 GENERAL GROUP PLC RESOLUTION PLC
ROYAL DUTCH SHELL -E-
ROYAL DU-CH SHELL PLC -A.
SHIRE PLC
SIG PLC
UNILEVER PLC
UTD BUSINFSS MEDIA PLC
XSTRATAPLC
31 GROUP PLC
GUERNSEY
RAVEN RUSSIA PLC
TOTAL SHARES
112.616
71.206
73 470
98,966
138.687
43 851
197 946
49,434
118.184
28,599
57.524
97.312
91 915
33.086
329,294
78,543
2
31,075
47 221
40,887
33,194
65.278
20,644
45,117
438,276
GBP
GBP
GEP
GBP
GBP
GBP
GEP
GBP
GBP
GBP
GEP
GBP
GBP
GBP
GEP
GBP
GBP
GBP
GBP
GBP
GEP
GBP
GEP
GBP
518.a70
515,175
541 107
551,381
525,430
517.442
447.853
518.741
522.373
509,320
510.526
511,375
523 916
519,946
516,827
482 984
34
530.450
497.237
517,629
503.221
522.224
533 131
51 2,150
YO net assets
4 01
3.98
4.19
4.27
4 06
4.00
3.46
4.01
4 04
3.94
3.95
3.95
4.05
4.02
4 00
3.73
0.00
4 10
3.84
4.00
3.89
4 04
4.12
3.96 -
11,849,350 91 61 - .
GEP 529,218 409 - .
529,218 4.09
12,378,568 95.70 - .
TOTAL TRANSFERABLE SECURITIES ADMITTED TO
AN OFFICIAL STOCK EXCHANGE LISTING 12,378.568 95.70
Quantity Currency Evaluation % net assets
Description
TRANSFERABLESECURITIESTRADEDONANOTHERREGULATED MARKET
SHARES
GREAT BRITAIN
TRADING EMISSIONS PLC -C- 451,972 GBP 503,9A9 3.90
503,949 3.90
TOTAL SHARES 503,949 3.90
TOTAL TRANSFERABLE SECURITIES TRADED ON ANOTHERREGULATEDMARKET 503,949 3.90
12,882,517 99 60 TOTAL INVESTMENTS
~ -.
52,359 0.40 - OTHER NET ASSETS LESS LIABILITIES
TOTAL NET ASSETS 12,934,876 100.00
HSBC Global Investment Funds 7 - ..
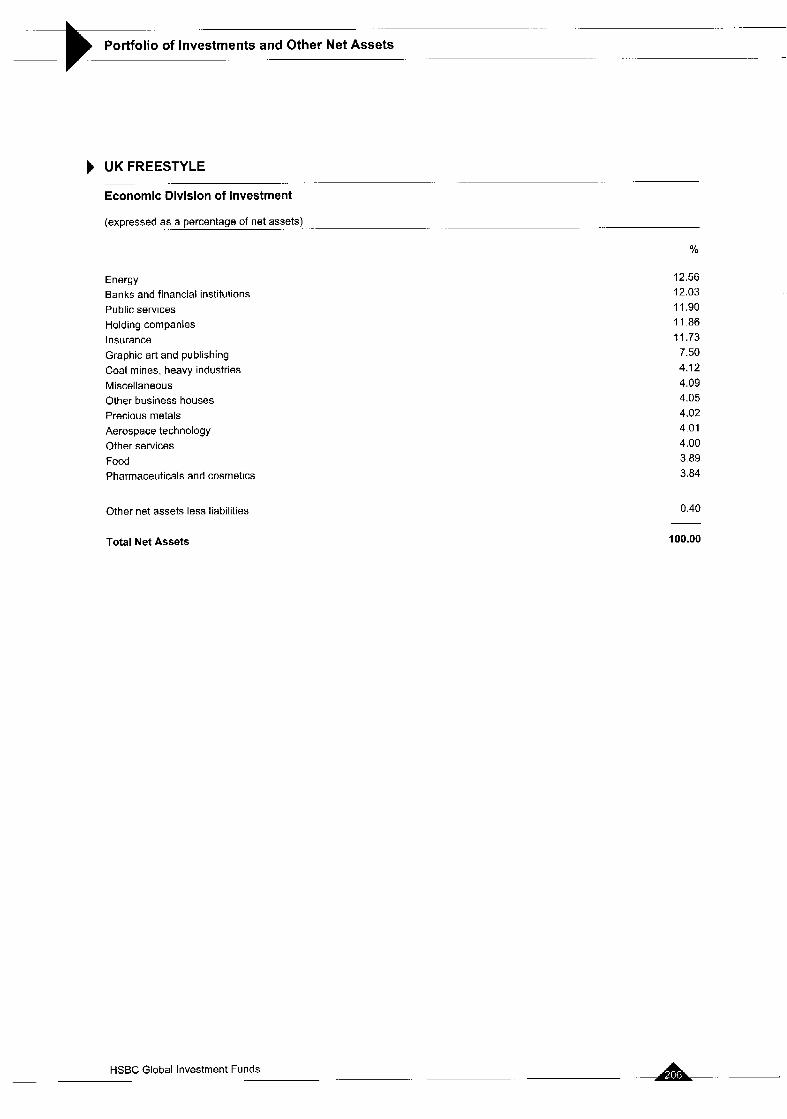
.. - -. - --
Portfolio of Investments and Other Net Assets -. -
UK FREESTYLE
Economic Division of Investment -
~
~. (expressed as a percentage of net assets) . - -
%
Energy Banks and financial institutions Public services Holding companies Insurance Graphic art and publishing Coal mines, heavy industries Miscellaneous Other business houses Precious metals Aerospace technology Other services Food Pharmaceuticals and cosmetics
Other net assets less liabilities
12.56 12.03 11.90 11.86 11.73 7.50 4.12 4.09 4.05 4.02 4.01 4.00 3.89 3.84
0.40
Total Net Assets 100.00
HSBC Global Investment Funds ~

- .. -
Portfolio of Investments and Other Net Assets
Description Face Value Currency Evaluation % net assets
ING BK BRAZIL 0%06- 590 BRL 299,894 4 3 0 10 12 07CD ~
895044 1284
095,044 12.84
asset5 TOTAL FINANCIAL INSTRUMENTS 4,260,213 61 13
TOTAL INVESTMENTS 6.113.491 07 72
BRAZILBOND Statement of investments as at 31 March 2007 (expressed in USD) -. ~
- - TOTAL CERTIFICATE OF DEPOSIT
- - Description Face Value Currency Evaluatlon %net
--
INVESTMENTS OTHER NET ASSETS LESS LIABILITIES - 855,802 12.20
TRANSFERABLE SECURITIES ADMITTED TO AN OFFICIAL STOCK EXCHANGE LISTING TOTAL NET ASSETS 6,969,093 1 0 0 . ~
BONDS
BRAZIL
BRAZIL TV 03-20.06.07
BRAZIL TV 05-16.12.09
TOTAL BONDS
407 BRL 609,774 8 7 5
830 BRL 1243.504 1784
1.853 278 26 59
1.853.278 26.59
~ --
-
TOTAL TRANSFERABLE SECURITIES ADMITTED TO
AN OFFICIAL STOCK EXCHANGE LISTING 1,853,278 26.59
FINANCIAL INSTRUMENTS
COMMERCIAL PAPER
BRAZIL -.
BANCO BRADESCO 06-28.5.07 CD BCO BNP BRAZIL 06-28.5 07 CD
BCO SANTBRASIL 06-28.5.07 CD ClTlBANK BRAZIL 06-04.6.07 CD
CAYMAN ISLANDS
BCO ABN AMRO REALO6- 28.5.07 CD
GREAT BRITAIN
565 BRL 307,836 4.42
1,130 BRL 616,321 8 8 4
1,130 BRL 617,100 886
565 BRL 306 507 4.40
~- 1.847 764 26 52
-.
1,100 BRL 600.780 8.62
-. .
600,780 8.62 ~. --
HSBC 06-28 5 07 CD
PORTUGAL
1.130 BRL 616.646 885
616,646 8.85
-
-
BANCO ITAU S.A.06-18 6.07 CD
TOTAL COMMERCIAL PAPER
CERTIFICATE OF DEPOSIT
BRAZIL
550 BRL 299,979 4.30
299,979 4.30
3,365,169 48.29
~- .-
BCO INVEST BRASIL 0%- 6.12.07CD BlFB 0% 06-6.12.07 CD
594 BRL 302,452 4.34
575 BRL 292,698 4.20
HSBC Global Investment Funds - ~. ~. ~ -
-
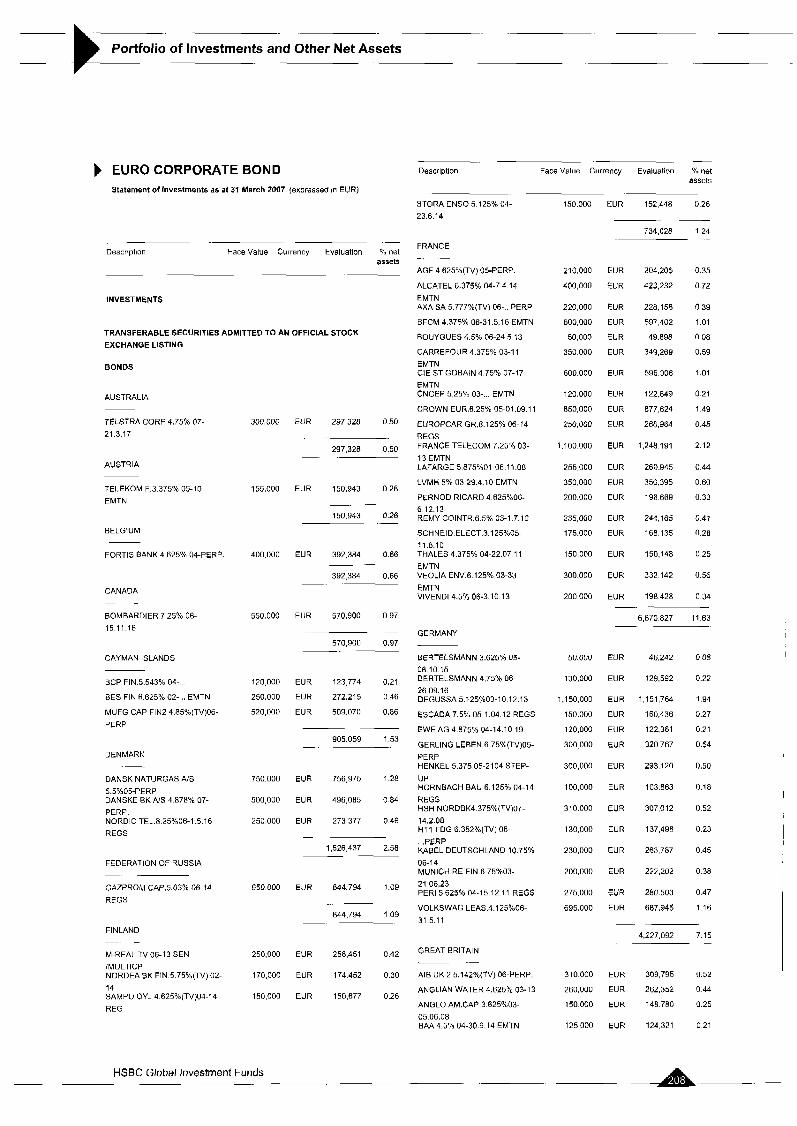
. -
Portfolio of Investments and Other Net Assets
EURO CORPORATE BOND Statement of investments as at 31 March 2007 (expressed in EUR)
. -
Descriplion Face Value Currency Evaluation Yo ne1 assets
. . .
INVESTMENTS
TRANSFERABLE SECURITIES ADMITTED TO AN OFFICIAL STOCK EXCHANGE LISTING
BONDS
AUSTRALIA
TELSTRA CORP 4.75% 07. 21.3.17
AUSTRIA
TELEKOM F.3.375% 05-10 EMTN
BELGIUM
FORTIS BANK 4.625% 04-PERP
CANADA -. -
BOMBARDIER 7 25% 06- 15.11.16
CAYMAN ISLANDS - -
BCP FIN 5 543% 04-
BES FIN 6 625C 02-
MUFG CAP FIN2 4 85%(TV)06- PERP
EMTN
DENMARK
DANSK NATURGAS AIS 5.5%05-PERP DANSKE BK A/$4.878% 07- PERP. NORDIC TEL.8.25%06-1.5.16 REGS
FEDERATION OF RUSSIA -.
GAZPROM CAP.5.03% 06-14
REGS
FINLAND - --
M-REAL TV 06-13 SEN iMULTlCP NORDEA BK FIN 5 75%(TV) 02- 14 SAMPO OYJ 4 625%(TV)04-14 REG
300.000
155,000
400.000
550.000
120 000
250,000
520,000
750.000
500,000
250 000
650 000
250.000
170.000
150,000
EUR 297,328 0.50
297.328 0.50 -
EUR 150,943 0.26
~. --
150,943 0.26 .-
EUR 392.384 066
392 384 0.66 ~. .
EUR 570,900 097
-
570,900 0.97 -~
EUR 123774 0.21
EUR 272.215 046
EUR 509.070 0.86
~- 905.059 1 5 3
-
EUR 756,975 1 2 8
EUR 496085 0 8 4
EUR 273377 046
-
1,526,437 2.58 ~~
EUR 644.794 109
644,794 1 0 9
EVA 256.451 0.42
EUR 174.452 0 3 0
EUR 150,677 0.26
.. . . -
Description Face Value Currency Evaluation % net assets
. . -. -
STORA ENS0 5.125% 04- 23.6.14
FRANCE -. -
AGF 4 625%(TV) 05-PERP
ALCATEL 6.375% 04-7 4 14 EMTN AXA SA 5.777n/(TV) 06- ... PERP
BFCM 4.375% 06-31 5.16 EMTN
EOUYGUES 4.5% 06-24.5.13
CARREFOUR 4.375% 03-1 1 EMTN CIE ST GOBAIN 4 75% 07-17 EMTN CNCEP 5 25% 03- . EMTN
CROWN EUR.6.25% 05-01.09.1 1
EUROPCAR GR.8.125% 06-14 REGS FRANCE TELECOM 7.25% 03- 13 EMTN LAFARGE 5 875%01-06.11.08
LVMH 5% 03-29 4.10 EMTN
PERNOD RICARD 4.625%06- 6 12.13 REMY COINTR.6.5% 03-7.7.70
SCHNEID ELECT.3.125%05- 11.8.10 THALES 4.375% 04-22.07.1 1 EMTN VEOLIA ENV.6 125% 03-33 EMTN VIVENDI 4.5% 06-3.10 13
150.000 EUR 152,448 0.26
~- 734.028 1.24
210,000
400,000
220,000
600,000
50,000
350 000
600.000
120.000
850.000
250,000
1.1 00 000
255,000
350 000
200.000
235 aoo 175,000
150,000
300.000
200 000
EUR
EUR
EUR
EUR
EUR
EUR
EUR
EUR
EUR
EUR
EUR
EUR
EUR
EUR
EUR
EUR
EUR
EUR
EUR
204,205
423,232
228.158
597,402
49.898
349,269
596 308
122.849
877,624
266,364
1,248 191
260.945
356.395
196.669
244,165
168.1 35
150.148
332 142
198 428
0 35
0.72
0.39
1.01
0.08
0.59
1.01
0 21
1.49
0.45
2.12
0.44
0.60
0.33
0 41
0.28
0 25
0.56
0.34 -.
6,870 827 11 63 ~
GERMANY
BERTELSMANN 3.625% 05-
06 10.15 EERTELSMANN 4.75% 06- 26.09.16 DEGUSSA 5.125%03-10 12.13
ESCADA 7.5% 05-1.04.12 REGS
EWE AG 4.875% 04-14.10.19
GERLING LEEEN.6.75%(TV)05- PERP HENKEL 5.375 05-2104 STEP-
UP HORNBACH BAU 6.125% 04-14 REGS HSH NORDEK4.375%(TV)O7- 14.2.08 HTI FOG 6.352%(TV) 06- , , PERP KABEL DEUTSCHLAND 10.75%
06-14 MUNICH RE FIN.6.75%03- 21.06.23 PER1 5.625% 04-15.12.11 REGS
VOLKSWAG LEAS.4.125%06- 31 5.11
GREAT BRITAIN - .- AIB UK 2 5.142%(TV) OB-PERP.
ANGLIAN WATER 4.6253'0 03-13
ANGLO AM.CAP 3.625%03- 05.06.08 BAA 4.5% 04-30.9 14 EMTN
50,000 EUR 46,242 008
130,000 EUR 129,592 0.22
1,150,000 EUR 1151,764 194
150.000 EUR 160,436 0.27
120,000 EUR 122.361 0.21
300.000 EUR 320767 0.54
300,000 EUR 293.120 0.50
100,000 EUR 103.863 0.18
310,000 EUR 307,012 0 5 2
130,000 EUR 137.498 0.23
230,000 EUR 263,787 0.45
200,000 EUR 222,202 0.38
275.000 EUR 280.503 0.47
695,000 EUR 687.945 1.16
-
4,227.092 7.15 - . .
310.000 EUR 309,795 052
260,000 EUR 262,352 0 4 4
150,000 EUR 148780 025
125000 EUR 124,321 021
I
- ~ A HSBC Global Investment Funds
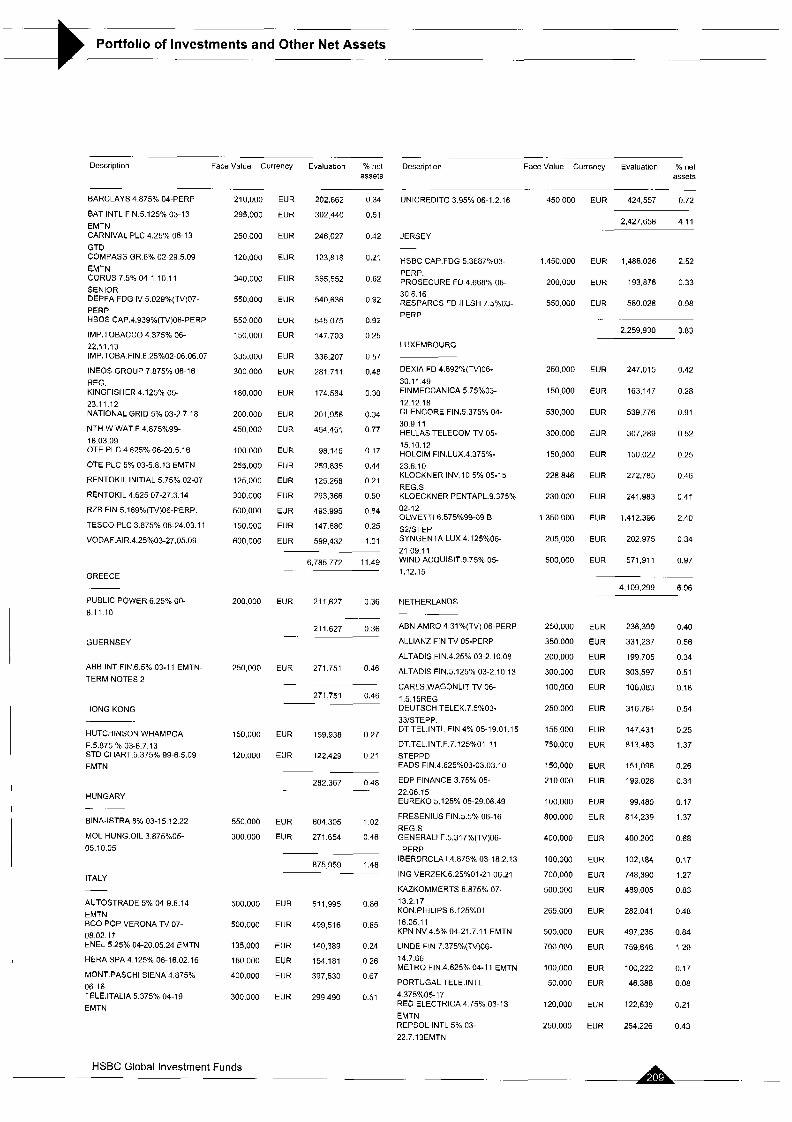
Portfolio of Investments and Other Net Assets -
- ~. .
Description Face Value Currency Evaluation % net assets
. - .. -.
Description Face Value Currency Evaluation % net assets
450,000 EUR 424,557 0.72
- - .
UNlCREDlTO 3.95% 06-1.2.16 210,000 EUR
295,000 EUR
250000 EUR
120,000 EUR
340,000 EUR
550,000 EUR
550000 EUR
150,000 EUR
335.000 EUR
300000 EUR
180,000 EUR
200000 EUR
450.000 EUR
I00000 EUR
255.000 EUR
125.000 EUR
300,000 EUR
500,000 EUR
150.000 EUR
600,000 EUR
202.662
302 440
246,027
12331 8
365,552
540,636
545 075
147,703
336,207
281.71 1
174.564
201.956
454 451
98.146
259.835
125 268
293,366
493,995
147.680
599,432
0 34
0.51
0.42
0.21
0.62
0.92
0.92
0.25
0 57
0.48
0 30
0.34
0 77
0.17
0.44
0.21
0.50
0.84
0.25
1.01
BARCLAYS 4 875% 04-PERP
BAT INTL FIN 5 125% 03-13 EMTN CARNIVAL PLC 4.25% 06-13 GTD COMPASS GR 6% 02-29.5.09
2.427.658 4 11
JERSEY
HSBC CAP.FDG 5.3687%03- PERP. PROSECURE FD 4.668% 06- 30.6.16 RESPARCS FD II LSH 7 5%03 PERP
1.450.000 EUR 1,486.026 2.52
200,000 EUR 193.876 0.33
550.000 EUR 580.028 0.98
.. ..
2.259.930 3.83
EMTN CORUS 7 540 04-1 10.11 SENIOR DEPFA FOG IV 5 029%(TV)07- PERP HBOS CAP.4.939%(TV)OS-PERP
IMP.TOBACC0 4.375% 06- 22.11.13 IMP.TOBA.FIN.6.25%02-06.06.07
INEOS GROUP 7 875% 06-16 REG. KINGFISHER 4 125% 05- 23.1 1.1 2 NATIONAL GRID 5% 03-2.7.18
NTH.W WAT.F 4.875%99- 18.03.09 OTE PLC 4.E25% 06-20.5.16
OTE PLC 5% 0348.13 EMTN
RENTOKIL INITIAL 5.75% 02-07
RENTOKIL 4.625 07-27.3.14
RZB FIN.5.169%(TV)06-PERP.
TESCO PLC 3 875% 06-24.03.1 1
VODAF.AIR.4.25%03-27.05,09
LUXEMBOURG
DEXIA FD 4.892%(TV)06- 250.000 EUR 247,015 0.42
150000 EUR 163,147 0.28
530.000 EUR 539,776 0.91
300000 EUR 307.289 0.52
150.000 EUR 150,022 0.25
228,846 EUR 272.785 0.46
230.000 EUR 241,983 041
1.350.000 EUR 1,412,396 2.40
205,000 EUR 202975 0.34
$00,000 EUR 571,911 0.97
4.109.299 6.96
30 11.49 FINMECCANICA 5 75%03- 12.12.18 GLENCORE FIN.5 375% 04. 3 0 9 1 1 HELLAS TELECOM TV 05-
15.10.12 HOLCIM FIN.LUX.4.375%- 23 6 10 KLOCKNER INV 10 5% 05-15 REG S KLOECKNER PENTAPL 9 375% 02-12 OLlVETTl 6.575%99-09 B SS/STEP SYNGENTA LUX 4.12$%06- 21.09.11 WIND ACQUISIT.9.75% 05- 1.12.15
~ _ _ 6.785 772 11 49
- GREECE
PUBLIC POWER 6.25% 00- 8.11.10
NETHERLANDS 200,000 EUR 211,627 0.36
~ -~ 211,627 0.36
-.
- -
ABN AMRO 4 3l%(TV) 06-PERP
ALLIANZ FIN TV 05-PERP
ALTADIS FIN.4.25% 03-2.10.08
ALTADIS FIN.5.125"h 03-2.10 13
CARLS.WAGONLIT TV 06- 1.5.15REG DEUTSCH TELEK.7 5%03- 33/STEPP. DT TEL.INTL.FIN 4% 05-19.01.15
DT.TEL.INT.F.7.125%01-11
250,000
350 000
200,000
300.000
100,000
250 000
155,000
750,000
150,000
210 000
100.000
800.000
400,000
100 000
700.000
500.000
265.000
500.000
700.000
100,000
50,000
120,000
250.000
EUR
EUR
EUR
EUR
EUR
EUR
EUR
EUR
EUR
EUR
EUR
EUR
EUR
EUR
EUR
EUR
EUR
EUR
EUR
EUR
EUR
EUR
EUR
236,399
331,237
199,705
303,597
106.083
316,784
147,431
813.483
151,096
199,028
99,480
814.239
400.200
102,184
748,390
489,005
282.041
497,235
759.646
100,222
46.388
122.639
254.226
0.40
0.56
0.34
0.51
0.18
0.54
0.25
1.37
0.26
0.34
0.17
1.37
0.68
0.17
1.27
0.83
0.48
0.84
1.29
0.17
0.08
0.21
0.43
GUERNSEY
ABB INT.FIN.6.5% 03-1 1 EMTN- TERM NOTES 2
250,000 EUR 271.751 046
- .
271 751 0.46 ~ .~
HONG KONG
HUTCHINSOU WHAMPOA F.5.875 90 03-8.7.13 STD CHART.3.375% 99-6 5.09 EMTN
150,000 EUR 159,938 027
120,000 EUR 122.429 021
282.367 048
STEPPD EADS FlN.4.625%03-03.03.10
EDP FINANCE 3.75% 05- 22.06.15 EUREKO 5.125% 05-29 06.49 HUNGARY
- .-
BINA-ISTRA 8% 03-15 12 22
MOL HUNG OIL 3.875%05- 05 10 05
FRESENIUS FIN.5.5% 06-16 REG.S GENERAL1 F.5.317%(TV)06- ..PERP IBERDROLA 14.875% 03-18.2.13
ING VERZEK.6.25%01-21 06.21
KAZKOMMERTS 6,875% 07. 13 2.17 KON PHILIPS 6.125%01-
550.000 EUR 604.305 102
300.000 EUR 271.654 0.46
~~
875,959 1.48 ~- ITALY - AUTOSTRADE 5% 04-9.6.14 EMTN BCO POP VERONA TV 07- 08 02 17 ENEL 5 25% 04-20 05 24 EMTN
HERA SPA 4 125% 06-16 02 16
MONT PASCHI SlENA 4 875% 06-16 TELE.ITALIA 5 375% 04-19 EMTN
500,000 EUR 511.995 086
500,000 EUR 499,516 085
135,000 EUR 140.389 0 24
160000 EUR 154181 026
400,000 EUR 397.530 067
300.000 EUR 299490 051
16.05 11 KPN NV 4.5% 04-21.7.1 1 EMTN
14.7.66 METRO FIN.4 625% 04-11 EMTN
PORTUGAL TELE.INTL 4.375%05-17 RED ELECTRICA 4.75% 03-13 EMTN REPSOL INTL 5% 03- 22.7.13EMTN
HSBC Global Investment Funds A .-

Portfolio of Investments and Other Net Assets ~- ) i i -
Descriotion Face Value Currencv Evaluation % net
SIEMENS F.5.25%(TV)06- 14.9.66 TELEFONICA 5.125%03- 14.02 13 TNT NV 5.125%01- 05.12.OBSENIOR
NORWAY -
TELENOR ASA 4 5% 06- 28 03 14
SOUTH AFRICA
CONSOL GLASS 7 625% 07- 15.4.14
SPAIN
BBVA INTL 4.952%(TV) 06- PERP. SANTANDER TV 04-..PERP.
SWEDEN
SCA FINANS ABS 375%02- 25 06 07 SCA FINANS 3 875% 06-7 03 11
SECURITAS 6 125%,01-14 03.08
SKAND ENSK BANK.TV 02-
6 6 12 TELIASONERA 4 125% 05- 11.5 15
UNITED STATES
AM.GEN.FIN.3.259b 05-16.1 05- 16 1 1 3 ATRT 4.375% 07-15.3.13
CA PREF.TRUST Ill 6% 03- PERP CITIGR.4.75”;o 04-10.2 19 INTL
COMMZBK CAP 5 012”/o(TV)06-
PERP CS GRP(US)3.625”/o(TV)O5- 14.9.20 DAIMLER CHRYS.4.25%04- 4.10.11 DEUTSCHE CAP.5.33% 03-
EMTN GECC 4 625% 06-15 9 66 REGS
GMAC 5 375% 04-6 6 11 EhlTN
GMAC 6%03-03 07 08
GOLDMAN SACHS 4% 05- 02.02.15 LEHMAN BROTH 4 25% 06- 26 UY 16 MERRILL LYNCH 4 45% 07- 31 114 MORGAN STANLEY 3 75% 06- 1 3 1 3 PEMEX FUND MASTER 6 375%
04- 16 ROCKINOOD SPEC 7 625% 04- 14 $AN PAOLO IMI 8.126%00-
PERF
assets
700,000
400 000
350,000
80.000
150 000
200.000
300 000
150,000
65.000
210 000
170,000
125 000
290,000
200.000
125,000
1.000,000
400,000
760.000
450,000
600 000
625,000
650 000
400,000
550 000
300,000
700.000
400.000
225,UOC
250.00c
zoo ooc
EUR 706.024 1.20
EUR 409,666 0.69
EUR 354070 0.60
~.
8,980,498 15 23 .~
EUR 79.565 0 13
. ...
79.565 0 13 ~~
EUR 152,044 0.26
._
152,044 0.26 ~
EUR 198.004 034
EUR 293,519 049
491.523 083 ~
Face Value Currency Evaluation % net assets
Description
.~ - ..
WACHOVIA COR 4 375% 06-18 500,000 EUR 483,684 082
EMTN
8 555,046 14 48
TOTAL BONDS 52,529,898 88 92
TOTAL TRANSFERABLE SECURITIES ADMITTED TO
-
AN OFFICIAL STOCK EXCHANGE LISTING
OTHER TRANSFERABLE SECURITES
BONDS
NETHERLANDS
CARMEUSE LIME 10.75% 02-12
REGS
260 000
TOTAL BONDS
TOTAL OTHER TRANSFERABLE SECURITIES
TOTAL INVESTMENTS
OTHER NET ASSETS LESS LIABILITIES
TOTALNETASSETS
EUR 150,404 0 2 5
EUR 63,680 0.11
EUR 213303 0.36
EUR 170.424 029
EUR 119,256 020
717,067 121
EUR
EUR
EUR
EUR
EUR
EUR
EUR
EUR
EUR
EUR
EUR
EUR
EUR
EUR
EUR
EUR
EUR
EUR
270.899
198,148
128,720
1,012 156
393.928
707,442
444.503
617 355
621 , I 69
637 406
403.500
527,SSY
294.375
695 975
383,374
247,244
263.750
223 729
0 46
0 34
0 22
1.70
0 67
1 20
0 75
1 04
1 05
1.08
U 68
0 89
0 50
118
0 65
0 42
0 45
0.38
- 52,529,898 88.92
EUR 28C,150 047
280.150 0.47
280,150 0.47
280,150 0.47
52,810,048. 89.39
~ --
~
6,269,063 -10.61
59,079,111 I O O f l
~
HSBC Global Investment Funds

. _. _.
Portfolio of Investments and Other Net Assets
EURO CREDIT BOND Statement of Investments as at 31 March 2007 (expressed in EUR)
-. . ..
Description QuantityIFace Currency Evaluation % net Value assets
.. .-
FRANCE TELEC 4 75% 07- 21.02.1 7 FRANCE 3.25% 05-25 4.16 OAT
FRANCE 5.7596 01-25.10.32 BTAN FR.TELECOM 8.1 25"/.03-
300,000
430 000
600 000
100,000
1,500 000
200,000
900.000
550,000
500.000
550.000
250 000
400.000
450 000
1 000,000
430.000
600.000
250.000
1 230.000
900 000
600,000
1,050,000
250.000
1,000 000
500.000
700 000
800,000
1 000,000
500 000
800,000
EUR 298,755 068
EUR 403,512 092
EUR 735,000 168
EUR 135115 031
EUR 1,472,999 3 37
EUR 200,120 0.46
EUR 887,961 203
EUR 549,071 1.25
EUR 511 322 117
EUR 556,540 1 2 7
-
12727217 2906 -
- .
Description QuantityIFace Currency Evaluation % net Value assets
. . 28.01.33 GECINA 4.875% 04-25 1.12
IMERYS 5"/0 07-16 04 17
LA BQUE POSTALE 4"/. 06 811 13 RFF 4 375% 06-2 6 22
RHODIA TV 06-15 10 13 REGS
SCOR ASSIST 6 154%(TV)06- PERP
INVESTMENTS
TRANSFERABLE SECURITIES ADMITTED TO AN OFFICIAL STOCK EXCHANGE LISTING
BONDS
AUSTRIA - ..
ERSTE BK TV 07-19.7.17 TR.2
GERMANY ~
DEGUSSA 5.125%03-10 12.13
HENKEL 5.375 05-2104 STEP- UP HSH NORDBK4,375%(TV)O7- 14.2.08
350 000
186,750
400,000
500,000
500.000
1.500,OOO
500.000
1,550,000
600 000
700.000
200,000
850.000
600,000
1,000.000
700.000
550.000
1,000 uoo 800.000
EUR 350.000 0.80
350,000 0.80
- . . EUR 250.384 0 5 7
EUR 390.826 089
EUR 445.662 1.02
-.
1,086,872 2 48
BELGIUM
TELENET COM 9% 03- 15.12.13REGS
EUR 204.Y45 0.47
GREAT BRITAIN -. - ANGLIAN WATER 4 625% 03-13
DEPFA FOG IV 5.029"h(TV)07- PERP HSBC HLDS 5 375%02-20 12 12
IMP TOBACCO 4 375% 06- 22 11 13 OTE PLC 5% 03-5 8 13 EMTN
204.945 047 ~
CANADA EUR 1.009045 2.31
EUR 422,679 0.96
EUR 628.443 143
EUR 246,171 0.56
EUR 1,253,321 2.87
BOMBARDIER TV06-15.11.13 REGS
EUR 413,000 0.94
~
413 000 0.94 ~~
CAYMAN ISLANDS -~
BCP FINANCE TV 05-PERP
DUBAI HOLDING 4.75%07- 30.01.14 MIZUHQ FIN.4.75% 04- 15.4.14REG
EUR 470 043 107
EUR 497.782 1.14
EUR 1,509,517 345
~~
2.477342 5 6 6 -.
3,559,659 8.13
IRELAND
FIDE RETAIL FIN TVO6-11.05.09
LEASEPLAN FIN.4.5"/o 06- 08.11 16
EUR 910,398 2.08
EUR 596,306 1.36
~.
1,506,704 3.44
FEDERATION OF RUSSIA ~-
GAZPROM CAP.5 03% 06-14
REGS EUR 495.996 1 1 3
-
495,996 113 ~.
ITALY
BCO POP VERONA TV 07- 06.02.17 ClRlNT 5.75% 04-16.12.2024
EDISON 5.125% 03-10.12.10
EUR 1,048.983 2 39
EUR 234794 054
EUR 1.025.290 234
EUR 461 814 110
2 790,881 6.37
~
FINLAND -. .
SAMPO OYJ 4.625%(TV)04-14 REG
EUR 1556.998 355
-
1.556.998 3 55 .~ -
EMTN HERA SPA 4,125Y~ 06-16.02.16
FRANCE - - JAPAN BFCM 4 471%(TV) 05-PERP.
BQPOSTALE TV 06-12.12.16 EMTN CASINO GUICHARD P.4.875"/0 07-14 CIE ST.GOBAIN TV 07-11 4.12
CIE ST.GOBAIN 4.75% 07-17
EUR 577,644 1.32
EUR 700.600 1 GO
EUR 198.680 0.45
EUH 648.871 1 Y4
EUR 596.008 1.36
EUR 1.048931 2.39
EUR 681 920 1.56
EUR 549.005 125
EUR l.U00,042 2.28
EUR 775.121 177
BK TOKYO MITSUB.3.5% U5-15 EUR 678,496 1.55 ~
678,496 1.55 -- ~
JERSEY
AIG.SUN.III 4 75%" 03-1 1.09.13 EUR 816.184 1.86 EMTN CNCEP 5.6% 99-51 1.201 1 816.184 1 8 6
- CNP ASS 4 75%(TV)06-PERP
CREDIT LOGEM 4 604%(TV)06- PERP CRH 4 25% 03-25 10 14
DEXIA MUN AG 3 875x06 24 11 16
LUXEMBOURG
BANQUE DU LUXEMBOURG TV 02-PERP. FIAT FIN.6 625% 06-15.02 13
MERCK FIN.3.75% 05-07.12.12
EUR 1.140080 2.60
EUR 538.225 1.23
EUR 767,520 1 7 5
HSBC Global Investment Funds
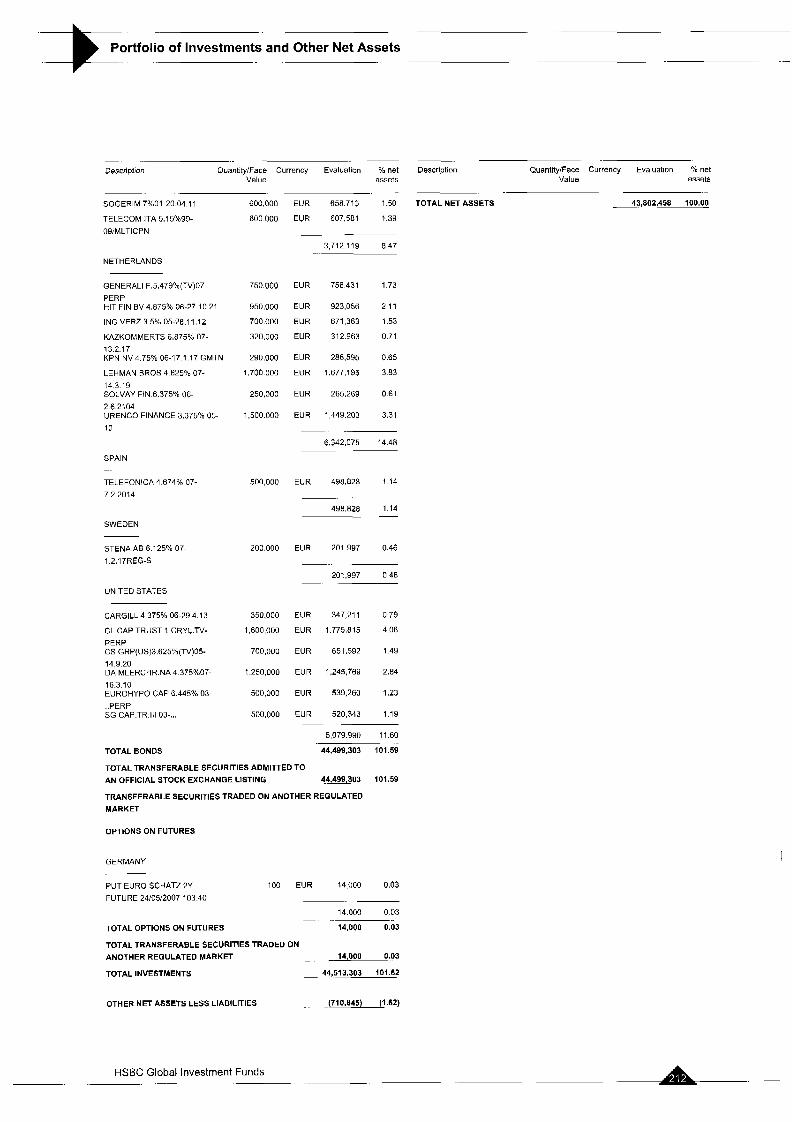
Portfolio of Investments and Other Net Assets - -
-. --- -. ~ - Description QuantitviFace Currencv Evaluation % net Descrietion QuantitvlFace Currencv Evaluation % net
SOGERIM 7%01-20 04 11
TELECOM ITA5.15%99- 09,MLTICPN
NETHERLANDS
GENERAL1 F,5,4794o(TV)07- PERP HIT FIN BV 4.875% 06-27.10 21
ING VERZ.3.5% 05-28.11.12
KAZKOMMERTS 6.875% 07- 13.2.17 KPN NV4.75% 06-17 1.17 GMTN
LEHMAN BROS 4 625% 07- 14.3.19 SOLVAY FIN.6.375% 06- 2 6.2104 URENCO FINANCE 3,375% 05-
10
SPAIN
TELEFONICA 4.674% 07- 7 2 2014
SWEDEN
STENA AB 6.125% 07-
1.2.17REG-S
UNITED STATES
CARGILL 4 375% 06-29.4.13
CL.CAP.TRUST 1 CRYL.TV- PERP CS GRP(US)3,625%(TV)05- 14 9 20 DAIMLERCHR.NA 4 375%07- 16.3.10 EUROHYPO CAP 6 445% 03- ..PERP SG CAP.TR.111 03- ...
TOTAL BONDS
Value assets Value assets . - .... ~. . --
600.000
600 000
750.000
950,000
700 000
320.000
290,000
I ,700 ooo
250.000
1,500 000
500,000
200 000
350.000
1,600,000
700,000
1,250 000
500.000
500,000
EUR 658.713 1.50 TOTAL NET ASSETS
EUR 607.581 1.39
~.
3,712.119 8.47
-. 43,802,458 100.00
EUR 756.431 1.73
EUR 923.056 2 11
EUR 671 363 1.53
EUR 312.963 0.71
EUR 286,595 0.65
EUR 1,677,195 3.83
EUR 265,269 061
EUR 1 449.203 3.31
~. -
6,342,075 14.48 ~
EUR 498,828 I 14
.~ 498,828 1.14
. -
EUR 201 997 046
~ ..
201,997 0.46 -
EUR 347,211 0.79
EUR 1775,815 406
EUR 651,592 149
EUR 1,245,769 2.84
EUR 539,260 1.23
EUR 520,343 119
5,079.990 11 EO
44,499,303 101.59
~.
TOTAL TRANSFERABLE SECURITIES ADMITTED TO AN OFFICIAL STOCK EXCHANGE LISTING 44,499,303 101,59
TRANSFERABLE SECURITIES TRADED ON ANOTHER REGULATED MARKET
OPTIONS ON FUTURES
GERMANY
PUT EURO SCHATZ 2Y 100 EUR 14000 003
FUTURE 24/05/2007 103 40 ~~
14000 003
TOTAL OPTIONS ON FUTURES 14,000 0.03
TOTAL TRANSFERABLE SECURITIES TRADED ON
-
14,000 0.03
44,513,303 101.62 TOTAL INVESTMENTS -
ANOTHER REGULATED MARKET - -
(710.845) (1.62) OTHER NET ASSETS LESS LIABILITIES . -
A- HSBC Global Investment Funds -

Portfolio of Investments and Other Net Assets a- - ~
EURO INVESTMENT GRADE BOND Statement of investments as at 31 March 2007 (expressed in EUR)
.. .~
Doscription QuantitylFace Currency Evaluation % net Value assets
-
FRANCE 5.75% 01-25.10.32 BTAN IMERYS 5% 07-ia.04.17
LA BQUE POSTALE 4% 06- 8.11.13 RTE EDF TR. 4.125% 06-27.9.16
SCOR ASSIST.B.I54"/(TV)06- PERP. TOTAL CAPITAL 3.875% 06- 6.9.1 1 VAUBAN MOBIL 4 5%01-
VEOLlA4 375% 06-16.1.17 28 10 oa
5,390,000
150,000
650 000
1 000.000
300.000
2,000 000
4,400,000
400,000
EUR 6602,749
EUR 150.090
EUR 641,305
EUR 982.845
EUR 303567
EUR 1.968.985
EUR 4,417.099
EUR 385,854
4 11
0 09
0.40
0 61
0 19
123
2 75
0 24
.-
Yo not 3ssets
Description QuantitylFace Curroncy Evalualion Value
.. .
INVESTMENTS
TRANSFERABLE SECURITIES ADMITTED TO AN OFFICIAL STOCK EXCHANGE LISTING
BONDS 32.790.164 20 40
GERMANY
AUSTRIA BERTELSMANN 3 625% 05- 06.10 15 GERMANY 4% 06-4 07.16
GERMANY 4.5% 03-4.1.13
G E R M A N Y ~ . ~ ~ Y ~ 98-28
HSH NORDEK4,375"/o(TV)07- 14.2.08
500.000 EUR 462.420 0 2 9
6.800000 EUR 6.779600 422
10.900,OOO EUR 11 161,600 6.94
4 135,000 EUR 4,425691 2 7 6
1.000,OOO EUR 990,360 0.62
~. ~
23.819 671 14 a3
EK AUSTRIA 5 75% 01-22 2 13 EMTN BUNDESIMMOB 4 375% 03- 24 9 13 ERSTE BK TV 07-19 7 17 TR 2
REP.AUSTRIA 3 5% 05-15 9 21
5,000,000
5,000,000
500,000
7 000.000
1.000.000
100.000
900,000
900,000
700,000
1,600,000
1.000,000
500.000
150.000
2 600,000
600 000
450,000
500 000
400,000
600,000
3.400 000
900.000
1 000,000
3.000 000
EUR 5360.968
EUR 5.030500
EUR 500.000
EUR 6,467,300
3.34
3 13
0 31
4 03
10 81 17.358.768 GREAT BRITAIN
CANADA
ANGLIAN WATER 4 625% 03-13
BP CAPITAL 3.759t 06-14.1.09
CARNIVAL PLC 4.25% 06-13 GTD DEPFA FDG IV 5.029%(lV)07- PERP HBOS TRS SERV.3.5"/o 04- 12.2.09 HSBC BANK 3.875% 06-9.11.1 1
IMP.TOBACC0 4 375% 06- 22.1 1 . I 3 OTE PLC 5% 03.5 a 13 EMTN
ROYAL BK CDA 3.875%06- 31.10.11
600000 EUR 605.427 038
4,000.000 EVA 3,967,951 2 47
7ooooo EUR mn.876 043
360,000 EUR 353,871 0 2 2
4,400,000 EUR 4 351.141 2.70
2,000.000 EUR 1,973,710 1 2 3
noo.ooo EUR 787.746 0.49
610000 EUR 621.566 0 3 9
13 350,290 8.31
-
__
EUR 985,447 0.61
-- .
985,447 0 6 1 ~ .~
CAYMAN ISLANDS ~~
DUBAl HOLDING 4.757007- 30.01.14 MIZUHO FIN.4.75% 04- 15 4.14REG
EUR Y9556 0 0 6
EUR 905,711 0 5 7
-
1,005267 0 6 3 ~ .-
FINLAND
SAMPO OYJ 4.625°/~(TV)04-14 REG
EUR 904063 0.56
~.
904,063 056 ~
GREECE -
GREECE 4 3% 07-20.7.2017 6,950,000 EUR 6 947.220 4 33
6.947 220 4.33 .~
FRANCE
BFCM 4.471%(TV) 05-PERP.
BNP PARIB 3.75% 06-13.12.1 1
BQPOSTALE TV 06-1 2.12.16 EMTN CARREFOUR 4.375% 06-2.1 1.16
CASINO GUICHARD P.4.875"/. 07-14 CIE FIN.FONC.4.25% 04-29 1.14
CIE STGOBAlNTV07-11.4.12
CIE ST GOBAIN 4 75% 07-17 EMTN CNCEP 5.6% 99-5.11.201 1
CNP ASS.4.75~J"(TV)O6-PERP
CREDIT LOGEM.4.604%(TV)06- PERP CSSE REFI.HABIT.4% 02-
EUR 673.918
EUR 1.571 964
EUR 1.000.857
EUR 487,693
EUR 149010
EUR 2,606,154
EUR 599203
EUR 447,006
EUR 524466
EUR 369.669
EUR 59ag i4
EUR 3385.980
EUR 872,011
EUR 995.425
EUR 3.035400
0.42
0.98
0.62
0 30
0.09
1.62
0.37
0 2a
0.33
0.24
0.37
2 11
0.54
0 62
1.89
IRELAND -
DEPFA ACS BK 3.875%06 14 11 16 GERM POST PE 3 75%06- i a 1 io!i
1,000.000 EUR 969851 0 6 0
4.500000 EUR 4454.150 2 7 8
- - 5 .4~4001 338
ITALY -
BCO POP VERONA TV 07- 08.02.17 ClRlNT 5.75% 04-16 12.2024
EDISON 5 125"/0 03-10 12.10 EMTN HERA SPA4.125% 06-16 02.16
ITALY 4% 05-1.2 37 BTP
TERNA SPA 4 9?/, 04-2a.io.z4
400.000 EUR 399,613 0.25
3[10,000 EUR 281,753 0.18
1.100.000 EUR 1,127,819 0.70
400,000 EUR 385.451 0.24
4.000,OOO EUR 3,652 000 2.27
650000 EUR 666,604 0.42
0,513 240 4.06 - .
25.10.09 DEXIA MUN.AG 3 875%06 24.11 16 FRANCE TELEC.4.375%07- 21.02.12 FRANCE 5.25% 98-25.4.08 OAT
HSBC Global Investment Funds

Portfolio of Investments and Other Net Assets -
.. .
Description QuantityIFace Currency Evaluation % net Value assets
JAPAN .-
BK TOKYO MITSUB.3.5% 05-15
JERSEY
AIG.SUN.III 4.75% 03-11.09.13
UBS JSY 4.125%(TV) 06-25.9.18
LUXEMBOURG - ~
BANQUE DU LUXEMBOURG TV 02-PERP MERCK FIN.3 75% 05-07.12.12
NETHERLANDS
ALLIANZ FIN BV4% 06-23.11 16
GENERAL1 F.5.479%(TV)07- PERP HIT FIN BV 4.875% 06-27 10.21
ING BK NV 3.5% 05-16.09.20
ING VERZ.3.5Yo 05-28 11.12
KPN NV 4.75% 06-17.1 17 GMTN
LEHMAN EROS 4.625% 07- 14.3.19 NEDERLD GASUNIE 4 25"/06- 20.6.16 NETHERLANDS 39t 04-15.01.10
NETHERLANDS 5% 01-15.07.1 1
RABOBK NEDL 4 25% 07- 16.1.17 REPSOL INT FI 4.75%07- 16 02.17 URENCO FINANCE 3.375"/0 05- 10
NORWAY .-
STATKRAFT 4 625% 07-22.09.17
SPAIN
CAJA BARCELONA 3.75%06- 13.9.11 TELEFONICA 4.674% 07- 7.2 2014
UNITED STATES
BANK AMERICA CORP 4% 05- 15 ClTlGROUP INC 3.95% 06-13 EMTN ClTlGROUP 5% 04-2.8.2019
CS GRP FIN(US)3.125% 05-12
DAIMLERCHR.NA 4.375%07- 16.3.10 EUROHYPO CAP 6.445% 03- ..PERP HSBC FIN.3.75X 05-4.11.15
NY LIFE GLB 4.375% 07- 2017EMTN
800,000
1.325,oon
700,000
600.000
680 ooo
1 000,000
400.000
650 000
340.000
1 000,000
210000
700.000
900 000
11.600.000
12 000,000
900,000
500.000
1,100,000
400,000
4.000 no0
500.000
1 100.000
1,400,000
800,000
700,000
1.000,000
800,noo
400.000
800,000
EUR 775.424 048
775424 048
-. ~
-
EUR 1,351,805 0.84
EUR 687,547 0 4 3
2 039.352 1.27
EUR 684.048 042
EUR 652392 0.41
1,336,440 0.83
EUR 964,140 0.60
EUR 403.430 025
EUR 631 565 0.39
EUR 315,904 0.20
EUR 959.090 0.60
EUR 207,535 0.13
EUR 690,610 043
EUR 896.235 0.56
EUR 11,294.920 7.03
EUR 12454.799 7.75
EUR 894,060 0.56
EUR 491.260 0 31
EUR 1,062,749 0.66
-~ 31 266.297 19 47
.
EUR 396.707 0.25
396.707 0.25
-. ~
EUR 3330,009 2.45
EUR 498.828 031
-. ..
4.428.837 2.76 . -
EUR 1,067919 0 6 6
EUR 1362.514 086
EUR 830.304 0 5 2
EUR 658.466 041
EUR 996615 062
EUR 862.816 0.54
EUR 375,440 0 2 3
EUR 794.436 049
-~
Descriptian QuantitylFace Currency Evaluation Sh net Value assets
.~
WELLS FARGO 4 375% 06-16 1000,000 EUR 966,730 060
REG - -
7,915240 493
TOTAL BONDS 157,256,428 97.91
TOTAL TRANSFERABLE SECURITIES ADMITTED TO AN OFFICIAL STOCK EXCHANGE LISTING __ 157,258,428 97 91
TRANSFERABLE SECURITIES TRADED ON ANOTHER REGULATED MARKET
-
OPTIONS ON FUTURES
GERMANY
PUT EURIBOR 360 13 MONATE 425 EUR 10625 001 17/09/2007 95 625 PUT EURIBOR 360 13 MONATE (850) EUR (95,625) (006)
PUT EURIBOR 360 f3 MONATE 425 EUR 106250 006 17/09/2007 95 875 -
i7/0~/2007 95 75
21.250 001
21,250 0 0 1 -
TOTAL OPTIONS ON FUTURES
TOTAL TRANSFERABLE SECURITIES TRADED ON ANOTHER REGULATE0 MARKET 21,250 0.01
TOTAL INVESTMENTS 157,277,670 97 92 ~
OTHER NET ASSETS LESS LIABILITIES 3,342,204 2.08
TOTALNETASSETS 160,619,882 ~ ~ ~ 1 0 0 . ~
-& HSBC Global Investment Funds

_. -_ Portfolio of Investments and Other Net Assets
-. ._
EURO HIGH YIELD BOND Statement of investments as at 31 March 2007 (expressed in EUR)
.-
Description Face Value Currency Evaluation oh net assets
-. .-
RHODIATV 06-15.10 13 REGS 3,100,000 EUR 3 170,196 3.77
VlNCl 6 25% OB-PERF 1 800,000 EUR 1,784,790 2.12
13 586.146 16.16
-
GERMANY -
ATU AUTO-TEILE TV 04-1.10.14 750,000 EUR 777,375 0.92
BAYERAG 5%(TV) 05-29 7.2015 1,750 000 EUR 1,658.729 1.97
DEGUSSA5 125%03-10 12 13 2,250,000 EUR 2.253.453 2.69
HENKEL 5.37505-2104 STEP- 1700,000 EUR 1,661,011 1.98 UP
Doscription Face Value Currency Evaluation riel assets
INVESTMENTS
TRANSFERABLE SECURITIES ADMITTED TO AN OFFICIAL STOCK EXCHANGE LISTING
BONDS
HORNBACH BAU 6 125% 04-14 REGS PER1 TV 04-15 12 09
PER1 5.625% 04-15 12 11 REGS
SGL CARBON 8 5Yu 04-1 2 12 EMTN
400,000
200 000
1,300.000
1,800.000
1,185,000
1 454,000
1,625 000
1 .ooo.ooo
325.000
300,000
1,200.000
650 000
600.000
1,000 000
3.020.000
600.000
500,000
900.000
1,750,000
1 000,000
EUR 415,451 0 4 9
EUR 204,753 0 2 4
EUR 1.326013 158
EUR 1,926,599 2.29
- -~ 10 223 384 12 16
BELGIUM
TELENET COM.Y% 03- 15.12.13REGS
2 875.950
1,650 000
i,200.000
1 360,000
100.000
1 400,000
450 000
800,000
780 000
1 100,000
210,000
1,658.000
400.000
1 550.000
1.700 000
600,000
I 850,000
300 000
EUR 3.156.154 3 75
~ -- 3156.154 3 7 5
. .-
GREAT BRITAIN
CORUS75%04-1.10.11 SENIOR ECO-BAT 10 125% 03-31.1.13 REGS INVENSYS 9 875% 04-15.3.11
LOUIS NO1 8 5% 06-1 12 14 REGS
BERMUDA SLANDS - .-
CEN.EUR0 MEDIA 8 25%05 12REG.S
EUR 1274,056 1 5 1
EUR 1,590676 189
EUR 1,777.264 2 12
EUR 1035,394 1 2 3
-
5,677.390 6 75
EUR 1,801,164 2.14
-
1,801.164 2 14
CANADA
BOMBARDIER TV 06-15.1 1 . I 3 REGS BOMBARDIER 7 25% 06- 15.1 1 . I6
EUR 1239,000 147
EUR 1.411 680 1.68
2,650680 3 1 5
GUERNSEY -
ABB INT.FIN.6.5% 03-11 EMTN- TERM NOTES 2
EUR 353277 042
353,277 0.42 - CROATIA
IRELAND AGROKOR 7% 06-23.1 1.1 1
DENMARK
EUR 102.880 0 1 2
102880 0 1 2 . -
MOP AQUISIT.10 125% 03-12 REG.
EUR 323,550 0.38
323,550 0.38
ITALY DANSK NATURGAS AIS 5 5%05-PERP FS FUNDG 8 875% 06-15.5.16
REG ISS GLOBAL A/$ 4.5% 04-14 EMTN NORDIC TE,.8 25%06-1 5 16 REGS TDC AS 6.5% 02-19 4 12
EUR 1.413021 1.69
EUR 472817 0.56
EUR 707420 0 8 4
ClRlNT 5 75% 04-16.12.2024 EUR 1,127010 1.34
1.127.010 1.34
LIBERIA EUR 852937 101
EUR 1.150589 137 ROYAL CARIBB.5.625% 07-14 REGS
EUR 650.416 0.77
650416 0.77
FEDERATION OF RUSSIA ~. .~
GAZPROM CAP.5.03% 06-14 REGS
LUXEMBOURG
EUR 208,318 0.25 CABLECOM 8 % 06-1.11.16
CODERE FIN.8.25% 05-15.06.15
FIAT FlN,6,625% 06-15 02.13
GAZ CAPITAL 7.8% 03-27.9.10
HELLAS TELECOM TV 05-
EUR 619 125 0.74
EUR 1064,430 127
EUR 3.250.878 3 8 7
EUR 659,828 0.78
EUR 512,149 0.61
EUR 976,249 1.16
EUR 1,895.059 225
EUR 1.143822 136
- 208318 0 2 5
FRANCE ~
ALCATEL 6.375% 04-7.4 14 EUR 1,754 297 2 0 9
EUR 413000 0 4 9
EUR 1.586732 189
EUR 1,921 000 2 2 8
EUR 589.200 0 7 0
EUR 2,022975 2 4 1
EUR 343956 0 4 1
15.10 12 LIGHTHOUSE INTL 8% 04-14 EMTN
CROWN EUR.6 25% 05-01.09.1 1 REGS NELL AF 8 375% 05-15 REGS
WIND ACOUISIT 9 75% 05- 1 12.15
EUROPCARTV06-15 5 13 REGS FG4 8 375% 05-30 4 15 REG S
GECINA 4 875% 04-25.1 12
KAUFMAN ET BR 8 75% UZ-09 10,121,540 12.04
~ .
REGS RAY ACQ SCA 9.375% 05-15 REG.S
HSBC Global Investment Funds - .~

.~ -
Portfolio of Investments and Other Net Assets -.
- - Description Face Value Currency Evaluatian % net
assets -
TRANSFERABLE SECURITIES TRADED ON ANOTHER REGULATED MARKET
% net assets
~
0.44
0.32
3 65
0.72
0 61
0.52
1.16
1 1 6
2.00
0.61
0 66
0.34
1.76
0.47
3.37
-.
Description Face Value Currency Evaluation
NETHERLANDS ~-
CARLS WAGONLIT TV 06- 350000 EUR 371,292
250.000 EUR 272.556
3 075.000 EUR 3,074,000
600000 EUR 605,145
487,500 EUR 510,457
400000 EUR 435,000
950000 EUR 976,268
I ooo.ooo EUR 97a.009
1,550 000 EUR 1 682.076
500,000 EUR 509,954
650,000 EUR 556,254
280000 EUR 282.409
1450.000 EUR 1,480,015
386.311 EUR 395,244
2,550,000 EUR z.a30,499
BONDS 1.5.15REG COGNIS 9.5% 04-15.5 14 EMTN
FRESENIUS FIN 5%06-31.1 13 REG GENERAL1 F.5.479%(TV)07- PERP HEIDELB.FIN.7.375% 03-10
UNITED STATES ~~
HUNTSMAN LLC 04- 300.000 EUR 316875 0.38 15REGSIMULTICP
3 1 6 . ~ 5 0 3 8 .. -.
TOTAL BONDS 316,875 0.38
TOTAL TRANSFERABLE SECURITIES TRADED ON
REGS IFCO SYSTEMS 10 375% 03-10
REG IMPRESS MET.TV 06-15.9.13 REGS KAZKOMMERTS 6.875% 07-
ANOTHER REGULATED MARKET
OTHER TRANSFERABLE SECURITES
BONDS
GERMANY
316,875 0.38
13.2.17 LINDE FIN.7.375%(TV)06- 14.7 66 NXP B V T V 06-15.10 13 REG.S
PORTUGAL TELE.INTL 4.5% 05- 25 SIEMENS F.5.25%(TV)06- 14.9.66 UPC HLD 7.75% 05-15.1.14 REG
VICTORIA ACQ.11 TV 06- 15 05.15 VICTORIA ACQ.7.875% 04-14 REG
FLENDER HLOG 11% 03-1.8.10 REGS
675.000
1,050,000
1.300.000
1 400.000
1,600,000
EUR 745,875 0.89
- 745,875 0.89
.-
NETHERLANDS
CARMEUSE LIME 10.75% 02-12 REGS
EUR 1131 375 1.34
-.
1.131.375 134
1,877,250 2.23
14,959,178 17 79 ~. .~
NORWAY
TOTAL BONDS
TREASURY BILLS AKER KVAERN.8.375% 04- 156.11
1.600.000 EUR 1.744.480 2 07
1,744,480 2.07 ~ .~
BELGIUM SOUTH AFRICA -~
CONSOL GLASS 7 625% 07- 15.4.14 SAVCIO HLDS LTD 8% 06-13 REG.S
BELGIUM 0% 06-12.4.07 CT
FRANCE
EUR 1,298,645 1.54
1 298,645 1.54
- 200000 EUR 202,725 024
200,000 EUR 211,500 0.25
-. .~
414,225 0.49 FRANCE 0% 07-14.06.07 BTF
PORTUGAL
EUR 1,386,940 1.65
i.3aa.940 I
SWEDEY
STENA AB 6.125% 07-
1.2.17REG-S STENA 5.875% 07-1 2.19 REG.S
980000 EUR 989.784 1.18
500,000 EUR 486,274 0.58
1.476.058 1.76
. .
~
PORTUGAL 0% 06-18 5.07 TB
TOTAL TREASURY BILLS
EUR 1.592.392 1 90
1592,392 I 9 0
4,279,977 5.09
6,157,227 7 32
82,893,962 98.57
- -
~-
-~
UNITED STATES - .~
AGCO 6.875% 04-15.4.14
BCP CRYST.US 10.375% 04- 14EMTN CENTRAL EUR.DIST.EO/u 05-12
CHESAPEAKE 6.25% 06-
15.1.20”7 EB HOLDING 10% 05-15.2.15 REGS XEROX 9.75% 03-15.01.09
TOTAL OTHER TRANSFERABLE SECURITIES
TOTALINVESTMENTS
300,000 EUR 314.125 0.37
312000 EUR 365820 0.43
880.000 EUR 960,712 1.15
600,000 EUR 622,125 0.74
218.400 EUR 224,254 0.27
700000 EUR 760 190 0.90
3,247,226 3 86
76,419,860 90.87
-. - -
~~
OTHER NET ASSETS LESS LIABILITIES 1,202,937 ..1.43
TOTALNETASSETS 84,096,899 100.00
TOTAL BONDS
TOTAL TRANSFERABLE SECURITIES ADMITTED TO AN OFFICIAL STOCK EXCHANGE LISTING 76,419,860 9 O z
HSBC Global Investment Funds . -
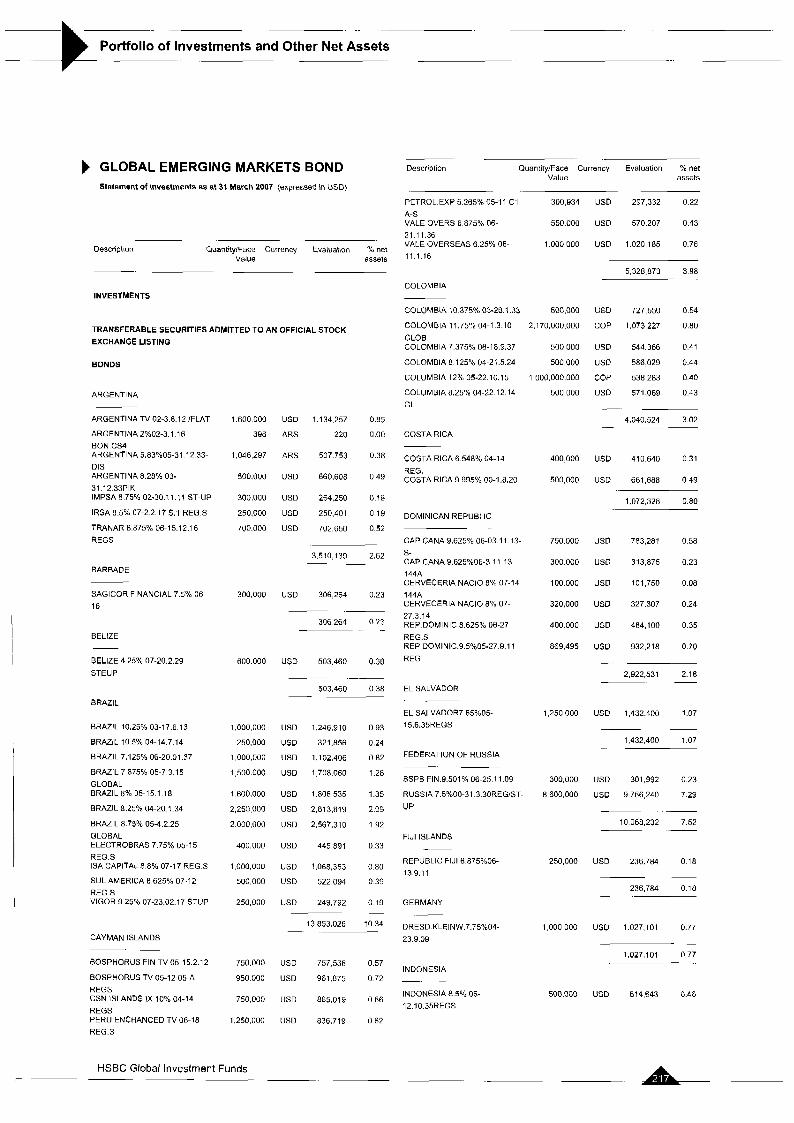
Portfolio of Investments and Other Net Assets t GLOBAL EMERGING MARKETS BOND Statement of investments as at 31 March 2007 (expressed in USD)
Description Quantity:Face Currency Evaluation % net Value assets
PETROL.EXP 5 265% 05-1 1 C1 300.934 USD 297.332 0.22 A-S VALE OVERS 6 875% 06- 550.000 USD 570.207 0.43 21.11 36 VALE OVERSEAS 6.25% 06- 1,000 000 US0 1.020.185 0.76 11.1.16
- -~
5,328,873 3.98
COLOMBIA
- .
Oescnption QuantitylFace Currency Evaluation Y. net Value assets
~.
INVESTMENTS
COLOMBIA 10 375% 03-28.1 33 500,000 USD 727.550 0.54
COLOMBIA 11.75% 04-1.3.10 2,170,000.000 COP 1,073,227 0.80
GLOB COLOMBIA 7.375% 06-18.9.37 500000 USD 544.366 0.41
COLOMBIA 8 12.5% 04-21.5.24 500,000 US0 586,029 0.44
COLUMBIA 12% 05-22 10.15 1 000.000.000 COP 538.283 0.40
TRANSFERABLE SECURITIES ADMITTED TO AN OFFICIAL STOCK EXCHANGE LISTING
BONDS
COLUMBIA 8.25% 04-22.12.14 GL
500,000 USD 571,069 0.43
-.
4,040,524 3.02 -
ARGENTINA
ARGENTINA TV 02-3 8 12 /FLAT
ARGENTINA 2x02-3 1 16 EON CS4 ARGENTIN4 5.83%05-31 12 33- 01s ARGENTIN4 8 28% 03- 31 12 33PIK IMPSA 8 75% 02-30 11 11 ST-UP
IRSA 8 5% 07-2 2 17 S 1 REG S
TRANAR 8 875% 06-15.12 16 REGS
1.600 000
398
1,046 297
500.000
300,000
250.000
700.000
300,000
600 000
1,000 000
250.000
1 000,000
1,500 000
1 600.000
2,250 000
2 000,000
400,000
1 000,000
500,000
250,000
750.000
950 000
750.000
1,250 000
USD 1.134.257 OK5
ARS 220 0.00
ARS 507753 0.38
US0 660,608 049
US0 254,250 0 1 9
US0 250.401 0 19
US0 702,650 052
3,510,139 2.62 - -
COSTA RIGA
COSTA RlCA 6 548% 04-14 REG. COSTA RlCA 9.995% 00-1.8.20
400,000 USD 410640 031
500,000 US0 661,688 0.49
1.072.328 0.80
DOMINICAN REPUBLIC . ..
CAP CANA 9.625F 06-03 11.13- S- CAP CANA 9.625%06-3.11 13 144A CERVECERIA NACIO 8% 07-14 144A CERVECERIA NACIO 8% 07- 27.3.14 REP.DOMINIC.8.625°/~ 06-27 REG.S REP.DOMINIC.9 5%05-27.9.11 REG
750.000 USD 783,281 058
300000 USD 313.675 023
I00000 USD 101,750 0 0 8
320,000 US0 327.307 024
400000 USD 464,100 0 3 5
869.4'35 USD 932,218 070
_.
2 922,531 2.18 ~
BARBADE
SAGICOR FINANCIAL 7.5% 06- 16
US0 306,264 0.23
-. .-
306,264 0.23 .. .-
BELIZE
BELIZE 4.25% 07-20.2.29 STEUP
USD 503.460 0.38
~ --
503,460 0.38 -.
EL SALVADOR
EL SALVADOR7.65%05- 15.6.35REGS
BRAZIL 1,250,000 USD 1 432.400 1 07
.-
1,432,400 1 07 - .
BRAZIL 10.25% 03-17 6 13
BRAZIL 10 5 % 04-14 7 14
BRAZIL 7 125% 06-20 01 37
BRAZIL 7 875% 05-7 3 15 GLOBAL BRAZIL 8% 35-15 1 18
BRAZIL 8 25% 04-20 1 34
BRAZIL 8 75% 05-4 2 25 GLOBAL ELECTROBRAS 7 75% 05-15 REG S ISA CAPITAL 8 8% 07-17 REGS
SUL AMERICA 8 625% 07-12 REG S VIGOR 9 25% 07-23 02 17 STUP
USD 1,246,910 0.93
USD 321,856 0.24
USD 1,102,406 0.82
US0 1708.060 1.28
US0 1.806.535 1.35
US0 2 813.819 2.09
US0 2,567,310 1 9 2
USD 445,891 0.33
US0 1,068,353 0.80
USD 522,094 0.39
USD 249,792 0.19
13,853.026 10 34
-
-
FEDERATION OF RUSSIA -. - BSPB FIN 9.501% 06-25.11.09
RUSSIA 7.5"/000-31.3.30REG/ST-
UP
300000 USD 301.992 0.23
8600,000 US0 9 766,240 729
~- 10 068,232 7.52 -
FIJI ISLANDS -
REPUBLIC FIJI 6.875%06- 13.9.11
250,000 USD 236.784 0 18
~
236,764 0 18 - _ GERMANY
ORESD.KLEINW.7.75°/,04~ 23.9.09
1,000 000 USD 1.027.101 0.77
-
1.027,lOl 0.77
CAYMAN ISLANDS - .- BOSPHORUS FIN TV 05-15.2.12 US0 757.536 057
US0 961 875 072
US0 885.019 066
USD 836,719 062
INDONESIA -. -
INDONESIA 8.5% 05- 12 10.35REGS
EOSPHORUS TV 05-12 05-A REGS CSN ISLANDS IX 10% 04-14 REGS PERU ENCHANCED TV 06-18 REG.S
500.000 USD 614,643 0.46
HSBC Global Investment Funds
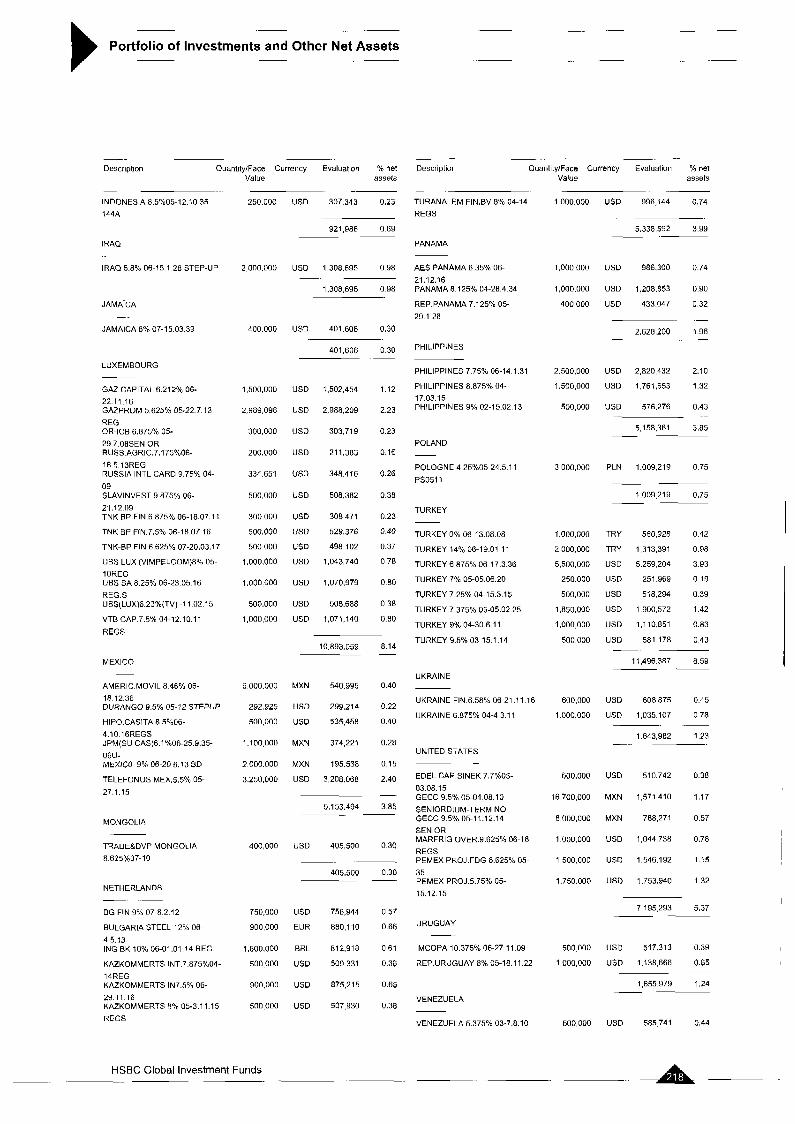
Portfolio of Investments and Other Net Assets ._
- . . . . -- Description Quantity/Face Currency Evaluation % net
. - .. - Description OuantitylFace Currency Evaluation % net
Value assets .~
Value assets
250.000 USD 307343 0.23
-~ - .
TURANALEM FIN.BV 8% 04-14 REGS
-.
INDONESIA a.5~~05-12.10.35 144A
1 000.000
1,000 000
1,000.000
400 000
2,500,000
I .500,oao
500,000
3 000,000
1.000.000
2 000.000
5,500,000
250.000
500,000
1,850,000
1,000,000
500,000
600,000
1 .ooo.ooo
500,000
16.700,OOO
8,000,000
1.000 000
1 500.000
1.750.000
500 000
1 000,000
600,000
US0 996,i44 0.74
921,986 0.69 ~- ~
5,338,592 3.99 -. ~
IRAQ PANAMA
AES PANAMA 6.35% 06- 21.12.16 PANAMA 8.125% 04-28.4.34
REP.PANAMA 7.125% 05-
29 1 26
IRAQ 5.8% 06-15 1 2a STEP-UP
JAMA.iCA
USD 986.300 0.74
USD 1,208,853 0 90
USD 433.047 032
. -
2,628,200 1 96 -
2 0o0.000 USD 1,308,695 0.98
I ,308,695 0.98
~.
JAMAICA a% 07-15.03.39
LUXEMBOURG
4ooooo USD 401.608 0.30
401,608 0 30 PHILIPPINES
PHILIPPINES 7 75% 06-14.1.31
PHILIPPINES 8.875% 04- 17.03.15 PHILIPPINES 9% 02-15.02.13
~
USD
USD
USD
US0
USD
US0
USD
US0
USD
USD
US0
USD
US0
US0 2,820432 2.10
US0 1,761,653 1 32
USD 576.276 0.43
5,158,361 3.85
.-
__
GAZ CAPITAL 6.212% 06- 22.1 1.1 6 GAZPROM 5.625% 05-22.7.13 REG OR-ICB 6.875% 05- 29.7.OBSENIOR RUSS.AGRIC.7.175%06- 16 5 l3REG RUSSIA INTL CARD 9.75% 04- 09 SLAVINVEST 9.875% 06- 21.12.09 TNK BP FIN.6.875% 06-18.07 11
TNK EP FIN.7.5% 06-18.07 16
TNK-BP FIN 6.625% 07-20.03.17
UBS LUX (VIMPELCOM)8% 05- lOREG
REG.S UBS(LUX)6.23%(TV) -1 1.02.15
VTB CAP.7.5% 04-12.10.11
REGS
UBS SA 8.25% 06-23.05 16
1,500,000
2,989 oga
300,000
200.000
334 651
500,000
300 000
500,000
500 000
1,000.000
1.000 000
500.000
1,000,000
1,502,454
2,988,209
303 719
211.383
348 416
508.3a2
308 471
529.376
498 102
1,043,740
1,070.979
508.688
1,071,140
1.12
2.23
0.23
0.16
0.26
0.38
0.23
0.40
0.37
0 76
0.80
0 38
0.80
POLAND
POLOGNE 4 25"/005-24.5.11
PS0511
PLN 1.009.219 0.75
1.009 219 0.75 - .~ TURKEY ~
TURKEY 0% 06-13.08.08
TURKEY 14% 06-19.01 11
TURKEY 6.875% 06-17.3 36
TURKEY 7% 05-05.06.20
TURKEY 7.25% 04-15.3.15
TURKEY 7.375% 05-05.02.25
TURKEY 9% 04-30.6.11
TURKEY 9.5% 03-15.1.14
TRY 560,928 0 4 2
TRY 1,313,391 0 9 8
US0 5259,204 393
US0 251 969 0 19
USD 5ia294 039
USD 1900,572 142
USD 1,110851 0.83
USD 581 178 0 4 3
11,496 387 a 59
__
~ .~ MEXICO
UKRAINE
UKRAINE FIN.6.58% 06-21.11 16
UKRAINE 6.875% 04-4 3.11
AMERIC MOVIL a 46% 06- 18.12 36 DURANGO 9 5% 05-12 STEPUP
HIP0 CASITA 8 5%06- 4 10 16REGS JPM(SU CAS)6.1%06-25 9 35- 06U- MEXICO 9% 06-20 6.13 BD
TELEFONOS MEX.5.5% 05- 271 15
6000.000 MXN 540.995 040
292,925 USD 299,214 022
500,000 US0 535,458 040
1,100000 MXN 374,221 0.28
2000.000 MXN 195.538 015
3,250,000 US0 3,208.068 2.40
- 5,153.494 385 ~-
USD 608.875 0 4 5
US0 1035,107 078 ~. .~
i.643,9a2 1.23 _.
UNITED STATES ~-
EDEL CAP SINEK 7 7%05 03 08 15 GECC 9 5% 05-04 08 10
SENIORDIUM-TERM NO GECC95%05-11.12 14 SENIOR MARFRIG OVER 9 625% 06-16 REGS PEMEX PROJ FOG 6 625% 05-
35 PEMEX PROJ 5 75% 05- 15.12 15
USD 510,742 038
MXN 1,571410 1 1 7
MXN 768,271 057
USD 1,044 738 0.78
USD 1546.192 1 1 5
USD 1.753.940 1 32
-
7,195293 537 -~
MONGOLIA
TRADE&DVP MONGOLIA 8.625%07-10
400,000 US0 405,500 0.30
~. .~
405.500 0.30
NETHERLANDS _ _ ~ BG FIN 9% 07-8 2 12
BULGARIA STEEL 12% 06 4 5 1 3 ING EK 10% 06-01.01 14 REG
KAZKOMMERTS INT 7 875"/~04- 14REG KAZKOMMERTS IN7 5% 06- 29 11 16 KAZKOMMERTS 8% 05-3 11 15 REGS
750,000 US0 756,944 057
900000 EUR 880,110 066
1,800.ooo ERL 812,gia 0 6 1
SO0000 US0 509331 038
Y00,OOO US0 875,215 065
5noooo USD 507 930 0.38
URUGUAY
IMCOPA 10 375% 06-27.11.09
REP.URUGUAY 8% 05-18.1 1.22
US0 517313 0.39
USD 1,138,666 0 8 5
1,655 979 1.24
~
VENEZUELA
VENEZUELA 5.375% 03-7.8.10 USD 585741 0.44
HSBC Global Investment Funds

.~
Portfolio of Investments and Other Net Assets
- . - . - Description QuantitylFace Currency Evaluation % not
Value assets - - .
VENEZUELA 5.75% 05- 1,900.000 US0 1,785.572 1 33 26.2.16REGS VENEZUELA 7.65% 05-21.04.25 2,000,000 USD 2,112,029 1.58
VENEZUELA 8 5% 04-8 10.14 I oo0.000 USD 1,110,809 0.83
~. GLOB
5 595.051 4.18 ~.
YOUGOSLAVIA -. ~
REP SERBIA 3.75% 04-24 1,250 000 US0 1.180.936 0.88 STEP-UP -
1,180,936 0 88
TOTAL BONDS 106.288.004 79.39
TREASURY BILLS
~ -.
~. . .-
Des c r I P t i o n QuantityIFace Currency Evaluation % net Value assets
~. .. . ..
CAYMAN ISLANDS
PERU ENHANCD 0%06-31.5.18 144A
250,000
600 000
A95.000
500.000
4,831,000
100.000
400 000
17,484,000
600,000
248.925
300,000
1,424,348
US0 165.500 0.12
-
165.500 0.12
DOMINICAN REPUBLIC ~ .~
REP.DOMINIC. 9.04%05- lRREG/PIK
USD 759,321 0.57
~
759,321 0.57 - ._ - GREAT BRITAIN
JP MORGAN CHASE 0% 06- 19.03.13 JP MORGAN LN 12.5% 06- 19.3.1 3 JP MORG CHASE TV 06- 3.1.2012
US0 495,000 037
USD 500.000 037
BRL 2.195043 164
.-
3,190043 238
EGYPT
EGYPT 0% 06-1 5 07 TB S 364 6,000 000 EGP 1,046 701 0 78
1,046,701 0 78
TOTAL TREASURY EILLS 1,046,701 0 78
TOTAL TRANSFERABLE SECURITIES ADMITTED TO
AN OFFICIAL STOCK EXCHANGE LISTING 107,334,705 80.17
TRANSFERABLESECURITIESTRADEDONANOTHERREGULATED MARKET
~
- . MEXICO -. .
VITRO SA 9.125% 07-17 144A US0 102,250 0.08
102,250 0.08
~.
-- . NETHERLANDS
ING BANK NV 13% 07-26 02.09
ING BK NV 8.04% 06- 23 8.07REGS
USD 400.649 0.30
RUB 670.475 0.50 BONDS
INDONESIA -.
INDONESIA 6.875%06- 09.3.17REGS REP INDONESIA 6.625%07- 17.2.37
1,071.124 0.80 -. .
UNITED STATES --
CITIG.G.MKT 09.002-22.1 0.07 144A SALTA HYD ROY.11.55"/o 01-15 REG
1000.000 US0 1058,364 0 7 9
i,oon,ooo USD 986,940 0 7 4
-
2.045 304 1.53 -
US0 531.789 0.40
USD 217,183 0.16
-.
748972 056 MEXICO - .
VITRO SA 8 125% 07-17 REG.S VENEZUELA
FERTINITRO FlN.8.29%98-20
144A
150000 US0 153,706 0 11
153,706 0 11
-
~. ~
USD 264,000 0.20
NETHERLANDS
ING BK 7.5% 07-7 3 08
MAJAPAHIT HLD 7 75% 06-16
REGS
264000 020 .-
400.000 US0 408.130 0.30
1.500 000 USD 1 575.937 1.18
~~
1.984 067 148
4,183,077 3.12 -
VIETNAM
VIETNAM TV -2016 ST-UP US0 1,431 024 1.07
1,431.02A 107
8,A31.074 6.30 -. TOTALBONDS
TOTAL BONDS
WARRANTS / EQUITY LINKED SECURITIES TOTAL TRANSFERABLE SECURITIES TRADED ON
ANOTHERREGULATEDMARKET A.183.077 3 . g
OTHER TRANSFERABLE SECURITES
BONDS
COLOMBIA - -
TRANSTEL INTERMEDIA I S A 06-1 6 16 SHS REG S
000 0.00 0.00 USD
- 0.00 0.00
BAHAMAS
- TOTAL WARRANTS / EQUITY LINKED SECURITIES 0.00 0.00
TOTAL OTHER TRANSFERABLE SECURITIES 8.431.074 8.30 BANCO VOTORANTIM 9.25% 1.200.000 BRL 593840 044 05-12
~~
593.840 0 4 4 -.
BELIZE
GOV BELIZE 4 5%07-20 2 29 125000 USD 105,000 008 144A
105000 008 ~ .-
A HSBC Global Investment Funds

.-
Portfolio of Investments and Other Net Assets -t Description QuantitylFace Currency Evaluation 010 net GLOBAL INVESTMENT GRADE BOND
Value assets . .~
FINANCIAL INSTRUMENTS
Stalement of investments as at 31 March 2007 (expressed in USD)
COMMERCIAL PAPER
GREAT BRITAIN
STANDARD BK 0% 06-03 06 07 502,687 US0 502.767 038
CP .-
502.767 0 3 8 ~. ~
SWEDEN
SWEDISH EXP 0% 07-24 1 08 1 000,000 USD 1 000 000 0 74
CP
1,000,000 0 74
TOTAL COMMERCIAL PAPER 1,502.767 1 1 2
TOTAL FINANCIAL INSTRUMENTS 1,502,767 -1.12 TOTAL INVESTMENTS 121.451.623 90.71
OTHER NET ASSETS LESS LIABILITIES 12,445,298 9 29 ~
TOTAL NET ASSETS 133,896,921 100.00
. . - -~ Description QuantitylFace Currency Evaluaiion % net
Value assets
INVESTMENTS
TRANSFERABLE SECURITIES ADMITTED TO AN OFFICIAL STOCK EXCHANGE LISTING
BONDS
ARGENTINA -~
ARGENTINA 2%02-3.1.16 BON.CS4
BELGIUM . -
BELGIUM 5% 04-28.3.35 544 OLO
CAYMAN ISLANDS -. .~
BCO ABN AM.15.8607%05- 13.12.07 BCP FIN.5.543% 04- ...
FRANCE - AVENTIS SA 4.25% 03-15 9 10
CASINO 5 875% 02-23 11 07 EMTN FRANCE 5% 00-25.10 16 OAT
FRANCE 5 75% 01-25 10 32 BTAN FR.TELECOM 4 625% 04-12 EMTN PINAULT PRINTEMPS 5% 03- 23 1 09 REG
GERMANY - .-
BMW FIN.5% 03-6.8.18 EMTN
GERMANY 3.5% 06-14.10.11 $149 GERMANY 3.75% 06-4.1 17 S.6
GERMANY 4% 05-4 1.37
GERMANY 5.625% 98-4 1.28
KFW 2.05% 06-16.02 06 GLOBAL MUNICH RE FIN.6.75%03- 21 06.23 RWE FIN.6.125% 02-26.10.12 EMTN
GREAT BRITAIN
BBC 5.0636% 03-10.08.2033 REG. GREAT BRITAIN 4% 03-7.3.09 TSY STOCK
790.000 ARS 432,127 0.40
~~
432 127 0.40 -
510,000 EUR 756255 0.69
756.255 069 -
650,000 BRL 329,366 0 3 0
500,000 EUR 687352 0.63
1.016.718 0.93
.-
~
415000 EUR 552.804 051
550,000 EUR 740.508 0 6 8
720.000 EUR 1,028,577 095
1,695.000 EUR 2,761.387 2 54
385000 EUR 516,739 047
375,000 EUR 504928 0.46
~~
6.104943 561 ~
210.000 EUR 291,079 0.27
2,370,000 EUR 3,095,922 2.85
1,105,000 EUR 1,438.890 1.32
365000 EUR 467502 0.43
1 405.000 EUR 2.217.367 2.04
92,000,000 JPY 770,692 0.71
450,000 EUR 666,641 0.61
200000 EUR 290212 027
-.
9,238,305 8.50
498,998 GBP 968,061 089
3.321,ooo GBP 6,350,777 5 . ~ 5
A HSBC Global Investment Funds
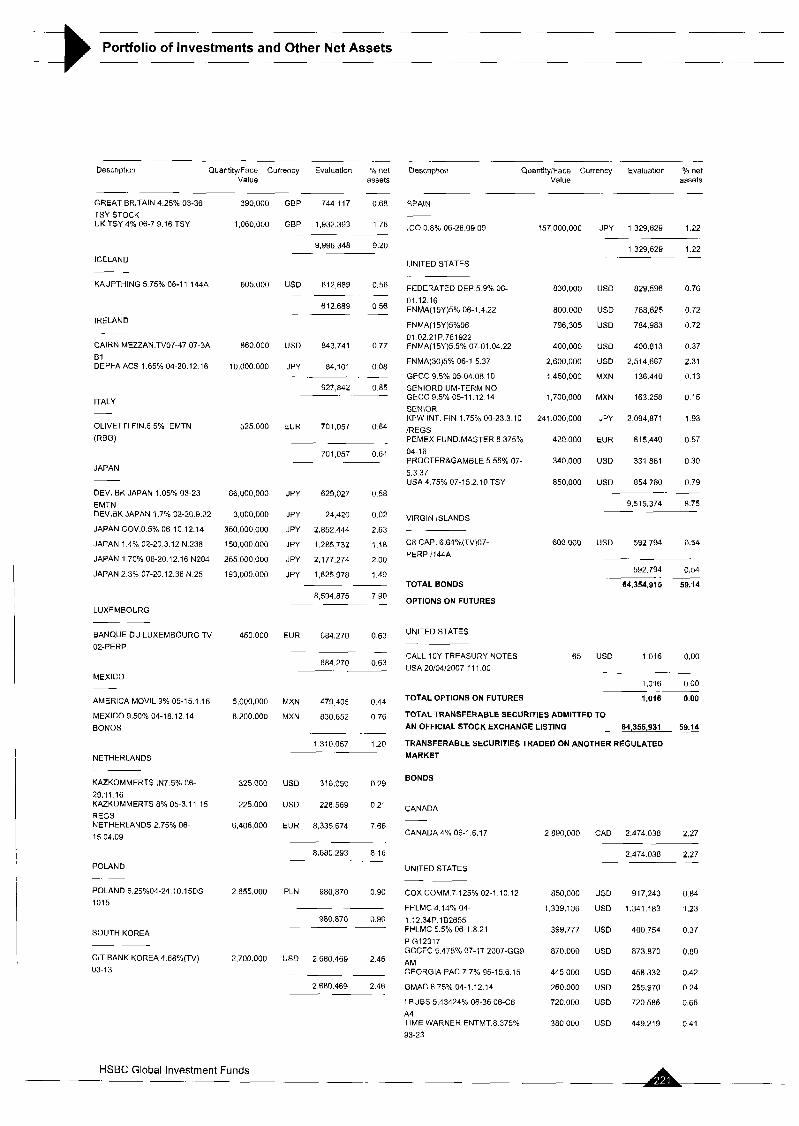
~~~~ .~
Portfolio of Investments and Other Net Assets - - _ _ ~ ~ ~~
~ ~ ~. ~ .-
Descriptio1 QuantityiFace Currency Evaluation % net Value assets
- __ Description QuantitylFace Currency Evaluation % net
Value assets ~ .~ - . -
SPAIN GREAT BRITAIN 4.25% 03-36 TSY STOCK UK TSY 4% 06-7 9.16 TSY
390000 GBP 744 117 068
1,060,000 GBP 1.932.393 1 78
9,996348 920
--
- ~.
IC0 0.8"/0 06-28.09 09 157,000,000 JPY 1,329,629 1.22
1 329,629 1.22
-- .
- . - UNITED STATES ICELAND
- -
KAUPTHING 5.75% 06-1 1 144A 605.000 US0 612689 0 5 6
612.689 056 - ~. -
- - -
FEDERATED DEP.5.9% 06- 830.000 US0 829.596 0.76 01 12 16 FNMA(15Y)5% 06-1.4.22 800000 USD 788,625 0.72
FNMA(15Y)5%06- 796,305 US0 784 983 0.72 01.02.21 P.781922 FNMA(15Y)S 5 % 07-01.04.22 400,000 US0 400813 037
IRELAND -
CAIRN MEZZAN.TVO7-47 07-3A 860000 USD 843,741 0 7 7
10,000000 JPY 84,101 0 0 8
927,842 0 8 5 - - -
--
E l DEPFA ACS 1 65% 04-20.12.16 FNMA(30)5% 06-1 5.37
GECC 9.5% 05-04.08.10 SENIORDIUM-TERM NO GECC 9.5% 05-11.12.14 SENIOR KFW INT. FIN 1.75% 00-23.3.10 /REGS PEMEX FUND MASTER 6 375% 04- 16 PROCTERkGAMBLE 5.55% 07- 5.3.37 USA 4.75% 07-15 2.10 TSY
2,600,000 USD
1,450.000 MXN
1,700,000 MXN
241 .OOO.OOO JPY
420000 EUR
340,000 USD
850,000 US0 -
-
2.514.687
136 440
163 258
2 094,871
615.440
331,881
854 780
9.515.374
~.
- -
2.31
0 13
0.15
1.93
0.57
0.30
0 79
ITALY - OLlVETTl FIN.6.5% EMTN
W G )
525000 EUR 701,057 064
701 057 064 -~ JAPAN
DEV. BK JAPAN 1.05% 03-23 EMTN DEV.BK JAPAN 1.7% 02-20.9.22
JAPAN GOV.0.5% 06-10 12.14
JAPAN 1.490 02-20.3.12 N.238
JAPAN 1.70% 06-20.12.16 N284
JAPAN 2 3% 07-20.12.36 N.25
86,000,000 JPY 629,027 0 58
3,000,000 JPY 24,420 002
350.000,OOO JPY 2.852.444 2.63
i~o,ooo.ooa JPY 1.285732 1 18
255 000,000 JPY 2,177.274 2.00
193.000.000 JPY 1,625 978 1 4 9
8.594.875 7 90
--
~ -- -
8.75 - VIRGIN ISLANDS -~
C8 CAP. 6.64%(TV)07- PERP /144A
600000 USD 592,794 0.54
-.
592.794 0.54
64,354.915 59.14 - -
TOTAL BONDS
OPTIONS ON FUTURES LUXEMBOLRG
UNITED STATES BANQUE DU LUXEMBOURG TV 02-PERP.
450000 EUR 684,270 063
- - - 684.270 063 -~
1 016 0.00
- 1,016 000
TOTALOPTIONSONFUTURES 1,016 0.00
TOTAL TRANSFERAELE SECURITIES ADMITTED TO AN OFFICIAL STOCK EXCHANGE LISTING
TRANSFERAELESECURITIESTRADEDONANOTHERREGULATED MARKET
65 US0 CALL 1OY TREASURY NOTES USA 20/0412007 11 1 00
~ --
_ 84,355,931 5 E
MEXICO
AMERICA MOVIL 9% 05-15 1.16
MEXICO 9.50"h 04-18.12.14 BONOS
5,000.000 MXN 479405 044
8.200000 MXN 830.652 076
- - 1310.057 120 -~
NETHERLANDS - -
KAZKOMMERTS IN7 5% 06-
29.11 16 KAZKOMMERTS 8% 05-3.1 1 15 REGS NETHERLANDS 2 75% 06- 15 04.09
BONDS 325.000 USD 316,050 0.29
225.000 USD 228,569 0.21
6,406.000 EUR 8,335,674 7.66
8.880.293 8.16 -
CANADA - CANADA4% 06-1.6.17 2,890,000 CAD 2.474 038 2.27
2.474.038 2.27
~~
UNITED STATES POLAND -. .- - .- POLAND 6.25%04-24.10.15DS 1015
2655.000 PLN 980,870 090
-- 980870 0.90
- - .-
COX COMM 7.125% 02-1.10.12 850,000 USD 917,243 0.84
FHLMC 4.14% 04- 1,339,136 US0 1,341,183 1.23 1 12.34P 1B2655 FHLMC 5.5% 06-1.8.21 399,777 US0 400754 037 P G12317 GCCFC 5.475% 07-17 2007-GG9 870.000 US0 873.870 0.80 AM GEORGIA PAC.7.7% 95-15.6.15 445,000 US0 458.332 0.42
GMAC 6 75% 04-1.12 14 260.000 USD 255,970 0.24
LBUBS 5.43424% 06-36 06-C6 720.000 US0 720.586 0.66 A4
93-23 TIME WARNER ENTMT.8.375% 3ao.000 USD 449.219 041
SOUTH KOREA ~- ClTlBANK KOREA 4.68%(TV) 03-1 3
2.700 000 USD 2.680.469 2.46
2 680.469 2.46
&-- HSBC Global Investment Funds
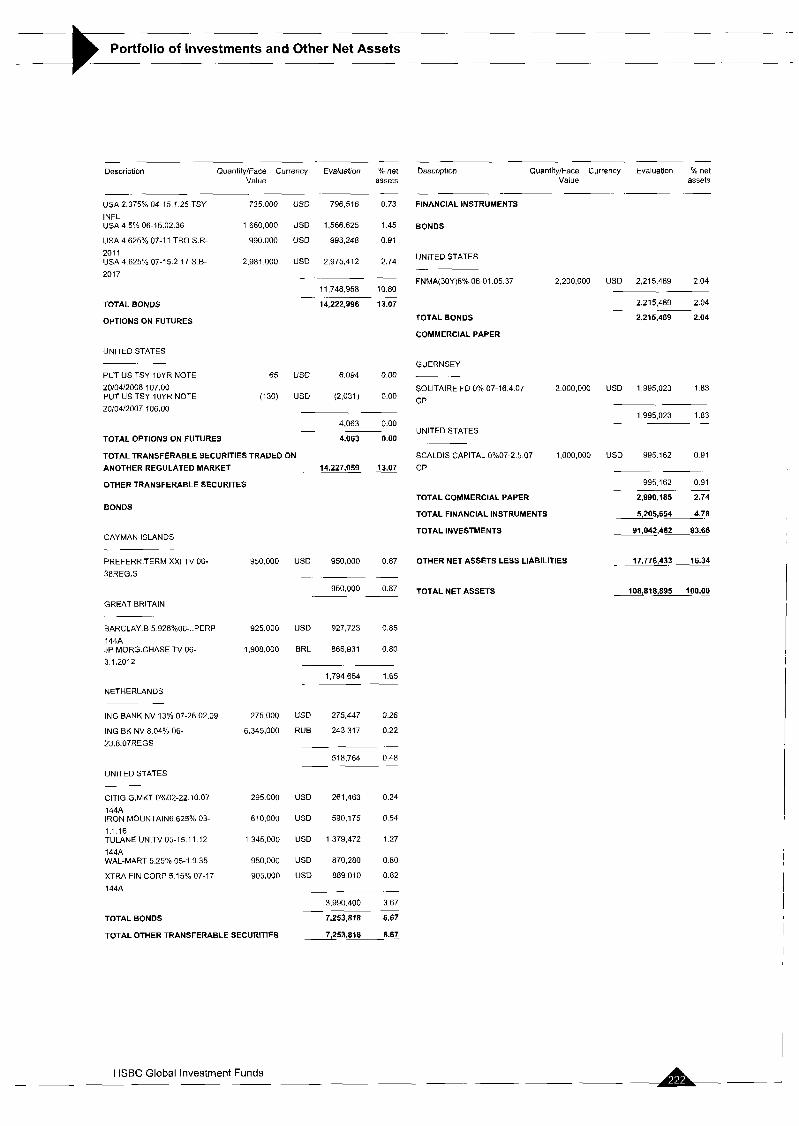
.~
Portfolio of Investments and Other Net Assets ~~~ ~ ~. -
-~ ~ - Description QuantityIFace Currency Evaluation % net
Value assets ~. ~ ~
USA 2 375% 04-15 1 25 TSY
INFL USA 4 5 % 06-15.02 36
USA 4 625% 07-1 1 TBO S R-
201 1 USA4 625% 07-15 2 17 S B-
2017
735 000
1 660.000
990.000
2,981 000
TOTAL BONDS
OPTIONS ON FUTURES
UNITED STATES -. -
PUT US TSY IOYR NOTE 2010412006 107.00
2010412007 106.00
65
PUT US TSY lOYR NOTE (130)
TOTALOPTIONSONFUTURES
US0 796,516 0 7 3
US0 1.566.625 145
USD 993248 0.91
US0 2,975,412 2.74
- -~ - 11 748.958 10 80
14,222,996 13.07 - .~ -
USD 6.094 0.00
USD (2,031) 0.00
-- 4,063 0.00
4.063 0.00 __ -.
TOTAL TRANSFERABLE SECURITIES TRADED ON ANOTHERREGULATEDMARKET 14,227,059 13.07 OTHER TRANSFERABLE SECURITES
BONDS
CAYMAN ISLANDS
PREFERR TERM XXI TV 06- 38REG.S
GREAT BRITAIN -.
BARCLAY B 5 9267006- PERP 144A JP MORG CHASE TV 06- 3 1.2012
NETHERLANDS ~-
ING BANK NV 13% 07-26 02.09
ING BK NV 8.04% 06-
23.8.07REGS
UNITED STATES - - CITIG.G.MKT Oo/o02-22 10.07 144A IRON MOUNTAIN6,625% 03- 1.1.16 TULANE UN.TV 05-15.11 12 144A WAL-MART 5.25% 05-1 9.35
XTRA FIN CORP 5.15'/0 07-17 144A
TOTAL BONDS
950.000 USD 950,000 087
950,000 0.87 .~ -
925.000 USD 927,723 0.85
1,908000 ERL 866,931 0.80
~- 1,794654 165
275.000 US0 275,447 026
6,345.000 RUB 243317 0 2 2
518,764 0 4 8
295000 US0 261,463 0.24
610,000 US0 590,175 054
1 345,000 US0 1,379,472 1 27
950.000 USD 870,280 o a o 905,000 USD 889010 082
3,990400 367
7253,818 6.67 __ - .-
TOTAL OTHER TRANSFERABLE SECURITIES 7,253.818 6.67
-. ____-. .~ - Description Quantitylface Currency Evaluation % net
Value assets - ~- ~ --
FINANCIAL INSTRUMENTS
BONDS
UNITED STATES ~
FNMA(30Y)6% 06-01.05.37
TOTAL BONDS
COMMERCIAL PAPER
2,200.000 US0 2,215.469 2.04
2.215,L69 2.04
2.215.A69 2.04
~. ~
-. .-
GUERNSEY - -- SOLITAIRE FD 0% 07-16.4.07 2 000,000 US0 1,995,023 I 83
CP ~. ~
1,995,023 1 83
UNITED STATES
SCALDIS CAPITAL 0%07-2.5 07 1,000,000 USD 995 162 0 91
CP -- 995,162 0 9 1
TOTAL COMMERCIAL PAPER 2,990,185 2.74 - -. -
TOTAL FINANCIAL INSTRUMENTS 5,205,654 4.78
TOTAL INVESTMENTS 81,042,462 83.66
17.776.433 . 16.34 .~ OTHER NET ASSETS LESS LIABILITIES
TOTALNETASSETS 108,81.8,895 10O.ClJ
-A&- - HSBC Global Investment Funds
~~ ~~~

Portfolio of Investments and Other Net Assets --L ~
PAN-EUROPEAN GOVERNMENT BOND Statement of Investments as at 31 March 2007 (expressed in EUR)
. .
Description QuantityIFace Currency Evaluation % net Value assets
- . . . . . ..
B.E.I. 6.25% 99-14 624000 GBP 961,521 0.69
1,527,731 1 09
FRANCE -
BNP PARIBAS 4% 07-22 03 10
CSSE REF1 HABIT 4% 02- 25 10 09 EDF 4 625% 03-6 11 13 EMTN
EDF 8 75% 92-22
FRANCE 4% 03-25 10 14 OAT
FRANCE 4% 04-25 4 14 OAT
FRANCE 5 5% 98-2029 OAT
FRANCE 5 75% 01-25 10 32 BTAN
~. ~ .~ . -
Description QuantitylFace Currency Evaluatian Yo net Value assets 500,000 EUR 497782 035
1.000.000 EUR 995,677 0.71
INVESTMENTS 0 25
0.66
2.62
1.54
2.28
2 67
350.000 EUR 357,465
4.150000 FRF 922.156
3,700.000 EUR 3,684,460
2,172 000 EUR 2,165.267
2 727.500 EUR 3,197,448
3,049 438 EUR 3.735 561
15,556 016
TRANSFERABLE SECURITIES ADMITTED TO AN OFFICIAL STOCK EXCHANGE LISTING
BONDS
AUSTRIA 1 1.08 -
AUSTRIA 3 9% 04-15 7 20 SENIOR AUSTRIA 4 15% 06-15 3 37
(REG) AUSTRIA 4 3% 03-15 7 14
AUSTRIA 5 5 4 99-15 1 10 599
OESTER KONTR 4 125% 07- 21 2 12
GERMANY 1 315.000
4,040 000
800 000
410,000
700,000
1,718,000
7 390.000
400 000
500 000
1044,000
116.000
9 000.000
6,000 000
2 300,000
1014,000
793,000
402,000
EUR 1,277,523 0 9 1
EUR 3953,543 281
EUR 811,920 0 5 8
EUR 425.580 0.30
EUR 700.303 050
-
7,168,869 5 10
EUROHYPO 3.25%05- 26 10.1512194 GEM.BDESLD 2.625%05- 7.10 10S22 GERMANY 3.5% 06-14.10.11 S14Y GERMANY4.25% 07-4.7.39
GERMANY 5.25% 00-4.7 2010
KFW 5.375% 04-29 1 14 EMTN
KFW 5.375% 04-7.12.07 EMTN
KFW 5.5% 01-7.12.15
KFW 5.5% 04-15.9.09
KFW 5.75% 01-07.06 32
300,000 EUR 279,630 020
3 750,000 EUR 3,568,873 2.54
4,810,000 EUR 4,709,472 3.36
540,000 EUR
1,125,000 EUR
155,000 GBP
385000 GBP
300.000 GBP
455,000 GEP
600,000 GBP -
_-
542,916
1 166.175
227 297
565.312
445 876
667,239
1.002415
0 39
0 83
0.16
0.40
0 32
0 47
0.71
9.38
-
-
BELGIUM
BELGIUM 325% 06-28 09 16 $47 BELGIUM 3 75%05-28 09 15 OL046 BELGIUM 4 25% 03-13 541 OLO
EUR 1,605,127 1 1 4
EUR 7,218,552 5 14
EUR 404.480 029
9,228 159 6 5 7
-- ~. -
~ -- 13.175.205
GREAT BRITAIN CANADA
EBRD 0% 98-2048 EMTN
GREAT BRITAIN 4.25% 03-36 TSY STOCK GREAT BRITAIN 4 75% 03- 7 9 15 TSY STOCK GREAT BRITAIN 4.75% 04- 7.12 38 TSY STOCK GREAT BRITAIN 5.75% 98-09 TSY STOCK GREAT BRITAIN 7.25% Y7-07 TSY GREAT BRITAIN 8% 96-21 TSY STOCK HBOS TSY SVCES 4.125%07- 6.2.12 MBNA EUR FDG.4.5"h 03- 23.1.09 UKTSY 4.25% 05-7 3.11
UK TSY 4.75% 05-7.3.20
ROY.EK CANADA 4 125%07- 26.1.10
8.000.000,000 ITL 514,246 0 37
273.000 GBP 390.211 0.28
660.000 GBP 954051 0.67
3268,000 GEP 5,095,301 362
365,000 GBP 542,016 0.39
385,000 GEP 572,848 0.41
160.000 GBP 310641 0.22
500.000 EUR 496,530 0.35
600000 EUR 602,295 0.43
287,000 GBP 407,054 0.29
140,000 GEP 204,270 0.15
10 089,463 7.18
- .~
.. ~
EUR 498,720 0.35
- 498,720 0.35
.~ - CYPRUS - _ CYPRUS 5 5% 02-27 2.12EMTN EUR 1,105.779 07Y
1,105.779 0 79 -- ~. -
CZECH REPUBLIC
TCHEQUE REP 4 125% 05- 18.3.20
EUR 112.980 008
112,980 0.08 ~- DENMARK
DENMARK 4% 01-15.08.08
DENMARK 6% 99-15.11.2011
DENMARK 736 95-07
DKK 1,205539 086
DKK 872012 0.62
DKK 313837 022
2,391.388 1 70 -
GREECE
GREECE 3 10% 05-20 04 10
GREECE 3 5% 04-2U 04 09
GREECE 4 3% 07-20 7 2017
GREECE 4 5Yu 05-20 9 37 (30Y)
GREECE 5 25% 02-18 5 2012
GREECE 5 90% 02-22 10 22
GREECE 6% 00.19 5 10
1585.000 EUR 1,540,937 110
3.135.000 EUR 3,098,634 2 21
4 105.000 EUR 4,103,358 2 91
375.000 EUR 369.863 0 2 6
995.000 EUR 1.045.546 074
20000 EUR 23,246 002
585.000 EUR 617,058 044
EUROPEAN UNION - - B.E.I. 5.375% 96-2021
B E.I. 8.75% 95-17
GBP 1.525.612 1.09
GBP 1481.376 1.05
3,006,968 2.14
- ~. . -
~. EUROPEAN UNION ~-
B El 4.255: 03-7 12.10 EMTN GEP 566.210 0.40
HSBC Global Investment Funds
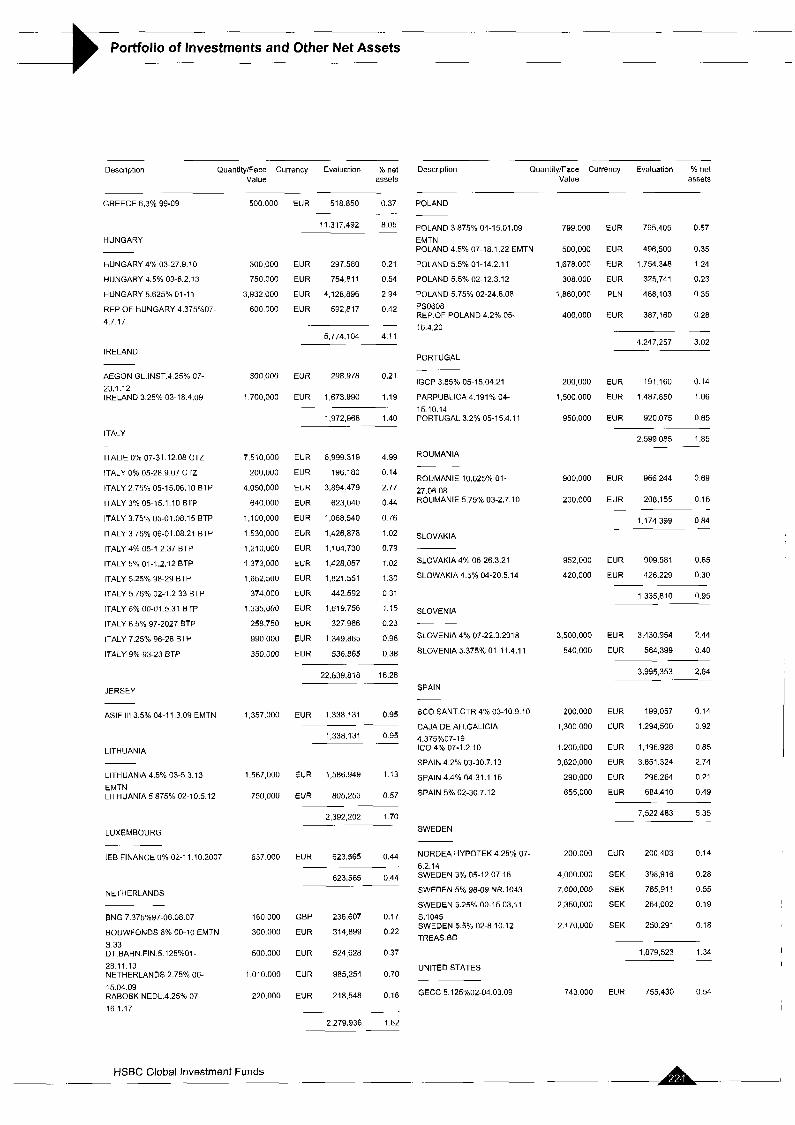
Portfolio of Investments and Other Net Assets t . -
Description QuantitylFace Currency Evaluation % net
GREECE 6.3% 99-09
HUNGARY ~
HUNGARY 4% 03-27.9 10
HUNGARY 4.5St 03-6.2.13
HUNGARY 5.625% 01-11
REP OF HUNGARY 4.375%07- 4.7.17
IRELAND
AEGON GL.lNST.4.25% 07- 23.1.12 IRELAND 3.25% 03-18.4.09
ITALY
ITALIE 070 07-31.12 08 CTZ
ITALY 0% 05-28.9.07 CTZ
ITALY 2.75% 05-15.06.10 BTP
ITALY 39h 05-15.1.10 BTP
ITALY 3.75% 05-01.08.15 BTP
ITALY 3 75% 06-01.08 21 BTP
ITALY 4% 05-1 2.37 BTP
ITALY 5% 01-1.2.12 BTP
ITALY 5.25% 98-29 BTP
ITALY 5 75% 02.1 2 33 BTP
ITALY 6% 00-01.5.31 BTP
ITALY 6.5% 97-2027 BTP
ITALY 7.25% 96-26 BTP
ITALY 9% 93-23 BTP
JERSEY
ASlF 111 3.5% 04-1 1.3.09 EMTN
LITHUANIA
LITHUANIA 4.5% 03-5 3.13
EMTN LITHUANIA 5 875% 02-10.5.12
LUXEMBOURG - -
IEB FINANCE 0% 02-1 I .10.2007
NETHERLANDS
BNG 7 375%97-06 08 07
BOUWFONDS 6% 00-10 EMTN s 33 DT BAHN FIN 5 125"/001- 28 11.13 NETHERLANDS 2.75% 06-
15.04.09 RABOEK NEDL.4.25Yo 07- 16.1.17
Value assets
500 000
300 000
750.000
3 932 000
600 000
300 000
1700,000
7 510.000
200,000
4,050,000
640.000
1,100000
1 530.000
1,210,000
I 373,000
1,652,500
374,000
1,335,000
258,750
990 000
350.000
1,357.000
1,567,000
750 000
637 000
160 000
300.000
500.000
1.01 0 000
220.000
EUR 518850 0.37
11.317.492 8 0 5
. --
-
EUR 297.580 0.21
EUR 754,811 0.54
EUR 4,128,896 2.94
EUR 592,817 0.42
.-
5,774.104 4.11 ~-
EUR 298.97a 0.21
EUR 1,673.990 1.19
1,972,968 1.40
- .
-
EUR 6,999,319 4.99
EUR 196.180 0.14
EUR 3,894 479 2.77
EUR 623,040 0 4 4
EUR 1.068.540 0.76
EUR 1.426378 1 0 2
EUR 1,104.730 0.79
EUR 1.428.057 102
EUR 1,821.551 1.30
EUR 442.592 031
EUR 1,619.756 1.15
EUR 327966 0.23
EUR 1 349.865 0.96
EUR 536.865 0.38
22.839.818 16.26
~. ~
.-
EUR 1.338131 0 9 5
1338,131 0 9 5 .~
EUR 1,586.949 1.13
EUR 805,253 0.57 ~~
2,392,202 1.70 -
. - .-
Description QuantityIFace Currency Evaluation % net Value assets
-. .
POLAND
POLAND 3 875% 04-15.01.09 EMTN POLAND 4.5% 07-18.1.22 EMTN
POLAND 5.5% 01-14.2.11
POLAND 5.5% 02-12.3.12
POLAND 5.75% 02-24.6.08 PSO608 REP.OF POLAND 4.2% 05- 15.4.20
PORTUGAL -. ~
IGCP 3.85% 05-15.04.21
PARPUBLICA 4.191% 04- 15.10.14 PORTUGAL 3.2% 05-15.4.1 1
ROUMANIA - -
ROUMANIE 10.625% 01-
27.06 08 ROUMANIE 5 75% 03-2.7 10
SLOVAKIA
SLOVAKIA 4% 06-26.3.21
SLO'NAKIA 4.5% 04-20 5.14
SLOVENIA - --
SLOVENIA 4% 07-22.3.2018
SLOVENlA5375%01-11.4.11
SPAIN - BCO SANT.CTR 4% 03-10.9.10
CAJA DE AH.GALICIA 4.375%07-19 ICO4% 07-1 2.10
SPAIN 4.2% 03-30.7.13
SPAIN 4.4% 04-31.1.15
SPAIN 5% 02-30 7.12
SWEDEN
EUR 623,565 0.44
623,565 0.44
~~
~. -
GBP 236,607 0.17
EUR 314,899 0 2 2
EUR 524628 0 3 7
EUR 985,254 0.70
EUR 218,548 0 16
- ~. -
2279.936 1 6 2 -~ -
NORDEA HYPOTEK 4.25% 07- 6.2.14 SWEDEN 3% 05-12 07.16
SWEDEN 5% 96-09 NR.1043
SWEDEN 5.25% 00-15.03.11 5.1045 SWEDEN 5.5% 02-8.10.12 TREAS.EO
UNITED STATES -~
GECC 5.125%02-04.03.09
799 000
500,000
1.678 000
308.000
1,860,000
400,000
200,000
1,500,000
950.000
900,000
200,000
952 000
420.000
3.500 000
540.000
200.000
1,300 000
1.200,000
3.a2o.000
290,000
655.000
200.000
4,000.000
7,000,000
2,350,000
2.170.000
743 000
EUR 795405 0 5 7
EUR 496,500 0 3 5
EUR 1,754 348 1 2 4
EUR 325741 0.23
PLN 488.103 0 3 5
EUR 387.160 0 2 8
~
4.247 257 3.02
EUR 191 160 0 1 4
EUR 1487.850 1 0 6
EUR 920075 065
2599,085 185
~~
. -
EUR 966244 0 6 9
EUR 208.155 0.15
1,174,399 0 84 - -
EUR 909581 0.65
EUR 426229 0 3 0
1,335,810 0 95
~ ~.
~~
EUR 3,430.954 2.44
EUR 564,399 0.40
3.995353 2.84
~. ~
~-
EUR 199.057 0 14
EUR 1294,500 0 9 2
EUR 1,196.928 0 8 5
EUR 3.851.324 2 7 4
EUR 296.264 0.21
EUR 684410 0 4 9
7522483 5 3 5
~~
EUR 200403 0.14
SEK 398,916 0 2 8
SEK 765,911 055
SEK 264,002 0.19
SEK 250.291 0.18
~. ~
1.879.523 1 34 -
EUR 755,430 0 5 4
I
HSBC Global Investment Funds

. .-
Portfolio of Investments and Other Net Assets - .~
- - . . .. ~
Description Quantity/Face Currency Evaluation 01" net STERLING INVESTMENT GRADE BOND Value assets
- -
KFW INTL 5 375% 01- 800,000 GBP 1,172 698 083 7.12 11EMTN . -
1928.128 137
TOTAL BONDS 137,061,552 97 55
TOTAL TRANSFERABLE SECURITIES ADMITTED TO
AN OFFICIAL STOCK EXCHANGE LISTING 137,081,552 97.55
TRANSFERABLE SECURITIES TRADED ON ANOTHER REGULATED MARKET
BONDS
-
SWEDEN
SWEDEN 8% 95-07 N.1037 6,600,000
TOTAL BONDS
OPTIONS ON FUTURES
GERMANY
CALL EURO BUND 23/04/2007 (5)
PUT EURIBOR 3 MONTHS (325) 11 5.50
17/12/2007 95.75 PUT EURIBOR 3 MONTHS 325 17/12/2007 96.00 PUT EURIBOR 3 (325) MONTHS1 7/12/2007 95.875 PUT EURlBOR 360 /3 MONATE 425 17/09/2007 95 625 PUT EURIBOR 360 13 MONATE (8481 17/09/2007 95.75 PUT EURIBOR 360 /3 MONATE 17/09/2007 95 875
425
TOTAL OPTIONS ON FUTURES
SEK 718,608 051
718.608 051
718,608 0.51
~ -~
EUR (1.250) 000
EUR (69,063) (005)
EUR 195,001 014
EUR (121 875) (009)
EUR 10,625 001
EUR (95,400) (007)
EUR 106.250 008
~~
24,288 002
24,288 0.02 - -
TOTAL TRANSFERABLE SECURITIES TRADED ON
ANOTHERREGULATEDMARKET 742,896 0.53
TOTAL INVESTMENTS -. 137,824,448 98.08
OTHER NET ASSETS LESS LIABILITIES 2,697,346 . 1.92
TOTALNETASSETS 140,521,794 100.00
HSBC Global Investment Funds
Statement of investments as at 31 March 2007 (expressed in GBP)
. - Description Face Value Currency Evaluation % net
assets
INVESTMENTS
TRANSFERABLE SECURITIES ADMITTED TO AN OFFICIAL STOCK EXCHANGE LISTING
BONDS
CAYMAN ISLANDS -
AIG SUNAMER. II 5,625% 02-12 EMTN LUNAR FD 6.442% 05- 18.9.32EMTN LUNAR FDG 5.75% 04-
18.10.33S 4 STH WATER SV.5%05- 31.3.21EMTN
DENMARK
FIN.FOR DANISH IND.6%07- 6.2 12
EUROPEAN UNION ~- BE1 5.5% 00-2025
BE1 5.625% 00-32
BE1 6% 98.2028 PARALLEL BDS
FRANCE
CIE ST GOBAIN 5.625% 06-24
CREDIT AGRICOLE 5.36% 06- PERP SOC GEN. 5.4C 03-30.1.18 EMTN
GERMANY
KFW INTL FIN 6% 00-7 12 28 T16 KFW 5.5% 01-7 12 15
KREDIT WIEDER.5.625%01- 25 8 17
GREAT BRITAIN
ANGLIAN WATER SERV.5.25% 05-1 5 BAA 5.75"/0 03-27 11.13 EMTN
BARCLAYS BK 5.75% 01-26 EMTN BK SCOTLAND 6.375% 99-19 EMTN GREAT BRITAIN 4.25% 03-36 TSY STOCK GREAT BRITAIN 4.75% 04- 7.12 38 TSY STOCK
600,000
95 000
140,000
420,000
400 000
210.000
450.000
520,000
50.000
250,000
750.000
680.000
850,000
300.000
150,000
400 000
170.000
50,000
230,000
2,426,000
GBP 596512 2.26
GBP 112,175 0.43
GBP 154934 0.59
GBP 405,344 1.54
~ .-
1,268,665 4 82 - .
GBP 399.334 1.52
- 399,334 1 5 2
GBP 221,907 0 8 4
GBP 502,470 1.91
GBP 591 864 225
1316241 500
-
-
GBP 48,242 0.18
GBP 233.195 0.89
GBP 734,381 2.79
-
1,015,818 3.86 -
GBP 774085 294
GBP 858,389 326
GBP 307650 1.17
~
1,940,124 7 37
GBP 145324 0 5 5
GBP 394,352 1.50
GBP 176 344 067
GBP 53.343 020
GBP 223,376 085
GBP 2,570,104 9 77

Portfolio of Investments and Other Net Assets .~
- Description
-. ..
GREAT BRITAIN 5.75% Ytl-09
TSY STOCK GREAT BRITAIN 6% 98-28 TSY STOCK GREAT BRITAIN 8% 93-13 TSY
STOCK GREAT BRITAIN 8% 96-21 TSY STOCK GREAT BRlTlAN 5% 02-7 9.14 TSY STOCK HAMMERSON 7 25% 98-21.4.28
METRONET TV 03-15 3 32 EMTN MITCHELLS BUTL 5 965% 03- 23/81 NET RAIL INFR.4.625%05- 21.7 20 NETWORK RAIL 4.875%04- 27.1 1 . I5 NETWRK RAIL INFRA.4.75% 05
24 TESCO 5.5% 02-13.12.2019 EMTN UK TSY 4.75% 05-7.3.20
UNITED STATES
Face Value Currency Evaluation net US DOLLAR HIGH YIELD BOND
688.000 GBP
1198,000 GBP
270,000 GBP
1002.000 GBP
3,365000 GBP
100,000 GBP
315,000 GBP
133,386 GBP
110,000 GBP
310000 GBP
350,000 GBP
150.000 GBP
5,735000 GBP
694 192
1,421,307
312,120
1,321,838
3,348 848
113,140
316,040
136,921
104,603
300 926
339,771
148.438
5 685.680
assets '
- 2.64
5 40
1.19
5.02
12.74
0.43
1.20
0 52
0.40
1.14
1.29
0.56
21.62
17,806.667 67 69
ClTlGROUP 4 5% 06- 3 3.2031EMTN ClTlGROUP 5.25% 03-21.05.26
GECC 5.5% 98-7 6.21 EMTN
GECC 6.125% 02-17.5.12 EMTN
RAEOBK CAP.5.556% OCPERP REG
TOTAL BONDS
100,000 GBP 87853 033
90,000 GBP 87.285 0.33
300,000 GBP 299673 1 1 4
750,000 GBP 763,372 291
410000 GBP 403,192 1 5 3
- 1,641375 6.24
25,388,524 96.50 ~ .~
TOTAL TRANSFERABLE SECURITIES ADMITTED TO AN OFFICIAL STOCK EXCHANGE LISTING 25,388,524 96.50
25,388,524 96.50 TOTAL INVESTMENTS ~.
OTHER NET ASSETS LESS LIABILITIES 921,891 -3.50
TOTALNETASSETS 26,310,415 100.00 -
Statement of Investments as at 31 March 2007 (expressed in USD)
-. - Description Face Value Currency Evalualion YO net
assets
INVESTMENTS
TRANSFERABLE SECURITIES ADMITTED TO AN OFFICIAL STOCK EXCHANGE LISTING
BONDS
FRANCE
CIE GEN.GEOPHYSIQUE 7 5O/.05-15
GREAT BRITAIN
NTL CABLE 9.125% 06-15.08.16
UNITED STATES ~- .-
CARRIAGE SER 7.875% 05- 15 1.15 CASE NEW HOLD 7.125% 06- 1.3.14 CHESAPEAKE EN.E.875-h 03-16
CINCINNATI BELL 8.375% 03- 141s COPANO ENERGY 8.125% 06- 1.3.16 EDUCAT MNGT F.10 25% 06-16
EXOPACK HLDG 11 25% 06- 12.14 FORD MO CR7.375%09GL.LAND FORD MOTOR 7 375% 01-1 2 11
FREEPORT MCMORAN 8 25% 07-15 GMAC 6.875% 02-28.8.12
HERTZ CORP 8.875% 07- 01.01.14 INNOPHOS 8.75% 06-15.08.14
MASSEY ENERGY 6.875% 06-
13 MIRANT NTH.AM.7.375Yb 06-13
PQ CORP 7.5% 05-15.2 13
TOTAL BONDS
25.000
25 000
25,000
50 000
150 000
250,000
20,000
15.000
50,aoo
100.000
50,000
25 000
250,000
150,000
25.000
150.000
150,000
50 000
USD 25,917 044
~
25917 0.44 -
USD 26 396 0.45
26.396 0.45
-
-
USD
USD
US0
USD
US0
USD
USD
USD
US0
USD
US0
USD
US0
USD
US0
USD
25,828
52 125
152.019
255.974
20.713
16 313
53.500
99,999
49,267
26 746
250,023
161,399
25,875
143,005
154,457
50 625
0 44
0.89
2.60
4.38
0.35
0.28
0.92
1.71
0.84
0.46
4.28
2.76
0.44
2.45
2.64
0.87 .-
1,537,868 26.31 ~ .~
1,590,181 27.20
TOTAL TRANSFERABLE SECURITIES ADMllTED TO AN OFFICIAL STOCK EXCHANGE LISTING
TRANSFERABLE SECURITIES TRADED ON ANOTHER REGULATED MARKET
1,590,181 27.20 -.
BONDS
CANADA -
COMPTON PET.7.625% 05- 01.12.13 STONE CONT.7.375% 04- 15 07.14
150,000 US0 147,000 252
25000 USD 24,031 0.41
1 HSBC Global Investment Funds

-
Portfolio of Investments and Other Net Assets
. . - .
Description Face Value Currency Evaluation Yo net assets
. .
TEMBEC IN0 7.75% 02-15.3.12
LUXEMBOURG
NELL AF 8.575"/0 05-15 8.15 144A
UNITED STATES
AK STEEL CORP 7.75% 02- 15.6.12 ALLIED WASTE 7.375% 04- 15.4.14 AMERICAN RAILCAR 7.5%07- 1.3.14 BEVERAGES MORE INC 9.25% 07-12 BUFFALO THUND DEV 9.375% 06-14 CABLEVISION 8% 05-15.4.12 SR.B CCM MERGER 8% 05-8.1.13 144A CELL TIS HOL 9.75% 04-15 3.10
CENTENNIAL COM.IO% 05- 1.1.13 CMS ENERGY 6.875% 05- 15.1 2.1 5 GENERAL CABLE 7 125%07- 1.4.17 GEN MOTORS.7.125% 03- 15.7.13 GEORGIA PAC 7.7% 95-15.6.15
GREEKTOWN HDG 10.75%05- 13/144A IDEARC INC8%06-15 11.16 144A ISLE OF CAPRI CAS.7% 04-14 WI K2 7.375% 04-1.7.2014
LANDRY S REST.7.5°/~ 04- 15 12 14 LYONDELL CHEMICAL 8%06- 15.9.14 LYONDELL CH.8.25% 06-15.9.16
MAAX CORP 9.75% 04-15.6.12
MEDIACOM LLC 7.875% 99-11
MlLLENlUM AMER.9.25%01- 15.6.08 OMNICARE E 75% 05-15.12.13
PLY GEM INO.S"/o 04-15.2.12
REGENCY ENGY 8.375%06- 15 12.13 RURAL CELLUL.9.75% 02- 15.1.10 SOLO CUP 8.5% 04-15 2.14
SUSSER lO.E25% 06-15.12.13
UCI HOLDCO TV 06-13 144A lPlK WILLIAMS 6.375%05-1.10.10 144A YANKEE AC0.9.75% 07-17 144A
TOTAL BONDS
25.000
200 OO(1
100.000
250,000
25.000
25.000
25 000
250,000
200,000
25.000
200 000
250,000
25.000
25 000
100,000
150,000
25,000
150 000
91,000
150 000
5,000
5,000
25.000
150 OOU
25.000
150,000
100.000
25 000
50.000
150 000
106.000
25.000
50,000
25.000
US0 15.219 026
186250 3.19 ~-
-
USD 208 500 3.57
. -
208,500 3 57
USD
USD
US0
US0
US0
US0
USD
USD
USD
us0
USD
USD
USD
US0
USD
US0
US0
USD
us0
USD
US0
USD
USD
US0
us0 USD
USD
USD
USD
USD
US0
USD -.
101.843
252,916
25 688
25.438
25 500
254,577
201,000
25 125
216 500
261,483
25.250
23 373
102 996
160.500
25 750
146 500
90.886
147,186
5.251
5,371
17 000
150 384
25.968
151 688
88.121
25,438
51 750
128,769
115.673
24.813
50 625
25,313
1 74
4.33
0.44
0.44
0.44
4 35
3.44
0 43
3.70
4.47
0.43
0.40
1.76
2.75
0.44
2.51
1 5 5
2.52
0 09
0.09
0 29
2.57
0 44
2.59
1 5 1
0.44
0 89
2.20
1 98
0.42
0.87
0.43
2.978 675 50.95
3.373.425 57.71 ~-
TOTAL TRANSFERABLE SECURITIES TRADED ON
ANOTHERREGULATEDMARKET . . 3,373.425 57.71
Description Face Value Currency Evaluation % net assets
. .
OTHER TRANSFERABLE SECURITES
BONDS
BAHAMAS
KERSZNER INT 6.75% 05- 01.10.15
UNITED STATES
CHAPARRAL 8.875%07-1 .?.I7 144A COMPUCOM SYST.lZ% 06-14 144A GEORGIA GULF 9.5% 06-14 - 144A- GIBRALTAR.IND.8% 06- 1 5IMUTLICP HAWKER BEECHC.8.5% 07-15 144A POKAGON 10 375%06-I5 6.14 144A RH DONNELLEY 6.875% 06-13 S A2 SWIFT ENERGY 7 625% 04- 15.7 11 TRANSDIGM 7 75%07-I5 7 14 144A TRIMAS 9.875% 02-15 6.12
TUBE CITY IMS 9 875%07-I5 144A TURNING STONE 9.125%06-14 144A US CONCRETE 8.375% 04- 4.1 14 WILLIAMS 7.5% 06-15.06.1 1 144A
TOTAL BONDS
i5o.000 USD 150,000 2.57
- 150000 257
25.000 USD
25,000 US0
25,000 USD
150,000 USD
25,000 USD
25,000 US0
10,000 USD
25,000 US0
25,000 USD
25,000 USD
25000 USD
25,000 US0
25.000 USD
25,000 US0
25 250
26.687
24,125
151.499
25 938
27.562
9,888
25,688
25.813
25,031
26,000
25 688
25.440
26,437
0.43
0.46
0.41
2.59
0.44
0.47
0 17
0.44
0.44
0.43
0.44
0.44
0.44
0.45
471,046 8.05
621,046 10.62 -~
621,046 10.62 TOTAL OTHER TRANSFERABLE SECURITIES __ .
TOTAL INVESTMENTS 5584.652 95.53
OTHER NET ASSETS LESS LIABILITIES 261,214 4.47
TOTALNETASSETS 5,845,866 100.00
HSBC Global Investment Funds ~ .~ .~ ~
-
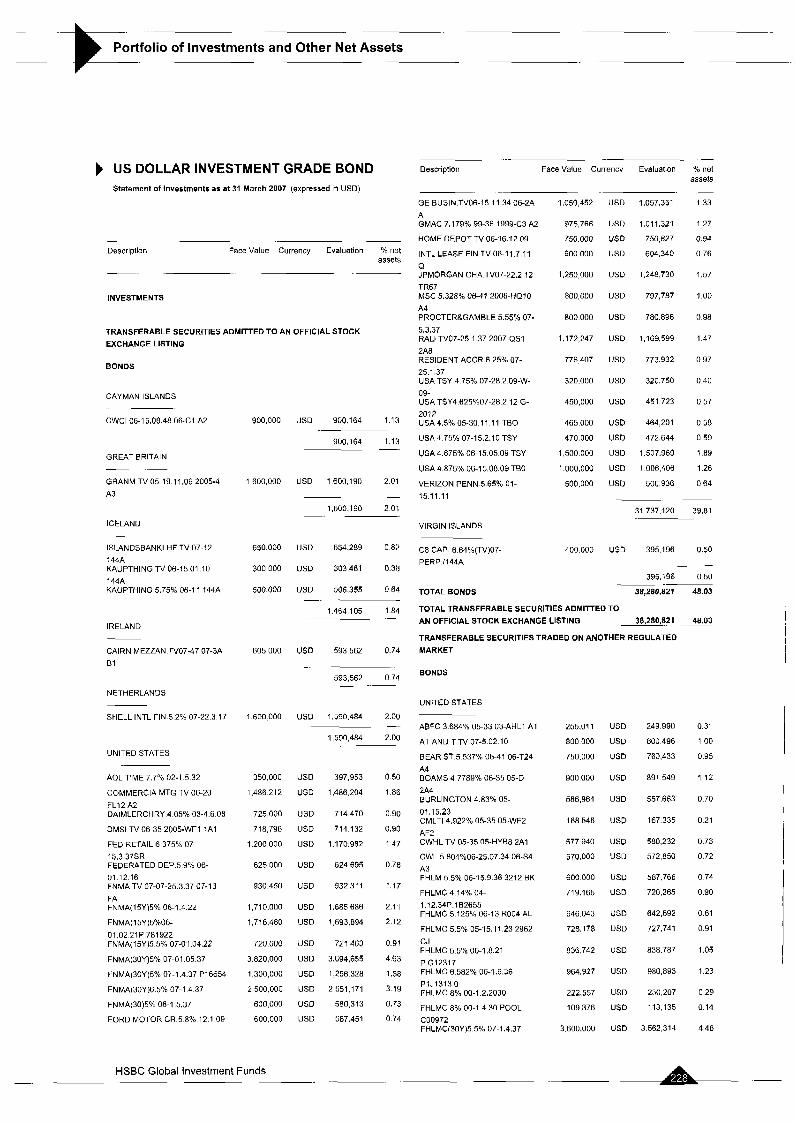
Portfolio of Investments and Other Net Assets -
~-
US DOLLAR INVESTMENT GRADE BOND Statement of Investments as at 31 March 2007 (expressed in USD)
~. . -
Descriplian Face Value Currency Evaluatian Yo net assets
-. . . .~
INVESTMENTS
TRANSFERABLE SECURITIES ADMITTED TO AN OFFICIAL STOCK EXCHANGE LISTING
BONDS
CAYMAN ISLANDS .. ~
CWClO6-15.08 48 06-C1 A2
GREAT BRITAIN __ GRANM TV 05-19.1 1.06 2005-4 A3
ICELAND
ISLANDSBANKI HF TV 07-12 144A KAUPTHlNGTV06-1501.10 144A KAUPTHING 5.75% 06-1 1 144A
IRELAND
CAIRN MEZZAN.TV07-47 07-3A E1
NETHERLANDS
SHELL INTL FIN 5 2% 07-22 3 17
UNITED STATES
AOL TIME 7 .75 02-1.5.32
COMMERCIA MTG TV 06-20 FL12 A2 DAIMLERCHRY.4.05% 03-4.6.08
DMSl TV 06-35 2005-WF1 1Al
FED RETAIL 6 375% 07-
15.3 37SR FEDERATED DEP.5.9% 06- 01.12.16 FNMA TV 07-07-25.3.37 07-13
FA FNMA(15Y)5% 06-1.4.22
FNMA( 15Y )5%06- 01.0221P781922 FNMA(15Y)5.5% 07-01.04.22
FNMA(30Y)5% 07-01.05.37
FNMA(30Y)5"h 07-1.4.37 PI6654
FNMA(30YF 5% 07-1 4.37
FNMAl30)5C 06-1 5 3 7
FORD MOTOR CR.5.8% 12.1.09
900,000
1600,000
650,000
300 000
500.000
605 000
1.60U 000
350.000
1,486 212
725,000
718 796
1200,000
625,000
930.450
1,710,000
1 716.480
720.00C
3 820,000
1,300,000
2 500.000
60flOOO
600.000
HSBC Global Investment Funds
USD 900164 1.13
900,164 113 -
US0 1600,190 2.01
- 1,600,190 2.01
USD 654,289 0.82
USD 303461 0.38
USD 506.355 064
1,464,105 1 8 4
- -
-
US0 593 562 0 74
- -
593,562 074
USD 1,590.484 2.00
1,590,484 2.00
-
~. ~
US0 397,953 0.50
USD 1,486.204 1.86
USD 714.470 0.90
USD 714132 0.90
US0 1.170.982 1 47
USD 624,695 0.78
US0 932.311 1.17
USD 1.685686 2.11
US0 1693,894 2.12
USD 721.463 0.91
US0 3,684,655 4.63
USD 1,256 328 1.58
USD 2551.171 319
US0 580313 0.73
US0 587.451 074
-
Description Face Value Currency Evaluation % net assets
GE BUSIN.TVO6-15 11.34 06-2A A GMAC 7.179% 99-36 1999-C3 A2
HOME DEPOT TV 06-16.12 09
INTL LEASE FIN.TV06-11 7.11 Q JPMORGAN CHA.TV07-22.2.12 TR67 MSC 5.328% 06-41 2006-HQ10 A4 PROCTERgGAMBLE 5.55% 07- 5.3.37 RALl TV07-25 1 37 2007-OS1 2AB RESIDENT ACCR 6.25% 07- 25.1.37 USA TSY 4.75% 07-28.2.09-W- 09- USA TSY4.625%07-28 2 12 G- 2012 USA 4.5% 05-30.1 1 11 TBO
USA 4.75% 07-15.2.10 TSY
USA 4.875% 06-15.05.09 TSY
USA 4.875% 06-15.08.09 TBO
VERIZON PENN.5.65% 01- 15.11 11
VIRGIN ISLANDS
C8 CAP. 6 64%(lV)07- PERP./l44A
TOTAL BONDS
1,059,452
975,766
750.000
600 000
1.250 000
800,000
800 000
1 172,247
776 407
320.000
450,000
465,000
470.000
1,500.000
1 .ooo.ooo 500,000
400 000
USD 1,057.351 1.33
USD 1,011,321 127
USD 750,827 0.94
USD 604.340 0.76
USD 1,248,730 1.57
USD 797.787 1.00
USD 780896 0.98
USD 1.169.599 1.47
USD 773932 0.97
USD 320.750 0.40
USD 451 723 0.57
USD 464,201 0.58
USD 472.644 059
USD 1.507.969 1.89
USD 1,006,406 1.26
USD 506 936 064
~~
31 737.120 39.81
USD 395,196 0 5 0
-
395,196 0.50 - .~ 3a,2ao.a2* 48.03
TOTAL TRANSFERABLE SECURITIES ADMITTED TO AN OFFICIAL STOCK EXCHANGE LISTING 38,280,821 48.03
TRANSFERABLESECURITIESTRADEDONANOTHERREGULATEO MARKET
BONDS
UNITED STATES
ABFC 3 684% 05-33 03-AHL1 A1
AT AND T TV 07-5.02.10
BEAR ST.5.537% 06-41 06-T24 A4 BOAMS 4.7789% 06-35 05-D 2A4 BURLINGTON 4.83% 05-
01.15.23 CMLTI 4.922% 05-35 05-WF2 AF2 CWHL TV 05-35 05-HYB8 2A1
CWL 5.804%06-25.07 34 06-54 A3 FHLM 5.5% 06-15 9.36 3212 BK
FHLMC 4.14% 04- 1.12.34P.182655 FHLMC 5.125% 06-13 ROO4 AL
FHLMC 5.5% 05-15.11.23 2962 CJ FHLMC 5 5% 06-1.8.21 P G12317 FHLMC 6.582% 06-1 6 3 6 P1J13130 FHLMC 8% 00-1.2.2030
FHLMC 8% 00-1.4.30 POOL COO972 FHLMC(3UY)5.5% 07-1.4.37
255,011 US0
800000 USD
750.000 USD
900000 US0
586.964 USD
168546 USD
577940 US0
570,000 USD
600000 US0
719.165 USD
646,043 US0
728.178 USD
836.742 US0
964,927 USD
222,557 US0
109376 USD
3,600,000 USD
249.990
809 496
763.433
891 549
557.663
167 335
580.232
572 850
587.766
720,265
642,692
727 741
838.787
980,893
250,207
113.135
3 562,314
0.31
1 .oo 0.95
1.12
0.70
0 21
0.73
0.72
0.74
0.90
0.81
0.91
1.05
1.23
0 29
0.14
4 48

Portfolio of Investments and Other Net Assets -
~
Description Face Value Currency Evaluation “lo net Description Face Value Currency Evaluation % net assets assets
~.
FREDDIE MAC TV 06-23 R008- FK GCCFC 5.475% 07-17 2007-GG9 AM GENERAL ELEC.CO 5% 03- 1.2.13 GMAC MTG 5.805%06-36/06- HE3-A3 LBUBS 5.43424% 06-36 06-C6 A4 MERCK a co 5.75% 06-15.1 1.36
MSM TV 06-36 06-3AR 2A3
PROGRESS ENGY TV05- 14.1 1.08-A- SBC COMM.5.l% 04-3.11.14
.. .
1,205.533
660 000
1000,000
480 000
600,000
Y00.000
629 397
450,000
750.000
1,550 000
525.000
950,000
1,000.000
1,300,000
1 577,000
1.570.000
2.365.000
500 000
1.525 000
US0
US0
US0
US0
USD
US0
USD
US0
US0
USD
US0
USD
USD
USD
US0 USD
USD
US0 USD
1,211.275
662 936
993.604
483.750
600.488
884,734
637 537
450.150
733.596
1 550,000
620.632
957,634
977,813
1,283.750
1,488 294
1,575,152
2,360566
504 414
1.544.777
1 52
0.83
1.25
0.61
0.75
111
0.8U
0 56
0.92
1.94
0.78
1.20
1.23
1.61
1 87
1.98
2.97
0.63
1 .94
PUGET SOUND 6 274% 06- 15.03.37 RAST TV 03-25.2 34 03-Al5 1A2
RAST 6% 06-25.4 36 06-Al-lA3-
SLM TV05-15.6.18 2005-A A1
SVHE 5.Y98% 06-36 2006-WF1 A I F TULANE UN.TV 05-15.11.12 144A UNION PAC 5 082% 05-1 2 2 9
WAMU 5.303% 06-43 2006-SL1 1A XEROX CORP TV 06-18.12.09
XTRA FIN CORP 5.15% 07-17 144A
550,000
1,245.796
407.827
864,577
1 294.302
1,000,000
499.930
695.426
300,000
1,000,000
USD 564,158 071
USD 1,249,586 1 5 7
USD 411,331 0.52
US0 864.577 1.08
USD 1.292 280 162
USD 1025,630 1 2 9
USD 487736 0 6 1
USD 695,417 087
USD 301.971 038
USD 982331 123 GLOB. TARGET CRED.TV 02-1 1 2002-1 A TIME WARNER ENTMT.8.375%
15 747,973 19.76
20,346,280 25.53
- 20,346,280 25.53
- TOTAL BONDS
TOTAL OTHER TRANSFERABLE SECURITIES
FINANCIAL INSTRUMENTS
BONDS
93-23 TIME WARNER 5.875% 06- 15.11.16 USA TSY 4.25%04-15.8.14/E- 2014 USA 4.125% 05-15 08.10 M-2010
USA 4.5% 06-15.02.36
USA 4.625% 07-1 1 TBO S.R- 201 1 USA4.625% 07-15.2.17 S.B- 2017 USA4 75% 07-31.1.12 S.F-2012
USA 4.875% 06-31.07.115 L- 201 1
UNITED STATES
FNMA(30Y)6% 06-01.05 37 3.400 000 USD 3.425.500 4 30
3,425,500 4 30
3.425.500 4.30
3,425,500 4 30
-. 94,558,051 118.65
- -~
- TOTAL BONDS
TOTAL FINANCIAL INSTRUMENTS
TOTALINVESTMENTS
~.
32.505.450 40 79
32,505,450 40.79 -
TOTAL BONDS
OTHER NET ASSETS LESS LIABILITIES TOTAL TRANSFERABLE SECURITIES TRADED ON
ANOTHERREGULATEDYARKET 32,505,450 . 40.79 OTHER TRANSFERABLE SECURITES
(14,859,788) (18.65)
TOTALNETASSETS 79,696,263 100.00
BONDS
CAYMAN ISLANDS -- ~
PREFERR.T.XXII TV 06-36 144A 600,000 USD 601.200 0.75
601 200 0.75
-
- GREAT BRITAIN
ARRMF TV 06-20.9.56 06-2A A2B BARCLAY B 5.926°/u06-..PERP 144A
3.000.0110 USD 2,994,163 3.76
1 000,000 US0 1,002,944 1.26
-. .~
3.997.107 5.02 -
UNITED STATES .~
AMCAR 4.47% 05-6 5 10 05-CF
A3 CAP.ONE AUTO 5 53%6-09 0 6 4 A2 CARAT 5 03% 06-08 2006-1 A2A
CGCMT 5 378% 06-49 2006-C5 A2 CIT DT 5.205807-49 07-CD4 A2B
COUNTRYWIDE TV 03-18 03-8 A2 FHR TV 05-15 6 35 2988 AF
GE 05-2AA3 4 88% 06-22.10 09
HOME DEPOT 5.25”/0 06- 16 12 13
1,163,311 USD 1 157.857 1.45
242.801 US0 242801 0.30
384.423 USD 383.943 0.48
950.000 US0 958.022 1.20
900,000 USD 904,493 1.13
735.058 US0 741.087 093
947.007 USD 946.015 119
1600.000 US0 1,592,499 201
950000 USD 946239 1.19
- -2 HSBC Global Investment Funds -

.-
Portfolio of Investments and Other Net Assets
EURO RESERVE Statement of investments as at 31 March 2007 (expressed in EUR)
-. - . -.
Descriution Face Value Currency Evaluation Yo net assets
-
EUR 2,000,300 4.67
~
5.000.000 11 67 ~- ~
.-
CR MUTUEL L.AT 0% 06- 13 4 07CD
2 000,000
GERMANY .~
Description Face Value Currency Evaluation % net assets
BAY HYPOBK 0% 06-13.4.07 CD 1,000,000 EUR 1,000,000 2.33
1 ,000,000 2.33
6,000,000 14.00 ~. INVESTMENTS
TOTAL CERTIFICATE OF DEPOSIT
TOTAL OTHER TRANSFERABLE SECURITIES
FINANCIAL INSTRUMENTS
COMMERCIAL PAPER
. 6,399,942 14p3 TRANSFERABLE SECURITIES ADMITTED TO AN OFFICIAL STOCK EXCHANGE LISTING
BONDS
BELGIUM - -
QUASAR SEC.O% 07-28 05 07 CP
FRANCE
EDF TV 04-7 5 07 5.64
SANOFI AVENTIS TV 05- 30.05.07
(RBG) 1 .ooo,ooo
1,000 000
1 000,000
1,000 000
1 000.000
1 .ooo,ooo 1.000 000
1 000,000
1.200.000
700,000
1 000,000
1.000 000
600,000
1.000.000
1 500.000
1,000 000
1.500.000
1,500,000
1,300 000
EUR 993.766 2.32 1 700,000 EUR 1,099,918 2.56
500,000 EUR 499,866 117
-
1,599,784 3.73
993766 2.32 ~.
CAYMAN iSLANDS
IRELAND -
ALLIED IRISH BK TV 05-27.6 07
CULLINAN FIN 0% 07-26 4.07 CP GOLDEN KEY 0% 07-14.05.07 ECP SILVER TOWER FD 0%07- 08.5.07CP
EUR 997201 2.33
EUR 995.294 2.32
EUR 995948 2.32
~.
2 988.443 6.97
1,250.000 EUR 1,249,968 292
1 249,968 2.92 ~
- NETHERLANDS ~. .-
KBC iFlMA TV 05-20 4.07 (REG)
KBC IFIMA TV 06-17.8 07
1.000.000 EUR 999,932 2 33
300000 EUR 299,983 0.70
1,299,895 3.03 .
FRANCE
ACOSS 0% 07-23.4.07 CP
ANTALiS 0% 07-13.04.07 CP
LMA 0% 07-10 4.07 CP
SCHNEIDER 0% 07-10.4.07 CP
SOFINCO 0% 07-1 1 04.07 CP
UNEOIC 0% 07-12.04.07 CP
EUR 997,450 2.33
EUR 998,566 2 3 3
EUR 998832 2 33
EUR 998.833 233
EUR 1,198312 2 7 9
EUR 699,058 1.63
5 891.251 13 74 -
SPAIN
BBVA TV 05-28.09 07
BPE FIN.TV 06-13.09 07
500.000 EUR 499.985 117
1 500.000 EUR 1,499,749 3 50 -
1,999734 467
SWEDEN - .. ..
AB SPINTAB TV 06-14.1.08 GREAT BRITAIN
1.000,OOO EUR 999865 2.33 ABBEY NAT TSY 0% 07- 10 04 07CP ALLIANCEBLEIC 0% 07-14 5 07 CP BARCLAYS 0% 07-12 4 2007 ECP BRITANNIA BLDG SOC 0%- 5 4 07CP HBOS TSY SERV 0%07- 25 05 07 CP NORTHERN ROCK 0% 07-6 6 07 CP REGENCY ASS.O% 07-20 4 07
CP
EUR 998.874 2.33
EUR 995268 2.32
EUR 599.195 1.40
EUR 999356 2.33
EUR 1.491.362 3.48
EUR 992780 2.32
EUR 1,496,634 3.49
7,573,469 17.67 ~.
999.865 2 33
7.149.246 16.68 ~- -
TOTAL BONDS
TOTAL TRANSFERABLE SECURITIES ADMITTED TO AN OFFICIAL STOCK EXCHANGE LISTING 7.149.246 16.68
OTHER TRANSFERABLE SECURITES
BONDS
IRELAND
UNICRED IRELO TV 06-25 1 .OS 400000 EUR 399.942 0.93
399,942 0.93
TOTAL BONDS 399,942 0.93
CERTIFICATE OF DEPOSIT
. -
~. IRELAND -
ANGLO IRISH BK 0% 07- EUR 1,497,821 3.49
EUR 1,299,586 3.03
~.
2.797.407 6.52 .. --
12.4.07CP DZ BK IRELAND 0% 07-2.4.07 CP FRANCE
ENP PARIBAS 0% 07-1 1 6 07 1 000,000 EUR 1,000.000 2 33
CD CEPME 0% 07-20 08 07 CD 1,000000 EUR 1,000000 234
CREDIT FONCIER 0x07-13 8.07 1 000,000 EUR 1,000 000 2 33 CD
A- HSBC Global Investment Funds

-.
Portfolio of Investments and Other Net Assets
~.
Description Face Value Currency Evaluation 010 net US DOLLAR RESERVE assets
Statement of investments as at 31 March 2007 (expressed in USD) . .. -
ITALY -
BCA POP DI VERONA 07- 7.6.07CP
1,500,000 EUR 1,488 952 3.47
~. -
1,488,952 3 47
- Description Face Value Currency Evaluatlon % net
assets JERSEY
AMSTEL EURO 0% 07-6.6.07 CP 1,000,000 EUR 992,834 2.32
992,834 232
-
-
INVESTMENTS
NETHERLANDS ~- UNILEVER FIN INT 0% 30 4 07 CP
TRANSFERABLE SECURITIES ADMITTED TO AN OFFICIAL STOCK EXCHANGE LISTING
1,000,000 EUR 996.688 2 32
.~
996,688 2.32 -.
BONDS
UNITED STATES UNITED STATES
CIT GROUP INC TV 05-24 8 07 700.000 US0 700,230 365
700.230 365
TOTAL BONDS 700.230 3.65
TOTAL TRANSFERABLE SECURITIES ADMITTED TO AN OFFICIAL STOCK EXCHANGE LISTING -700,230 36$
OTHER TRANSFERABLE SECURITES
BONDS
-- .. SlMBA FUND 0% 07-12.06 07
CP 1,000000 EUR 992 133 231
-
992.133 231
TOTAL COMMERCIAL PAPER
CERTIFICATE OF DEPOSIT
24,714.943 57.64
FRANCE
BFCM 0% 07-29.5.07 CD
BQ.SOLFEA 0% 06-20.7.07 CD
NATlXlS 0% 07-1.6.07 CD
STE GENERALE 0%07-12.6.07 CD
1 000,000 EUR 1,000.000 2 33
1,000.000 EUR 1.000,OOO 2 33
1,500 000 EUR 1,500,000 351
1,000,000 EUR 1,000.000 2 33
UNITED STATES
GOLDM SACHS TV 04-07 400,000 USD 400,029 2.08
T205(REG) -.
400,029 2.08
400,029 2.08 TOTAL BONDS
TOTAL OTHER TRANSFERABLE SECURITIES 400,029 2.08
FINANCIAL INSTRUMENTS
- 4 500,000 10.50
IRELAND
DEPFA BANK 3 73% 06-11.10 07 CP
1.000,OOO EUR 999,370 2.33
-
999.370 2.33 COMMERCIAL PAPER - TOTAL CERTIFICATE OF DEPOSIT 5,499,370 12.83
TOTAL FINANCIAL INSTRUMENTS - 30,214,3'13 70.47
TOTAL INVESTMENTS . 43,763,501 102.08
AUSTRALIA
AN2 NATL.O"/o 07-27.4.07 CP
WESTPAC BANKING 09t07- 5.04.07CP
700,000 US0 697,150 3.63
700,000 USD 699.389 3.65
- .
1,396,539 7.28 -.
OTHER NET ASSETS LESS LIABILITIES (890,382) (2.04
TOTAL NET ASSETS .. 42,873,119 100.00 CANADA -.
BK NOVA SCOTIA 0% 07- 9 04 07CP CC JARD QUEBEC 0%07- 13.4.07CP
700,000 USD 698,979 3.64
500,000 US0 498,976 2.60
. . . -
1,197,955 6.24 - .
CAYMAN ISLANDS ~- K2 CORP Oo/. 06-17.05 07 CP 500000 USD 496,527 2.59
496,527 2 59 .
DENMARK - .-
DANSKE CORP 0% 07-9.4.07 DCP
700,000 US0 698,985 3.64
.
698.985 3.64 -
L -~
HSBC Global Investment Funds - . -
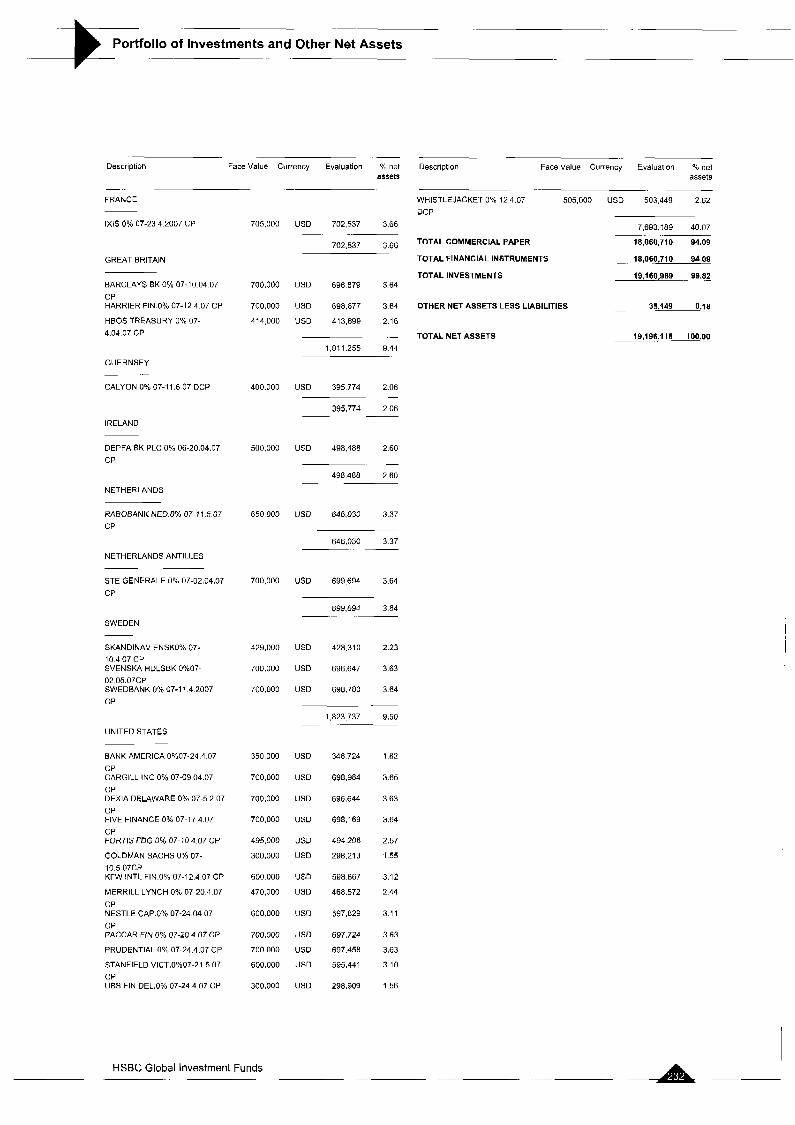
.~ ._
Portfolio of Investments and Other Net Assets - .~
- .-
Description Face Value Currency Evaluation % net assets
FRANCE
1x1s 0% 07-23 4.2007 CP
GREAT BRITAIN
705,000 USD 702,537 366
702.537 366
-
BARCLAYS BK 0% 07-10 04 07 CP HARRIER FIN 0% 07-12 4 07 CP
HBOS TREASURY 0% 07- 4.04.07 CP
700.000 USD 698879 364
700,ooo USD 698.677 364
414000 USD 413,699 216
-
i . a i i 255 944
GUERNSEY -
CALYON 0% 07-1 1.6.07 DCP 400.000 US0 395774 2.06
395,774 206
. -
~. -- IRELAND
DEPFA EK PLC 0% 06-20.04.07 CP
NETHERLANDS
500,000 USD 498.488 260
. -
498488 2.60 -. .
RABOBANK NED.O% 07-1 1.5 07 CP
650000 USD 646.030 3.37
NETHERLANDS ANTILLES
STE GENERALE 09t 07-02.04.07 CP
SWEDEN
SKANDINAV ENSKO% 07- 10.4 07 CP SVENSKA HDLSBK 0%07- 02.05.07CP SWEDBANK 0% 07-1 1 4.2007 CP
UNITED STATES ~-
BANK AMERICA O"h07-24.4 07 CP CARGILL INC 0% 07-09.04.07 CP DEXIA DELAWARE 0% 07-5.2.07 CP FIVE FINANCE 0% 07-17 4.07 CP FORTIS FDG 0% 07-10 4.07 CP
GOLDMAN S A W S 0% 07- 10.5 07CP KFW INTL FIN.O0/. 07-12.4.07 CP
MERRILL LYNCH 0% 07-20.4 07 CP NESTLE CAP.O% 07-24.04.07
CP PACCAR FIN 0% 07-20 4 07 CP
PRUDENTIAL O X 07-24.4.07 CP
STANFIELD VICT.O%07-21.5.07 CP UBS FIN DEL.O% 07-24 4.07 CP
646,030 3 37 ~ -~
700,000 US0 699694 364
699,694 364 -. .~
429,000 USD 428,310 223
700,000 USD 696,6A7 363
700.000 USD 698.780 364
1,823 737 9.50
350000 USD
700.000 USD
700,noo USD
700.000 US0
495,000 USD
300,000 US0
600000 USD
470,000 USD
600000 US0
700,000 USD
700000 US0
600.000 USD
300,000 US0
348 724
698,984
696,644
698,169
494 206
298.213
598 867
468.572
597.829
697.724
697.458
595,441
298.909
1.82
3.65
3.63
3.64
2.57
I 55
3.12
2.44
3.1 1
3.63
3.63
3.10
1 56
Description Face Value Currency Evaluation % net assets
-~ .-
WHISTLEJACKET 0% 12 4 07 505,000 USD 503449 262 DCP
7,693,189 40 07 ~. ~
TOTAL COMMERCIAL PAPER 18.060.710 94.09
TOTAL FINANCIAL INSTRUMENTS - 18,060,710 94 09
TOTALINVESTMENTS 19,160,989 . 99.82
- 35,149 0.18 OTHER NET ASSETS LESS LIABILITIES
TOTALNETASSETS 19,196,l 18 100.00
HSBC Global Investment Funds . ...

.~
Portfolio of Investments and Other Net Assets
TURKISH CONVERGENCE Statement of investments as at 31 March 2007 (expressed in EUR)
- - Description QuantityiFace Currency Evaluallon % net
Value assets
INVESTMENTS
TRANSFERABLE SECURITIES ADMITTED TO AN OFFICIAL STOCK EXCHANGE LISTING
SHARES
TURKEY - AKBANK
AKCANSA CIMENTO SANAYl VE TIC AKSIGORTA
ALARKO GAYRIMENKUL YATlRlM ALARKO HLD
ANADOLU EFES BlRAClLlK VE MALT ARCELIK AS
AYAN ENERJI AS
AYGAZ
BOLU CIMENTO SANAYI AS
CIMSA CIMENTO SANAYI VE TICAR. DOGAN SIRKETLER GRUBU HOLDINGS DOGAN YAYIN HOLDING
DOEUS OTOMOTIV SERVIS VE TICAR ECZAClBASl ILAC
ENKA INSMT VE SANAYI AS
FORD OTOMOTIV SANAYl AS
KOC HLD AS
MIGROS TURKEY T.A.S
SELCUK ECZA DEP.TICARET SANAY TAV HAVALIMALARI HOLDING AS TOFAS TURK OTOMOBIL FABRlKASl TUPRAS TURKIYE PETROL RAFINEL TURK DEMIR DOKUM
TURK EKONOMI BANKASI AS
TURK SlSE CAM
TURKIYE IS BANKASI AS C
TURKIYE VA4FLAR BANKASI TAO VESTEL BEYAZ ESA TICAR SANAYI VESTEL ELEYTR.SANAYI TICARET YAP1 KREDI BANKASA
YAZICILAR HOLD ANOMIN SlRKETl YAZlClLAR HOLDING ANONIM SIRKE
TOTAL SHARES
400,000
131,196
49,425
35 373
448 4aa
24611
120 492
129,874
200,000
50.000
48,561
200.000
100,000
50.00U
700,000
50,000
a i 344
ao,ooo 102 710
100 000
175.000
52,542
90.000
75,000
345
100,000
600,000
100,000
652.935
150.000
750.000
125,190
17,527
TRY
TRY
TRY
TRY
TRY
TRY
TRY
TRY
TRY
TRY
TRY
TRY
TRY
TRY
TRY
TRY
TRY
TRY
TRY
TRY
TRY
TRY
TRY
TRY
TRY
TRY
TRY
TRY
TRY
TRY
TRY
TRY
TRY
1,989.300
613,464
180.345
607111
a19.445
605 331
615.520
130,583
417,321
68 E52
261,194
250.825
278,394
171.631
2,497,438
500.028
540.858
349.789
774,097
332 451
I ,097 358
150,534
1,532 518
478.405
4 103
289,205
2,173,094
iaa.119
a50,wa
2 a a . m
1,191 958
598,915
92,851
3 90
1.20
0 35
1.19
1.61
119
1.21
0.26
0.82
0 13
0.51
0 49
0.55
0.34
4.89
0.98
1.06
0.69
1 52
0.65
2 15
0.30
3 01
0.94
0.01
0.57
4 26
0.37
1.67
0.57
2.34
1.17
0.18
~- 20,940 130 41 08
20,940,130 41.08 -
Description QuanUtylFace Currency Evaluation % net Value assets
- - BONDS
TURKEY
TURKEY TV 05-ia.a.10 2.000.000 TRY 1,118.575 2.19
TURKEY TV 06-02 07 oa ~ I R 6,100.000 TRY 3,308,995 6.49
TURKEY TV 07-26.02.14 2,000000 TRY 1.101.590 2.16
TURKEY 0% 05-09.05 07 700,000 TRY 371.800 0.73
(RBG) TURKEY 0% 06-05 09.07
TURKEY 0% 06-13.06.07 TRY 100 TURKEY 0% 06-16.7.0a
TURKEY O Y ~ 07-26.11.oa
TURKEY 14% 06-19.01.11
TURKEY 15% 5-10.2 10
TURKEY 16% 07-7.3.12
TURKEY 20% 04-17.10 07
TOTAL BONDS
TREASURY BILLS
1,000.000
500,000
900.000
1,300,000
600,000
200.000
8.ow,ooo 6 aoomo
TRY
TRY
TRY
TRY
TRY
TRY
TRY
TRY
-
500,801
261,293
383,830
520.458
2a6,092
100,213
4 056,383
3.723 612
15,733,642
15,733,642 -. -
o 9a
0.51
0 75
1 02
0.56
0 20
7.97
7 30
30.86
30.86
~
.-
TURKEY -
TURKEY 0% 06-4 4 07 TB 1000000 TRY 516202 101
516,202 101
TOTAL TREASURY BILLS 516,202 I 0 1
TOTAL TRANSFERABLE SECURITIES ADMITTED TO AN OFFICIAL STOCK EXCHANGE LISTING 37,109,974 7295 OTHER TRANSFERABLE SECURITES
~
-
TREASURY BILLS
TURKEY - _ TURKEY 0% 06-12 12 2007 TB 10,000 000 TRY 4,764 590 9 35
4,764,590 9 35
TOTAL TREASURY BILLS 4,764,590 9 35
TOTAL OTHER TRANSFERABLE SECURITIES 4,764,590 9.3$
-
TOTAL INVESTMENTS 41,954,564- 82.30
OTHER NET ASSETS LESS LIABILITIES -. 9,023,887 17.70
TOTALNETASSETS 50,978,451 1.00.00
HSBC Global Investment Funds - . - . .. A.
Portfolio of Investments and Other Net Assets .~
The detailed list of movements in the investment portfolio can be obtained free of charge upon request at the registered office of the Company. The current prospectus, the articles of association as well as the interim report and the audited annual report are available free of charge upon request from the German payment and information office.
HSBC Global Investment Funds .~ ~

Currency Conversion Table
.. -. ._
...
To help shareholders to calculate the performance of their individual investment, in the relevant reference currency, we have produced the following table. It shows the value of one US Dollar against various currencies (as at the given dates).
AUD
CAD
H KD
J PY
GBP
SGD
CHF EUR
I
31 March 2006
USD
1.3975
1.1619
7.7599
1 17.4349
0.5737
1.6181
1.2999
0.8238
31 March 2007
USD
1.2384
1.1546
7.8146
11 7.8550
0.5095
1.5166
1.2177
0.7499
A - HSBC Global Investment Funds . . ~ ~-

-
Dealing Day of the Fund -
Dealing for Shares of the Company will take place on any Business Day (a day on which banks are open for normal banking business in Luxembourg) other than days during a period of suspension of dealing in Shares provided that, for sub-funds materially invested in markets other than North or South American markets, such Business Day is a day where stock exchanges and regulated markets in countries where the sub-fund is materially invested are open for normal trading. For sub-funds materially invested in North or South American markets, dealing for Shares of the sub-fund will take place on any Business Day (other than days during a period of suspension of dealing in Shares) except a Business Day following the day where stock exchanges and regulated markets in such countries were closed for normal trading.
Shareholders who deal through the Company’s local distributor or representative should note that there will be no dealing for the Shares of the Company in the jurisdiction in which such distributor or representative operates on a day which is not a business day in such jurisdiction.
The Company will determine the dealinglnon-dealing calendar according to the latest market information obtained by the Company from time to time. Shareholders can obtain the latest dealinglnon-dealing calendar of the Company from the registered office of the Company or from the Company’s local distributor or representative.
HSBC Global Investment Funds -

b Dealing Day of the Fund (continued)
FUND NON-DEALING DAYS FOR 2007
All HSBC Global Investment Funds sub-funds will have non-dealing days on the following days:
all Saturdays and Sundays
and
on the following dates:
01 January 06 April 09 April 01 May 17 May 28 May 15 August 01 November 25 December 26 December
(Luxembourg public holiday) (Luxembourg public holiday) (Luxembourg public holiday) (Luxembourg public holiday) (Luxembourg public holiday) (Luxembourg public holiday) (Luxembourg public holiday) (Luxembourg public holiday) (Luxembourg public holiday) (Luxembourg public holiday)
In addition the following sub-funds will have non-dealing days on the following dates (reason in brackets):
Asia ex Japan Equity, Asia ex Japan Equity Smaller Companies, Asia Freestyle (Public holiday in Hong Kong, Korea, and Taiwan)
16 February 19 February 20 February 21 February 22 February 23 February 28 February 01 March 05 April 24 May 06 June 18 June 19 June 02 July 17 July 24 September 25 September 26 September 01 October 03 October 10 October 19 October
Taiwan Hong Kong, Taiwan, Korea Hong Kong, Taiwan Taiwan Taiwan Taiwan Taiwan Korea Hong Kong, Taiwan Hong Kong, Korea Korea Taiwan Hong Kong, Taiwan Hong Kong Korea Korea. Taiwan Korea, Taiwan Hong Kong, Korea Hong Kong Korea Taiwan Hong Kong
Asia Pacific ex Japan Equity High Dividend (Public holiday in Hong Kong, Korea, Singapore, and Taiwan)
02January 16February 19February 20February 21 February 22February 23February 28February 01 March 05 April
Singapore Taiwan Hong Kong, Korea, Singapore, Taiwan Hong Kong, Singapore, Taiwan Taiwan Taiwan Taiwan Taiwan Korea Hong Kong, Taiwan
HSBC Global Investment Funds
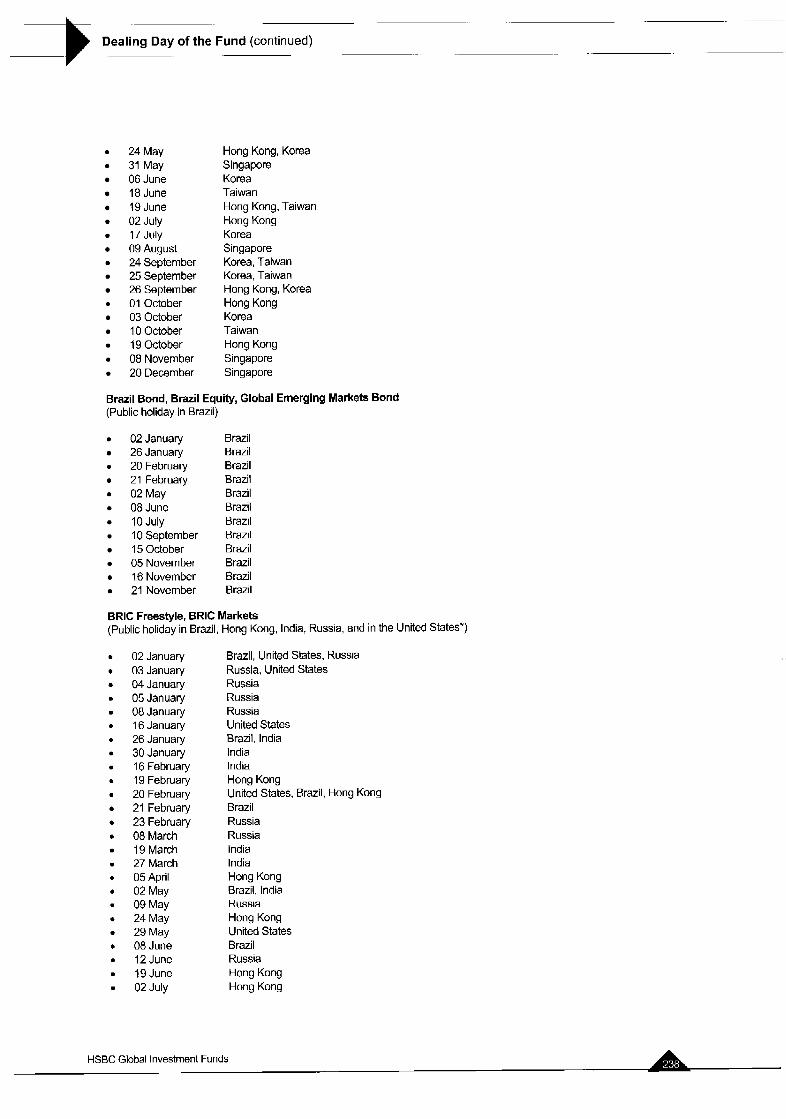
.- .. . -
Dealing Day of the Fund (continued) -
24May 31 May O6June 18June 19June 02 July 17 July 09August 24 September 25 September 26 September 01 October 03October 10October 19October 08November 20December
Hong Kong, Korea Singapore Korea Taiwan Hong Kong, Taiwan Hong Kong Korea Singapore Korea, Taiwan Korea, Taiwan Hong Kong, Korea Hong Kong Korea Taiwan Hong Kong Singapore Singapore
Brazil Bond, Brazil Equity, Global Emerging Markets Bond (Public holiday in Brazil)
02January 26January 20February 21 February 02May 08June 10 July 10 September I 5 October 05November 16 November 21 November
Brazil Brazil Brazil Brazil Brazil Brazil Brazil Brazil Brazil Brazil Brazil Brazil
BRlC Freestyle, BRlC Markets (Public holiday in Brazil, Hong Kong, India, Russia, and in the United States*)
02 January 03 January 04 January 05 January 08 January 16 January 26 January 30 January 16 February I 9 February 20 February 21 February 23 February 08 March 19 March 27 March 05 April 02 May 09 May 24 May 29 May 08 June 12 June 19 June 02 July
Brazil, United States, Russia Russia, United States Russia Russia Russia United States Brazil, India India India Hong Kong United States, Brazil, Hong Kong Brazil Russia Russia India India Hong Kong Brazil, India Russia Hong Kong United States Brazil Russia Hong Kong Hong Kong
HSBC Global Investment Funds

...
Dealing Day of the Fund (continued)
05 July I O July 20August 04 September 10 September 26 September 01 October 02October 15October 19 October 05November 09November 16 November 21 November 23Novernber
United States Brazil India United States Brazil Hong Kong Hong Kong India Brazil Hong Kong Brazil, Russia India Brazil Brazil United States
BRlC Markets Equity (Public holiday in Brazil, Hong Kong, India. Great Britain and in the United States*)
02January 03January 16 January 26January 3OJanuary 16 February 19February 20February
0 21 February 19 March 27March 05 April 02May 07May 24May 29May 08June 19June 02 July 05 July 10 July 20August 27August 04 September 10 September 26 September 01 October 02October 15October 19October 05November 09November 16Novernber 21 November 23November
Brazil, United States United States United States Brazil, India India India Hong Kong Brazil, Hong Kong, United States Brazil India India Hong Kong Brazil, India Great Britain Hong Kong United States Brazil Hong Kong Hong Kong United States Brazil India Great Britain United States Brazil Hong Kong Hong Kong India Brazil Hong Kong Brazil India Brazil Brazil United States
Chinese Equity, Hong Kong Equity (Public holiday in Hong Kong)
0 19 February Hong Kong 20February Hong Kong 05April Hong Kong 24May Hong Kong
HSBC Global Investment Funds
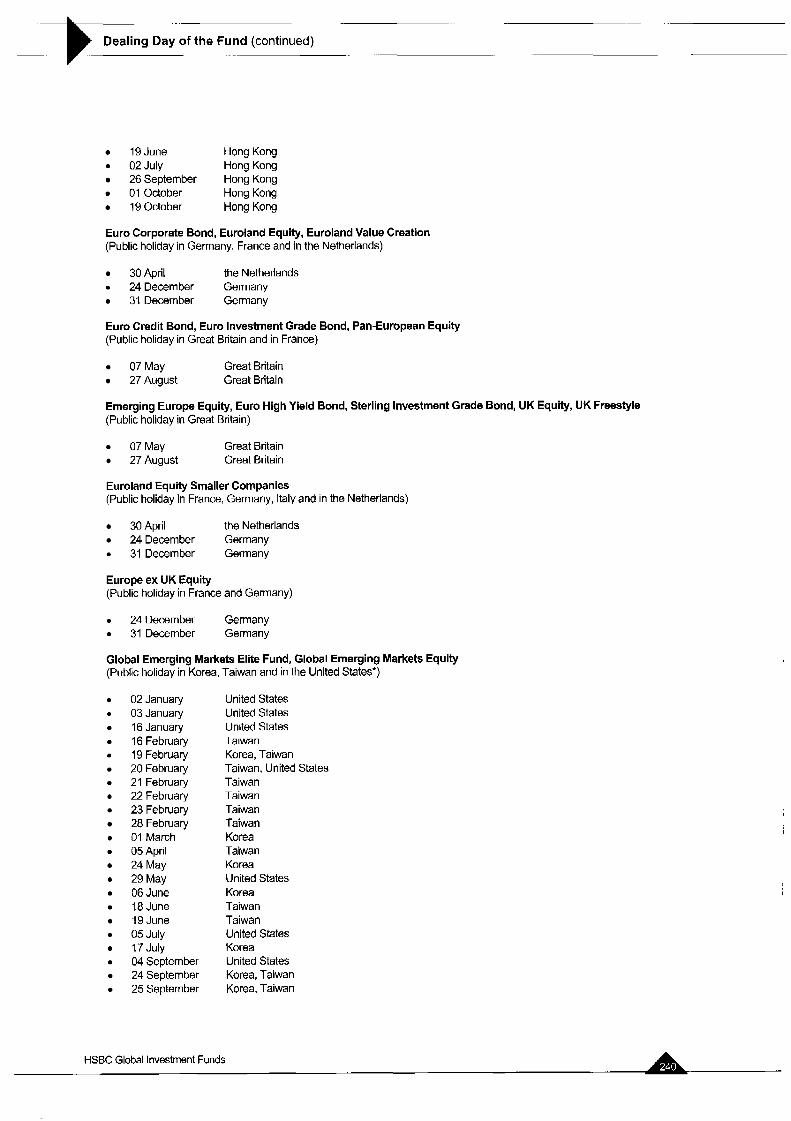
Dealing Day of the Fund (continued) ... .. .
19June Hong Kong 02 July Hong Kong 26 September Hong Kong 01 October Hong Kong 19 October Hong Kong
Euro Corporate Bond, Euroland Equity, Euroland Value Creation (Public holiday in Germany, France and in the Netherlands)
30 April the Netherlands 0 24December Germany
31 December Germany
Euro Credit Bond, Euro Investment Grade Bond, Pan-European Equity (Public holiday in Great Britain and in France)
07May Great Britain 27August Great Britain
Emerging Europe Equity, Euro High Yield Bond, Sterling Investment Grade Bond, UK Equity, UK Freestyle (Public holiday in Great Britain)
07May Great Britain 27August Great Britain
Euroland Equity Smaller Companies (Public holiday in France, Germany, Italy and in the Netherlands)
30 April the Netherlands 24December Germany
0 31 December Germany
Europe ex UK Equity (Public holiday in France and Germany)
0 24December Germany 31 December Germany
Global Emerging Markets Elite Fund, Global Emerging Markets Equity (Public holiday in Korea, Taiwan and in the United States')
02January 0 03January
16 January 16Febnrary
0 19 February 20February 21 February 22February 23February 28February 01 March 05 April 24May 29May O6June 18June 19June 05 July 17 July 04 September 24 September 25 September
United States United States United States Taiwan Korea, Taiwan Taiwan, United States Taiwan Taiwan Taiwan Taiwan Korea Taiwan Korea United States Korea Taiwan Taiwan United States Korea United States Korea, Taiwan Korea, Taiwan
HSBC Global Investment Funds

.. -
Dealing Day of the Fund (continued) -
26September Korea 03October Korea 10October Taiwan 23 November United States
Global Emerging Markets Equity Freestyle (Public holiday in Korea, Great Britain, and in the United States')
rn 02January 03January 16January
rn 19February 20February
rn 01 March 07May 24May
0 29May 0 O6June
05 July 17 July 27August 04 September 24 September 25 September 26 September 03October 23November
United States United States United States Korea United States Korea Great Britain Korea United States Korea United States Korea Great Britain United States Korea Korea Korea Korea United States
Global Equity (Public holiday in Japan, and in the United States*)
02January 03January 08January 16 January 12 February
rn 20February 21 March 30April 03May
0 04May 29May 05 July 16 July 04 September 17 September 24 September 08October 23November 24 December 31 December
United States, Japan United States, Japan Japan United States Japan United States Japan Japan Japan Japan United States United States Japan United States Japan Japan Japan Japan, United States Japan Japan
Global Equity SRI, Global ex Euroland Equity, Global Equity Technology, US Dollar Reserve, US Equity, US Index (Public holiday in the United States*)
02January United States 03January United States
rn 16January United States 20February United States 29May United States 05 July United States 04 September United States
HSBC Global Investment Funds I

Dealing Day of the Fund (continued) .
23 November United States
Global Investment Grade Bond (Public holiday in Germany, Italy, Japan”, France, Great Britain and in the United States*)
02January 08January 16January
0 12 February e 20February
21 March 30April 03May 04May 07May 29May 05 July 16 July 27August
0 04 September 17 September 24 September 08October 09October 13 November 23November 24December 31 December
United States Japan United States Japan United States Japan Japan Japan Japan Great Britain United States United States Japan Great Britain United States Japan Japan Japan United States’ United States* Japan, United States Germany, Japan Germany, Japan
a Exposure to Japan was below 20% for the holiday announced on 3 January - the sub-fund did not observe this date as a non-dealing day.
Indian Equity (Public holiday in India)
26 January 30 January 16 February 19 March 27 March 02 May 20 August 02 October 09 November
Japanese Equity (Public holiday in Japan)
02January 03January 08January 12February 21 March 30 April 03May
e 04May 16 July 17 September 24 September 08October 23November 24December 31 December
India India India India India India India India India
Japan Japan Japan Japan Japan Japan Japan Japan Japan Japan Japan Japan Japan Japan Japan
HSBC Global Investment Funds

Dealing Day of the Fund (continued) - .
Korean Equity (Public holiday in Korea)
19 February 01 March 24 May 06 June 17 July 24 September 25 September 26 September 03 October
Korea Korea Korea Korea Korea Korea Korea Korea Korea
Latin American Freestyle (Public holiday in Argentina, Brazil, Chile and Mexico)
0 02January 26January 06February 20February 21 February 20March 03 April 02May 22May O5June 08June 19June 03 July I O July 16August 21 August 10 September 19 September 20 September 15October 16October 02November 05November 16November 20November 21 November 13December
Argentina, Brazil, Chile, Mexico Brazil Mexico Brazil Brazil Mexico Argentina Argentina, Brazil, Chile, Mexico Chile Chile Brazil Argentina Chile Argentina, Brazil Chile Argentina Brazil Chile Chile Brazil Argentina, Chile Chile Brazil, Mexico Brazil Mexico Brazil Mexico
Pan-European Equity High Dividend (Public holiday Germany, France and Great Britain)
07May Great Britain 27August Great Britain 24December Germany 31 December Germany
Singapore Equity (Public holiday in Singapore)
02January Singapore 19 February Singapore 20February Singapore 31 May Singapore 09August Singapore 08 November Singapore 20 December Singapore
HSBC Global Investment Funds I
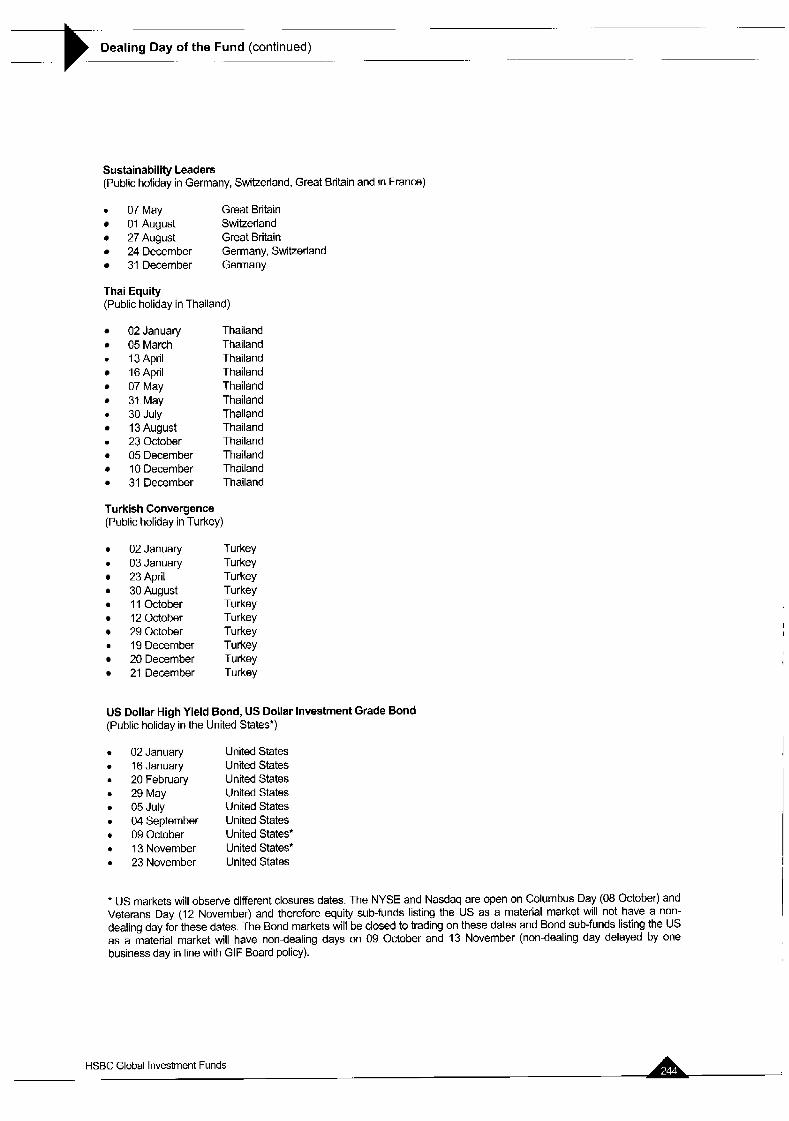
.~
Dealing Day of the Fund (continued)
Sustainability Leaders (Public holiday in Germany, Switzerland, Great Britain and in France)
0 07May Great Britain 01 August Switzerland 27August Great Britain 24 December Germany, Switzerland 31 December Germany
Thai Equity (Public holiday in Thailand)
0
0
0
02 January 05 March 13 April 16 April 07 May 31 May 30 July 13 August 23 October 05 December 10 December 31 December
Thailand Thailand Thailand Thailand Thailand Thailand Thailand Thailand Thailand Thailand Thailand Thailand
Turkish Convergence (Public holiday in Turkey)
02January 0 03January
23 April 30August 11 October 12October 29October
0 19 December 20December 21 December
Turkey Turkey Turkey Turkey Turkey Turkey Turkey Turkey Turkey Turkey
US Dollar High Yield Bond, US Dollar Investment Grade Bond (Public holiday in the United States")
02 January 16 January 20 February 29 May 05 July 04 September 09 October 13 November 23 November
United States United States United States United States United States United States United States* United States* United States
+ US markets will observe different closures dates. The NYSE and Nasdaq are open on Columbus Day (08 October) and Veterans Day (12 November) and therefore equity sub-funds listing the US as a material market will not have a non- dealing day for these dates. The Bond markets will be closed to trading on these dates and Bond sub-funds listing the US as a material market will have non-dealing days on 09 October and 13 November (non-dealing day delayed by one business day in line with GIF Board policy).
HSBC Global Investment Funds

- -
Dealing Day of the Fund (continued) _. -
Shareholders who deal through the Company’s local distributor or representative should note that there will be no dealing for the Shares of the Company in the jurisdiction in which such distributor or representative operates on a day which is not a business day in such jurisdiction.
The Company will determine the dealinghon-dealing calendar according to the latest market information obtained by the Company from time to time. Shareholders can obtain the latest dealing/nondealing calendar of the Company from the registered ofke of the Company or from the Company’s local distributor or representative.
HSBC Global Investment Funds