Embed Size (px)
Citation preview

HSA Profile: BarrePeriod: Jan. 2015 - Dec. 2015 Profile Type: Adults (18+ Years)
Welcome to the 2015 Blueprint HospitalService Area (HSA) Profile from the
Blueprint for Health, a state-ledinitiative transforming the way that
health care and comprehensive healthservices are delivered in Vermont. The
Blueprint is leading a transition to anenvironment where all Vermonters
have access to a continuum ofseamless, effective, and preventive
health services.
Blueprint HSA Profiles are basedprimarily on data from Vermont's
all-payer claims database, the VermontHealth Care Uniform Reporting andEvaluation System (VHCURES). Datainclude all covered commercial, Full
Medicaid, and Medicare members attributed to Blueprint practices that
began participating on or beforeDecember 31, 2015.
Blueprint HSA Profiles for the adultpopulation cover members ages 18
years and older; pediatric profiles covermembers between the ages of 1 and 17years. Practices have been rolled up to
the HSA level.
Utilization and expenditure ratespresented in these profiles have been
risk adjusted for demographic andhealth status differences among the
reported populations.
These profiles use three key sources ofdata: VHCURES, the Blueprint clinicaldata registry, and the Behavioral Risk
Factor Surveillance Study (BRFSS), atelephone survey conducted annually
by the Vermont Department of Health.
This reporting includes only memberswith a visit to a primary care physician,
as identified in VHCURES claims data,during the current reporting yearor the year prior. Rates for HSAs
reporting fewer than 30 members for ameasure are not presented in
alignment with NCQA HEDIS guidelines.
Demographics & Health Status
HSA Statewide
Average Members 28,408 258,837
Average Age 50.3 50.0
% Female 54.5 54.7
% Medicaid 17.2 20.6
% Medicare 26.8 26.8
% Maternity 1.3 1.4
% with Selected Chronic Conditions 41.7 39.9
Health Status (CRG)
% Healthy 30.9 32.9
% Acute or Minor Chronic 15.0 15.3
% Moderate Chronic 26.1 26.2
% Significant Chronic 26.6 24.2
% Cancer or Catastrophic 1.3 1.4
Table 1: This table provides comparative information on the demographics and health status ofthe specified HSA and of the state as a whole. Included measures reflect the types of informationused to generate adjusted rates: age, gender, maternity status, and health status.
Average Members serves as this table's denominator and adjusts for partial lengths ofenrollment during the year. In addition, special attention has been given to adjusting forMedicaid and Medicare. This includes adjustment for each member's enrollment in Medicaid orMedicare, the member's HSA's percentage of membership that was Medicaid or Medicare,Medicare disability or end-stage renal disease status, and the degree to which the memberrequired special Medicaid services that are not found in commercial populations (e.g., daytreatment, residential treatment, case management, school-based services, and transportation).
The % with Selected Chronic Conditions measure indicates the proportion of members identifiedthrough the claims data as having one or more of seven selected chronic conditions: asthma,chronic obstructive pulmonary disease, congestive heart failure (CHF), coronary heart disease,hypertension, diabetes, and depression.
The Health Status (CRG) measure aggregates 3M™ Clinical Risk Grouper (CRG) classifications forthe year for the purpose of generating adjusted rates. Aggregated risk classification groupsinclude: Healthy, Acute (e.g., ear, nose, throat infection) or Minor Chronic (e.g., minor chronicjoint pain), Moderate Chronic (e.g., diabetes), Significant Chronic (e.g., diabetes and CHF), andCancer (e.g., breast cancer, colorectal cancer) or Catastrophic (e.g., HIV, muscular dystrophy,cystic fibrosis). CRG identification was enhanced using additional diagnostic and pharmacyinformation for CY2015 reporting, resulting in fewer healthy members and more members withchronic and other conditions.

HSA Profile: BarrePeriod: Jan. 2015 - Dec. 2015 Profile Type: Adults (18+ Years)
Total Expenditures per Capita
Figure 1: Presents annual risk-adjusted rates, including 95% confidenceintervals, with expenditures capped statewide for outlier patients.Expenditures include both plan payments and member out-of-pocketpayments (i.e., copay, coinsurance, and deductible). The blue dashed lineindicates the statewide average.
Total Expenditures per Capita by Major Category
Total Expenditures per Capita (Excluding SMS)
Figure 3: Presents annual risk-adjusted rates, including 95% confidenceintervals, with expenditures capped statewide for outlier patients.Expenditures include both plan payments and member out-of-pocketpayments (i.e., copay, coinsurance, and deductible) and exclude SpecialMedicaid Services. The blue dashed line indicates the statewide average.
Total Resource Use Index (RUI) (Excluding SMS)
Figure 4: Presents annual risk-adjusted rates, including 95% confidenceintervals. Since price per service varies widely, a measure of expenditures basedon resource use — Total Resource Use Index (RUI) — is included. RUI reflects anaggregated capped cost based on utilization and intensity of services acrossmajor components of care and excludes Special Medicaid Services. The HSAs areindexed to the statewide average (1.00), which is indicated by the blue dashedline.
Figure 2: Presents annual risk-adjusted rates for the major components of cost (asshown in Figure 1) with expenditures capped statewide for outlier patients. Someservices provided by Medicaid (e.g., case management, transportation) arereported separately as Special Medicaid Services (SMS).

HSA Profile: BarrePeriod: Jan. 2015 - Dec. 2015 Profile Type: Adults (18+ Years)
Annual Total Expenditures per Capita vs. Resource Use Index (RUI)
Annual TotalExpenditures
per Capita,Excluding SMS
(Adjusted)
r-square =27.7%
Annual Total Resource Use Index (Adjusted)
Legend
Barre
All other Blueprint HSAs statewide
Figure 5: This graphic demonstrates the relationship between risk-adjusted expenditures, excluding SMS, and risk-adjustedutilization for each of the HSAs in Vermont. This graphic illustrates the specified HSA's risk-adjusted rate (i.e., the red dot)compared to those of all other HSAs statewide (i.e., the blue dots). The dashed lines show the average expenditures percapita and average Resource Use Index statewide (i.e., 1.0). HSAs with higher expenditures and utilization are in the upperright-hand quadrant, while HSAs with lower expenditures and utilization are in the lower left-hand quadrant. An RUI valuegreater than 1.0 indicates higher than average utilization; conversely, a value lower than 1.0 indicates lower than averageutilization. A trend line has been included in the graphic, which demonstrates that, in general, HSAs with higherrisk-adjusted utilization had higher risk-adjusted expenditures.

HSA Profile: BarrePeriod: Jan. 2015 - Dec. 2015 Profile Type: Adults (18+ Years)
Inpatient Discharges
Figure 6: Presents annual risk-adjusted rates, including 95% confidenceintervals, of inpatient discharges per 1,000 members. Additional detailmeasures for inpatient utilization — Inpatient Days, and Preventive QualityIndicators — can be found in Table 6. The blue dashed line indicates thestatewide average.
Outpatient ED Visits
Figure 7: Presents annual risk-adjusted rates, including 95% confidenceintervals, of outpatient emergency department (ED) visits per 1,000 members.An additional detail measure — Outpatient Potentially Avoidable ED Visits — can be found in Table 5. The blue dashed line indicates the statewide average.
Advanced Imaging (MRIs, CT Scans)
Figure 8: Presents annual risk-adjusted rates, including 95% confidence intervals, of advanced imagingdiagnostic tests (i.e., magnetic resonance imagings (MRIs) and computed tomography (CT) scans) per 1,000members. The blue dashed line indicates the statewide average.

HSA Profile: BarrePeriod: Jan. 2015 - Dec. 2015 Profile Type: Adults (18+ Years)
Diabetes: HbA1c Testing
Figure 9: Presents the proportion, including 95% confidence intervals, ofcontinuously enrolled members with diabetes, ages 18–75 years, that receiveda hemoglobin A1c test during the measurement year. The blue dashed lineindicates the statewide average.
Diabetes: HbA1c Not in Control (Core-17, MSSP-27)
Figure 10: Presents the proportion, including 95% confidence intervals, ofcontinuously enrolled members with diabetes, ages 18–75 years, whose lastrecorded hemoglobin A1c test in the Blueprint clinical data registry was in poorcontrol (>9%). Members with diabetes were identified using claims data. Thedenominator was then restricted to those with clinical results for at least onehemoglobin A1c test during the measurement year. The blue dashed lineindicates the statewide average.
Diabetes: Eye Exam
Figure 11: Presents the proportion, including 95% confidence intervals, ofcontinuously enrolled members with diabetes, ages 18–75 years, that receivedan eye screening for diabetic retinal disease during the measurement year.The blue dashed line indicates the statewide average.
Diabetes Care Two-Part Composite (Core-53)
Figure 12: Presents the proportion, including 95% confidence intervals, ofcontinuously enrolled members with diabetes, ages 18–75 years, that had avalid HbA1c ≤9% and received an eye screening for diabetic retinal diseaseduring the measurement year. The blue dashed line indicates the statewideaverage.

HSA Profile: BarrePeriod: Jan. 2015 - Dec. 2015 Profile Type: Adults (18+ Years)
Comparison of Patients by HbA1c Control Status, Statewide
Metric Diabetes A1c in ControlDiabetes A1c Not in
Control
Members 5619 786
Annual expendituresper capita
$15,726 ($15,219, $16,233) $17,328 ($16,110, $18,546)
Inpatienthospitalizations per1,000 members
189.7 (178.2, 201.1) 253.1 (217.7, 288.6)
Inpatient days per1,000 members
868.5 (844.0, 893.0) 1,156.1 (1,080.4, 1,231.8)
Outpatient ED visitsper 1,000 members
627.5 (606.7, 648.3) 801.1 (738.1, 864.2)
Note: Risk-adjusted rates with 95% confidence intervals are provided in parentheses.Outliers beyond the 99th percentile have been excluded.
Table 2: Presents a comparison of health care expenditures and utilization inthe measurement year for continuously enrolled members, ages 18–75 years,whose diabetes hemoglobin A1c was in control (≤9%) compared to those withpoor control (>9%). Rates have been adjusted for age, gender, and healthstatus. The rates in this table are presented at the state level only. Memberswith poor control had statistically significant higher total expenditures,inpatient hospitalizations, inpatient days, and outpatient ED visits.
Diabetes: Nephropathy
Figure 13: Presents the proportion, including 95% confidence intervals, ofcontinuously enrolled members with diabetes, ages 18–75 years, that had anephropathy screening test or evidence of nephropathy documented in theclaims data. The blue dashed line indicates the statewide average.
Diabetes: Tobacco Non-Use (MSSP-25)
Figure 14: Presents the proportion, including 95% confidence intervals, ofcontinuously enrolled members with diabetes, ages 18–75 years, documentedas tobacco non-users in the Blueprint clinical data registry. Members withdiabetes were identified using claims data. The denominator was thenrestricted to those with clinical results for tobacco non-use during themeasurement year. The blue dashed line indicates the statewide average.
Diabetes: Blood Pressure in Control (MSSP-24)
Figure 15: Presents the proportion, including 95% confidence intervals, ofcontinuously enrolled members with diabetes, ages 18–75 years, whose lastrecorded blood pressure measurement in the Blueprint clinical data registry wasin control (<140/90 mmHg). Members with diabetes were identified using claimsdata. The denominator was then restricted to those with clinical results for atleast one blood pressure test during the measurement year. The blue dashed lineindicates the statewide average.

HSA Profile: BarrePeriod: Jan. 2015 - Dec. 2015 Profile Type: Adults (18+ Years)
Linked Clinical Data: Obesity, Hypertension, & HbA1c
Measure (N = Count of distinct members)
HSAN=29,739
StatewideN=271,430
Rate % Rate %
% linked to clinical data 86% 47%
% with BMI data 76% 40%
% meeting obesity criteria 39% 39%
% with blood pressure data 83% 43%
% meeting hypertension criteria 16% 19%
% with BMI and blood pressure data 76% 39%
% meeting obesity and hypertension criteria 8% 10%
Measure(N = Count of distinct members with diabetes)
HSAN=2,633
StatewideN=22,302
Rate % Rate %
% linked to clinical data 97% 59%
% with BMI data 94% 50%
% meeting obesity criteria 71% 69%
% with blood pressure data 96% 53%
% meeting hypertension criteria 22% 27%
% with valid HbA1c 77% 38%
% with HbA1c >9% 9% 5%
Table 3: Presents the proportion of total distinct members and distinct members withdiabetes with claims linked to clinical data, valid body mass index (BMI), blood pressure,and HbA1c data meeting the criteria for obesity (BMI ≥ 30.0), hypertension (mmHg ≥140/90), and HbA1c >9%.
Hypertension: Blood Pressure in Control (Core-39, MSSP-28)
Figure 16: Presents the proportion, including 95% confidence intervals, ofcontinuously enrolled members with hypertension, ages 18–85 years, whose lastrecorded blood pressure measurement in the Blueprint clinical data registry wasin control (<140/90 mmHg). Members with hypertension were identified usingclaims data. The denominator was then restricted to those with clinical resultsfor a blood pressure reading during the measurement year. The blue dashed lineindicates the statewide average.

HSA Profile: BarrePeriod: Jan. 2015 - Dec. 2015 Profile Type: Adults (18+ Years)
Imaging Studies for Low Back Pain
Figure 17: Presents the proportion, including 95% confidence intervals, ofcontinuously enrolled members, ages 18–50 years, that received a primarydiagnosis of low back pain and appropriately did not have an imaging study(e.g., plain X-Ray, CT scan, MRI) within 28 days of the diagnosis. This is aninverted measure for which a higher score indicates appropriate treatment(i.e., imaging did not occur). The blue dashed line indicates the statewideaverage.
Cervical Cancer Screening (Core-30)
Figure 18: Presents the proportion, including 95% confidence intervals, ofcontinuously enrolled female members, ages 21–64 years, that received one ormore Papanicolaou (Pap) tests to screen for cervical cancer during themeasurement year or the two years prior to the measurement year. The bluedashed line indicates the statewide average.
Chlamydia Screening (Core-7)
Figure 19: Presents the proportion, including 95% confidence intervals, ofcontinuously enrolled women, ages 16–24 years, identified as sexually activeduring the measurement year that received at least one test for chlamydiaduring the measurement year or the year prior to the measurement year.(Note that, due to the age ranges for this ACO measure, women below the ageof 18 years, not typically represented in adult profiles, have been included inthese rates.) The blue dashed line indicates the statewide average.
Breast Cancer Screening (Core-11, MSSP-20)
Figure 20: Presents the proportion, including 95% confidence intervals, ofcontinuously enrolled women, ages 52–64 years, that had a mammogram toscreen for breast cancer during the measurement year or the year prior to themeasurement year. The blue dashed line indicates the statewide average.

HSA Profile: BarrePeriod: Jan. 2015 - Dec. 2015 Profile Type: Adults (18+ Years)
Plan All-Cause Readmissions (Core-1)
Figure 21: Presents the relative rate, including 95% confidence intervals, ofcontinuously enrolled members, ages 18 years and older, that had aninpatient stay that was followed by an acute readmission for any diagnosiswithin 30 days during the measurement year. The rate is expressed as a ratioof observed to expected readmissions where the expected number ofreadmissions has been risk adjusted. The blue dashed line indicates thestatewide average. HEDIS specifications have changed.
Follow-Up After Hospitalization for Mental Illness (Core-4)
Figure 22: Presents the proportion, including 95% confidence intervals, ofcontinuously enrolled members, ages 6 years and older, hospitalized for mentalillness with an intensive outpatient encounter or partial hospitalization with amental health practitioner and a follow-up visit within seven days of discharge.The blue dashed line indicates the statewide average.
Initiation of Alcohol/Drug Treatment (Core-5a)
Figure 23: Presents the proportion, including 95% confidence intervals, ofcontinuously enrolled members, ages 18 years and older, that had their initialtreatment through an inpatient alcohol or other drug (AOD) admission,outpatient visit, intensive outpatient encounter, or partial hospitalizationwithin 14 days of the diagnosis. The blue dashed line indicates the statewideaverage.
Engagement of Alcohol/Drug Treatment (Core-5b)
Figure 24: Presents the proportion, including 95% confidence intervals, ofcontinuously enrolled members, ages 18 years and older, that had their initialtreatment and then had two or more additional services with a diagnosis of AODwithin 30 days of the initiation visit. The blue dashed line indicates the statewideaverage.

HSA Profile: BarrePeriod: Jan. 2015 - Dec. 2015 Profile Type: Adults (18+ Years)
Cholesterol Management, Cardiac (Core-3, MSSP-29)
Figure 25: Presents the proportion, including 95% confidence intervals, ofcontinuously enrolled members, ages 18–75 years, discharged alive aftertreatment for acute myocardial infarction (AMI), coronary artery bypassgrafting (CABG), or percutaneous coronary intervention (PCI) in the year priorto the measurement year or with a diagnosis of ischemic vascular disease(IVD) during the measurement year and year prior and with an LDL-C screeningduring the measurement year. The blue dashed line indicates the statewideaverage.
Avoidance of Antibiotic Treatment, Acute Bronchitis (Core-6)
Figure 26: Presents the proportion, including 95% confidence intervals, ofcontinuously enrolled members, ages 18–64 years, that received a diagnosis ofacute bronchitis but was not dispensed an antibiotic prescription. The bluedashed line indicates the statewide average.
Influenza Vaccination (Core-35, MSSP-14)
Figure 27: Presents the proportion, including 95% confidence intervals, ofcontinuously enrolled members, ages six months and older, that received aninfluenza immunization from October 1 of the prior year through March 31 ofthe measurement year. Immunizations were identified in the medical claimsor, if available, in the Blueprint clinical data registry. The blue dashed lineindicates the statewide average.
Pneumonia Vaccination (Core-48, MSSP-15)
Figure 28: Presents the proportion, including 95% confidence intervals, ofVermont residents, ages 65 years and older, that reported ever receiving apneumonia vaccination as measured by the Behavioral Risk Factor SurveillanceSystem (BRFSS). The blue dashed line indicates the statewide average.

HSA Profile: BarrePeriod: Jan. 2015 - Dec. 2015 Profile Type: Adults (18+ Years)
ACS Admissions: COPD & Asthma (Core-10, MSSP-9)
Figure 29: This Prevention Quality Indicator (PQI) presents the rate, including95% confidence intervals, of ambulatory care sensitive (ACS) admissions witha principal diagnosis of chronic obstructive pulmonary disorder (COPD) orasthma per 1,000 members, ages 40 years and older. The blue dashed lineindicates the statewide average.
ACS Admissions: Heart Failure (MSSP-10)
Figure 30: This Prevention Quality Indicator (PQI) presents the rate, including95% confidence intervals, of admissions with a principal diagnosis of congestiveheart failure per 1,000 members, ages 18 years and older. The blue dashed lineindicates the statewide average.
ACS Hospitalizations: PQI Composite Chronic (Core-12)
Figure 31: This Prevention Quality Indicator (PQI) presents a composite rate, including 95% confidence intervals, of hospitalizations for chronic conditions per 1,000members, ages 18 years and older. This measure includes admissions for at least one of the following conditions: COPD, asthma, hypertension, heart failure, angina withouta cardiac procedure, diabetes with lower-extremity amputations, diabetes with short-term complications, diabetes with long-term complications, or uncontrolled diabeteswithout complications. The blue dashed line indicates the statewide average.

HSA Profile: BarrePeriod: Jan. 2015 - Dec. 2015 Profile Type: Adults (18+ Years)
BRFSS: Households with Income <$25,000
Figure 32: Presents the proportion, including 95% confidence intervals, ofVermont residents, ages 18 years and older, that reported a household incomeof less than $25,000 per year. This data was collected through the BehavioralRisk Factor Surveillance System (BRFSS). The blue dashed line indicates thestatewide average.
BRFSS: Cigarette Smoking
Figure 33: Presents the proportion, including 95% confidence intervals, ofVermont residents, ages 18 years and older, that reported being cigarettesmokers. This data was collected through the Behavioral Risk Factor SurveillanceSystem (BRFSS). The blue dashed line indicates the statewide average.
BRFSS: No Leisure-Time Physical Activity/Exercise
Figure 34: Presents the proportion, including 95% confidence intervals, ofVermont residents, ages 18 years and older, that said they did not participatein any physical activity or exercise during the previous month. This data wascollected through the Behavioral Risk Factor Surveillance System (BRFSS). Theblue dashed line indicates the statewide average.
BRFSS: Meets Fruit/Vegetable Recommendations
Figure 35: Presents the proportion, including 95% confidence intervals, ofVermont residents, ages 18 years and older, that said they met fruit andvegetable consumption recommendations. This data was collected through theBehavioral risk Factor Surveillance System (BRFSS). The blue dashed lineindicates the statewide average.

HSA Profile: BarrePeriod: Jan. 2015 - Dec. 2015 Profile Type: Adults (18+ Years)
The following tables provide greater detail on the annual rates presented in the preceding figures.
Table 4. Expenditure Measures (Adjusted)
MeasureHSA Statewide
Rate per Capita 95% LCL 95% UCL Rate per Capita 95% LCL 95% UCL
Total $7,783 $7,629 $7,937 $8,059 $8,008 $8,110
Inpatient Total $1,533 $1,439 $1,628 $1,508 $1,477 $1,539
Inpatient Mental Health $86 $66 $106 $80 $74 $86
Inpatient Maternity $98 $91 $106 $91 $89 $94
Inpatient Surgical $536 $474 $599 $646 $623 $668
Inpatient Medical $813 $751 $875 $701 $682 $720
Outpatient Total $2,078 $2,030 $2,125 $2,117 $2,101 $2,132
Outpatient Hospital Mental Health $31 $28 $34 $30 $29 $31
Outpatient Hospital ED $268 $258 $279 $309 $305 $313
Outpatient Hospital Surgery $410 $388 $432 $503 $495 $511
Outpatient Hospital Radiology $463 $431 $495 $491 $481 $501
Outpatient Hospital Laboratory $357 $349 $366 $296 $293 $298
Outpatient Hospital Pharmacy $95 $85 $106 $81 $78 $85
Outpatient Hospital Other $461 $449 $474 $421 $417 $425
Professional Non-Mental Health Total $1,302 $1,281 $1,322 $1,434 $1,427 $1,441
Professional Physician Total $897 $881 $913 $926 $920 $931
Professional Physician Inpatient $153 $143 $164 $164 $160 $167
Professional Physician Outpatient Facility $321 $313 $329 $301 $299 $304
Professional Physician Office Visit $354 $347 $360 $386 $384 $388
Professional Non-Physician $392 $383 $400 $494 $491 $497
Professional Mental Health Provider $187 $180 $194 $180 $177 $182
Pharmacy Total $1,404 $1,362 $1,446 $1,475 $1,460 $1,489
Pharmacy Psych Medication $185 $175 $196 $192 $189 $196
Other Total $762 $718 $806 $797 $781 $812
Special Medicaid Services $394 $356 $431 $358 $346 $369
Mental Health Substance Combined* $460 $442 $478 $455 $449 $461
* The Mental Health Substance Combined measure is the sum of all expenditures associated with medical and pharmacy services for mental health / substance abuse.
Table 5. Total Resource Use Index (RUI) (Adjusted)
MeasureHSA Statewide
Index Ratio 95% LCL 95% UCL Index Ratio 95% LCL 95% UCL
Total 0.97 0.95 0.99 1.00 0.99 1.01
Inpatient 0.96 0.90 1.02 1.00 0.98 1.02
Outpatient Facility 0.98 0.95 1.00 1.00 0.99 1.01
Professional 0.92 0.91 0.94 1.00 1.00 1.00
Pharmacy 1.04 1.01 1.06 1.00 0.99 1.01

HSA Profile: BarrePeriod: Jan. 2015 - Dec. 2015 Profile Type: Adults (18+ Years)
Table 6. Utilization Measures (Adjusted)
MeasureHSA Statewide
Rate per 1,000 95% LCL 95% UCL Rate per 1,000 95% LCL 95% UCL
Inpatient Discharges 102.4 98.6 106.1 102.8 101.6 104.1
Inpatient Days 497.7 489.5 505.9 487.9 485.2 490.6
Outpatient ED Visits 382.1 374.9 389.3 407.6 405.1 410.0
Outpatient Potentially Avoidable ED Visits 58.3 55.5 61.1 62.6 61.7 63.6
Non-Hospital Outpatient Visits 6,873.6 6,843.1 6,904.1 7,043.9 7,033.7 7,054.1
Primary Care Encounters 3,242.0 3,221.0 3,262.9 3,077.2 3,070.4 3,083.9
Medical Specialist Encounters 1,055.6 1,043.7 1,067.6 1,157.6 1,153.5 1,161.8
Surgical Specialist Encounters 989.5 978.0 1,001.1 1,019.0 1,015.1 1,022.9
Standard Imaging 983.3 971.8 994.9 979.4 975.6 983.2
Advanced Imaging 274.2 268.1 280.3 282.3 280.3 284.4
Echography 317.6 311.1 324.2 352.4 350.1 354.7
Colonoscopy 51.0 48.4 53.6 55.8 54.9 56.7
Table 7. Effective & Preventive Care Measures
MeasureHSA Statewide
N Rate % 95% LCL 95% UCL N Rate % 95% LCL 95% UCL
Comprehensive Diabetes Care (CDC)
HbA1c Testing 2,567 93% 92% 94% 21,811 89% 88% 89%
Eye Exam 2,567 47% 45% 49% 21,811 49% 48% 49%
Nephropathy 2,567 70% 68% 71% 21,811 69% 68% 69%
Imaging Studies for Low Back Pain 485 84% 81% 88% 4,214 83% 82% 84%
HSA Profile: BarrePeriod: Jan. 2015 - Dec. 2015 Profile Type: Adults (18+ Years)
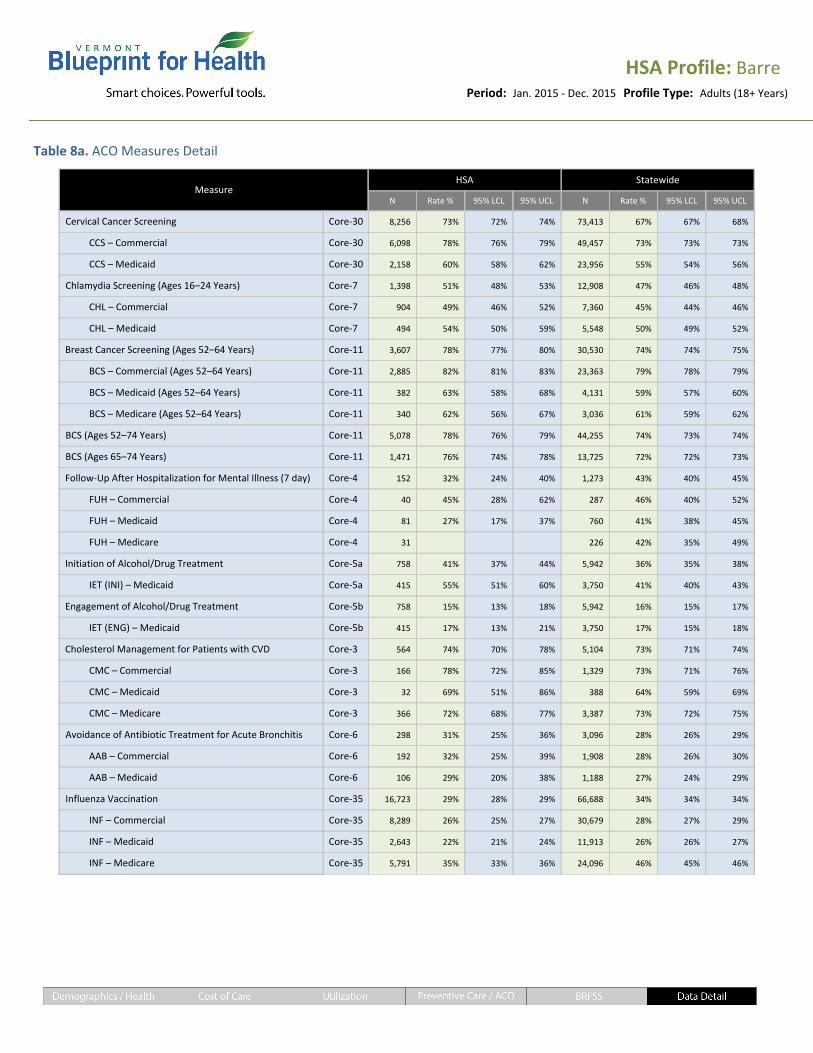
Table 8a. ACO Measures Detail
MeasureHSA Statewide
N Rate % 95% LCL 95% UCL N Rate % 95% LCL 95% UCL
Cervical Cancer Screening Core-30 8,256 73% 72% 74% 73,413 67% 67% 68%
CCS – Commercial Core-30 6,098 78% 76% 79% 49,457 73% 73% 73%
CCS – Medicaid Core-30 2,158 60% 58% 62% 23,956 55% 54% 56%
Chlamydia Screening (Ages 16–24 Years) Core-7 1,398 51% 48% 53% 12,908 47% 46% 48%
CHL – Commercial Core-7 904 49% 46% 52% 7,360 45% 44% 46%
CHL – Medicaid Core-7 494 54% 50% 59% 5,548 50% 49% 52%
Breast Cancer Screening (Ages 52–64 Years) Core-11 3,607 78% 77% 80% 30,530 74% 74% 75%
BCS – Commercial (Ages 52–64 Years) Core-11 2,885 82% 81% 83% 23,363 79% 78% 79%
BCS – Medicaid (Ages 52–64 Years) Core-11 382 63% 58% 68% 4,131 59% 57% 60%
BCS – Medicare (Ages 52–64 Years) Core-11 340 62% 56% 67% 3,036 61% 59% 62%
BCS (Ages 52–74 Years) Core-11 5,078 78% 76% 79% 44,255 74% 73% 74%
BCS (Ages 65–74 Years) Core-11 1,471 76% 74% 78% 13,725 72% 72% 73%
Follow-Up After Hospitalization for Mental Illness (7 day) Core-4 152 32% 24% 40% 1,273 43% 40% 45%
FUH – Commercial Core-4 40 45% 28% 62% 287 46% 40% 52%
FUH – Medicaid Core-4 81 27% 17% 37% 760 41% 38% 45%
FUH – Medicare Core-4 31 226 42% 35% 49%
Initiation of Alcohol/Drug Treatment Core-5a 758 41% 37% 44% 5,942 36% 35% 38%
IET (INI) – Medicaid Core-5a 415 55% 51% 60% 3,750 41% 40% 43%
Engagement of Alcohol/Drug Treatment Core-5b 758 15% 13% 18% 5,942 16% 15% 17%
IET (ENG) – Medicaid Core-5b 415 17% 13% 21% 3,750 17% 15% 18%
Cholesterol Management for Patients with CVD Core-3 564 74% 70% 78% 5,104 73% 71% 74%
CMC – Commercial Core-3 166 78% 72% 85% 1,329 73% 71% 76%
CMC – Medicaid Core-3 32 69% 51% 86% 388 64% 59% 69%
CMC – Medicare Core-3 366 72% 68% 77% 3,387 73% 72% 75%
Avoidance of Antibiotic Treatment for Acute Bronchitis Core-6 298 31% 25% 36% 3,096 28% 26% 29%
AAB – Commercial Core-6 192 32% 25% 39% 1,908 28% 26% 30%
AAB – Medicaid Core-6 106 29% 20% 38% 1,188 27% 24% 29%
Influenza Vaccination Core-35 16,723 29% 28% 29% 66,688 34% 34% 34%
INF – Commercial Core-35 8,289 26% 25% 27% 30,679 28% 27% 29%
INF – Medicaid Core-35 2,643 22% 21% 24% 11,913 26% 26% 27%
INF – Medicare Core-35 5,791 35% 33% 36% 24,096 46% 45% 46%

HSA Profile: BarrePeriod: Jan. 2015 - Dec. 2015 Profile Type: Adults (18+ Years)
Table 8a. ACO Measures Detail, Continued
MeasureHSA Statewide
N Rate % 95% LCL 95% UCL N Rate % 95% LCL 95% UCL
Diabetes Blood Pressure in Control (<140/90 mmHg) MSSP-24 2,366 76% 75% 78% 9,093 73% 72% 74%
Diab – Commercial (BP) MSSP-24 838 78% 75% 81% 2,949 74% 72% 75%
Diab – Medicaid (BP) MSSP-24 298 78% 73% 83% 1,312 73% 70% 75%
Diab – Medicare (BP) MSSP-24 1,230 75% 72% 77% 4,832 72% 71% 74%
Diabetes Care Two-Part Composite Core-53 2,010 42% 39% 44% 6,880 45% 44% 46%
Diab – Commercial (Comp.) Core-53 660 34% 30% 37% 2,100 37% 35% 39%
Diab – Medicaid (Comp.) Core-53 227 38% 31% 44% 851 40% 37% 43%
Diab – Medicare (Comp.) Core-53 1,123 47% 44% 50% 3,929 50% 49% 52%
Diabetes HbA1c Not in Control (>9%) Core-17 1,856 11% 9% 12% 6,458 12% 11% 13%
Diab – Commercial (HbA1c Not in Control) Core-17 656 12% 9% 15% 2,091 15% 13% 16%
Diab – Medicaid (HbA1c Not in Control) Core-17 225 20% 15% 25% 848 20% 17% 22%
Diab – Medicare (HbA1c Not in Control) Core-17 975 8% 6% 9% 3,519 9% 8% 10%
Hypertension with BP in Control (<140/90 mmHg) Core-39 4,745 74% 72% 75% 16,402 68% 67% 69%
HYP – Commercial (Ages 18–85 Years) Core-39 2,332 71% 70% 73% 7,820 67% 66% 68%
HYP – Medicaid (Ages 18–85 Years) Core-39 597 74% 70% 77% 2,510 65% 63% 67%
HYP – Medicare (Ages 18–85 Years) Core-39 1,816 77% 75% 79% 6,072 71% 70% 72%
HYP (Ages 18–64 Years) Core-39 3,300 72% 70% 73% 11,629 67% 66% 68%
HYP (Ages 65–85 Years) Core-39 1,433 78% 76% 80% 4,731 72% 70% 73%

HSA Profile: BarrePeriod: Jan. 2015 - Dec. 2015 Profile Type: Adults (18+ Years)
Table 8b. ACO Measures Detail
Measure
HSA Statewide
NObserved / Expected
Ratio LCL UCL NObserved / Expected
Ratio LCL UCL
Plan All-Cause Readmissions Core-1 3,020 1.04 0.92 1.16 26,387 1.06 1.02 1.10
PCR – Commercial Core-1 468 1.08 0.76 1.41 3,599 1.30 1.19 1.42
PCR – Medicaid Core-1 376 0.91 0.67 1.15 3,673 0.90 0.83 0.98
PCR – Medicare Core-1 2,176 1.08 0.93 1.24 19,115 1.08 1.03 1.13
Table 8c. ACO Measures Detail
Measure
HSA Statewide
NRate per
1,000 95% LCL 95% UCL NRate per
1,000 95% LCL 95% UCL
ACS Admissions for COPD and Asthma Core-10 20,023 3.2 2.4 4.0 178,616 3.6 3.3 3.8
PQI – Commercial (COPD and Asthma) Core-10 10,490 0.3 0.0 0.6 87,339 0.4 0.2 0.5
PQI – Medicaid (COPD and Asthma) Core-10 2,153 3.7 1.1 6.3 23,603 5.1 4.2 6.0
PQI – Medicare (COPD and Asthma) Core-10 7,380 7.2 5.2 9.1 67,674 7.1 6.5 7.8
ACS Admissions for Congestive Heart Failure MSSP-10 28,408 3.2 2.5 3.8 258,837 3.0 2.8 3.2
PQI – Commercial (CHF) MSSP-10 15,826 0.4 0.1 0.8 134,903 0.3 0.2 0.4
PQI – Medicaid (CHF) MSSP-10 4,914 2.4 1.1 3.8 53,763 1.0 0.7 1.3
PQI – Medicare (CHF) MSSP-10 7,668 9.3 7.1 11.4 70,171 9.9 9.1 10.6
ACS Hospitalizations: PQI Composite (Chronic) Core-12 28,408 7.6 6.6 8.6 258,837 7.3 7.0 7.6
PQI – Commercial (Comp.) Core-12 15,826 1.2 0.7 1.7 134,903 1.0 0.8 1.2
PQI – Medicaid (Comp.) Core-12 4,914 9.2 6.5 11.8 53,763 6.3 5.7 7.0
PQI – Medicare (Comp.) Core-12 7,668 19.7 16.6 22.8 70,171 20.1 19.1 21.2

HSA Profile: BarrePeriod: Jan. 2015 - Dec. 2015 Profile Type: Adults (18+ Years)
Table 9. ACO Measures Reference Table
VT Measure IDMedicare SharedSavings Program
Measure IDMeasure Name
NationallyRecognized/
Endorsed
Included in HSAProfile?
Measure Description
Core-1Plan All-CauseReadmissions
NQF #1768, HEDISmeasure
Adult
For members 18 years and older, the number of acuteinpatient stays during the measurement year that werefollowed by an acute readmission for any diagnosis within30 days.
Core-2Adolescent Well-CareVisit
HEDIS measure PediatricThe percentage of members 12-21 years who had at leastone comprehensive well-care visit with a PCP or OB/GYNduring the measurement year.
Core-3 MSSP-29
Ischemic VascularDisease (IVD):Complete Lipid Panel(Screening Only)
NQF #0075, NCQA Adult
The percentage of members 18-75 years who weredischarged alive for acute myocardial infarction, coronaryartery bypass grafting, or percutaneous coronaryintervention in the year prior to the measurement year orwho had a diagnosis of Ischemic Vascular Disease duringthe measurement year and one year prior, who had LDL-Cscreening.
Core-4Follow-up afterHospitalization forMental Illness, 7 Day
NQF #0576, HEDISmeasure
Adult
The percentage of discharges for members 6 years andolder who were hospitalized for treatment of selectedmental illness diagnoses and who had an outpatient visit,an intensive outpatient encounter, or partialhospitalization with a mental health practitioner.
Core-5
Initiation &Engagement ofAlcohol and OtherDrug DependenceTreatment (a)Initiation, (b)Engagement
NQF #0004, HEDISmeasure
Adult
(a) The percentage of adolescent and adult members witha new episode of alcohol or other drug (AOD) dependencewho received initiation of AOD treatment within 14 days.(b) The percentage of adolescent and adult members witha new episode of alcohol or other drug (AOD) dependencewho initiated treatment and had two additional serviceswith a diagnosis of AOD within 30 days of the initiationvisit.
Core-6
Avoidance ofAntibiotic Treatmentfor Adults with AcuteBronchitis
NQF #0058, HEDISmeasure
AdultThe percentage of adults 18-64 years with a diagnosis ofacute bronchitis who were not dispensed an antibiotic.
Core-7Chlamydia Screeningin Women
NQF #0033, HEDISmeasure
Adult and PediatricThe percentage of women 16-24 years who were identifiedas sexually active and who had at least one test forchlamydia during the measurement period.
Core-8DevelopmentalScreening in the FirstThree Years of Life
NQF #1448 Pediatric
The percentage of children screened for risk ofdevelopmental, behavioral, and social delays using astandardized screening tool in the 12 months precedingtheir first, second, or third birthday.
Core-10 MSSP-9
Ambulatory SensitiveCondition Admissions:Chronic ObstructivePulmonary Disease orAsthma in OlderAdults
NQF, AHRQ (Prevention QualityIndicator (PQI) #5)
Adult
All discharges with an ICD-9-CM principal diagnosis codefor COPD or asthma in adults ages 40 years and older, forACO assigned or aligned Medicare fee-for-service (FFS)beneficiaries with COPD or asthma. This is an observed rateof discharges per 1,000 members.
Core-11 MSSP-20Mammography /Breast CancerScreening
NQF #2372, HEDISmeasure
AdultThe percentage of women 50-74 years who had amammogram to screen for breast cancer in the last twoyears.
Core-12
Rate ofHospitalization forAmbulatory CareSensitive Conditions:PQI ChronicComposite
NQF, AHRQ (Prevention QualityIndicator (PQI)Chronic Composite)
Adult
Prevention Quality Indicators' (PQI) overall composite per1,000 population, ages 18 years and older; includesadmissions for one of the following conditions: diabeteswith short-term complications, diabetes with long-termcomplications, uncontrolled diabetes withoutcomplications, diabetes with lower-extremity amputation,chronic obstructive pulmonary disease, asthma,hypertension, heart failure, angina without a cardiacprocedure, dehydration, bacterial pneumonia, or urinarytract infection.
HSA Profile: BarrePeriod: Jan. 2015 - Dec. 2015 Profile Type: Adults (18+ Years)
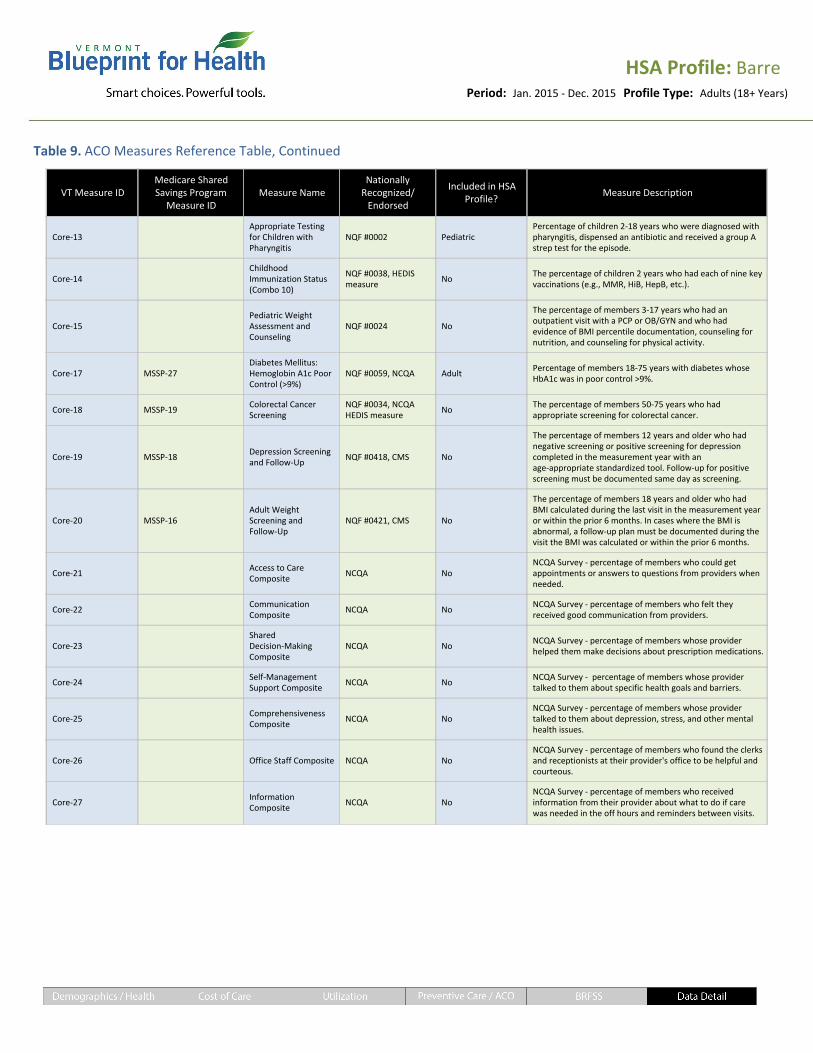
Table 9. ACO Measures Reference Table, Continued
VT Measure IDMedicare SharedSavings Program
Measure IDMeasure Name
NationallyRecognized/
Endorsed
Included in HSAProfile?
Measure Description
Core-13Appropriate Testingfor Children withPharyngitis
NQF #0002 PediatricPercentage of children 2-18 years who were diagnosed withpharyngitis, dispensed an antibiotic and received a group Astrep test for the episode.
Core-14ChildhoodImmunization Status(Combo 10)
NQF #0038, HEDISmeasure
NoThe percentage of children 2 years who had each of nine keyvaccinations (e.g., MMR, HiB, HepB, etc.).
Core-15Pediatric WeightAssessment andCounseling
NQF #0024 No
The percentage of members 3-17 years who had anoutpatient visit with a PCP or OB/GYN and who hadevidence of BMI percentile documentation, counseling fornutrition, and counseling for physical activity.
Core-17 MSSP-27Diabetes Mellitus:Hemoglobin A1c PoorControl (>9%)
NQF #0059, NCQA AdultPercentage of members 18-75 years with diabetes whoseHbA1c was in poor control >9%.
Core-18 MSSP-19Colorectal CancerScreening
NQF #0034, NCQAHEDIS measure
NoThe percentage of members 50-75 years who hadappropriate screening for colorectal cancer.
Core-19 MSSP-18Depression Screeningand Follow-Up
NQF #0418, CMS No
The percentage of members 12 years and older who hadnegative screening or positive screening for depressioncompleted in the measurement year with anage-appropriate standardized tool. Follow-up for positivescreening must be documented same day as screening.
Core-20 MSSP-16Adult WeightScreening andFollow-Up
NQF #0421, CMS No
The percentage of members 18 years and older who hadBMI calculated during the last visit in the measurement yearor within the prior 6 months. In cases where the BMI isabnormal, a follow-up plan must be documented during thevisit the BMI was calculated or within the prior 6 months.
Core-21Access to CareComposite
NCQA NoNCQA Survey - percentage of members who could getappointments or answers to questions from providers whenneeded.
Core-22CommunicationComposite
NCQA NoNCQA Survey - percentage of members who felt theyreceived good communication from providers.
Core-23SharedDecision-MakingComposite
NCQA NoNCQA Survey - percentage of members whose providerhelped them make decisions about prescription medications.
Core-24Self-ManagementSupport Composite
NCQA NoNCQA Survey - percentage of members whose providertalked to them about specific health goals and barriers.
Core-25ComprehensivenessComposite
NCQA NoNCQA Survey - percentage of members whose providertalked to them about depression, stress, and other mentalhealth issues.
Core-26 Office Staff Composite NCQA NoNCQA Survey - percentage of members who found the clerksand receptionists at their provider's office to be helpful andcourteous.
Core-27InformationComposite
NCQA NoNCQA Survey - percentage of members who receivedinformation from their provider about what to do if carewas needed in the off hours and reminders between visits.

HSA Profile: BarrePeriod: Jan. 2015 - Dec. 2015 Profile Type: Adults (18+ Years)
Table 9. ACO Measures Reference Table, Continued
VT Measure IDMedicare SharedSavings Program
Measure IDMeasure Name
NationallyRecognized/
Endorsed
Included in HSAProfile?
Measure Description
Core-28Coordination of CareComposite
NCQA No
NCQA Survey - percentage of members whose providersfollowed-up about test results, seemed informed aboutspecialty care, and talked at each visit about prescriptionmedication.
Core-29 Specialist Composite NCQA No
NCQA Survey - percentage of members who found it easy toget appointments with specialists and who found that theirspecialist seemed to know important information abouttheir medical history.
Core-30Cervical CancerScreening
NQF #0032, HEDISmeasure
Adult
The percentage of females 21-64 years who received one ormore PAP tests to screen for cervical cancer in themeasurement year or two years prior to the measurementyear.
Core-31 MSSP-30
Ischemic VascularDisease (IVD): Use ofAspirin or AnotherAntithrombotic
NQF #0068, NCQA NoPercentage of members 18 years and older with IVD whohad documentation of using aspirin or anotherantithrombotic during the measurement year.
Core-35 MSSP-14 Influenza VaccinationNQF #0041,AMA-PCPI
AdultPercentage of members 6 months and older with anoutpatient visit between October and March who receivedan influenza vaccine.
Core-36 MSSP-17Tobacco UseAssessment andCessation Intervention
NQF #0028,AMA-PCPI
No
Percentage of members 18 years and older who had anegative tobacco screen or positive tobacco screen withcessation intervention in the two years prior to themeasurement year.
Core-38 MSSP-32Drug Therapy forLowering LDLCholesterol
NQF #0074 No
Percentage of members 18 years and older with a diagnosisof CAD and an outpatient visit in the measurement yearwhose LDL-C <100 mg/dL or LDL-C >=100 mg/dL and whoreceived a prescription of a statin in the measurement year.
Core-38 MSSP-33
ACE Inhibitor or ARBTherapy for Memberswith CAD andDiabetes and/or LeftVentricular SystolicDysfunction (LVSD)
NQF #0066 No
Percentage of members 18 years and older with a diagnosisof CAD and a Left Ventricular Ejection Fraction (LVEF) < 40%or diagnosis of CAD and diabetes who received aprescription of ACE/ARB medication in the measurementyear.
Core-39 MSSP-28
Percent ofBeneficiaries WithHypertension WhoseBP < 140/90 mmHg
NQF #0018, NCQAHEDIS measure
AdultPercentage of members 18-85 years with hypertensionwhose BP was in control <140/90 mmHg.
Core-40 MSSP-21
Screening for HighBlood Pressure andFollow-Up PlanDocumented
Not NQF-endorsed;MSSP
No
Percentage of members 18 years and older seen during themeasurement period who were screened for high bloodpressure and a recommended follow-up plan is documentedbased on the current blood pressure reading as indicated.
Core-47 MSSP-13Falls: Screening forFall Risk
NQF #0101 NoPercentage of members 65 years and older who had anytype of falls screening in the measurement year.
Core-48 MSSP-15PneumoniaVaccination (EverReceived)
NQF #0043 AdultThe percentage of members 65 years and older who haddocumentation of ever receiving a pneumonia vaccine.
Core-53Diabetes CareTwo-Part Composite
NQF #0059 and #0055 Adult
The percentage of members 18-75 years with diabetes whohave a valid HbA1c less than or equal to 9% and whoreceived an eye exam for diabetic retinal disease during themeasurement year.
MSSP-1
CG CAHPS: GettingTimely Care,Appointments, andInformation
NQF #0005, AHRQ NoCMS Survey - Getting Timely Care, Appointments, andInformation
MSSP-2CG CAHPS: How WellYour DoctorsCommunicate
NQF #0005, AHRQ No CMS Survey - How Well Your Doctors Communicate
HSA Profile: BarrePeriod: Jan. 2015 - Dec. 2015 Profile Type: Adults (18+ Years)
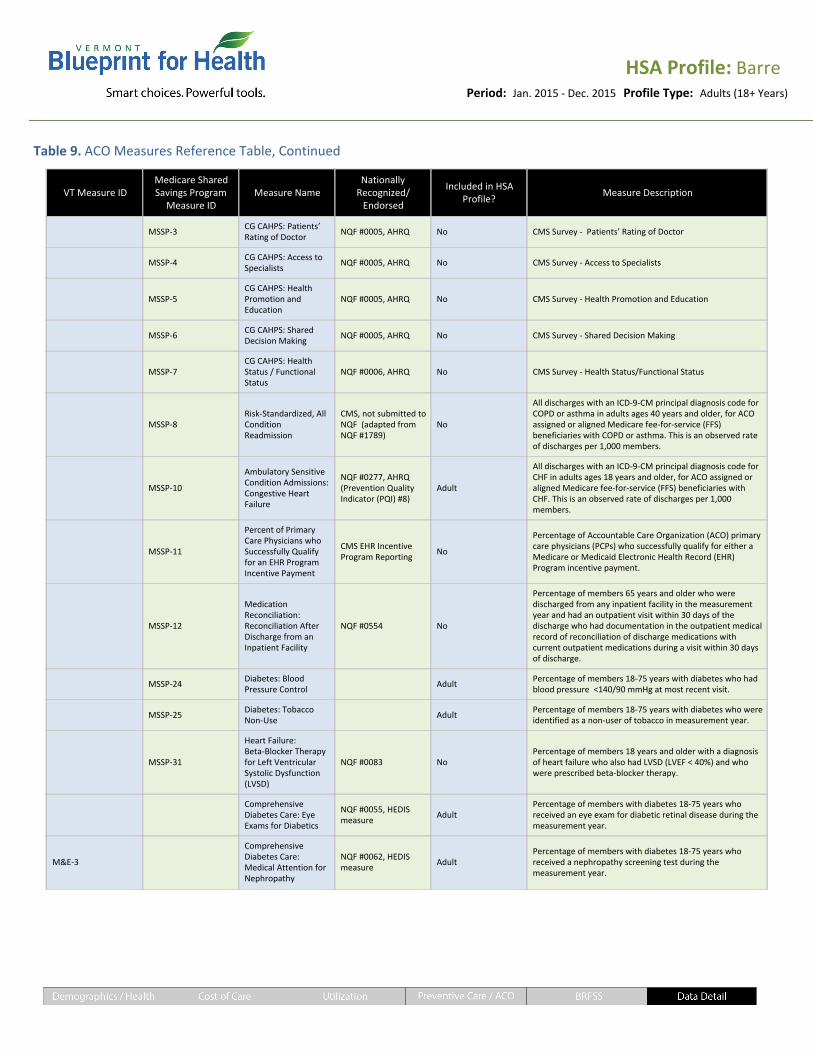
Table 9. ACO Measures Reference Table, Continued
VT Measure IDMedicare SharedSavings Program
Measure IDMeasure Name
NationallyRecognized/
Endorsed
Included in HSAProfile?
Measure Description
MSSP-3CG CAHPS: Patients’Rating of Doctor
NQF #0005, AHRQ No CMS Survey - Patients’ Rating of Doctor
MSSP-4CG CAHPS: Access toSpecialists
NQF #0005, AHRQ No CMS Survey - Access to Specialists
MSSP-5CG CAHPS: HealthPromotion andEducation
NQF #0005, AHRQ No CMS Survey - Health Promotion and Education
MSSP-6CG CAHPS: SharedDecision Making
NQF #0005, AHRQ No CMS Survey - Shared Decision Making
MSSP-7CG CAHPS: HealthStatus / FunctionalStatus
NQF #0006, AHRQ No CMS Survey - Health Status/Functional Status
MSSP-8Risk-Standardized, AllConditionReadmission
CMS, not submitted toNQF (adapted fromNQF #1789)
No
All discharges with an ICD-9-CM principal diagnosis code forCOPD or asthma in adults ages 40 years and older, for ACOassigned or aligned Medicare fee-for-service (FFS)beneficiaries with COPD or asthma. This is an observed rateof discharges per 1,000 members.
MSSP-10
Ambulatory SensitiveCondition Admissions:Congestive HeartFailure
NQF #0277, AHRQ (Prevention QualityIndicator (PQI) #8)
Adult
All discharges with an ICD-9-CM principal diagnosis code forCHF in adults ages 18 years and older, for ACO assigned oraligned Medicare fee-for-service (FFS) beneficiaries withCHF. This is an observed rate of discharges per 1,000members.
MSSP-11
Percent of PrimaryCare Physicians whoSuccessfully Qualifyfor an EHR ProgramIncentive Payment
CMS EHR IncentiveProgram Reporting
No
Percentage of Accountable Care Organization (ACO) primarycare physicians (PCPs) who successfully qualify for either aMedicare or Medicaid Electronic Health Record (EHR)Program incentive payment.
MSSP-12
MedicationReconciliation:Reconciliation AfterDischarge from anInpatient Facility
NQF #0554 No
Percentage of members 65 years and older who weredischarged from any inpatient facility in the measurementyear and had an outpatient visit within 30 days of thedischarge who had documentation in the outpatient medicalrecord of reconciliation of discharge medications withcurrent outpatient medications during a visit within 30 daysof discharge.
MSSP-24Diabetes: BloodPressure Control
AdultPercentage of members 18-75 years with diabetes who hadblood pressure <140/90 mmHg at most recent visit.
MSSP-25Diabetes: TobaccoNon-Use
AdultPercentage of members 18-75 years with diabetes who wereidentified as a non-user of tobacco in measurement year.
MSSP-31
Heart Failure:Beta-Blocker Therapyfor Left VentricularSystolic Dysfunction(LVSD)
NQF #0083 NoPercentage of members 18 years and older with a diagnosisof heart failure who also had LVSD (LVEF < 40%) and whowere prescribed beta-blocker therapy.
ComprehensiveDiabetes Care: EyeExams for Diabetics
NQF #0055, HEDISmeasure
AdultPercentage of members with diabetes 18-75 years whoreceived an eye exam for diabetic retinal disease during themeasurement year.
M&E-3
ComprehensiveDiabetes Care:Medical Attention forNephropathy
NQF #0062, HEDISmeasure
AdultPercentage of members with diabetes 18-75 years whoreceived a nephropathy screening test during themeasurement year.

HSA Profile: BarrePeriod: Jan. 2015 - Dec. 2015 Profile Type: Adults (18+ Years)
The following tables provide risk-adjusted rates for selected quality measures, which are not represented in the preceding figures.
Table 10. Risk-Adjusted Quality Measures: PQI Composite (Chronic)
HSATrend
Rate Difference
Barre -0.7
Bennington 1.0
Brattleboro 0.9
Burlington -0.3
Middlebury -3.3
Morrisville -0.8
Newport 1.1
Randolph 1.1
Rutland -2.5
Springfield -3.4
St Albans 0.5
St Johnsbury 1.4
White River Jct -1.7
HSAJul. 2014-Jun. 2015 Jan. 2015-Dec. 2015
Rate per 1,000 N Rate per 1,000 N
Barre 7.6 30,135 6.9 28,408
Bennington 7.0 15,914 8.0 14,377
Brattleboro 3.6 12,262 4.5 11,404
Burlington 6.4 80,137 6.1 80,830
Middlebury 9.5 15,558 6.2 15,280
Morrisville 8.7 15,070 7.9 15,831
Newport 7.2 11,201 8.3 11,421
Randolph 11.7 6,146 12.8 7,644
Rutland 7.5 21,453 5.0 21,341
Springfield 11.5 11,075 8.0 10,005
St Albans 5.0 18,045 5.5 18,439
St Johnsbury 5.4 11,911 6.7 12,332
White River Jct 9.2 11,065 7.4 11,524
* Cells with less than 11 in the numerator or less than 30 in the denominator are left blank due to either insufficient data or confidentiality requirements.
Table 11. Risk-Adjusted Quality Measure: Diabetes HbA1c Not in Control (>9%)
HSATrend
Rate Difference
Barre -2.5%
Bennington -1.3%
Brattleboro
Burlington -2.5%
Middlebury
Morrisville -1.6%
Newport -1.3%
Randolph
Rutland
Springfield
St Albans -0.9%
St Johnsbury -1.2%
White River Jct
HSAJul. 2014-Jun. 2015 Jan. 2015-Dec. 2015
Rate % N Rate % N
Barre 14.5% 1,791 12.0% 1,856
Bennington 13.8% 574 12.5% 441
Brattleboro 14.0% 297 30
Burlington 14.1% 1,996 11.6% 1,995
Middlebury 98
Morrisville 13.7% 411 12.1% 343
Newport 14.4% 805 13.1% 394
Randolph 37
Rutland 56
Springfield
St Albans 14.1% 1,194 13.3% 933
St Johnsbury 15.1% 395 14.0% 301
White River Jct 14.7% 167
* Cells with less than 11 in the numerator or less than 30 in the denominator are left blank due to either insufficient data or confidentiality requirements.

HSA Profile: BarrePeriod: Jan. 2015 - Dec. 2015 Profile Type: Adults (18+ Years)
Table 12. Patient Experience Survey: Access to Care Questions
Question & Answer
HSA Statewide
N %Error(+/-)
N %Error(+/-)
In the last 12 months, when you phoned this provider's office after regularoffice hours, how often did you get an answer to your medical question assoon as you needed?
Always 35 63% 17% 373 55% 5%
Usually 373 24% 4%
Never or Sometimes 373 21% 4%
In the last 12 months, when you phoned this provider's office during regularoffice hours, how often did you get an answer to your medical question thatsame day?
Always 380 62% 5% 3,015 57% 2%
Usually 380 26% 5% 3,015 29% 2%
Never or Sometimes 380 12% 3% 3,015 14% 1%
In the last 12 months, when you phoned this provider’s office to get anappointment for care you needed right away, how often did you get anappointment as soon as you needed?
Always 385 62% 5% 3,335 64% 2%
Usually 385 27% 5% 3,335 26% 1%
Never or Sometimes 385 11% 3% 3,335 10% 1%
In the last 12 months, when you phoned this provider’s office to get anappointment for a check-up or routine care with this provider, how oftendid you get an appointment as soon as you needed?
Always 643 67% 4% 5,282 69% 1%
Usually 643 26% 3% 5,282 24% 1%
Never or Sometimes 643 7% 2% 5,282 6% 1%
Wait time includes time spent in the waiting room and exam room. In thelast 12 months, how often did you see this provider within 15 minutes ofyour appointment time?
Always 854 49% 3% 7,123 43% 1%
Usually 854 38% 3% 7,123 39% 1%
Never or Sometimes 854 13% 2% 7,123 19% 1%
Patient Experience Survey: Access to Care Composite
Figure 36: Presents the composite proportion, including the 95% confidence interval, of the given response to the questions associatedwith Access to Care for members 18 years and older. The composite proportion is given by the average of the correspondingproportions of the associated questions.

HSA Profile: BarrePeriod: Jan. 2015 - Dec. 2015 Profile Type: Adults (18+ Years)
Table 13. Patient Experience Survey: Communication Questions
Question & Answer
HSA Statewide
N %Error(+/-)
N %Error(+/-)
In the last 12 months, how often did this provider give you easy tounderstand information about these health questions or concerns?
Always 701 83% 3% 5,666 82% 1%
Usually 701 13% 3% 5,666 13% 1%
Never or Sometimes 701 4% 2% 5,666 4% 1%
In the last 12 months, how often did this provider spend enough time withyou?
Always 844 84% 3% 7,027 82% 1%
Usually 844 13% 2% 7,027 14% 1%
Never or Sometimes 844 4% 1% 7,027 4% 0%
In the last 12 months, how often did this provider show respect for whatyou had to say?
Always 846 90% 2% 7,030 89% 1%
Usually 846 7% 2% 7,030 8% 1%
Never or Sometimes 846 3% 1% 7,030 3% 0%
In the last 12 months, how often did this provider seem to know theimportant information about your medical history?
Always 852 74% 3% 7,091 72% 1%
Usually 852 20% 3% 7,091 21% 1%
Never or Sometimes 852 6% 2% 7,091 7% 1%
In the last 12 months, how often did this provider listen carefully to you?
Always 855 86% 2% 7,124 85% 1%
Usually 855 10% 2% 7,124 11% 1%
Never or Sometimes 855 4% 1% 7,124 4% 0%
In the last 12 months, how often did this provider explain things in a waythat was easy to understand?
Always 855 87% 2% 7,132 84% 1%
Usually 855 11% 2% 7,132 12% 1%
Never or Sometimes 855 2% 1% 7,132 3% 0%
Patient Experience Survey: Communication Composite
Figure 37: Presents the composite proportion, including the 95% confidence interval, of the given response to the questions associatedwith Communication for members 18 years and older. The composite proportion is given by the average of the correspondingproportions of the associated questions.
HSA Profile: BarrePeriod: Jan. 2015 - Dec. 2015 Profile Type: Adults (18+ Years)
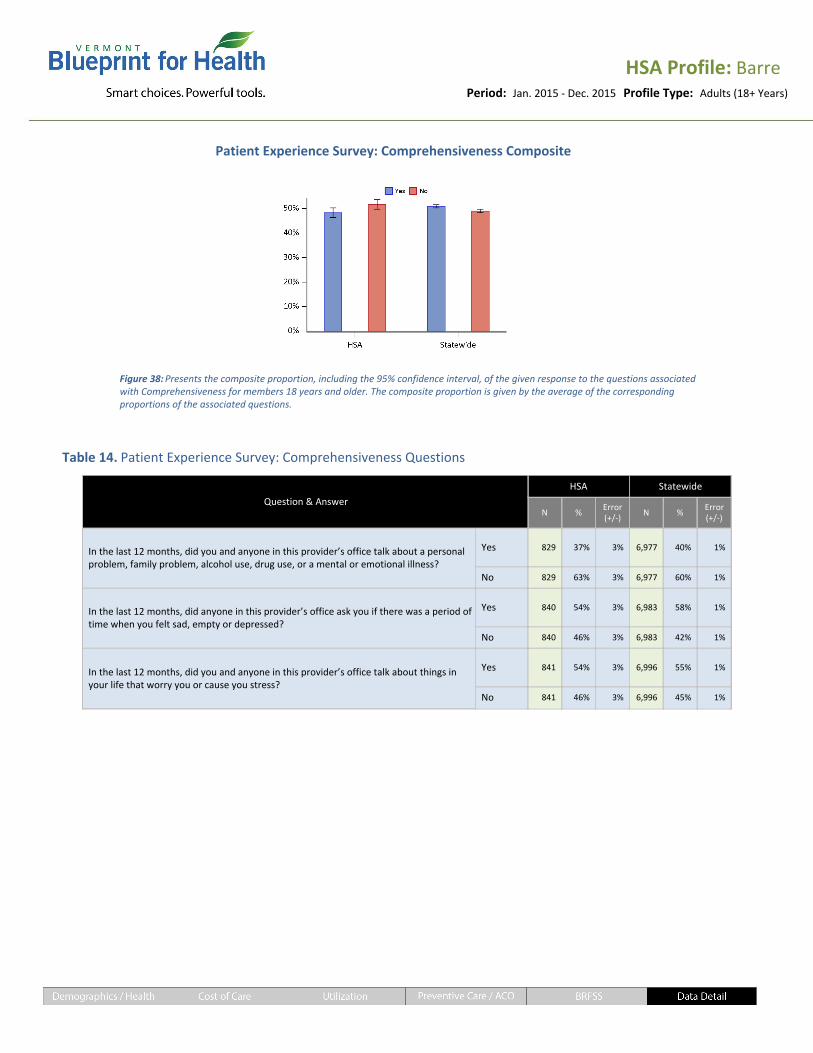
Table 14. Patient Experience Survey: Comprehensiveness Questions
Question & Answer
HSA Statewide
N %Error(+/-)
N %Error(+/-)
In the last 12 months, did you and anyone in this provider’s office talk about a personalproblem, family problem, alcohol use, drug use, or a mental or emotional illness?
Yes 829 37% 3% 6,977 40% 1%
No 829 63% 3% 6,977 60% 1%
In the last 12 months, did anyone in this provider’s office ask you if there was a period oftime when you felt sad, empty or depressed?
Yes 840 54% 3% 6,983 58% 1%
No 840 46% 3% 6,983 42% 1%
In the last 12 months, did you and anyone in this provider’s office talk about things inyour life that worry you or cause you stress?
Yes 841 54% 3% 6,996 55% 1%
No 841 46% 3% 6,996 45% 1%
Patient Experience Survey: Comprehensiveness Composite
Figure 38: Presents the composite proportion, including the 95% confidence interval, of the given response to the questions associatedwith Comprehensiveness for members 18 years and older. The composite proportion is given by the average of the correspondingproportions of the associated questions.
HSA Profile: BarrePeriod: Jan. 2015 - Dec. 2015 Profile Type: Adults (18+ Years)
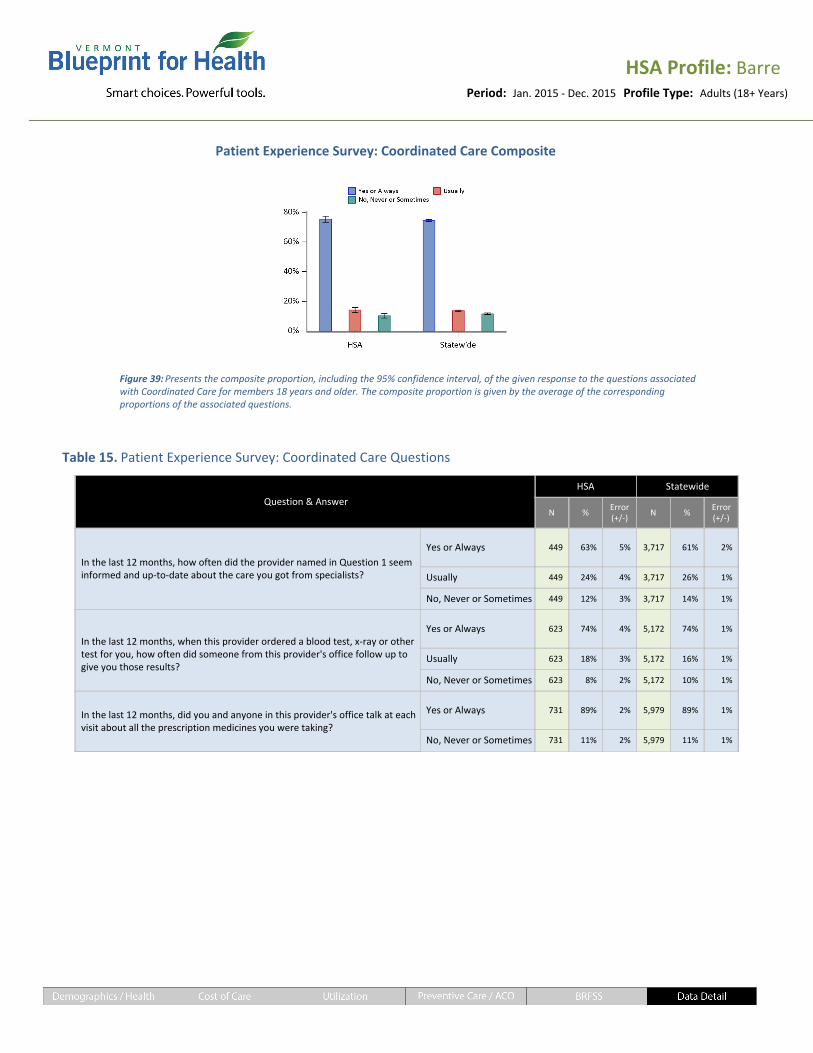
Table 15. Patient Experience Survey: Coordinated Care Questions
Question & Answer
HSA Statewide
N %Error(+/-)
N %Error(+/-)
In the last 12 months, how often did the provider named in Question 1 seeminformed and up-to-date about the care you got from specialists?
Yes or Always 449 63% 5% 3,717 61% 2%
Usually 449 24% 4% 3,717 26% 1%
No, Never or Sometimes 449 12% 3% 3,717 14% 1%
In the last 12 months, when this provider ordered a blood test, x-ray or othertest for you, how often did someone from this provider's office follow up togive you those results?
Yes or Always 623 74% 4% 5,172 74% 1%
Usually 623 18% 3% 5,172 16% 1%
No, Never or Sometimes 623 8% 2% 5,172 10% 1%
In the last 12 months, did you and anyone in this provider's office talk at eachvisit about all the prescription medicines you were taking?
Yes or Always 731 89% 2% 5,979 89% 1%
No, Never or Sometimes 731 11% 2% 5,979 11% 1%
Patient Experience Survey: Coordinated Care Composite
Figure 39: Presents the composite proportion, including the 95% confidence interval, of the given response to the questions associatedwith Coordinated Care for members 18 years and older. The composite proportion is given by the average of the correspondingproportions of the associated questions.

HSA Profile: BarrePeriod: Jan. 2015 - Dec. 2015 Profile Type: Adults (18+ Years)
Table 16. Patient Experience Survey: Office Staff Questions
Question & Answer
HSA Statewide
N %Error(+/-)
N %Error(+/-)
In the last 12 months, how often were the clerks and receptionists at thisprovider’s office as helpful as you thought they should be?
Always 844 70% 3% 7,018 71% 1%
Usually 844 25% 3% 7,018 23% 1%
Never or Sometimes 844 5% 2% 7,018 6% 1%
In the last 12 months, how often did clerks and receptionists at thisprovider’s office treat you with courtesy and respect?
Always 845 86% 2% 7,015 85% 1%
Usually 845 12% 2% 7,015 12% 1%
Never or Sometimes 845 2% 1% 7,015 3% 0%
Patient Experience Survey: Office Staff Composite
Figure 40: Presents the composite proportion, including the 95% confidence interval, of the given response to the questions associatedwith Office Staff for members 18 years and older. The composite proportion is given by the average of the corresponding proportionsof the associated questions.
HSA Profile: BarrePeriod: Jan. 2015 - Dec. 2015 Profile Type: Adults (18+ Years)
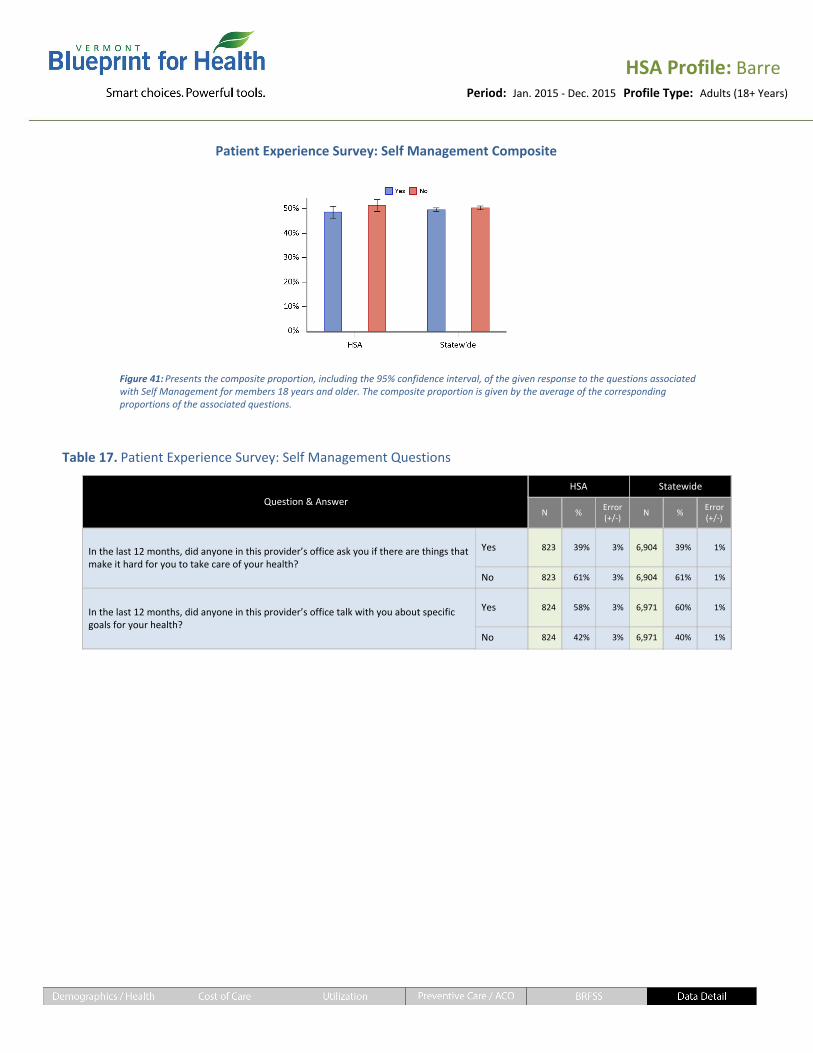
Table 17. Patient Experience Survey: Self Management Questions
Question & Answer
HSA Statewide
N %Error(+/-)
N %Error(+/-)
In the last 12 months, did anyone in this provider’s office ask you if there are things thatmake it hard for you to take care of your health?
Yes 823 39% 3% 6,904 39% 1%
No 823 61% 3% 6,904 61% 1%
In the last 12 months, did anyone in this provider’s office talk with you about specificgoals for your health?
Yes 824 58% 3% 6,971 60% 1%
No 824 42% 3% 6,971 40% 1%
Patient Experience Survey: Self Management Composite
Figure 41: Presents the composite proportion, including the 95% confidence interval, of the given response to the questions associatedwith Self Management for members 18 years and older. The composite proportion is given by the average of the correspondingproportions of the associated questions.

HSA Profile: BarrePeriod: Jan. 2015 - Dec. 2015 Profile Type: Adults (18+ Years)
Table 18. Patient Experience Survey: Shared Decision Making Questions
Question & Answer
HSA Statewide
N %Error(+/-)
N %Error(+/-)
When you talked about starting or stopping a prescription medicine, did thisprovider ask you what you thought was best for you?
Yes or Always 383 86% 4% 3,119 85% 1%
No, Never or Sometimes 383 14% 4% 3,119 15% 1%
When you talked about starting or stopping a prescription medicine, howmuch did this provider talk about the reasons you might not want to take amedicine?
Yes or Always 386 46% 5% 3,127 43% 2%
Usually 386 38% 5% 3,127 36% 2%
No, Never or Sometimes 386 16% 4% 3,127 20% 1%
When you talked about starting or stopping a prescription medicine, howmuch did this provider talk about the reasons you might want to take amedicine?
Yes or Always 393 65% 5% 3,145 65% 2%
Usually 393 30% 5% 3,145 29% 2%
No, Never or Sometimes 393 6% 2% 3,145 6% 1%
Patient Experience Survey: Shared Decision Making Composite
Figure 42: Presents the composite proportion, including the 95% confidence interval, of the given response to the questions associatedwith Shared Decision Making for members 18 years and older. The composite proportion is given by the average of the correspondingproportions of the associated questions.

HSA Profile: BarrePeriod: Jan. 2015 - Dec. 2015 Profile Type: Adults (18+ Years)
Table 19. Patient Experience Survey: Specialist Questions
Question & Answer
HSA Statewide
N %Error(+/-)
N %Error(+/-)
In the last 12 months, how often did the specialist you saw most seem toknow the important information about your medical history?
Always 376 52% 5% 3,092 52% 2%
Usually 376 31% 5% 3,092 33% 2%
Never or Sometimes 376 17% 4% 3,092 15% 1%
In the last 12 months, how often was it easy to get appointments withspecialists?
Always 394 53% 5% 3,150 52% 2%
Usually 394 31% 5% 3,150 35% 2%
Never or Sometimes 394 16% 4% 3,150 13% 1%
Patient Experience Survey: Specialist Composite
Figure 43: Presents the composite proportion, including the 95% confidence interval, of the given response to the questions associatedwith Specialists for members 18 years and older. The composite proportion is given by the average of the corresponding proportions ofthe associated questions.

HSA Profile: BarrePeriod: Jan. 2015 - Dec. 2015 Profile Type: Adults (18+ Years)
Table 20. Patient Experience Survey: Information Questions
Question & Answer
HSA Statewide
N %Error(+/-)
N %Error(+/-)
Did this provider's office give you information about what to do if you needed care duringevenings, weekends, or holidays?
Yes 841 72% 3% 7,003 72% 1%
No 841 28% 3% 7,003 28% 1%
Some offices remind patients between visits about tests, treatment or appointments. Inthe last 12 months, did you get any reminders from this provider's office between visits?
Yes 843 67% 3% 7,089 67% 1%
No 843 33% 3% 7,089 33% 1%
Patient Experience Survey: Information Composite
Figure 44: Presents the composite proportion, including the 95% confidence interval, of the given response to the questions associatedwith Information for members 18 years and older. The composite proportion is given by the average of the corresponding proportionsof the associated questions.