Embed Size (px)
Citation preview
HS2 Phase Two Assumptions Report: PLANET Framework Model version 6.1c
November 2016D6/CS655_A2
High Speed Two (HS2) Limited has been tasked by the Department for Transport (DfT) with managing the delivery of a new national high speed rail network. It is a non-departmental public body wholly owned by the DfT.
High Speed Two (HS2) Limited, Two Snowhill Snow Hill Queensway Birmingham B4 6GA
Telephone: 020 7944 4908
General email enquiries: [email protected]
Website: www.gov.uk/hs2
High Speed Two (HS2) Limited has actively considered the needs of blind and partially sighted people in accessing this document. The text will be made available in full on the HS2 website. The text may be freely downloaded and translated by individuals or organisations for conversion into other accessible formats. If you have other needs in this regard please contact High Speed Two (HS2) Limited.
© High Speed Two (HS2) Limited, 2016, except where otherwise stated.
Copyright in the typographical arrangement rests with High Speed Two (HS2) Limited.
This information is licensed under the Open Government Licence v2.0. To view this licence, visit www.nationalarchives.gov.uk/doc/open-government-licence/ version/2 or write to the Information Policy Team, The National Archives, Kew, London TW9 4DU, or e-mail: [email protected]. Where we have identified any third-party copyright information you will need to obtain permission from the copyright holders concerned.
Printed in Great Britain on paper containing at least 75% recycled fibre.
Contents Contents
1 Introduction 1
2 Forecasting assumptions 2
2.1 Forecasting approach 2
2.2 Rail demand growth 2
2.3 Rail demand forecasts 9
2.4 Highway demand forecasts 11
2.5 Air demand forecasts 13
3 Economic appraisal 14
3.1 Background 14
3.2 Price base 14
3.3 Appraisal period 14
3.4 Parameters 15
4 Highway and air networks 21
4.1 Background 21
4.2 ‘Do Minimum’ and ‘Do Something’ highway networks 21
4.3 ‘Do Minimum’ and ‘Do Something’ air networks 23
5 Rail network: ‘Do Minimum’ 25
5.1 Background 25
5.2 Chiltern Railways 26
5.3 Cross country 28
5.4 East Coast Main Line 30
5.5 Great Western 32
5.6 London Midland 34
5.7 East Midlands 36
5.8 West Coast Main Line 37
5.9 TransPennine 40
5.10 Northern Railway 42
5.11 East-West Rail 48
5.12 Other services 49
5.13 London Underground 50
5.14 National Rail – rolling stock 51
6 Rail Network: ‘Do Something’ 55
6.1 Introduction 55
6.2 HS2 service patterns 56
6.3 Released capacity 61
6.4 West Coast 62
6.5 East Coast Main Line 65
i
6.6 London Midland 66
6.7 East Midlands trains 68
6.8 TransPennine Trains 70
6.9 Northern Railway 72
6.10 Cross country 78
6.11 Southern 80
6.12 Thameslink and Great Northern Trains 81
6.13 Old Oak Common - Great Western and Heathrow Express 87
6.14 Old Oak Common - Crossrail 87
7 Rail reliability assumptions - PFMv6.1c 88
8 General model assumptions 89
8.1 Introduction 89
HS2 Phase Two – Assumptions report PLANET Framework Model v6.1c
1
1 Introduction 1.1.1 The PLANET Framework Model, or PFM, has been developed by HS2 Ltd as a tool to
forecast demand for and benefits of HS2. The current version of the PFM is known as version 6.1c or PFMv6.1c and its methodology is separately described in the report: PLANET Framework Model (PFMv6.1) – Model description.
1.1.2 This document provides a summary of the input and forecasting assumptions used by PFMv6.1c to generate what is known as the HS2 standard case, as most recently presented in the separate report, Economic Case for HS2 Phase 2a, November 2015.
1.1.3 The remainder of this document is set out using the following structure:
Chapter 2: Forecasting assumptions;
Chapter 3: Economic appraisal;
Chapter 4: Highway and air networks;
Chapter 5: Rail networks: ’Do Minimum’;
Chapter 6: Rail networks: ‘Do Something’;
Chapter 7: Rail reliability assumptions; and
Chapter 8: General model assumptions.
HS2 Phase Two – Assumptions report PLANET Framework Model v6.1c
2
2 Forecasting assumptions 2.1 Forecasting approach
2.1.1 Forecasts of ‘Do Minimum’ (without HS2) passenger demand are produced by mode and purpose. These make use of the recommended Department for Transport (DfT) modal forecasting procedures for air, car and rail:
Rail forecasts are generated in line with WebTAG using the DfT's EDGE1 model.
Car forecasts are generated using the National Trip End Model in TEMPro2.
Domestic air forecasts are generated using the DfT Aviation Model3.
2.1.2 The following sections in this chapter outline the input assumptions used by these models to produce ‘Do Minimum’ forecasts for each of these modes.
2.2 Rail demand growth
Elasticities
2.2.1 Rail demand growth is generated by the DfT's EDGE model, which is based on current WebTAG4 guidance for forecasting rail demand. This uses Passenger Demand Forecasting Handbook (PDFH) Version 5.1 growth elasticities for all variables except fares that are based on PDFH4 elasticities, and car cost which uses PDFH5.0. In addition, the ‘ticket type to journey purpose’ conversion is based on parameters from PDFH5.0.
2.2.2 In PFMv6.1c the forecasting approach has been updated to incorporate the recommended PDFHv5.1 variable elasticity values for non-London flows, which previous versions of the PFM did not include, as the functionality did not exist to apply them within EDGE. The exogenous elasticity values for GDP per capita and employment demand drivers now vary over the short and long-term forecasting horizon for non-London Core and Major city flow categories. The forecasting horizons are defined in TAG Unit M4.
Demand drivers
2.2.3 Rail demand growth is generated by the DfT’s EDGE model which uses up to 14 different demand drivers to feed into the future year forecasts of rail demand.
2.2.4 The base year of PFMv6.1c is the financial year 2014/15, which was updated from 2010/11 in PFM5.2b. The demand drivers are used to provide the change in demand from the base in 2014/15 to the forecast years in 2026/27 and 2036/37 for PFMv6.1c.
1 Exogenous Demand Growth Estimation (EDGE). Details are given in WebTAG TAG Unit M4, November 2014, Forecasting and uncertainty. 2 Details of the Trip End Model Presentation Programme (TEMPro) can be found at https://www.gov.uk/government/collections/tempro. Accessed 20 August 2015. 3 The model is described in ‘UK Aviation Forecasts, DfT, January 2013. 4 TAG Unit M4: November 2014, Table 1.
HS2 Phase Two – Assumptions report PLANET Framework Model v6.1c
3
2.2.5 The demand drivers for the modelling were provided by the DfT. The following
sections detail the source data and assumptions used for each of these drivers in PFMv6.1c and, for ease of comparison, we also present the assumptions used in PFMv5.2b, the model used for the Economic Case for HS2, Autumn 2015. However, it should be noted that the growth for PFMv6.1c is calculated from the base of 2014/15, whereas the growth in drivers for PFMv5.2b is calculated from its base of 2010/11. It should also be noted that there is further inconsistency between PFMv6.1c and PFMv5.2b in the second forecast year and therefore a direct comparison cannot be made.
Population growth
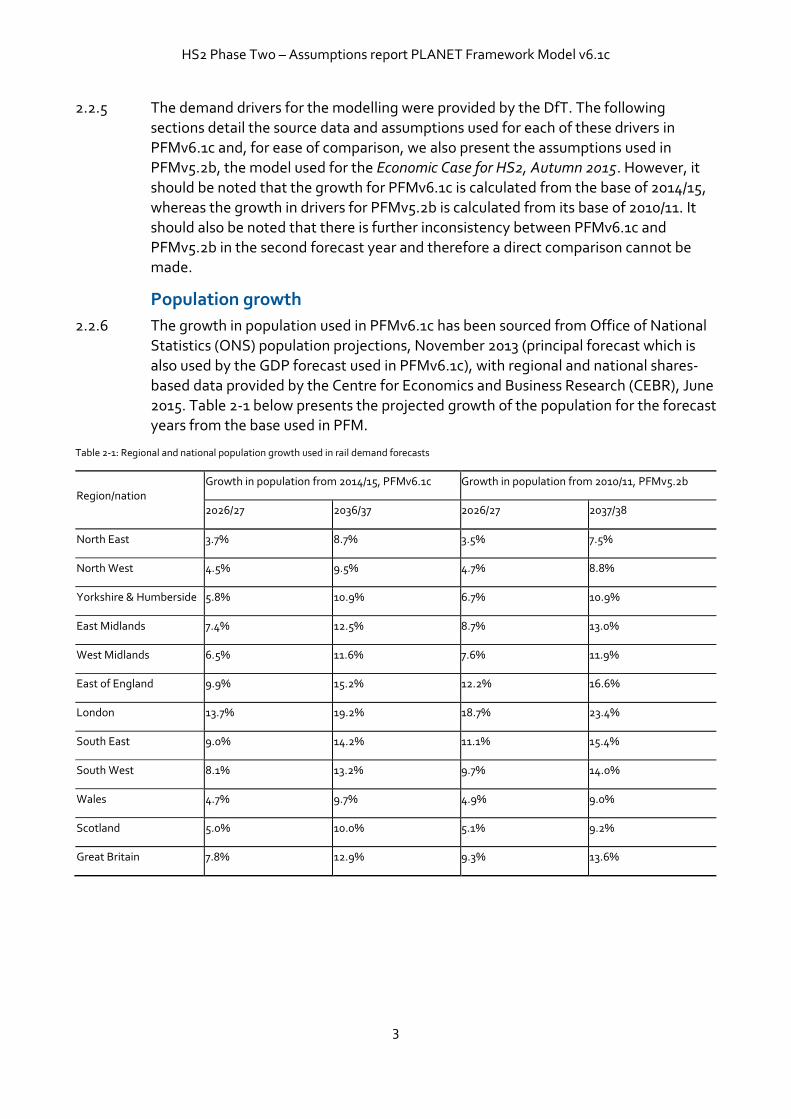
2.2.6 The growth in population used in PFMv6.1c has been sourced from Office of National Statistics (ONS) population projections, November 2013 (principal forecast which is
also used by the GDP forecast used in PFMv6.1c), with regional and national shares-based data provided by the Centre for Economics and Business Research (CEBR), June 2015. Table 2-1 below presents the projected growth of the population for the forecast years from the base used in PFM.
Table 2-1: Regional and national population growth used in rail demand forecasts
Region/nation Growth in population from 2014/15, PFMv6.1c Growth in population from 2010/11, PFMv5.2b
2026/27 2036/37 2026/27 2037/38
North East 3.7% 8.7% 3.5% 7.5%
North West 4.5% 9.5% 4.7% 8.8%
Yorkshire & Humberside 5.8% 10.9% 6.7% 10.9%
East Midlands 7.4% 12.5% 8.7% 13.0%
West Midlands 6.5% 11.6% 7.6% 11.9%
East of England 9.9% 15.2% 12.2% 16.6%
London 13.7% 19.2% 18.7% 23.4%
South East 9.0% 14.2% 11.1% 15.4%
South West 8.1% 13.2% 9.7% 14.0%
Wales 4.7% 9.7% 4.9% 9.0%
Scotland 5.0% 10.0% 5.1% 9.2%
Great Britain 7.8% 12.9% 9.3% 13.6%
HS2 Phase Two – Assumptions report PLANET Framework Model v6.1c
4
Employment growth
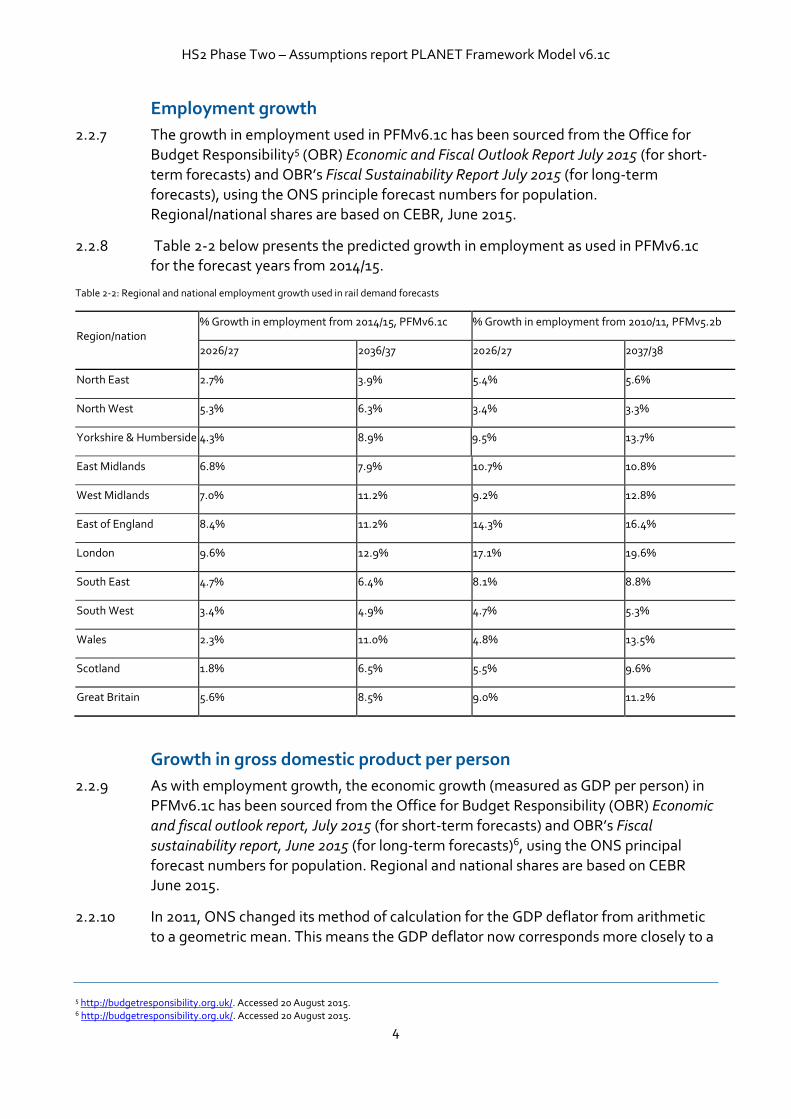
2.2.7 The growth in employment used in PFMv6.1c has been sourced from the Office for Budget Responsibility5 (OBR) Economic and Fiscal Outlook Report July 2015 (for short-term forecasts) and OBR’s Fiscal Sustainability Report July 2015 (for long-term forecasts), using the ONS principle forecast numbers for population. Regional/national shares are based on CEBR, June 2015.
2.2.8 Table 2-2 below presents the predicted growth in employment as used in PFMv6.1c for the forecast years from 2014/15.
Table 2-2: Regional and national employment growth used in rail demand forecasts
Region/nation % Growth in employment from 2014/15, PFMv6.1c % Growth in employment from 2010/11, PFMv5.2b
2026/27 2036/37 2026/27 2037/38
North East 2.7% 3.9% 5.4% 5.6%
North West 5.3% 6.3% 3.4% 3.3%
Yorkshire & Humberside 4.3% 8.9% 9.5% 13.7%
East Midlands 6.8% 7.9% 10.7% 10.8%
West Midlands 7.0% 11.2% 9.2% 12.8%
East of England 8.4% 11.2% 14.3% 16.4%
London 9.6% 12.9% 17.1% 19.6%
South East 4.7% 6.4% 8.1% 8.8%
South West 3.4% 4.9% 4.7% 5.3%
Wales 2.3% 11.0% 4.8% 13.5%
Scotland 1.8% 6.5% 5.5% 9.6%
Great Britain 5.6% 8.5% 9.0% 11.2%
Growth in gross domestic product per person
2.2.9 As with employment growth, the economic growth (measured as GDP per person) in PFMv6.1c has been sourced from the Office for Budget Responsibility (OBR) Economic and fiscal outlook report, July 2015 (for short-term forecasts) and OBR’s Fiscal
sustainability report, June 2015 (for long-term forecasts)6, using the ONS principal forecast numbers for population. Regional and national shares are based on CEBR June 2015.
2.2.10 In 2011, ONS changed its method of calculation for the GDP deflator from arithmetic to a geometric mean. This means the GDP deflator now corresponds more closely to a
5 http://budgetresponsibility.org.uk/. Accessed 20 August 2015. 6 http://budgetresponsibility.org.uk/. Accessed 20 August 2015.
HS2 Phase Two – Assumptions report PLANET Framework Model v6.1c
5
Consumer Price Index (CPI) measure of inflation than Retail Price Index (RPI),
although it is not quite the same as either. ONS back-calculated historic GDP using this new approach, as well as using it in its GDP forecasts.
2.2.11 The PDFH5.1 GDP to rail demand elasticity parameter was estimated using GDP forecasts defined with the previous definition of the GDP deflator (similar to RPI), rather the new deflator (similar to CPI). Consequently, to maintain consistency with the original calibration of the PDFH5.1 the GDP forecasts have to be readjusted to the old GDP deflator.
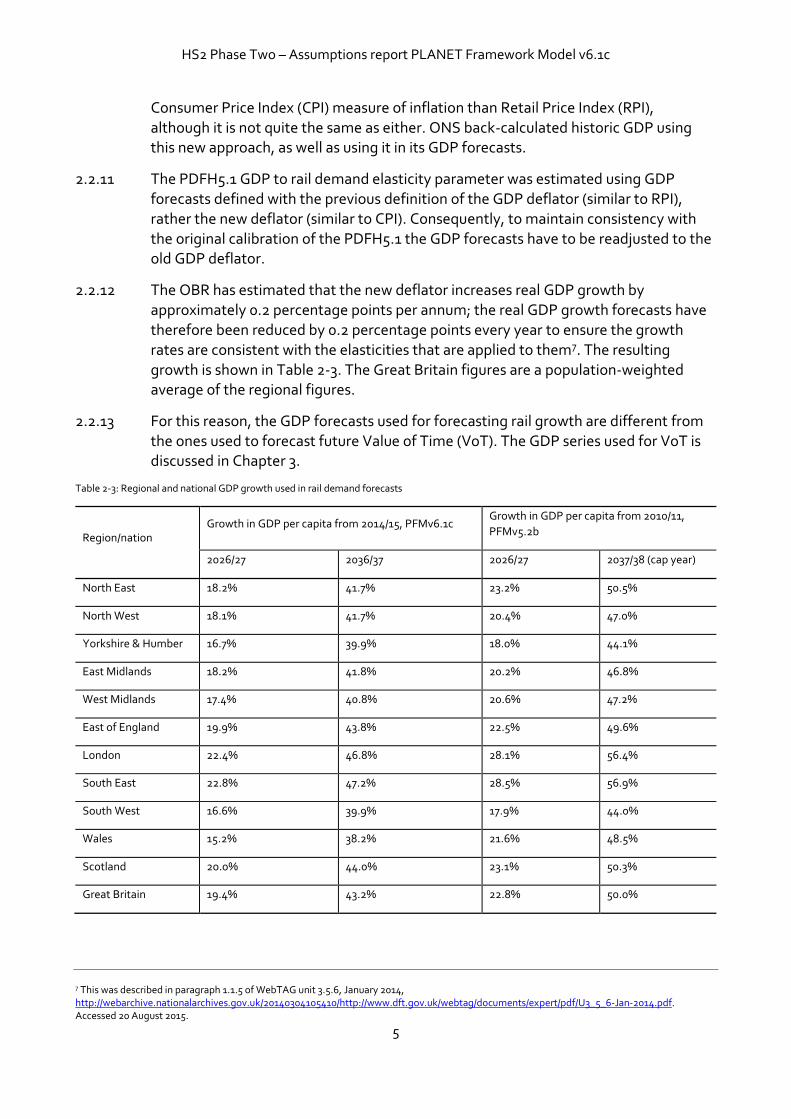
2.2.12 The OBR has estimated that the new deflator increases real GDP growth by approximately 0.2 percentage points per annum; the real GDP growth forecasts have therefore been reduced by 0.2 percentage points every year to ensure the growth rates are consistent with the elasticities that are applied to them7. The resulting
growth is shown in Table 2-3. The Great Britain figures are a population-weighted average of the regional figures.
2.2.13 For this reason, the GDP forecasts used for forecasting rail growth are different from
the ones used to forecast future Value of Time (VoT). The GDP series used for VoT is discussed in Chapter 3.
Table 2-3: Regional and national GDP growth used in rail demand forecasts
Region/nation Growth in GDP per capita from 2014/15, PFMv6.1c
Growth in GDP per capita from 2010/11,
PFMv5.2b
2026/27 2036/37 2026/27 2037/38 (cap year)
North East 18.2% 41.7% 23.2% 50.5%
North West 18.1% 41.7% 20.4% 47.0%
Yorkshire & Humber 16.7% 39.9% 18.0% 44.1%
East Midlands 18.2% 41.8% 20.2% 46.8%
West Midlands 17.4% 40.8% 20.6% 47.2%
East of England 19.9% 43.8% 22.5% 49.6%
London 22.4% 46.8% 28.1% 56.4%
South East 22.8% 47.2% 28.5% 56.9%
South West 16.6% 39.9% 17.9% 44.0%
Wales 15.2% 38.2% 21.6% 48.5%
Scotland 20.0% 44.0% 23.1% 50.3%
Great Britain 19.4% 43.2% 22.8% 50.0%
7 This was described in paragraph 1.1.5 of WebTAG unit 3.5.6, January 2014, http://webarchive.nationalarchives.gov.uk/20140304105410/http://www.dft.gov.uk/webtag/documents/expert/pdf/U3_5_6-Jan-2014.pdf. Accessed 20 August 2015.
HS2 Phase Two – Assumptions report PLANET Framework Model v6.1c
6
National Rail and London Underground fares
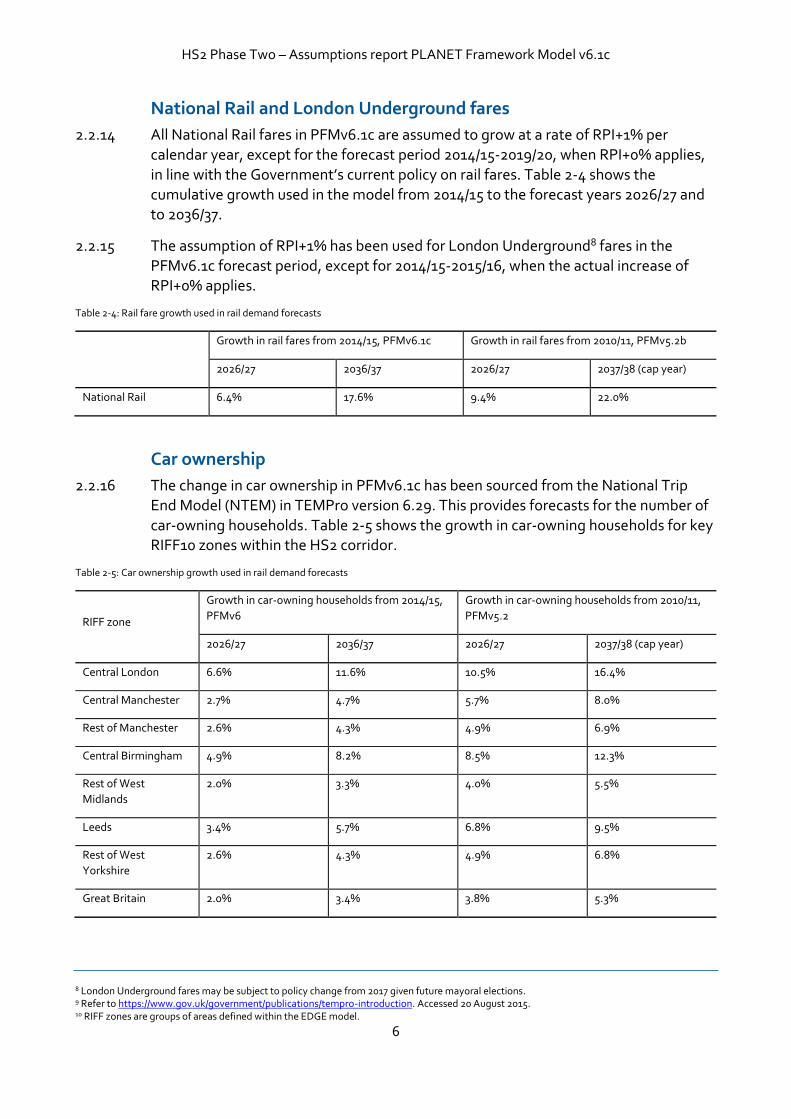
2.2.14 All National Rail fares in PFMv6.1c are assumed to grow at a rate of RPI+1% per calendar year, except for the forecast period 2014/15-2019/20, when RPI+0% applies, in line with the Government’s current policy on rail fares. Table 2-4 shows the cumulative growth used in the model from 2014/15 to the forecast years 2026/27 and to 2036/37.
2.2.15 The assumption of RPI+1% has been used for London Underground8 fares in the PFMv6.1c forecast period, except for 2014/15-2015/16, when the actual increase of RPI+0% applies.
Table 2-4: Rail fare growth used in rail demand forecasts
Growth in rail fares from 2014/15, PFMv6.1c Growth in rail fares from 2010/11, PFMv5.2b
2026/27 2036/37 2026/27 2037/38 (cap year)
National Rail 6.4% 17.6% 9.4% 22.0%
Car ownership
2.2.16 The change in car ownership in PFMv6.1c has been sourced from the National Trip End Model (NTEM) in TEMPro version 6.29. This provides forecasts for the number of car-owning households. Table 2-5 shows the growth in car-owning households for key RIFF10 zones within the HS2 corridor.
Table 2-5: Car ownership growth used in rail demand forecasts
RIFF zone
Growth in car-owning households from 2014/15,
PFMv6
Growth in car-owning households from 2010/11,
PFMv5.2
2026/27 2036/37 2026/27 2037/38 (cap year)
Central London 6.6% 11.6% 10.5% 16.4%
Central Manchester 2.7% 4.7% 5.7% 8.0%
Rest of Manchester 2.6% 4.3% 4.9% 6.9%
Central Birmingham 4.9% 8.2% 8.5% 12.3%
Rest of West
Midlands
2.0% 3.3% 4.0% 5.5%
Leeds 3.4% 5.7% 6.8% 9.5%
Rest of West
Yorkshire
2.6% 4.3% 4.9% 6.8%
Great Britain 2.0% 3.4% 3.8% 5.3%
8 London Underground fares may be subject to policy change from 2017 given future mayoral elections. 9 Refer to https://www.gov.uk/government/publications/tempro-introduction. Accessed 20 August 2015. 10 RIFF zones are groups of areas defined within the EDGE model.
HS2 Phase Two – Assumptions report PLANET Framework Model v6.1c
7
Car journey times
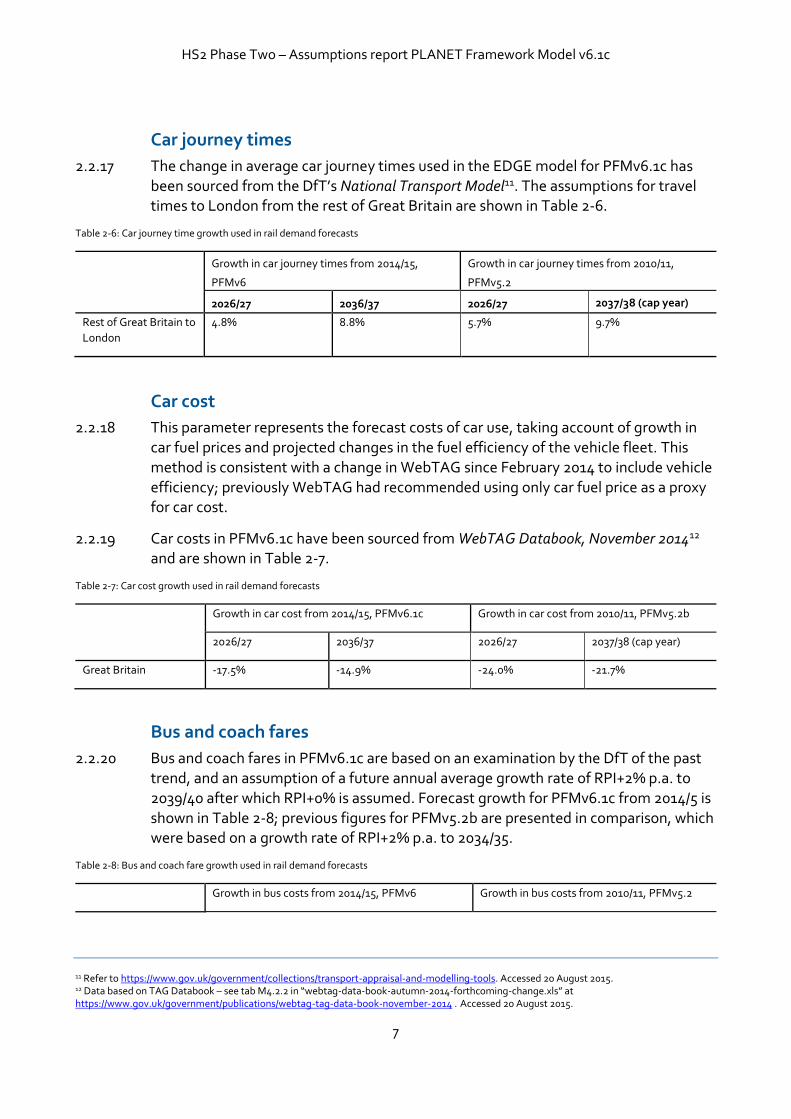
2.2.17 The change in average car journey times used in the EDGE model for PFMv6.1c has been sourced from the DfT’s National Transport Model11. The assumptions for travel times to London from the rest of Great Britain are shown in Table 2-6.
Table 2-6: Car journey time growth used in rail demand forecasts
Growth in car journey times from 2014/15,
PFMv6
Growth in car journey times from 2010/11,
PFMv5.2
2026/27 2036/37 2026/27 2037/38 (cap year)
Rest of Great Britain to
London
4.8% 8.8% 5.7% 9.7%
Car cost
2.2.18 This parameter represents the forecast costs of car use, taking account of growth in car fuel prices and projected changes in the fuel efficiency of the vehicle fleet. This method is consistent with a change in WebTAG since February 2014 to include vehicle efficiency; previously WebTAG had recommended using only car fuel price as a proxy for car cost.
2.2.19 Car costs in PFMv6.1c have been sourced from WebTAG Databook, November 201412
and are shown in Table 2-7.
Table 2-7: Car cost growth used in rail demand forecasts
Growth in car cost from 2014/15, PFMv6.1c Growth in car cost from 2010/11, PFMv5.2b
2026/27 2036/37 2026/27 2037/38 (cap year)
Great Britain -17.5% -14.9% -24.0% -21.7%
Bus and coach fares
2.2.20 Bus and coach fares in PFMv6.1c are based on an examination by the DfT of the past trend, and an assumption of a future annual average growth rate of RPI+2% p.a. to 2039/40 after which RPI+0% is assumed. Forecast growth for PFMv6.1c from 2014/5 is shown in Table 2-8; previous figures for PFMv5.2b are presented in comparison, which were based on a growth rate of RPI+2% p.a. to 2034/35.
Table 2-8: Bus and coach fare growth used in rail demand forecasts
Growth in bus costs from 2014/15, PFMv6 Growth in bus costs from 2010/11, PFMv5.2
11 Refer to https://www.gov.uk/government/collections/transport-appraisal-and-modelling-tools. Accessed 20 August 2015. 12 Data based on TAG Databook – see tab M4.2.2 in “webtag-data-book-autumn-2014-forthcoming-change.xls” at https://www.gov.uk/government/publications/webtag-tag-data-book-november-2014 . Accessed 20 August 2015.
HS2 Phase Two – Assumptions report PLANET Framework Model v6.1c
8
2026/27 2036/37 2026/27 2037/38 (cap year)
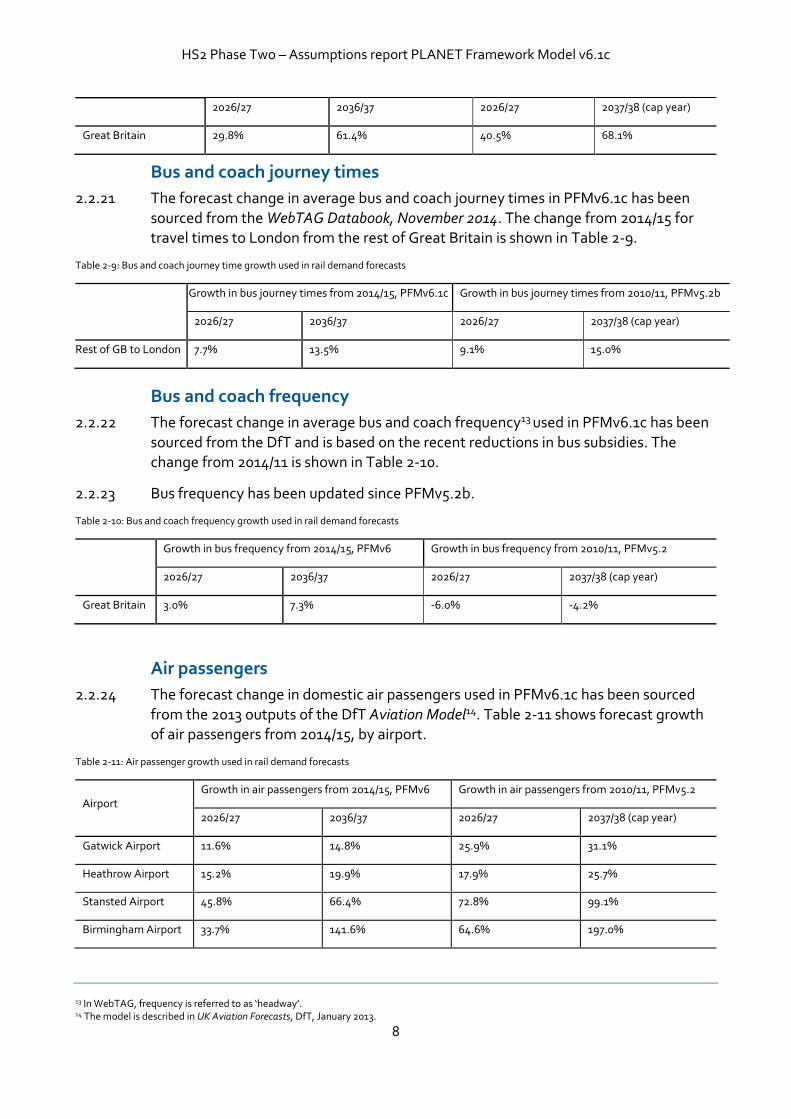
Great Britain 29.8% 61.4% 40.5% 68.1%
Bus and coach journey times
2.2.21 The forecast change in average bus and coach journey times in PFMv6.1c has been sourced from the WebTAG Databook, November 2014. The change from 2014/15 for travel times to London from the rest of Great Britain is shown in Table 2-9.
Table 2-9: Bus and coach journey time growth used in rail demand forecasts
Growth in bus journey times from 2014/15, PFMv6.1c Growth in bus journey times from 2010/11, PFMv5.2b
2026/27 2036/37 2026/27 2037/38 (cap year)
Rest of GB to London 7.7% 13.5% 9.1% 15.0%
Bus and coach frequency
2.2.22 The forecast change in average bus and coach frequency13 used in PFMv6.1c has been sourced from the DfT and is based on the recent reductions in bus subsidies. The change from 2014/11 is shown in Table 2-10.
2.2.23 Bus frequency has been updated since PFMv5.2b.
Table 2-10: Bus and coach frequency growth used in rail demand forecasts
Growth in bus frequency from 2014/15, PFMv6 Growth in bus frequency from 2010/11, PFMv5.2
2026/27 2036/37 2026/27 2037/38 (cap year)
Great Britain 3.0% 7.3% -6.0% -4.2%
Air passengers
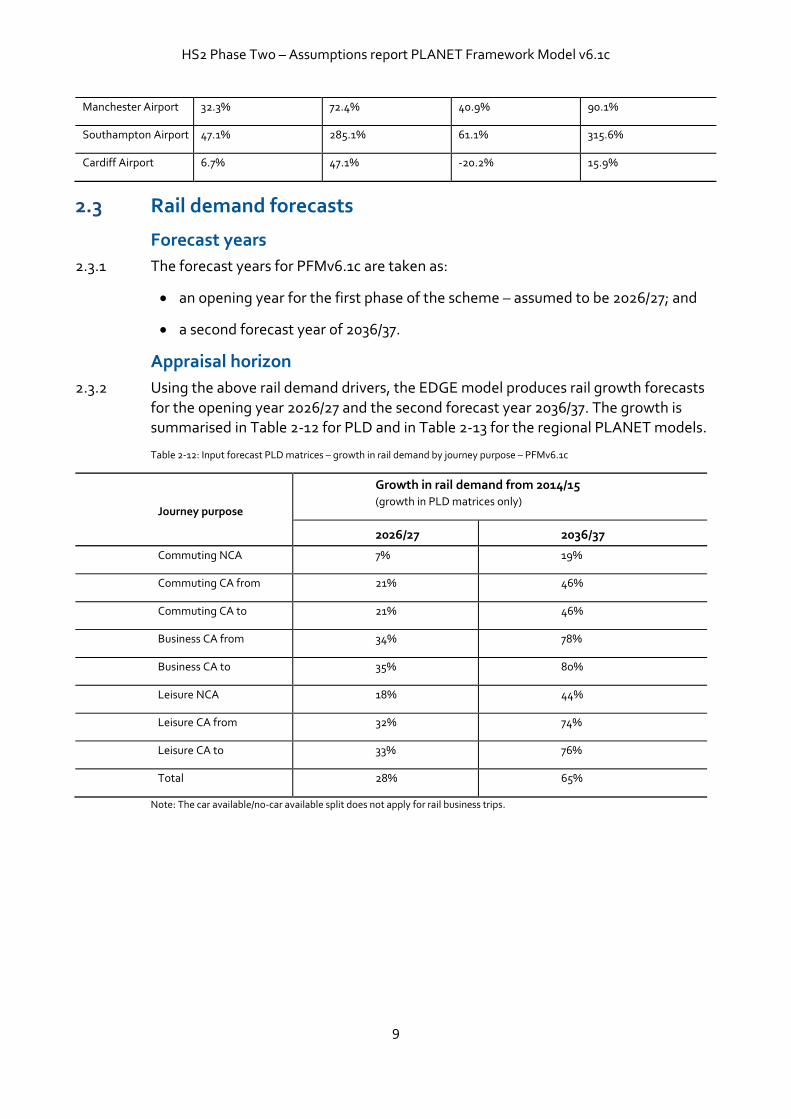
2.2.24 The forecast change in domestic air passengers used in PFMv6.1c has been sourced from the 2013 outputs of the DfT Aviation Model14. Table 2-11 shows forecast growth of air passengers from 2014/15, by airport.
Table 2-11: Air passenger growth used in rail demand forecasts
Airport Growth in air passengers from 2014/15, PFMv6 Growth in air passengers from 2010/11, PFMv5.2
2026/27 2036/37 2026/27 2037/38 (cap year)
Gatwick Airport 11.6% 14.8% 25.9% 31.1%
Heathrow Airport 15.2% 19.9% 17.9% 25.7%
Stansted Airport 45.8% 66.4% 72.8% 99.1%
Birmingham Airport 33.7% 141.6% 64.6% 197.0%
13 In WebTAG, frequency is referred to as ‘headway’. 14 The model is described in UK Aviation Forecasts, DfT, January 2013.
HS2 Phase Two – Assumptions report PLANET Framework Model v6.1c
9
Manchester Airport 32.3% 72.4% 40.9% 90.1%
Southampton Airport 47.1% 285.1% 61.1% 315.6%
Cardiff Airport 6.7% 47.1% -20.2% 15.9%
2.3 Rail demand forecasts
Forecast years
2.3.1 The forecast years for PFMv6.1c are taken as:
an opening year for the first phase of the scheme – assumed to be 2026/27; and
a second forecast year of 2036/37.
Appraisal horizon
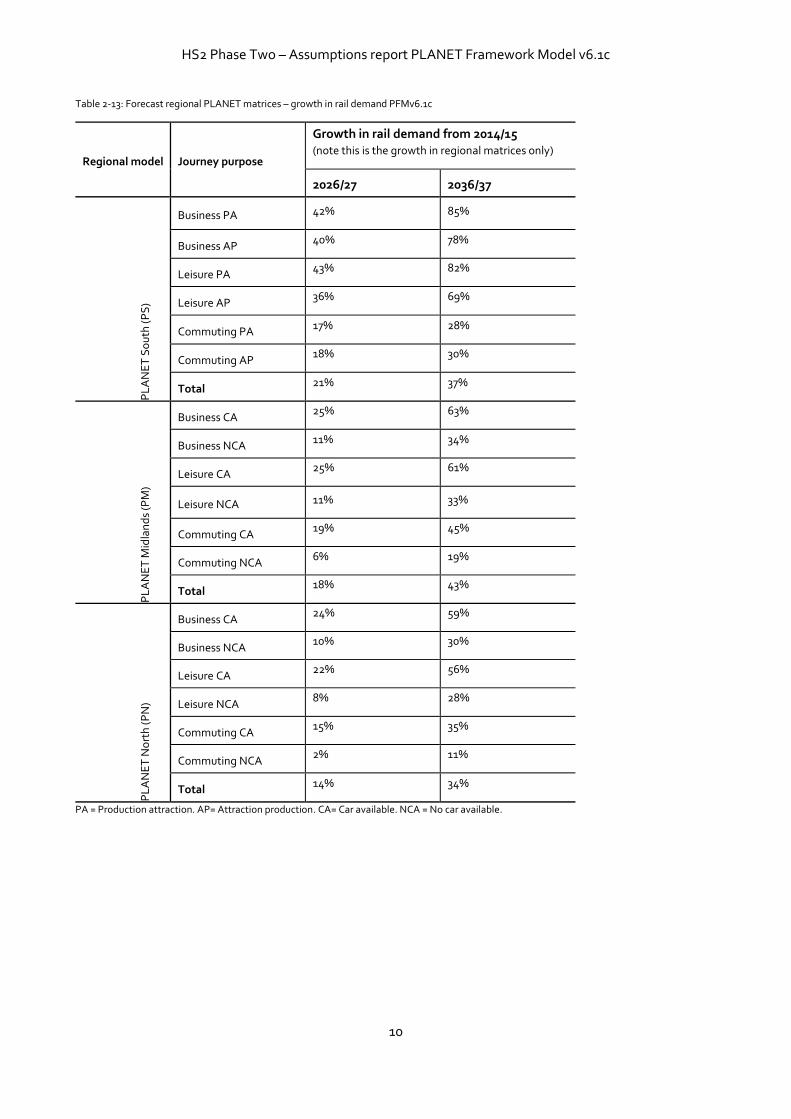
2.3.2 Using the above rail demand drivers, the EDGE model produces rail growth forecasts for the opening year 2026/27 and the second forecast year 2036/37. The growth is summarised in Table 2-12 for PLD and in Table 2-13 for the regional PLANET models.
Table 2-12: Input forecast PLD matrices – growth in rail demand by journey purpose – PFMv6.1c
Journey purpose
Growth in rail demand from 2014/15 (growth in PLD matrices only)
2026/27 2036/37
Commuting NCA 7% 19%
Commuting CA from 21% 46%
Commuting CA to 21% 46%
Business CA from 34% 78%
Business CA to 35% 80%
Leisure NCA 18% 44%
Leisure CA from 32% 74%
Leisure CA to 33% 76%
Total 28% 65%
Note: The car available/no-car available split does not apply for rail business trips.
HS2 Phase Two – Assumptions report PLANET Framework Model v6.1c
10
Table 2-13: Forecast regional PLANET matrices – growth in rail demand PFMv6.1c
Regional model Journey purpose
Growth in rail demand from 2014/15 (note this is the growth in regional matrices only)
2026/27 2036/37
PL
AN
ET
So
uth
(P
S)
Business PA 42% 85%
Business AP 40% 78%
Leisure PA 43% 82%
Leisure AP 36% 69%
Commuting PA 17% 28%
Commuting AP 18% 30%
Total 21% 37%
PL
AN
ET
Mid
lan
ds
(PM
)
Business CA 25% 63%
Business NCA 11% 34%
Leisure CA 25% 61%
Leisure NCA 11% 33%
Commuting CA 19% 45%
Commuting NCA 6% 19%
Total 18% 43%
PL
AN
ET
No
rth
(P
N)
Business CA 24% 59%
Business NCA 10% 30%
Leisure CA 22% 56%
Leisure NCA 8% 28%
Commuting CA 15% 35%
Commuting NCA 2% 11%
Total 14% 34%
PA = Production attraction. AP= Attraction production. CA= Car available. NCA = No car available.
HS2 Phase Two – Assumptions report PLANET Framework Model v6.1c
11
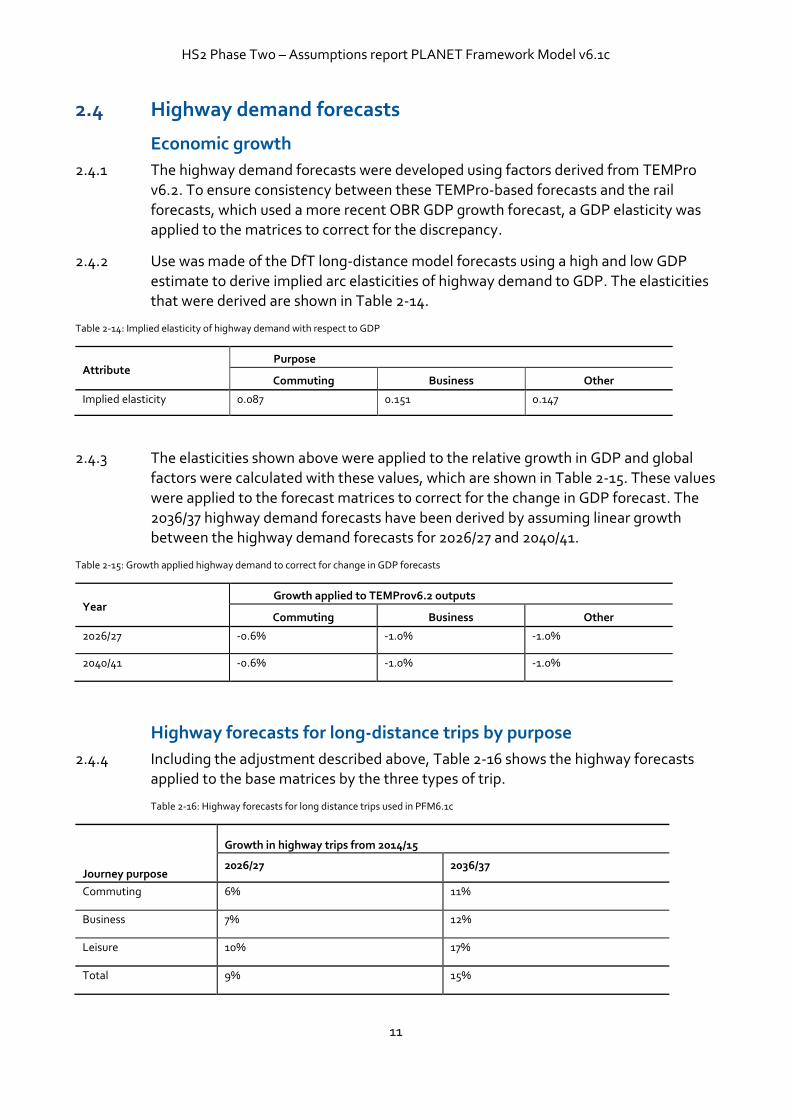
2.4 Highway demand forecasts
Economic growth
2.4.1 The highway demand forecasts were developed using factors derived from TEMPro v6.2. To ensure consistency between these TEMPro-based forecasts and the rail forecasts, which used a more recent OBR GDP growth forecast, a GDP elasticity was applied to the matrices to correct for the discrepancy.
2.4.2 Use was made of the DfT long-distance model forecasts using a high and low GDP estimate to derive implied arc elasticities of highway demand to GDP. The elasticities that were derived are shown in Table 2-14.
Table 2-14: Implied elasticity of highway demand with respect to GDP
Attribute Purpose
Commuting Business Other
Implied elasticity 0.087 0.151 0.147
2.4.3 The elasticities shown above were applied to the relative growth in GDP and global factors were calculated with these values, which are shown in Table 2-15. These values were applied to the forecast matrices to correct for the change in GDP forecast. The 2036/37 highway demand forecasts have been derived by assuming linear growth between the highway demand forecasts for 2026/27 and 2040/41.
Table 2-15: Growth applied highway demand to correct for change in GDP forecasts
Year Growth applied to TEMProv6.2 outputs
Commuting Business Other
2026/27 -0.6% -1.0% -1.0%
2040/41 -0.6% -1.0% -1.0%
Highway forecasts for long-distance trips by purpose
2.4.4 Including the adjustment described above, Table 2-16 shows the highway forecasts applied to the base matrices by the three types of trip.
Table 2-16: Highway forecasts for long distance trips used in PFM6.1c
Journey purpose
Growth in highway trips from 2014/15
2026/27 2036/37
Commuting 6% 11%
Business 7% 12%
Leisure 10% 17%
Total 9% 15%
HS2 Phase Two – Assumptions report PLANET Framework Model v6.1c
12
Highway forecasts for short-distance trips
2.4.5 Short-distance trips and goods vehicles trips are represented as preloaded flows on the network. For the base year, these are calculated by assigning the base year PLD matrices onto the highway network and taking the difference between the assigned flows and observed traffic flows. The traffic flow data was taken from the DfT’s traffic counts15.
2.4.6 The preloads were calculated for the forecast years using the NTM traffic forecast component of the Road Transport Forecasts 2015 (RTF15)16. The key input assumptions to RTF15 are as follows:
population and employment data – based on NTEM 5.4;
GDP forecasts – OBR central forecasts; and
fuel prices – based on DECC’s fuel price projections.
2.4.7 While the above assumptions are not consistent with those used for forecasting other modes, they are the latest DfT assumptions and so are the most appropriate source of data.
2.4.8 NTM forecasts traffic levels by region and road type using the DfT’s fitting on of regional growth and elasticities (FORGE) mechanism. FORGE is not a traditional assignment model as it uses observed data on the level of traffic, using each link of the road network from its 2003 base year, and then applies elasticities derived from the demand model to forecast future levels of traffic.
2.4.9 The flows for the years required for the study (2014/15, 2026/27 and 2036/37) were
derived from Road transport forecasts 2015, scenario 117, which shows forecast traffic in calendar years 2010 through to 2035 in five-yearly intervals. The growth implied by interpolation of the average annual growth rates for the required model years is shown below in Table 2-17. The link preloads were uplifted using the following assumptions:
All projections from the national transport model are subject to a significant level of uncertainty. As this uncertainty is higher for more disaggregate results, a single factor was calculated to be applied globally to all regions.
The values calculated apply to England only – it is assumed that Wales and Scotland have the same growth factors.
Car and other vehicle factors are calculated separately as preload values are
disaggregated by car and light goods vehicles.
As the nature of the network modelled is predominantly major roads, the only road types to be considered in the calculation of the growth factors are
15 http://www.dft.gov.uk/traffic-counts. 16 https://www.gov.uk/government/publications/road-traffic-forecasts-2015. Accessed 20 August 2015. 17 https://www.gov.uk/government/publications/road-traffic-forecasts-2015. Accessed 20 August 2015.
HS2 Phase Two – Assumptions report PLANET Framework Model v6.1c
13
motorway, trunk and principal.
Table 2-17: Highway forecasts by vehicle type and road type, England
Vehicle type Growth from 2014/15 to: Motorway Trunk Principal All roads
Cars 2026/27 17% 16% 14% 15%
2036/37 30% 29% 25% 27%
Other vehicles 2026/27 20% 21% 21% 21%
2036/37 36% 37% 39% 38%
Source: Interpolation of RTF 2015 forecast to 2035
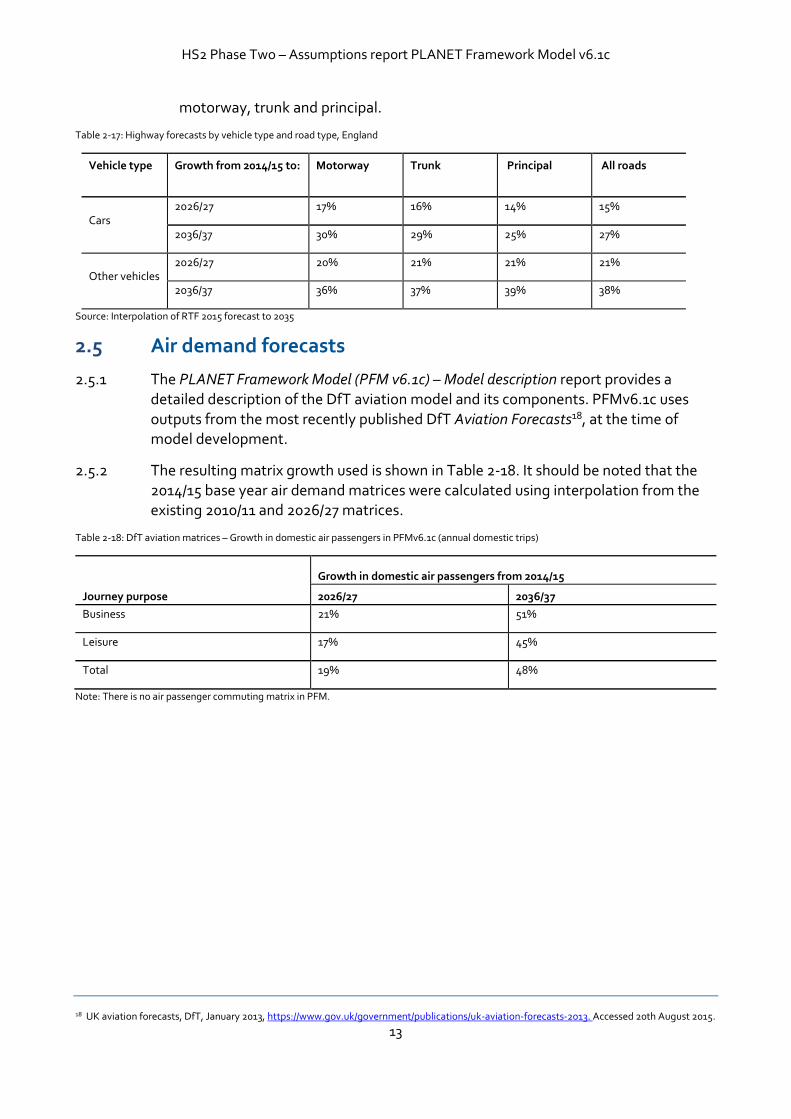
2.5 Air demand forecasts
2.5.1 The PLANET Framework Model (PFM v6.1c) – Model description report provides a detailed description of the DfT aviation model and its components. PFMv6.1c uses outputs from the most recently published DfT Aviation Forecasts18, at the time of model development.
2.5.2 The resulting matrix growth used is shown in Table 2-18. It should be noted that the 2014/15 base year air demand matrices were calculated using interpolation from the existing 2010/11 and 2026/27 matrices.
Table 2-18: DfT aviation matrices – Growth in domestic air passengers in PFMv6.1c (annual domestic trips)
Journey purpose
Growth in domestic air passengers from 2014/15
2026/27 2036/37
Business 21% 51%
Leisure 17% 45%
Total 19% 48%
Note: There is no air passenger commuting matrix in PFM.
18 UK aviation forecasts, DfT, January 2013, https://www.gov.uk/government/publications/uk-aviation-forecasts-2013. Accessed 20th August 2015.
HS2 Phase Two – Assumptions report PLANET Framework Model v6.1c
14
3 Economic appraisal 3.1 Background
3.1.1 The appraisal of HS2 requires a range of assumptions to compare costs and benefits in accordance with WebTAG guidance. This section outlines the assumptions that have been adopted and their sources.
3.1.2 The economic appraisal uses outputs from the ‘Do Minimum’, with HS2 scenarios run in PLD and the regional PLANET models to produce an appraisal of the economic performance of Phase One and the full network over the construction period and 60 years of operation.
3.1.3 The section breaks the assumptions down into different elements used in the appraisal.
3.2 Price base
3.2.1 The costs and benefits presented in the appraisal of HS2 are based on 2015/16 prices using the HM Treasury GDP deflator as a measure of inflation. The definition of this deflator has been changed from being more consistent with an RPI metric to being more consistent with a CPI metric.
3.3 Appraisal period
3.3.1 In line with WebTAG guidance the appraisal period is based on 60 years of operation of the scheme.
3.3.2 The key assumptions used in the modelling and appraisal by PFMv6.1c are:
Phase One – opening year January 2026;
Phase ‘Do Minimum’ – opening year January 2027;
Phase 2b – opening year January 2033;
First forecast modelled year – 2026/27;
Second forecast modelled year – 2036/37.
HS2 Phase Two – Assumptions report PLANET Framework Model v6.1c
15
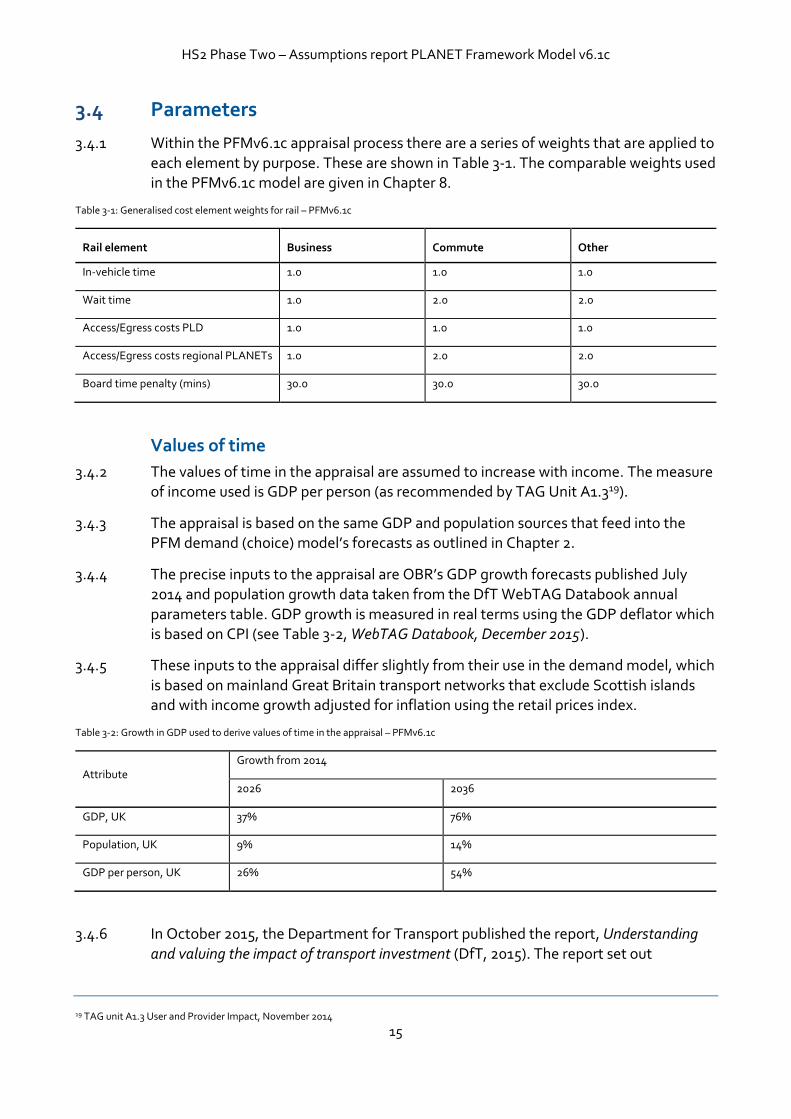
3.4 Parameters
3.4.1 Within the PFMv6.1c appraisal process there are a series of weights that are applied to each element by purpose. These are shown in Table 3-1. The comparable weights used in the PFMv6.1c model are given in Chapter 8.
Table 3-1: Generalised cost element weights for rail – PFMv6.1c
Rail element Business Commute Other
In-vehicle time 1.0 1.0 1.0
Wait time 1.0 2.0 2.0
Access/Egress costs PLD 1.0 1.0 1.0
Access/Egress costs regional PLANETs 1.0 2.0 2.0
Board time penalty (mins) 30.0 30.0 30.0
Values of time
3.4.2 The values of time in the appraisal are assumed to increase with income. The measure of income used is GDP per person (as recommended by TAG Unit A1.319).
3.4.3 The appraisal is based on the same GDP and population sources that feed into the PFM demand (choice) model’s forecasts as outlined in Chapter 2.
3.4.4 The precise inputs to the appraisal are OBR’s GDP growth forecasts published July 2014 and population growth data taken from the DfT WebTAG Databook annual
parameters table. GDP growth is measured in real terms using the GDP deflator which is based on CPI (see Table 3-2, WebTAG Databook, December 2015).
3.4.5 These inputs to the appraisal differ slightly from their use in the demand model, which
is based on mainland Great Britain transport networks that exclude Scottish islands and with income growth adjusted for inflation using the retail prices index.
Table 3-2: Growth in GDP used to derive values of time in the appraisal – PFMv6.1c
3.4.6 In October 2015, the Department for Transport published the report, Understanding and valuing the impact of transport investment (DfT, 2015). The report set out
19 TAG unit A1.3 User and Provider Impact, November 2014
Attribute Growth from 2014
2026 2036
GDP, UK 37% 76%
Population, UK 9% 14%
GDP per person, UK 26% 54%
HS2 Phase Two – Assumptions report PLANET Framework Model v6.1c
16
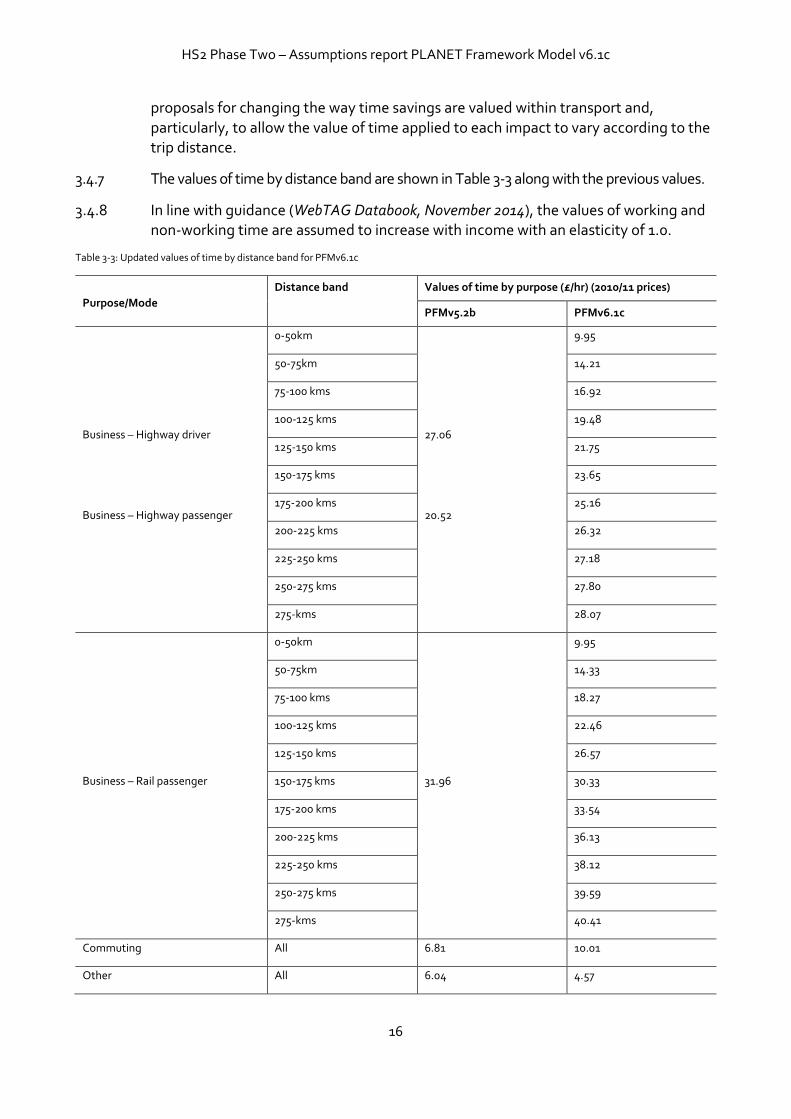
proposals for changing the way time savings are valued within transport and,
particularly, to allow the value of time applied to each impact to vary according to the trip distance.
3.4.7 The values of time by distance band are shown in Table 3-3 along with the previous values.
3.4.8 In line with guidance (WebTAG Databook, November 2014), the values of working and non-working time are assumed to increase with income with an elasticity of 1.0.
Table 3-3: Updated values of time by distance band for PFMv6.1c
Purpose/Mode
Distance band Values of time by purpose (£/hr) (2010/11 prices)
PFMv5.2b PFMv6.1c
Business – Highway driver
Business – Highway passenger
0-50km
27.06
20.52
9.95
50-75km 14.21
75-100 kms 16.92
100-125 kms 19.48
125-150 kms 21.75
150-175 kms 23.65
175-200 kms 25.16
200-225 kms 26.32
225-250 kms 27.18
250-275 kms 27.80
275-kms 28.07
Business – Rail passenger
0-50km
31.96
9.95
50-75km 14.33
75-100 kms 18.27
100-125 kms 22.46
125-150 kms 26.57
150-175 kms 30.33
175-200 kms 33.54
200-225 kms 36.13
225-250 kms 38.12
250-275 kms 39.59
275-kms 40.41
Commuting All 6.81 10.01
Other All 6.04 4.57
HS2 Phase Two – Assumptions report PLANET Framework Model v6.1c
17
*Per person value is calculated using car occupancy per vehicle kilometre travelled for the work journey purpose, all week average, 2010, from WebTAG Databook, November 2014, Table A1.3.3.
Annualisation factors
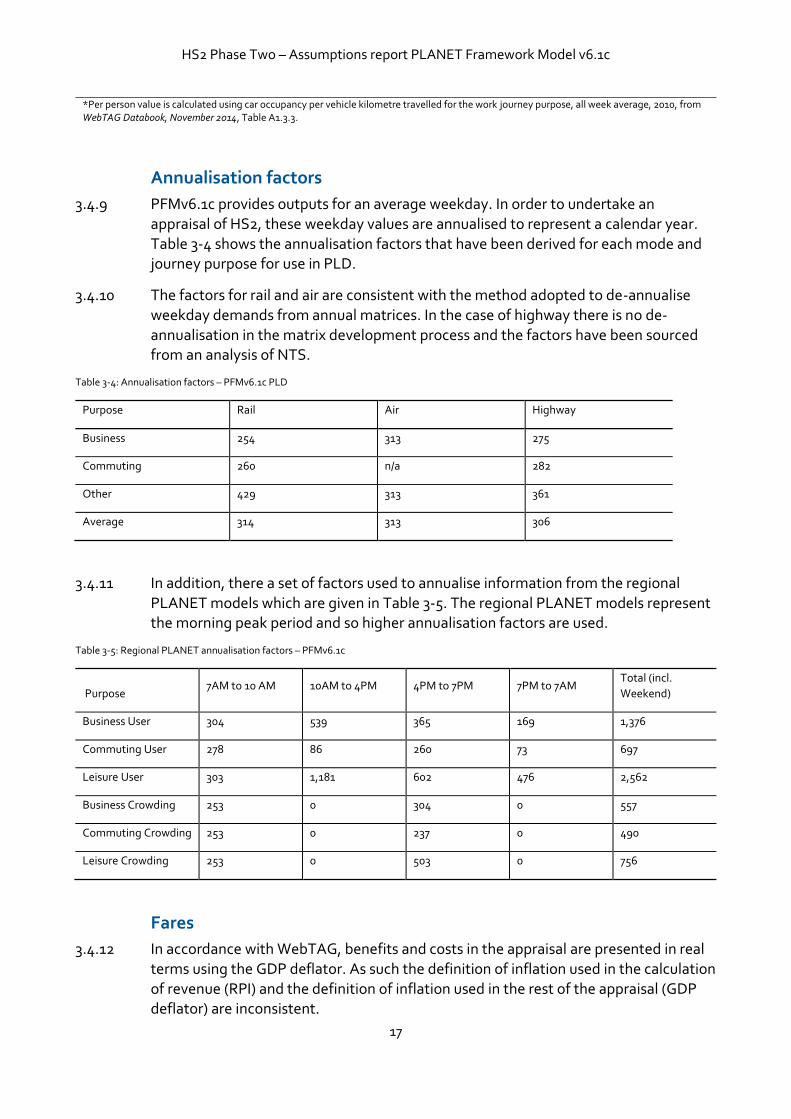
3.4.9 PFMv6.1c provides outputs for an average weekday. In order to undertake an appraisal of HS2, these weekday values are annualised to represent a calendar year. Table 3-4 shows the annualisation factors that have been derived for each mode and journey purpose for use in PLD.
3.4.10 The factors for rail and air are consistent with the method adopted to de-annualise weekday demands from annual matrices. In the case of highway there is no de-annualisation in the matrix development process and the factors have been sourced from an analysis of NTS.
Table 3-4: Annualisation factors – PFMv6.1c PLD
Purpose Rail Air Highway
Business 254 313 275
Commuting 260 n/a 282
Other 429 313 361
Average 314 313 306
3.4.11 In addition, there a set of factors used to annualise information from the regional
PLANET models which are given in Table 3-5. The regional PLANET models represent the morning peak period and so higher annualisation factors are used.
Table 3-5: Regional PLANET annualisation factors – PFMv6.1c
Purpose 7AM to 10 AM 10AM to 4PM 4PM to 7PM 7PM to 7AM Total (incl.
Weekend)
Business User 304 539 365 169 1,376
Commuting User 278 86 260 73 697
Leisure User 303 1,181 602 476 2,562
Business Crowding 253 0 304 0 557
Commuting Crowding 253 0 237 0 490
Leisure Crowding 253 0 503 0 756
Fares
3.4.12 In accordance with WebTAG, benefits and costs in the appraisal are presented in real terms using the GDP deflator. As such the definition of inflation used in the calculation of revenue (RPI) and the definition of inflation used in the rest of the appraisal (GDP deflator) are inconsistent.
HS2 Phase Two – Assumptions report PLANET Framework Model v6.1c
18
3.4.13 In order to define fares growth on the basis of the GDP deflator, revenues are uplifted
by the difference in the RPI and GDP deflator indices over time. The difference between these indices is around 0.9% per annum; in effect, this means real fares growth defined on the basis of RPI+1% per annum is equivalent to growth of the GDP deflator +1.9% per annum.
3.4.14 For the purpose of our modelling, all National Rail and London Underground fares are assumed to grow at a rate of RPI+1% per year between 2010 and the second modelled year except between 2014 and 2020, when RPI+0% applies. Within the appraisal there is no further real growth in fares for the remainder of the appraisal period beyond that point.
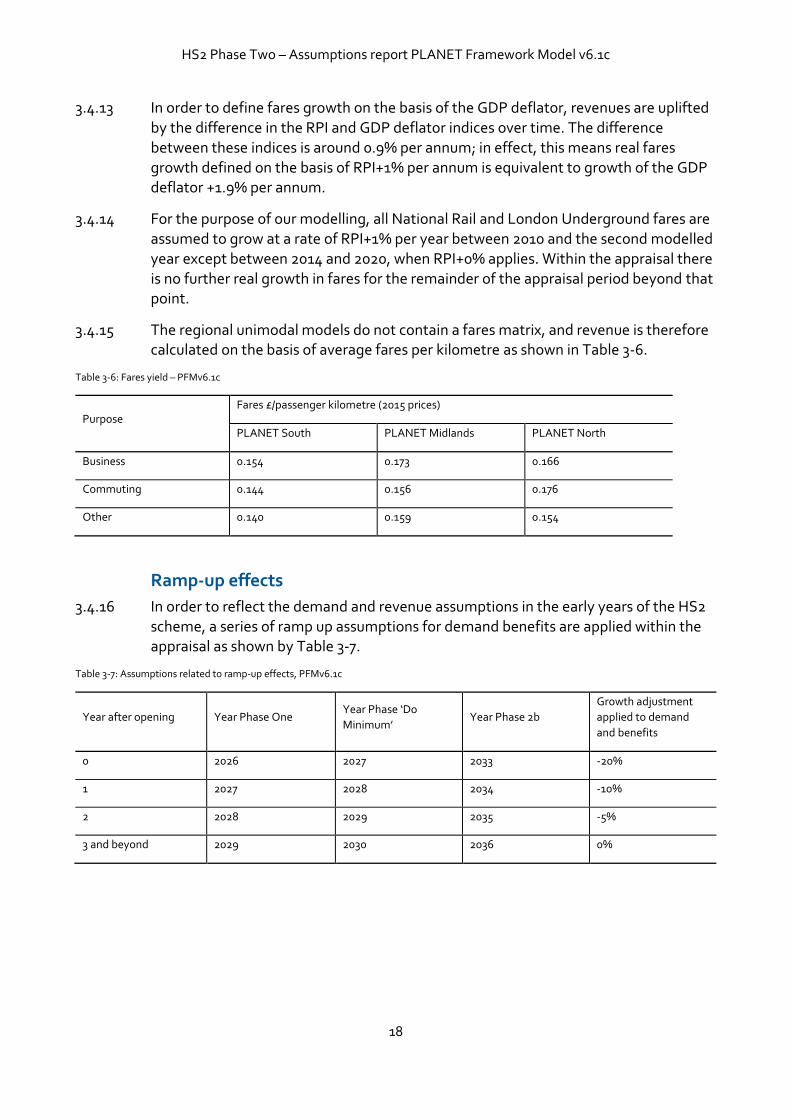
3.4.15 The regional unimodal models do not contain a fares matrix, and revenue is therefore calculated on the basis of average fares per kilometre as shown in Table 3-6.
Table 3-6: Fares yield – PFMv6.1c
Purpose
Fares £/passenger kilometre (2015 prices)
PLANET South PLANET Midlands PLANET North
Business 0.154 0.173 0.166
Commuting 0.144 0.156 0.176
Other 0.140 0.159 0.154
Ramp-up effects
3.4.16 In order to reflect the demand and revenue assumptions in the early years of the HS2 scheme, a series of ramp up assumptions for demand benefits are applied within the appraisal as shown by Table 3-7.
Table 3-7: Assumptions related to ramp-up effects, PFMv6.1c
Year after opening Year Phase One Year Phase ‘Do
Minimum’ Year Phase 2b
Growth adjustment
applied to demand
and benefits
0 2026 2027 2033 -20%
1 2027 2028 2034 -10%
2 2028 2029 2035 -5%
3 and beyond 2029 2030 2036 0%
HS2 Phase Two – Assumptions report PLANET Framework Model v6.1c
19
Discount rates
3.4.17 In line with TAG Unit A1.1 and WebTAG Databook, November 201420 a series of discount rates are applied from 2011. The annual discount rates assumed are:
until 2046: annual discount rate = 3.5%;
between 2047 and 2091: annual discount rate = 3.0%; and
beyond 2092: annual discount rate = 2.5%.
Highway factors used in the appraisal
3.4.18 Vehicle operating costs are derived using the approach outlined in TAG Unit A1.321. Fuel consumption is estimated using the function:
L= a / v + b + c * v + d * v2
where: L= fuel consumption, expressed in litres per kilometre;
v = average speed in kilometres per hour; and
a, b, c, d are parameters defined for each vehicle category.
3.4.19 The input for speed of highway traffic, v, is taken from PLD’s highway model, which estimates average traffic speed using DfT link type specific volume delay functions and traffic estimates. The vehicle operating cost parameters adopted within the HS2 appraisal are based on the parameters used by TAG Unit A1.322.
3.4.20 The impacts of road decongestion are assessed in line with TAG A5.4, December 201523. In the absence of more specific evidence TAG suggests the use of a diversion factor based on results from the DfT’s National Transport Model which suggest 26% of a change in rail passenger kilometres would be diverted from car kilometres.
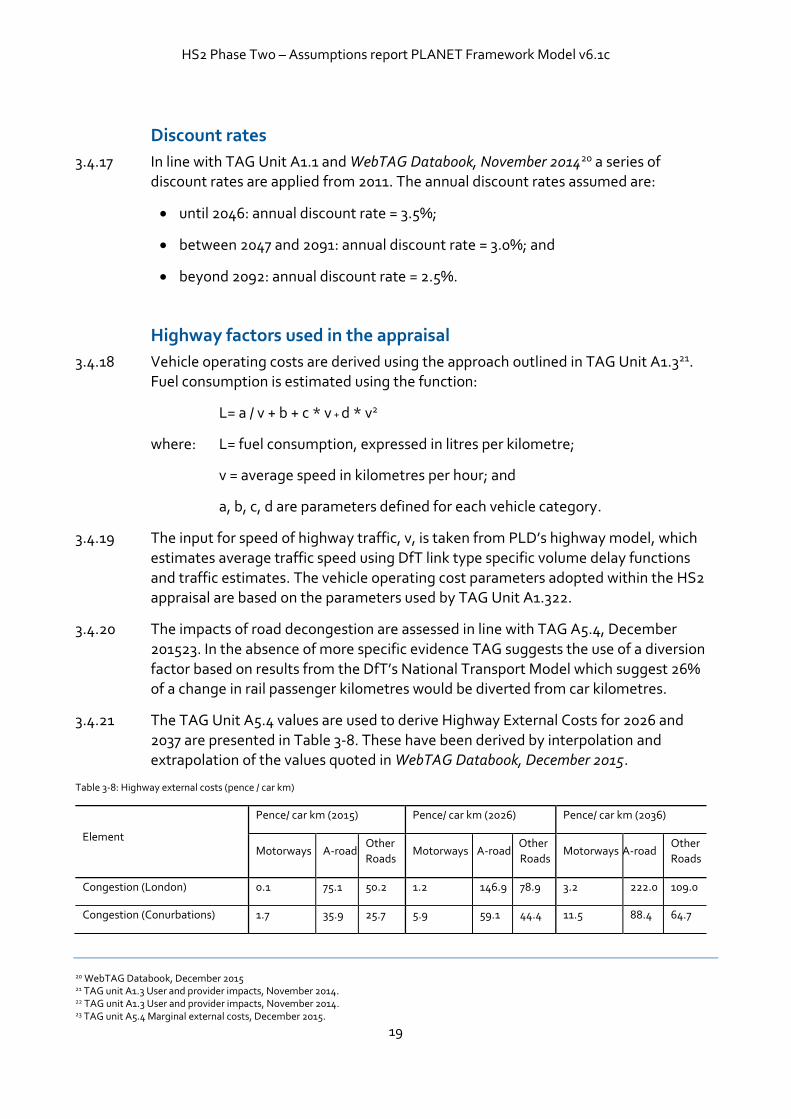
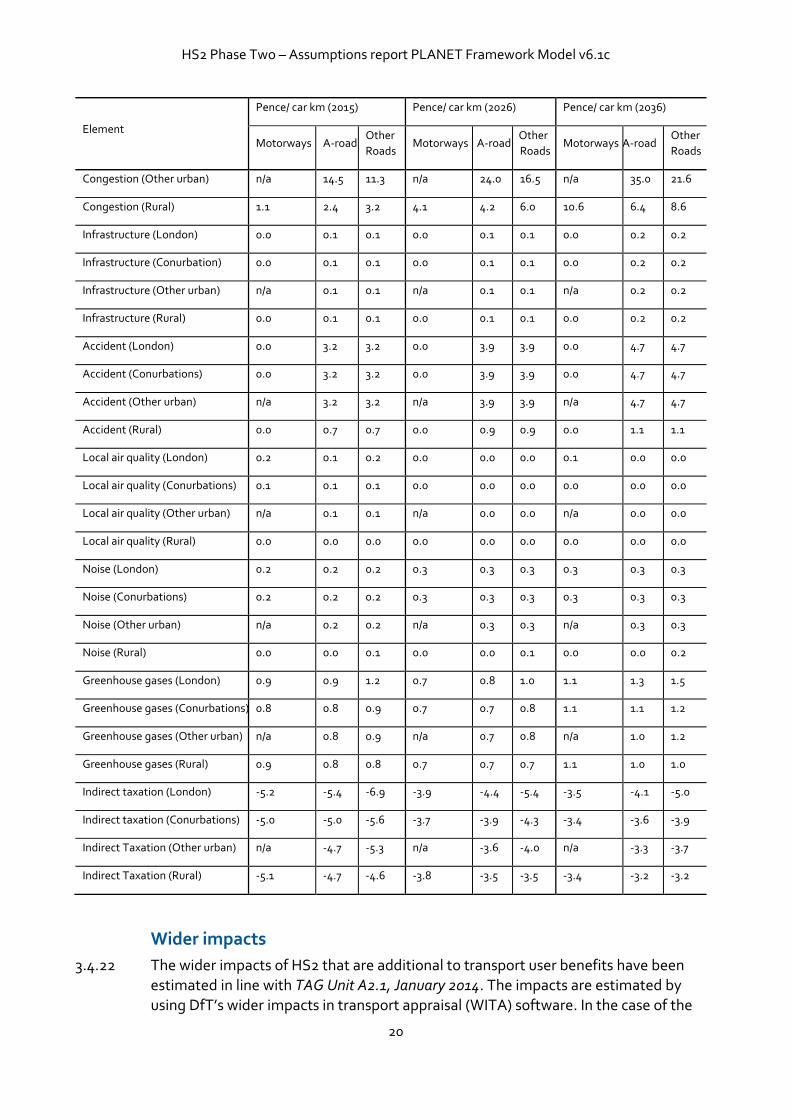
3.4.21 The TAG Unit A5.4 values are used to derive Highway External Costs for 2026 and 2037 are presented in Table 3-8. These have been derived by interpolation and extrapolation of the values quoted in WebTAG Databook, December 2015.
Table 3-8: Highway external costs (pence / car km)
Element
Pence/ car km (2015) Pence/ car km (2026) Pence/ car km (2036)
Motorways A-road Other
Roads Motorways A-road
Other
Roads Motorways A-road
Other
Roads
Congestion (London) 0.1 75.1 50.2 1.2 146.9 78.9 3.2 222.0 109.0
Congestion (Conurbations) 1.7 35.9 25.7 5.9 59.1 44.4 11.5 88.4 64.7
20 WebTAG Databook, December 2015 21 TAG unit A1.3 User and provider impacts, November 2014. 22 TAG unit A1.3 User and provider impacts, November 2014. 23 TAG unit A5.4 Marginal external costs, December 2015.
HS2 Phase Two – Assumptions report PLANET Framework Model v6.1c
20
Element
Pence/ car km (2015) Pence/ car km (2026) Pence/ car km (2036)
Motorways A-road Other
Roads Motorways A-road
Other
Roads Motorways A-road
Other
Roads
Congestion (Other urban) n/a 14.5 11.3 n/a 24.0 16.5 n/a 35.0 21.6
Congestion (Rural) 1.1 2.4 3.2 4.1 4.2 6.0 10.6 6.4 8.6
Infrastructure (London) 0.0 0.1 0.1 0.0 0.1 0.1 0.0 0.2 0.2
Infrastructure (Conurbation) 0.0 0.1 0.1 0.0 0.1 0.1 0.0 0.2 0.2
Infrastructure (Other urban) n/a 0.1 0.1 n/a 0.1 0.1 n/a 0.2 0.2
Infrastructure (Rural) 0.0 0.1 0.1 0.0 0.1 0.1 0.0 0.2 0.2
Accident (London) 0.0 3.2 3.2 0.0 3.9 3.9 0.0 4.7 4.7
Accident (Conurbations) 0.0 3.2 3.2 0.0 3.9 3.9 0.0 4.7 4.7
Accident (Other urban) n/a 3.2 3.2 n/a 3.9 3.9 n/a 4.7 4.7
Accident (Rural) 0.0 0.7 0.7 0.0 0.9 0.9 0.0 1.1 1.1
Local air quality (London) 0.2 0.1 0.2 0.0 0.0 0.0 0.1 0.0 0.0
Local air quality (Conurbations) 0.1 0.1 0.1 0.0 0.0 0.0 0.0 0.0 0.0
Local air quality (Other urban) n/a 0.1 0.1 n/a 0.0 0.0 n/a 0.0 0.0
Local air quality (Rural) 0.0 0.0 0.0 0.0 0.0 0.0 0.0 0.0 0.0
Noise (London) 0.2 0.2 0.2 0.3 0.3 0.3 0.3 0.3 0.3
Noise (Conurbations) 0.2 0.2 0.2 0.3 0.3 0.3 0.3 0.3 0.3
Noise (Other urban) n/a 0.2 0.2 n/a 0.3 0.3 n/a 0.3 0.3
Noise (Rural) 0.0 0.0 0.1 0.0 0.0 0.1 0.0 0.0 0.2
Greenhouse gases (London) 0.9 0.9 1.2 0.7 0.8 1.0 1.1 1.3 1.5
Greenhouse gases (Conurbations) 0.8 0.8 0.9 0.7 0.7 0.8 1.1 1.1 1.2
Greenhouse gases (Other urban) n/a 0.8 0.9 n/a 0.7 0.8 n/a 1.0 1.2
Greenhouse gases (Rural) 0.9 0.8 0.8 0.7 0.7 0.7 1.1 1.0 1.0
Indirect taxation (London) -5.2 -5.4 -6.9 -3.9 -4.4 -5.4 -3.5 -4.1 -5.0
Indirect taxation (Conurbations) -5.0 -5.0 -5.6 -3.7 -3.9 -4.3 -3.4 -3.6 -3.9
Indirect Taxation (Other urban) n/a -4.7 -5.3 n/a -3.6 -4.0 n/a -3.3 -3.7
Indirect Taxation (Rural) -5.1 -4.7 -4.6 -3.8 -3.5 -3.5 -3.4 -3.2 -3.2
Wider impacts
3.4.22 The wider impacts of HS2 that are additional to transport user benefits have been estimated in line with TAG Unit A2.1, January 2014. The impacts are estimated by using DfT’s wider impacts in transport appraisal (WITA) software. In the case of the
HS2 Phase Two – Assumptions report PLANET Framework Model v6.1c
21
output change in imperfectly competitive markets WebTAG recommends these are estimated as being equivalent in value to 10% of the business user transport benefits.
Carbon impacts
3.4.23 The impacts of HS2 on emissions of carbon from highway and diesel train use have been appraised using a bespoke model. It uses PFMv6.1c assumptions. These are:
Assumptions for car fuel consumption, car emissions and the value of a non-traded tonne of carbon from WebTAG;
Train kms and highway kms from PFM;
Car speeds for long distance and local from the DfT’s National Transport Model; and
Diesel train energy consumption is sourced from DfT’s Rail Emissions Model.
4 Highway and air networks 4.1 Background
4.1.1 Within PLD and the regional PLANET models are a series of networks for the ‘Do Minimum’ and ‘Do Something’ scenarios. Chapter 4 outlines the assumptions made for the air and highway networks. Chapters 5 and 6 outline the assumptions related to the rail networks.
4.2 ‘Do Minimum’ and ‘Do Something’ highway networks
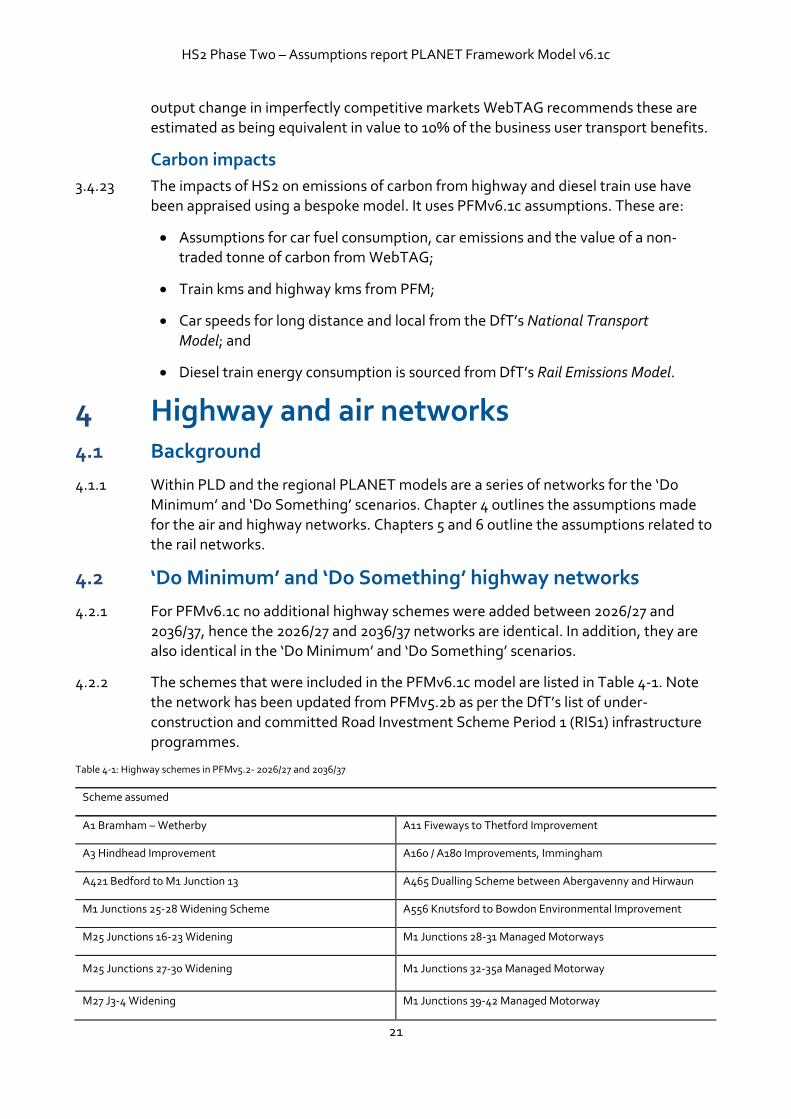
4.2.1 For PFMv6.1c no additional highway schemes were added between 2026/27 and 2036/37, hence the 2026/27 and 2036/37 networks are identical. In addition, they are also identical in the ‘Do Minimum’ and ‘Do Something’ scenarios.
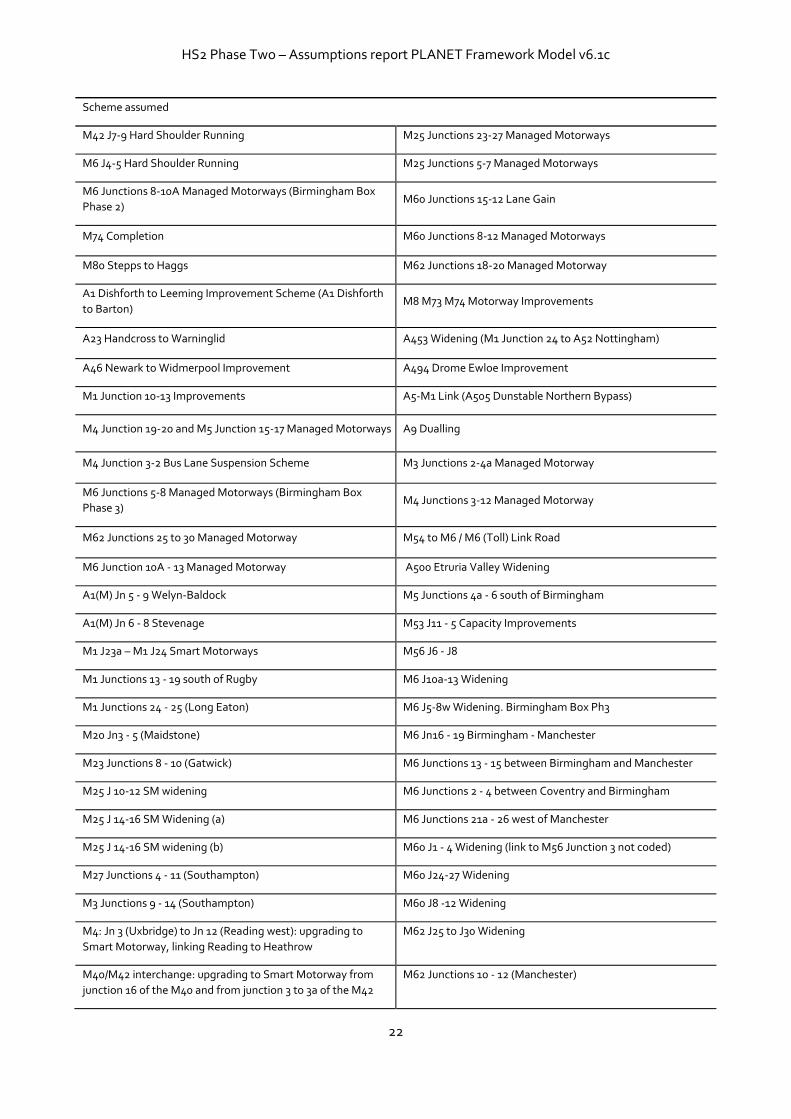
4.2.2 The schemes that were included in the PFMv6.1c model are listed in Table 4-1. Note the network has been updated from PFMv5.2b as per the DfT’s list of under-construction and committed Road Investment Scheme Period 1 (RIS1) infrastructure programmes.
Table 4-1: Highway schemes in PFMv5.2- 2026/27 and 2036/37
Scheme assumed
A1 Bramham – Wetherby A11 Fiveways to Thetford Improvement
A3 Hindhead Improvement A160 / A180 Improvements, Immingham
A421 Bedford to M1 Junction 13 A465 Dualling Scheme between Abergavenny and Hirwaun
M1 Junctions 25-28 Widening Scheme A556 Knutsford to Bowdon Environmental Improvement
M25 Junctions 16-23 Widening M1 Junctions 28-31 Managed Motorways
M25 Junctions 27-30 Widening M1 Junctions 32-35a Managed Motorway
M27 J3-4 Widening M1 Junctions 39-42 Managed Motorway
HS2 Phase Two – Assumptions report PLANET Framework Model v6.1c
22
Scheme assumed
M42 J7-9 Hard Shoulder Running M25 Junctions 23-27 Managed Motorways
M6 J4-5 Hard Shoulder Running M25 Junctions 5-7 Managed Motorways
M6 Junctions 8-10A Managed Motorways (Birmingham Box
Phase 2) M60 Junctions 15-12 Lane Gain
M74 Completion M60 Junctions 8-12 Managed Motorways
M80 Stepps to Haggs M62 Junctions 18-20 Managed Motorway
A1 Dishforth to Leeming Improvement Scheme (A1 Dishforth
to Barton) M8 M73 M74 Motorway Improvements
A23 Handcross to Warninglid A453 Widening (M1 Junction 24 to A52 Nottingham)
A46 Newark to Widmerpool Improvement A494 Drome Ewloe Improvement
M1 Junction 10-13 Improvements A5-M1 Link (A505 Dunstable Northern Bypass)
M4 Junction 19-20 and M5 Junction 15-17 Managed Motorways A9 Dualling
M4 Junction 3-2 Bus Lane Suspension Scheme M3 Junctions 2-4a Managed Motorway
M6 Junctions 5-8 Managed Motorways (Birmingham Box
Phase 3) M4 Junctions 3-12 Managed Motorway
M62 Junctions 25 to 30 Managed Motorway M54 to M6 / M6 (Toll) Link Road
M6 Junction 10A - 13 Managed Motorway A500 Etruria Valley Widening
A1(M) Jn 5 - 9 Welyn-Baldock M5 Junctions 4a - 6 south of Birmingham
A1(M) Jn 6 - 8 Stevenage M53 J11 - 5 Capacity Improvements
M1 J23a – M1 J24 Smart Motorways M56 J6 - J8
M1 Junctions 13 - 19 south of Rugby M6 J10a-13 Widening
M1 Junctions 24 - 25 (Long Eaton) M6 J5-8w Widening. Birmingham Box Ph3
M20 Jn3 - 5 (Maidstone) M6 Jn16 - 19 Birmingham - Manchester
M23 Junctions 8 - 10 (Gatwick) M6 Junctions 13 - 15 between Birmingham and Manchester
M25 J 10-12 SM widening M6 Junctions 2 - 4 between Coventry and Birmingham
M25 J 14-16 SM Widening (a) M6 Junctions 21a - 26 west of Manchester
M25 J 14-16 SM widening (b) M60 J1 - 4 Widening (link to M56 Junction 3 not coded)
M27 Junctions 4 - 11 (Southampton) M60 J24-27 Widening
M3 Junctions 9 - 14 (Southampton) M60 J8 -12 Widening
M4: Jn 3 (Uxbridge) to Jn 12 (Reading west): upgrading to
Smart Motorway, linking Reading to Heathrow
M62 J25 to J30 Widening
M40/M42 interchange: upgrading to Smart Motorway from
junction 16 of the M40 and from junction 3 to 3a of the M42
M62 Junctions 10 - 12 (Manchester)
HS2 Phase Two – Assumptions report PLANET Framework Model v6.1c
23
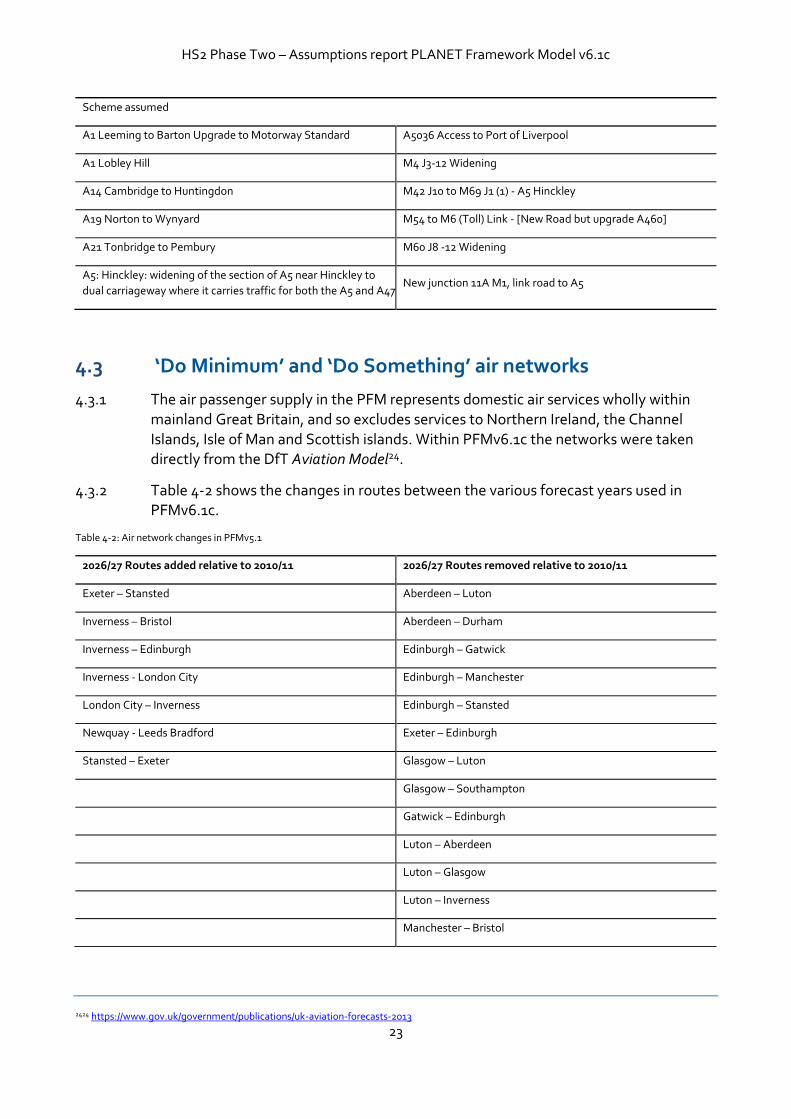
Scheme assumed
A1 Leeming to Barton Upgrade to Motorway Standard A5036 Access to Port of Liverpool
A1 Lobley Hill M4 J3-12 Widening
A14 Cambridge to Huntingdon M42 J10 to M69 J1 (1) - A5 Hinckley
A19 Norton to Wynyard M54 to M6 (Toll) Link - [New Road but upgrade A460]
A21 Tonbridge to Pembury M60 J8 -12 Widening
A5: Hinckley: widening of the section of A5 near Hinckley to
dual carriageway where it carries traffic for both the A5 and A47 New junction 11A M1, link road to A5
4.3 ‘Do Minimum’ and ‘Do Something’ air networks
4.3.1 The air passenger supply in the PFM represents domestic air services wholly within mainland Great Britain, and so excludes services to Northern Ireland, the Channel
Islands, Isle of Man and Scottish islands. Within PFMv6.1c the networks were taken directly from the DfT Aviation Model24.
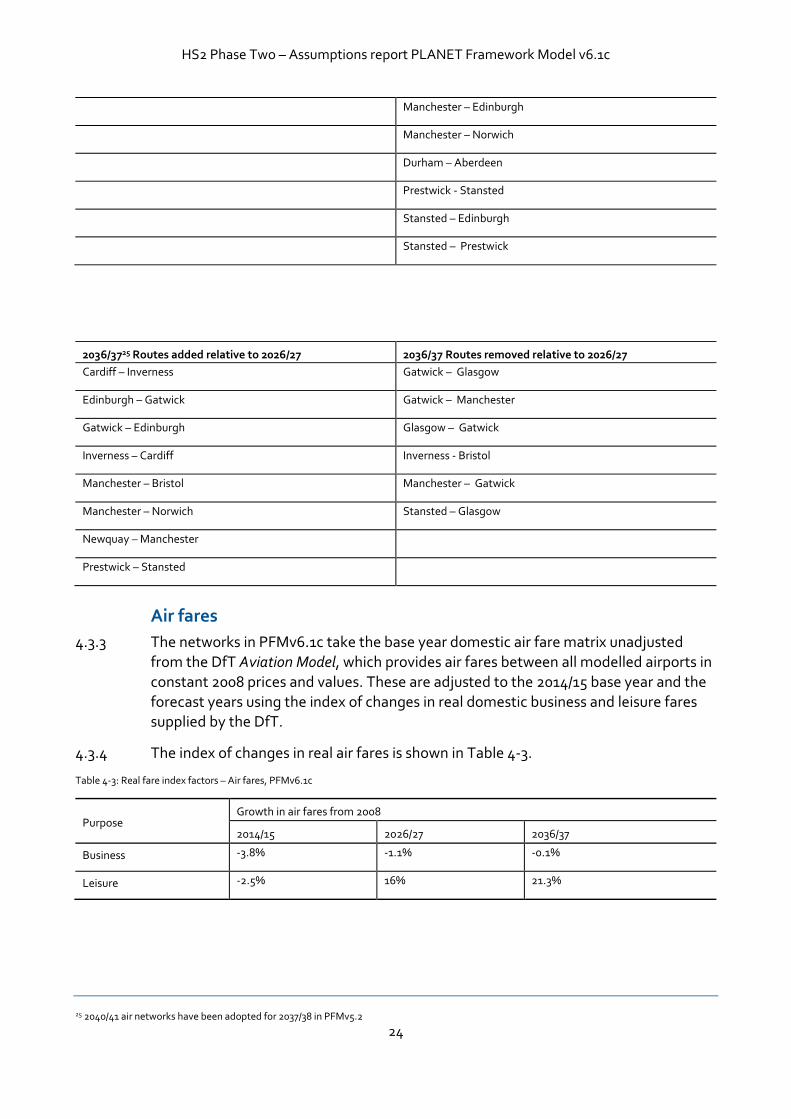
4.3.2 Table 4-2 shows the changes in routes between the various forecast years used in PFMv6.1c.
Table 4-2: Air network changes in PFMv5.1
2026/27 Routes added relative to 2010/11 2026/27 Routes removed relative to 2010/11
Exeter – Stansted Aberdeen – Luton
Inverness – Bristol Aberdeen – Durham
Inverness – Edinburgh Edinburgh – Gatwick
Inverness - London City Edinburgh – Manchester
London City – Inverness Edinburgh – Stansted
Newquay - Leeds Bradford Exeter – Edinburgh
Stansted – Exeter Glasgow – Luton
Glasgow – Southampton
Gatwick – Edinburgh
Luton – Aberdeen
Luton – Glasgow
Luton – Inverness
Manchester – Bristol
2424 https://www.gov.uk/government/publications/uk-aviation-forecasts-2013
HS2 Phase Two – Assumptions report PLANET Framework Model v6.1c
24
Manchester – Edinburgh
Manchester – Norwich
Durham – Aberdeen
Prestwick - Stansted
Stansted – Edinburgh
Stansted – Prestwick
2036/3725 Routes added relative to 2026/27 2036/37 Routes removed relative to 2026/27
Cardiff – Inverness Gatwick – Glasgow
Edinburgh – Gatwick Gatwick – Manchester
Gatwick – Edinburgh Glasgow – Gatwick
Inverness – Cardiff Inverness - Bristol
Manchester – Bristol Manchester – Gatwick
Manchester – Norwich Stansted – Glasgow
Newquay – Manchester
Prestwick – Stansted
Air fares
4.3.3 The networks in PFMv6.1c take the base year domestic air fare matrix unadjusted from the DfT Aviation Model, which provides air fares between all modelled airports in
constant 2008 prices and values. These are adjusted to the 2014/15 base year and the forecast years using the index of changes in real domestic business and leisure fares supplied by the DfT.
4.3.4 The index of changes in real air fares is shown in Table 4-3.
Table 4-3: Real fare index factors – Air fares, PFMv6.1c
Purpose Growth in air fares from 2008
2014/15 2026/27 2036/37
Business -3.8% -1.1% -0.1%
Leisure -2.5% 16% 21.3%
25 2040/41 air networks have been adopted for 2037/38 in PFMv5.2
HS2 Phase Two – Assumptions report PLANET Framework Model v6.1c
25
5 Rail network: ‘Do Minimum’ 5.1 Background
5.1.1 The rail networks within PFMv6.1c include a representation of a timetable and its associated capacity. The ‘Do Minimum’ provides a reference against which the ‘Do something’ HS2 option is compared.
5.1.2 With a few exceptions, the ‘Do Minimum’ timetable assumptions are based on future committed schemes only. The ‘Do Minimum’ makes use of information provided by the DfT for Network Rail services and Transport for London (TfL) for London Underground Limited (LUL) services. The rail and LUL ‘Do Minimum’ networks are assumed to be identical in the 2026/27 (first forecast year model) and 2036/37 (second forecast year).
5.1.3 These assumptions are designed only for the purpose of providing a suitable reference case for the appraisal of HS2. No decisions have yet been taken about train service requirements – or which stock will operate them – in any of the relevant franchises, and therefore these service patterns should be considered to be indicative.
5.1.4 In the PLD model these assumptions relate to the average service pattern on weekdays. Information used within the regional PLANET models relates to services during the morning peak period. Within these assumptions, no work has been undertaken to review the local commuter services.
5.1.5 A summary of the key assumptions used within the PLD sub-model of PFMv6.1c for the Train Operating Companies affected by HS2 are given in this chapter.
HS2 Phase Two – Assumptions report PLANET Framework Model v6.1c
26
5.2 Chiltern Railways
5.2.1 The ‘Do Minimum’ service and rolling stock assumptions for Chiltern Railways in PFMv6.1c have not been updated from PFMv5.2b and are described in the following sections.
5.2.2 The assumed future year ‘Do Minimum’ timetable includes Evergreen 3, which allows for new London Marylebone - Oxford services via Bicester Town to be introduced, as well as a small amount of train lengthening on some peak services between Aylesbury and High Wycombe.
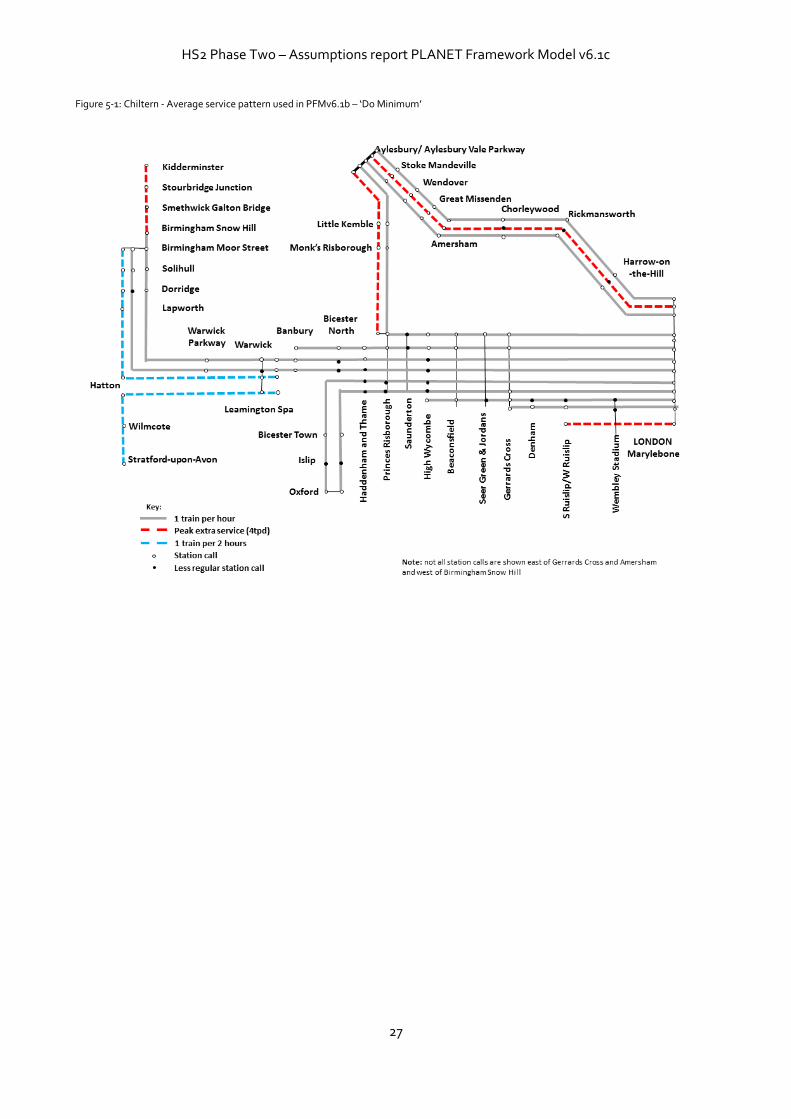
5.2.3 The main characteristics of the service specification are:
2 trains per hour (tph) + peak extras between London Marylebone and Aylesbury Vale Parkway/Aylesbury via Amersham;
2tph London Marylebone – Birmingham Snow Hill/Birmingham Moor Street;
2tph London Marylebone – Oxford;
1tph London Marylebone – Gerrards Cross;
1tph London Marylebone – Banbury;
1tph London Marylebone – High Wycombe;
2tph London Marylebone - Aylesbury Vale Parkway/Aylesbury via Princes Risborough;
0.5tph Leamington Spa – Birmingham Moor Street;
0.5tph Stratford-Upon-Avon – Leamington Spa;
5 trains per day (tpd) Princes Risborough – Aylesbury; and,
4tpd peak only London Marylebone – West Ruislip.
5.2.4 Figure 5-1 shows a summary of the service and service pattern assumed in the ‘Do Minimum’.
HS2 Phase Two – Assumptions report PLANET Framework Model v6.1c
27
Figure 5-1: Chiltern - Average service pattern used in PFMv6.1b – ‘Do Minimum’
HS2 Phase Two – Assumptions report PLANET Framework Model v6.1c
28
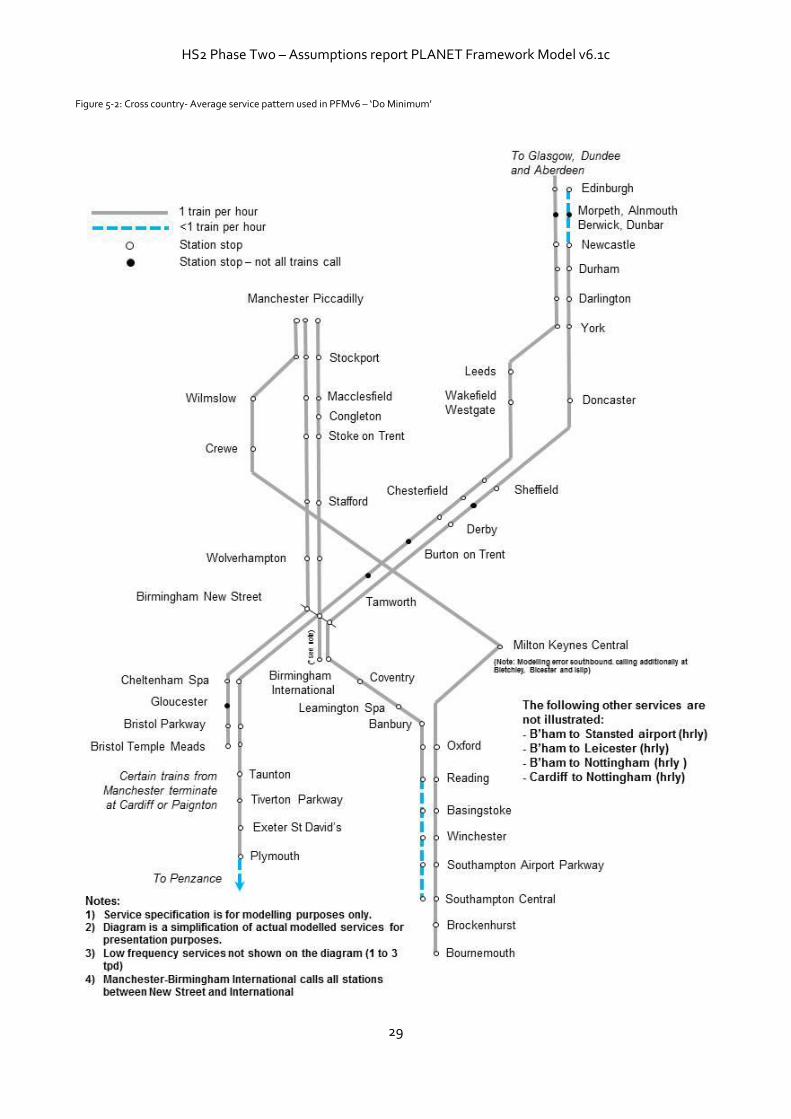
5.3 Cross country
5.3.1 The ‘Do Minimum’ assumptions for cross country in PFMv6.1c are updated compared to PFMv5.2b for some journey times between Birmingham and Nottingham and Birmingham and Sheffield.
5.3.2 The future year ‘Do Minimum’ timetable includes electrification, with an all-electric fleet, of 5-car Intercity Express Programme (IEP) trains on the cross country network with the exception of the Cardiff to Nottingham route which remain as Class 170 trains.
5.3.3 There are small changes in the future year ‘Do Minimum’ timetable from the modelled base year. A notable exception is the addition of an hourly service between Manchester and Birmingham International which was added due to extra train paths becoming available as a result of some Cross Country services being re-routed via
East-West Rail to take advantage of journey time improvements through electrification and to maintain Stockport/Macclesfield/Stoke-on-Trent frequencies to Birmingham New Street and Birmingham International.
5.3.4 In PFMv6 there was a partial update to the DM scenario to better reflect journey times for cross country services on the section of the network between Birmingham and Derby, and Birmingham and Nottingham. This is the section of the network that is in direct competition with the high speed (HS) services in Phase 2 of the HS2 scheme.
5.3.5 The capacity of the IEP trains is 328 seats and standing capacity for 181 using a factor of 2.5 passengers per metre square.
5.3.6 Figure 5-2 shows a summary of the service and stopping pattern assumed in the ‘Do Minimum’ for cross country services.
HS2 Phase Two – Assumptions report PLANET Framework Model v6.1c
29
Figure 5-2: Cross country- Average service pattern used in PFMv6 – ‘Do Minimum’
HS2 Phase Two – Assumptions report PLANET Framework Model v6.1c
30
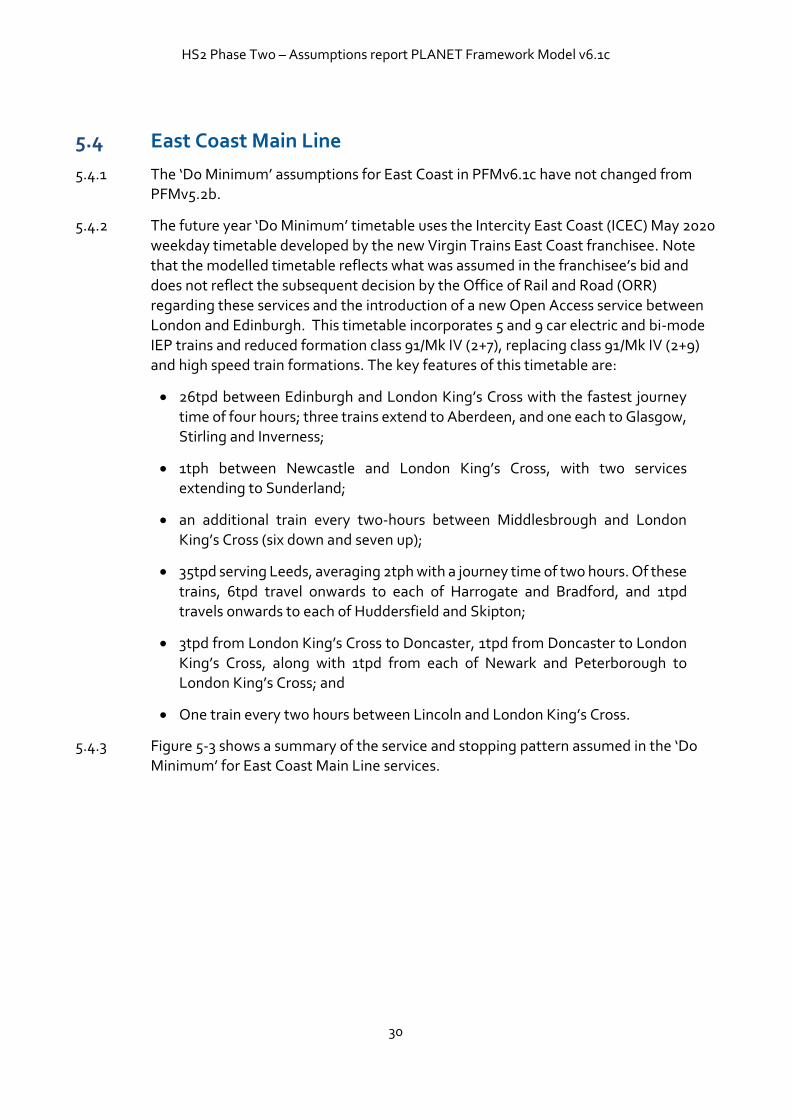
5.4 East Coast Main Line
5.4.1 The ‘Do Minimum’ assumptions for East Coast in PFMv6.1c have not changed from PFMv5.2b.
5.4.2 The future year ‘Do Minimum’ timetable uses the Intercity East Coast (ICEC) May 2020 weekday timetable developed by the new Virgin Trains East Coast franchisee. Note that the modelled timetable reflects what was assumed in the franchisee’s bid and does not reflect the subsequent decision by the Office of Rail and Road (ORR) regarding these services and the introduction of a new Open Access service between London and Edinburgh. This timetable incorporates 5 and 9 car electric and bi-mode IEP trains and reduced formation class 91/Mk IV (2+7), replacing class 91/Mk IV (2+9) and high speed train formations. The key features of this timetable are:
26tpd between Edinburgh and London King’s Cross with the fastest journey time of four hours; three trains extend to Aberdeen, and one each to Glasgow, Stirling and Inverness;
1tph between Newcastle and London King’s Cross, with two services extending to Sunderland;
an additional train every two-hours between Middlesbrough and London King’s Cross (six down and seven up);
35tpd serving Leeds, averaging 2tph with a journey time of two hours. Of these
trains, 6tpd travel onwards to each of Harrogate and Bradford, and 1tpd travels onwards to each of Huddersfield and Skipton;
3tpd from London King’s Cross to Doncaster, 1tpd from Doncaster to London King’s Cross, along with 1tpd from each of Newark and Peterborough to London King’s Cross; and
One train every two hours between Lincoln and London King’s Cross.
5.4.3 Figure 5-3 shows a summary of the service and stopping pattern assumed in the ‘Do Minimum’ for East Coast Main Line services.
HS2 Phase Two – Assumptions report PLANET Framework Model v6.1c
31
Figure 5-3: East Coast Main Line – Average service pattern used in PFMv6.1c – ‘Do Minimum’
HS2 Phase Two – Assumptions report PLANET Framework Model v6.1c
32
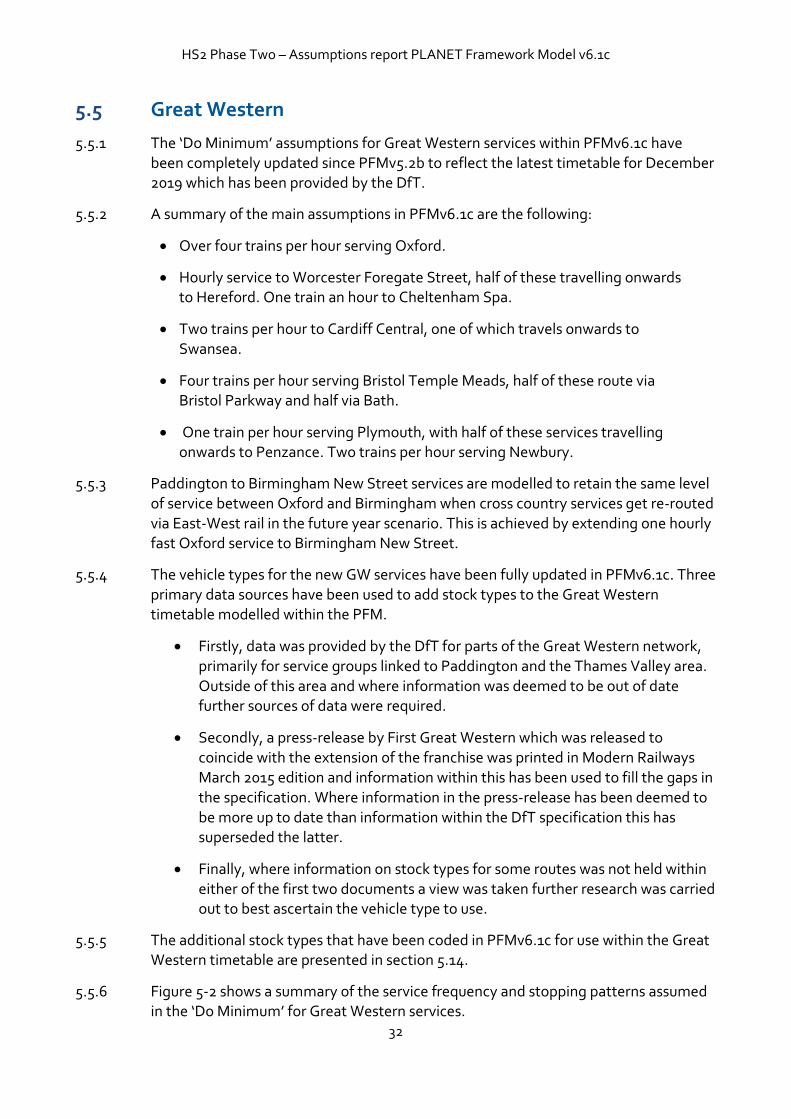
5.5 Great Western
5.5.1 The ‘Do Minimum’ assumptions for Great Western services within PFMv6.1c have been completely updated since PFMv5.2b to reflect the latest timetable for December 2019 which has been provided by the DfT.
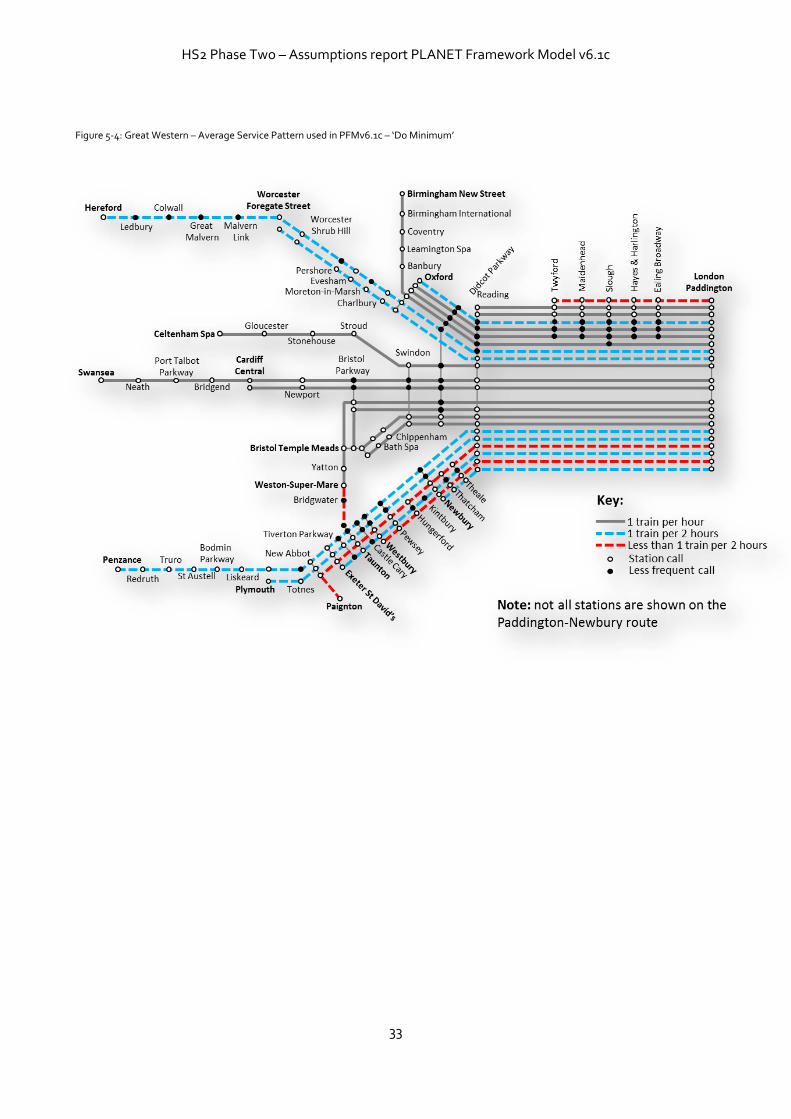
5.5.2 A summary of the main assumptions in PFMv6.1c are the following:
Over four trains per hour serving Oxford.
Hourly service to Worcester Foregate Street, half of these travelling onwards to Hereford. One train an hour to Cheltenham Spa.
Two trains per hour to Cardiff Central, one of which travels onwards to Swansea.
Four trains per hour serving Bristol Temple Meads, half of these route via Bristol Parkway and half via Bath.
One train per hour serving Plymouth, with half of these services travelling onwards to Penzance. Two trains per hour serving Newbury.
5.5.3 Paddington to Birmingham New Street services are modelled to retain the same level of service between Oxford and Birmingham when cross country services get re-routed via East-West rail in the future year scenario. This is achieved by extending one hourly fast Oxford service to Birmingham New Street.
5.5.4 The vehicle types for the new GW services have been fully updated in PFMv6.1c. Three primary data sources have been used to add stock types to the Great Western timetable modelled within the PFM.
Firstly, data was provided by the DfT for parts of the Great Western network, primarily for service groups linked to Paddington and the Thames Valley area. Outside of this area and where information was deemed to be out of date further sources of data were required.
Secondly, a press-release by First Great Western which was released to coincide with the extension of the franchise was printed in Modern Railways March 2015 edition and information within this has been used to fill the gaps in the specification. Where information in the press-release has been deemed to be more up to date than information within the DfT specification this has superseded the latter.
Finally, where information on stock types for some routes was not held within either of the first two documents a view was taken further research was carried out to best ascertain the vehicle type to use.
5.5.5 The additional stock types that have been coded in PFMv6.1c for use within the Great Western timetable are presented in section 5.14.
5.5.6 Figure 5-2 shows a summary of the service frequency and stopping patterns assumed in the ‘Do Minimum’ for Great Western services.
HS2 Phase Two – Assumptions report PLANET Framework Model v6.1c
33
Figure 5-4: Great Western – Average Service Pattern used in PFMv6.1c – ‘Do Minimum’
HS2 Phase Two – Assumptions report PLANET Framework Model v6.1c
34
5.6 London Midland
5.6.1 The ‘Do Minimum’ assumptions for London Midland have not changed since PFMv5.2b.
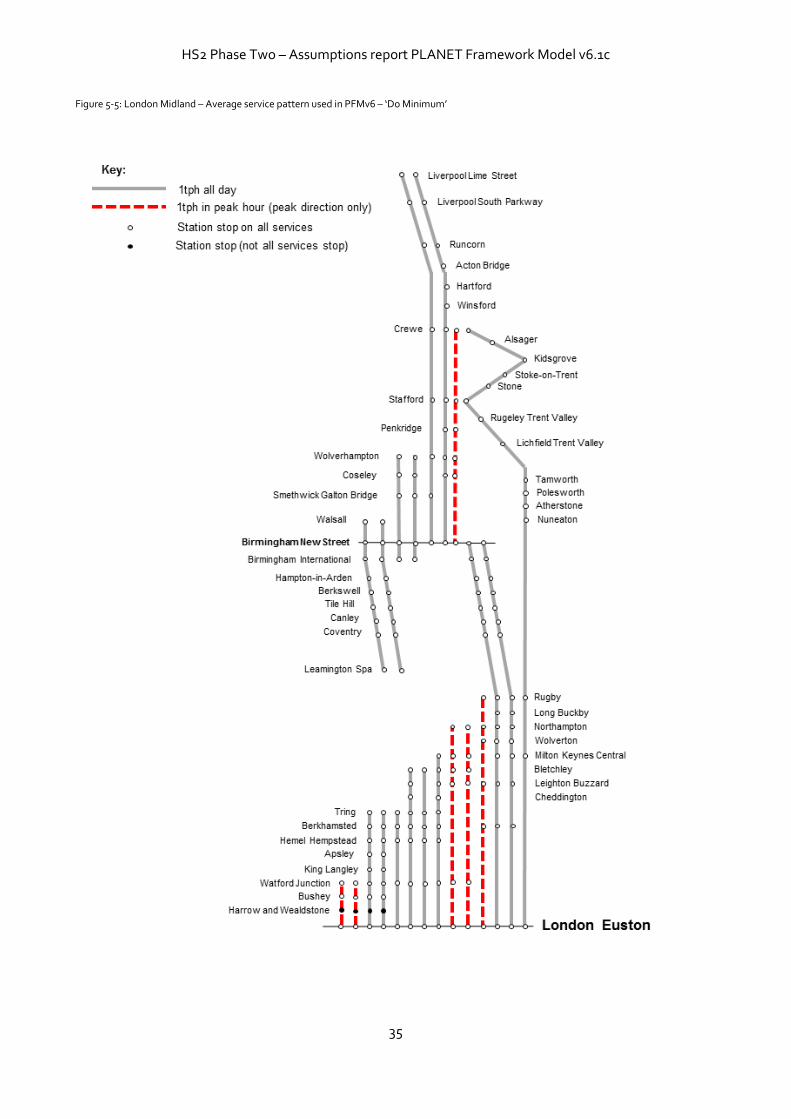
5.6.2 The London Midland future year ‘Do Minimum’ timetable allows for 110mph running on the fast lines and some train lengthening. Three trains per hour are scheduled to run at 110mph between London Euston and Ledburn Junction (south of Leighton Buzzard) which means that all Crewe services, most Northampton services, and some of the through Birmingham services benefit from accelerated journey times.
5.6.3 Key points of the London Midland specification are:
3tph between Birmingham New Street and London Euston;
1tph (peak period service only) between Coventry and Birmingham New Street;
1tph between London Euston and Crewe (via Trent Valley);
1tph between Birmingham International and Birmingham New Street;
1tph peak services between London Euston and Northampton;
2tph between Birmingham New Street and Liverpool Lime Street; and,
Services starting at Northampton, Milton Keynes Central and Tring to London Euston.
5.6.4 Figure 5-5 shows a summary of the service and stopping pattern assumed in the PFMv6.1c ‘Do Minimum’ for London Midland services.
HS2 Phase Two – Assumptions report PLANET Framework Model v6.1c
35
Figure 5-5: London Midland – Average service pattern used in PFMv6 – ‘Do Minimum’
HS2 Phase Two – Assumptions report PLANET Framework Model v6.1c
36
5.7 East Midlands
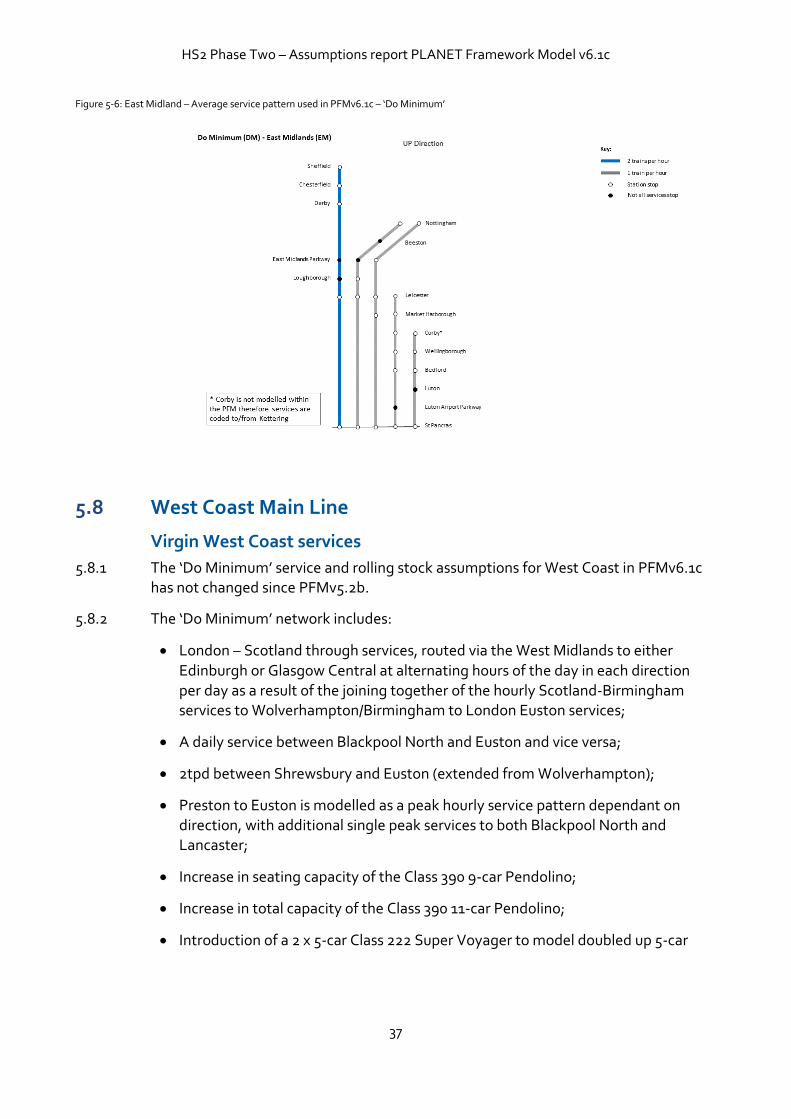
5.7.1 The ‘Do Minimum’ assumptions for East Midlands PFMv6.1c are the same as PFMv5.2b, with the exception of 10-car IEP trains being modelled in the peak on the Midland Mainline. 5-car trains are modelled during the off-peak.
5.7.2 The future year ‘Do Minimum’ PFMv5.2b timetable is based on the latest East Midlands (EM) Trains timetable which assumes electrification of the Midland main line and some line speed improvements. It includes the following:
1tph between Corby and London St Pancras (where the service is coded between Kettering and London St Pancras, as Corby is not included in PFM);
1tph between Leicester and London St Pancras;
2tph between Nottingham and London St Pancras; and
2tph between Sheffield and London St Pancras.
5.7.3 Elsewhere on the network the timetable changes are summarised as follows:
The EM service between Leicester and Liverpool has been truncated at Manchester, and re-routed to serve Derby rather than Nottingham;
The Nottingham to Worksop service has a reduced headway of 16 trains per day from 24; and
Numerous small variations in headway and journey time.
5.7.4 Figure 5-6 shows a summary of the service and stopping pattern assumed in the ‘Do Minimum’ for East Midland services.
HS2 Phase Two – Assumptions report PLANET Framework Model v6.1c
37
Figure 5-6: East Midland – Average service pattern used in PFMv6.1c – ‘Do Minimum’
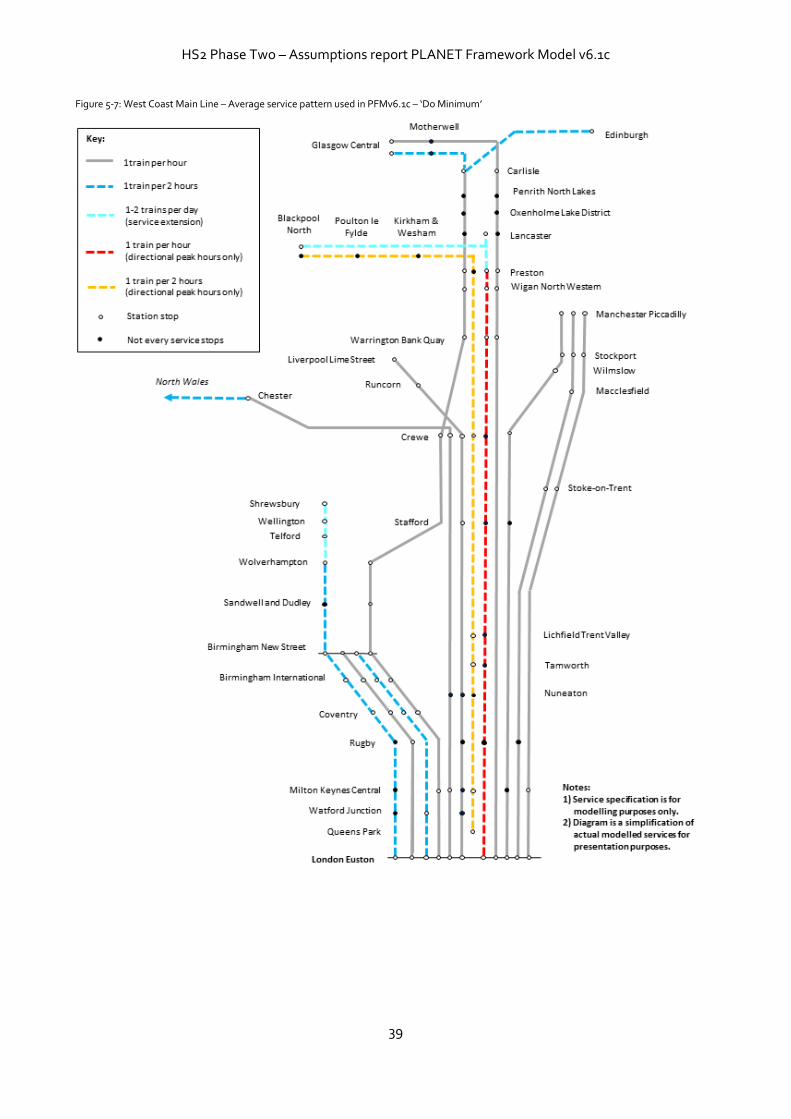
5.8 West Coast Main Line
Virgin West Coast services
5.8.1 The ‘Do Minimum’ service and rolling stock assumptions for West Coast in PFMv6.1c has not changed since PFMv5.2b.
5.8.2 The ‘Do Minimum’ network includes:
London – Scotland through services, routed via the West Midlands to either
Edinburgh or Glasgow Central at alternating hours of the day in each direction per day as a result of the joining together of the hourly Scotland-Birmingham services to Wolverhampton/Birmingham to London Euston services;
A daily service between Blackpool North and Euston and vice versa;
2tpd between Shrewsbury and Euston (extended from Wolverhampton);
Preston to Euston is modelled as a peak hourly service pattern dependant on direction, with additional single peak services to both Blackpool North and Lancaster;
Increase in seating capacity of the Class 390 9-car Pendolino;
Increase in total capacity of the Class 390 11-car Pendolino;
Introduction of a 2 x 5-car Class 222 Super Voyager to model doubled up 5-car
HS2 Phase Two – Assumptions report PLANET Framework Model v6.1c
38
‘Super Voyager’ trains26
Open access services
5.8.3 The ‘Do Minimum’ assumptions for West Coast open access services (GNWR, Great North Western Railways, operating as Grand Central) are newly included within PFMv6.1c.
5.8.4 A review was undertaken by HS2 Ltd to specify the timetable for open access services to be included within the ‘Do Minimum’ scenario. The resulting assumptions applied from the TAG paper are:
a) The London terminus for the Euston-Blackpool services in both directions would be modelled as Queen’s Park (QPW) rather than Euston.
b) The journey time between Queen’s Park and the next stop (Milton Keynes Central) would maintain the Milton Keynes Central to Euston travel time.
5.8.5 The ‘Do Minimum’ network includes:
6 trains Blackpool North – Queens Park (proxy for Euston).
5 trains Queens Park (proxy for Euston) – Blackpool North, plus 1 extra train Queens Park (proxy for Euston) – Crewe.
5.8.6 Figure 5-7 shows a summary of the service and stopping pattern assumed in the ‘Do Minimum’ for West Coast Main Line services with the open access additions overlaid.
26 The operating cost model treats 10-car Super Voyager units as vehicle type 222 to avoid spurious results.
HS2 Phase Two – Assumptions report PLANET Framework Model v6.1c
39
Figure 5-7: West Coast Main Line – Average service pattern used in PFMv6.1c – ‘Do Minimum’
HS2 Phase Two – Assumptions report PLANET Framework Model v6.1c
40
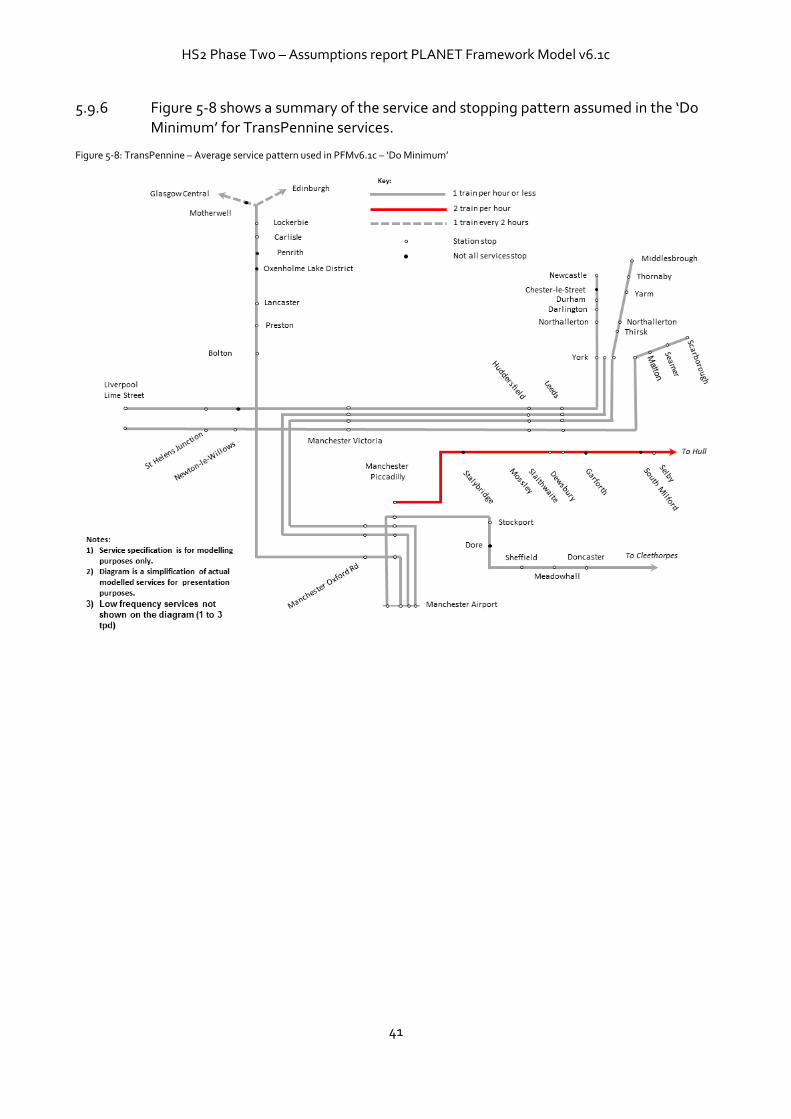
5.9 TransPennine
5.9.1 The ‘Do Minimum’ services in PFMv6.1c for TransPennine have been fully updated from PFMv5.2b. The updates are based on December 2019 timetable and a train plan including stock information and peak loading points.
5.9.2 On the TransPennine routes the PFMv6.1c future year timetable assumes the following services through the Manchester – Leeds core:
2tph between Manchester and Hull via Leeds;
5tpd between Liverpool Lime Street and Newcastle;
4tpd between Manchester Airport and York Via Leeds ;
1tph between Manchester Airport and Middlesbrough Via Leeds; and,
11tpd between Manchester Airport and Newcastle.
5.9.3 A further 1tph operates between Manchester Airport alternately to Edinburgh or Glasgow via the West Coast main line.
5.9.4 The following stock type assumptions were included within the TransPennine timetable in PFMv6.1c and were accurate at time of coding:
Class 350 EMUs on Manchester Airport to Edinburgh/Glasgow services are replaced by 5-car EMUs (125mph 23m CAF);
All Class 185s on Leeds/Hull services replaced by 6-car EMUs (125mph 23m vehicles as per CAF trains for Manchester–Scotland);
Newcastle and Edinburgh services to become 6-car EMUs (125mph 23m vehicles as above); and,
Scarborough and Middlesbrough services become 5-car bi-mode AT300.
5.9.5 The following characteristics were included within the TransPennine service pattern in PFMv6.1c:
Retain pre-electrification stops between Stalybridge and Huddersfield (exclusive) for TPE Manchester Piccadilly to Leeds/Hull services;
Removal of all stops from TPE Manchester to Leeds/Hull services except for Dewsbury; and,
Extend TPE Man Piccadilly–Leeds service to Selby and Hull, replacing a segment of Northern Bridlington–Hull–Leeds–Bradford – Huddersfield. In the peaks the extended service calls at all stations Leeds to Selby, and then as per replaced Bridlington DMU service. In the off-peak the service is fast from Leeds to Selby, then as per superseded Bridlington DMU service as far as Hull (and no further).
HS2 Phase Two – Assumptions report PLANET Framework Model v6.1c
41
5.9.6 Figure 5-8 shows a summary of the service and stopping pattern assumed in the ‘Do Minimum’ for TransPennine services.
Figure 5-8: TransPennine – Average service pattern used in PFMv6.1c – ‘Do Minimum’
HS2 Phase Two – Assumptions report PLANET Framework Model v6.1c
42
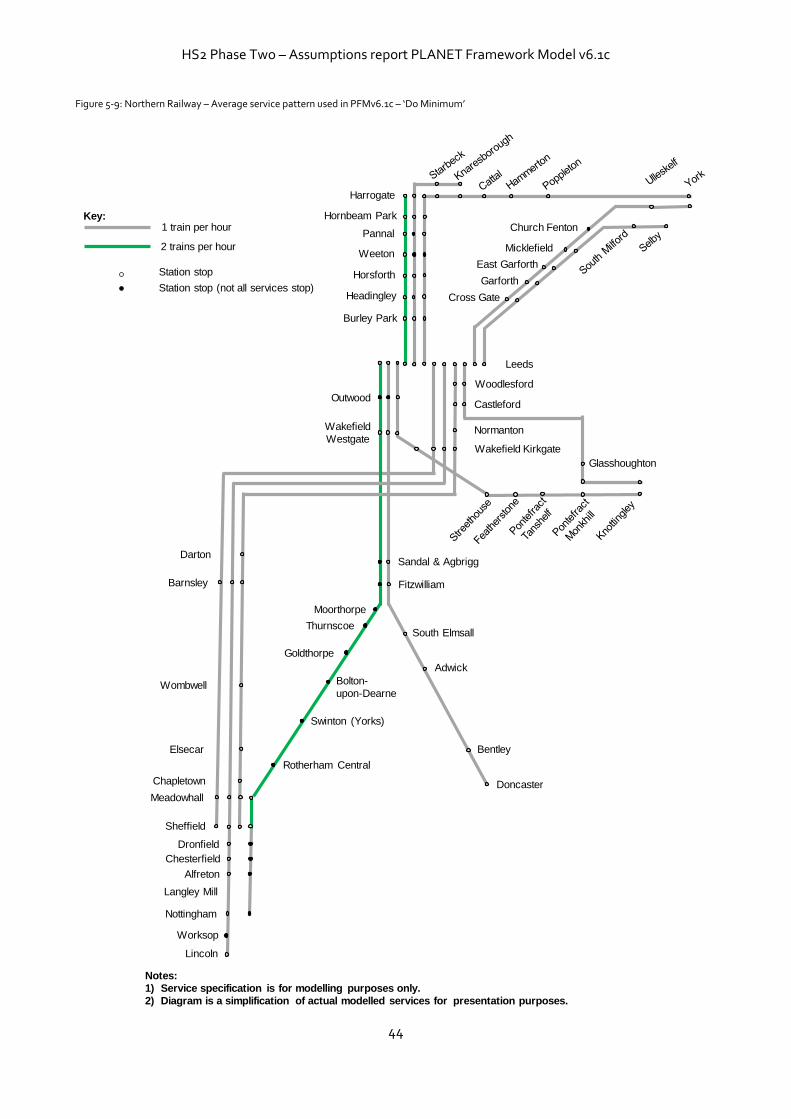
5.10 Northern Railway
5.10.1 The ‘Do Minimum’ services in PFMv6.1c for Northern Railway have been fully updated from PFMv5.2b. The updates are based on December 2019 timetable and a train plan including stock information and peak loading points.
5.10.2 For key corridors in the Northern Railway network, the PFMv6.1c future year timetable assumes the following services through the corridors:
On the Leeds–Doncaster corridor the following services to/from Leeds:
1tph Bradford Interchange to Nottingham via Leeds;
1tph Leeds to Knottingley via Wakefield Westgate;
1.5tph to Sheffield via Rotherham stopping service; and
1tph to Doncaster calling all stations.
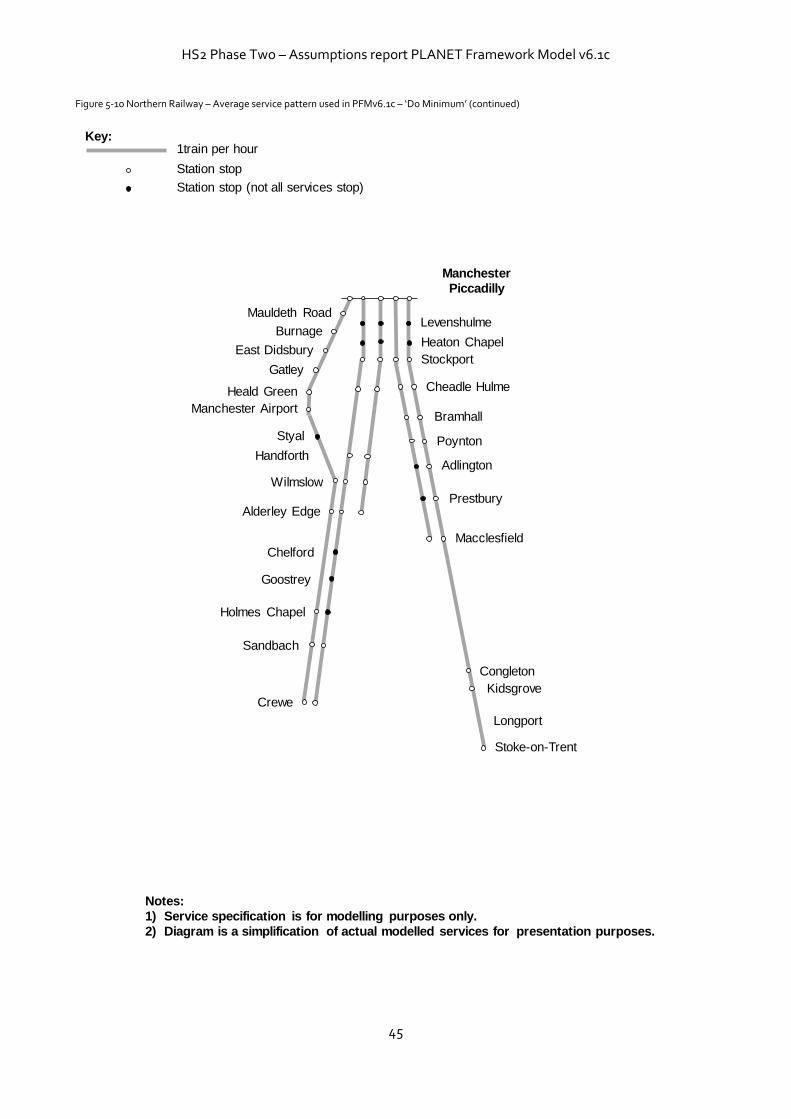
On the South Manchester corridor, the following services to/from Manchester Piccadilly:
1tph to Crewe via Stockport;
1tph to Alderley Edge via Stockport;
1tph to Macclesfield;
1tpd to Stoke on Trent semi-fast;
1tph to Crewe via Manchester Airport;
4tph all day Manchester–Hazel Grove with 2tph to New Mills Newtown and 1tph to Buxton;
2tph all day Manchester–Stockport–Greenbank with 1tph to Chester;
1tph all day semi-fast Manchester Victoria–Warrington Bank Quay–Chester, extended to Calder Valley; and
Fast services via Chat Moss and CLC routes swap between Northern and TPE, with Northern operating Liverpool–Warrington–Manchester Airport fast service.
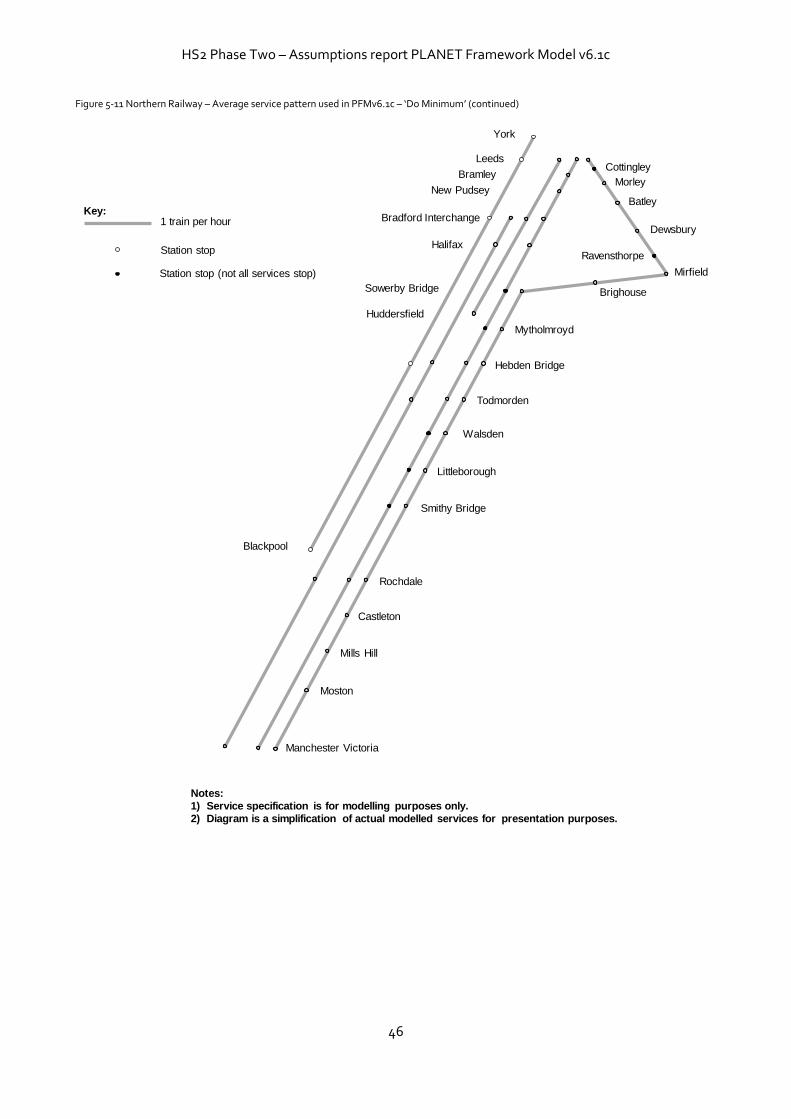
On the Calder Valley corridor, the following services to/from Leeds:
1tph to Huddersfield via Bradford;
1tph York to Blackpool North;
3tph to Manchester Victoria, extended to Liverpool, Chester and Southport;
1tph Bradford Interchange to Manchester Victoria and Manchester Airport; and
2tph Manchester Victoria–Rochdale stopping service enabling all through trains to
HS2 Phase Two – Assumptions report PLANET Framework Model v6.1c
43
Yorkshire to be non-stop on this section.
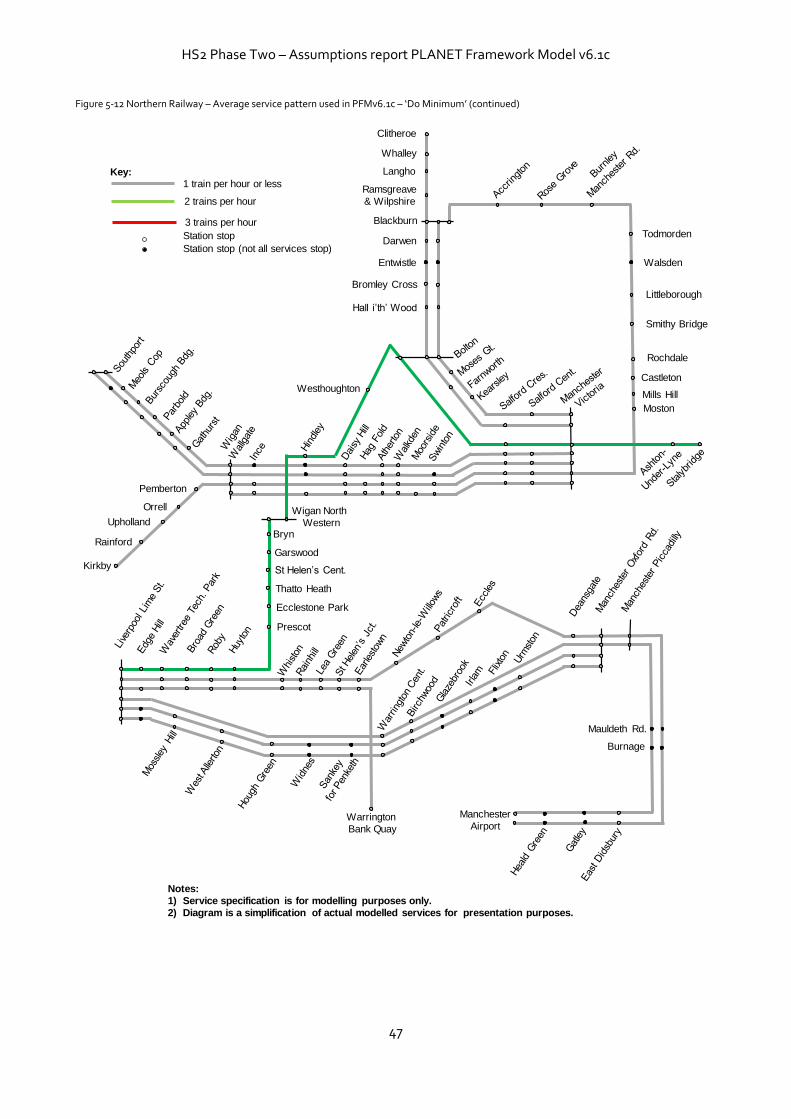
On the North West Electrification corridor, the following services to/from Manchester Piccadilly / Manchester Victoria:
2tph to Blackpool via Bolton;
1tph to Preston;
1tph to Wigan Wallgate;
1tph to Kirkby;
2tph to Blackburn, of which 1tph to Clitheroe;
1tph to Southport (from Calder Valley);
1tph to Southport stopping service;
1tph Liverpool Lime Street stopping service; and
1tph Liverpool Lime Street fast service (from Calder Valley).
5.10.3 The additional service specification includes:
York – Hull service becomes 1tph all day with DMU prior to TransPennine and Hull electrification;
Retain peak direction only Manchester Piccadilly–Huddersfield stopping service;
Remove all stops other than Church Fenton from Northern Blackpool–York DMU, with 2tph stopping service to Selby;
New 1tph Middlesbrough–Newcastle via Durham in addition to existing
service via Sunderland. New train calls at Thornaby, Stockton, Durham and Chester-le-Street;
Darlington–Bishop Auckland hourly as extensions of Saltburn services;
Extension of Bridlington–Hull services via Selby to Leeds;
4tph all day Leeds–Harrogate; and
1tph Knottingley–Wakefield extended to Leeds, with 1tph Huddersfield–Wakefield extended to Castleford.
5.10.4 Figures 5-9 to 5-12 show a summary of the service and stopping pattern assumed in the ‘Do Minimum’ for Northern services.
HS2 Phase Two – Assumptions report PLANET Framework Model v6.1c
44
Figure 5-9: Northern Railway – Average service pattern used in PFMv6.1c – ‘Do Minimum’
Leeds
Wakefield
Westgate
Doncaster
Rotherham Central
Barnsley
Meadowhall
Sheffield
Nottingham
Wakefield Kirkgate
Station stop
1 train per hourKey:
Sandal & Agbrigg
South Elmsall
Adwick
Bentley
Dronfield
Chesterfield
Alfreton
Langley Mill
Fitzwilliam
Moorthorpe
Thurnscoe
Goldthorpe
Bolton-
upon-Dearne
Normanton
Swinton (Yorks)
Notes:
1) Service specification is for modelling purposes only.
2) Diagram is a simplification of actual modelled services for presentation purposes.
Woodlesford
Castleford
Darton
Chapletown
Elsecar
Wombwell
Station stop (not all services stop)
Outwood
Glasshoughton
Burley Park
Headingley
Horsforth
Weeton
Pannal
Hornbeam Park
Harrogate
Cross Gate
Garforth
East Garforth
Micklefield
Church Fenton
2 trains per hour
Lincoln
Worksop
HS2 Phase Two – Assumptions report PLANET Framework Model v6.1c
45
Figure 5-10 Northern Railway – Average service pattern used in PFMv6.1c – ‘Do Minimum’ (continued)
Manchester
Piccadilly
Congleton
Crewe
Sandbach
Wilmslow
Kidsgrove
Manchester Airport
Alderley Edge
Chelford
Goostrey
Holmes Chapel
Handforth
Macclesfield
Stockport
Cheadle Hulme
Bramhall
Poynton
Stoke-on-Trent
Adlington
Prestbury
Styal
Heald Green
Gatley
East Didsbury
Burnage
Mauldeth RoadLevenshulme
Heaton Chapel
Longport
Notes:
1) Service specification is for modelling purposes only.
2) Diagram is a simplification of actual modelled services for presentation purposes.
Station stop
1train per hourKey:
Station stop (not all services stop)
HS2 Phase Two – Assumptions report PLANET Framework Model v6.1c
46
Figure 5-11 Northern Railway – Average service pattern used in PFMv6.1c – ‘Do Minimum’ (continued)
Leeds
Notes:
1) Service specification is for modelling purposes only.
2) Diagram is a simplification of actual modelled services for presentation purposes.
Bramley
New Pudsey
Bradford Interchange
Halifax
Sowerby Bridge
Cottingley
Morley
Batley
Dewsbury
Ravensthorpe
Mirfield
Brighouse
Manchester Victoria
Mytholmroyd
Hebden Bridge
Todmorden
Walsden
Littleborough
Smithy Bridge
Rochdale
Castleton
Mills Hill
Moston
Station stop
1 train per hourKey:
Station stop (not all services stop)
Huddersfield
Blackpool
York
HS2 Phase Two – Assumptions report PLANET Framework Model v6.1c
47
Figure 5-12 Northern Railway – Average service pattern used in PFMv6.1c – ‘Do Minimum’ (continued)
Clitheroe
Whalley
Langho
Ramsgreave
& Wilpshire
Blackburn
Darwen
Entwistle
Bromley Cross
Hall i’th’ Wood
Todmorden
Rochdale
Walsden
Littleborough
Smithy Bridge
Castleton
Mills Hill
Moston
Westhoughton
Wigan North
Western
Kirkby
Rainford
Upholland
Orrell
Pemberton
Prescot
Ecclestone Park
Thatto Heath
St Helen’s Cent.
Garswood
Bryn
Warrington
Bank Quay
Manchester
Airport
Burnage
Mauldeth Rd.
Notes:
1) Service specification is for modelling purposes only.
2) Diagram is a simplification of actual modelled services for presentation purposes.
Station stop
1 train per hour or lessKey:
Station stop (not all services stop)
3 trains per hour
2 trains per hour
HS2 Phase Two – Assumptions report PLANET Framework Model v6.1c
48
5.11 East-West Rail
5.11.1 The ‘Do Minimum’ assumptions for the East West Rail Link in PFMv6.1c are the same as used in PFMv5.2b.
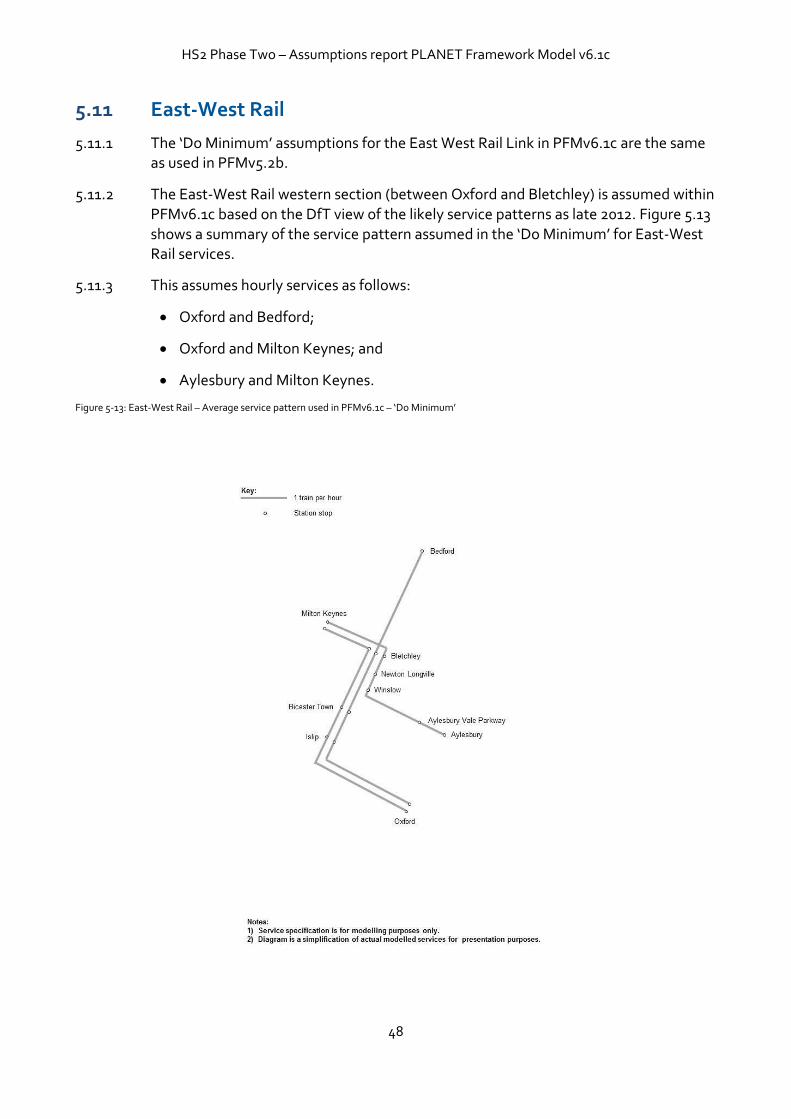
5.11.2 The East-West Rail western section (between Oxford and Bletchley) is assumed within PFMv6.1c based on the DfT view of the likely service patterns as late 2012. Figure 5.13 shows a summary of the service pattern assumed in the ‘Do Minimum’ for East-West Rail services.
5.11.3 This assumes hourly services as follows:
Oxford and Bedford;
Oxford and Milton Keynes; and
Aylesbury and Milton Keynes.
Figure 5-13: East-West Rail – Average service pattern used in PFMv6.1c – ‘Do Minimum’
HS2 Phase Two – Assumptions report PLANET Framework Model v6.1c
49
5.12 Other services
5.12.1 The ‘Do Minimum’ assumptions for CrossRail in pFMv6.1c have been updated. The ‘Do Minimum’ service pattern assumes:
A service every half an hour on the full length of the route between Shenfield and Reading in both directions.
A service every 15 minutes between Shenfield and Maidenhead.
Services on the Heathrow spur run every 15 minutes from Abbey Wood27.
A service approximately every three minutes on the core section of the route between Liverpool Street and Paddington.
Around one train per hour east to Gidea Park from London.
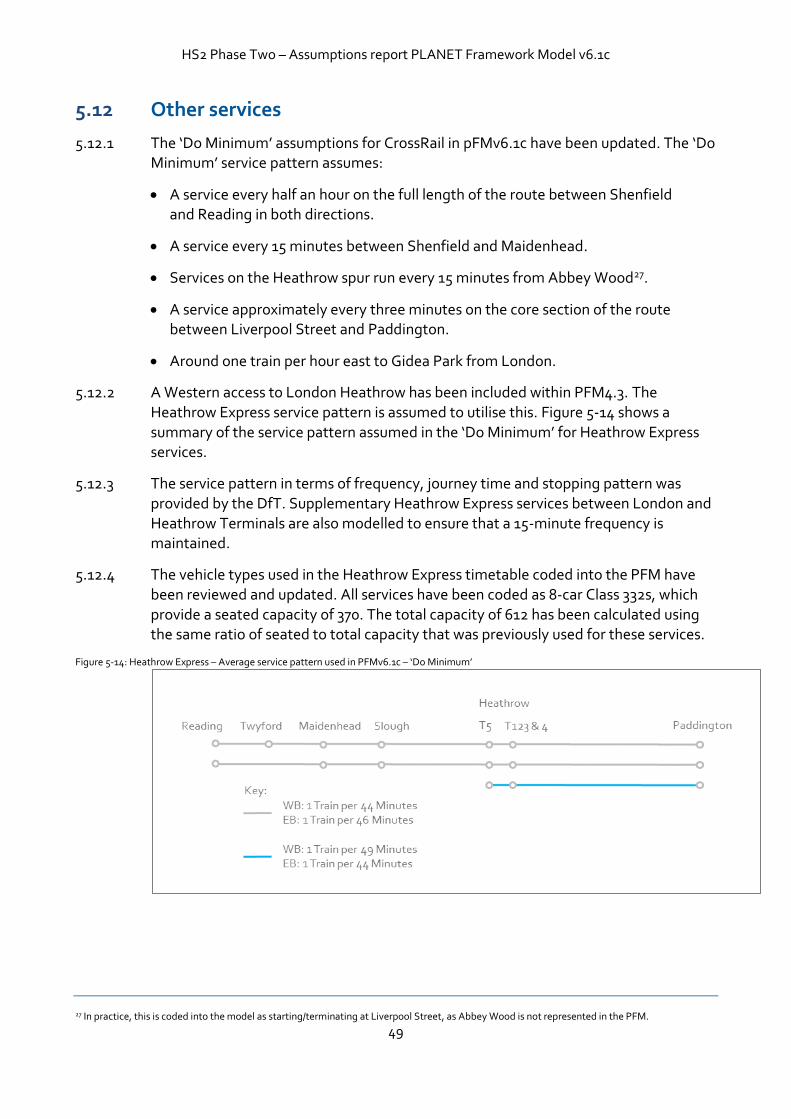
5.12.2 A Western access to London Heathrow has been included within PFM4.3. The Heathrow Express service pattern is assumed to utilise this. Figure 5-14 shows a summary of the service pattern assumed in the ‘Do Minimum’ for Heathrow Express services.
5.12.3 The service pattern in terms of frequency, journey time and stopping pattern was provided by the DfT. Supplementary Heathrow Express services between London and Heathrow Terminals are also modelled to ensure that a 15-minute frequency is maintained.
5.12.4 The vehicle types used in the Heathrow Express timetable coded into the PFM have been reviewed and updated. All services have been coded as 8-car Class 332s, which
provide a seated capacity of 370. The total capacity of 612 has been calculated using the same ratio of seated to total capacity that was previously used for these services.
Figure 5-14: Heathrow Express – Average service pattern used in PFMv6.1c – ‘Do Minimum’
27 In practice, this is coded into the model as starting/terminating at Liverpool Street, as Abbey Wood is not represented in the PFM.

HS2 Phase Two – Assumptions report PLANET Framework Model v6.1c
50
5.13 London Underground
5.13.1 The ‘Do Minimum’ assumptions for London Underground in PFMv6.1c are the same as used in PFMv52b and are assessed to remain valid.
5.13.2 TfL supplied London Underground network and vehicle type data extracted from TfL’s Railplan model.
HS2 Phase Two – Assumptions report PLANET Framework Model v6.1c
51
5.14 National Rail – rolling stock
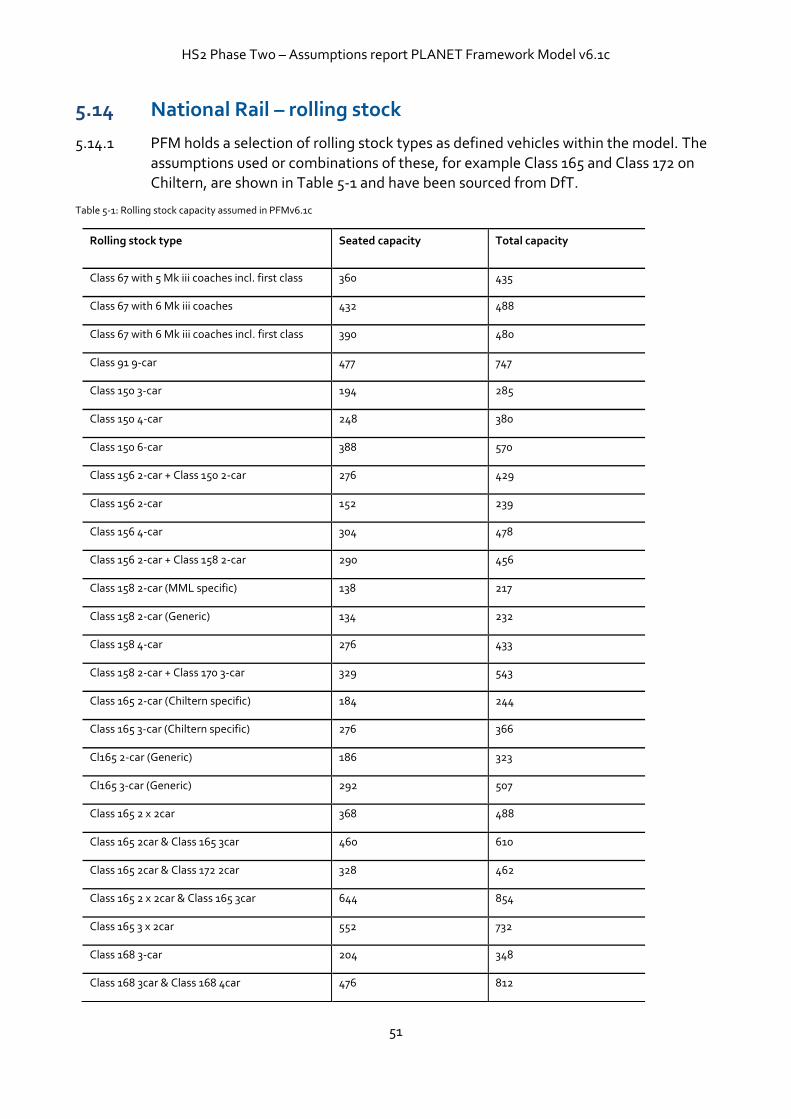
5.14.1 PFM holds a selection of rolling stock types as defined vehicles within the model. The assumptions used or combinations of these, for example Class 165 and Class 172 on Chiltern, are shown in Table 5-1 and have been sourced from DfT.
Table 5-1: Rolling stock capacity assumed in PFMv6.1c
Rolling stock type Seated capacity Total capacity
Class 67 with 5 Mk iii coaches incl. first class 360 435
Class 67 with 6 Mk iii coaches 432 488
Class 67 with 6 Mk iii coaches incl. first class 390 480
Class 91 9-car 477 747
Class 150 3-car 194 285
Class 150 4-car 248 380
Class 150 6-car 388 570
Class 156 2-car + Class 150 2-car 276 429
Class 156 2-car 152 239
Class 156 4-car 304 478
Class 156 2-car + Class 158 2-car 290 456
Class 158 2-car (MML specific) 138 217
Class 158 2-car (Generic) 134 232
Class 158 4-car 276 433
Class 158 2-car + Class 170 3-car 329 543
Class 165 2-car (Chiltern specific) 184 244
Class 165 3-car (Chiltern specific) 276 366
Cl165 2-car (Generic) 186 323
Cl165 3-car (Generic) 292 507
Class 165 2 x 2car 368 488
Class 165 2car & Class 165 3car 460 610
Class 165 2car & Class 172 2car 328 462
Class 165 2 x 2car & Class 165 3car 644 854
Class 165 3 x 2car 552 732
Class 168 3-car 204 348
Class 168 3car & Class 168 4car 476 812
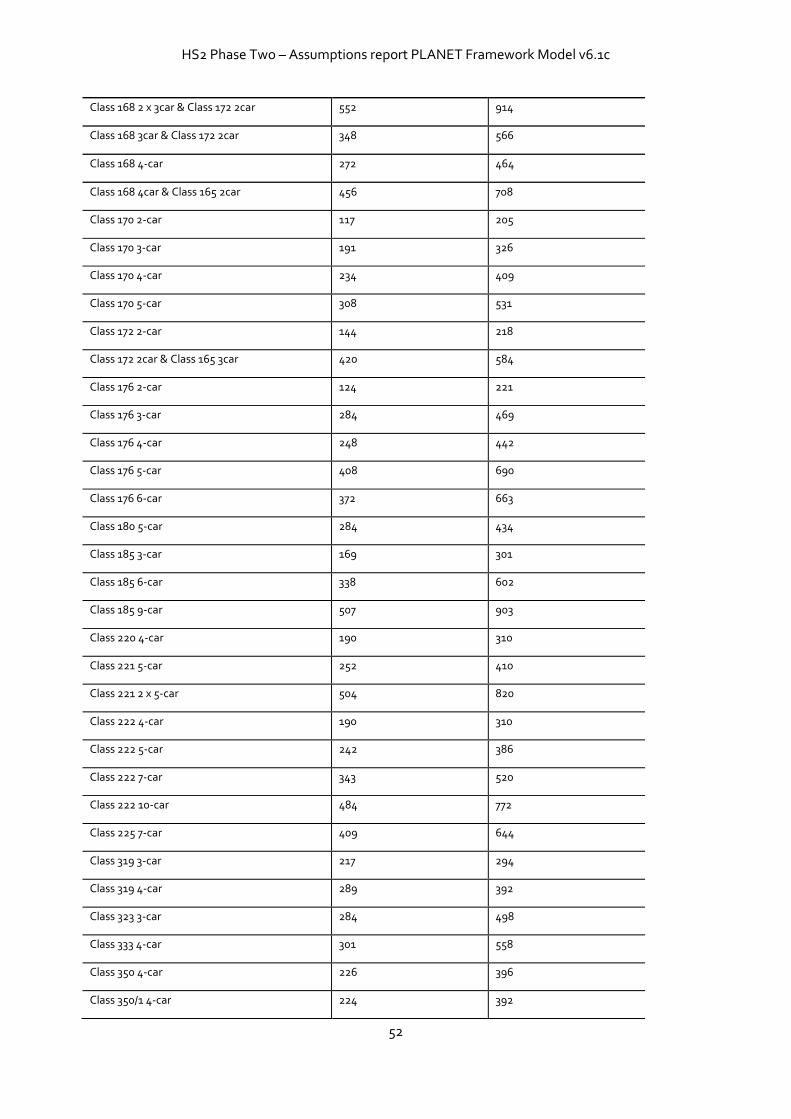
HS2 Phase Two – Assumptions report PLANET Framework Model v6.1c
52
Class 168 2 x 3car & Class 172 2car 552 914
Class 168 3car & Class 172 2car 348 566
Class 168 4-car 272 464
Class 168 4car & Class 165 2car 456 708
Class 170 2-car 117 205
Class 170 3-car 191 326
Class 170 4-car 234 409
Class 170 5-car 308 531
Class 172 2-car 144 218
Class 172 2car & Class 165 3car 420 584
Class 176 2-car 124 221
Class 176 3-car 284 469
Class 176 4-car 248 442
Class 176 5-car 408 690
Class 176 6-car 372 663
Class 180 5-car 284 434
Class 185 3-car 169 301
Class 185 6-car 338 602
Class 185 9-car 507 903
Class 220 4-car 190 310
Class 221 5-car 252 410
Class 221 2 x 5-car 504 820
Class 222 4-car 190 310
Class 222 5-car 242 386
Class 222 7-car 343 520
Class 222 10-car 484 772
Class 225 7-car 409 644
Class 319 3-car 217 294
Class 319 4-car 289 392
Class 323 3-car 284 498
Class 333 4-car 301 558
Class 350 4-car 226 396
Class 350/1 4-car 224 392
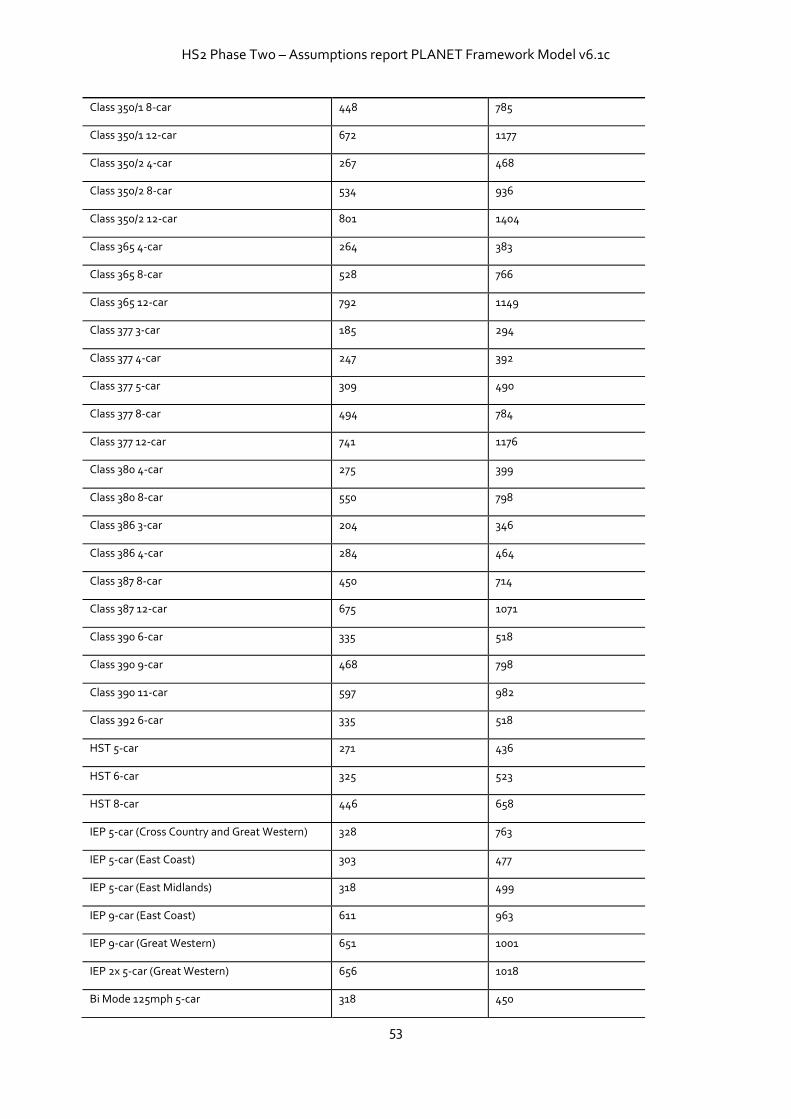
HS2 Phase Two – Assumptions report PLANET Framework Model v6.1c
53
Class 350/1 8-car 448 785
Class 350/1 12-car 672 1177
Class 350/2 4-car 267 468
Class 350/2 8-car 534 936
Class 350/2 12-car 801 1404
Class 365 4-car 264 383
Class 365 8-car 528 766
Class 365 12-car 792 1149
Class 377 3-car 185 294
Class 377 4-car 247 392
Class 377 5-car 309 490
Class 377 8-car 494 784
Class 377 12-car 741 1176
Class 380 4-car 275 399
Class 380 8-car 550 798
Class 386 3-car 204 346
Class 386 4-car 284 464
Class 387 8-car 450 714
Class 387 12-car 675 1071
Class 390 6-car 335 518
Class 390 9-car 468 798
Class 390 11-car 597 982
Class 392 6-car 335 518
HST 5-car 271 436
HST 6-car 325 523
HST 8-car 446 658
IEP 5-car (Cross Country and Great Western) 328 763
IEP 5-car (East Coast) 303 477
IEP 5-car (East Midlands) 318 499
IEP 9-car (East Coast) 611 963
IEP 9-car (Great Western) 651 1001
IEP 2x 5-car (Great Western) 656 1018
Bi Mode 125mph 5-car 318 450

HS2 Phase Two – Assumptions report PLANET Framework Model v6.1c
54
EMU125 5-car 262 418
EMU125 6-car 322 478
EMU125+EMU125 12-car 524 836
AT300 5-car 328 509
AT300 2x 5-car 656 1018
AT300 9-car 651 1001
PFMv6.1c Assumptions Report
55
6 Rail Network: ‘Do Something’ 6.1 Introduction
6.1.1 To understand the costs and benefits of the scheme, our modelling requires assumptions on a service specification for HS2 and a specification for the revised service pattern on the classic network enabled by capacity being released due to the transfer of passengers to HS2. These assumptions are set out in the following sections.
6.1.2 The released capacity assumptions set out in this section have been derived for transport modelling purposes only. They are not a future proposed or agreed service specification.
6.1.3 There are many potential options for future service specifications across the network. DfT’s strategic case sets out the high level principles that will be followed in making best use of released capacity, including:
To ensure that all places with a direct London service today retain a broadly comparable or better service after HS2 opens;
To provide additional commuter capacity where it is most needed;
To spread the benefits of long-distance and inter-regional services to the many towns and cities that can be served by the capacity created on the existing rail network;
To integrate HS2 services fully into the wider national rail network;
To provide capacity for the growing rail freight sector; and
To improve performance by making timetables more robust.
6.1.4 Decisions on future services will be taken much nearer the time. What is set out here are a set of assumptions for modelling purposes.
6.1.5 In the following sections the HS2 service assumptions and assumptions on the classic network are set out separately. Within the PFMv6.1c model the impacts of these are combined.
PFMv6.1c Assumptions Report
56
6.2 HS2 service patterns
Phase One
6.2.1 There are four stations assumed on the Phase One route: Birmingham Curzon Street, Birmingham Interchange, Old Oak Common and London Euston.
6.2.2 The Phase One service pattern is the same as used in PFMv5.2b, with some small updates to journey times. It is shown in Figure 6-1 and comprises:
London Euston to Birmingham Curzon Street;
A series of services that are ‘classic compatible’, i.e. they use the HS2 link between London and its connection with the West Coast Main Line and then switch to the classic network;
London Euston to Manchester Piccadilly (three trains per hour);
London Euston to Liverpool Lime Street (two trains per hour);
London Euston to Preston (one train per hour); and
London Euston to Glasgow Central (one train per hour).
Phase ‘Do Minimum’
6.2.3 Phase ‘Do Minimum’ is assumed to have the same service pattern as Phase One. This means that we assume the same number of services, and stopping pattern, as presented in the 2013 Economic Case, but some services gain the benefit of a reduced journey time by using the new high-speed section of track. The following HS2 services take advantage of that journey time saving:
London Euston to Glasgow Central service;
London Euston to Preston service;
London Euston to Liverpool Lime Street stopping at Crewe, Runcorn and Liverpool; and
Three London Euston to Manchester Piccadilly services using the high speed track.
6.2.4 Phase ‘Do Minimum’ would become operational in 2027. It is shown in Figure 6-2.
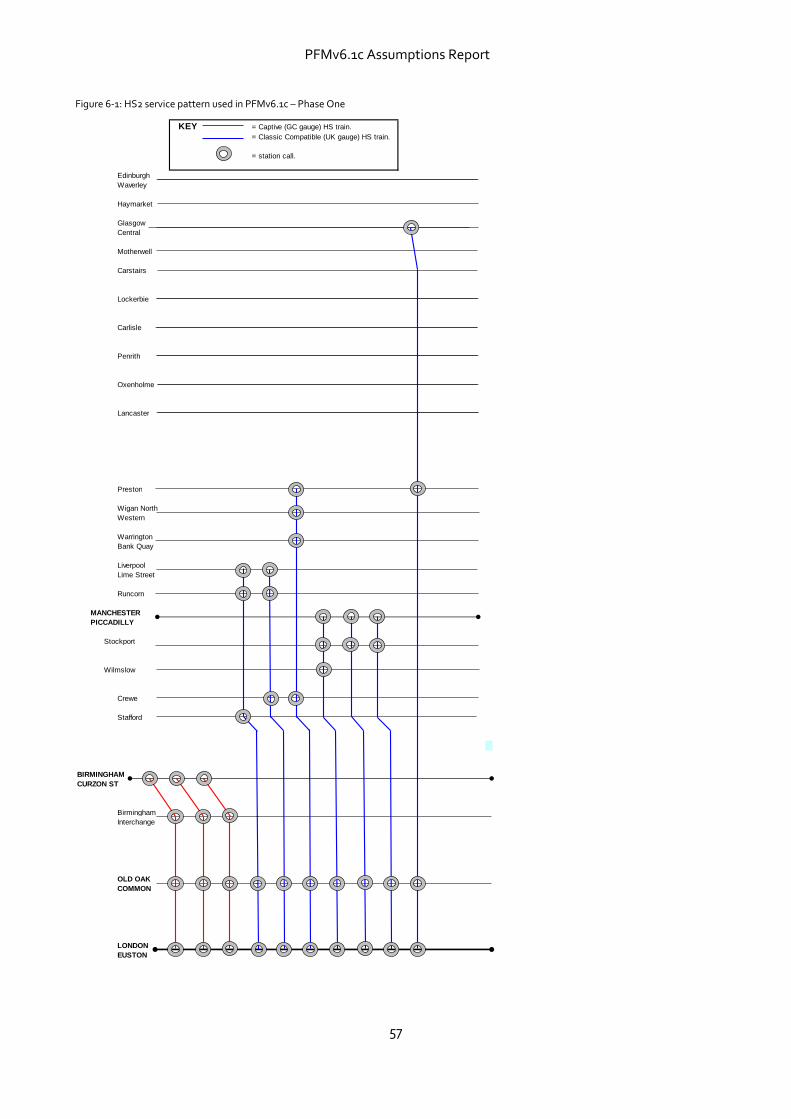
PFMv6.1c Assumptions Report
57
Figure 6-1: HS2 service pattern used in PFMv6.1c – Phase One
KEY = Captive (GC gauge) HS train.
= Classic Compatible (UK gauge) HS train.
= station call.
Edinburgh
Waverley
Haymarket
Glasgow
Central
Motherwell
Carstairs
Lockerbie
Carlisle
Penrith
Oxenholme
Lancaster
Preston
Wigan North
Western
Warrington
Bank Quay
Liverpool
Lime Street
Runcorn
MANCHESTER
PICCADILLY
Stockport
Wilmslow
Crewe
Stafford
BIRMINGHAM
CURZON ST
Birmingham
Interchange
OLD OAK
COMMON
LONDON
EUSTON
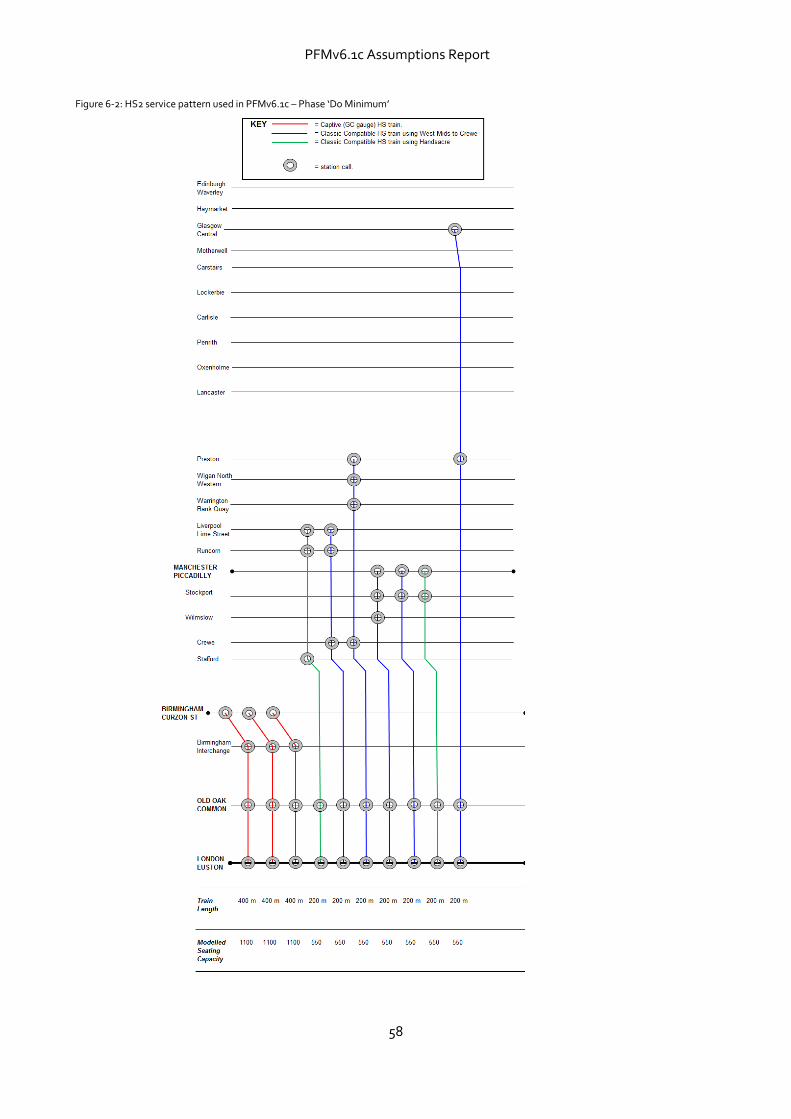
PFMv6.1c Assumptions Report
58
Figure 6-2: HS2 service pattern used in PFMv6.1c – Phase ‘Do Minimum’
PFMv6.1c Assumptions Report
59
Full network
6.2.6 The full network service pattern is based on the preferred route set out in the Phase Two consultation. It is shown in Figure 6-3 and comprises:
HS2 services:
London Euston to Birmingham Curzon Street (3tph);
London Euston to Manchester Piccadilly (3tph);
London Euston to Leeds (3tph28);
Birmingham Curzon Street to Manchester Piccadilly (2tph); and
Birmingham Curzon Street to Leeds (2tph);
And a series of services that are classic-compatible, i.e. they use the HS2 link from London Euston and switch to the classic network at the appropriate location:
London Euston to Liverpool Lime Street (2tph);
London Euston to Preston (1tph);
London Euston to Glasgow Central/ Edinburgh Waverley (2tph);
Birmingham Curzon Street to Glasgow Central/ Edinburgh Waverley (1tph);
Birmingham Curzon Street to Newcastle (1tph);
London Euston to Leeds/ York (1tph29); and
London Euston to Newcastle (2tph).
28 Two trains operate entirely to Leeds, the third combines/splits at Meadowhall to serve Leeds and York (the next footnote also refers to this service). 29 A Leeds train combines/splits with a classic-compatible York service at Meadowhall.
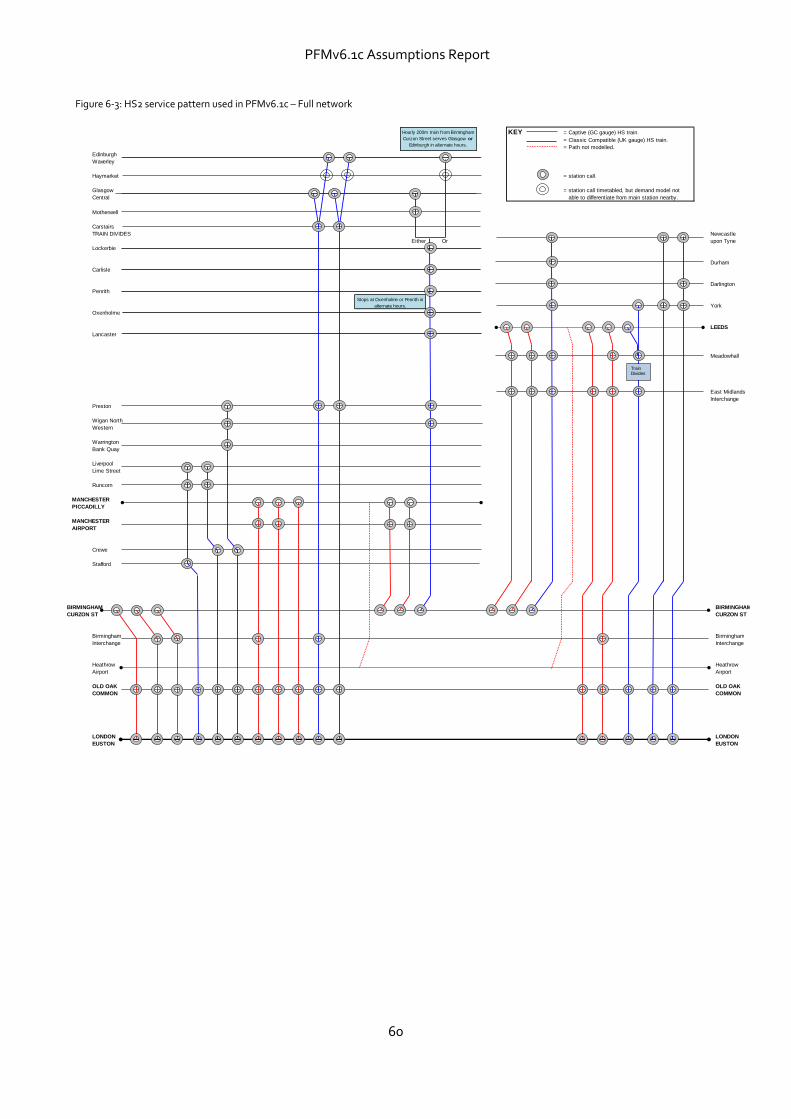
PFMv6.1c Assumptions Report
60
Figure 6-3: HS2 service pattern used in PFMv6.1c – Full network
KEY = Captive (GC gauge) HS train.
= Classic Compatible (UK gauge) HS train.
= Path not modelled.
Edinburgh
Waverley
Haymarket = station call.
Glasgow = station call timetabled, but demand model not
Central able to differentiate from main station nearby.
Motherwell
Carstairs
TRAIN DIVIDES Newcastle
Either Or upon Tyne
Lockerbie
Durham
Carlisle
Darlington
Penrith
York
Oxenholme
LEEDS
Lancaster
Meadowhall
East Midlands
Interchange
Preston
Wigan North
Western
Warrington
Bank Quay
Liverpool
Lime Street
Runcorn
MANCHESTER
PICCADILLY
MANCHESTER
AIRPORT
Crewe
Stafford
BIRMINGHAM BIRMINGHAM
CURZON ST CURZON ST
Birmingham Birmingham
Interchange Interchange
Heathrow Heathrow
Airport Airport
OLD OAK OLD OAK
COMMON COMMON
LONDON LONDON
EUSTON EUSTON
Hourly 200m train from Birmingham
Curzon Street serves Glasgow or
Edinburgh in alternate hours.
Stops at Oxenholme or Penrith in
alternate hours.
Train Divides
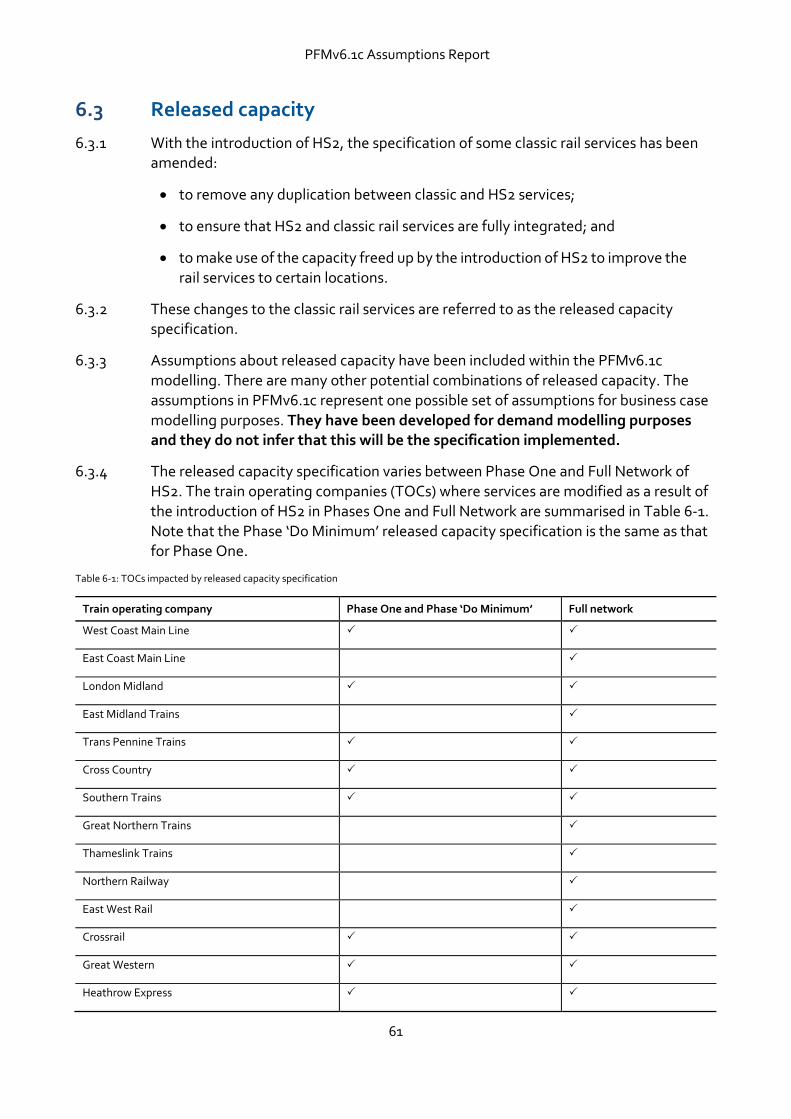
PFMv6.1c Assumptions Report
61
6.3 Released capacity
6.3.1 With the introduction of HS2, the specification of some classic rail services has been amended:
to remove any duplication between classic and HS2 services;
to ensure that HS2 and classic rail services are fully integrated; and
to make use of the capacity freed up by the introduction of HS2 to improve the rail services to certain locations.
6.3.2 These changes to the classic rail services are referred to as the released capacity specification.
6.3.3 Assumptions about released capacity have been included within the PFMv6.1c modelling. There are many other potential combinations of released capacity. The assumptions in PFMv6.1c represent one possible set of assumptions for business case modelling purposes. They have been developed for demand modelling purposes and they do not infer that this will be the specification implemented.
6.3.4 The released capacity specification varies between Phase One and Full Network of HS2. The train operating companies (TOCs) where services are modified as a result of the introduction of HS2 in Phases One and Full Network are summarised in Table 6-1. Note that the Phase ‘Do Minimum’ released capacity specification is the same as that for Phase One.
Table 6-1: TOCs impacted by released capacity specification
Train operating company Phase One and Phase ‘Do Minimum’ Full network
West Coast Main Line
East Coast Main Line
London Midland
East Midland Trains
Trans Pennine Trains
Cross Country
Southern Trains
Great Northern Trains
Thameslink Trains
Northern Railway
East West Rail
Crossrail
Great Western
Heathrow Express
PFMv6.1c Assumptions Report
62
6.4 West Coast
6.4.1 A summary of services and stopping patterns for the West Coast is included in figure 6-4 for Phase One.
6.4.2 The service pattern for Phase Two is shown on figure 6-5.
6.4.3 The Phase One timetable assumes the following services to/from London Euston:
1tph to Wolverhampton (2 trains per day extension to Shrewsbury);
1tph to Scotland via Birmingham (alternating between Glasgow and Edinburgh);
1tph peak shuttle service between Preston and Blackpool North;
1tph to Chester (7–8 trains per day extension to North Wales) with a regularised stopping pattern compared to the do-minimum along the Trent Valley;
one train per peak hour in the peak direction from/to Crewe;
1tph to Northampton (in addition to LM services);
1tph to Scotland via Manchester (alternating between Glasgow and Edinburgh); and
one train per peak hour in the peak direction to Manchester.
6.4.4 Train types used are similar to those by service in the new ‘Do Minimum’, but with all Pendolino trains being of 9-car length alone, and the same mix of Voyagers on those services worked by diesel trains.
6.4.5 There is no change to the West Coast Mainline open access services under released capacity.
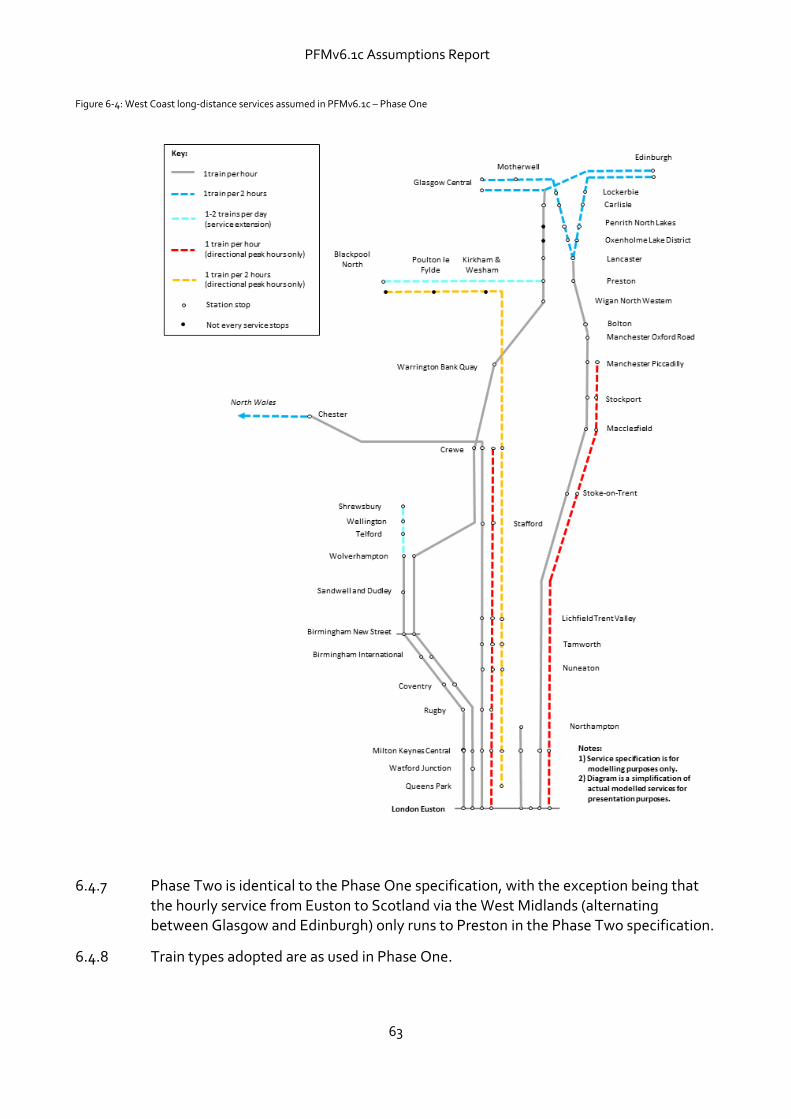
PFMv6.1c Assumptions Report
63
Figure 6-4: West Coast long-distance services assumed in PFMv6.1c – Phase One
6.4.7 Phase Two is identical to the Phase One specification, with the exception being that the hourly service from Euston to Scotland via the West Midlands (alternating between Glasgow and Edinburgh) only runs to Preston in the Phase Two specification.
6.4.8 Train types adopted are as used in Phase One.
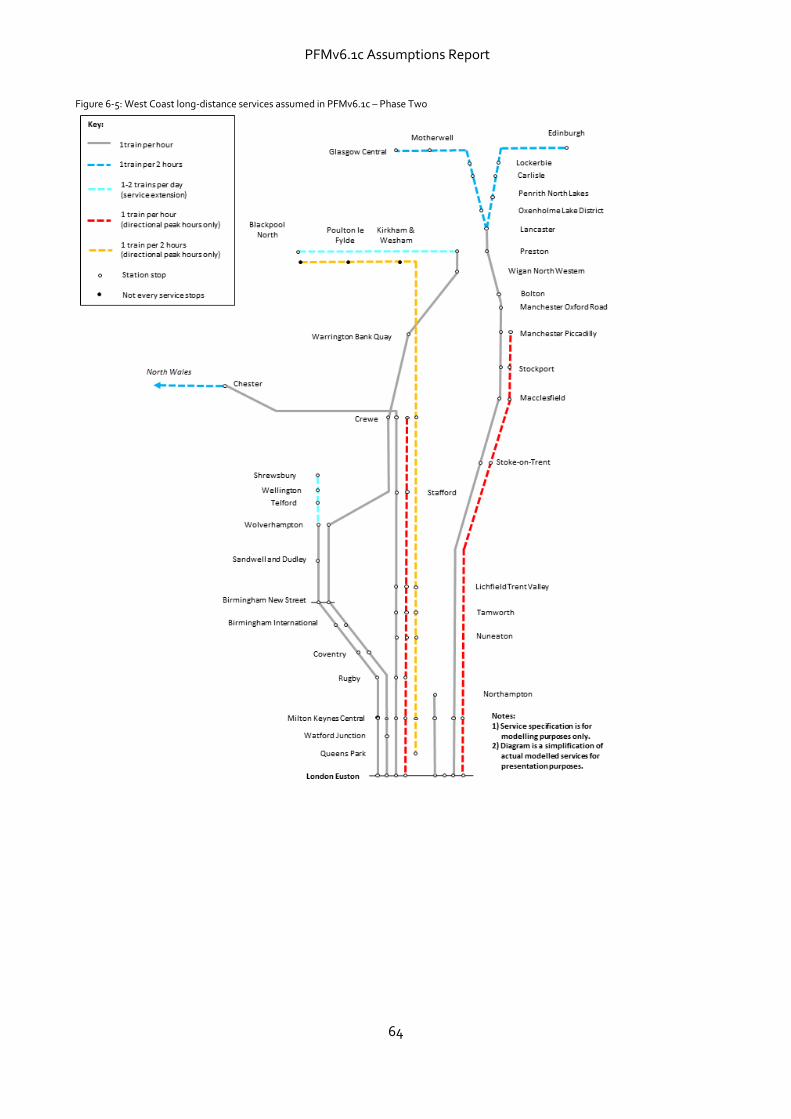
PFMv6.1c Assumptions Report
64
Figure 6-5: West Coast long-distance services assumed in PFMv6.1c – Phase Two
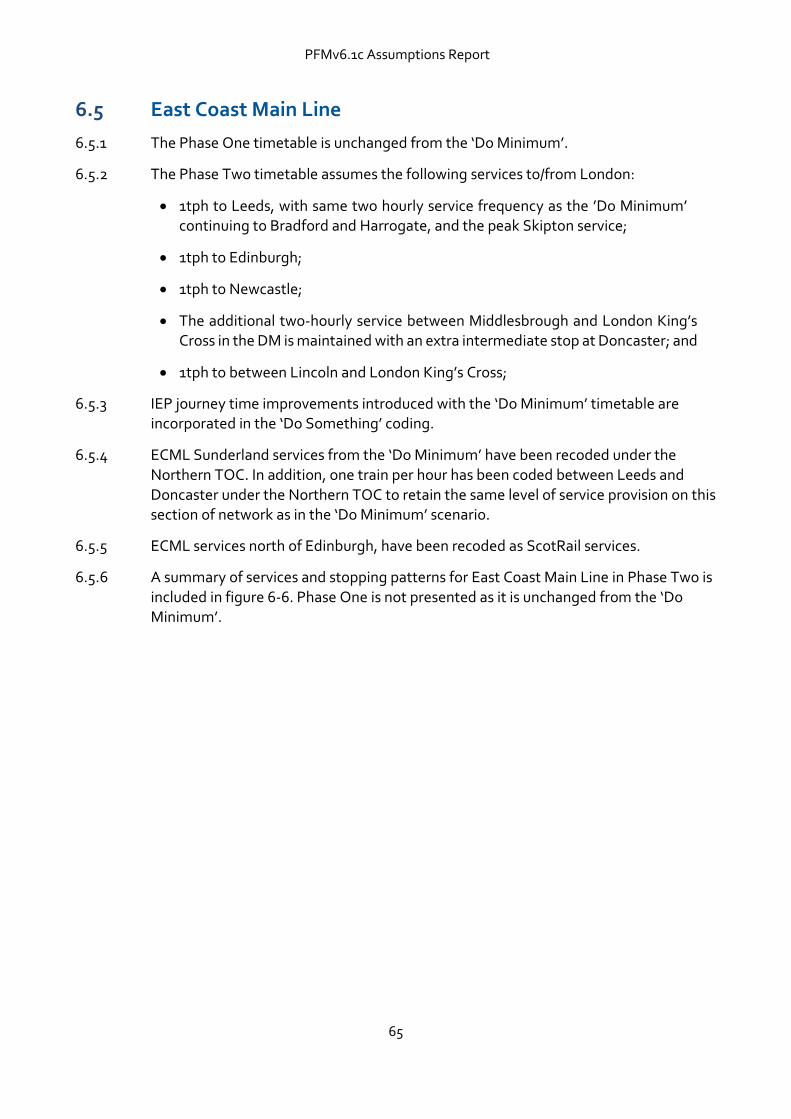
PFMv6.1c Assumptions Report
65
6.5 East Coast Main Line
6.5.1 The Phase One timetable is unchanged from the ‘Do Minimum’.
6.5.2 The Phase Two timetable assumes the following services to/from London:
1tph to Leeds, with same two hourly service frequency as the ’Do Minimum’ continuing to Bradford and Harrogate, and the peak Skipton service;
1tph to Edinburgh;
1tph to Newcastle;
The additional two-hourly service between Middlesbrough and London King’s Cross in the DM is maintained with an extra intermediate stop at Doncaster; and
1tph to between Lincoln and London King’s Cross;
6.5.3 IEP journey time improvements introduced with the ‘Do Minimum’ timetable are incorporated in the ‘Do Something’ coding.
6.5.4 ECML Sunderland services from the ‘Do Minimum’ have been recoded under the Northern TOC. In addition, one train per hour has been coded between Leeds and Doncaster under the Northern TOC to retain the same level of service provision on this section of network as in the ‘Do Minimum’ scenario.
6.5.5 ECML services north of Edinburgh, have been recoded as ScotRail services.
6.5.6 A summary of services and stopping patterns for East Coast Main Line in Phase Two is included in figure 6-6. Phase One is not presented as it is unchanged from the ‘Do Minimum’.
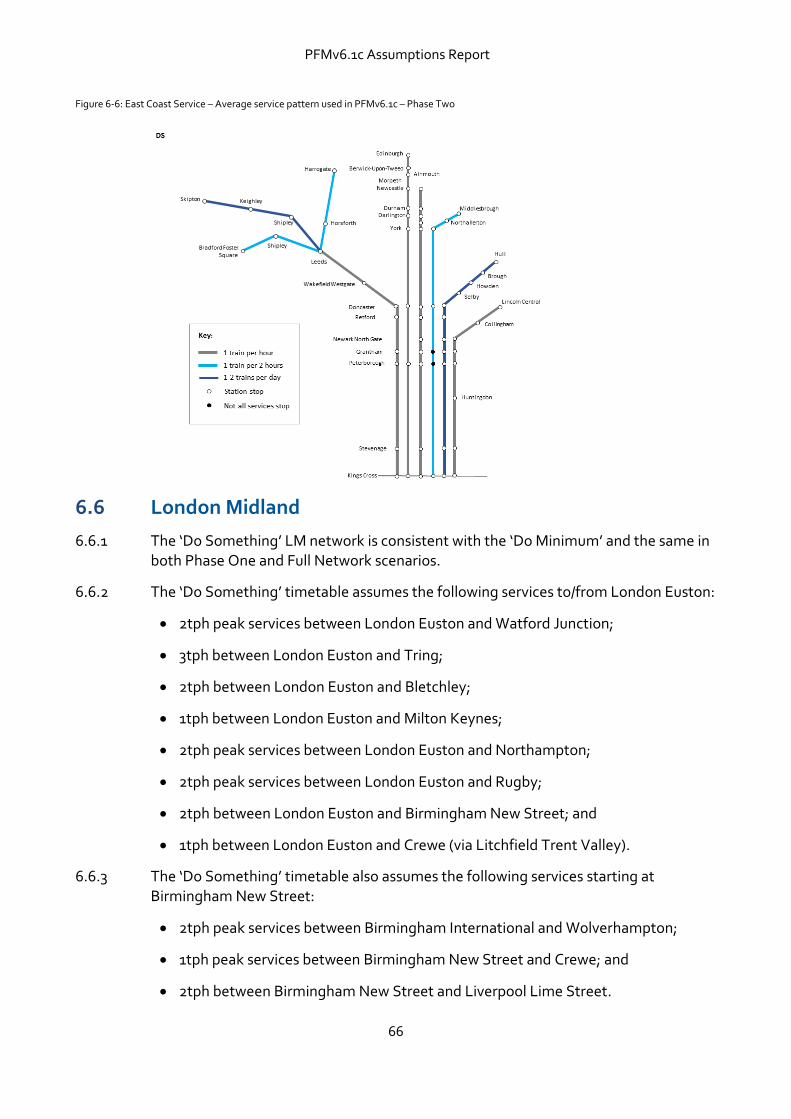
PFMv6.1c Assumptions Report
66
Figure 6-6: East Coast Service – Average service pattern used in PFMv6.1c – Phase Two
6.6 London Midland
6.6.1 The ‘Do Something’ LM network is consistent with the ‘Do Minimum’ and the same in both Phase One and Full Network scenarios.
6.6.2 The ‘Do Something’ timetable assumes the following services to/from London Euston:
2tph peak services between London Euston and Watford Junction;
3tph between London Euston and Tring;
2tph between London Euston and Bletchley;
1tph between London Euston and Milton Keynes;
2tph peak services between London Euston and Northampton;
2tph peak services between London Euston and Rugby;
2tph between London Euston and Birmingham New Street; and
1tph between London Euston and Crewe (via Litchfield Trent Valley).
6.6.3 The ‘Do Something’ timetable also assumes the following services starting at Birmingham New Street:
2tph peak services between Birmingham International and Wolverhampton;
1tph peak services between Birmingham New Street and Crewe; and
2tph between Birmingham New Street and Liverpool Lime Street.
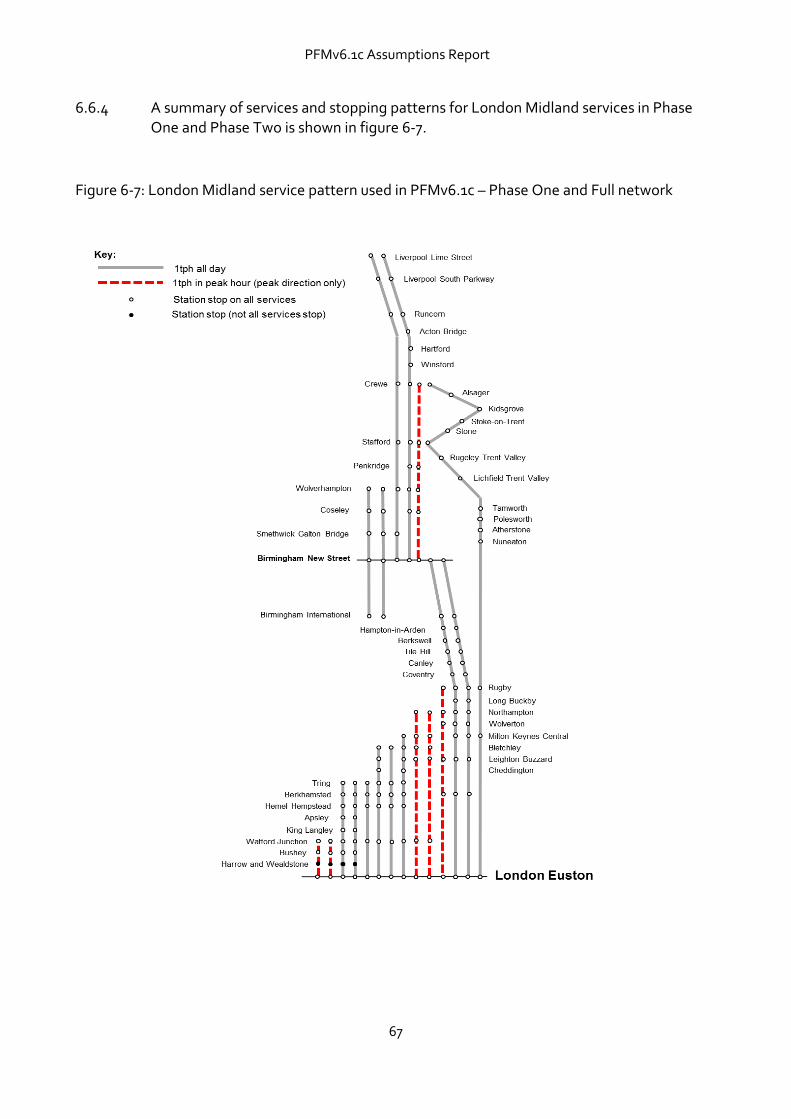
PFMv6.1c Assumptions Report
67
6.6.4 A summary of services and stopping patterns for London Midland services in Phase One and Phase Two is shown in figure 6-7.
Figure 6-7: London Midland service pattern used in PFMv6.1c – Phase One and Full network
PFMv6.1c Assumptions Report
68
6.7 East Midlands trains
6.7.1 The Phase One ‘Do Something’ timetable for East Midlands Trains has been updated with exactly the same changes as the ‘Do Minimum’ scenario as there are no HS2 Phase One effects on this service.
6.7.2 The Phase Two timetable assumes the following service pattern for London services on the Midland main line:
1tph between Nottingham and London St Pancras30;
1tph between Sheffield and London St Pancras31;
1tph between Derby and London St Pancras, which routes via the East Midlands High Speed station at Toton32;
1tph between Corby (Kettering) and London St Pancras. Note that services to and from Corby are coded to and from Kettering as Corby is not a station that is directly represented in PLD; and
1tph between Leicester and London St Pancras.
6.7.3 London services are assumed to be 10-car IEP trains in the peak and 5-car IEP trains in the off-peak.
6.7.4 A summary of services and stopping patterns for East Midlands Trains services to/from London in Phase Two is included in figure 6-8. Phase One is not presented as it is unchanged from the ‘Do Minimum’.
6.7.5 The Phase 2 timetable is also amended within the East Midlands area to allow for released capacity and connectivity of the East Midlands high speed station33:
The Liverpool to Norwich services group is re-routed in Phase 2 to stop at
Toton. This incurs increases journey time by six minutes. The Nottingham to Norwich variant is extended to start/terminate at Toton incurring an additional 14-minute journey time.
Both the Matlock to Nottingham and Derby to Nottingham service groups are re-routed via Toton in Phase 2, incurring an additional 14-minute journey time.
30 The East Midlands Nottingham services have been coded with variable stopping patterns, therefore not all services stop at Beeston, East Midlands Parkway and Market Harborough. 31 The East Midlands Sheffield services have been coded with variable stopping patterns, as a result these services are missing intermediate stops at Loughborough and Long Eaton. 32 The East Midlands Derby services are missing intermediate stops at Luton, Bedford, Wellingborough, Kettering and Market Harborough. 33 The connections to Toton for the following East Midlands services have not been included in this model release version.
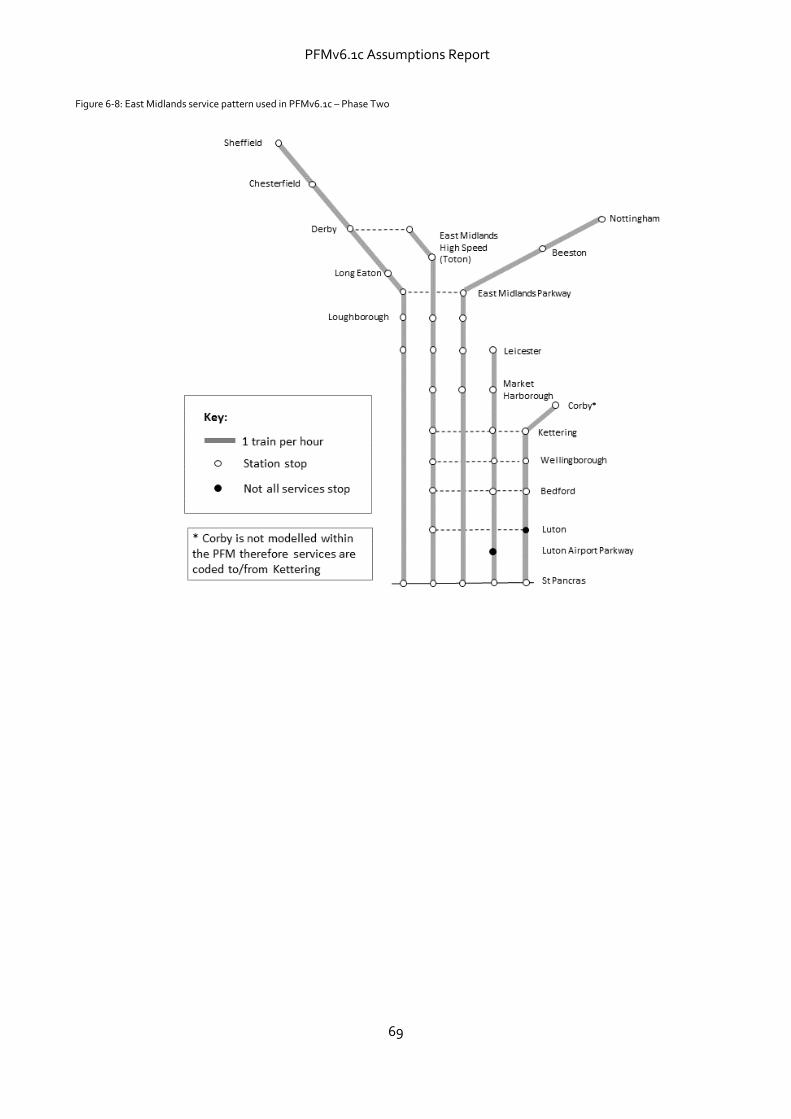
PFMv6.1c Assumptions Report
69
Figure 6-8: East Midlands service pattern used in PFMv6.1c – Phase Two
PFMv6.1c Assumptions Report
70
6.8 TransPennine Trains
6.8.1 Released capacity assumptions for TransPennine changes to the ‘Do Minimum’ timetables are applied initially in Phase One and Phase 2a. This initial release, includes truncation of Manchester Airport–Scotland services at Manchester Piccadilly (removing the section to Scotland).
6.8.2 Further released capacity assumptions for TransPennine are applied in Phase Two with the Liverpool–Newcastle services extended to Edinburgh.
6.8.3 The Phase Two timetable for TransPennine Trains assumes:
2tph between Manchester and Hull via Leeds;
1tpd between Manchester Airport and Doncaster via Sheffield;
1tpd from York to Middlesbrough;
5tpd between Liverpool and Newcastle (via Manchester, Leeds and York);
1tph between Liverpool and Scarborough (via Manchester, Leeds and York);
To / from Manchester Airport:
- 4tpd to York;
- 1tph to Manchester Piccadilly (the truncation of the ’Do Minimum’ Manchester
Airport–Scotland service);
- 1tph to Cleethorpes via Sheffield.
6.8.4 A summary of services and stopping patterns for TransPennine Train services is included in Figure 6-9 for Phase Two. Phase One services for TransPennine are not shown as they are the same as the ‘Do Minimum’.
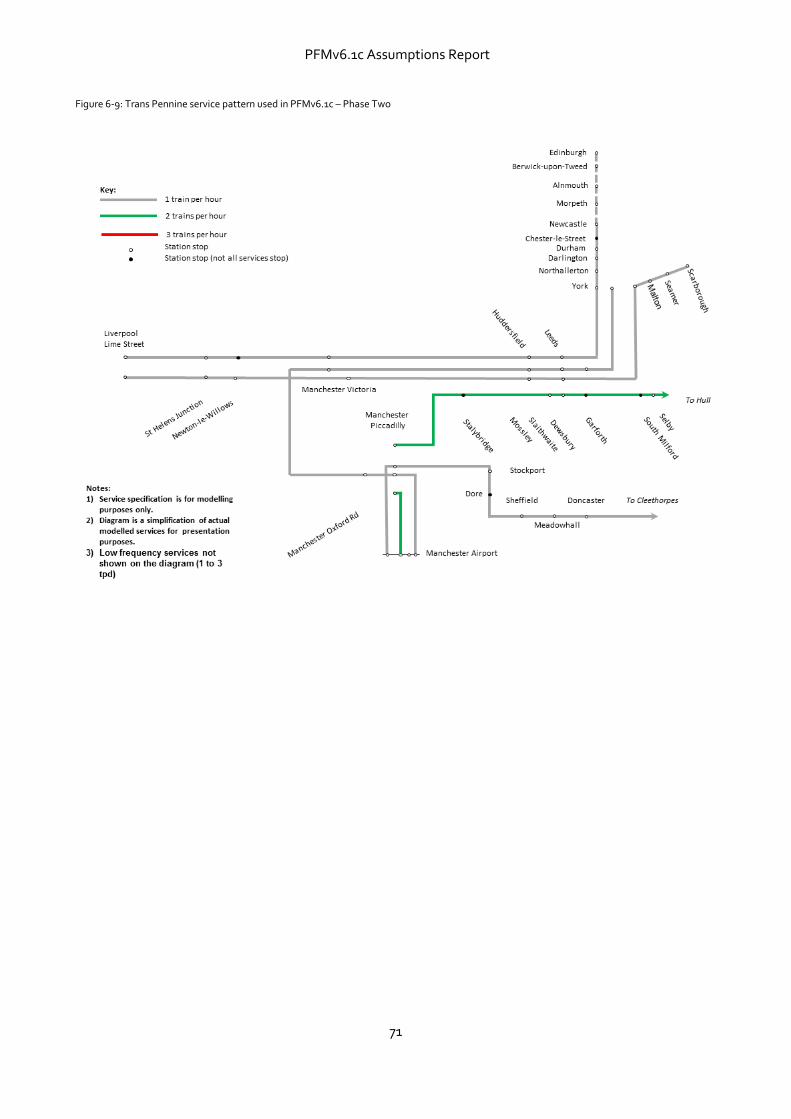
PFMv6.1c Assumptions Report
71
Figure 6-9: Trans Pennine service pattern used in PFMv6.1c – Phase Two
PFMv6.1c Assumptions Report
72
6.9 Northern Railway
6.9.1 The Phase One and Phase 2a timetables are unchanged from the ‘Do Minimum’.
6.9.2 Released capacity assumptions for Northern Railway are applied within the Phase Two timetable only.
6.9.3 The Phase Tw0 timetable assumes the following for each corridor.
On the Leeds–Doncaster corridor the following services to/from Leeds:
2tph to Sheffield;
1tph to Sheffield via Rotherham stopping service;
1tph to Doncaster calling all stations; and
1.5tph to Doncaster semi-fast (backfilling for removed East Coast services).
On the South Manchester corridor, the following services to/from Manchester Piccadilly:
2tph to Crewe via Stockport;
1tph to Alderley Edge via Stockport;
2tpd to Stoke on Trent stopping service;
peak extra services to Macclesfield; and
1tph to Crewe semi-fast.
On the Calder Valley corridor, the following services to/from Leeds:
3tph to Huddersfield;
1tpd to Manchester Victoria; and
1tpd Bradford Interchange to Manchester Victoria.
On the North West Electrification corridor, the following services to/from Manchester Piccadilly / Manchester Victoria:
1tph Wigan Wallgate;
1tph Kirkby;
1tpd Clitheroe;
4tpd Southport;
1 tpd Liverpool Lime Street stopping service;
1tpd Liverpool Lime Street peak fast service; and

PFMv6.1c Assumptions Report
73
2tph Liverpool Lime Street to Manchester Airport.
6.9.4 A summary of services and stopping patterns for Northern services on the key corridors are presented in Figures 6-10 to 6-13 for Phase Two. Phase One services for Northern Railway are not shown as they are the same as the ‘Do Minimum’.
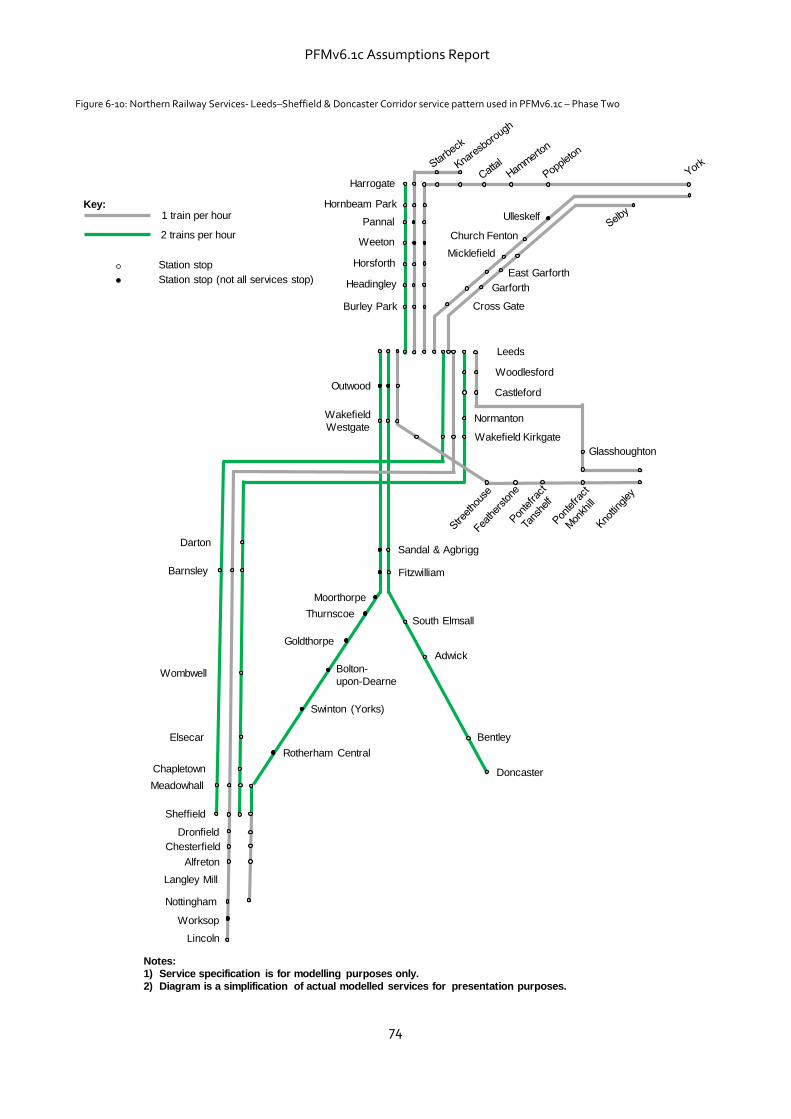
PFMv6.1c Assumptions Report
74
Figure 6-10: Northern Railway Services- Leeds–Sheffield & Doncaster Corridor service pattern used in PFMv6.1c – Phase Two
Leeds
Wakefield
Westgate
Doncaster
Rotherham Central
Barnsley
Meadowhall
Sheffield
Nottingham
Wakefield Kirkgate
Sandal & Agbrigg
South Elmsall
Adwick
Bentley
Dronfield
Chesterfield
Alfreton
Langley Mill
Fitzwilliam
Moorthorpe
Thurnscoe
Goldthorpe
Bolton-
upon-Dearne
Normanton
Swinton (Yorks)
Woodlesford
Castleford
Darton
Chapletown
Elsecar
Wombwell
Outwood
Glasshoughton
Burley Park
Headingley
Horsforth
Weeton
Pannal
Hornbeam Park
Harrogate
Cross Gate
Garforth
East Garforth
Micklefield
Church Fenton
Ulleskelf
Notes:
1) Service specification is for modelling purposes only.
2) Diagram is a simplification of actual modelled services for presentation purposes.
Station stop (not all services stop)
Station stop
1 train per hourKey:
2 trains per hour
Lincoln
Worksop
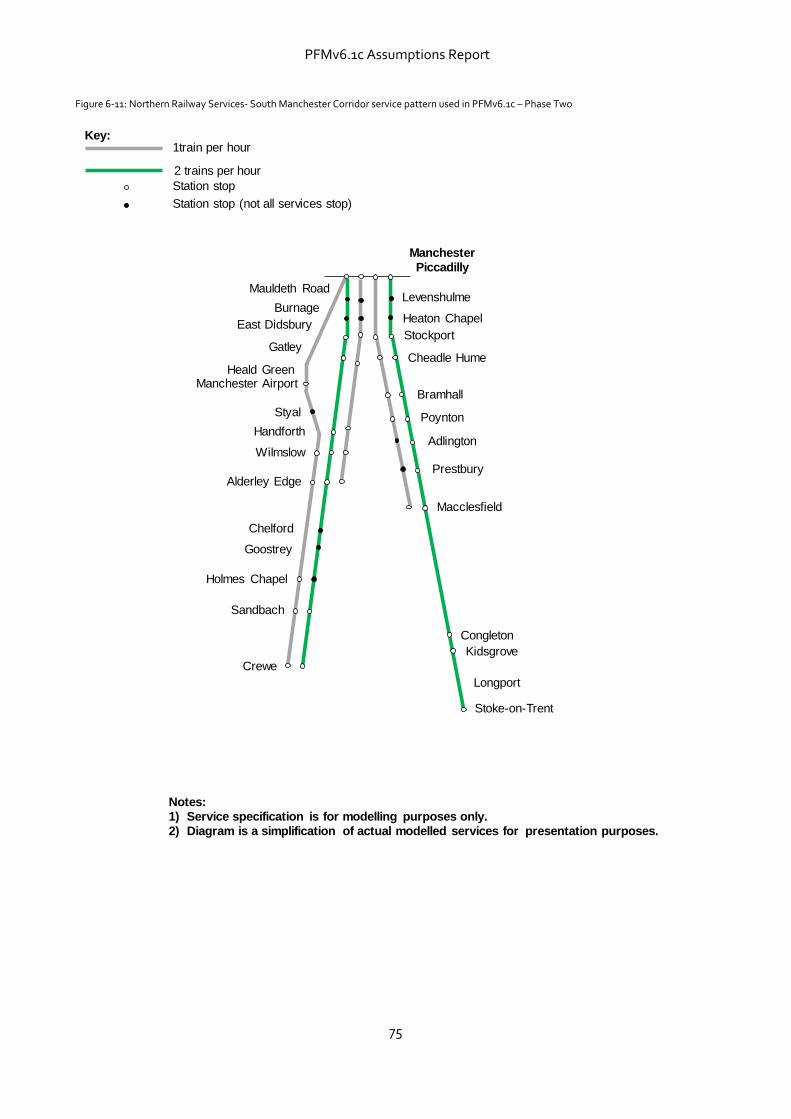
PFMv6.1c Assumptions Report
75
Figure 6-11: Northern Railway Services- South Manchester Corridor service pattern used in PFMv6.1c – Phase Two
Manchester
Piccadilly
Congleton
Crewe
Sandbach
Wilmslow
Kidsgrove
Manchester Airport
Alderley Edge
Chelford
Goostrey
Holmes Chapel
Handforth
Macclesfield
Stockport
Cheadle Hume
Bramhall
Poynton
Stoke-on-Trent
Adlington
Prestbury
Styal
Heald Green
Gatley
East Didsbury
Burnage
Mauldeth RoadLevenshulme
Heaton Chapel
Longport
Station stop
1train per hourKey:
Station stop (not all services stop)
Notes:
1) Service specification is for modelling purposes only.
2) Diagram is a simplification of actual modelled services for presentation purposes.
2 trains per hour
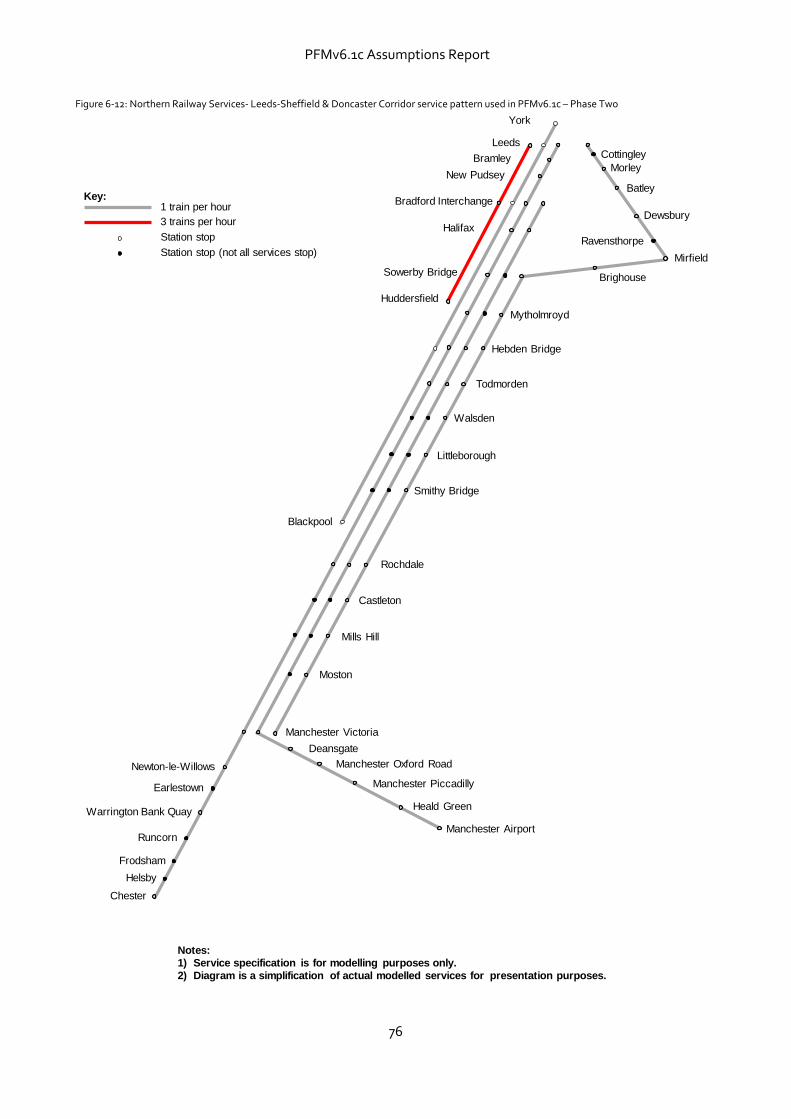
PFMv6.1c Assumptions Report
76
Figure 6-12: Northern Railway Services- Leeds-Sheffield & Doncaster Corridor service pattern used in PFMv6.1c – Phase Two
Leeds
Notes:
1) Service specification is for modelling purposes only.
2) Diagram is a simplification of actual modelled services for presentation purposes.
Bramley
New Pudsey
Bradford Interchange
Halifax
Sowerby Bridge
Ravensthorpe
Brighouse
Manchester Airport
Heald Green
Manchester Piccadilly
Manchester Oxford Road
Deansgate
Manchester Victoria
Newton-le-Willows
Earlestown
Warrington Bank Quay
Runcorn
Frodsham
Helsby
Chester
Mytholmroyd
Hebden Bridge
Todmorden
Walsden
Littleborough
Smithy Bridge
Rochdale
Castleton
Mills Hill
Moston
Station stop
1 train per hourKey:
Station stop (not all services stop)
Cottingley
Morley
Batley
Dewsbury
Mirfield
Huddersfield
York
Blackpool
3 trains per hour
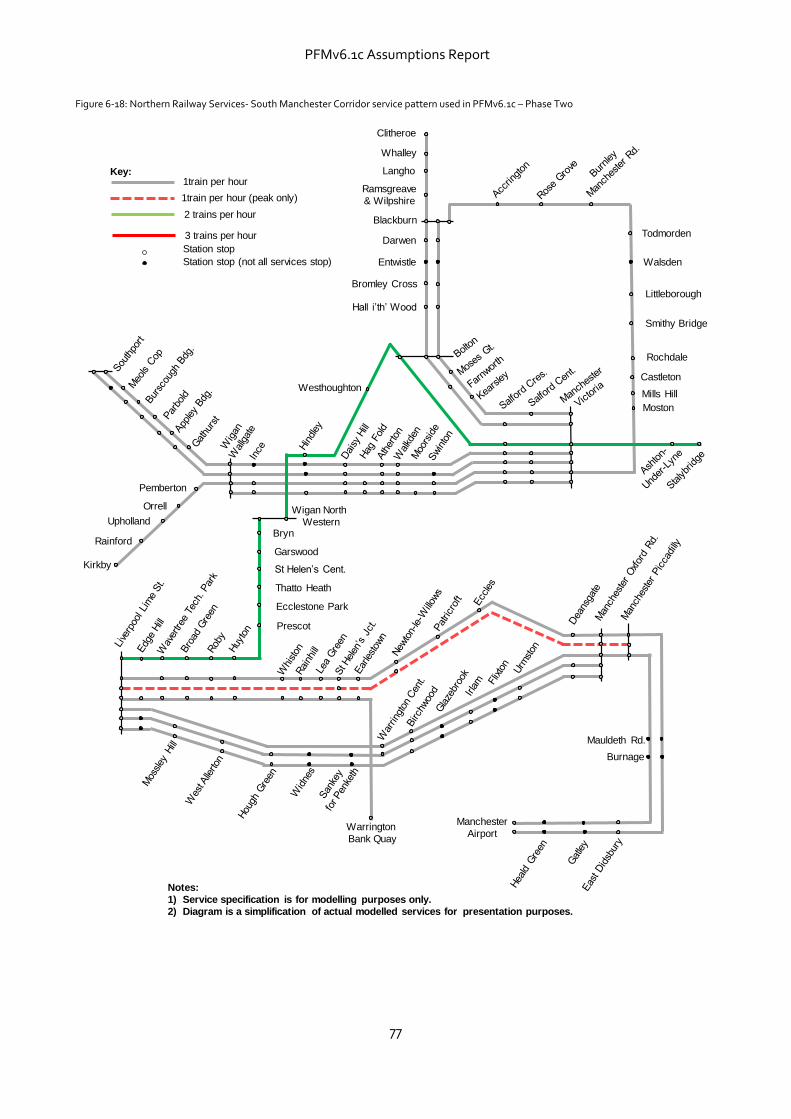
PFMv6.1c Assumptions Report
77
Figure 6-18: Northern Railway Services- South Manchester Corridor service pattern used in PFMv6.1c – Phase Two
1train per hourKey:
1train per hour (peak only)
Clitheroe
Whalley
Langho
Ramsgreave
& Wilpshire
Blackburn
Darwen
Entwistle
Bromley Cross
Hall i’th’ Wood
Todmorden
Rochdale
Walsden
Littleborough
Smithy Bridge
Castleton
Mills Hill
Moston
Westhoughton
Wigan North
Western
Kirkby
Rainford
Upholland
Orrell
Pemberton
Prescot
Ecclestone Park
Thatto Heath
St Helen’s Cent.
Garswood
Bryn
Warrington
Bank Quay
Manchester
Airport
Burnage
Mauldeth Rd.
Notes:
1) Service specification is for modelling purposes only.
2) Diagram is a simplification of actual modelled services for presentation purposes.
Station stop
Station stop (not all services stop)
3 trains per hour
2 trains per hour
PFMv6.1c Assumptions Report
78
6.10 Cross country
6.10.1 The Phase One timetable for cross country services is as assumed for the ‘Do Minimum’ in PFMv6.1c.
6.10.2 The Phase Two timetable is broadly the same as that in the ‘Do Minimum’ in PFMv6.1c except for the following:
additional calling points are provided at Meadowhall, Chesterfield, Burton-on-Trent and Tamworth on all services to Edinburgh and York; and Congleton and Macclesfield on services to Manchester; and
Reading to Newcastle services are cut back to terminate at York (and vice versa).
6.10.3 This provides a service pattern as follows:
1tph between Manchester and Bournemouth via Milton Keynes;
1tph between Manchester and Bristol via Birmingham (with some services continuing on to Cardiff or Paignton);
1tph between Manchester and Birmingham International;
1tph between Plymouth and Edinburgh, with some services continuing on to Penzance in the South West or Glasgow, Dundee or Aberdeen in Scotland; and
1tph between Reading and Newcastle, with some services continuing on to Southampton or Guildford in the south, or Edinburgh in the north.
6.10.4 In PFMv6.1c the ’Do Minimum’ journey time changes between Birmingham and Nottingham and Birmingham and Sheffield have been incorporated into Phase Two.
6.10.5 A summary of services and stopping patterns for cross country services in Phase Two
is included in figure 6-11. Phase One is not presented as it is unchanged from the ‘Do Minimum’.
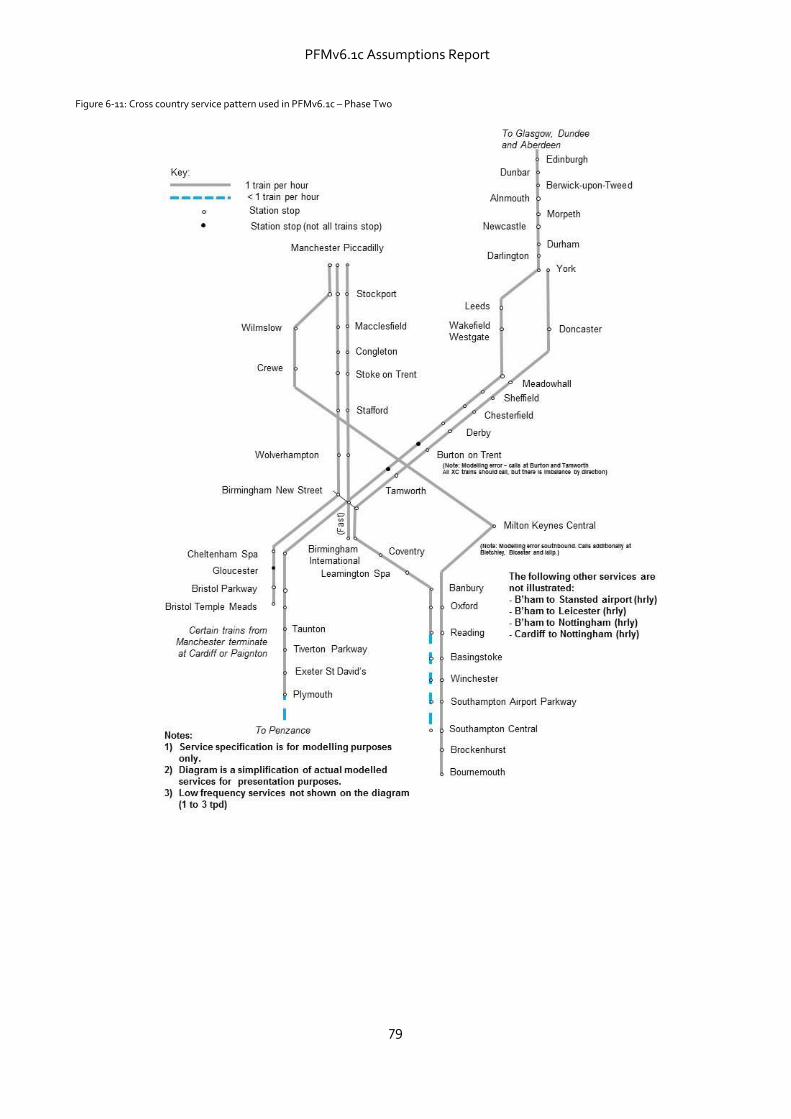
PFMv6.1c Assumptions Report
79
Figure 6-11: Cross country service pattern used in PFMv6.1c – Phase Two
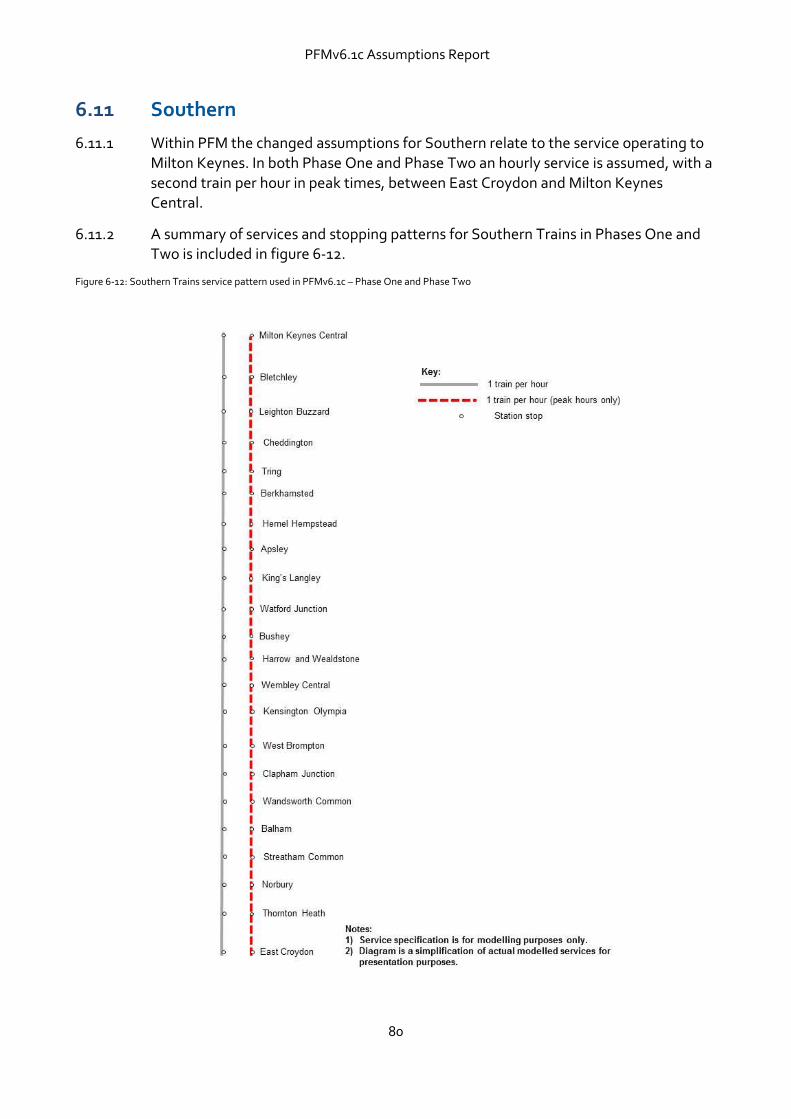
PFMv6.1c Assumptions Report
80
6.11 Southern
6.11.1 Within PFM the changed assumptions for Southern relate to the service operating to Milton Keynes. In both Phase One and Phase Two an hourly service is assumed, with a second train per hour in peak times, between East Croydon and Milton Keynes Central.
6.11.2 A summary of services and stopping patterns for Southern Trains in Phases One and Two is included in figure 6-12.
Figure 6-12: Southern Trains service pattern used in PFMv6.1c – Phase One and Phase Two
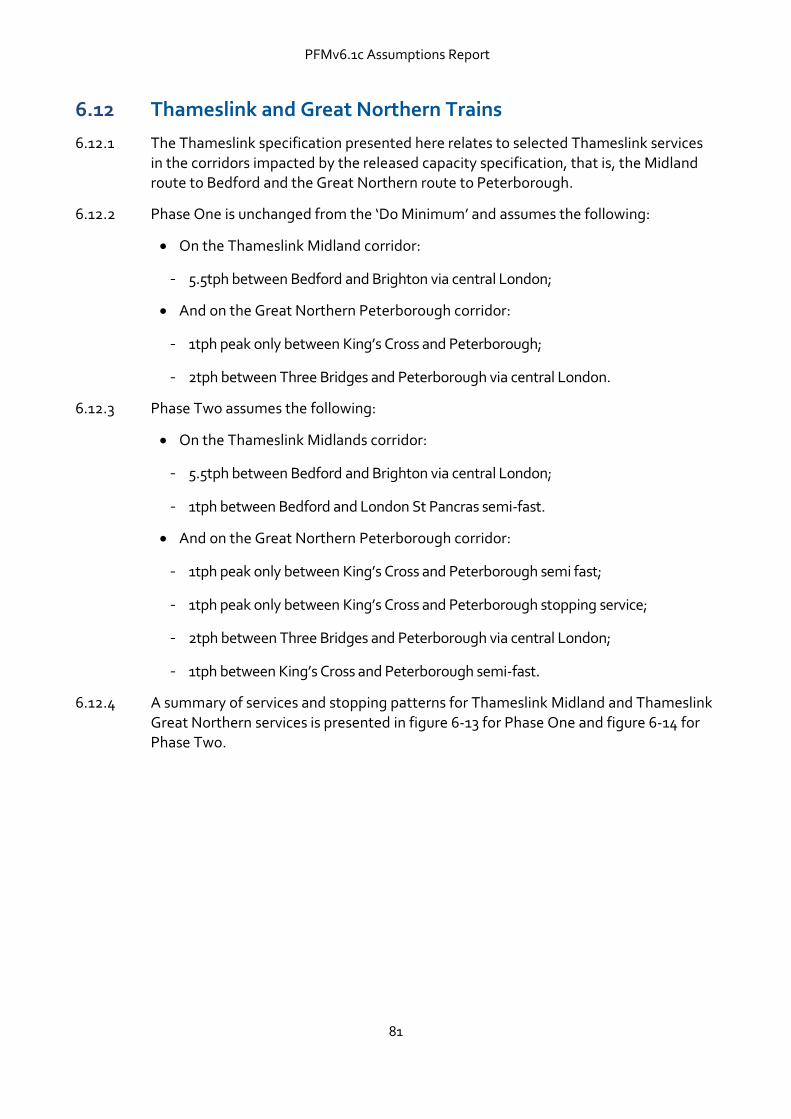
PFMv6.1c Assumptions Report
81
6.12 Thameslink and Great Northern Trains
6.12.1 The Thameslink specification presented here relates to selected Thameslink services in the corridors impacted by the released capacity specification, that is, the Midland route to Bedford and the Great Northern route to Peterborough.
6.12.2 Phase One is unchanged from the ‘Do Minimum’ and assumes the following:
On the Thameslink Midland corridor:
5.5tph between Bedford and Brighton via central London;
And on the Great Northern Peterborough corridor:
1tph peak only between King’s Cross and Peterborough;
2tph between Three Bridges and Peterborough via central London.
6.12.3 Phase Two assumes the following:
On the Thameslink Midlands corridor:
5.5tph between Bedford and Brighton via central London;
1tph between Bedford and London St Pancras semi-fast.
And on the Great Northern Peterborough corridor:
1tph peak only between King’s Cross and Peterborough semi fast;
1tph peak only between King’s Cross and Peterborough stopping service;
2tph between Three Bridges and Peterborough via central London;
1tph between King’s Cross and Peterborough semi-fast.
6.12.4 A summary of services and stopping patterns for Thameslink Midland and Thameslink Great Northern services is presented in figure 6-13 for Phase One and figure 6-14 for Phase Two.
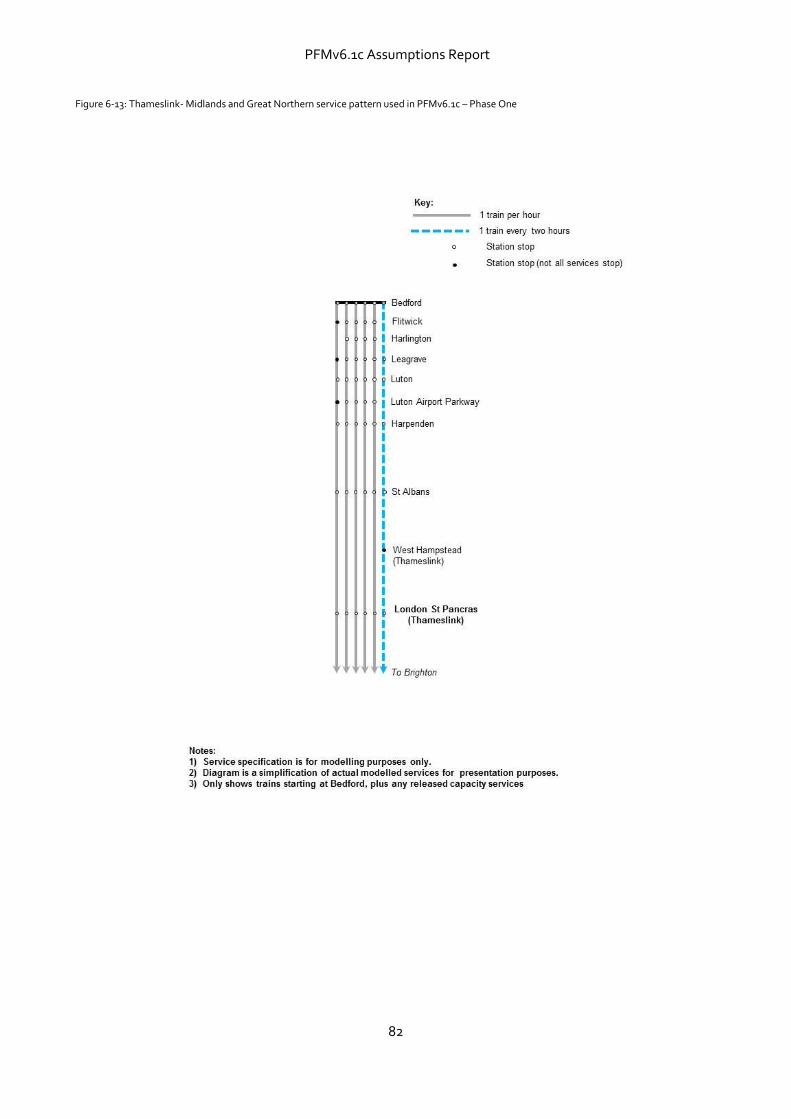
PFMv6.1c Assumptions Report
82
Figure 6-13: Thameslink- Midlands and Great Northern service pattern used in PFMv6.1c – Phase One
PFMv6.1c Assumptions Report
83
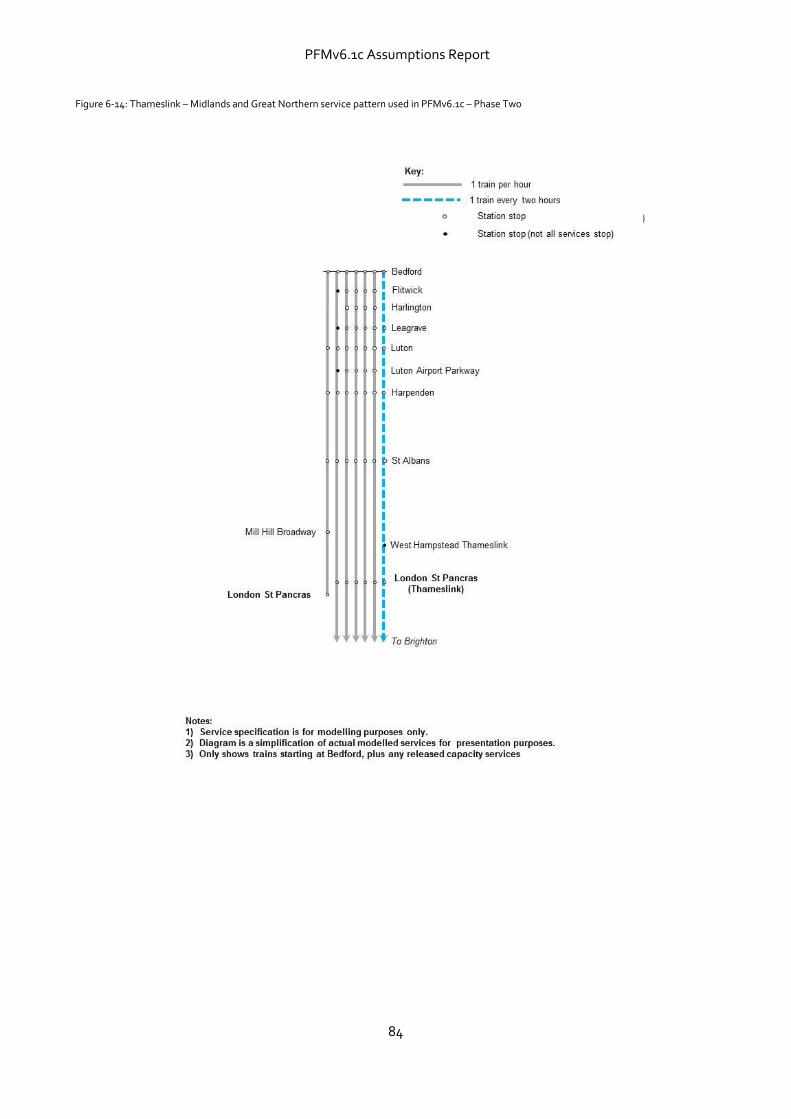
PFMv6.1c Assumptions Report
84
Figure 6-14: Thameslink – Midlands and Great Northern service pattern used in PFMv6.1c – Phase Two
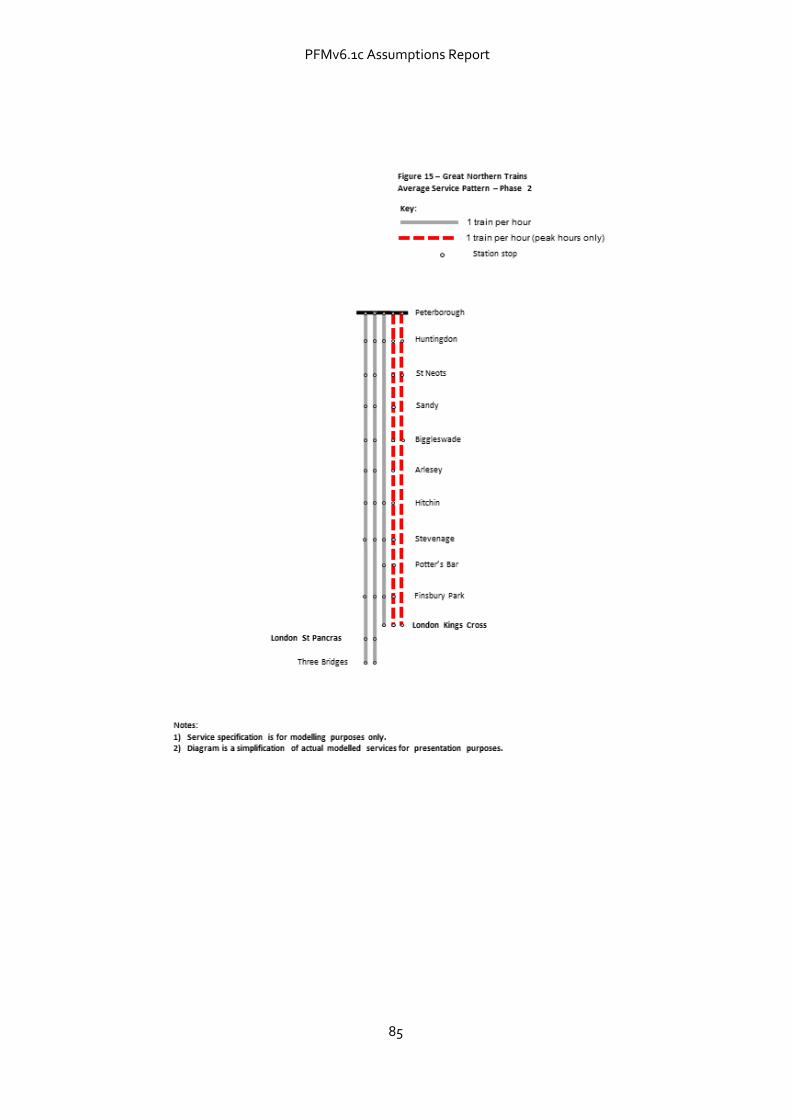
PFMv6.1c Assumptions Report
85
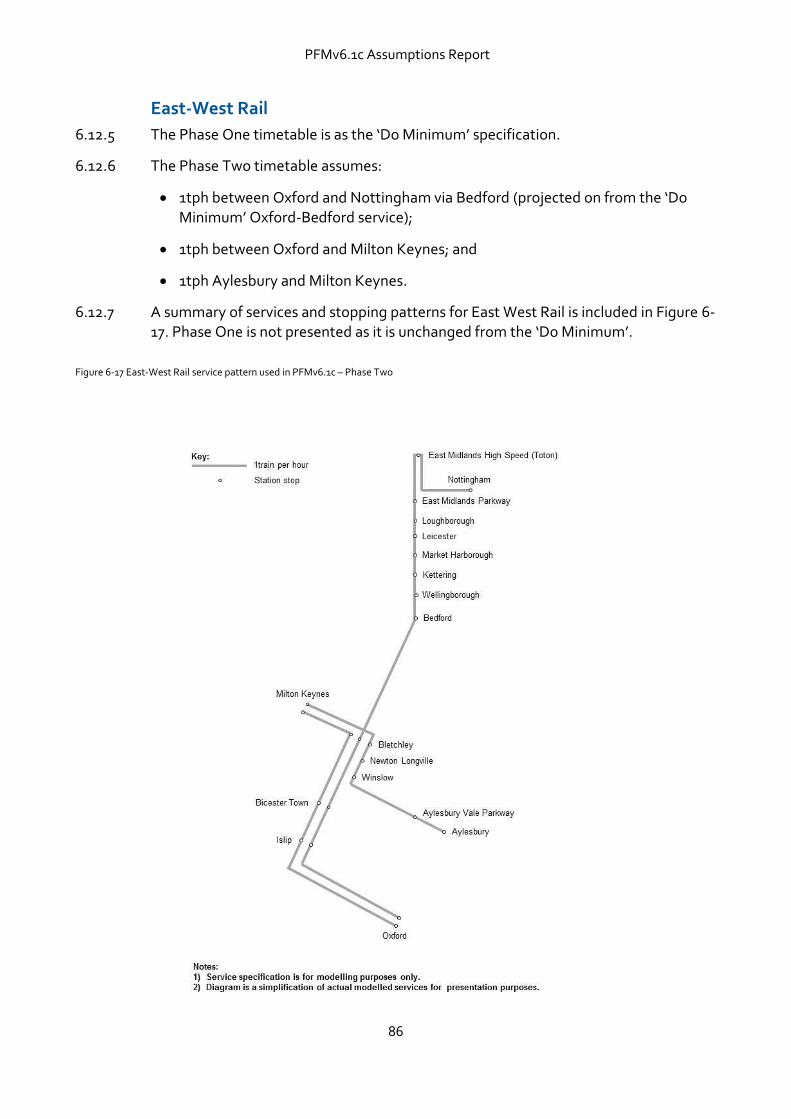
PFMv6.1c Assumptions Report
86
East-West Rail
6.12.5 The Phase One timetable is as the ‘Do Minimum’ specification.
6.12.6 The Phase Two timetable assumes:
1tph between Oxford and Nottingham via Bedford (projected on from the ‘Do Minimum’ Oxford-Bedford service);
1tph between Oxford and Milton Keynes; and
1tph Aylesbury and Milton Keynes.
6.12.7 A summary of services and stopping patterns for East West Rail is included in Figure 6-17. Phase One is not presented as it is unchanged from the ‘Do Minimum’.
Figure 6-17 East-West Rail service pattern used in PFMv6.1c – Phase Two
PFMv6.1c Assumptions Report
87
6.13 Old Oak Common - Great Western and Heathrow Express
6.13.1 All Crossrail, Great Western and Heathrow Express services between Paddington and the west call at Old Oak Common in both Phases One and Two. The impact of stopping at Old Oak Common is an increase in journey time of between two and four minutes.
6.14 Old Oak Common - Crossrail
6.14.1 All Crossrail trains that travel the western section towards Heathrow and West Drayton/Maidenhead/Reading in the ’Do Minimum’ additionally call at Old Oak Common in the ‘Do something’ scenario
6.14.2 In addition, services that start/end at Paddington are extended to serve Old Oak
Common. The maximum capacity for turnaround at Old Oak Common is 12 trains per hour; therefore 12 trains per hour are extended in the morning and evening peaks, and eight trains per hour have been extended in the off-peak. This extension is split equally between the Paddington to Shenfield, and Paddington to Abbey Wood34 services.
34 In practice, these services are modelled to start/terminate at Liverpool Street as Abbey Wood is not represented in the PFM.
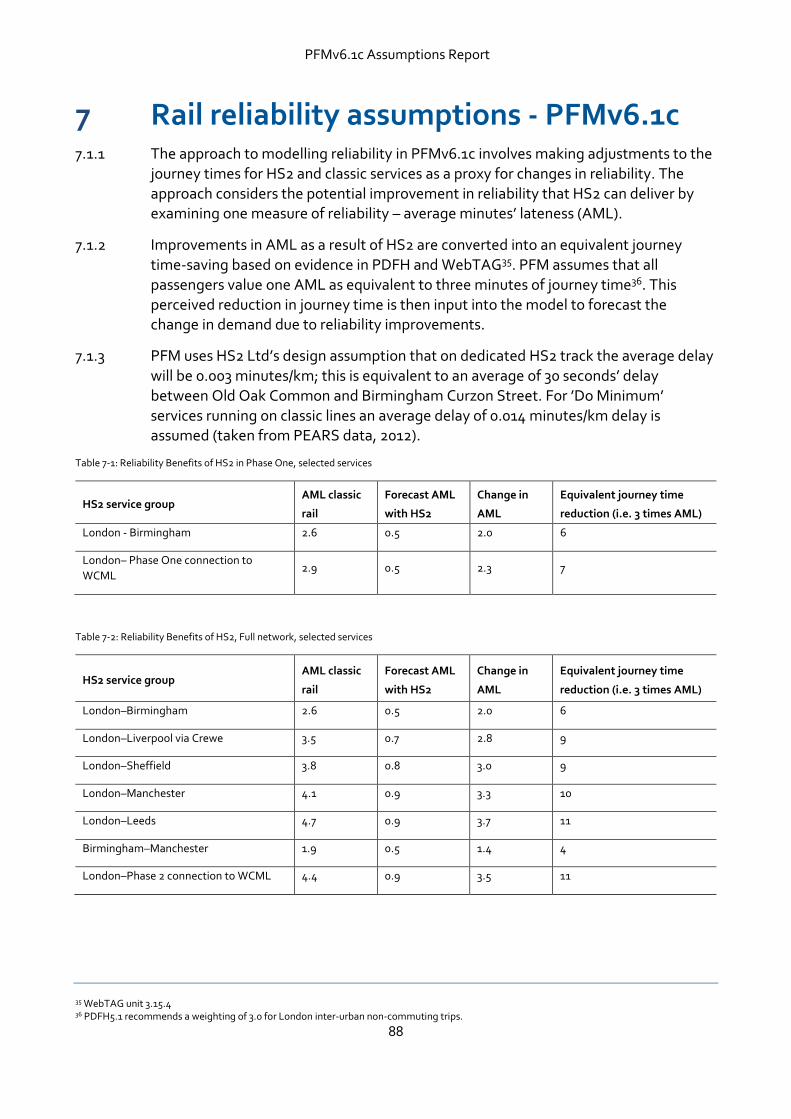
PFMv6.1c Assumptions Report
88
7 Rail reliability assumptions - PFMv6.1c 7.1.1 The approach to modelling reliability in PFMv6.1c involves making adjustments to the
journey times for HS2 and classic services as a proxy for changes in reliability. The approach considers the potential improvement in reliability that HS2 can deliver by examining one measure of reliability – average minutes’ lateness (AML).
7.1.2 Improvements in AML as a result of HS2 are converted into an equivalent journey time-saving based on evidence in PDFH and WebTAG35. PFM assumes that all passengers value one AML as equivalent to three minutes of journey time36. This perceived reduction in journey time is then input into the model to forecast the change in demand due to reliability improvements.
7.1.3 PFM uses HS2 Ltd’s design assumption that on dedicated HS2 track the average delay
will be 0.003 minutes/km; this is equivalent to an average of 30 seconds’ delay between Old Oak Common and Birmingham Curzon Street. For ’Do Minimum’ services running on classic lines an average delay of 0.014 minutes/km delay is assumed (taken from PEARS data, 2012).
Table 7-1: Reliability Benefits of HS2 in Phase One, selected services
HS2 service group AML classic
rail
Forecast AML
with HS2
Change in
AML
Equivalent journey time
reduction (i.e. 3 times AML)
London - Birmingham 2.6 0.5 2.0 6
London– Phase One connection to
WCML 2.9 0.5 2.3 7
Table 7-2: Reliability Benefits of HS2, Full network, selected services
HS2 service group AML classic
rail
Forecast AML
with HS2
Change in
AML
Equivalent journey time
reduction (i.e. 3 times AML)
London–Birmingham 2.6 0.5 2.0 6
London–Liverpool via Crewe 3.5 0.7 2.8 9
London–Sheffield 3.8 0.8 3.0 9
London–Manchester 4.1 0.9 3.3 10
London–Leeds 4.7 0.9 3.7 11
Birmingham–Manchester 1.9 0.5 1.4 4
London–Phase 2 connection to WCML 4.4 0.9 3.5 11
35 WebTAG unit 3.15.4 36 PDFH5.1 recommends a weighting of 3.0 for London inter-urban non-commuting trips.
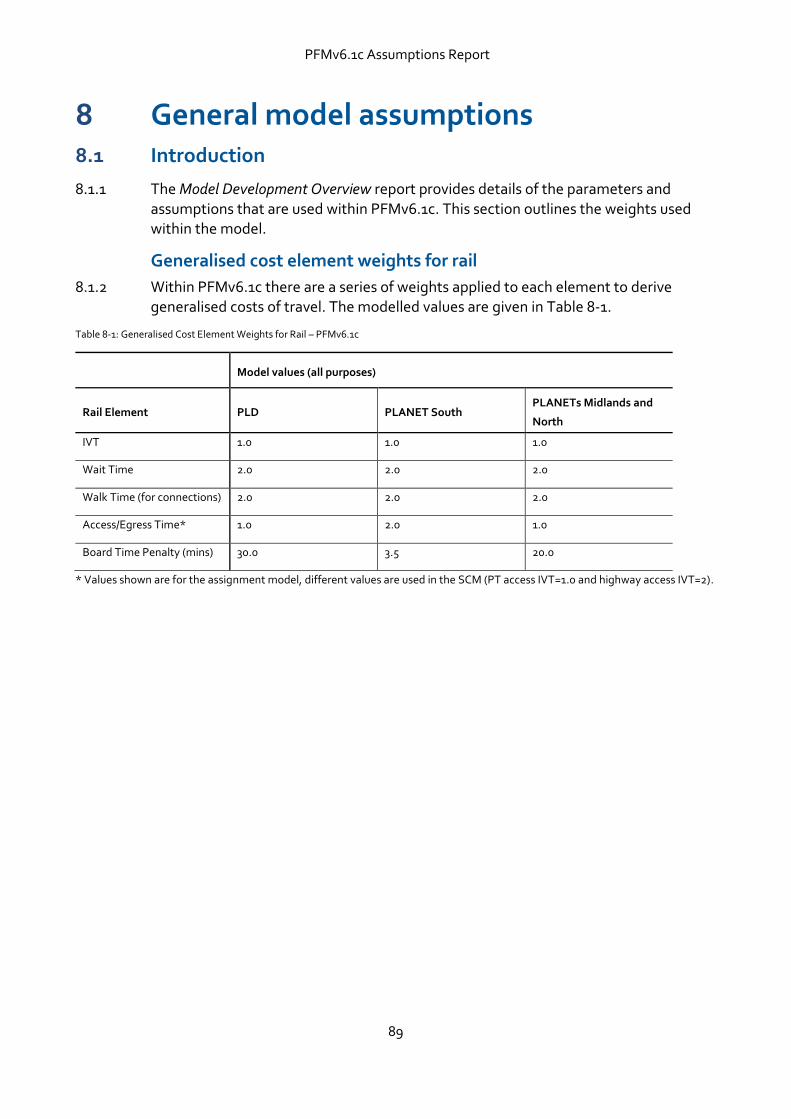
PFMv6.1c Assumptions Report
89
8 General model assumptions 8.1 Introduction
8.1.1 The Model Development Overview report provides details of the parameters and assumptions that are used within PFMv6.1c. This section outlines the weights used within the model.
Generalised cost element weights for rail
8.1.2 Within PFMv6.1c there are a series of weights applied to each element to derive generalised costs of travel. The modelled values are given in Table 8-1.
Table 8-1: Generalised Cost Element Weights for Rail – PFMv6.1c
Model values (all purposes)
Rail Element PLD PLANET South PLANETs Midlands and
North
IVT 1.0 1.0 1.0
Wait Time 2.0 2.0 2.0
Walk Time (for connections) 2.0 2.0 2.0
Access/Egress Time* 1.0 2.0 1.0
Board Time Penalty (mins) 30.0 3.5 20.0
* Values shown are for the assignment model, different values are used in the SCM (PT access IVT=1.0 and highway access IVT=2).
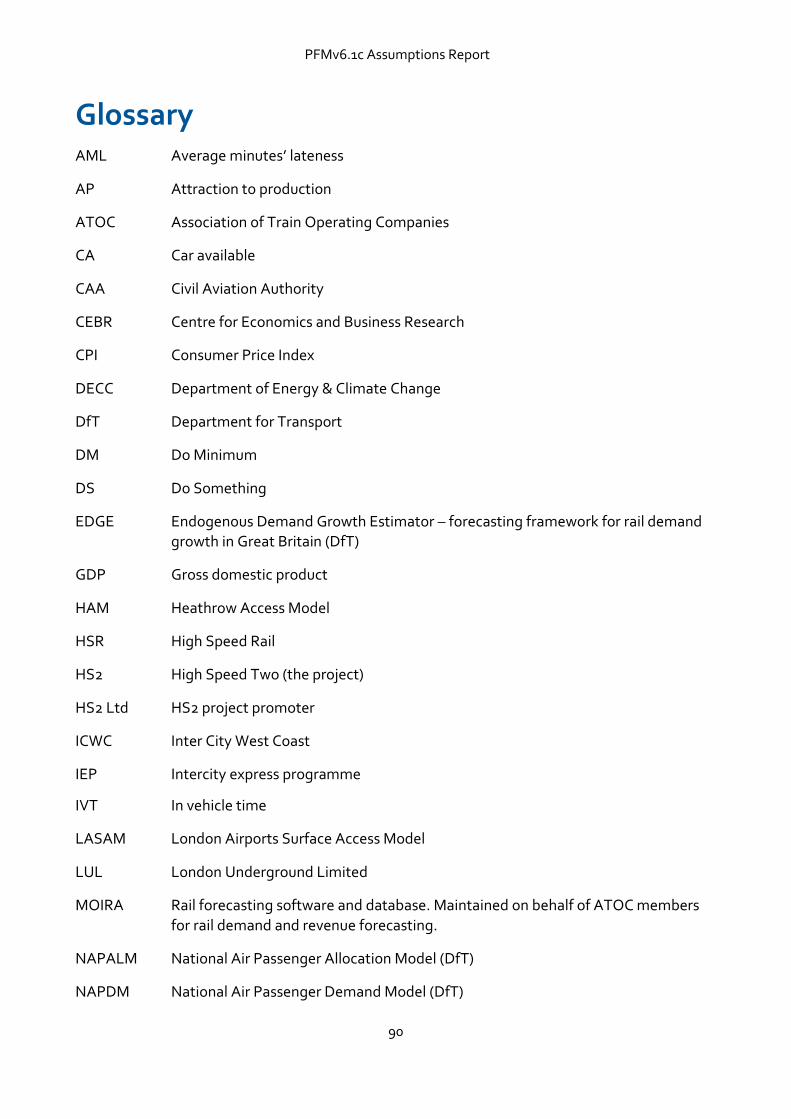
PFMv6.1c Assumptions Report
90
Glossary AML Average minutes’ lateness
AP Attraction to production
ATOC Association of Train Operating Companies
CA Car available
CAA Civil Aviation Authority
CEBR Centre for Economics and Business Research
CPI Consumer Price Index
DECC Department of Energy & Climate Change
DfT Department for Transport
DM Do Minimum
DS Do Something
EDGE Endogenous Demand Growth Estimator – forecasting framework for rail demand growth in Great Britain (DfT)
GDP Gross domestic product
HAM Heathrow Access Model
HSR High Speed Rail
HS2 High Speed Two (the project)
HS2 Ltd HS2 project promoter
ICWC Inter City West Coast
IEP Intercity express programme
IVT In vehicle time
LASAM London Airports Surface Access Model
LUL London Underground Limited
MOIRA Rail forecasting software and database. Maintained on behalf of ATOC members
for rail demand and revenue forecasting.
NAPALM National Air Passenger Allocation Model (DfT)
NAPDM National Air Passenger Demand Model (DfT)
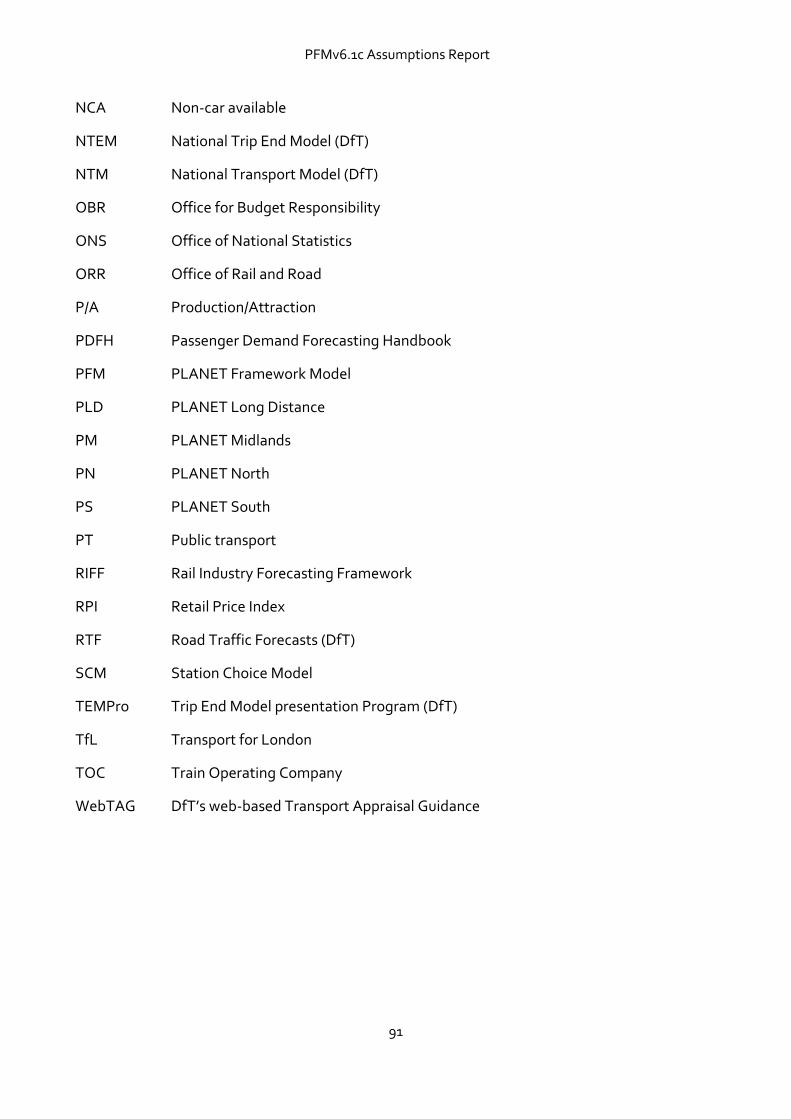
PFMv6.1c Assumptions Report
91
NCA Non-car available
NTEM National Trip End Model (DfT)
NTM National Transport Model (DfT)
OBR Office for Budget Responsibility
ONS Office of National Statistics
ORR Office of Rail and Road
P/A Production/Attraction
PDFH Passenger Demand Forecasting Handbook
PFM PLANET Framework Model
PLD PLANET Long Distance
PM PLANET Midlands
PN PLANET North
PS PLANET South
PT Public transport
RIFF Rail Industry Forecasting Framework
RPI Retail Price Index
RTF Road Traffic Forecasts (DfT)
SCM Station Choice Model
TEMPro Trip End Model presentation Program (DfT)
TfL Transport for London
TOC Train Operating Company
WebTAG DfT’s web-based Transport Appraisal Guidance