Embed Size (px)
Citation preview
HRP
These Digests are issued in the interest of providing an early awareness of the research results emanating from projects in the NCHRP. By making these results known as they are developed, it is hoped
that the potential users of the research findings will be encouraged toward their early implementation in operating practices. Persons wanting to pursue the project subject maner in greater depth may
do so through contact with the Cooperative Research Programs Staff, Transportation Research Board, 2101 Constitution Ave., NW., Washington, D.C. 20418.
Areas of Interest: 11 administration, 12 planning, 13 forecasting, Responsible Staff Engineer: Kenneth S. Opiela 40 maintenance, 54 operations and traffic control (all modes)
Implementation of Geographic Information Systems (GIS) in State DOTs
An NCHRP digest of the essential findings from the interim report on NCHRP Project 20-27 "Adaptation of Geographic Information Systems
for Transportation," prepared by Alan Vonderohe, Larry Travis, and Robert Smith, University of Wicconsin, Madison
1. THE PROBLEM AND ITS SOLUTION
develop a top-level design and implementation plan for GIS-T that will be responsive to technical (present and
Administrators, engineers, and researchers are 10-year future), economic, social, and institutional needs continually faced with transportation problems on which and that will have an immediate, and favorable, impact much information exists, often in the form of reports, on GIS endeavors in transportation. The first step in computer data, and undocumented experience and this effort was to review the status and plans of efforts to practice. Because of the complexity of many implement GIS-T. The materials presented in this RRD transportation issues, both within and across modes, the provide (1) a 1990-1991 snapshot of the GIS-T information required to fully consider the various implementation status in the U.S., (2) a description of alternatives frequently resides in a number of units within feasible applications, (3) a review of technological and local, state, and federal agencies and is not readily institutional issues that are faced in implementing GIS-T, available for use in the decision process. . and (4) an outline of critical factors that must be consi-
Geographic Information Systems (GIS), which have dered. This information will serve as the basis for - been, successfully applied in many fields outside of the developing a generalized design, implementation plan, and transportation industry, offer the potential to assemble management guide for GIS-T in a transportation agency and process data from a diversity of sources and present in the second phase of the research project. The material it in an easily understood graphical format. The presented herein will be useful to agencies in determining capabilities of a GIS in the transportation field (GIS-T) their standing relative to other agencies, better under- will permit the assimilation, integration, and presentation standing the opportunities and constraints associated with of data collected and stored by each of the divisions GIS-T, and making the necessary implementation within a highway agency. To exploit the full capabilities decisions. of GIS-T, there is a need to identify current applications of GIS concepts and technologies in the transportation field, to identify uses that may be possible with the 2. FINDINGS development of advanced GIS concepts and technologies, to design a GIS-T that will provide comprehensive and 2.1. Agency Survey timely information for management decision support, and to assess the impacts of implementing a GIS-T on the The purpose of the survey of the research was to transportation industry. . develop an understanding of the current status and likely
NCHRP Project 20-27 was initiated in response to future direction of GIS-T. This included identification of.; these needs. The primary objective of the research is to the technical and institutional problems and methods .fOt
TRANSPORTATION RESEARCH BoARD .
NATIONAL RESEARCH COUNCIL ,
addressing them; understanding of successful and unsuccessful implementation strategies; identification of additional design and implementation constraints including both internal and external factors; understanding of agency needs; understanding of the perceived role and organizational fit of GIS-T; identification of current technological limitations; understanding of GIS-T computing and data environments; and understanding of the relationship between GIS-T and other emerging technologies.
During the first half of 1990, the American Association of State Highway and Transportation Officials (AASHTO) conducted a survey of the status of GIS-T at the state or provincial level in the United States and Canada. The questionnaire addressed system status, goals, hardware, software, data, interagency and intra-agency coordination, projects, application priorities, standards, technology transfer, research, and impediments. AASHTO also requested that each state designate a "contact person for GIS-T. During 1989, the Nebraska and Virginia DOTs conducted their own surveys concerning state-level GIS-T within the United States. The existing surveys provided considerable, but general, background information that was used as the basis for obtaining more detailed, individualized information from each state.
This research effort had four primary components: (1) interviews with each state's DOT or highway department; (2) site visits to selected state DOTs; (3) a meeting of the research team with a panel of experts; and (4) interviews with selected Metropolitan Planning Organizations (MPO5).
In order to collect in-depth basic information from the 50 states, questionnaires were prepared based on the responses to the AASHTO survey. The questionnaires covered nine topic areas deemed critical for GIS-T design and implementation planning: (1) activities, objectives, and status; (2) applications; (3) state government computing environment; (4) departmental computing environment; (5) departmental GIS-T initiatives; (6) data environment and issues; (7) GIS in other agencies and interagency data sharing; (8) management issues; and (9) advances in technology. The response rate to a long "mail-back" questionnaire was a concern. Consequently, it was decided to conduct the survey as a telephone interview with a copy of the questionnaire sent to the AASHTO GIS-T contact person in each state prior to the interview. The information obtained during this survey is summarized in the following sections and in Appendix A.
21.1. Activities, Objectives, Status
Only a few DOTs have little interest or enthusiasm for GIS-T (Hawaii and Wyoming are examples). A number are gathering information and learning from the experience of others. A few expect to undertake feasibility studies (Nevada, for example) and others have recently completed them (Washington, for example). New Mexico and others are undertaking pilot projects. Pilots have been completed in Arizona, North Carolina, and elsewhere. Some DOTs are currently implementing
GIS-T and training users (Indiana, for example). A few have operational systems under expansion (New Hamp-shire and Wisconsin are examples). The Alaska DOT finds itself in a particularly unique position. They have acquired GIS-T software and are eager to proceed, but there are very few maps of Alaskan highways that are viable for GIS-T use. A few DOTs (Louisiana, Ohio, and Oregon) have systems that have evolved since the early or mid-1980s. These agencies took the earliest steps in GIS-T development. Typically, their systems link digital maps and attribute databases and contain substantial amounts of software developed in-house or on contract.
In a few states the initial stimulus for GIS-T was provided by a key administrator (Colorado is an example), while in most other states interested staff have been the leaders. In the majority of cases the roots of GIS-T initiatives have been with DOT planners. In some cases engineers or management information systems (MIS) staff have taken the lead and, in a few cases, the initiative has been with photogrammetric and geodetic staff. MIS units have sometimes become involved only after initial steps have been taken by a user group. Early critical decisions (such as the scale of the base map) and the approach to implementation often depend on which group has taken the lead. In some DOTs GIS-T interest and activity have appeared spontaneously in various departments. New York, Minnesota, California, and Texas have diverse activity throughout their agencies. Each of these DOTs is currently trying to come to grips with the significance of GIS-T for the agency as a whole. The Texas DOT has placed a moratorium on further GIS-T activities until an overall direction for the agency has been established.
The Michigan DOT has contracted with a consultant for development of a GIS-T implementation plan. They have finished a feasibility study and are developing a statewide digital control section atlas. Michigan DOT has acquired a number of GIS-T vendor products for evaluation. The Pennsylvania DOT has also contracted with a consultant for development of a GIS-T strategic plan. They have a long history of success with digital cartography and have complete coverage of state-maintained highways at 1:24,000 scale. The local road network is being added to their base map and they are eager to establish overall direction for the GIS-T.
Formal strategic plans for GIS-T are rare within the DOTs. Even rarer are such plans integrated with the overall general computing plans of the departments. DOTs that have developed and followed formal GIS-T plans seem to have made the most progress. GIS-T efforts in Florida and Wisconsin have matured to the point where centrally-developed applications are being introduced at the district level. Florida expects to dis-tribute its Traffic and Roadway Characteristics Reporting (TRCR) application to its districts during 1991. Wisconsin installed its pavement management application at the district level during 1990. Many DOTs are participating in statewide GIS coordination efforts. Some are playing lead roles. The Kentucky and Kansas DOTs have slowed their internal GIS-T efforts until statewide directions for GIS have been established. Some statewide efforts have led to selection of a single base map scale for
all state agencies and development of blanket orders for preferred GIS vendors.
Technical staff in many DOTs are eager to make progress and are striving to move GIS-T up on the agency agenda. The significance of GIS-T to the agencies is a key issue. Without high-level commitment to GIS-T, stagnation and loss of momentum easily occur. There are at least as many examples of promising efforts that have dwindled as there are examples of successful efforts that have led to well-established GIS-T programs. Effective methods for winning and sustaining the support of top management are critical at the present stage of GIS-T development.
There is significant diversity in two related areas: the definition of GIS-T and the role of GIS-T within the agencies. Some believe their systems to be GIS-T when their most sophisticated operation is graphic query, but others insist that in order to qualiI' as GIS-T a system must have spatial data integration functions such as network overlay. More important is the relevance of GIS-T to the agency. Some view GIS-T as a new computing tool (like computer-aided mapping (CAM)) to be applied to a certain limited class of problems. For them GIS-T is tangential to the agency's overall information systems mission. Others view GIS-T as the long-sought basis for data and process integration. For them the class of problems which GIS-T addresses encompasses a great deal of the agency's business and, therefore, GIS-T should be an integral component of the agency's information systems mission. These are very different perspectives, and approaches to implementation vary accordingly. It is appropriate to say that a majority of DOTs have not yet developed a collective view of the relevance of GIS-T and that they are beginning to realize that they need to do so.
21.2. Applications
In many cases GIS-T applications have been limited to pilot studies because of the lack of comprehensive digital base maps at the appropriate scale. [NOTE: Here and elsewhere the term "basemap" is intended to include digital representations of map features, their locations and shapes, and their spatial relationships (topology).] Many early applications have been "thematic mapping" with highway network attributes selected from a mainframe database and segments with selected attributes displayed on the base map. The applications mentioned most often during interviews were: highway inventory, pavement management and bridge management, safety analysis, routing, and executive information systems.
Highway inventory constitutes the major attribute databases which potentially support a multitude of other GIS-T applications. Typically a DOT's highway inventory consists of a diverse collection of mainframe files that are difficult (or nearly impossible) to integrate. In many cases the data exist in flat files-and are not incorporated under any database management system. These circumstances not only prohibit comprehensive GIS-T application de-velopment, but they also limit the efficiency and efffective-ness of an agency's overall information systems efforts.
A number of state DOTs are redesigning their highway inventory systems and bringing them into relational database management environments. Redesign efforts are underway in Kentucky, Minnesota, Missouri, Nebraska, North Carolina, Oregon, Vermont, and Wisconsin. In some cases GIS-T considerations have high priority in the redesign. Louisiana has an existing highway inventory application. Florida's initial GIS-T application (called Traffic and Roadway Characteristics Reporting) provides general-purpose access to the agency's highway inventory databases.
Federal mandates require development of pavement and bridge management systems, which do not have to be GIS-based. Wisconsin DOT has a GIS-based pavement management system that is operational and is being used by district managers. Ohio and Oregon also have pavement management systems and one of North Carolina's prototype GIS-T applications was pavement management. California developed a bridge management system in response to the October 1989 earthquake. A number of other states intend to develop GIS-based applications in both pavement and bridge management.
The AASHTO survey indicated that many states hope to develop safety analysis applications. Ohio and Oregon have accident analysis applications, and a safety management system is under development in Wisconsin. The second North Carolina prototype GIS-T application was an accident analysis system.
A number of states hope to use GIS-T to solve routing problems. Oversize and overweight truck routing was mentioned most often. Wisconsin and Ohio are developing routing applications. Colorado DOT has used GIS-T for hazardous waste routing. Intelligent Vehicle Highway Systems (IVHS5) have a routing component and some DOTs, such as those in Colorado and Minnesota, are studying the potential of GIS-T in this area.
Executive Information Systems (EIS) which have merit in their own right may, additionally, be an effective way of winning and maintaining top-level management support for GIS-T. In many states EIS is high on the priority list for GIS-T application development. The ability to provide "quick-look", summary information in map form could significantly enhance the usefulness of EIS. FHWA has developed a prototype GIS-based Executive Information System.
GIS-T applications for project tracking have been developed at Louisiana and California DOTs, the latter as part of their State-wide Transportation Improvement Plan. A project tracking application is also under development at Connecticut DOT.
Louisiana, New Hampshire, and Connecticut use GIS-T techniques to produce highway strip maps. Ohio and Oregon have applications in traffic signals and signs and in traffic system management, respectively. In the area of transportation modeling, Connecticut plans to derive traffic analysis zones from TIGER files, Ohio is planning to develop a traffic assignment application, and Minnesota is developing linkages between GIS-T and existing transportation planning models.
Innovative GIS-T pilot projects were developed at the Arizona and Wisconsin DOTs. The Arizona pilot
involved litigation avoidance in right-of-way acquisition cases. The pilot application helped to settle four cases out of court, resulting in considerable savings for the Department. The Wisconsin pilot application linked GIS-T with photolog images that had been scanned and stored on optical disk. Access to the photolog images was enabled through "point-and-click" graphic query of the GIS-T base map. It was then possible to view sequences of photolog images at various speeds, simulating the visual driving experience. This popular application has been duplicated and enhanced in various forms by vendors.
When asked what software functionality and system characteristics (e.g., spatial operators) were needed to support GIS-T applications, many DOTs could not respond because of a lack of experience. Graphic query ('point-and-click" and thematic mapping) was mentioned most often, perhaps because nearly all existing applications depend on this function. For those who were familiar with the terms, "dynamic segmentation" and "network overlay" were viewed as absolutely critical. Full topologic data structure, routing capability, modifiable user interface, open architecture, and the ability to handle multiple location reference systems were sometimes mentioned, as were more routine capabilities such as hard copy cartographic output and report generation. Not surprisingly, the standard GIS operation of polygon overlay was rarely mentioned, perhaps because initial applications have understandably addressed highway network problems. Those applications requiring area analysis, such as corridor selection, have yet to be undertaken. The Indiana and Minnesota DOTs specifically identified network generation as a necessary software function for GIS-T.
With GIS-T currently in its infancy, the range of existing applications is considerably limited. Nonetheless, the capacity for using GIS-T to approach old problems in new ways has been sufficiently demonstrated. Once the highway inventory redesigns mentioned earlier and the necessary base maps are complete, GIS-T applications can be expected to proliferate. It should then be possible to solve both old and new problems that previously could not even be effectively addressed.
21.3. State Government Computing Environment
Many states have centralized mainframe computing facilities administered by a single agency or service center. However, the specialized computing needs of DOTs have typically resulted in the DOTs supporting their own engineering computing. The usual case has DOT corporate databases residing on a central agency's large mainframe with computer-aided design (CAD), mapping, and GIS-T being done on a smaller mainframe or distributed work stations at the DOT. In some cases (New York and Oregon, for example) state agency computing is quite decentralized and DOTs are likely to have their own large mainframes.
The institutional trend appears to be toward more centralization (Texas is a good example), while the technological trend is away from centralization. In a few states central computing agencies play a strong role in
statewide GIS efforts (with obvious implications for GIS-T) and in other states those agencies seem to be paying little heed to GIS developments. Many states have some formal mechanism for centralized review and approval of major computer hardware purchases and in some cases software purchases. Few requests are rejected, but the process can be slow and cumbersome, with delays of 12 to 18 months not uncommon. This clearly limits the ability of some DOTs to take timely advantage of technological advances.
21.4. Departmental General Computing Environment
Within DOTs there appears to be a substantial degree of decentralization except for mainframe computers. In the majority of cases corporate databases reside on IBM or AMDAHL mainframes. At least seven DOTs have their large databases on UNISYS mainframes. At least five use IBM AS/400s. The most frequently mentioned mainframe database management systems were DB2 and ADABASE, with ten or more installations of each. An array of file managers are used. Typically, a DOTs corporate data will be in a variety of formats, managed by a number of different software systems.
Engineering computing is most often supported by a DEC VAX mainframe or VAX cluster (frequently running Intergraph software under the VMS operating system). Many DOTs are moving, or intend to move, their engineering computing to UNIX work stations. The most often mentioned database management systems for engineering computing were DMRS, ORACLE, and INFORMIX with the trend being towards relational database management.
Each DOT, typically has a wide variety of microcomputers that are usually DOS-based. Usually there is also a wide variety of database management software for the PCs. Only a few DOTs have standard-ized their microcomputer environment.
The use of networks appears to be growing, but most states do not have full network integration among PCs, work stations, and mainframes. The sophistication of existing and planned networking varies. Some DOTs have very little, but more have or are developing extensive local- and wide-area networks. Most often, the primary network is ETHERNET with token-ring LANs connecting pockets of PCs and with SNA gateways providing work station and PC access to large mainframes. Districts in a number of states are currently on-line with headquarter computing resources; in other states networking to districts is planned; and in a few, typically those where districts do only construction and maintenance, there are no plans for bringing them on-line with headquarters.
Planning for general computing in many DOTs is informal and no written plans are available. In others, there is a formal planning process, often linked to budget cycles. In a few states (Mississippi, as an example), agency computing plans are mandated and must be approved by a central department, office, or commission. The status of GIS-T within an agency's overall computing plan may be an indicator of potential for success. A few
noteworthy examples are Wisconsin, where GIS-T is a central focus in the agency's overall computing strategy; Indiana, where CAD and GIS-T rank second and third, respectively, in computing priority; and Virginia, where GIS-T ranks fourth in a long list of priorities.
21.5. Departmental GIS-T Computing Environment
DOTs have acquired software from three primary vendors: Intergraph, ESRI, and McDonnell Douglas. There appear to be only a few exceptions. The Alaska DOT has selected GEOBASED. California has installations of both ARC/INFO (ESRI) and ULTIMAP. TRANSCAD (from Caliper Corporation) is being used experimentally by the Michigan and Oklahoma DOTs.
Many DOTs have been using Intergraph for computer-aided mapping and design and are building upon their existing investment to support GIS-T. Some are attempting to use the Intergraph product IGDS along with the DMRS database manager to perform GIS-T operations. Others have acquired Intergraph products (such as MGE) intended for GIS, and a few are using them with relational database management systems such as INFORMIX. One or two DOTs have selected their existing Intergraph hardware for GIS-T but have not yet chosen their software vendor.
DOTs with McDonnell Douglas software are typically using the core product (GDS) along with various modules to support computer-aided.design, mapping, and GIS-T. Indiana DOT has recently undertaken a major implementation. The company is porting their software to UNIX platforms and is about to release a new GIS product called PCN. DOTs typically use McDonnell Douglas software in conjunction with third-party relational database management systems such as ORACLE.
Typically, those state DOTs using ARC/INFO conceptually segregate their GIS-T and engineering design functions. A number of DOTs running ARC/INFO on VAX mainframes or clusters intend to move to UNIX work stations. However, as few as three (California, North Carolina, and Wisconsin) are currently using UNIX platforms. Many DOTs that use ARC/INFO expect to adopt third-party relational database management software for GIS-T.
Usually GIS-T access to large mainframe databases is either by "sneaker net" (physical tape transfer) or by on-line file transfer utilities. Such methods are viable because of the relatively static nature of the data. For example, most highway inventory databases are not transactional but are updated on, perhaps, monthly or even annual cycles.
Some DOTs are seeking direct record-level access to mainframe databases. Recent product development efforts by vendors such as Software AG, IBM, ESRI, and Intergraph appear to be addressing this problem by linking GIS directly to mainframe database management systems. Adoption of such products by DOTs will require solutions to problems concerning corporate data security and referential integrity as use of GIS-T expands throughout the agencies.
The administration of GIS-T computing varies
considerably. The New Jersey DOT has a permanent GIS Section that provides full services, from database design to application development and even production. They have a "walk-up" service for users and devote considerable effort to producing reports and final cartographic products. New Jersey DOT would like to provide direct user access to GIS-T, but there is limited funding for additional equipment and training.
The Wisconsin DOT also has a permanent GIS Section. The central staff does system design, base map maintenance, low-level application development, and training. "Master" users in various functional areas are trained to do high-level application development (macro writing and testing). End users have hands-on access to GIS-T. In Ohio and Oregon, GIS-T is administered primarily by user units. In a few states special units (often sub-units of a larger MIS unit) support engineering computing including both CAD and GIS-T. In Minnesota, there is currently no central administration of GIS-T and application development has been on an ad hoc project basis. The Kentucky DOT believes that it will not be able to commit substantial staff resources to GIS-T development. They need a nearly complete off-the-shelf vendor product. The Maryland DOT has hired consultants for application development.
Future potential for agency-wide access to GIS-T that includes integratable databases, robust applications, and sustained institutional support appears to be best in DOTs whose MIS groups are heavily involved in GIS-T activities.
GIS-T system development is sometimes constrained by the timetables of vendors. This is particularly true if staffing limitations require strong reliance on off-the-shelf products. On the other hand, DOTs which have a great deal of in-house or contracted software (e.g., Ohio, Louisiana, and Oregon) may have difficulty taking advan-tage of fundamental, low-level improvements in vendor products.
21.6. Data Environment and Issues
The GIS-T data environment is fraught with unanswered questions and unresolved issues. There is a difference of opinion on the appropriate scale of the primary base map, resulting in differing levels of investment (time and dollars). A number of agencies have found that their corporate data, in its current form, cannot be effectively used with GIS-T. The future is promising but unclear concerning GIS-T data collection and maintenance.
Spatial Data. One of the first choices faced by DOTs is the source and scale of their GIS-T highway base map. Typically the agencies have elected the 1:24,000 or 1:100,000 scales of U.S. Geological Survey (USGS) topographic maps with their base map being a digital ver-sion of these maps. Nearly equal numbers of states have elected each of the two scales. The scale of Maryland DOTs base map is 1:253,440 (1 in. = 4 miles) and that of Vermont is 1:5,000 (statewide mandate).
The choice of 1:100,000 scale was often based on the ready availability of statewide digital coverage from USGS
in digital line graph (DLG) form. Base maps at that scale usually do not resolve divided highways and complex highway intersections. Those using a 1:100,000 scale have sometimes solved the divided highway problem by main-. taming two identical line representations with opposite topology. In addition, base map development is never as easy as merely acquiring DLGs from USGS. For example, DLG standard attribute coding for highways does not usually agree with state DOT standards and revisions need to be made.
DOTs choosing 1:24,000 scale typically have done so because they believed the additional detail was needed. Many of them sought the largest scale data that could be found on a statewide basis. For most of these states, complete 7-1t2 min map coverage existed in hardcopy form. Digitizing of 1:24,000 maps has been done in-house, on contract or under cooperative funding with USGS, and by independent contractors. Some state DOTs have devoted, or are devoting, as much as 6 years to development of 1:24,000 digital base maps. Some DOTs choosing 1:24,000 scale cited National Map Accuracy Standards and the resolution of their attribute data. The 1/50th in. standard for small-scale maps pro-duces allowable errors of 40 ft on the ground (1:24,000 scale map). The spatial resolution of most highway attribute data is about 53 feet (0.01 mile). Such comparisons are probably useful, but it should be kept in mind that National Map Accuracy Standards apply only to well-defined points. Street intersections are often considered to be well-defined, but locations along highways are not. Also, the act of digitizing introduces additional error, so digital base maps can be expected to be somewhat less accurate than their hardcopy sources. Moreover, 0.01 mile may be the resolution of the attribute data, but it is probably not its accuracy. Given current data collection methods, the locational accuracy of attribute data is probably coarser than its resolution.
The clear trade-off in choosing scales is between level of detail and level of investment. Those electing smaller scales spend fewer dollars and, can develop applications sooner for quicker payback. However, the range of applications that can be addressed with smaller scale data may be more limited. It appears that applications can be grouped according to scale and that, as GIS-T matures, the need to maintain multiple base maps at different scales will probably arise.
Many states use computer-aided mapping for production of their county highway maps. Some DOTs elected to build their GIS-T base map from their county highway maps. Other DOTs have separated their cartographic and GIS-T operations. In these cases, the existing cartographic products have usually been deemed incompatible with the "clean", topologically structured base map that is necessary for GIS-T.
The content of DOT base maps also varies. Some include only state-maintained highways and roads. Some also have local roads. A few have, or will have, every highway, road, and street in the state. A few DOTs also maintain digital base maps for hydrography and political boundaries.
Some DOTs are mixing scales in order to maintain
more extensive information. For example, in Oregon, municipal streets are at 1:24,000 and the remaining roads and highways are at 1:100,000. In New Hampshire, the municipal/nonmunicipal mix is 1:600 and 1:24,000. Louisiana has state-maintained highways at 1:24,000 and intends to fill in local roads at 1:100,000. The mix of scales provides more extensive coverage but will probably pose new problems because of the different levels of generalization and abstraction. Such problems may not become apparent until the data are combined with other, external data such as hydrography (for example, bridges and streams will not match). Area data (polygons) such as land-use (necessary for corridor analysis) may reveal other problems when combined with highway data at mixed scales. To keep users well informed, it will be critically necessary to develop tracking procedures on the lineage of data (this is necessary whether scales are mixed or not).
All existing GIS-T base maps are based on the North American Datum of 1927 (NAD27). Conversion to NAD83 is somewhat of an issue. A number of DOTs have mandates to convert and others expect to do so anyway. Still others continue to discuss the problem without committing. Fortunately, some GIS-T software vendors provide datum conversion utilities. The New Mexico DOT intends to initially develop its GIS-T base map on NAD83.
Nonspatial Data. The incompatibility, and redundancy of many DOT corporate databases are well-recognized. It is perhaps never more clear than when attempts are made to implement GIS-T. Such an attempt in Vermont led directly to redesign of the DOTs databases. The Wisconsin DOT had been seeking a data integration method for years before the advent of GIS-T and is now performing a major database redesign. The redesign efforts in those two states are matched by similar work in Oregon, Nebraska, Minnesota, Kentucky, Missouri, and North Carolina. Although these efforts were not necessarily triggered by GIS-T, key personnel are asserting GIS-T principles during the redesigns.
As expected, there is a long list of location referencing methods within the DOTs. To name a few linear referencing methods include reference point/mile post, county/route/mile post, log miles, control section, and stationing. Nonlinear methods include XJY coordinates, latitude/longitude, and bridge or railroad crossing numbering systems. A number of DOTs assert to have adopted a location referencing standard such as county/route/mile post. However, some have discovered internal variations in the use of the standard. For example, planners may maintain location to the nearest 0.01 mile and engineers may maintain it to the nearest 0.001 mile. Clearly, GIS-T software must be able to manage location referencing in ways that are quite different from those needed for more traditional (area-based) GIS problems.
The spatial (base maps) and the nonspatial (attribute) data must be associated. This is done by including features in the base map that serve as links to location references in the attribute records. An example is the intersection of a highway with a county boundary as
a link for county/route/mile post records. Dynamic segmentation minimizes the links that must be spatially maintained. Some DOTs had invested considerable effort in digitizing highway segments prior to development of this technique.
Data Collection and Maintenance. There is little experience with GIS-T base map maintenance. Many DOTs regularly maintain cartographic products in digital form, but the problems are very different. For example, GIS-T base map maintenance requires attention to topology and to referential integrity with respect to attribute databases.
Moreover, given the potential decision-support capability of GIS-T and the potential for combining highway base maps with other spatial data, some traditional map maintenance techniques may need to be re-examined. For example, some DOTs receive annual map updates from local governments with new alignments drawn on hardcopy maps. This may result in mixing data of varying quality and scale with the base map, resulting in the difficulties mentioned earlier under "Spatial Data."
A number of DOTs are investigating hybrid methods for base map maintenance. Louisiana DOT is participating in a project with Louisiana State University on the use of aerial photos and satellite imagery. New Mexico is considering SPOT satellite imagery, as-built plans, and GPS (Global Positioning System). Wisconsin is developing linkages between highway design files (CAD) and GIS-T, so that alignment updates can be made to their base map without intermediate hardcopy products. All these techniques may pose the mixed scale and data quality problem. Methods will have to be developed for dealing with it.
Most DOTs agree that GPS will revolutionize data collection. The Virginia DOT did some early experimenting with GPS-based data collection in a vehicle. Tennessee used two GPS data collection vans to drive their 13,000 miles of highways over the last two years. Idaho has its own GPS-based data collection vehicle and will be using hand-held GPS receivers for accident reporting. Many DOTs helped fund the recent research and development effort in GPS-based data collection at Ohio State University (OSU).
There is great promise in GPS-based data collection and, as with any new technology (GIS-T included), there are a number of issues to be addressed and questions to be answered:
GPS data are dense and highly accurate (OSU has reported 1-m accuracy in informal presentations). The density and high accuracy of GPS data are not required (and are perhaps undesirable because of overhead) for small-scale analysis over large areas. How will the large amounts of data be managed? Will generalization techniques be required to filter unnecessary information?
GPS data yield strings of coordinates that differ from those in existing digital base maps. How are the new data to be related to existing maps? How are they to be related to locational references in attribute records?
Even though GPS data are highly accurate they still contain random errors. That is, successive passes along the same highway will produce different strings of
coordinates. How will successive GPS data sets be related to one another? One should not expect merely to discard the previous base map each time new data are collected. There will be reasons for maintaining GIS-T histories of both spatial and nonspatial data.
GPS data contain no topology. Topology must be constructed.
An underlying issue is that GPS captures positional data in two- or three-dimensional space, while information concerning highways has traditionally been referenced along the highways (one-dimensional space). In fact, the relatively new technique of dynamic segmentation forms a link between one-dimensional and two-dimensional referencing. Will GPS lead to new methods for locational referencing of highway information?
Other new data collection technologies that can be expected to impact GIS-T are currently being adopted by DOTs. They include automation of engineering surveys, real-time telemetry of traffic counts, and various aspects of imaging (including video) for bridge inventory. Some agencies with GIS-T experience see the need for institutional change in the management of data collection and maintenance. The concept of data as a corporate (agency) resource needs to be promoted, internal data collection standards need to be established, and redundancy in data collection should be eliminated. The Michigan DOT is considering creating an Office for Data Management to coordinate data collection.
2.1.7. Statewide Efforts
Every state has some GIS coordination activity among state agencies (some extend the activity to include federal and local governments, and even to the private sector). In some cases coordination is ad hoc and informal with periodic or irregular meetings among interested individuals. In other cases coordination takes place under executive order, with agency designees having memberships on committees or commissions. In yet other cases, coordination has been legislated and there may be an office or board responsible for statewide GIS coordination. For example, Vermont has a State Office of Geographic Information Systems; North Carolina, a State Center for Geographic Information and Analysis; and Wisconsin, a State Land Information Board.
Compatible or confederated systems development to facilitate data sharing is the primary objective of many of these efforts. Some have taken a decentralized approach and concentrated on standards and mechanisms for data sharing. The Growth Management Data Network Coordinating Council in Florida facilitiates data sharing among eight state agencies and offices. North Carolina is operating under a statewide GIS library network concept. Some states have developed GIS data clearinghouses (e.g., Arizona Land Resources Information System, the Teale Data Center in California, and the Resource Geographic Information System at the University of New Mexico).
Other states have used a top-down approach, at least to the extent that a single base map scale has been established for state agencies (Vermont and New
Hampshire have done so, and Georgia is now in the process). Statewide efforts in Kentucky and Kansas have brought further GIS-T development within their DOTs to a halt until definitive statewide directions have been established. The North Dakota DOTs GIS-T effort is also closely tied to statewide coordination developments. Some states have or are developing blanket-order mechanisms with preferred GIS software vendors.
Some states have an office that facilitates GIS development among their agencies. For example, Mississippi's Research and Development Center conducts GIS pilots and other projects for state agencies.
Kentucky and Minnesota have recently contracted with consultants for development of statewide GIS strategic plans. The Pennsylvania statewide group is waiting for the DOTs strategic plan (being developed by a consultant) before moving forward with a broader one.
DOTs often have lead or primary roles in statewide GIS efforts. There appear to be at least three reasons for this: (1) DOTs have a tradition of map-making and geographic data management. (2) Many other agencies need transportation data. (3) DOTs have always worked closely with local governments in transportation planning, engineering, aerial photography acquisition, and large-scale mapping.
DOT roles seem to revolve around these concepts. DOTs are often looked to for leadership and technical knowledge. DOTs are perceived as custodians of transportation information. And they are often important players in local government land information system (US) development efforts, particularly with regard to geodetic control. The local need for geodetic control is great and de facto responsibility at the state level is usually with the DOT.
The New Hampshire, Minnesota, and Colorado DOTs have derived considerable benefits from their active involvement in local government LIS efforts. New Hampshire is using locally developed 1:600 scale mapping in its GIS-T base map. Minnesota uses local control and mapping for engineering planning and design. Colorado lends GIS equipment to local governments and participates in pilot projects that have mutual benefit.
Typically state agencies do not have common GIS hardware and software. Data exchange standards that have been used include SIF, IGES, DXF, and DLG. All have their limitations. Deeper linkages among vendor software products need to be established, and standards need to account for not only data content and format, but also for data quality. Many states are waiting for release of the federal Spatial Data Transfer Standard (SDTS).
2.1.8 Management Issues
Top management support is generally viewed as critical and difficult to obtain and sustain. In only a few cases (Colorado and Wisconsin, for example) have top-level managers been involved and enthusiastic from the beginning. More often, technical managers must convince those with budget authority to commit resources to GIS-T. The most effective GIS-T efforts seem to have two key personnel: a top manager (with budget authority)
who sponsors the effort and a technical manager who spearheads system design and implementation.
It is important to show top management how GIS-T can be used to support decision making, but the technology should not be oversold. It is easy to make promises that cannot be fulfilled. The Ohio DOT obtained top-management support by providing cartographic products that were used during the agency's budget presentations to the legislature. The Arizona DOTs pilot project demonstrated the effectiveness of GIS-T to top management by avoiding substantial costs for the agency in right-of-way litigation cases. A number of DOTs have placed Executive Information Systems high on their priority lists for GIS-T application development. Some DOTs feel that defensible, quantitative cost/benefit ratios must be developed for GIS-T. Others suggest they are not needed because the effectiveness of the technology can be demonstrated by pointing to key success stories (Arizona's right-of-way application or Wisconsin's pavement management system). Educational materials for top management might be helpful. Brief video presentations and executive seminars were suggested.
Inclusion of GIS-T in the overall formal strategic planning process of the agency helps to ensure future commitment. Long-range implementation plans for the technology are crucial. Implementation planning must account for the organizational structure of the agency in order to minimize conflicts and negative impacts.
GIS-T staffing has been a continuing problem. Many states are currently under hiring freezes and a few GIS-T operations have even had staff cuts. North Carolina conducted a GIS-T feasibility study, evaluated hardware and software, acquired a system, carried out two pilot projects, and developed an approved implementation plan. But they have never been able to hire the necessary permanent staff. Turnover of their temporary staff has inhibited further GIS-T development. Other state DOTs have no staff (or perhaps one person) devoted to GIS-T. A few have permanently staffed GIS-T Sections (New Jersey and Wisconsin). The Missouri DOT recently committed four staff positions to GIS-T.
There are very few people with the right kind of backgrounds for GIS-T. A blend of engineering, geography, and computer science is needed. Typically, existing staff are retrained for GIS-T. Some DOTs use vendors for training and others use consultants. Many conduct in-house training sessions (e.g., Indiana, Minnesota, and Wisconsin). Wisconsin conducts training at three levels: (1) core GIS-T staff, (2) "master" users, and (3) end users. The Idaho DOT sends staff to the USGS Western Mapping Center for training.
2.1.9. Advances in Technology
More intervendor compatibility must be developed. There is a need for standard interfaces that are closer to system data models. Current data exchange formats result in the loss of too much information that must be recovered by editing and keyboard entry. In a similar regard, better linkages need to be developed among
automated systems in the overall infrastructure life cycle process. In particular, improved linkages are needed between CAD and GIS-T and between GIS-T and transportation planning models.
GIS-T data models need better network representation. Three-dimensional data models with overpass and underpass representation are needed. And four-dimensional models, with time as an integral component, should be developed in the future.
GIS-T applications of computer-aided software engineering (CASE) need to be investigated. The successful application of CASE in business systems development shows promise for the major GIS-T development efforts of the future.
Off-the-shelf networking technology needs to be improved. Transmission capacities need to be increased significantly to manage the vast quantities of data that will reside in networked GIS-T.
GIS-T linkages to multimedia need time to mature. Techniques are required for system design and application development that include multimedia in production systems.
Work must be done to integrate advanced data collection technologies with GIS-T. These include GPS and real-time telemetry systems such as those for traffic counts or weather conditions. The relationship between GIS-T and IVHS needs to be more fully developed. And associated technology for storage and retrieval of very large quantities of data must be forthcoming.
2.2. Agency Visits
Site visits were made to three states: New Hampshire, Minnesota, and Wisconsin. All of these states have developed GIS-T applications covering a range of functional areas. The three major GIS software vendors with state DOT installations are represented (Intergraph, McDonnell Douglas, and ESRI). These three states also present a range of institutional environments and implementation strategies. New Hampshire DOT (NHDOT) is a relatively small agency with a central GIS-T focus. Minnesota DOT (MNDOT) is relatively large with diverse GIS-T activities. Wisconsin DOT (WIDOT) is relatively large, has a successful track record with GIS-T application development, and has made a major commitment to agencywide GIS-T implementation. During the visits, top-level managers and GIS-T users participated in discussions in addition to the technical managers who had been initially interviewed by telephone.
2.21. New Hampshire
GIS-T system design and implementation planning began at the NHDOT in 1984. McDonnell Douglas GDS software, running on a DEC VAX was installed in 1987. The hardware was upgraded to a VAX cluster in 1989. New Hampshire takes a holistic view of spatial data management and no sharp distinction is made between GIS-T, computer-aided design, and computer-aided
mapping. The applications that they expect to develop range from engineering design and construction through facilities management and transportation planning. The technology is seen as a systems integrator, representative of the entire organization. The NHDOT initially developed a detailed implementation plan for CAD/GIS-T and that plan has been followed. The plan calls for an "open system" that includes different programming languages.
New Hampshire's approach to GIS-T implementation may be considered top-down. The Data Processing Bureau, through its CAD facility, provides training and technical support for end users. Five staff members develop applications according to user needs. Responsibility for day-to-day production is with users, while GIS-T development and management remain with Data Processing.
New Hampshire's major development effort is in a comprehensive Roadway Inventory System that will support many applications. Their initial application was straight-line diagrams that link graphics to alphanumeric information. The straight-line diagram application is in full production. The NHDOrs application development strategy includes extensive use of macros that make nuances of the GIS-T core software transparent to the user. They have, or are developing, GIS-T applications in design, planning, mapping, and construction. NHDOT is considering linking GIS-T to imaging for a bridge management application. Long-range goals include development of a GIS-based Executive Information System and agencywide use of GIS-T.
Administrative computing at NHDOT is supported by a UNISYS mainframe. The mainframe database environment is RDBMS. Data are transferred, as needed, by tape from the mainframe to NHDOrs VAX cluster running ORACLE. A dynamic link between the UNISYS mainframe and the VAX cluster is a goal of the future. The NHDOT has begun to acquire networked workstations and both PC-based LANs and ETHERNET are available. They are moving toward a server-net model.
Procurement of computing technology by state agencies in New Hampshire requires approval by the Department of Administrative Services. Although requests are typically approved, the full procurement process can be lengthy. The major acquisition of CAD/GIS-T technology in 1987 required 18 to 24 months to complete.
NHDOT plays a significant role in a statewide GIS effort managed by the Office of State Planning and known as GRANIT (Geographically Referenced Analysis and Information Transfer). NHDOT is responsible for development of digital hydrography, transportation, and political boundary data layers. These digital data are being developed at a 1:24,000 scale under joint funding with USGS, which is doing the actual digitizing. At the time of the site visit, 11 of New Hampshire's 249 7-112 min quadrangle maps had been digitized. Digitizing is expected to be completed during 1993. Choice of scale was predicated upon large amounts of data already
10
plotted at 1:24,000 statewide. NHDOT is working with local governments to develop 1:2400 data for urban areas and special studies. NHDOT is also responsible jointly with the National Geodetic Survy for geodetic control in the statewide effort.
NHDOT receives numerous requests for data, not only from other state agencies but also from local governments, particularly Regional Planning Commissions (RPC5). A policy for external access to DOT data is currently being developed. Some efforts to share data in the past have been hampered by lack of an appropriate exchange format (most other state agencies and many of the RPCs use ARC/INFO).
Internal database updates and maintenance are not yet completely coordinated. For example, the roadway inventory includes all town roads and there is currently no timely way to track changes to these roads. NHDOT expects that further development of GPS technology will bring about vast changes in data collection methods. They are considering maintaining a permanent GPS receiver at headquarters to support relative positioning statewide. This might be used not only for data collection but also for densification of geodetic control.
NHDors current CAD/GIS-T staff have been retrained from previous positions. As staffing needs continue to grow, there is demand for people with a blend of backgrounds in both engineering and computing. Although GIS-T appears to be well-established at the NHDOT, sustaining support from top-level management will continue to be a challenge as administrations change.
2.22. Minnesota
MNDOT conducted GIS-T demonstrations 3 years ago. Although the first agencywide GIS-T coordination meeting took place just before the site visit, there is diverse activity in a number of divisions, including Planning, Operations, and Program Management. Appli-cations are also being developed at the district level. Minnesota is using primarily Intergraph products for GIS-T. Among other things they conducted in-house training for 12 people on the Intergraph product MGE in order to familiarize themselves with it.
Minnesota's approach to GIS-T implementation could be characterized as bottom-up. The proliferation of GIS-T interest and activity has led to recent efforts to address the significance of the technology on an agencywide basis. Fundamental issues are being addressed such as whether to implement GIS-T at the program level or to continue at the project level.
Minnesota is redesigning and redeveloping their Transportation Information System (TIS) which contains condition rating, roadway history, traffic data, accident data, and so on. The revised TIS will support GIS-T applications in pavement management, accident analysis, and other areas. MNDOT is linking GIS-T to transportation planning models such as TRANPLAN. GIS-T is used to generate model databases, the models are run, and results are returned to the GIS-T environment for display and reporting. A bridge management application is under development as is a GIS-T link to photolog. MNDOT is investigating possible relationships between GIS-T and IVHS.
A demonstration package, developed at the district level, links multiple base maps and databases at various scales (state, district, county, project, site, floorplan). The demonstration supports various queries at each scale, from display of statewide information at the district and county levels to the distribution of headquarters personnel at the floorplan level.
Application development has been, primarily, at the end-user level. Computer-Aided Engineering Services has facilitated GIS-T training. The bottom-up approach is likely to continue with applications being identified prior to specific implementation.
A number of applications have been developed with 1:100,000 scale base maps derived from USGS DLGs. MNDOrs digital cartographic operation does mapping at 1:24,000. Their cartographic products, heretofore, have not had the topologic integrity required for GIS-T, and some application developers have elected to use the smaller scale DLGs rather than pre-process the 1:24,000 maps. There is now some interest in revising cartographic procedures to include support for GIS-T base mapping. Another aspect of the problem is that MNDOrs 1:24,000 digital coverage is not statewide, and maintenance of the already existing digital products has slowed further de-velopment. Some preliminary conisideration was given to mixing the two scales in order to achieve statewide GIS-T coverage. MNDOT is convinced that GPS and GIS-T, together, will bring about significant changes in data collection and associated base map and database maintenance.
State agency mainframe computing in Minnesota is supported by the Intertech Department. MNDOTs TIS is on an IBM 3090 computer in an MVS/XA environment. The TIS is currently a VSAM file system application. Part of the TIS redesign process involves selection of an appropriate database management system. MNDors engineering and GIS-T computing is supported in-house. Six VAX computers (four at head-quarters) are networked and run Intergraph software under VMS. There has been a recent trend towards Intergraph workstations running CLIX, with some including MGE and either INFORMIX or ORACLE. The networking environment is ETHERNET with pockets of PC token-ring LANs. Twisted-pair wiring is being installed at headquarters to boost the agency's ETHERNET capability. There is on-line access to mainframe data through SNA connections and LAN gateways.
MNDOT participates on a statewide GIS/LIS committee which employed a consultant to develop a statewide GIS plan. The final document is distributed through the State Planning Agency. MNDOT shares data with other state agencies and local governments. They cooperate closely with local government LIS efforts. For example, MNDOT has assisted in designing local control surveys and helped to prepare specifications for large-scale local mapping -- to the extent that MNDOT has enough confidence in local survey control and mapping to use them for its own planning and design purposes.
The relationship between large-scale endeavors, such as engineering design and data sharing with local government, and small-scale endeavors, such as
11
transportation planning and facilities management, needs to be more clearly defined by MNDOT within the context of their overall GIS-T strategy.
22.3. Wisconsin
WIDOT has adopted a data-driven approach to GIS-T implementation. Their effort can be traced to the early 1970s with development of a Highway Inventory System linked to digitized 7-112 min USGS quadrangle maps. The computing technology available at the time was overwhelmed by the task and the system became batch-oriented and difficult to use. Nearly 10 years later, an attempt to redesign the Highway Inventory System raised the issue of data integration. It was this effort that led to the recognition of location as a critical element in their data strategy.
In 1987, WIDOT began a pilot project using ESRI's ARC/INFO, which was installed at the University of Wisconsin-Madison. Since then, successful application development has led full-circle to redesign of the Highway Inventory System, based on the concept of location as integrator. Workstation-based systems have been installed throughout the department. GIS-T is viewed not only as an integral part of the agency's overall information systems strategy, but also as central to all engineering computing architectures.
WIDOrs strategy has three phases. The first was development of their GIS-T infrastructure, with successful initial applications installed and in production. The second phase (currently in progress) is institutional implementation, with creation of a permanent GIS Section, development of GIS-T database maintenance procedures, and redesign of the agency's corporate databases. WIDOrs permanently-staffed GIS Section provides application development, training, and support to a variety of users, including those in district offices. The third phase will include merger of the department's carto-graphic and geographic activities, strengthening of relationships with other agencies, and department-wide application development. WIDOT characterizes this approach as top-down design then bottom-up implementation.
Wisconsin's pilot application linked a GIS-T database with photolog images that had been converted to optical disk. That effort succesfully demonstrated the potential for using GIS-T to accomplish tasks, such as accident analysis, in new and very effective ways. Development of a rule-based Pavement Management Decision-Support System (PMDSS) began in 1988 and was funded in part by FHWA. In early 1990, WIDOT began installing PMDSS on UNIX workstations at the district level and it is now in production statewide. More than twenty PMDSS users have been trained and an additional 30 or more have been trained in ARC/INFO. California DOT is attempting to transfer the PMDSS application to their state.
Initial facilities management applications, developed for regional (districtwide) use, are based on a statewide 1:100,000 base map derived from USGS DLGs. This database contains 12,000 miles of state trunk highways, 19,600 reference point locations, minor civil division boundaries, and cartography for local roads and
hydrography. In order to build the full database for local-roads, WIDOT is currently participating in an interagency effort to refine Census Bureau TIGER files. They are also co-operating with the Wisconsin Department of Natural Resources to develop complete 1:100,000 databases of hydrography and the land net (Public Land Survey System). It is expected that with further application development, needs will arise for base maps at various scales. The agency is considering methods for linking their GIS-T and design operations so that, in the future, GIS-T base maps can be updated directly from design databases.
The Hill Farms Regional Computing Center provides mainframe computing for a number of agencies in Wisconsin, with WIDOT being the largest user. An AMDAHL 5890 and an IBM 3090, running under MVS/XA, support a number of database managers and file handlers including ORACLE, DB2, IMS, and VSAM. Cartography and some design operations are currently supported by Intergraph workstations and a VAX 7801785 running VMS and DMRS. GIS-T computing is done on 25 networked UNIX (APOLLO) workstations. ETHERNET and token-ring LANS (for PC5) are available. SNA gateways provide links to the mainframes. GIS-T access to mainframe databases is at the file level.
WIDOT has a lead role in statewide GIS activity, particularly in data sharing standards development. The agency has a legislated seat on Wisconsin's Land Information Board, and WIDOT's GIS Section Chief serves as an advisor to that board. The Board administers a program facilitating data sharing at the state and local level. The program includes regular reporting on the availability of data by state agencies and funding for development of compatible systems at the local level. A proposal to create a Wisconsin Geodetic Reference System Program will soon be considered by the Wisconsin Land Information Association. If that program is imple-mented, WIDOT is expected to have a major role.
2.3. Experts Panel
An experts panel was convened for extended discussions of objectives, methods, status, preliminary findings, and implications for future GIS research. From these discussions, 24 major points were identified. These points are grouped under headings and are presented below (in most cases the panel reached consensus; when there was disagreement, this is noted explicitly).
2.3.1. Definition and Role of GIS-T
Point 1. There is extensive confusion in the community concerning the nature of GIS. This causes a lot of problems, one of the main ones being that people fail to see the full potential of the technology. Another is that many DOTs think they are exploiting the technology when actually they have had experience with only a small part of it. There is a major need for conceptual clarification and precise, detailed delineation of desired, required, and available GIS functionality -- particularly, that needed for transportation applications (GIS-T).
Point 2 GIS-T as part of a DOrs general
12
information systems strategy has a critical role to play. Location is a potential integrative concept. The long-sought 'holy grail" of data integration may finally be practically realizable.
Point 3. What kind of technology is GIS? Like word processing and spreadsheets, is it something that users can learn and effectively apply without constant hand-holding and consulting support from experts? Or is it something more like statistical analysis or desktop publishing where the level of expertise required for effective use is so high that nonspecialists in the technology cannot use it effectively without expert help? There was disagreement on this among the panel. The questions suggest the need for much improved GIS-T software with emphasis on user friendliness.
Point 4. There was disagreement among the panel about the potential importance and role to be played (for example, in justifying the funding needed for base map development) of real-time GIS-T systems. Examples of such systems are drug traffic interdiction systems, emergency rerouting systems, and IVHSs.
Point 5. A distinction needs to be made between GIS-T as an integrator and GIS-T as a toolbox.
23.2. Data Collection and Presentation
Point 6. The vendors are central players and there are a number of them. (The panel helped to generate a short list of the central players, including contact persons at the vendor companies.)
Point 7. The inclusion of GIS aspects (i.e., spatial statistics) in general statistical packages such as SPSS and SAS would result in an important new product.
Point & Detailed case studies (both successes and failures) might be more useful than the general overview data that has been collected. However, general data collection (such as that which has been done) is necessary for identifying the really illuminating cases.
Point 9. A repertoire of GIS-T cases studies which have shown significant cost savings would be very useful for DOTs faced with the need to justify investments in GIS-T.
Point 10. There is a need to clearly distinguish between GIS-T pilot studies and implementations of robust, full-blown GIS-T production systems.
23.3. Data Environment
Point 11. There is no one correct scale for all GIS-T applications. At least four plausible levels of scale exist: project, corridor, regional (districtwide), and global (statewide). Clearly, several different base maps are needed. There is no way they should or can all be developed simultaneously. Therefore, decisions need to be made concerning which will be implemented first.
Point 12. There is a need for more compatibility among GIS-T software products and between GIS-T and other systems such as those for design and planning.
23.4. Implementation
Point 13. Agencywide GIS-T implementation efforts may be different from efforts directed by functional units, (e.g., planning.) In some of the latter cases, implementation may proceed quite independently of any MIS involvement.
Point 14. A distinction continues to arise between centralized, top-down GIS-T implementation strategy and piecemeal, bottom-up strategy. Clearly, there is a need to evaluate and contrast the pros and cons of the two approaches. There may be a kind of middle position - one where implementation is piecemeal and decentralized, but where the department as a whole promotes, supports, and implements coordination among applications.
Point 15. Another related and clearly useful distinction between implementation strategies is between data-driven and application-driven approaches.
Point 16. Yet another related distinction is between GIS-T implementation as a component of an overall DOT information systems strategy, and GIS-T implementation as independent of, and isolated from, other data processing activities in the agency.
23.5. Institutional and Management Issues
Point 17. An essential component of DOT success with introduction of GIS-T technology is the commitment of top-level management, both top-level data processing management and general management.
Point 18. Significant political and organizational problems surround data integration and making data a corporate resource. Who finances data collection and maintenance? Who owns the data? What does "ownership" mean and what responsibilities does it entail? How can its costs be recovered? Who decides what data get collected (or, for a more GIS.specific example, what base map resolution gets implemented first)?
Point 19. There was general agreement that no successful GIS-T implementation can occur in a DOT without an effective GIS-T champion. But at what stage, if any, is the champion no longer needed?
Point 20. The appropriate level of justification is sometimes difficult to anticipate. It is easy and dangerous to build up unrealizable expectations.
Point 21. One of the problems with decentralized implementation is that typically not enough available people understand and can effectively apply GIS-T. The development of adequate staff resources may take considerable time.
23.6. Research Context
Point 22 Another important distinction to be made is between needs-driven and technology-driven GIS-T implementation. Technology should be viewed as a means for fulfilling short-term and long-term agency needs and not as an end in itself.
13
Point 23. The GIS-T design and implementation plan must be presented within a near-term timeframe of the next 5 years. However, a more far-reaching view also needs to be developed to establish a foundation for maximizing long-term benefits.
Point 24. The project final report should provide a general framework for evaluating day-to-day decisions. Another project document, the Management Guide, should provide specifics, such as guidelines for the preparation of RFPs.
2.4. MPO Interviews
Tweleve Metropolitan Planning Organizations (MPOs) were contacted to assess the applications and range of current commitment to GIS and GIS-T.. These included: (1) Ada Planning Association (Ada County (Boise), Idaho), (2) Association of Bay Area Governments (San Francisco, California), (3) Atlanta Regional Commission (Atlanta, Georgia), (4) East-West Gateway Council (St. Louis, Missouri), (5) Johnson City Planning Department (Johnson City, Tennessee), (6) Indianapolis City Planning Department (Indianapolis, Indiana), (7) Maryland National Capital Park and Planning Commission (Montgomery County, Maryland), (8) North Central Texas COG (Dallas, Texas), (9) Puget Sound COG (Seattle, Washington), (10) San Diego As-sociation of Governments (San Diego, California), (11) Tn-County Regional Planning Commission (Lansing, Michigan), and (12) Twin Cities Area Metro Council (MinneapolisiSt.Paul, Minnesota).
Nearly all these agencies are looking at developing GIS capability, but not necessarily as the result of an agencywide commitment to GIS. Agencies that have the most active GIS efforts have developed land-use, population, and employment databases that are also useful for GIS-T. Most of these agencies have also made at least some partial links to their transportation modeling efforts.
The MPOs with limited or no GIS activities have been hampered by lack of funds and staff limitations. Transportation planning staffs in these MPOs are generally satisfied with their modeling capabilities and as a result are not actively supporting GIS activities.
At the regional level land-use data are most readily available from aerial photos. Tools are now available for direct digitizing of aerial orthophotographs from computer displays. The most advanced agencies are using satellite images at medium to high resolution to replace the aerial photo data for land-use classification and transportation base map updates. Both Landsat and SPOT images are being used.
Some regional or county level agencies have developed parcel-level databases as part of the overall local government database. Integration with basic local government functions is required to keep the parcel-level data current at a reasonable cost. The parcel-level data typically provide a wealth of information that can be useful for transportation planning applications. Lack of a regional land-use database is a primary barrier to
implementation of a GIS. Coordinated planning and funding among land-use, environment, and transportation offices and agencies is needed to provide adequate database development resources.
Some GIS software is beginning to incorporate limited transportation planning modeling capabilities such as shortest pathflnding. Similarly, transportation planning packages are enhancing their network editing, display, and zonal overlay capabilities. Links among the most common GIS software and transportation models now require specialized interfaces that are cumbersome and relatively inflexible. GIS software has been used as the primary transportation network editor in San Diego for several years. Transportation model outputs are also transferred to the GIS for analysis and display. Traffic count data are maintained in the GIS and annual flow maps are created with minimal effort. A similar approach is being developed in Dallas by the North Central Texas COG (NCTCOG). It has a large highway network with over 23,000 links and 13,900 nodes. GIS in a workstation environment is used to automate the coding and analysis of the transportation networks required for the travel forecasting process. The use of GIS macros has improved the efficiency and accuracy of transportation network coding. GIS overlay functions are used to assign zone numbers and city codes to networks. In addition to network editing, NCTCOG has used GIS for thematic mapping. The GIS has been used to display demographic activity and change, trip-end information, travel-time contours, and air quality emission inventory data.
The Maryland-National Capital Park and Planning Commission (M-NCPPC) has linked their transportation models and a GIS to provide detailed analysis of a multitude of spatial relationships such as the number of households within a specified walking distance of bus stops or rapid transit stops, the employment-to-housing balance within a specified distance of a given point, and the number of jobs within one quarter mile of a bus line. M-NCPPC is using GIS to develop a new traffic zone system that is more consistent with current activity patterns. Micro-scale land-use data are available from the tax assessor parcel file, but it is not accurate enough to be used directly for travel demand modeling. Parcel-level estimates of households and jobs are used for disaggregating zonal data to subzones. The subzones are needed for subarea master planning, assessment of new development proposals, and evaluation of transportation systems management strategies.
The Metropolitan Council of the Minneapolis-St. Paul region has recently moved from a PC to a workstation-based GIS. The Council has used the PC-based GIS since 1987. A regional highway base map is being developed at 1:24,000 scale. Digitized maps from the Minnesota DOT are being combined with attribute data from the post-Census TIGER file. GIS is being used for address matching for a large regional travel behavior inventory. This includes home interview, external station, transit, establishment, and employment address-based data in excess of 500,000 records. A land-use inventory, based on digitizing from air photos, is also underway which will provide input to travel demand
14
modeling activities for both the base year calibration and forecasts. Extensive use of choropleth and network displays are anticipated as the travel behavior and 1990 census data become available. Another GIS project is the new airport search study which utilizes raster data from Landsat and SPOT satellites. A multipurpose database that includes land-cover and selected land-uses has been developed and used to select three alternative sites for further evaluation.
Applications of GIS are not limited to major metropolitan areas. The Tn-County Regional Planning Commission (TCRPC) in Lansing, Michigan, is using GIS for analysis of the local bus system. Bus routes have been digitized and a GIS database of demographic, employment, land-use and ridership data is being built. GIS will be used for market area identification by route, accessibility and proximity analysis, and bus routing and circulation analysis. In addition to transportation applications of GIS, TCRPC is beginning development of a GIS-based land-use forecasting model and a GIS-based risk analysis model for hazardous materials transportation.
One of the major barriers to integration of GIS and transportation planning activities is the lack of detailed documentation of the methodologies used by the leading MPOs. Documentation of what works, under what conditions, and at what cost would help other MPOs begin to develop strategic plans and advance more rapidly along the learning curve. Funding constraints are another major barrier. Acquisition of GIS software and hardware and base map development are major expenses that can most easily be justified by multiple applications throughout a regional agency. Transportation networks are useful for many regional modeling efforts such as modeling of land use, water quality, air pollution, and hazardous waste transportation. Cooperative funding of GIS-based transportation networks and the associated databases may be needed to encourage transportation planners to adopt GIS technology.
3. SUMMARY OF FINDINGS
The findings of the survey, agency visits, experts panel, and MPO interviews make it clear that a GIS-T design and implementation plan must be flexible and adaptable to a broad spectrum of needs and conditions. There is both a technological context and an institutional context for design and implementation planning. The technological context is set by rapidity and multiplicity of change, not only in the information processing arena but also in data collection and communications. The insti-tutional context is set by organizational and management structures. One of the key elements to success is constructing and maintaining a fit between the technology and the institutions. The findings drawn from the research to date relative to the technological and institutional issues are discussed in the following sections.
3.1. The Technological Context This is an age of major and rapid technological
change. These changes will affect the use, scope, and method of transportation, as well as how DOTs and other organizations responsible for transportation infrastructure plan, design, construct, and manage that infrastructure. A summary of projected imminent technological changes was recently compiled by the science and technology writers of the New York Times from lists constructed by such groups as the Department of Defense, the Commerce Department, and the White House Office of Science and Technology. The items in the summary most relevant for DOT planning during the next decade include the following:
New computer architectures exploiting parallelism. Superconducting materials used for electric power
transmission and for computer circuits. Very high resolution, true-color electronic display
used in TV and in computer display screens (which probably will not continue to be two separate things).
Increase of the number of transistors on silicon chips from about a million to about a hundred million (enabling the placement of entire GISs on single, or a very small number of chips, thus bringing the cost of such systems down by orders of magnitude).
S. Fiberoptic gigabit networks interconnecting computers and computer databases, both local-area and wide-area networks.
6. Computer-aided software engineering (CASE) that utilizes low-cost computing power to support software development environments which, in turn, enable faster, cheaper, more rapidly developed, and more reliable computer applications.
Not on the New York Times list but of great significance for DOTs is the rapid improvement and lower cost of data storage techniques, both optical and magnetic. These will enable the cost-effective production and distribution of very large geographic databases, as well as the rapid improvement and lower cost of various geographic measurement and data collection technologies (e.g., GPS technology.)
Within the context of rapid technological change, it is important that DOT's closely follow two principles in developing plans and strategies for the implementation of GIS capabilities. They are:
1. Strategies for adoption and exploitation of information technology, in general as well as GIS technology specifically, must be needs driven rather than technology driven. New technology should be adopted and used because it meets specific, well-identified needs, not for its own sake and not because it is likely to serve some good, but ill-defined purpose. Needs-driven strategies require good knowledge and intelligent appraisal of technological developments and prospects. Only thus can intelligent decisions be made about timely adoption of new technologies, at the point they have become sufficiently cost-effective and reliable for certain needs; and only thus can prospective technologies be anticipated and prepared for, avoiding dead-end approaches that may meet certain short-term needs but that have to be abandoned when a prospective technology does become sufficiently cost-effective and reliable.
15
2. GIS technology has reached a state of maturity where it can effectively be exploited by DOTs for a myriad of purposes, of which, the role of data integrator may be the most important. Feasibility studies to demonstrate that the technology is useful and can meet needs cost-effectively are of limited value. If a particular DOT has not yet internally had such a demonstration, it can simply appeal to the experience of others. (There might, of course, be other reasons for starting with a small-scale, pilot project, e.g., to enable data processing staff and users to gain familiarity with the technology.) Having reached this stage in its life cycle carries an important consequence for GIS technology; however, a consequence often missed. In general, GIS technology should no longer be treated as a special case, to be implemented for isolated applications on isolated equipment not connected into the general DOT data processing environment. This means that the plans for GIS implementation and use should be a part of a DOrs general information technology plans.
As with any component of information technology, there will continue to arise, for GIS, cases where some immediate, urgent problem can, perhaps, best be handled in the short-term by bringing up a special, isolated, dedicated system. Compare, for example, isolated minicomputers and workstations that have been dedicated in many DOTs to support engineering modeling and design, and that have been installed and operated quite separately from the general DOT data processing environment. However, for reasons that should become abundantly clear, this is not the general approach most suitable for GIS applications.
3.1.1. GIS Technology
There are more than 70 products being sold as "GISs". They differ widely in function and capability. Thus, it is important, when one speaks about adoption and application of GIS technology, that it not be interpreted simply as referring to acquisition and use of any such product. It is important not to conclude that the benefits attributed to GIS technology are available from just any product with a "GIS" label, since the label is often attached only for marketing reasons. A precise characterization of GIS and of GIS-T technology is critical.
GIS technology must be perceived correctly for just what it is, if it is to be inserted correctly into an organization and maximally exploited. There are some useful historical analogies. Despite frequent claims to the contrary by vendors, GIS technology is not a simple "end-user technology," like word processing or spreadsheet technologies, that can be purchased as a software package, installed on a few workstations or PCs, introduced in a short orientation session, and then left to users to learn and use, at their own pace and in their own way. The effective use of GIS within an organization requires the construction and maintenance of databases, which is time consuming, costly and -- in the ideal -- an organization-wide activity. The costs of database con-
struction and maintenance should be spread across as many different applications throughout the organization as possible, redundancy and duplication should be avoided, and the investment in data acquisition and maintenance should have benefits over the long term that outlive and extend beyond particular applications, hardware platforms, and software packages.
Indeed, as some DOTs have now demonstrated, once the appropriate databases are available, their use for particular GIS applications can effectively be left to end-user initiative. Thus, we characterize the ideal GIS-T implementation strategy as first top down, then bottom up. The "top down" part is the part that has to.do with designing and implementing the required databases. The "bottom up" part is the part that has to do with end-user use of the databases to realize particular applications.
The best historical analogy is to fourth .geñeration language technology, a technology that makes possible application development by end users because it enables application development in terms of high-level, nonprocedural languages. The languages are much easier to learn and use than older, procedural languages like FORTRAN and COBOL, such that end users can use them directly rather than requiring the services of specialist programmers. The end user need only specify graphically what input and output user interfaces are to be used in an application, and the system automatically compiles the required procedural code.
Some GIS products are now being packaged to include certain widely useful databases, (e.g., Census Bureau TIGER data) and indeed, to the extent that applications need only the data made available in this way, the products can be correctly classified as "end-user products" ready for use by end users simply on installation. But the applications that need only such generic data are usually small and often trivial. They certainly do not include, for example, DOT applications that depend on complete, accurate, and up-to-date data about a state's highway network.
The contrast between the spatial knowledge representation used in GISs with that used in other spatially oriented data processing systems, in particular, computer-aided design (CAD) systems, image processing systems, robot control sytems, and cartographic pro-duction systems is important. A cartographic production system should not be confused with a GIS. It contains representations of the surface symbols that will be explicitly produced when a map is printed in hard copy or displayed on a screen. (Compare the representations used in a text "pagemaker.") A GIS contains deep knowledge, about spatial entities and relations. A true GIS system, may have a capability to translate from its deep data structures to surface-level map symbols and it may indeed have as a component a map-production module, but it will also have several other modules as well. In this context, it is interesting to note that CAD systems have been extended to enable their use as GISs. A widespread practice in DOTs and elsewhere has been the use of systems originally designed and acquired for CAD purposes as GIS platforms.
16
A GIS has several functionally separable modules, and a particular application will use some but not necessarily all of the modules. They include: (1) modules for data input and editing; (2) database managers for databases containing locational, geometric, and topological data about spatial entities (points, lines, and polygons), (3) database managers for databases containing spatially referenced descriptive information (examples are spatially referenced attribute data, spatially referenced image data, and spatially referenced abstract objects); (4) modules that combine data from these diverse databases, in particular, by means of "overlay" operations; (5) modules that perform aggregation and generalization operations on geographic data; (6) modules that perform analytic (e.g., allocation) operations on geographic data; (7) modules for map generation, for creating the cartographic symbolic structures needed for map printing and displaying; (8) modules for map printing; (9) modules for electronic map display, with user control of zooming, cropping, windowing, suppressing or adding details of different kinds (10) query and report generation modules, both map-oriented and nongraphic; and (11) application development utilities, e.g., macro languages. Many GIS products intertwine these modules in ways that do not allow their easy separation nor their independent use. Actual modularity is an essential aspect of GISs in a server-net environment. Logical separation of the modules constitutes a first step in an ideal framework, and their physical separation and assignment to different servers in a server-net architecture an eventual desideratum.
Characterizing GIS, as has been done so far, emphasizes its technical functions. An important development has been the recognition that, from another point of view, introduction of GIS capabilities into a data processing environment is important not only because of the new capabilities made available but also because the fundamental concept of location that underlies GIS base maps provides an efficient and practical means of integrating data of many other kinds. Benefits of data integration include cost reductions in data collection and maintenance, improved data reliability, and, most important, applications not otherwise possible.
The value of data integration for DOTs was persuasively presented in the 1987 NCHRP report "Integrated Highway Information Systems":
The collection of highway-related data involves a wide variety of activities: traffic counting, sign inventories, skid resistance measurements, photologging, accident investigation, recording of construction and maintenance projects and funding, right-of-way surveys, inventories of ... roadside obstacles, bridge inspection, rail-highway crossing inventories, speed monitoring, pavement condition surveys, geometric design inventories, and other data-collection and maintenance activities. In the past, these activities were often uncoordinated within highway organizations and across organizational boundaries. Collected data were typically stored in
paper files or in single-purpose computer files accessible only to a few people. Because of the lack of coordination, or of a narrow concept of data use and application, data collected for one purpose were rarely usable for others. If two users needed the same data, or very similar data, the data were often collected twice....
Highway agencies have been a fertile breeding ground for independent data-collection activities and the data files that result from them. It has often been easier for organizational units to independently develop the information systems they need to operate their programs, without coordinating their efforts with data-related activity in other organizational units. In some cases, this has been the most reasonable approach to take - duplication of effort has been more apparent than real. There is no question that coordination requires resources and often involves compromises with respect to data specification, editing, and maintenance. But as systems grow and the cost of data collection rises, independent data-collection and data-storage activities become expensive luxuries. Integrated systems permit broader use of collected data, which increases data value....
Integration generally makes it possible to study many relationships among two or more data elements. As an integrated system grows, the cost of providing the linkage is rapidly offset by the value of the increase in information that the system provides....
In practice, integration of data can be relatively complex. It is not always efficient or convenient, for example, for everyone to use the same location reference system when collecting data. It may be best for a traffic-counting team at an intersection to identify the intersecting highways by name, whereas a survey crew recording sight-distance restrictions might use mileage from the county line. This is not a problem if the systems that are used are compatible with each other or with a third system (italics added) so that location data can be translated from one system to another.
As a matter of fact, the 1987 report foresaw the centrality of location as an integrative concept, but at that time GIS technology had not progressed to the point where it was obvious that this technology offers the key to efficient and practical third systems for achieving location-based integration.
The criticism might arise that what is being proposed here is the use of a concept (location), not the use of a technology (GIS). Why not merely introduce the concept into the basic schemas used for database definitions? Introducing a new schema definition is hardly introducing a new technology. The criticism is not valid because it misses an essential aspect of using location as a data integrator. The concept of location is basic and idiosyncratic; at least when used as an integrator it is not just another attribute. Its representation, the algorithms
17
required for its efficient processing, and the facilities needed for location data acquisition constitute the core of a GIS. Thus, introduction of the concept requires use of at least some of the essential capabilities of GISs. Once these core capabilities are available, it is natural to think of using some of the additional capabilities as well, when they can be put to good use.
Using GIS technology in this integrative role changes radically the strategy most appropriate for its introduction and use in a DOT. In particular, it becomes something more than just one more thing to do with computers. It becomes a central, indispensable component of the organization's overall information technology strategy.
3.1.2 GIS-T Technology
GIS technology originated mainly in the areas of environmental resource use and land record information processing, but it has now been extended for use in transportation modeling, planning, reporting, and decision-making. Also, most of the major transportation planning and modeling packages have enhanced their network editing and display capabilities, and are adding geographic display capabilities. Indeed, somenow appear to have been extended to the point where they are full-fledged GIS packages, well-suited for transportation applications but also usable for a large number of nontransportation GIS applications.
The following question needs to be raised when GIS products are evaluated for transportation applications: Is the adaptation and extension of systems originally designed for other purposes -- CAD systems on the one hand, and GISs for nontransportation applications, on the other -- the optimum way to achieve a good GIS-T? Would not design from the ground up of a transportation-oriented GIS result in more suitable data structures and algorithms, and hence result in a system more natural for transportation specialists and more efficient for transportation applications? The answer may well be "yes,' given the special requirements of GIS-T. Special data structures and topological relationships are clearly required for transportation, both for effective network representation and for efficient transportation algorithm processing. They can be defined on top of more general structures and relationships but, as always, there is a trade-off between generality and efficiency.
There are several capabilities required for GIS applications to transportation that go beyond those developed for applications in other areas. In the ideal --at some cost in efficiency -- these should be realizable by acquiring modules that provide them and that can be used in association with other modules that provide core GIS capabilities. In a server net the different modules might well be supported by different servers. The current state of technology is such, however, that products providing the capabilities are unlikely to be so neatly decomposable into modules. In some cases, the pioneer DOTs that have made these capabilities available to themselves have done so by extending commercially available products with internal development efforts.
The required capabilities include: ability to handle linear location referencing methods, origin plus offset along a line (not necessarily straight); dynamic segmentation; path construction and path naming; network construction; special kinds of transportation "objects" like overpàsses and merges; network overlay; network analysis;' ability to support various transportation modeling techniques (e.g., assignment modeling, including convenient data input, "what if' hypothetical data changes, and perspicuous display of model output) time slicing; and ability to transform data structures into forms required for efficient transportation algorithm processing (but with links back to the original data structures, as required for explanation and display of the results).
3.1.3. Technology Issues and Implementation Strategies
The planning and implementation of any information system, not only GIS, must recognize and address the impacts of the technology. In the technological context, the major issues are the rapidity of change, the complexity of systems, the costs of hardware and software, the difficulties of transitions (particularly relative to existing databases), and the need to train/retrain staff. The following paragraphs discuss these issues in detail and offer strategies to address them in the implementation process.
Although one need not say more about the rapidity of technology change, it is worth noting how different the workstation-dominated, open-system, distributed computing environments of the near future are from the mainframe-dominated, star-network environments of the near past. The difference between near past and near future is about 5 years. And it is the latter for which planning must be done. Also bear in mind how rapidly GIS technology has emerged and matured to the point where it is eminently usable. With respect to this technology alone, it will be extremely difficult to plan within the next 5 years if the technology continues to change as rapidly as it has in the last 5 -- as it likely will.
The problem is one of hitting a rapidly, irregularly moving target. More specifically, the needs are: (1) good timing (avoidance of premature technology adoption versus obtaining the benefits of a new technology as soon as possible); (2) avoidance of investments in something that will be out of date before fully amortized; and (3) investing in something that will not have to be replaced, but that evolves naturally into later developments.
Technology trends can be identified, and the situation is not hopeless. But successful tracking of the moving target does require study and investment in technology projection expertise -- as essential components of information technology planning. It requires resisting hyperbole, fads, and vendor selling pressures. A major problem concerns the fact that far too many organiza-tions, including DOTs, use marketers (or other kinds of vendor representatives with a vested interest) as their major source of information for technology tracking. This is both biased and too short-term.
There are a number of aspects of the proposed ideal
18
framework for GIS technology adoption that specifically address these issues: Two of the dominating costs in GIS implementation, data acquisition and staff training, should be planned to carry over many applications and over many stages of hardware and software investment. Each should have a usefulness far beyond the hardware and software (the particular generation of GIS technology) used for particular applications. Further, once an appropriate network is established, new and old technologies (including different generations of GIS technology) can co-exist within a common network environment, with older technologies being fully amortized before they are retired, but with newer approaches being incrementally introduced as opportunities and needs arise and as the approaches can be justified in terms of their costs and benefits.
DOTs need to plan for and combine the simultaneous implementation of several promising technological developments. GIS is not the only emerging technology to be incorporated in an information technology plan. There are a number of others, all of which must be coherently integrated. Those other technologies cannot be held still while GIS technology is inserted. Treating the different emerging technologies in isolation (i.e., developing a separate plan for each) is to miss the interdependencies and to fail to take advantage of the ways in which they complement each other. There will be significant benefits that accrue from merging them into a single, coherent plan. More will be gained from each -- and from the whole.
Several of the technologies on the following list have been around for some time. They constitute new technologies in that they will be reaching practicality and affordability within the next 5 years, and in every case will be extended beyond the first steps, pilot implementations, and isolated pockets of the recent past -- to become ubiquitously applied, generally accepted state of the art:
Networking (fiber optics, "data highways," ISDN, data compression).
Low-cost, powerful computing engines, from parallel-processing supercomputers to $1000 1000-MIPS personal computers before the year 2000.
Distributed and cooperative computing based on decomposition of computing tasks, and assignment of subtasks to separate but interconnected computing engines. Appropriate decompositions are determined in terms of separable functions, different mixes of these functions being needed for different applications, and the efficiency and possible standardization of communication among the functions.
Client-server network architectures. The essential idea here is division of labor among network nodes. Each node is specialized to provide a particular computing service to other nodes on a network. Each node func-tions as both a server to, and a client of, other nodes on the network. For present purposes it is important to note that such an architecture begins as a logical rather than a physical structuring, with different "services" corresponding to the functions of different logical modules of a comput-
ing system (e.g., a GIS), even though the different modules are not necessarily located on different physical computing platforms. This distinction between logical and physical is important for two reasons: (1) division of labor for client-server structuring does not require an exact fit between network node capacities and the volumes of computing that will be required for particular services, and (2) it is possible to implement client-server structuring on older computing machines, in particular, mainframes and minicomputers, thus enabling their full amortization, by delegating to them several services (in the case of mainframes, perhaps a large number).
Computer-based graphics (high resolution, true-color, dynamic, three-dimensional) and realistic, interactive visualization.
Geographic information systems. Many planners might omit this from the list because they would consider GIS technology an application rather than a new core technology. Given the potential role of the location concept as the basis of data integration, GIS technology is not just an application but is a central part of the technology infrastructure.
Computer-aided design -- for many different kinds of design, from design of highway intersections to design of buildings to designof VLSI circuits. Of particular importance for purposes of this study is computer-aided design of software systems, an area that has come to be referred to as computer-aided software engineering (CASE). Essential aspects of CASE technology are rapid prototyping and incremental prototyping capabilities.
New database system capabilities (these include object-oriented structuring, storing and managing text, storing and managing images, graphical querying, optical (laser-disk) storage, and laser-disk database publishing).
Throughout the history of data processing one can observe a natural tendency toward bottom-up implementations, with different applications assuming responsibility for collecting and maintaining the data they require, and with resulting wasteful data redundancy and duplication across the organization. The problem has been widely recognized and numerous attempts have been made to solve it, but without widespread success. DOTs have been no different.
The data integration problem is especially important for GIS technology adoption because the costs of geographic data acquisition and maintenance are high and, thus, need to be shared across applications, and because GIS data provide the potential of integrating many other kinds of data. Data that can be shared across applications need to be considered as a corporate resource, rather than as being "owned" by particular applications. This is not a property unique to geographic data, but it is especially apropos for GIS base map data because of their cost, because of their centrality to inte- gration of data of many other kinds (within the organiza- tion), and because they are potentially useful for so many different applications. Special problems are raised by the fact that their usefulness is not limited to DOT applica-tions. DOTs report frequent external requests for their
19
GIS base map data, not only from other state agencies but from other units of government and from private corporations.
Despite its general recognition as an important problem, data integration remains an elusive, largely unsolved problem in DOTs -- and elsewhere. An apparent solution is to turn data collection and mainte-nance over to a centralized MIS department, but such a top-down approach carries with it political and organizational problems. Successful introduction of information technology into an organization, GIS technology as well as other kinds, is likely to be stifled by excessive centralization. It benefits from the empower-ment of decentralized initiative. People at lower levels of organization, close to the real problems for which the technology is being proposed as a solution, are the ones best able to evaluate and justify it, to work Out precise requirement specifications, to plan the most cost-effective levels and locations of use, and to assure that effective use is actually made of the technology once it has been made available.
Thus, there clearly needs to be a compromise between a pure MIS-directed, centralized, top-down approach and a bottom-up, decentralized, application-by-application approach with applications largely unrelated and uncoordinated with each other. In the ideal framework, one is reaching for a "golden-mean' for effective GIS implementation: first top down, then bottom up.
3.2 The Institutional Context
3.21. Funding Issues
Computer system costs involve hardware and software acquisition, staff and user training, base map development, and data maintenance. The latter two dominate.
Different applications require different GIS base map data scales. No one scale can support all necessary and feasible DOT applications: project management may require something like 1:120; corridor evaluation and selection, 1:24,000; regional (districtwide) transportation planning and inventory may require something like 1:100,000; more global (statewide) uses (economic planning and high-level routing) may require even smaller scales. A complete statewide GIS base map for any one of these scales represents a major investment. The expense is such that its use should in no sense be limited only to transportation, which raises the difficult but vitally necessary problem of statewide planning across different agencies and of coordinating GIS implementation with other agencies, in particular, those responsible for natural resource management, environmental protection, and economic development. Further, coordination and data sharing with counties, municipalities, and utilities are necessary and desirable.
Initial applications typically are required to shoulder the lion's share of development costs, including data acquisition. Later applications are required to bear only
marginal costs. One problem is that this approach makes the costs of the initial applications appear prohibitively high. Another is that data collection and maintenance are unlikely to be designed and organized in a way to easily support later, different applications. An argument can be made that construction of GIS base maps should to be funded directly and undertaken top-down by a centralized MIS organization, as part of building up a data infrastructure of wide usefulness across the entire organization but, as indicated above, there can be political and organizational problems with this approach. At the very least, data collection must be coupled with some initial applications that manifest reasonably quick, visible payback and that can be used for convincing high-level management and the public to see the construction of the data infrastructure through to_completion. An example, although unexpected, applicati was Arizona's right-of-way litigation support system. It is important to distinguish between those application implementations that have been primarily pilot projects or technology feasibility tests, as opposed to those that have been implementation of production systems.
Other emerging technologies may promote the implementation of GIS. For example, intelligent vehicle/highway systems (IVHSs) will almost certainly play a major role in the future of automobile transportation --and thus in the future of DOT responsibilities -- because of their potential for significantly increasing (1) traffic-carrying capacity of the currently available road system (without requiring new land acquisition), (2) safety, and (3) ease and convenience of road use. For present purposes, this means that a major, if not dominating, reason for building GIS base maps will be that they are required by IVHSs. This needs to be factored into current GIS planning by DOTs, even though widespread use of IVHSs may be several years off.
There are a number of considerations here that will affect GIS planning by DOTs. Federal programs supporting IVHS developments will be critical, but so will be product developments by the automobile industry. In particular, in-vehicle navigation systems being proposed and already marketed (in limited form) in some automobiles, systems that compute position from GPS positioning, dead reckoning, and map matching, may become widely popular in a very few years. They do not depend on the construction of major, additional government-provided infrastructure, although the laser-disk-based, on-board maps they use will require the development of a large amount of digitized map information. Commercial concerns will likely be heavily involved in this development, as will DOTs through their traditional map production units. There is need to coordinate development of these digitized navigation GIS base maps with other GIS applications, so that DOTs can take advantage of the commercial interests and funding that will be available, and influence data acquisition to support other applications. Increasing the usability of these in-vehicle navigation systems with publicly provided, dynamic information, (e.g., about weather conditions, traffic incidents and resulting congestion, and
20
alternative-route evaluations) will of course be a follow-on development and will involve public-sector transportation organizations like DOTs even more centrally.
3.22 Justifying GIS-T
In justifying GIS-T to management, legislators, and taxpayers, each of the following is important:
Winning initial commitment of budget resources. The preparation, by a national group, of videotapes and documentation that present the general justification is recommended. There is no need for each DOT to develop its own. Included in the documentation -- and perhaps the videotapes -- should be in-depth case studies of GIS projects that have paid off for DOTs, with each case presented in sufficient depth that DOT managers and planners can draw careful and reliable analogies to their own particular circumstances. The case studies should provide useful demonstration materials, and might well be accompanied in some cases by portable demonstration software.
Maintaining commitment -- in the face of budget crunches, shifting priorities, urgent problems that compete for resources, and rotating managements -- by demonstrating short-term and continuing, payoff. Fortunately, this is not especially difficult for GIS, if the need for continuing, visible payoff has been incorporated in the GIS development plan from the beginning. As has been observed: "GIS technology demonstrates well to generals." It is easy for them to see its value in improving the quality of their planning and decisions. There are dangers if too much time and too many resources are being invested in GIS base map data collection before useful applications become available. This is why a pure top-down strategy for GIS implementation appears unwise. A balance must be struck in investment of resources between building the data infrastructure and relatively quick realization of useful applications.
Obviously, it is important to gain and maintain commitment without building up undue expectations. The history of data processing is replete with the bones of projects that lost continuing support because they were not able to satisfy the unrealistic expectations that had been built up for them when they were initially justified.
3.23. Staff Aqussition, Training and Retention
Consulting firms are being used by some DOTs (and/or at the statewide level) for GIS plan development. Dependence on outside expertise cannot be continued beyond initial planning and justification, and a workable plan must include time and resource allocation for the generation of internal staff capability. It is important that DOT planners and implementers realize the special nature of the GIS staffing problem. Merely turning evaluation and adoption of the new technology over to traditional data processing staff, on the belief that this is just one more technology included in that staff's repertoire, will not work. The knowledge and expertise required (as, for example, concerning the potential use of
location as a data integrator) is not a part of traditional data processing experience and training. Significant additional training is required, for example, in the areas of geographic reasoning and of cartographic design. In fact, traditional data processing experience can sometimes be an obstacle rather than an asset.
The existence of GIS champions in those organizations that have so far successfully exploited the technology has been almost universal. As a matter of fact, this is not unusual for new information technologies (e.g., expert system technology), but it does raise some special management problems. Managers must create the conditions for potential champions to emerge, must be able to recognize them when they do, and then must support them. Often they emerge from application areas rather than from centralized data processing staff. The fact that such champions often emerge from application areas constitutes yet another reason to be wary of excessive centralization and delegation to MIS departments of all responsibility for GIS planning and implementation.
3.24. The Technology-Organization Fit Problem
A misfit of an information technology and organizational structure is inefficient and sometimes damaging -- for example, serving decentralized organi-zations with centralized, mainframe-based data processing operations. Computing technology is an influential organizational change agent. It is important that it be recognized as such in plans for its introduction into, and expanded use within, an organization.
A major effect of current information technology developments is that economy-of-scale arguments no longer dominate in determining whether data processing operations should be centralized. As far as the tech-nology per se is concerned, data processing style can be made to fit, not to dictate, desired organizational style. However, the need for sharing data across applications and departments and for considering data as a corporate resource (considerations especially important for GIS base map data), the need for setting and maintaining data processing standards across an entire organization, and the need for establishing and maintaining a modern networking infrastructure all continue to tend in the direction of some degree of centralization and some degree of top-down planning. The arguments apply not only to DOTs but across state agencies at a level above DOTs, and they are the basis of several recently developed statewide computing plans swinging back toward centralization at a statewide level.
3.25. The Larger Organizational Context
DOTs and DNRs (state natural resource manage-ment and environmental protection agencies) must play a pioneering role in statewide GIS development efforts, as they have in several states -- not only because GISs and geographic data collection are so important to their primary responsibilities, but also because they are such
21
large land owners. Coordination activities must be an integral part of state DOT GIS strategies, whether or not it is externally imposel. Principal actors besides DOTs in coordination efforts include (1) other state agencies; (2) private corporations (especially utilities); (3) federal agencies (FHWA, NGS, DOD, EPA, USGS, BLM, and USDA); and (4) regional, county, and municipal agencies.
The open-systems movement within computing is of special importance. Its goal is to achieve standardization of operating systems, networking protocols, user interfaces, and program-to-program communication conventions so that software modules and databases can be implemented in client-server network environments. Different network nodes are each to provide some kind of specialized computational or data-providing service. A given program running at one of these nodes is to be able to communicate efficiently with other nodes of the network, nodes providing services to the program or, as its clients in turn, obtaining services from it. The various programs are possibly to be coded in different programming languages, and the different network nodes are possibly to be realized on different kinds of hardware. And the various large software systems (e.g., GISs) that in the past have been available only as all-or-none "black boxes" are to be decomposed into different functions available from different servers.
4. CONCLUSIONS
From the survey and data collection effort it can be concluded that there is consistency in some areas and diversity in others. Support and involvement of top-level management is universally viewed as critical for the long-term' viability of GIS-T. Also, nearly all state DOTs with enough experience have confronted the problem of linking GIS-T to large corporate databases. Fundamental differences arise in the understanding of what constitutes GIS-T and in the perception of the role of GIS-T within the organization. The technology and institutional con-
texts for GIS planning and implementation by DOTs have been characterized based on the results of the survey and data collection effort.
Principal aspects of the technological context for GIS adoption and application by DOTs are: (1) The moving target problem--GIS technology and, more generally, the information technology of which it is a part are changing rapidly, making planning for them very difficult. (2) Multiple technology problem--There are several new and imminent information technologies, including GIS, for which plans must be developed in concert. For example, a GIS technology adoption plan cannot and should not be developed independently of a networking technology plan. (3) The data integration problem--Data integration across different application areas is an urgent, longstanding need of DOTs. GIS technology plays a dual role with respect to this problem: it both exacerbates the problem and offers a solution. Because of the cost of their acquisition and maintenance, GIS data must be shared and inte-grated across as many applications as possible. On the other hand, the concept, of location, for which GIS technology provides an efficient means of representing and processing, can serve as an integrative concept across a wide variety of data, both geographic and of other kinds.
Principal aspects of the institutional context for GIS adoption and application by DOTs include issues of determining the most critical applications that must carry the brunt of initial GIS base map data acquisition costs; sharing costs across applications; gaining and retaining support of high-level management and of the public; coordinating with other state agencies and with external organizations; and utilizing standard developments.
The findings of the first phase efforts are being used as the basis for continuing efforts under NCHRP Project 20-27. These efforts are expected to lead to the development of a generalized design concept for GIS-T and guidelines for DOT management to implement them. Project efforts are expected to be completed in early 1992 with the expectation that 'a final report will be ready by mid-1992.
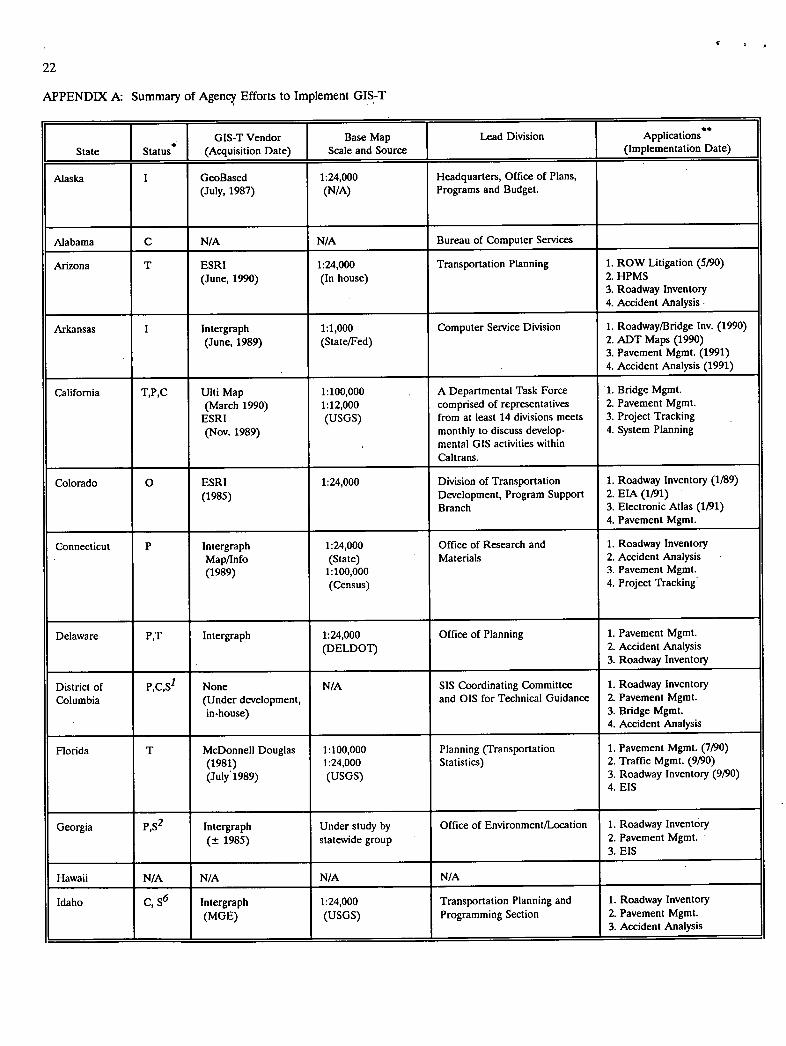
22
APPENDIX A. Summary of Agency Efforts to Implement GIS-T
GIS-T Vendor Base Map Lead Division Applications
State *
Status (Acquisition Date) Scale and Source (Implementation Date)
Alaska I GeoBased 1:24,000 Headquarters, Office of Plans, (July, 1987) (N/A) Programs and Budget.
Alabama C N/A N/A Bureau of Computer Services
Arizona T ESRI 1:24,000 Transportation Planning ROW Litigation (5i90)
(June, 1990) (In house) HPMS Roadway Inventory Accident Analysis.
Arkansas I Intergraph 1:1,000 Computer Service Division Roadway/Bridge mv. (1990)
(June, 1989) (State/Fed) ADT Maps (1990) Pavement Mgmt. (1991) Accident Analysis (1991)
California T,P,C Ulti Map 1:100,000 . A Departmental Task Force Bridge Mgmt. (March 1990) 1:12,000 comprised of representatives Pavement Mgmt.
ESRI (USGS) from at least 14 divisions meets Project Tracking (Nov. 1989) monthly to discuss develop- System Planning
mental GIS activities within Caltrans.
Colorado 0 ESRI 1:24,000 Division of Transportation Roadway Inventory (1/89)
(1985) Development, Program Support ETA (1/91) Branch Electronic Atlas (1191)
Pavement Mgmt.
Connecticut P Intergraph 1:24,000 Office of Research and Roadway Inventory
Map/Info (State) Materials Accident Analysis (1989) 1:100,000 Pavement Mgmt.
(Census) Project Tracking
Delaware P,T Intergraph 1:24,000 Office of Planning Pavement Mgmt. (DELDOT) Accident Analysis
Roadway Inventory
District of P,C,S1 None N/A SIS Coordinating Committee Roadway Inventory
Columbia (Under development, and OIS for Technical Guidance Pavement Mgmt. in-house) Bridge Mgmt.
Accident Analysis
Florida T McDonnell Douglas 1:100,000 Planning (Transportation Pavement Mgmt. (7/90)
(1981) 1:24,000 Statistics) Traffic Mgmt. (9/90)
(July1989) (USGS) Roadway Inventory (9190) EIS
Georgia P,S2 Intergraph Under study by Office of Environment/Location Roadway Inventory
(± 1985) statewide group Pavement Mgmt. EIS
Hawaii N/A N/A N/A N/A
Idaho C, 6 Intergraph 1:24,000 Transportation Planning and Roadway Inventory
(MOE) (USGS) Programming Section Pavement Mgmt. Accident Analysis
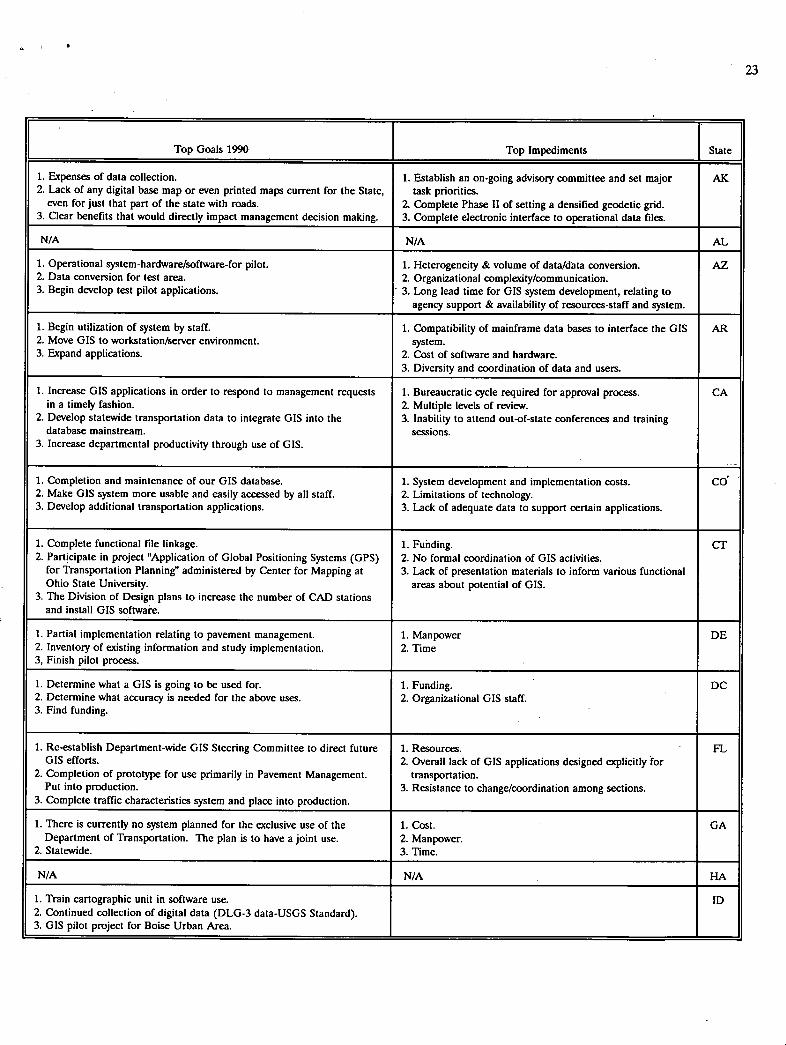
Top Goals 1990 Top Impediments State
1. Expenses of data collection. 1. Establish an on-going advisoiy committee and set major AK 2. Lack of any digital base map or even printed maps current for the State, task priorities.
even for just that part of the state with roads. Complete Phase H of setting a densified geodetic grid. Clear benefits that would directly impact management decision making. 3. Complete electronic interface to operational data files.
N/A N/A AL
1. Operational system-hardware/software-for pilot. 1. Heterogeneity & volume of data/data conversion. AZ 2. Data conversion for test area. Organizational complexity/communication.
Begin develop test pilot applications. 3. Long lead time for GIS system development, relating to agency support & availability of resources-staff and system.
1. Begin utilization of system by staff. 1. Compatibility of mainframe data bases to interface the GIS AR 2. Move GIS to workstation/server environment, system. 3. Expand applications. Cost of software and hardware.
Diversity and coordination of data and users.
1. Increase GIS applications in order to respond to management requests Bureaucratic cycle required for approval process. CA in a timely fashion. Multiple levels of review.
2. Develop statewide transportation data to integrate GIS into the 3. Inability to attend out-of-state conferences and training database mainstream, sessions.
3. Increase departmental productivity through use of GIS.
1. Completion and maintenance of our GIS database. 1. System development and implementation costs. CO 2. Make GIS system more usable and easily accessed by all staff. Limitations of technology.
Develop additional transportation applications. 3. Lack of adequate data to support certain applications.
1. Complete functional file linkage. 1. Funding. CT 2. Participate in project "Application of Global Positioning Systems (GPS) No formal coordination of GIS activities.
for Transportation Planning" administered by Center for Mapping at Lack of presentation materials to inform various functional Ohio State University. areas about potential of GIS.
3. The Division of Design plans to increase the number of CAD stations and install GIS software.
1. Partial implementation relating to pavement management. 1. Manpower DE 2. Inventoiy of existing information and study implementation. 2. Time 3, Finish pilot process.
1. Determine what a GIS is going to be used for. 1. Funding. DC 2. Determine what accuracy is needed for the above uses. Organizational GIS staff.
Find funding.
1. Re-establish Department-wide GIS Steering Committee to direct future Resources. FL GIS efforts. Overall lack of GIS applications designed explicitly for
2. Completion of prototype for use primarily in Pavement Management. transportation. Put into production. 3. Resistance to change/coordination among sections.
3. Complete traffic characteristics system and place into production.
1. There is currently no system planned for the exclusive use of the Cost. GA Department of Transportation. The plan is to have a joint use. Manpower.
2. Statewide. 3. Time.
N/A N/A HA
Train cartographic unit in software use. ID Continued collection of digital data (DLG-3 data-USGS Standard). GIS pilot project for Boise Urban Area.
23
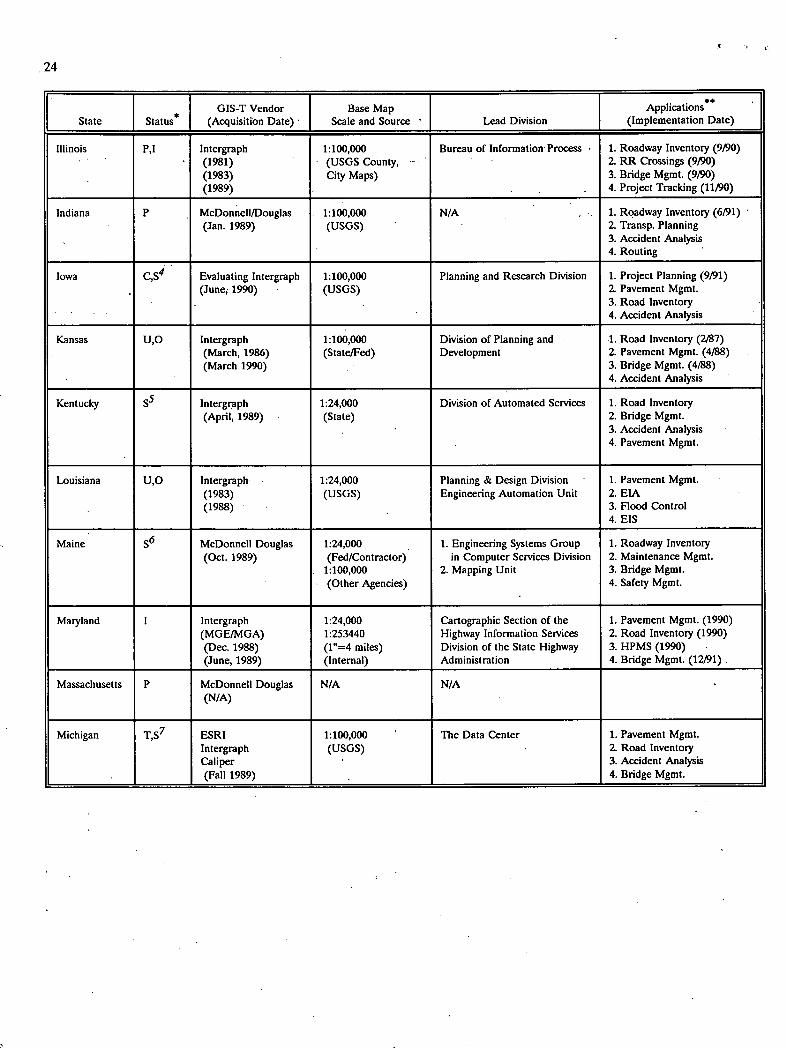
24
GIS-T Vendor Base Map Applications**
State *
Status (Acquisition Date)• Scale and Source Lead Division (Implementation Date)
Illinois P,I Intergraph 1:100,000 Bureau of Information Process . Roadway Inventory (9i90) (1981) (USGS County, RR Crossings (9190) (1983) City Maps) Bridge Mgmt. (9/90) (1989) Project Tracking (11/90)
Indiana P McDonnell/Douglas 1:100,000 N/A Roadway Inventory (6/91) (Jan. 1989) (USGS) Transp. Planning
Accident Analysis Routing
Iowa C,S4 Evaluating Intergraph 1:100,000 Planning and Research Division Project Planning (9/91) (June, 1990) (USGS) Pavement Mgmt.
Road Inventory Accident Analysis
Kansas U,O Intergraph 1:100,000 Division of Planning and .1. Road Inventory (2/87) (March, 1986) (State/Fed) Development Pavement Mgmt. (4/88) (March 1990) Bridge Mgmt. (4/88)
Accident Analysis
Kentucky 55 Intergraph 1:24,000 Division of Automated Services Road Inventory (April, 1989) (State) Bridge Mgmt.
Accident Analysis Pavement Mgmt.
Louisiana U,O Intergraph 1:24,000 Planning & Design Division Pavement Mgmt. (1983) (USGS) Engineering Automation Unit EIA (1988) Flood Control
EIS
Maine S6 McDonnell Douglas 1:24,000 1. Engineering Systems Group Roadway Inventory (Oct. 1989) (Fed/Contractor) in Computer Services Division Maintenance Mgmt.
1:100,000 2. Mapping Unit 3. Bridge Mgmt. (Other Agencies) 4. Safety Mgmt.
Maryland I Intergraph 1:24,000 Cartographic Section of the Pavement Mgmt. (1990) (MGE/MGA) 1:253440 Highway Information Services Road Inventory (1990) (Dec. 1988) (1=4 miles) Division of the State Highway HPMS (1990) (June, 1989) (Internal) Administration Bridge Mgmt. (12/91)
Massachusetts P McDonnell Douglas N/A N/A (N/A)
Michigan T,S7 ESRI 1:100,000 The Data Center Pavement Mgmt. Intergraph (USGS) Road Inventory Caliper Accident Analysis (Fall 1989) Bridge Mgmt.
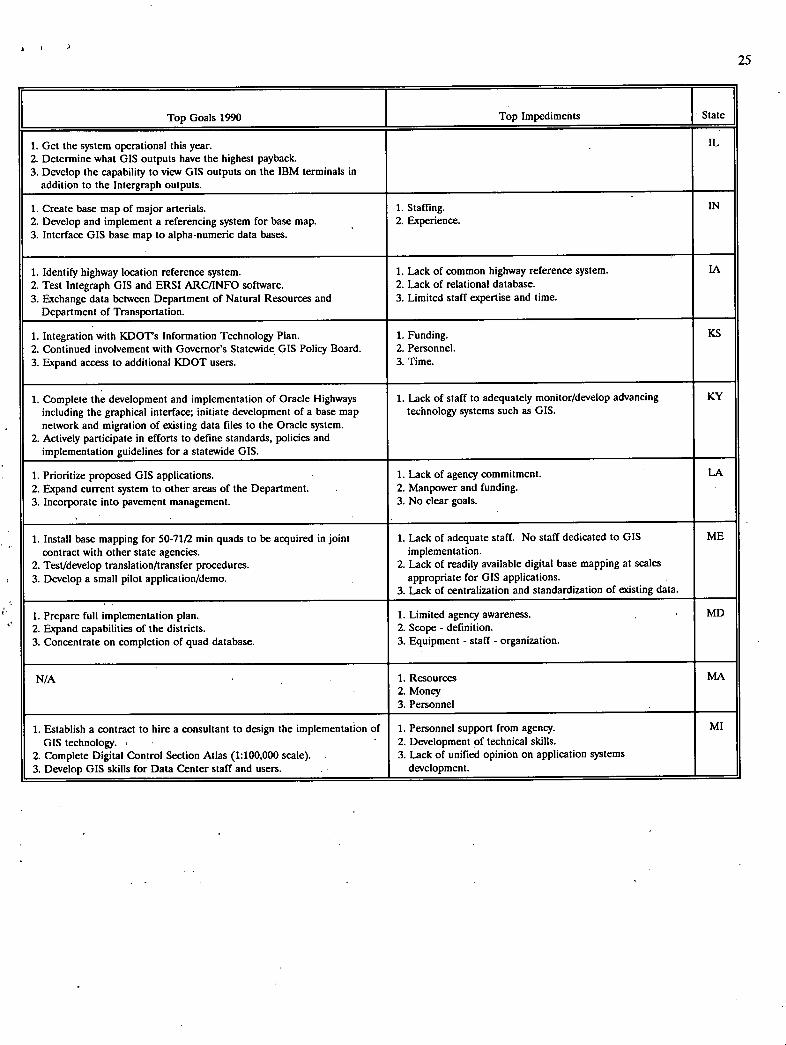
25
Top Goals 1990 Top Impediments State
Get the system operational this year. - IL
Determine what GIS outputs have the highest payback. Develop the capability to view GIS outputs on the IBM terminals in addition to the Intergraph outputs.
1. Create base map of major arterials. 1. Staffing. IN 2. Develop and implement a referencing system for base map. Experience.
Interface GIS base map to alpha-numeric data bases.
1. Identify highway location reference system. 1. Lack of common highway reference system. LA
2. Test Integraph GIS and ERSI ARC/INFO software. Lack of relational database. Exchange data between Department of Natural Resources and 3. Limited staff expertise and time. Department of Transportation.
1. Integration with KDOT's Information Technology Plan. 1. Funding. KS 2. Continued involvement with Governor's Statewide GIS Policy Board. Personnel.
Expand access to additional KDOT users. 3. Time.
Complete the development and implementation of Oracle Highways 1. Lack of staff to adequately monitor/develop advancing KY including the graphical interface; initiate development of a base map technology systems such as GIS. network and migration of existing data files to the Oracle system. Actively participate in efforts to define standards, policies and implementation guidelines for a statewide GIS.
1. Prioritize proposed GIS applications. 1. Lack of agency commitment. LA
2. Expand current system to other areas of the Department. Manpower and funding. Incorporate into pavement management. 3. No clear goals.
1. Install base mapping for 50-71/2 min quads to be acquired in joint 1. Lack of adequate staff. No staff dedicated to GIS ME contract with other state agencies. implementation.
2. Test/develop translation/transfer procedures. Lack of readily available digital base mapping at scales Develop a small pilot application/demo. appropriate for GIS applications.
3. Lack of centralization and standardization of existing data.
1. Prepare full implementation plan. 1. Limited agency awareness. MD 2. Expand capabilities of the districts. Scope - definition.
Concentrate on completion of quad database. 3. Equipment - staff - organization.
N/A Resources MA Money Personnel
1. Establish a contract to hire a consultant to design the implementation of Personnel support from agency. MI
GIS technology. f Development of technical skills. 2. Complete Digital Control Section Atlas (1:100,000 scale). 3. Lack of unified opinion on application systems 3. Develop GIS skills for Data Center staff and users. development.
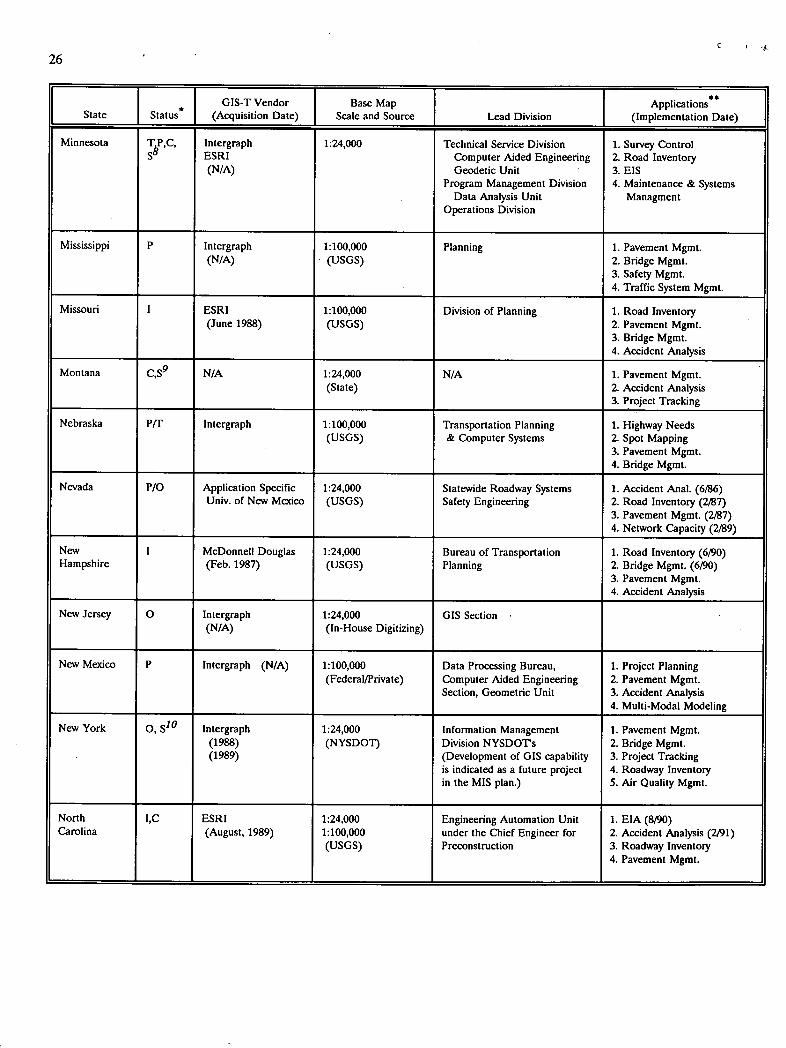
26
* GIS-T Vendor Base Map Applications** State Status (Acquisition Date) Scale and Source Lead Division (Implementation Date)
Minnesota T,P,C, Intergraph 1:24,000 Technical Service Division Survey Control S° ESRI Computer Aided Engineering Road Inventory
(N/A) Geodetic Unit EIS Program Management Division Maintenance & Systems
Data Analysis Unit Managment Operations Division
Mississippi P Intergraph 1:100,000 Planning Pavement Mgmt. (N/A) (USGS) Bridge Mgmt.
Safety Mgmt. Traffic System Mgmt.
Missouri I ESRI 1:100,000 Division of Planning Road Inventory (June 1988) (USGS) Pavement Mgmt.
Bridge Mgmt. Accident Analysis
Montana C,S9 N/A 1:24,000 N/A Pavement Mgmt. (State) Accident Analysis
Project Tracking
Nebraska P/T Intergraph 1:100,000 Transportation Planning Highway Needs (USGS) & Computer Systems Spot Mapping
Pavement Mgmt. Bridge Mgmt.
Nevada P/O Application Specific 1:24,000 Statewide Roadway Systems Accident Anal. (6/86) Univ. of New Mexico (USGS) Safety Engineering Road Inventory (2/87)
Pavement Mgmt. (2/87) Network Capacity (2/89)
New I McDonnell Douglas 1:24,000 Bureau of Transportation Road Inventory (6/90) Hampshire (Feb. 1987) (USGS) Planning Bridge Mgmt. (6/90)
Pavement Mgmt. Accident Analysis
New Jersey 0 Intergraph 1:24,000 GIS Section (N/A) (In-House Digitizing)
New Mexico P Intergraph (N/A) 1:100,000 Data Processing Bureau, Project Planning (Federal/Private) Computer Aided Engineering Pavement Mgmt.
Section, Geometric Unit Accident Analysis Multi-Modal Modeling
New York o, 1O Intergraph 1:24,000 Information Management Pavement Mgmt. (1988) (NYSDOT) Division NYSDOTs Bridge Mgmt. (1989) (Development of GIS capability Project Tracking
is indicated as a future project Roadway Inventory in the MIS plan.) Air Quality Mgmt.
North I,C ESRI 1:24,000 Engineering Automation Unit EIA (8/90) Carolina (August, 1989) 1:100,000 under the Chief Engineer for Accident Analysis (2/91)
(USGS) Preconstruction Roadway Inventory Pavement Mgmt.
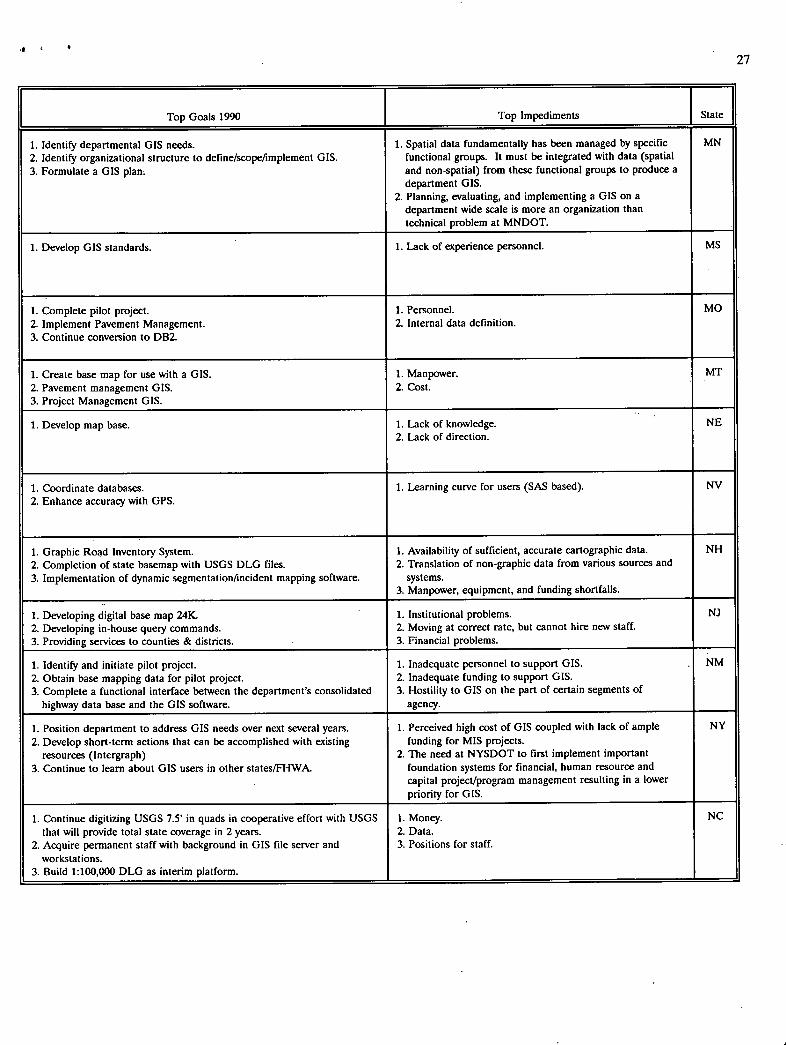
I 27
Top Goals 1990 Top Impediments State
1. Identify departmental GIS needs. 1. Spatial data fundamentally has been managed by specific MN
2. Identify organizational structure to def'ine/scope/implement GIS. functional groups. It must be integrated with data (spatial
3. Formulate a GIS plank and non-spatial) from these functional groups to produce a department GIS.
2. Planning, evaluating, and implementing a GIS on a department wide scale is more an organization than technical problem at MNDOT.
1. Develop GIS standards. 1. Lack of experience personnel. MS
1. Complete pilot project. 1. Personnel. MO
2. Implement Pavement Management. Internal data definition. Continue conversion to DB2.
1. Create base map for use with a GIS. 1. Manpower. MT
2. Pavement management GIS. Cost. Project Management GIS.
1. Develop map base. Lack of knowledge. NE Lack of direction.
Coordinate databases. 1. Learning curve for users (SAS based). NV
Enhance accuracy with GPS.
1. Graphic Road Inventory System. 1. Availability of sufficient, accurate cartographic data. NH
2. Completion of state basemap with USGS DLG files. Translation of non-graphic data from various sources and Implementation of dynamic segmentationlincident mapping software. systems.
3. Manpower, equipment, and funding shortfalls.
1. Developing digital base map 241C 1. Institutional problems. NJ
2. Developing in-house query commands. Moving at correct rate, but cannot hire new staff. Providing services to counties & districts. 3. Financial problems.
1. Identify and initiate pilot project. 1. Inadequate personnel to support GIS. NM
2. Obtain base mapping data for pilot project. Inadequate funding to support GIS. Complete a functional interface between the department's consolidated 3. Hostility to GIS on the part of certain segments of highway data base and the GIS software, agency.
1. Position department to address GIS needs over next several years. 1. Perceived high cost of GIS coupled with lack of ample NY
2. Develop short-term actions that can be accomplished with existing funding for MIS projects. resources (Intergraph) The need at NYSDOT to first implement important Continue to learn about GIS users in other states/FHWA. foundation systems for financial, human resource and
capital project/program management resulting in a lower priority_for GIS.
1. Continue digitizing USGS 7.5' in quads in cooperative effort with USGS Money. NC
that will provide total state coverage in 2 years. Data. 2. Acquire permanent staff with background in GIS file server and 3. Positions for staff.
workstations. 3. Build 1:100,000 DLG as interim platform.
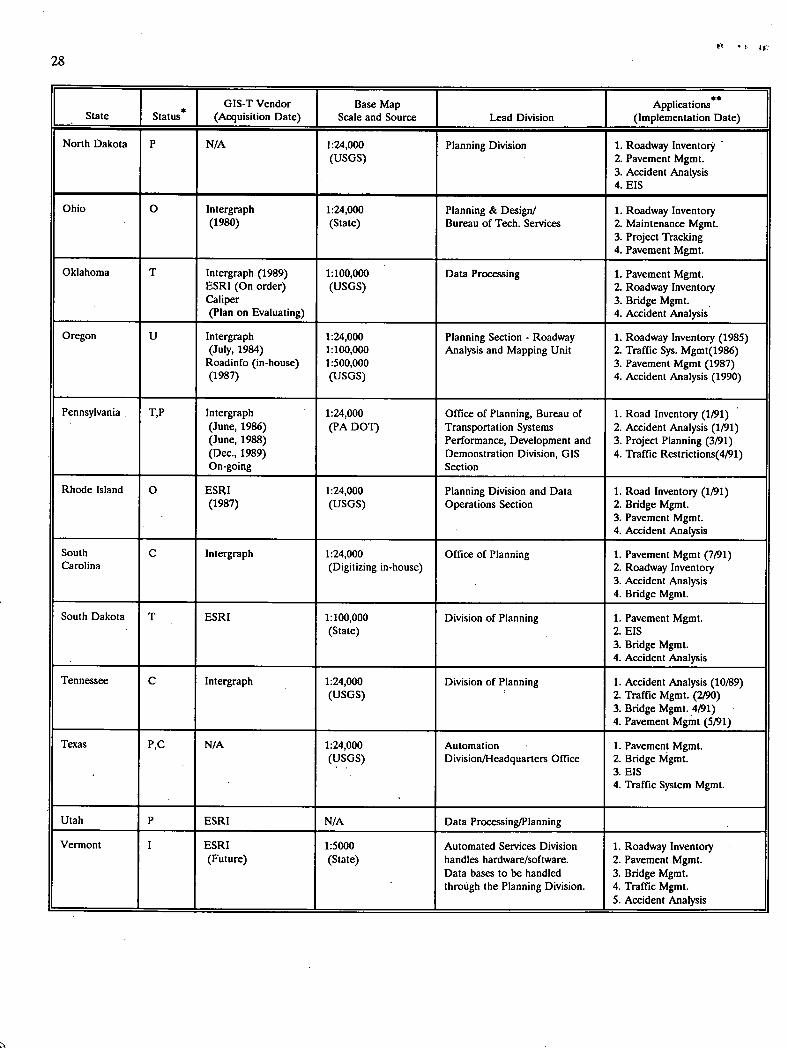
28
GIS-T Vendor Base Map Applications' State Status (Acquisition Date) Scale and Source Lead Division (Implementation Date)
North Dakota P N/A 1:24,000 Planning Division 1. Roadway Inventory (USGS) 2. Pavement Mgmt.
3. Accident Analysis 4.EIS
Ohio 0 Intergraph 1:24,000 Planning & Design! Roadway Inventory (1980) (State) Bureau of Tech. Services Maintenance Mgmt.
Project Tracking Pavement Mgmt.
Oklahoma T Intergraph (1989) 1:100,000 Data Processing Pavement Mgmt. ESRI (On order) (USGS) Roadway Inventory Caliper Bridge Mgmt. (Plan on Evaluating) Accident Analysis
Oregon U Intergraph 1:24,000 Planning Section - Roadway Roadway Inventory (1985) (July, 1984) 1:100,000 Analysis and Mapping Unit Traffic Sys. Mgmt(1986)
Roadinfo (in-house) 1:500,000 Pavement Mgmt (1987) (1987) (USGS) Accident Analysis (1990)
Pennsylvania T,P Intergraph 1:24,000 Office of Planning, Bureau of Road Inventory (1/91) (June, 1986) (PA DOT) Transportation Systems Accident Analysis (1/91) (June, 1988) Performance, Development and Project Planning (3/91) (Dec., 1989) Demonstration Division, GIS Traffic Restrictions(4,91) On-going Section
Rhode Island 0 ESRI 1:24,000 Planning Division and Data Road Inventory (1191) (1987) (USGS) Operations Section Bridge Mgmt.
Pavement Mgmt. Accident Analysis
South C Intergraph 1:24,000 Office of Planning Pavement Mgmt (7/91) Carolina (Digitizing in-house) Roadway Inventory
Accident Analysis Bridge Mgmt.
South Dakota T ESRI 1:100,000 Division of Planning Pavement Mgmt. (State) EIS
Bridge Mgmt. Accident Analysis
Tennessee C Intergraph 1:24,000 Division of Planning Accident Analysis (10/89) (USGS) Traffic Mgmt. (2/90)
Bridge Mgmt. 4/91) Pavement Mgmt (5/91)
Texas P,C N/A 1:24,000 Automation Pavement Mgmt. (USGS) Division/Headquarters Office Bridge Mgmt.
3.EIS 4. Traffic System Mgmt.
Utah P ESRI N/A Data Processing/Planning
Vermont I ESRI 1:5000 Automated Services Division Roadway Inventory (Future) (State) handles hardware/software. Pavement Mgmt.
Data bases to be handled Bridge Mgmt. through the Planning Division. Traffic Mgmt.
Accident Analysis
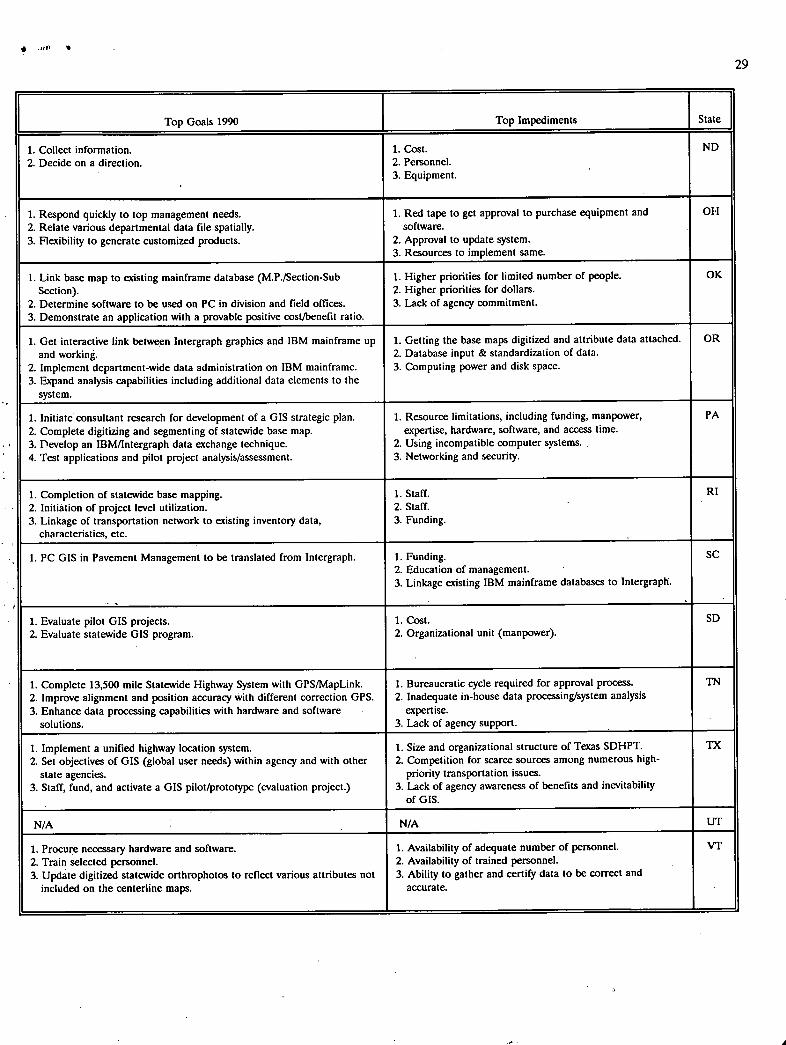
29
Top Goals 1990 Top Impediments State
1. Collect information. 1. Cost. ND
2. Decide on a direction. Personnel. Equipment.
1. Respond quickly to top management needs. 1. Red tape to get approval to purchase equipment and OH
2. Relate various departmental data file spatially, software. 3. Flexibility to generate customized products. Approval to update system.
Resources to implement same.
1. Link base map to existing mainframe database (M.P./Section-Sub Higher priorities for limited number of people. OK
Section). Higher priorities for dollars. 2. Determine software to be used on PC in division and field offices. 3. Lack of agency commitmtnt. 3. Demonstrate an application with a provable positive cost/benefit ratio.
1. Get interactive link between Intergraph graphics and IBM mainframe up Getting the base maps digitized and attribute data attached. OR
and working. Database input & standardization of data.
2. Implement department-wide data administration on IBM mainframe. 3. Computing power and disk space. 3. Expand analysis capabilities including additional data elements to the
system.
1. Initiate consultant research for development of a GIS strategic plan. 1. Resource limitations, including funding, manpower, PA
2. Complete digitizing and segmenting of statewide base map. expertise, hardware, software, and access time. 3. Develop an IBM/Intergraph data exchange technique. 2. Using incompatible computer systems. 4. Test applications and pilot project analysis/assessment. 3. Networking and security.
1. Completion of statewide base mapping. 1. Staff. RI
2. Initiation of project level utilization. Staff. Linkage of transportation network to existing inventory data, 3. Funding. characteristics, etc.
1. PC GIS in Pavement Management to be translated from Intergraph. Funding. SC Education of management. Linkage existing IBM mainframe databases to Intergraph.
1. Evaluate pilot GIS projects. 1. Cost. SD
2. Evaluate statewide GIS program. 2. Organizational unit (manpower).
1. Complete 13,500 mile Statewide Highway System with GPS/MapLink. 1. Bureaucratic cycle required for approval process. TN
2. Improve alignment and position accuracy with different correction GPS. Inadequate in-house data processing/system analysis
Enhance data processing capabilities with hardware and software expertise. solutions. 3. Lack of agency support.
1. Implement a unified highway location system. 1. Size and organizational structure of Texas SDHPT. TX
2. Set objectives of GIS (global user needs) within agency and with other Competition for scarce sources among numerous high-
state agencies. priority transportation issues. Staff, fund, and activate a GIS pilot/prototype (evaluation project.) 3. Lack of agency awareness of benefits and inevitability
of GIS.
N/A N/A UT
1. Procure necessary hardware and software. 1. Availability of adequate number of personnel. VT
2. Train selected personnel. Availability of trained personnel. Update digitized statewide orthrophotos to reflect various attributes not 3. Ability to gather and certify data to be correct and included on the centerline maps. accurate.
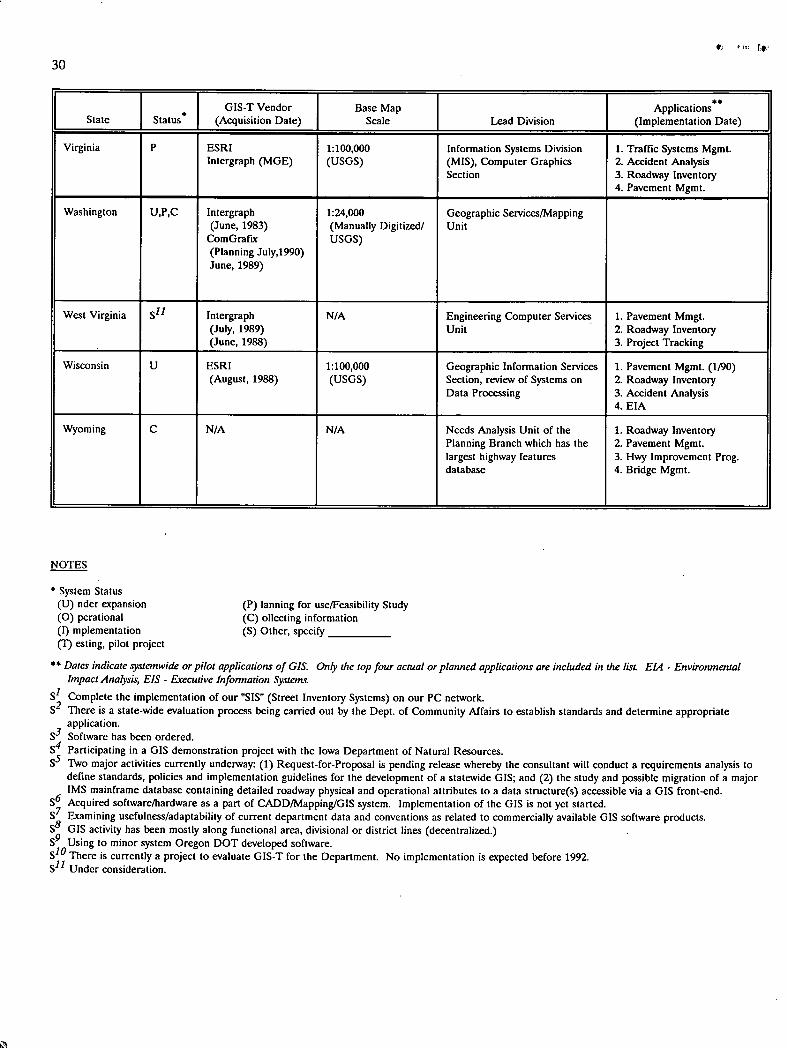
CTI
F I GIS-T Vendor Base Map Applications
**
State J Status (Acquisition Date) Scale Lead Division (Implementation Date)
Virginia P ESRI 1:100,000 Information Systems Division Traffic Systems Mgmt. Intergraph (MOE) (USGS) (MIS), Computer Graphics Accident Analysis
Section Roadway Inventory Pavement Mgmt.
Washington U,P,C Intergraph 1:24,000 Geographic Services/Mapping (June, 1983) (Manually Digitized! Unit
ComGrafix USGS) (Planning July,1990) June, 1989)
West Virginia S" Intergraph N/A Engineering Computer Services Pavement Mmgt. (July, 1989) Unit Roadway Inventory (June, 1988) Project Tracking
Wisconsin U ESRI 1:100,000 Geographic Information Services Pavement Mgmt. (liO) (August, 1988) (USGS) Section, review of Systems on Roadway Inventory
Data Processing Accident Analysis EIA
Wyoming C N/A N/A Needs Analysis Unit of the Roadway Inventory Planning Branch which has the Pavement Mgmt. largest highway features Hwy Improvement Prog. database Bridge Mgmt.
NOTES
* System Status (U) nder expansion (P) tanning for use/Feasibility Study (0) perational (C) ollecting information (I) mplementation (S) Other, specify (1) esting, pilot project
Dates indicate systemwide or pilot applications of GIS. Only the top four actual or planned applications are included in the lisL ELI - Environmental Impact Analysia EIS - Erecutive Information Systems.
S1 Complete the implementation of our 'SIS' (Street Inventory Systems) on our PC network. There is a state-wide evaluation process being carried out by the Dept. of Community Affairs to establish standards and determine appropriate application.
53 Software has been ordered. S4 Participating in a GIS demonstration project with the Iowa Department of Natural Resources. S5 Two major activities currently underway: (1) Request-for-Proposal is pending release whereby the consultant will conduct a requirements analysis to
define standards, policies and implementation guidelines for the development of a statewide GIS; and (2) the study and possible migration of a major IMS mainframe database containing detailed roadway physical and operational attributes to a data structure(s) accessible via a GIS front-end.
S6 Acquired software/hardware as a part of CADDIMapping/GIS system. Implementation of the GIS is not yet started. S7 Examining usefulness/adaptability of current department data and conventions as related to commercially available GIS software products. S8 GIS activity has been mostly along functional area, divisional or district lines (decentralized.) 9 Using to minor system Oregon DOT developed software.
S1° There is currently a project to evaluate GIS-T for the Department. No implementation is expected before 1992. S11 Under consideration.
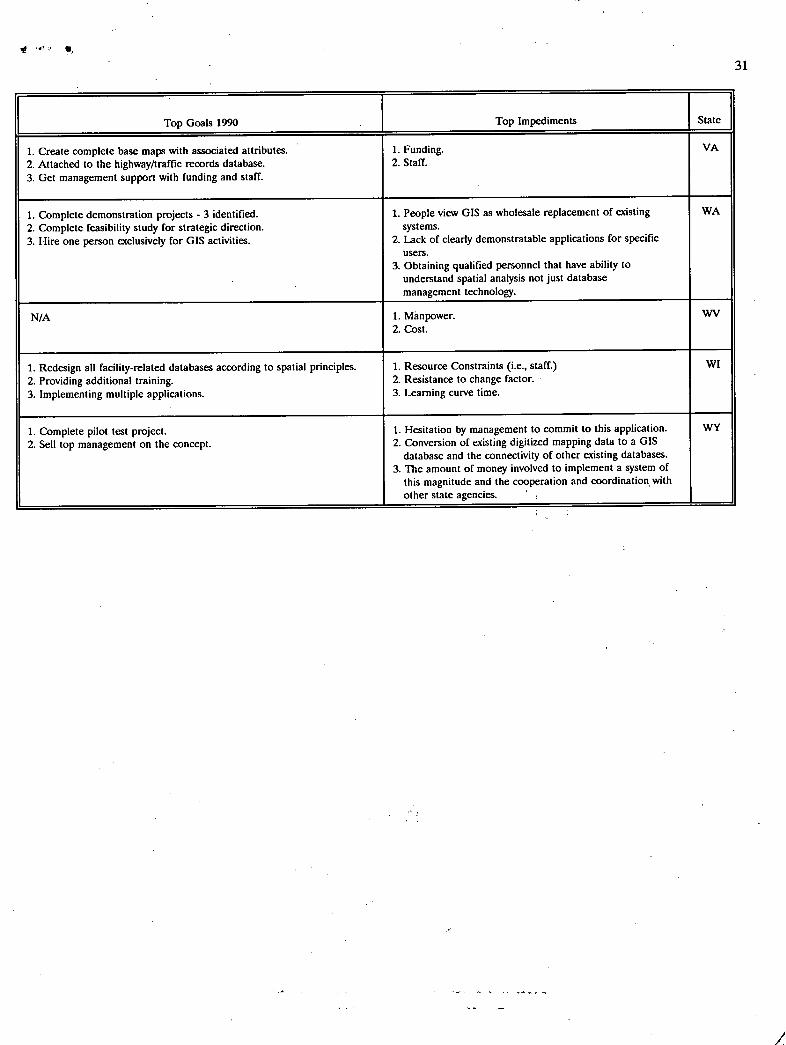
31
Top Goals 1990 Top Impediments State
1. Create complete base maps with associated attributes. 1. Funding. VA
2. Attached to the highway/traffic records database. Staff. Get management support with funding and staff.
1. Complete demonstration projects - 3 identified. 1. People view GIS as wholesale replacement of existing WA
2. Complete feasibility study for strategic direction. systems. 3. Hire one person exclusively for GIS activities. Lack of clearly demonstratable applications for specific
users. Obtaining qualified personnel that have ability to understand spatial analysis not just database management technology.
N/A Manpower. WV
Cost.
1. Redesign all facility-related databases according to spatial principles. 1. Resource Constraints (i.e., staff.) WI
2. Providing additional training. Resistance to change factor.
Implementing multiple applications. 3. Learning curve time.
1. Complete pilot test project. 1. Hesitation by management to commit to this application. WY
2. Sell top management on the concept. Conversion of existing digitized mapping data to a GIS database and the connectivity of other existing databases. The amount of money involved to implement a system of this magnitude and the cooperation and coordination, with
- other state agencies.
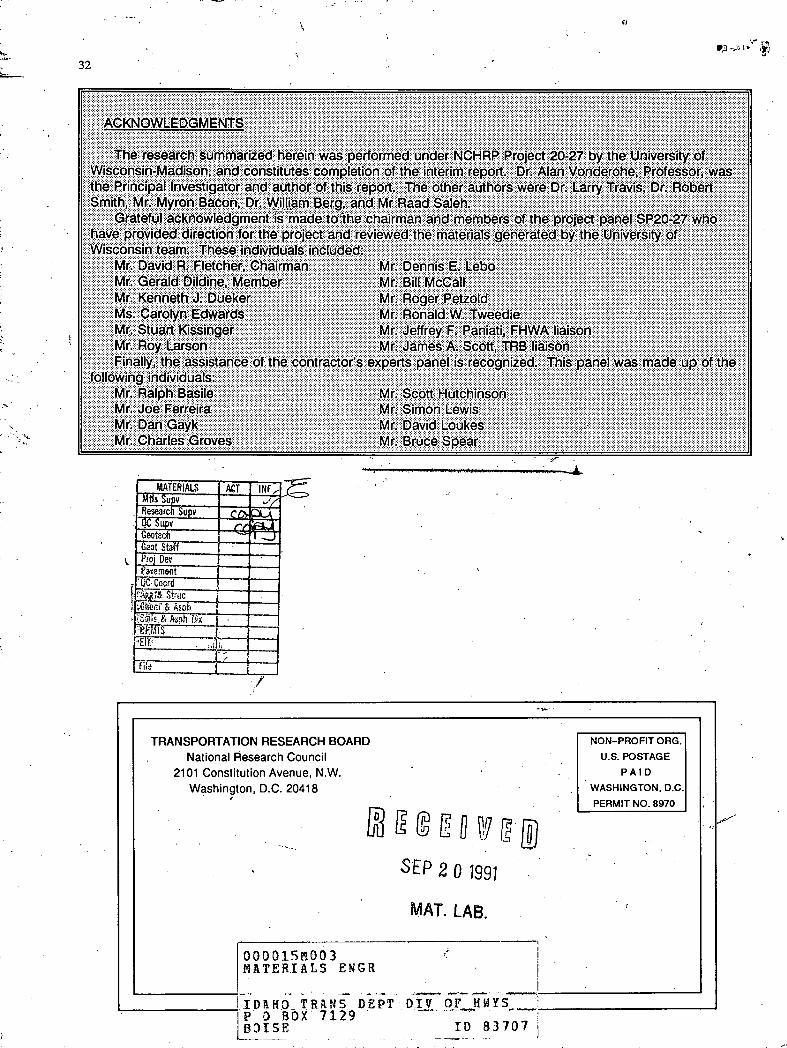
MATERIALS ACT Mtts Supu - Research Supv QCSupu
INF,.-
GeotcIi otStgf
Proj De Pavement
Cocrd
A501) is.& hph Mx -
/ TRANSPORTATION RESEARCH BOARD NON—PROFIT ORG.
National Research Council U.S. POSTAGE
2101 Constitution Avenue, N.W. PAID
Washington, D.C. 20418 WASHINGTON, D.C.
PERMIT NO. 8970
SEp201991
MAT. LAB.
00001511003 NATERtALS ENGR
IDTRANS DEPTDIOF HW!S P 0 BOX 7129 - BISE ID 83707
32