Embed Size (px)
Citation preview
HRM Workforce ReportExecutive Standing Committee
Human Resources
January 22, 2018
12.1.2
HRM Workforce Report
2
What we are presenting today
1. HRM Workforce Profile
2. Employee Attendance
3. Summary of
Grievances
4. Employee Health and
Safety
HRM Workforce Report
3
Annual Reporting - April 1, 2016 to March 31, 2017
Attendance
Headcount
Jobs filled
Turnover rates
Headcount and FTEs
(Number of employees
vs. budgeted FTE
positions)
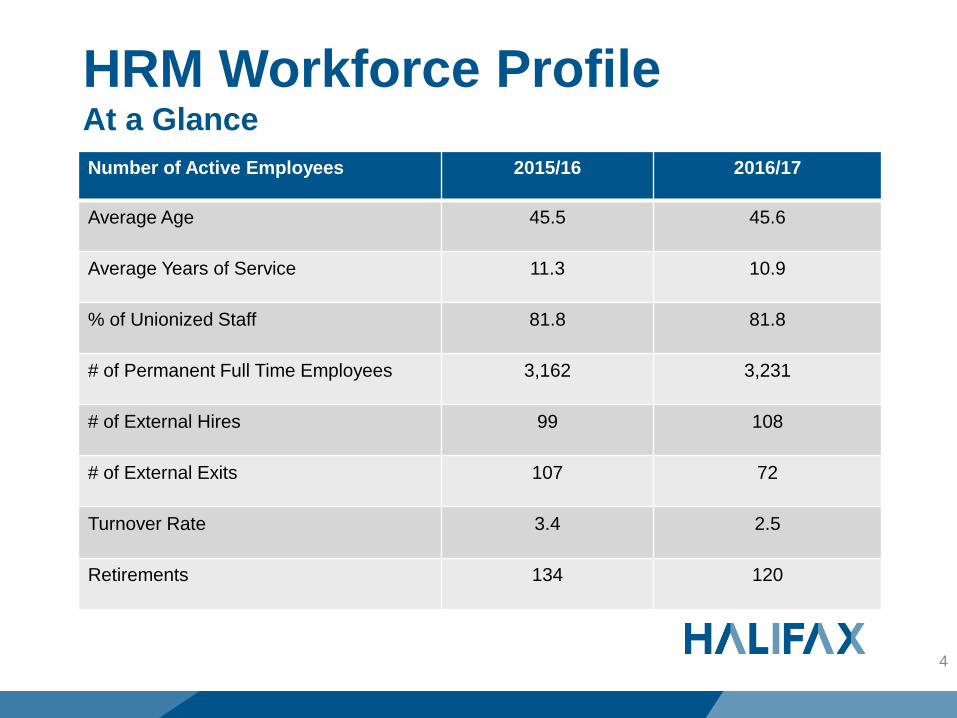
HRM Workforce ProfileAt a Glance
4
Number of Active Employees 2015/16 2016/17
Average Age 45.5 45.6
Average Years of Service 11.3 10.9
% of Unionized Staff 81.8 81.8
# of Permanent Full Time Employees 3,162 3,231
# of External Hires 99 108
# of External Exits 107 72
Turnover Rate 3.4 2.5
Retirements 134 120
Workforce Profile Highlights
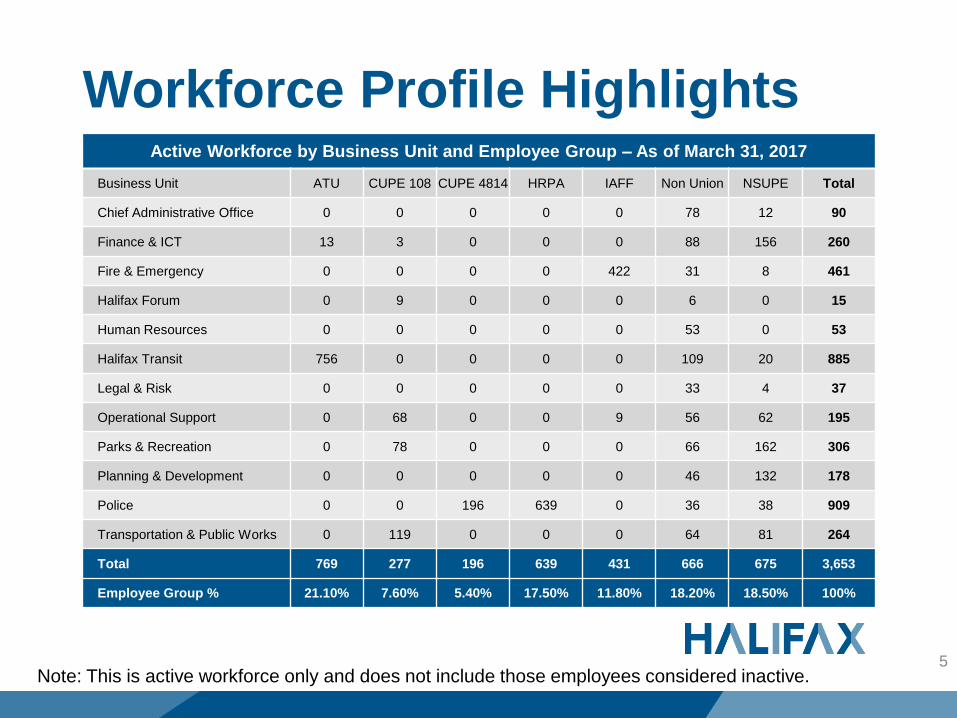
5Note: This is active workforce only and does not include those employees considered inactive.
Active Workforce by Business Unit and Employee Group – As of March 31, 2017
Business Unit ATU CUPE 108 CUPE 4814 HRPA IAFF Non Union NSUPE Total
Chief Administrative Office 0 0 0 0 0 78 12 90
Finance & ICT 13 3 0 0 0 88 156 260
Fire & Emergency 0 0 0 0 422 31 8 461
Halifax Forum 0 9 0 0 0 6 0 15
Human Resources 0 0 0 0 0 53 0 53
Halifax Transit 756 0 0 0 0 109 20 885
Legal & Risk 0 0 0 0 0 33 4 37
Operational Support 0 68 0 0 9 56 62 195
Parks & Recreation 0 78 0 0 0 66 162 306
Planning & Development 0 0 0 0 0 46 132 178
Police 0 0 196 639 0 36 38 909
Transportation & Public Works 0 119 0 0 0 64 81 264
Total 769 277 196 639 431 666 675 3,653
Employee Group % 21.10% 7.60% 5.40% 17.50% 11.80% 18.20% 18.50% 100%
HRM Workforce Report
6
Headcount / Budgeted FTEs
FTE = Full Time Equivalent
A measure of the # of hours to
make up a workday/week/year
Differs by employee group
E.g. 1 Non Union FTE = 1,827
hrs/year
Employee Headcount
The actual number of employees
(people, not positions) employed
at HRM at any point in time.
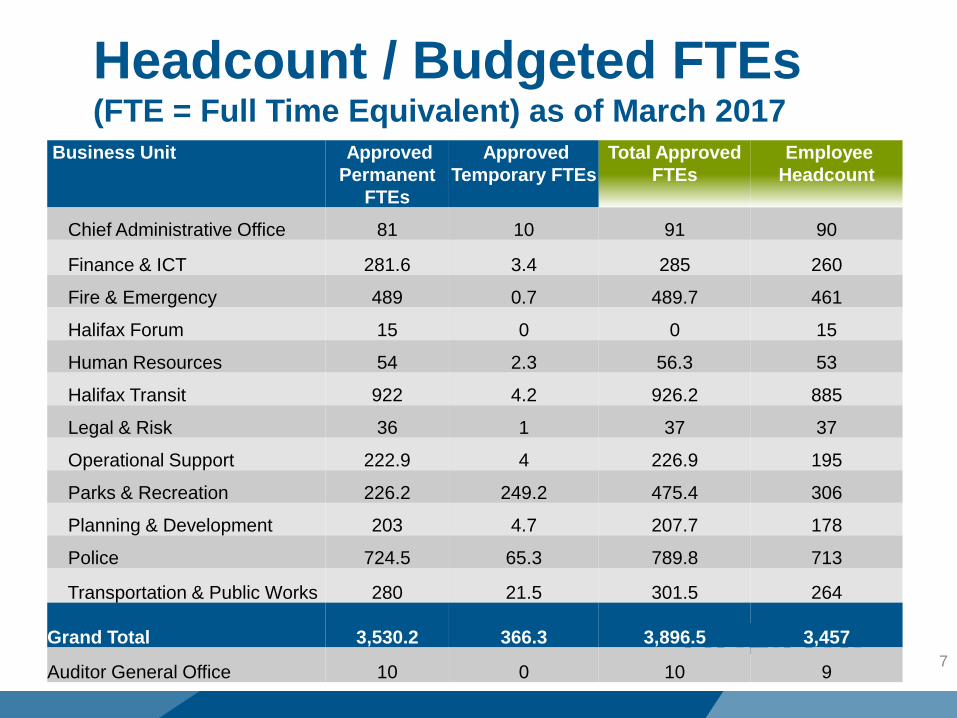
Headcount / Budgeted FTEs (FTE = Full Time Equivalent) as of March 2017
7
Business Unit Approved
Permanent
FTEs
Approved
Temporary FTEs
Total Approved
FTEs
Employee
Headcount
Chief Administrative Office 81 10 91 90
Finance & ICT 281.6 3.4 285 260
Fire & Emergency 489 0.7 489.7 461
Halifax Forum 15 0 0 15
Human Resources 54 2.3 56.3 53
Halifax Transit 922 4.2 926.2 885
Legal & Risk 36 1 37 37
Operational Support 222.9 4 226.9 195
Parks & Recreation 226.2 249.2 475.4 306
Planning & Development 203 4.7 207.7 178
Police 724.5 65.3 789.8 713
Transportation & Public Works 280 21.5 301.5 264
Grand Total 3,530.2 366.3 3,896.5 3,457
Auditor General Office 10 0 10 9
HRM Workforce Report
8
Employee Attendance
Reporting on fiscal year (April 1/16
to March 31/17)
• By Business Unit
• By Employee Group*
Yearly trends
• By Employee Group
* Does not include CUPE 4814
(Crossing Guards)
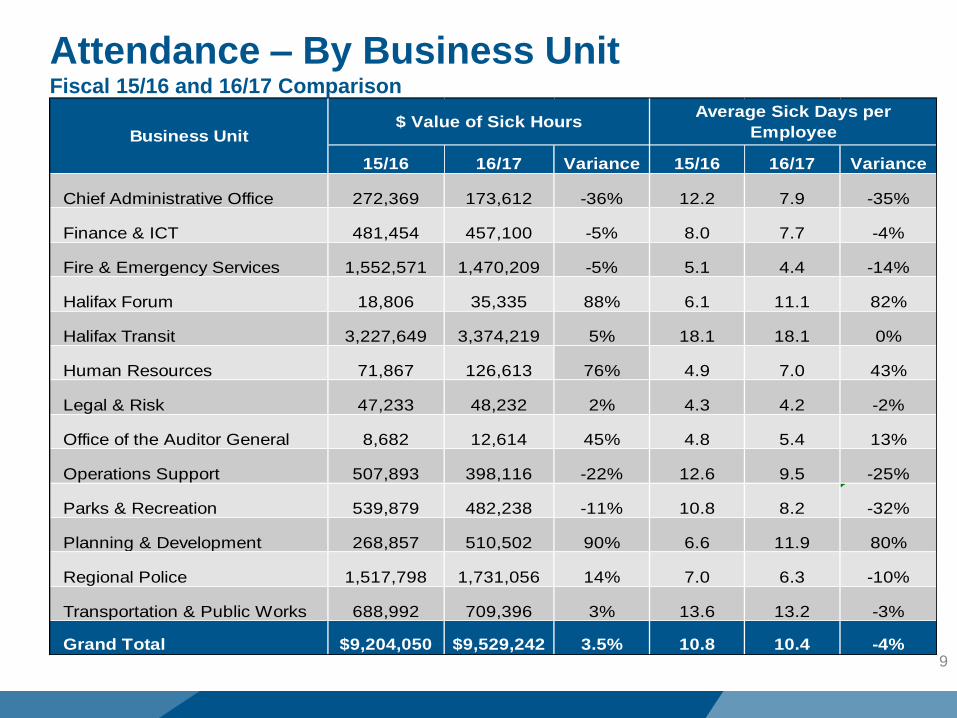
Attendance – By Business UnitFiscal 15/16 and 16/17 Comparison
9
15/16 16/17 Variance 15/16 16/17 Variance
Chief Administrative Office 272,369 173,612 -36% 12.2 7.9 -35%
Finance & ICT 481,454 457,100 -5% 8.0 7.7 -4%
Fire & Emergency Services 1,552,571 1,470,209 -5% 5.1 4.4 -14%
Halifax Forum 18,806 35,335 88% 6.1 11.1 82%
Halifax Transit 3,227,649 3,374,219 5% 18.1 18.1 0%
Human Resources 71,867 126,613 76% 4.9 7.0 43%
Legal & Risk 47,233 48,232 2% 4.3 4.2 -2%
Office of the Auditor General 8,682 12,614 45% 4.8 5.4 13%
Operations Support 507,893 398,116 -22% 12.6 9.5 -25%
Parks & Recreation 539,879 482,238 -11% 10.8 8.2 -32%
Planning & Development 268,857 510,502 90% 6.6 11.9 80%
Regional Police 1,517,798 1,731,056 14% 7.0 6.3 -10%
Transportation & Public Works 688,992 709,396 3% 13.6 13.2 -3%
Grand Total $9,204,050 $9,529,242 3.5% 10.8 10.4 -4%
Business Unit$ Value of Sick Hours
Average Sick Days per
Employee
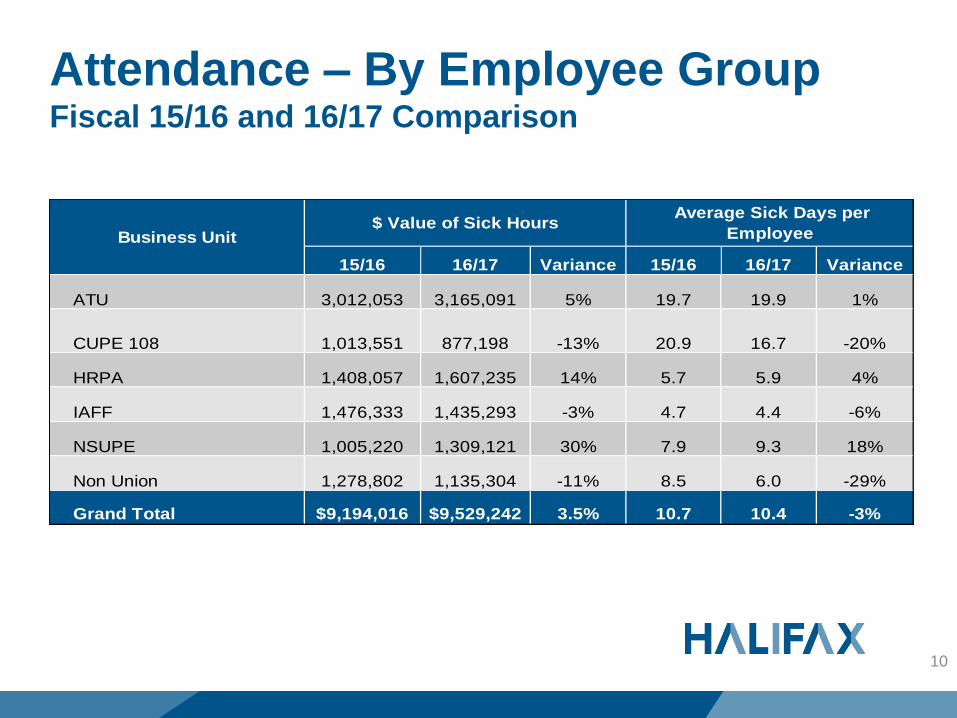
Attendance – By Employee GroupFiscal 15/16 and 16/17 Comparison
10
15/16 16/17 Variance 15/16 16/17 Variance
ATU 3,012,053 3,165,091 5% 19.7 19.9 1%
CUPE 108 1,013,551 877,198 -13% 20.9 16.7 -20%
HRPA 1,408,057 1,607,235 14% 5.7 5.9 4%
IAFF 1,476,333 1,435,293 -3% 4.7 4.4 -6%
NSUPE 1,005,220 1,309,121 30% 7.9 9.3 18%
Non Union 1,278,802 1,135,304 -11% 8.5 6.0 -29%
Grand Total $9,194,016 $9,529,242 3.5% 10.7 10.4 -3%
Business Unit$ Value of Sick Hours
Average Sick Days per
Employee

Attendance Support ProgramWhat are we doing?
11
Objectives
Promoting a
healthy workplace
with guidance for
assisting
employees to
minimize
absences.
Supporting
maximizing service
delivery to the
public.
Collaboration with Managers/Supervisors
Meeting with employees to discuss levels of
support, offer health file referrals to Health,
Safety & Wellness
Making every reasonable effort to provide
accommodation, assistance, rehabilitation and
resources to achieve regular attendance Training for management to provide support to
employees
Improving reporting and trending for managers
More trending based on available data to
promote well-being
Sharing accountability for results will minimize
absences and support service delivery
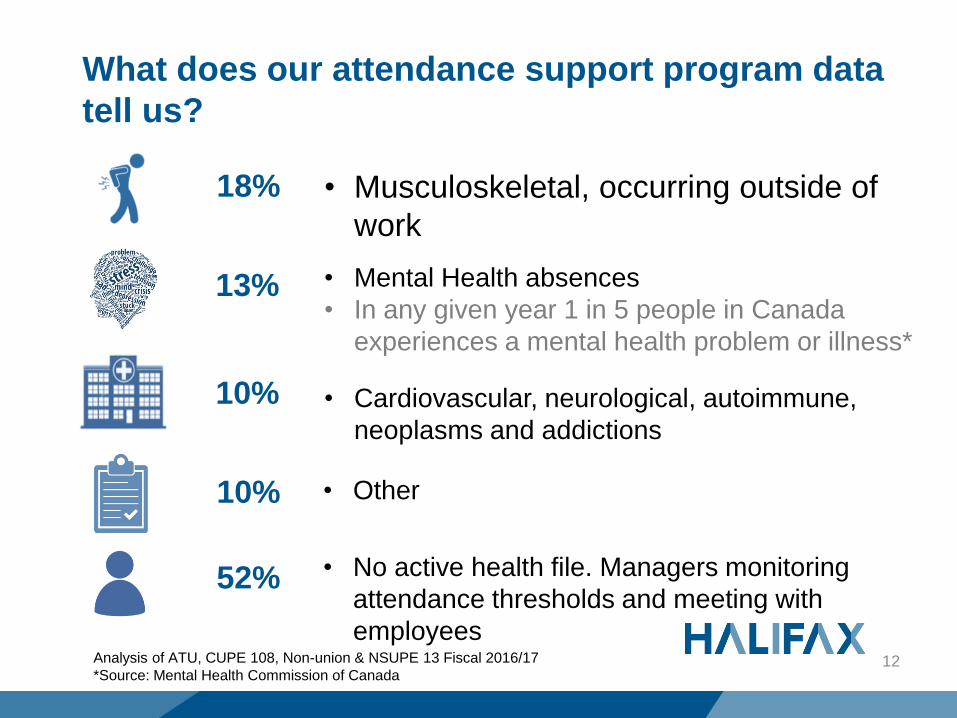
What does our attendance support program data
tell us?
12Analysis of ATU, CUPE 108, Non-union & NSUPE 13 Fiscal 2016/17
*Source: Mental Health Commission of Canada
10% • Cardiovascular, neurological, autoimmune,
neoplasms and addictions
18% • Musculoskeletal, occurring outside of
work
13% • Mental Health absences
• In any given year 1 in 5 people in Canada
experiences a mental health problem or illness*
10% • Other
52% • No active health file. Managers monitoring
attendance thresholds and meeting with
employees
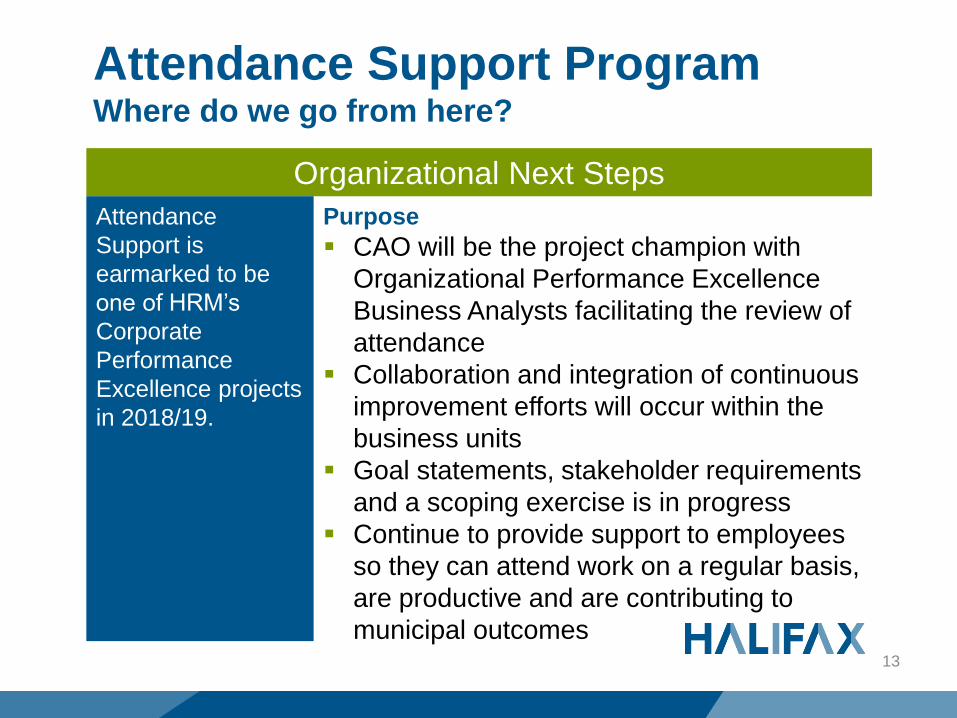
Attendance Support ProgramWhere do we go from here?
13
Organizational Next Steps
Attendance
Support is
earmarked to be
one of HRM’s
Corporate
Performance
Excellence projects
in 2018/19.
Purpose
CAO will be the project champion with
Organizational Performance Excellence
Business Analysts facilitating the review of
attendance
Collaboration and integration of continuous
improvement efforts will occur within the
business units
Goal statements, stakeholder requirements
and a scoping exercise is in progress
Continue to provide support to employees
so they can attend work on a regular basis,
are productive and are contributing to
municipal outcomes
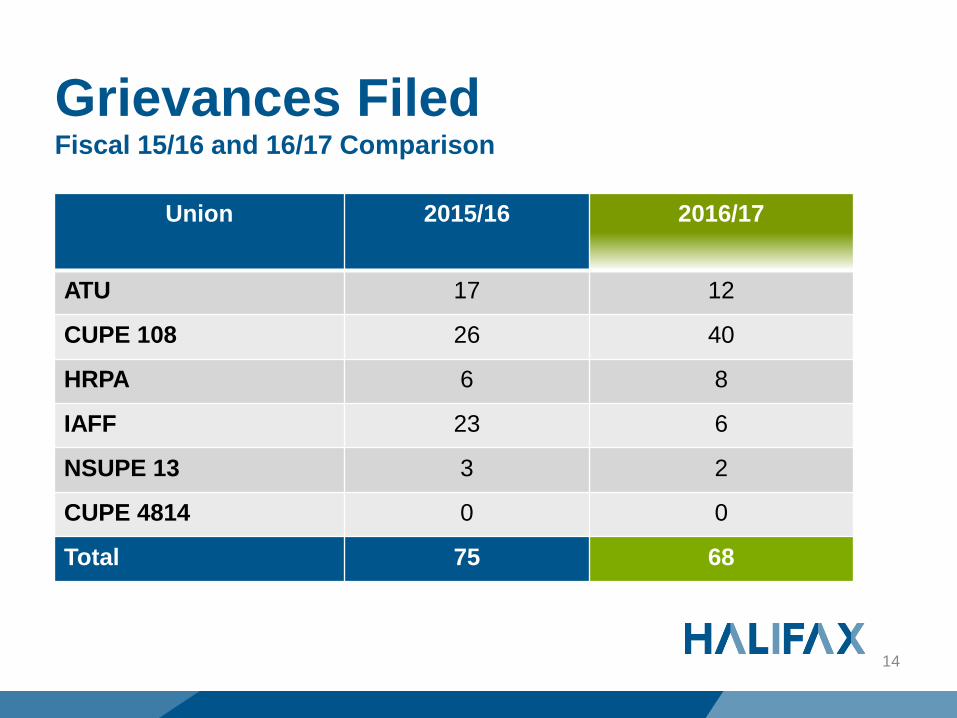
Grievances FiledFiscal 15/16 and 16/17 Comparison
Union 2015/16 2016/17
ATU 17 12
CUPE 108 26 40
HRPA 6 8
IAFF 23 6
NSUPE 13 3 2
CUPE 4814 0 0
Total 75 68
14
Health & Safety ReportingWCB HRM rates reporting 2013 to 2016
HRM WCB Classification reports in three categories:
1. Administration and Transportation & Public Works
(TPW)
2. Recreation
3. Bus Transportation
Accident reporting for Fiscal (April to March 2016-17)
• Human Resources H&S Business Operations
Plans
• Internal OHS Incident Reporting
15
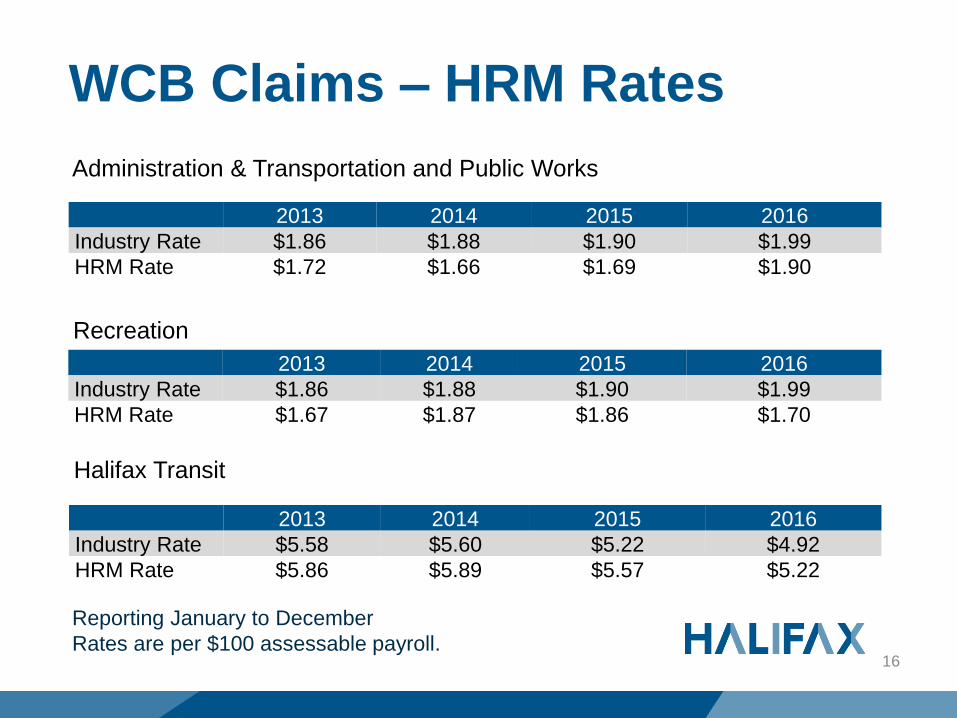
WCB Claims – HRM Rates
16
Reporting January to December
Rates are per $100 assessable payroll.
Administration & Transportation and Public Works
Recreation
2013 2014 2015 2016
Industry Rate $1.86 $1.88 $1.90 $1.99
HRM Rate $1.72 $1.66 $1.69 $1.90
2013 2014 2015 2016
Industry Rate $1.86 $1.88 $1.90 $1.99
HRM Rate $1.67 $1.87 $1.86 $1.70
Halifax Transit
2013 2014 2015 2016
Industry Rate $5.58 $5.60 $5.22 $4.92
HRM Rate $5.86 $5.89 $5.57 $5.22
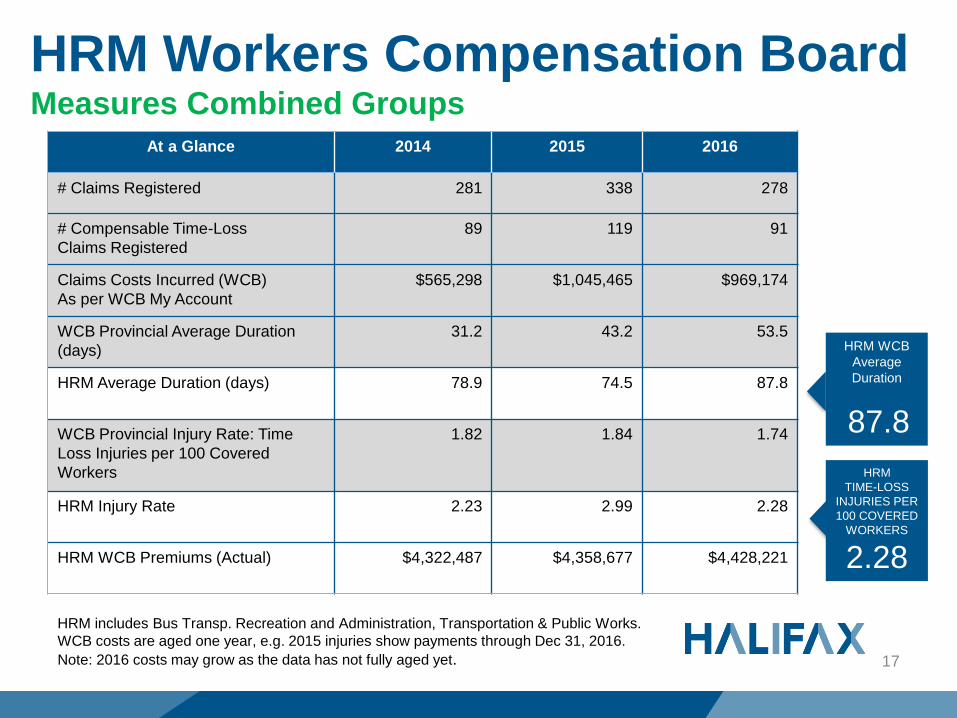
HRM Workers Compensation Board Measures Combined Groups
17
At a Glance 2014 2015 2016
# Claims Registered 281 338 278
# Compensable Time-Loss
Claims Registered
89 119 91
Claims Costs Incurred (WCB)
As per WCB My Account
$565,298 $1,045,465 $969,174
WCB Provincial Average Duration
(days)
31.2 43.2 53.5
HRM Average Duration (days) 78.9 74.5 87.8
WCB Provincial Injury Rate: Time
Loss Injuries per 100 Covered
Workers
1.82 1.84 1.74
HRM Injury Rate 2.23 2.99 2.28
HRM WCB Premiums (Actual) $4,322,487 $4,358,677 $4,428,221
HRM WCB
Average
Duration
87.8
HRM
TIME-LOSS
INJURIES PER
100 COVERED
WORKERS
2.28
HRM includes Bus Transp. Recreation and Administration, Transportation & Public Works.
WCB costs are aged one year, e.g. 2015 injuries show payments through Dec 31, 2016.
Note: 2016 costs may grow as the data has not fully aged yet.
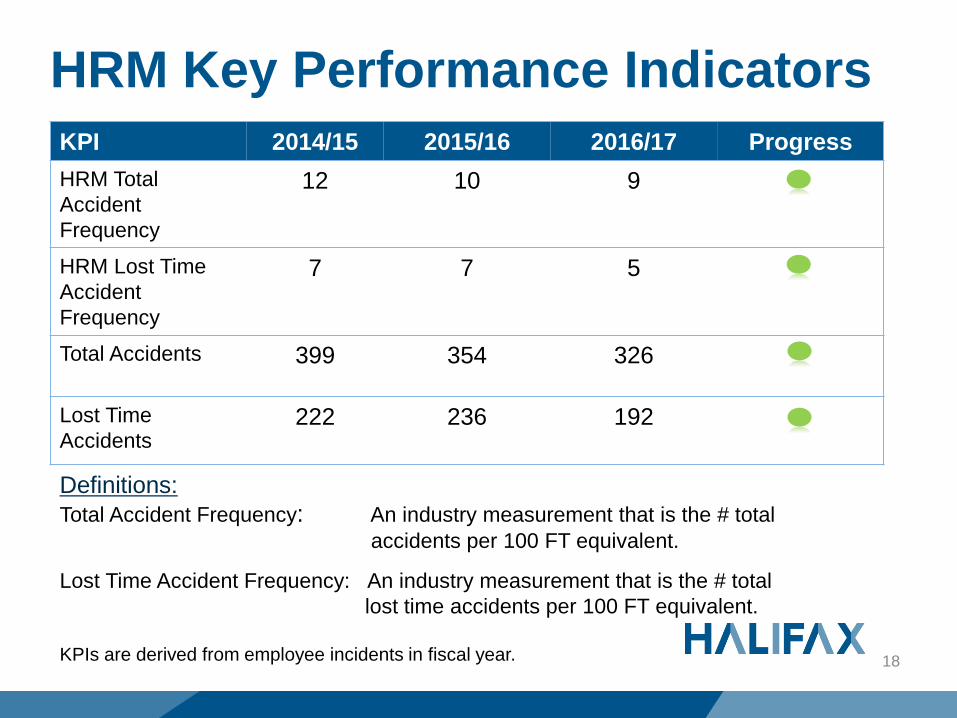
HRM Key Performance Indicators
KPI 2014/15 2015/16 2016/17 Progress
HRM Total
Accident
Frequency
12 10 9
HRM Lost Time
Accident
Frequency
7 7 5
Total Accidents 399 354 326
Lost Time
Accidents222 236 192
Definitions:
Total Accident Frequency: An industry measurement that is the # total
accidents per 100 FT equivalent.
Lost Time Accident Frequency: An industry measurement that is the # total
lost time accidents per 100 FT equivalent.
KPIs are derived from employee incidents in fiscal year. 18
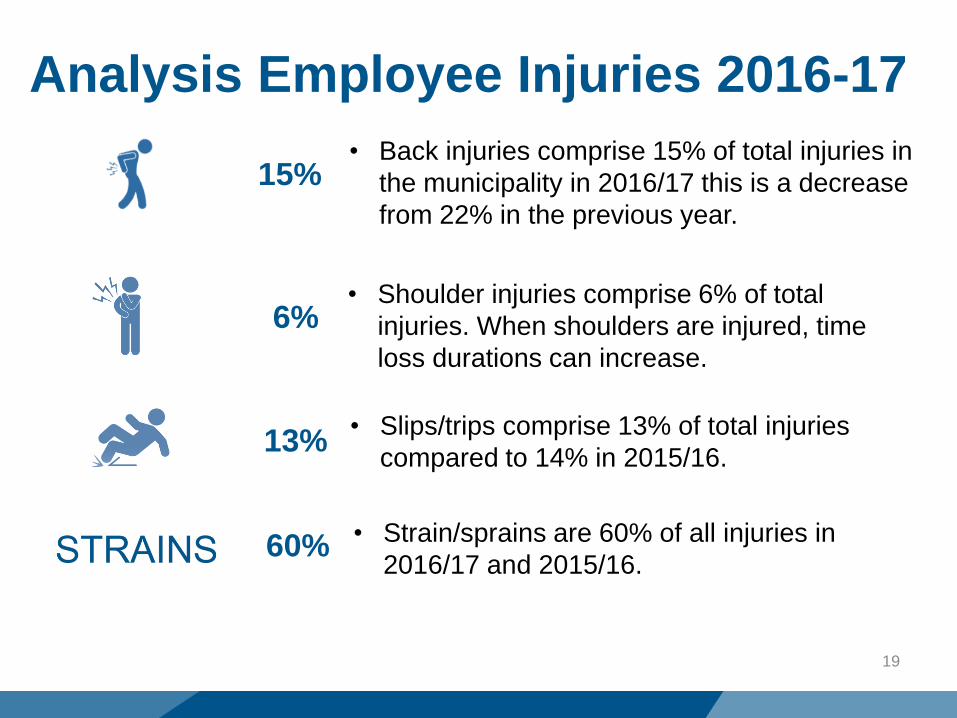
Analysis Employee Injuries 2016-17
• Back injuries comprise 15% of total injuries in
the municipality in 2016/17 this is a decrease
from 22% in the previous year.
15%
6%• Shoulder injuries comprise 6% of total
injuries. When shoulders are injured, time
loss durations can increase.
60% • Strain/sprains are 60% of all injuries in
2016/17 and 2015/16.
• Slips/trips comprise 13% of total injuries
compared to 14% in 2015/16. 13%
19
Health, Safety & Wellness
20
Strategic Goals – Year 3
We create a safety-
first culture
together.
We proactively
work to make our
workplaces safer.
Corporate Occupational health & Safety Plan
OHS Incident Reporting – Environment. Health
& Safety Management (EHSM) technology
launched in September 2016
Planning for enhanced trending via business
intelligence reporting from EHSM
North American Occupational Health & Safety
Week
National Mental Health Week
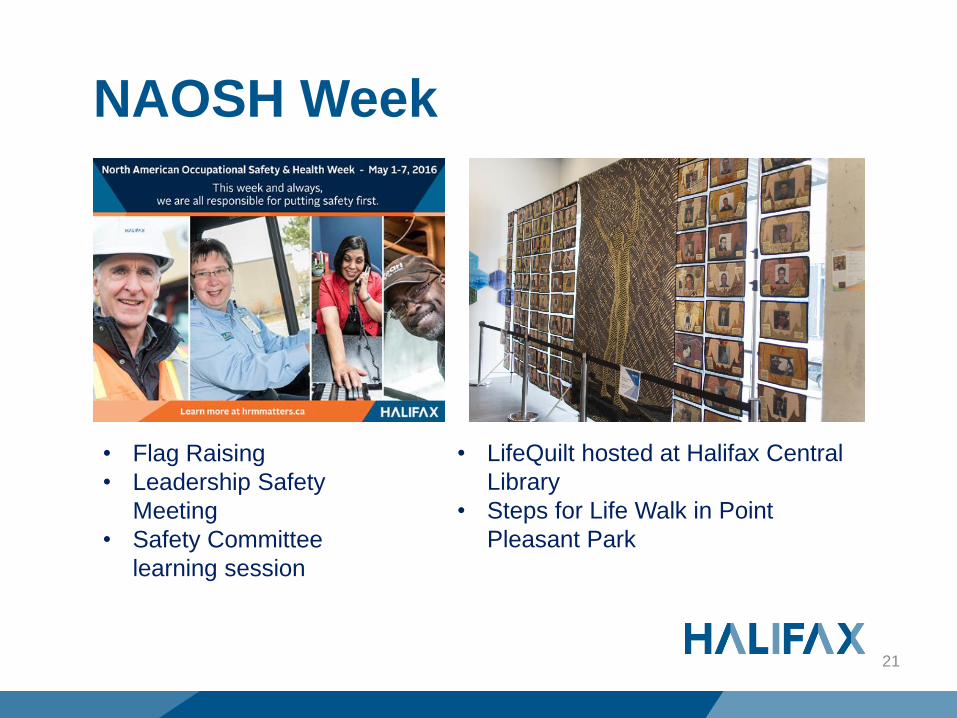
NAOSH Week
• Flag Raising
• Leadership Safety
Meeting
• Safety Committee
learning session
• LifeQuilt hosted at Halifax Central
Library
• Steps for Life Walk in Point
Pleasant Park
21
Health, Safety & WellnessWhere do we go from here?
22
Improving outcomes for safe and timely return to work
Similar to provincial
results, the
municipality
experienced an
increase in claim
durations.
This is mainly due
to increasing
musculoskeletal
injuries.
What are some next steps
Understanding our trends: strain/sprain
injuries comprise 60% of all injuries in 2016/17
The municipality is introducing an enhanced
Stay at Work / Return to Work policy
Offering employees with WCB coverage
access to physiotherapy services within 24
hours of an injury for an assessment to help
support safe return to work
Piloting an injury prevention working group
within Halifax Transit to support employees
reduce injuries
Partnering with the WCB for ergonomic
learnings and supports

Thank You