Embed Size (px)
Citation preview

1
Human Resources for Health
Country Profile
Zimbabwe

Human Resources for Health Country Profile Zimbabwe
2
Human Resources for HealthCountry Profile
ZIMBABWE
Zimbabwe Health Workforec OBservatory, March 2009
3
Content
1. Country context .........................................................................................................................91.1 Geography and demography........................................................................................................91.2 Economic context. .....................................................................................................................101.3 Political context .........................................................................................................................111.4 Health status ..............................................................................................................................112. Country health system ............................................................................................................132.1 Governance................................................................................................................................132.2 Service provision .......................................................................................................................182.3 Health care financing.................................................................................................................192.4 Health information system ........................................................................................................203. Health Workers Situation .......................................................................................................223.1 Health workers stock and trends................................................................................................224. HRH Production......................................................................................................................244.1 Pre-service education.................................................................................................................244.2 In-service and continuing education..........................................................................................274.3 Health workforce requirements .................................................................................................275. HRH Utilization .......................................................................................................................285.1 Recruitment, Deployment and Distribution mechanisms..........................................................285.2 The work environment ..............................................................................................................286. Governance for HRH ..............................................................................................................326.1 HRH policies and plans .............................................................................................................326.2 Policy development, planning and managing for HRH.............................................................326.3 Professional Regulation............................................................................................................326.4 HRH information.......................................................................................................................336.5 HRH research ............................................................................................................................346.6 Stakeholders in HRH.................................................................................................................34Annex 1: Definition of Health workforce Data .............................................................................37Annex2: Members involved in the working Group ............................ Error! Bookmark not defined.Annex3: Detailed HRH Stock Data for Critical cadres (Doctors, Nurses, Pharmacy and
Laboratory Staff)...........................................................................................................38
CONTENT

4
Acronyms
BSS Basic Services Sector
CSO Central Statistics Office
DMO District Medical Office
ESP European Support Programme
EU European Union
GoZ Government of Zimbabwe
HIA Health Information Assistants
HPA Health Professions Authority
HR Human Resources
HRIS Human Resources Information System
HSB Health Services Board
ICDS Inter-Censal Demographic Survey
IDRS Integrated Disease Surveillance and Response
IMF International Monetary Fund
LATH Liverpool Associates in Tropical Health
LSTM Liverpool School of Tropical Medicine
MDGs Millennium Development Goals
MoF Ministry of Finance
MoHCW Ministry of Health and Child Welfare
MoHTE Ministry of Higher and Tertiary Education
MoLSS Ministry of Labour and Social Services
MP Member of Parliament
NAC National AIDS Council
NGO Non-Governmental Organization
NHIS National Health Information and Surveillance
NIHR National Institute of Health Research
NHS National Health Strategy
NSSA National Social Security Authority
NUST National University of Science and Technology
OPD Out Patient Department
PCC Primary Care Counsellors
PHC Primary Health Care
PMD Provincial Medical Directorate
SADC Southern African Development Community
SSB Salary Services Bureau
TWG Technical Working Group
UCA Urban Councils Act
VHW Village Health Worker
WHO World Health Organization
ZACH Zimbabwe Association of Church Related Hospitals
ZDHS Zimbabwe Demographic and Health Survey
ZIMPREST Zimbabwe Programme for Economic and Social Transformation
ZOU Zimbabwe Open University

5
Tables
Table 1.1 Percent Population Distribution by Age Group and year (last available year and 10 yearearlier if possible) ............................................................................................................9
Table 1.2 Population distribution by Sex.........................................................................................10Table 1.3 Economic indicators..........................................................................................................10Table 1.4 Trends of Population growth rate and economic growth rate in the past 5 years ......11Table 1.5 Main causes of morbidity and mortality .........................................................................12Table 1.6 Health indicators ...............................................................................................................12Table 2.1 Health Facilities by levels of care and by province ....................................................18Table 2.2 Registered Private Health Facilities by Province and Service Type ........................19Table 3.1 Health worker/Population ratios at national level ...................................................22Table 3.3 Gender distribution by health occupation/cadre ............... Error! Bookmark not defined.(See definition of each occupational category in annex)..................... Error! Bookmark not defined.Table 3.4 Workers by age group and cadre ........................................ Error! Bookmark not defined.Table 3.5 Province distribution of health workers per 1000 population. Error! Bookmark not
defined.Table 3.6 Regional/District/province distribution of workers ........... Error! Bookmark not defined.Table 3.7 Urban/Rural distribution of workers ................................. Error! Bookmark not defined.(See definition of each occupational category in annex) ...................... Error! Bookmark not defined.Table 3.8 Public/Private for profit/Faith based organization/private not for profit distribution of
health workers (See definition of each occupational category in annex)Error! Bookmarknot defined.
Table 4.1 Number of Training Institutions by type of ownership............................................25Table 4.2 Number of entrants and graduates by 2010 .............................................................25Table 4.3 Projections for health workforce requirements for the coming years .........................27Table 5.2.1 MOHCW Staff Attrition (Resignations and Retirements 2008 & 2009) .....................30Table 5.2.2 The original Emergency Retention Scheme Allowances versus District Pay scales
.........................................................................................................................................31

6
Figures
Figure 1.1 Map of Zimbabwe..............................................................................................................9Figure 2.1 The MoHCW structure ..................................................................................................17Figure 5.2.1: MoHCW Establishment Vacancy Rates Analysis ...................................................29

7
Executive Summary
The development of the Zimbabwean Human Resources for Health (HRH) country profilebegan in June 2010 and was completed in August 2010. This assignment was carried out by anInternational and local consultant who used secondary data sources and key informantinterviews from the Ministry of Health and Child Welfare (MoHCW), government departments,health council and associations, missions and NGOs in health.
The development of the HRH profile is part of an initiative by the African Health WorkforceObservatory to develop a mechanism that could assist countries to compare and contrast theirHRH policies and systems with other countries experiencing similar HRH challenges. Theexperiences in the development of the first HRH profile in Zimbabwe are very much similar tomost African countries that carried out the activity for the first time. The lessons learnt from theprocess have motivated governments to view HRH challenges from a sectoral perspective. Theprofile suggests that the MoHCW should develop HRH systems that provide adequateinformation that includes the public, private, private for profit, and faith based organizations(missions).
This profile reports that Zimbabwe was projected to have a population of 12.12 Million people in2009 who were being served by a public health workforce of approximately 27,840. Thecountry’s service delivery system has developed over the years and most communities livewithin at least 8 kilometers of the nearest health facility. Zimbabwe is reported to have 1431public health facilities and 1920 private health facilities across the country providing bothprimary and tertiary health services. These health facilities are also complemented by 3,943traditional health workers and 4,013 Village Health Workers.
The economic depression experienced in 2008 heavily affected the stability of health workers inthe public sector. The profile reports that at the peak of the economic depression theMoHCW lost 3,588 staff through resignations. The effects of the these losses are still felt in somecritical cadres such as doctors, laboratory and environmental health staff who still have vacancyrates above 50% of established posts.
Realizing that the health sector was in crisis the MoHCW and partners developed an EmergencyRetention Scheme in 2008 to cover the whole public sector including council employees inrural and urban areas. In March 2009, the government and its partners revised the retentionscheme to only apply to grades C5 and above of the MoHCW posts. There seems to beevidence suggesting that the retention scheme currently managed by Crown Agents hasbrought some stability in the public health sector. The number of resignations in 2009 dropped to84% (567) of the previous year.
The production of health workers seems to have gone down during the last five years before thisHRH profile. A review of data on intakes and graduates from 2006 to 2009 shows that
approximately 7,896 students were registered and 10,233 graduates were produced from thesame training institutions. The misnomer between intake and graduate numbers could beevidence that the enrollments into schools are becoming lower than the previous years. This couldalso be as a result of the reported losses of teaching staff in health training schools.
Despite the high attrition of health staff from MoHCW, there was evidence that showed thatgovernment continued employing staff to work in public health facilities across the country. Thenumber of new appointments increased from 2,057 in 2008 to 2,320 in 2009. If we are tocompare the total number of graduates for 2008 and 2009 against appointments; it seems thatMoHCW employed 4,377 of 5,268 graduates. However there is also evidence of internal healthworker migration between MoHCW and City health departments due to salary differentials.

8
Introduction
The development of the Zimbabwean Human Resources for Health (HRH) profile is the first step inthe whole process of developing and implementing an HRH Observatory. In addition the wholeprocess adds to the country’s development of an HRH system that makes decisions based on
verifiable HR information collected from the public, private, private not for profit and faith basedorganizations.
Purpose
The purpose of the HRH country profile is to serve as a tool for:
Providing a comprehensive picture of the Health Workforce situation; Systematically presenting the HRH policies and management situation to help
monitoring the HRH stock and trends; Communication with and between policy-makers and stakeholders; Strengthening the HRH information system by establishing evidence for baselines and
trends; Facilitating information sharing and cross-country comparisons
Methodology
The main source of information to develop this HRH profile was document reviewcomplemented by key informant interviews. Key informant interviews were conducted tosolicit information missing from document reviews. A meeting with the HRH Technical WorkingGroup (TWG) also helped generate valuable information and validate findings from documentreviews and interviews.
The TWG members involve organizations from government, training institutions and NGOs whoplay key roles in HRH in Zimbabwe. The members include the following organizations:
DFID, USAID, EU, World Bank Training institutions: College of Health Sciences, Nursing Schools etc. MoHCW: Personnel unit, Chief Nursing Officer, Zimbabwean Nursing Council, Medical
Council of Zimbabwe, Heads of Directorates including the Planning unit
The Participants for the interviews included:
MoHCW (Health Services Board, HR Directorate, City Health Departments, HealthProfessions Authority, Zimbabwean Nursing Council, Medical Council of Zimbabwe,Directorates of HR, Planning Directorate, HMIS unit, Reproductive Health Unit, HIV/AIDSDirectorate)
Ministry of Finance, Central Statistics Office, Training institutions principals
Scope of the HRH profile
The Zimbabwean HRH profile covers the following areas mainly from the public sector:
Comprehensive picture of the Health Workforce situation in the country Geography, demography, and economic situation. Country’s health services system, its governance and policies HRH stock and trends; HRH production including pre-service and post basic training processes; HRH utilization Stakeholders in the health sector

9
1. Country context
1.1 Geography and demography
Figure 1.1 Map of ZimbabweZimbabwe lies between theLimpopo and Zambezirivers. The country islandlocked, bordered byMozambique on the east,South Africa on the south,Botswana on the West, andZambia on the north andnorthwest. The country hasa land area of 390,757square kilometrescomposed of abundantnatural resources, including8.6 million hectares of
potentially arable land andmore than 5 millionhectares of forests, nationalparks and wildlife estates.Administratively, Zimbabwe
is divided into ten provinces. The climate of Zimbabwe is a blend of cool, dry, sunny winters andwarm, wet summers. The three distinct seasons are the cool dry winter from May to August, a hotdry season during September and October, and a warm wet season from November to April.
According to the Central Statistics Office (CSO, 2010), Zimbabwe has a population of circa 12.12million. Approximately 65% of the population lives in the rural areas while the remaining 35% live inthe urban areas. It has a population growth rate of approximately 0.7% and a population density of29 persons per square kilometre. The Zimbabwe Demographic and Health Survey (ZDHS) (2005-2006) reported a decline in fertility rate to 3.8 births per woman from 5.4 births in 1988. The sexratio for Zimbabwe is almost 93. According to the 2008 Inter-Censal. Demographic Survey(ICDS) 41.1% of the total population is under 15 years of age. For detailed information please seeTables 1.1 and 1.2.
Table 1.1 Percent Population Distribution by Age Group and year (last available year and 10 yearearlier if possible)
Age Group 2002 2007 2008
0–14 years 40.60 % 41.10 % 41.10 %
15–59 years 53.75 % 52.20 % 52.20 %
60+ years 5.65% 6.70 % 6.70 %
Total 100.00 % 100.00 % 100.00 %
Total population 11,631,657 12,040,262 12,121,665
Source: CSO, Census 2002 & ICDS 2008

10
Table 1.2 Population distribution by Sex
Year Total Male FemaleMale
/Female (%)
Growth rate
(%)
2002 11,631,657 5,583,195 6,048,462 94% 1.3
2007 12,040,262 5,794,978 6,245,284 93% 0.3
2008 12,121,665 5,834,157 6,287,508 93% 0.7
Source: CSO, Census 2002 & ICDS 2008
1.2 Economic context.
Zimbabwe experienced a severe economic depression in the last decade. Economical growth hadbeen negative with an average GDP growth of - 5.4% per year from 2000 to 2008. GDP per capita in2008 was US$392.
In 1996 – 2000, the government of Zimbabwe implemented a five year economic developmentprogramme, the Zimbabwe Programme for Economic and Social Transformation (ZIMPREST). It wasenvisaged that the government of Zimbabwe would implement ZIMPREST with financial supportfrom the World Bank, the International Monetary Fund (IMF), and other internationalorganizations. However, the financial aid was not received in a timely manner. Directdevelopment assistance has declined from US$71 million in 1997 to US$7 million in 2002.
Currently domestic revenue is mainly from the agriculture, manufacturing and tourism sectorswhich are the major sources of funding for the national budget.
In 2010 the Government of Zimbabwe (GoZ) has allocated 12.7 % of the total budget to health. Thisis a decline from previous years, with a budget allocation for health 13% in 2006 and 14% in 2008.
Table 1.3 Economic indicators
Indicators 2006 2007 2008
GDP (Million $) 5272 5235 4752
External Debt as % of GDP 150%
External Debt $6.7Bn
Economic Aid as % of GDP NA NA NA
Proportion of Budget on health as % of total GoZ budget 13% (2003) 14%
Proportion GoZ total expenditure on health 137322%1
GDP per capita (in PPP) $454 $438 $392
Proportion of population living below poverty line NA NA NA
Proportion of population in extreme poverty 60% (2003)
Proportion of Under 5 with severe malnutrition NA NA NA
Unemployment rate 80%
Inflation rate (Consumer price) 4% (2010)
Source: MoF, CSO, June 2010; ZDHS 2005-06; MOLSS Poverty Assessment Survey 2003
Note: NA means Not Available (The consultants had no access to this information)
1 This high proportion is due to heavy inflation in 2008. The health budget was prepared in Zimbabweandollars.

11
Table 1.4 shows a constant population growth of 1% in the last 5 years whilst alsodemonstrating a constant negative economic growth rate in the same period.
Table 1.4 Trends of Population growth rate and economic growth rate in the past 5 years
YearPopulation
GrowthEconomicGrowth
2004 1% -4%
2005 1% -4%
2006 2% -4%
2007 0% -3%
2008 1% -10%
1.3 Political context
The Republic of Zimbabwe is a presidential and pluralistic system where the head of the state andthe executive is elected by direct universal suffrage. At central level, the country has a
bicameral parliamentary system composing Members of Parliament (MPs) and Senators votedthrough a general election.
The current structure comprises of decentralized and deconcentrated levels consisting ofprovinces, districts, wards and villages.
Provinces a r e deconcentrated levels of the central government and serve as coordinatingorgans for the central government planning, implementation and supervision. Each province isheaded politically by a Provincial Governor. There are 10 provinces in Zimbabwe, includingHarare and Bulawayo Cities.
Districts a r e decentralized local levels that are the main organ of service delivery topopulations. They are based on a local pluralistic system. The legislative body of the districts is thedistrict council, which is elected through local government elections. The executive body of thedistrict is the executive committee, which is chaired by a mayor in urban areas and councilchairman in rural districts. The administration of the district in urban areas is headed by a TownClerk. In the rural district councils the head of administration is referred to as Chief ExecutiveOfficer and also serves as a secretary to the councils. The local councils are supported byvarious sub-committees of council with various thematic areas, one of which is the SocialServices Sub-committee responsible for health education and social welfare.
Wards are planning and implementation units of the district. They have a similar governingstructure to districts with an elected ward council composed of members from the lowestpolitical-administrative level (villages). An executive committee is responsible for the d a i l yadministration of the ward and for the implementation of ward decisions. It also oversees and isresponsible for the supervision of the health centres in a ward.
Villages are the smallest political-administrative units. The ward councillor is the political voice ofcommunities in the identification, discussion and prioritization of problems and actions to be takenat village level. It can also refer any relevant issue to higher levels.
1.4 Health status
The Zimbabwean health indicators are generally poor making it clear that the country might struggleto meet its health Millennium Development Goals (MDG) targets. Maternal Mortality Rate is very high

12
at 725 per 100,000 deliveries. Table 1.5 also shows that normal delivery represents 32.3 % of nationalhealth morbidity. These indicators may reflect weak reproductive health services and a lack ofavailability of midwives in the health facilities. Infant and Child Mortality Rates are stillhigh standingat 64 and 82 deaths per 1000 live births respectively.
Table 1.5 Main causes of morbidity and mortality
Main causes of morbidity Value (%) Main causes of mortality Value (%)
1. Normal Delivery 32.3 1.ARI 23.3
2. ARI 13.7 2.Pulmonary TB 15.4
3. Direct & In-direct Obstetric 11.8 3.HIV related/ AIDS 15
4. Malaria 9.4 4.Intestinal Infections 14.6
5. Intestinal Infections
7.9 5.Certain Conditions originated
in the Perinatal period
7.2
6. Pulmonary TB 6.2 6.Malaria 6.6
7. Other reasons for contact with
health system
5.9 7.Meningococcal & other
Meningitis
5
8. Abortion
5.1 8.Other reasons for contact with
health system
4.6
9. HIV related/ HIV
4.2 9.Nervous system (except
meningitis
4.3
10. Signs, Symptoms & ill
defined conditions
3.6 10.Signs, symptons and ill-
defined conditions
4.1
Total 100.0 Total 100.0
Source MoHCW, National Health Profile (2008)
Table 1.6 Health indicators
Indicators Both sex Source and year
Life expectancy 43 (41 male; 46 female) ICDS 2008
Crude mortality rate per
1000 population (Adult 15-
60 yrs)
19.7 ICDS 2008
Infant mortality rate 64/1000 ICDS 2008
Under-5 mortality rate 82/1000 ZDHS 2005-06
Maternal mortality rate 725/100,000 NHS 2009-2013
HIV/AIDS prevalence rate 13.7 NHS 2009-2013
% with access to safe water 75 ICDS 2008
% with access to sanitation 69 ICDS 2008
HIV/AIDS prevalence was estimated at 13.7% in 2008 with substantial differences betweengeographical areas and population groups. Social determinants strongly influence the profile ofdistribution and spread of the epidemic.
Life expectancy at birth was estimated at 43 years for both sexes. However the women have ahigher life expectancy at birth of 46 years whilst the men’s is estimated at 41 years.
The ICDS 2008 reports that 75% and 69% of the population have access to safe water and sanitationrespectively.

Human Resources for Health Country Profile Zimbabwe
13
2. Country health system
2.1 Governance
Health service delivery in Zimbabwe is structured in four levels: the central, provincial, districtand community levels. Service delivery is provided by the public sector and privately registeredpractitioners under an Act of Parliament, the Health Services Act 2004, which also includes theparticipation of traditional medicine practitioners.
The public health sector comprises the Ministry of Health and Child Welfare (MoHCW), LocalAuthorities (municipalities), the Ministry of Higher and Tertiary Education, the Ministry ofDefence Forces, Prisons Services Department and the Ministry of Home Affairs, Ministry ofLabour and Social Services (National Social Security Authority - NSSA). According to theMoHCW, the public sector provides 65% of health care services in the country.
The private for-profit sector comprises private for-profit hospitals, mines, nursing homes,maternity homes, industrial clinics and general practitioners, private laboratories and imagingfacilities.
The non-profit sector comprises faith-based organizations – with Zimbabwe Association ofChurch Related Hospitals (ZACH) as an umbrella organization – and other non-governmentalorganizations (NGOs).
All health facilities (public and private) in Zimbabwe are registered under the HealthProfessions Authority (HPA), including their sub-units such as laboratories, pharmacies, nursinghomes etc. All these facilities are guided by the Public Health Acts of Zimbabwe and relevantstatutory instruments in terms of their day-to-day operations. However oversight for the entirehealth system is provided by the MoHCW. All public facilities are supported and supervised bythe MoHCW directly or through provincial and district health offices. Faith-based facilities arerecognized by the MoHCW as part of the public health systems and the norms, standards andprogrammes of the public sector are extended to those facilities. Approximately 35% and 65% ofnational and rural bed capacity respectively are provided by faith-based organizations. Theprivate sector is relatively large in absolute numbers of facilities but is however mainly found inurban areas and cities.
The government funded health system is organized along the national administrative lay-outincluding central, provincial, districts, wards and village administrative and service provisionstructure.. The MoHCW and its units provide the strategic vision and stewardship fornational programmes, setting of norms and standards, and the monitoring of central/referralhospitals. The Ministry is under the political leadership of the Minister of Health andadministratively under the Permanent Secretary.
The MoHCW has 3 Principal Directors who head curative services, preventive services andPolicy, Planning, Monitoring and Evaluation directorates. There are five other principals whoreport directly to the Permanent Secretary and these include Provincial Medical Directors,Director Human Resources, Director Finance and Administration, Chief Internal Auditor and theChief Engineer. The MoHCW structure has 14 other directors reporting to the principaldirectors. These directors are also assisted by their deputies. In addition to these structures, theMoHCW supervises a large number of health related agencies and professional bodies. Some ofthem are under its full supervision such as the National Pharmaceutical Company of Zimbabweand Health Services Board and others are autonomous but handle substantial programmessuch as the National AIDS Council (NAC), Medicines Control Authority of Zimbabwe, and HealthProfessional Authority etc.

Human Resources for Health Country Profile Zimbabwe
14
The MoHCW has devolved structures at the provincial level referred to as Provincial MedicalDirectorate (PMD). They are responsible for the coordination of health programmes at locallevel and to provide technical assistance to districts.
At district and city level, the public health structures split according to their respectivegovernment departments. Health facilities under MoHCW report through a District MedicalOffice (DMO) whilst health facilities under city and urban councils report through theirrespective councils. The DMO is however responsible for planning, coordination and evaluation ofhealth service delivery at district level down to ward and village level.
At Ward level, health centres, dispensaries, health posts and community health workers areunder the administrative responsibility of the Ward Committee. The sub-committee on healthsupervises the activities of the health facilities at this level.

Human Resources for Health Country Profile Zimbabwe
17
Figure 2.1 The MoHCW structure

Human Resources for Health Country Profile Zimbabwe
18
2.2 Service provision
The MoHCW NHS reports that in 1997, 85% of the population lived within 8 km of a primary carefacility. Population movements, as a result of the agrarian reform programme and naturalpopulation growth, have reduced geographic accessibility in some parts of the country. TheAccess to Health Care Services Study (2008), found that most communities live within 5kmradius from their nearest health facilities, whilst 23% between 5 to 10 km and 17% are over10km from their nearest health centre.
The health sector in Zimbabwe could be described as one that has expanded progressively over thelast decade. The first line of care involves community health workers.
The formal MoHCW service delivery facilities are divided into a four tier referral system. Theprimary level, which is the first point in primary health care (PHC) services, is represented by1,231 facilities. These are mainly public, faith based and rural council health centres. Thesecondary level in the referral system is represented by 179 district hospitals. The tertiary level ismainly represented by 7 provincial hospitals and at the apex are quaternary facilities which aremainly national level teaching hospitals. All the facilities from the secondary level to thequaternary provide curative, long term care and rehabilitative services.
Table 2.1 Health Facilities by levels of care and by province
Province PrimaryLevel
Secondary
(1stReferral)
Level
Tertiary
(2nd Referral)level
Quaternary
(3rdReferral)
Level
Total
Harare 45 0 0 8 53
Manicaland 253 36 1 0 290
Mashonaland Central 130 13 1 0 144
Mashonaland East 168 22 1 0 191
Mashonaland West 128 22 1 0 151
Matebeleland North 92 17 0 0 109
Matebeleland South 105 18 1 0 124
Midlands 106 28 1 0 135
Masvingo 170 23 1 0 194
Bulawayo 34 0 0 7 41
Total 1231 179 7 15 1432
Source: MoHCW National Health Strategy 2009 – 2013
In addition to the 1,431 public health institutions curative, long term care and rehabilitativeservices are also available in 1,920 private health facilities. Table 2.2 shows that the largestnumbers of private facilities are medical consulting rooms, with a total of 716 practising roomsnationally. These private for-profit institutions are mostly found in urban areas (Harare,Bulawayo and provincial headquarters). Mission hospitals have 126 hospitals and clinics, whilethe rural district councils have 582 clinics. These last two stakeholders are the main healthservice providers in rural areas.

Human Resources for Health Country Profile Zimbabwe
19
Table 2.2 Registered Private Health Facilities by Province and Service Type
Category HarareBulawa yo
MashEast
MashWest
MashCentral
MatNorth
MatSouth
Masvin go
Midland s
Manica land TOTAL
Dental 89 18 2 7 3 2 - 2 8 10 141
Medicallaboratories 52 14 2 8 3 - - 4 7 7 97
Speech andOccup.
11 - - - - - - - 1 - 12
Physiotherapy 40 14 4 3 2 2 - 1 4 7 77
Nursing homes 12 9 - 5 - - - 4 3 1 34
Consultingrooms
347 147 27 55 15 8 3 17 49 48 716
Nurses'consulting
29 6 14 16 1 - 1 12 7 24 110
Maternityhomes/polyclinics
12 3 2 1 - - - 1 1 - 20
Special clinics 15 8 1 5 2 1 1 6 6 6 51
Pharmacies 132 36 4 16 4 1 1 4 16 15 229
Privatehospitals
13 1 1 4 1 4 5 4 33
Industrialclinics(mnes/compa
91 34 - 13 5 16 5 9 23 12 208
Estate clinics - 3 - - - - 3 - 4 10
Psychologicalservices 51 9 - - 1 - - 1 1 1 64
Operatingtheatres 4 1 - - - - - - - - 5
Dietetics 4 1 - - - - - - - 1 6
Natural therapy 8 2 - - - - - - - - 10
Emergencyservices 12 6 1 1 1 2 1 3 1 28
Radiologyservices 25 9 2 1 - - 2 - 2 2 43
Optical 15 8 - - - - - - 2 1 26
Total 962 325 63 132 41 33 13 69 138 144 1920
Source: Health Professions Authority Register 2009
Preventive health services are mainly provided through the public health units within thenational, district health offices, rural councils and urban councils. These units provide a variety offamily health programmes which include maternal and child health services, HIV/AIDSpreventive services, epidemiological surveillance services and environmental health services.Public health services are coordinated through the preventive health directorate at MoHCWheadquarters.
2.3 Health care financing
The National Health Strategy (1997 – 2007) set the agenda for launching the health sector into thenew millennium. However the implementation of the NHS was frustrated by the economicdepression and limited external aid support. The Government of Zimbabwe has howevercontinued to recognise the importance of the social sectors and health is still within the top fivesectors in terms of resource allocation.
Health care services have been financed from several sources, inclusive of governmentallocations, private voluntary organizations, medical aid / health insurance schemes, direct out ofpocket payments and development assistance from both bilateral and multi-lateral partners.Government has remained the single largest source of health financing in the public sector withtaxation being the major source of revenue.

Human Resources for Health Country Profile Zimbabwe
20
The 2001 National Health Accounts estimated government’s contribution to total healthcareexpenditure to be 39%, while the contribution by households was 29% against 10.8% by employers.
The private sector has continued to contribute to the mobilization of resources for healththrough once-off donations and adoption of wards in public health institutions. However theircontribution has been limited due to the economic depression.
The declining performance of the economy has meant less funding for the health sector. Thesituation has been further exacerbated by the fact that development assistance, which used toaugment expenditure on health services has declined from US$71 million in 1997 to US$7million in 2002. While donor financing was 13% of the total national health expenditure in 1999, by2002 it had reduced to only 1%, a trend which reflects the almost total absence of bilateralassistance. This picture has improved in the recent past, but the effects are still witnessed in thehealth system.
The NHS 2009 – 2013 states that in order to achieve the MDGs Zimbabwe should be spending atleast US$34 per capita per annum on health. This is the minimum required to provide an essentialpackage of health services. The 2009 revised budgetary allocations works out to about US$7per capitaper annum on health, leaving a deficit of about US$27 per capita per annum.
2.4 Health information system
The Ministry of Health and Child Welfare responded to emerging calls for increased availability ofdata for planning, implementation and monitoring of health programmes, by designing aNational Health Information and Surveillance (NHIS) system in 1985. The NHIS system was rolled outnationwide in 1988 followed by a joint evaluation of the system in 1999 conducted by
MoHCW and WHO. Some data collection, analysis, reporting and uniformity issues wereidentified and recommendations for improving the system made. Despite these challenges, theNHIS was awarded a SADC trophy for being the best surveillance system in the region in 2004.
A lot of effort has gone towards improving the NHIS in the past ten years. Posts for HealthInformation Assistants (HIA) were created at district and mission hospital levels. Data collectiontools have been constantly adapted to suite new information needs. Software packages havebeen developed for data capture and storage. HIA training was established at HararePolytechnic, while Integrated Disease Surveillance and Response (IDSR) and basic epidemiologycourses were introduced for staff at all levels. The training was designed to equip staff at theselevels with skills to enable them to use health information for decision making. According to theNational Health Strategy 2009 - 2013,”The training has proved to be very useful and hasenabled operational levels to detect and respond to outbreaks early.”
Weekly sentinel surveillance data is being used to a limited extent at the local levels, especially bythose trained in IDSR and basic epidemiology. Others are collecting data only fortransmission to higher levels. This has resulted in some outbreaks only detected at theprovincial and national levels, with the district or facility unaware of the outbreak. This problem hasbeen compounded by on-going professional migration facilities are forced to accept ever moreinexperienced staff take up posts at the operational level. Furthermore completeness of returnsremains a challenge while no success has been achieved towards monitoring the privatesector.
Extensive support has gone towards providing information technology support to districts,provinces and national levels. Most NHIS departments at the various levels have access tocomputers as well as access to telephone and email facilities. Telephone facilities have howeverbeen unreliable especially at the rural health centre level. Radio communication equipmentlinking Rural Health Centres and District hospitals, has largely been vandalized and is now

Human Resources for Health Country Profile Zimbabwe
21
unreliable.
In addition to the NHIS data the MoHCW also relies on information generated from research. TheNational Institute of Health Research (formerly Blair) is mandated to champion the research function.The NHS 2009 – 2013 reports that the National Institute of Health Research (NIHR) has however
been inactive in the last five years mainly due to professional migration. Research activities atdistrict and provincial levels have virtually stopped.
The NHIS collects limited Human Resources (HR) data, mainly related to Out Patient DepartmentOPD and in-patient daily staff to client ratio information. The MoHCW mainly relies on themonthly Staff Returns introduced by the HR Directorate.
Human Resources for Health Country Profile Zimbabwe
22
3. Health Workers Situation
This section of the report had limitations in the collection of information on unemployment,internal and international migration, age, gender, employment sector distribution, andrural/urban distribution. The main reason for excluding this important information is mainlybecause it was never analysed or collected at the time of the developing the HRH profile.However a detailed account of information challenges and weaknesses of the HumanResources Information System (HRIS) is covered in chapter 6 of this report.
3.1 Health workers stock and trends
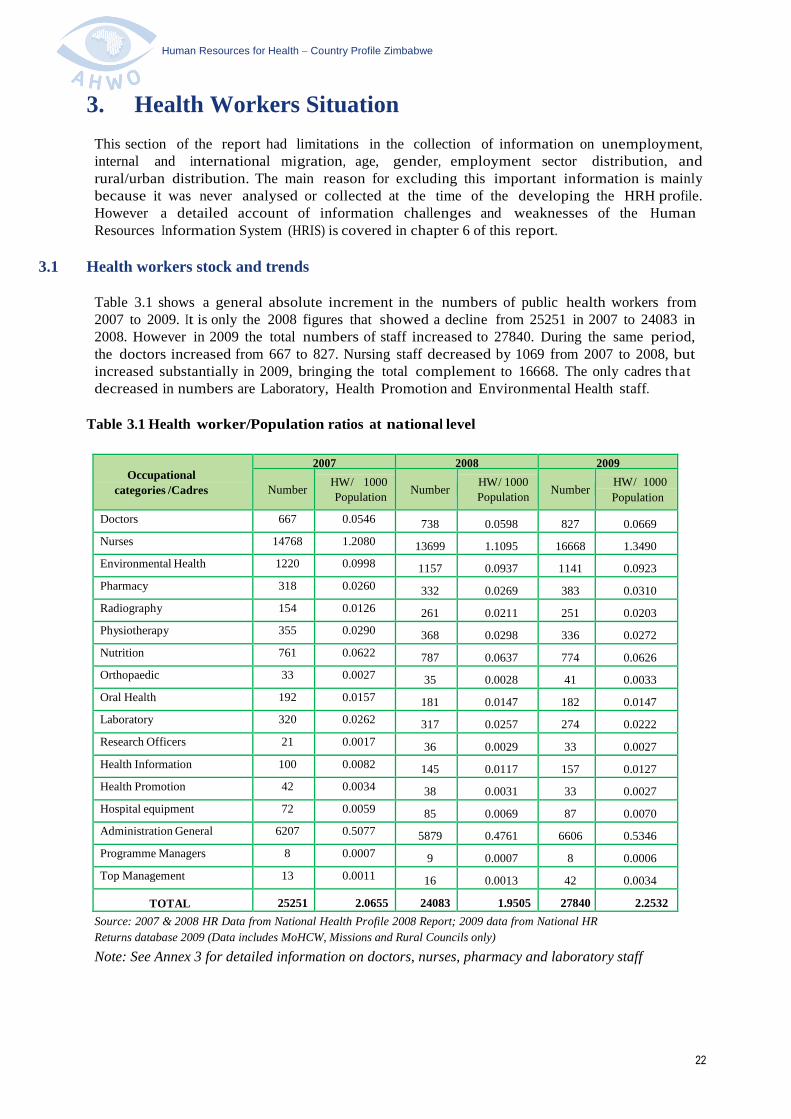
Table 3.1 shows a general absolute increment in the numbers of public health workers from2007 to 2009. It is only the 2008 figures that showed a decline from 25251 in 2007 to 24083 in2008. However in 2009 the total numbers of staff increased to 27840. During the same period,the doctors increased from 667 to 827. Nursing staff decreased by 1069 from 2007 to 2008, butincreased substantially in 2009, bringing the total complement to 16668. The only cadres thatdecreased in numbers are Laboratory, Health Promotion and Environmental Health staff.
Table 3.1 Health worker/Population ratios at national level
Occupational
categories /Cadres
2007 2008 2009
NumberHW/ 1000
PopulationNumber
HW/ 1000
PopulationNumber
HW/ 1000
Population
Doctors 667 0.0546 738 0.0598 827 0.0669
Nurses 14768 1.2080 13699 1.1095 16668 1.3490
Environmental Health 1220 0.0998 1157 0.0937 1141 0.0923
Pharmacy 318 0.0260 332 0.0269 383 0.0310
Radiography 154 0.0126 261 0.0211 251 0.0203
Physiotherapy 355 0.0290 368 0.0298 336 0.0272
Nutrition 761 0.0622 787 0.0637 774 0.0626
Orthopaedic 33 0.0027 35 0.0028 41 0.0033
Oral Health 192 0.0157 181 0.0147 182 0.0147
Laboratory 320 0.0262 317 0.0257 274 0.0222
Research Officers 21 0.0017 36 0.0029 33 0.0027
Health Information 100 0.0082 145 0.0117 157 0.0127
Health Promotion 42 0.0034 38 0.0031 33 0.0027
Hospital equipment 72 0.0059 85 0.0069 87 0.0070
Administration General 6207 0.5077 5879 0.4761 6606 0.5346
Programme Managers 8 0.0007 9 0.0007 8 0.0006
Top Management 13 0.0011 16 0.0013 42 0.0034
TOTAL 25251 2.0655 24083 1.9505 27840 2.2532
Source: 2007 & 2008 HR Data from National Health Profile 2008 Report; 2009 data from National HR
Returns database 2009 (Data includes MoHCW, Missions and Rural Councils only)
Note: See Annex 3 for detailed information on doctors, nurses, pharmacy and laboratory staff

Human Resources for Health Country Profile Zimbabwe
23
In addition to professional health workers, the sector also includes community and traditionalhealth workers. According to the 2008 traditional medicine register there are 3,943 registeredcommunity/ traditional health workers in Zimbabwe. In addition there are 4,013 Village HealthWorkers (VHW) in 7 provinces (excluding Matebeleland north) and 149 Primary Care Counsellors(PCC) supported by the European Support Programme (ESP) in 17 districts including HarareCity. These PCC numbers exclude those supported by The Global Fund. These communi tyhealth workers, VHWs and PCCs are not formal health workers and as such are not paid by thegovernment but supported by various programmes within MoHCW.
The World Health Organization (WHO) recommends that for African countries to meet theMDGs , a population should be covered by a minimum of 2.5 health workers per 1000population. This staffing norm represents a combination of doctors at 0.2 per 1000 population andnurses and mid-wives at 2.3 per 1000 population. Table 3.2 above shows that only the two cityprovinces of Bulawayo (3.6 per 1000) and Harare (2.3 per 1000) seem to have HRH staffing close tothe above standards. The province wi th the lowest health worker population ratio is Manicaland at0.901 per 1000 population.
In addition to professional health workers the sector also includes community and traditionalhealth workers. According to the 2008 traditional medicine register there are 3,943 registeredcommunity/ traditional health workers in Zimbabwe. In addition there are 4,013 Village HealthWorkers (VHW) in 7 provinces (excluding Matabeleland north) and 149 Primary Care Counsellors(PCC) supported by the European Support Programme (ESP) in 17 districts including HarareCity. These PCC numbers exclude those supported by The Global Fund. These communityhealth workers, VHWs and PCCs are not formal health workers and as such are not paid by theGovernment but supported by various programmes within MoHCW.

Human Resources for Health Country Profile Zimbabwe
24
4. HRH Production
The MoHCW has an established training a n d development unit which is headed by a SeniorHuman Resources Officer. The operations of the unit are guided by the HRH Strategic Plan and theHuman Resources Policy. A review of the operational tools and guidelines providedevidence that the MoHCW coordinates both pre and in-service training programmes. TheMoHCW has developed a draft guideline which provides information on the basic requirements forenrolment in each pre-service training programme. The document also highligh ts the traininginstitutions, training programmes offered, entry requirements, duration, qualification awarded, intakesand the foreign quota allocation.
The production, training a n d d e v e l o p m e n t section o f the H R H policy clearly highlights theterms of bonding for government sponsored health workers. The policy s t a t es that, “Allcategories of staff whose training has been facilitated b y Government may be called upon tooffer services to government after qualification. The minimum length of this service will depend onthe length of training and qualification obtained.”
The MoHCW works closely with health p r o f e s s i o n a l councils on standardisation a n ddevelopment of curricula for health workers. However it was observed that training institutionshighly affected by staff attrition have not been reviewing their curricula due to workloadchallenges. This situation mainly affected the College of Health Sciences at the University ofZimbabwe who lost close to 80% of its teaching staff.
Accreditation of health professionals in Zimbabwe rests with the various professional councils. Allforeign trained health workers who wish to practice in Zimbabwe have to go through theirrespective councils for the accreditation of their qualification.
4.1 Pre-service education
Pre–service education for health workers in Zimbabwe is delivered through health traininginstitutions under both the Ministry of Higher and Tertiary Education (MoHTE) and the MoHCW. TheUniversity of Zimbabwe - College of Health Sciences trains doctors, pharmacists, laboratoryscientists, nurses and other professionals at degree and post graduate level. National University ofScience and Technology (NUST), Solusi, Africa University, Zimbabwe Open University (ZOU),Women’s University in Africa and Masvingo State University also provide degree courses forvarious health professional programmes. Harare and Bulawayo Polytechnics colleges offertraining to pharmacy technicians and environmental health officers.
The MoHCW is responsible for providing diploma programmes for MOHCW - run schools ofnursing, dental therapy and environmental health technicians.
However, the involvement of more than one ministry in the training of health workers needsgood coordination between the MoHTE and the MoHCW. This coordination should involve asymbiotic relationship in curricula development, including management of staff (health workerretention schemes), planning and accreditation of health programmes and student outputs. Healthworkers working at training institutions move between the policies and regulations of the two
ministries. Lecturers at the university and the polytechnic colleges are employed by the MoHTE, butare also expected to provide medical services at the University Teaching Hospitals falling under
MoHCW. Each ministry is responsible for paying its workers.

Human Resources for Health Country Profile Zimbabwe
25
Table 4.1 Number of Training Institutions by type of ownership
Type of training institution Type of ownership Total
Public Private not
for profit,
FBOs
Private for
Profitc
Medicine 2 0 0 2
Pharmacy 2 0 0 2
Nursing & Midwifery 20 23 1 44
Laboratory 1 0 0 1
Environnent health 6 0 0 6
Radiology 5 0 0 5
Physiotherapy/ Rehabilitation 2 0 0 2
Dental Technology/ Therapy 1 0 0 1
Dietician/ Food Services 1 0 0 1
Source: MoHCW
FBO: Faith based Organization – Training schools supported by MoHCW
Table 4.1 shows that Zimbabwe has a good number of training schools and programmesoffered by the various Universities and colleges with a total annual output of nearly 2,500health personnel (see Table 4.2).
Table 4.2 Number of entrants and graduates by 2010
Cadre
Number of entrants
2006 2007 2008 2009 Total input
Physicians0 216 195 123 534
Nurses 902 902 902 902 3608
Midwifery 0 0 0 0 NA
Primary Care Nurses 768 768 768 768 3072
BSC HOT - 25 15 14 54
Dental Therapy 19 0 17 19 55
Dental Technicians 10(2005) 0 0 0 10
BSC HPT - 28 15 11 54
Pharmacy Technicians - 48 50 54 152
LaboratoryTechnicians
0 0 25 88 113
Laboratory Scientists0 0 0 0 NA
BDS- 10 11 10 31
HPM- 81 67 65 213
Total1699 2078 2065 2054 7896

Human Resources for Health Country Profile Zimbabwe
26
Cadre
Number of graduates
2006 2007 2008 2009 TotaloutputPhysicians
- 134 158 159 451
Nurses1470 1341 1635 1262 5708
Midwifery155 208 187 233 783
Primary Care Nurses745 737 623 506 2611
BSC HOT - 6 12 11 29
Dental Therapy 16 0 16 18 50
Dental Technicians0 0 10 0 10
BSC HPT- 11 17 23 51
Pharmacy Technicians- 46 48 47 141
LaboratoryTechnicians - 25
2362 110
Laboratory Scientists- 25 23 38 86
BDS- 14 19 14 47
HPM- 42 55 59 156
Total2386 2589 2826 2432 10233
Source: MOHCW Training Intakes and Graduates data collection 2006 - 2009
Note: N/A = Not Available
NB. The consultancy team did not have access to data from all training programmes andinstitutions. This data is therefore incomplete.
Table 4.2 shows that in the last four years the training institutions in Zimbabwe enrolled
approximately 7896 health students. Within the same period approximately 10,233 graduates were
produced. These figures only recognise trainings done locally within Zimbabwe.
The MoHCW has included the post of trainee cadet to its establishment with concurrence of the
Ministry of Finance. These trainee cadet positions are applicable to students at MoHCW and
MoHTE training institutions. In other words, the trainee cadet positions are a form of
guaranteed sponsorship. However the training institutions are responsible for receiving and
processing applications for admission for both local and foreign applicants.
The capacity to produce health professionals in Zimbabwe was heavily impacted by the
economic depression. Health training schools lost many of their teaching staff through
international migration. Professional migration led to the closure of some schools. In 2008, the
teaching activities in some schools were suspended and for instance some medical student interns
left the country to do their practice in foreign countries. The country’s only dental technician
course was also abandoned due to loss of the only 2 tutors in the school. At the time of carrying out
the situation analysis the dental technician programme was still closed. However the Principal Tutor
for the Dental College confirmed that they were in the process of recruiting new tutors for the
schools.

Human Resources for Health Country Profile Zimbabwe
27
4.2 In-service and continuing education
The MoHCW recognizes the importance of staff development and skills updates for its staff in its
HRH policy. However, in-service and continuing education though beneficial to the health
sector in Zimbabwe, has also been viewed as counterproductive by some health managers. The lack
of coordination of existing health training programmes leads to a large drain on the time of health
professionals, and a loss of control of health facilities over the number of staff attending training at
any one time.
A standard calendar for in-service training each year might be one way to reduce the negative
impact of continuing professional development.
4.3 Health workforce requirements
The staff requirements projections were based on the current established posts. The main
assumption in projecting them forward was based on maintaining the current staff
requirements - population ratios. The population growth rate of 0.7 % was used to project the
staffing requirements. The consultants decided to use this simple method but recommend that
much more robust methods could be used to query the current staff establishment posts. These
projections are not costed or budgeted. However it our hope that when the HRH plan is revised both
the staff in-post and projected requirements will be costed and budgeted.
Table 4.3 Projections for health workforce requirements for the coming years
Cadre 2009 2010 2011 2012 2013
Doctors 1767 1779 1792 1804 1817
Physiotherapist 470 473 477 480 483
Med. Laboratory 564 568 572 576 580
Radiographers 461 464 467 471 474
Pharmacists/ Tech 585 589 593 597 602
Nurses 19356 19491 19628 19765 19904
Nutritionists 972 979 986 993 1000
OrthopaedicTechnician
49 49 50 50 50
Health Education 73 74 74 75 75
Environmental 2429 2446 2463 2480 2498

Human Resources for Health Country Profile Zimbabwe
28
5. HRH Utilization
5.1 Recruitment, Deployment and Distribution mechanisms
The Zimbabwean health sector provides one of the most diverse local HRH labour markets
compared to other countries within the region in the sense that the various employers in the
sector apply different strategies to attract and retain their health workers. The MoHCW however
provides the most clear and transparent policies on how staff are deployed and distributed
throughout the MoHCW structure.
Effective June 2005, the Health Services Board (HSB) was established with the sole responsibility of
employer of public health workers under the MoHCW. The HSB is a form of health services
commission found in some other African countries, but structured such that it reports to the
Permanent Secretary of health instead of the Civil Service Commission.
The HSB has since developed an Human Resources for Health Policy in order to guide and
facilitate the optimum production, training, management and retention of human resources for
health in the Zimbabwean public health sector.
The HSB has also decentralised its recruitment functions to the lower levels within the MoHCW
structures. The HSB has given Provincial Medical Departments authority, in conjunction with their
service delivery partners to recruit staff up to the Matron II level. Health institutions have also been
given powers to directly recruit staff below the C5 grade. The HSB retains the powers for recruitment
of staff from Matron I and above including the appointment of senior directors at MoHCW.
Recruitment of all MoHCW staff is based on the staff establishment. However there is a unique
feature in the Zimbabwean MoHCW establishment in that it also includes student positions. In
other words, the MoHCW provides a stipend to students studying in health programmes both
within and outside Zimbabwe. This makes it easy for the MoHCW to plan and estimate the
number of expected graduates that would be recruited each year, but makes it imperative that the
MoHCW collect accurate figures on intakes and continuing students. In the event that training
schools register student numbers that are more than the establishment posts, then the MoHCW
considers those as excess to be absorbed by other partners in the health sector.
5.2 The work environment
The MoHCW pays its health workers through the Salary Services Bureau (SSB). The SSB
maintains the payroll for all health workers working under MoHCW, rural health centres under
councils and all mission health facilities. An assessment of the products of the SSB payroll
suggests that it is an advanced system that could also function appropriately as a human
resources information system for MoHCW. The SSB payroll provides personnel data that
includes names, age, gender, province, district, designation, salary grade and allowances for
health workers.
In spite of these highly developed systems, tools and guidelines, the MoHCW was not spared by the
economic depression that affected the country in the last decade. Anecdotal evidence from draft
reports seems to suggest that the social sectors, education and health were the most affected
by professional migration of teachers and health workers respectively. However,
Human Resources for Health Country Profile Zimbabwe
29
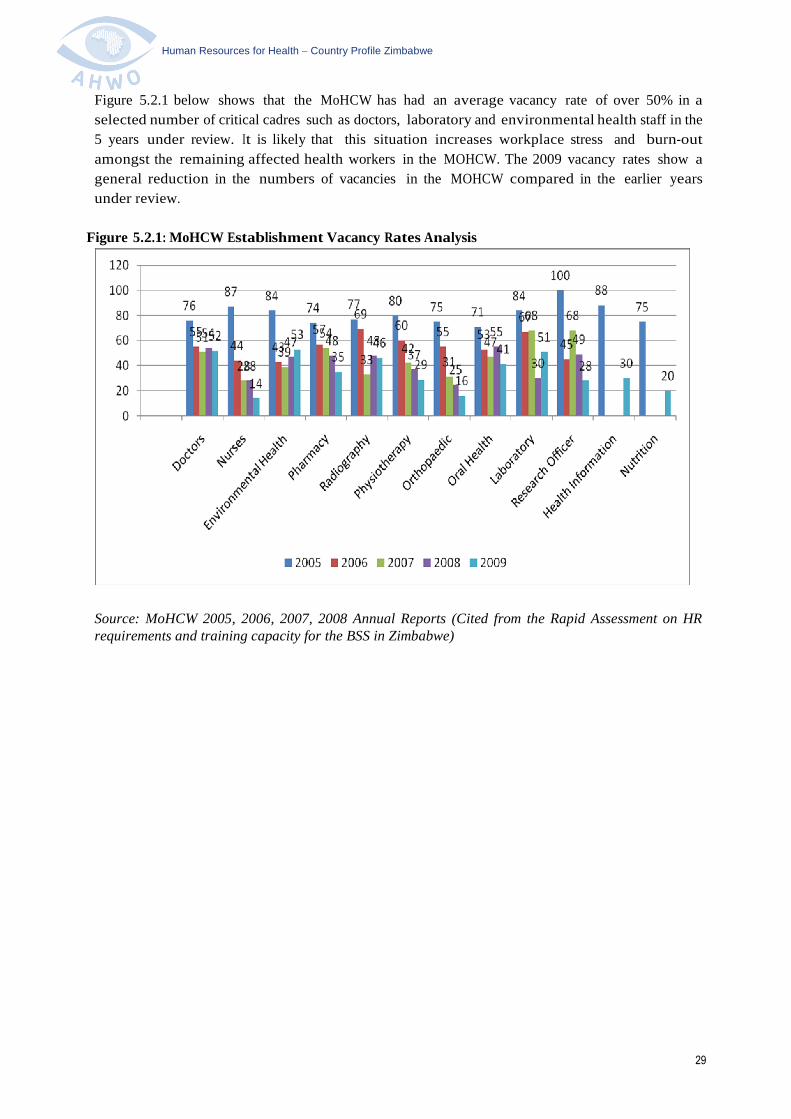
Figure 5.2.1 below shows that the MoHCW has had an average vacancy rate of over 50% in a
selected number of critical cadres such as doctors, laboratory and environmental health staff in the
5 years under review. It is likely that this situation increases workplace stress and burn-out
amongst the remaining affected health workers in the MOHCW. The 2009 vacancy rates show a
general reduction in the numbers of vacancies in the MOHCW compared in the earlier years
under review.
Figure 5.2.1: MoHCW Establishment Vacancy Rates Analysis
Source: MoHCW 2005, 2006, 2007, 2008 Annual Reports (Cited from the Rapid Assessment on HRrequirements and training capacity for the BSS in Zimbabwe)

Human Resources for Health Country Profile Zimbabwe
30
Table 5.2.1 MOHCW Staff Attrition (Resignations and Retirements 2008 & 2009)
Cadres
Central Hospitals Provinces National Totals
Numbers ofResignations
Number ofRetirements
Numbers ofResignations
Number ofRetirements
Numbers ofResignations
Number ofRetirements
2008 2009 2008 2009 2008 2009 2008 2009 2008 2009 2008 2009
Doctors 53 13 21 15 0 1 74 28 0 1
Physiotherapist 25 2 25 2 0 0
Med.Laboratory 31 5 2 0 29 2 60 7 2 0
Radiographers 24 5 24 5 0 0
Pharmacists/ Tech 10 7 10 7 0 0
NurseTutor 21 0 21 0 0 0
Sister inCharge 17 3 0 2 17 3 0 2
RGN/SCN 611 48 33 6 451 37 47 58 1062 85 80 64
Matron II& III 17 2 4 1 17 2 4 1
StudentsNurses 67 10 67 10 0 0
NurseAides 105 15 21 3 38 4 143 19 21 3
Nutritionists 11 0 2 0 11 0 2 0
Rehab.Technician 2 0 2 0 0 0
JRMO 7 0 1 0 7 0 1 0
HealthEducation 3 0 3 0 0 0
Lab.Tech’s 1 0 16 0 16 0 1 0
Environmental 51 0 51 0 0 0
OtherStaff 380 31 38 11 1598 368 97 88 1978 399 135 99
GrandTotal 1384 141 102 23 2204 426 144 147 3588 567 246 170
Source: MOHCW HSB Annual Report 2009
Recognising that the staffing situation in health was worsening, the MoHCW with its remainingcooperating partners implemented an emergency health sector retention scheme in 2008. Theretention scheme is currently being managed by Crown Agents on behalf of the MoHCW andcooperating partners. The retention scheme first began as an emergency public health sectorremuneration scheme for all public health workers under MoHCW, Missions and both urban andrural councils. This was at a time when GoZ could not raise enough resources to pay civilservants; at the peak of the economic depression. The retention scheme was revised in March2009 to only apply to staff at grades C5 and above. The revision also excluded city healthdepartments and town councils.
Human Resources for Health Country Profile Zimbabwe
31
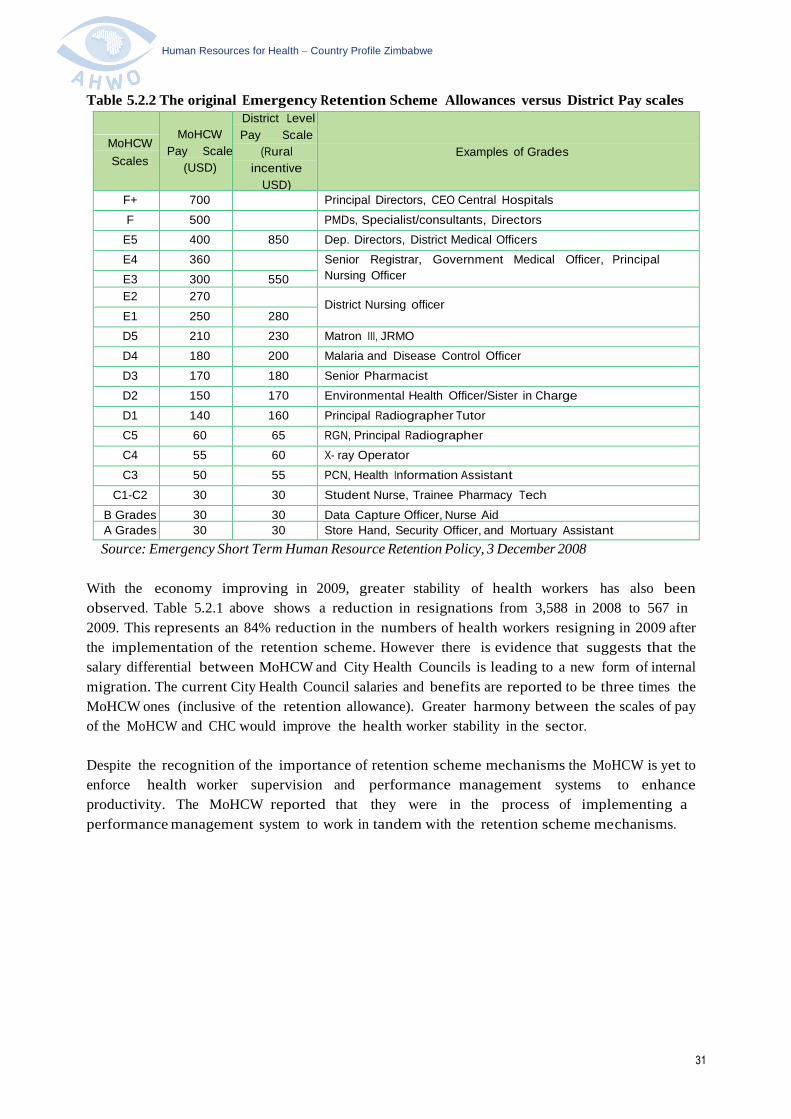
Table 5.2.2 The original Emergency Retention Scheme Allowances versus District Pay scales
MoHCW
Scales
MoHCW
Pay Scale
(USD)
District Level
Pay Scale
(Rural
incentive
USD)
Examples of Grades
F+ 700 Principal Directors, CEO Central Hospitals
F 500 PMDs, Specialist/consultants, Directors
E5 400 850 Dep. Directors, District Medical Officers
E4 360 Senior Registrar, Government Medical Officer, Principal
Nursing OfficerE3 300 550
E2 270District Nursing officer
E1 250 280
D5 210 230 Matron III, JRMO
D4 180 200 Malaria and Disease Control Officer
D3 170 180 Senior Pharmacist
D2 150 170 Environmental Health Officer/Sister in Charge
D1 140 160 Principal Radiographer Tutor
C5 60 65 RGN, Principal Radiographer
C4 55 60 X- ray Operator
C3 50 55 PCN, Health Information Assistant
C1-C2 30 30 Student Nurse, Trainee Pharmacy Tech
B Grades 30 30 Data Capture Officer, Nurse Aid
A Grades 30 30 Store Hand, Security Officer, and Mortuary Assistant
Source: Emergency Short Term Human Resource Retention Policy, 3 December 2008
With the economy improving in 2009, greater stability of health workers has also been
observed. Table 5.2.1 above shows a reduction in resignations from 3,588 in 2008 to 567 in
2009. This represents an 84% reduction in the numbers of health workers resigning in 2009 after
the implementation of the retention scheme. However there is evidence that suggests that the
salary differential between MoHCW and City Health Councils is leading to a new form of internal
migration. The current City Health Council salaries and benefits are reported to be three times the
MoHCW ones (inclusive of the retention allowance). Greater harmony between the scales of pay
of the MoHCW and CHC would improve the health worker stability in the sector.
Despite the recognition of the importance of retention scheme mechanisms the MoHCW is yet to
enforce health worker supervision and performance management systems to enhance
productivity. The MoHCW reported that they were in the process of implementing a
performance management system to work in tandem with the retention scheme mechanisms.

Human Resources for Health Country Profile Zimbabwe
32
6. Governance for HRH
The governance of health workers in Zimbabwe was transferred from the public servicecommission in 2005to the Health Services Board, which is responsible for all matters ofconditions of service, recruitment, deployment, hiring of staff or providing local incentives toretain health staff in the MoHCW. Other public sector health institutions determine their ownconditions of service without any consultation or cooperation with the MoHCW. Each cityhealth department determines their own salaries based on the Urban Councils Act 1995 whichrestricts the allocation of staff salaries to 30% of council revenue. The private for profit healthfacilities pay their staff based on their internal remuneration policies. There is currently noofficial source providing comparative differentials in HR and remuneration policies.
6.1 HRH policies and plans
The MoHCW, through the HSB, has developed a Human Resources for Health Strategic Plan
2010 – 2014 in order to operationalise the HRH policy at all levels of the health service delivery
system. The HRH strategic plan includes broad strategies on HR planning and financing
(HIV/AIDS workplace policies, platforms for strategic partnerships; HRH skills mix requirements;
HRIS and planning; HRH Observatory establishment). In addition, the plan has detailed
strategies on HRH production, training and development, deployment, retention utilization,
management and HRH information and research.
The HRH strategic plan expands on the broad objectives of the NHS 2009 – 2013. Thedevelopment of an HRH country profile is the first step in providing HRH mapping and situationanalysis that will guide strategic decisions on HR planning, financing and implementation.
6.2 Policy development, planning and managing for HRH
Policy development, planning and management of HRH under MoHCW is mandated to the
Health Services Board (HSB) according to the Health Services Act (Chapter 15:16). However the
HSB has made significant delegation of responsibilities and functions to local levels. These
include recruitment, promotions, and handling of disciplinary cases. These delegatory functions
have been made at three different levels, MoHCW HQ, PMDs and DMOs.
6.3 Professional Regulation
The HPA is an umbrella organization consisting of seven professional councils; Medical and
Dental Practitioners Council; Nurses Council; Pharmacists Council; Environmental Health
Practitioners Council; Medical Rehabilitation Practitioners Council; Medical Laboratory and Clinical
Scientist Council and the Allied Health Practitioners Council. The ethical conduct of health
professionals is regulated by the different councils, which are the registration authorities. They are
therefore critical stakeholders in instilling professional discipline, curriculum development,
examinations and research.
In addition to professional councils some of the critical cadres have registered professional
associations. These include the Zimbabwe Medical Doctors Association, Zimbabwe Nurses
Association, etc. The professional associations are also critical stakeholders in lobbying for
professional development, and participating in bi-partite negotiating fora with government
(negotiations for wages and conditions of service).

Human Resources for Health Country Profile Zimbabwe
33
6.4 HRH information
The management and development of human resources information systems (HRIS) is key to
assisting in the planning and rationalisation of HRH decision making processes. The current HR
policy recognises the lack of a central sectorwide database. However there are many possible
sources for HR information in the health sector. When combined these databases could provide most
of the data for a central HRIS database that would also include age, gender, type of employer,
urban/rural split, and attrition information. These include:
Salary Services Bureau: This mainly contains HR information for government workers, missions,rural district councils and lecturers under the Ministry of Higher and Tertiary Education.
MoHCW Establishment Returns: This is a monthly report which covers MoHCW healthinstitutions and diverse set of independent authorities (grant aided institutions and statutorybodies), totalling 17 reporting units.
Crown Agents Health Worker Retention scheme payrolls: This database covers MoHCW, missionsand rural council employees from grades C5 and above.
City Health Departments/Town Council payrolls: These are various payrolls from the differenturban councils.
Other Government Departments: This includes payrolls for health facilities under the Ministryof Defence, Prisons Services Department, Zimbabwe Republic Police, Ministry of Labour andSocial Services (National Social Services Authority – NSSA).
Private Health Sector payrolls: These are various payrolls from private health facilities workingthroughout Zimbabwe.
Professional Councils: The various professional councils hold registration databases for theirrespective members.
The situation analysis on the HRIS suggests that the public sector currently has the most well-organized and reported HRH information compared to other sectors. However this informationsuffers from inconsistent and inadequate reporting. Most of the non-public sector sources of HRHdata heavily rely on manual processes and there was no evidence of systematic HR reports. HRH datafrom the uniformed sources (defense, police and prisons) could not be accessed due to the nature ofthe institutions in the context of Zimbabwe.
An effort to install an HRIS was made in 2008 with funding from EU for MoHCW institutions only.MoHCW installed MySQL (Structured Query Language) at head office, all central hospitals and allprovincial offices. District hospitals have remained outside this system. The challenges cited includelack of technical staff to provide systems maintenance when breakdowns occur, tendency of
rotating trained staff by institutions and poor communication networks between districts andprovinces for data collection. The system is not networked and data entry is incomplete. TheHRIS is not linked to the health information system although this remains an ultimate objective.There are no standing reporting requirements for the private sector, other departments with healthworkforce and NGOs and professional councils feeding into the HRIS.The HRIS therefore remains fragmented.

Human Resources for Health Country Profile Zimbabwe
34
6.5 HRH research
The area of HRH research remains weak due to lack of funding. The few HRH research activities
conducted to date include “A Rapid Assessment of HR Requirements and Training Capacity for the
Basic Services Sector in Zimbabwe”,2 a recent study on workforce internal migration3 and a feasibility
study on HRH retention4. The HR Directorate has placed research activities high on the agenda by
including a research objective and strategies in the HRH Strategic Plan 2010 – 2014. The list of
HRH research topics are yet to be developed through stakeholder consultations.
6.6 Stakeholders in HRH
According to the HRH Policy for Zimbabwe the HSB/MoHCW will:-
support mechanisms and processes for co-ordination and collaborationwith stakeholders (e.g. inter-Ministerial committees, Health ProfessionsAuthorities, development partners, private sector);
clarify the roles of key stakeholders;
develop, implement and monitor MoU with relevant organizations andinstitutions; and
strengthen mechanisms for community involvement in prevention, care,treatment and good governance of health services, in line with the HealthSector reforms.
INSTITUTIONAL FRAMEWORK SUPPORTING HRH POLICY IMPLEMENTATION HRH
Functions and responsibilities are spread over many institutions, facilities andprogrammes. The HSB and the MoHCW will collaborate with the following institutions toensure timely financing, implementation and monitoring of this HRH Policy. Theimplementation, monitoring and review of this Policy require firm collaboration between allstakeholders, among whom many HRH functions and responsibilities are spread. The followingMinistries/organisations shall be central to the implementation and success of this HRH Policy:
HEALTH SERVICE BOARD
The HSB is a statutory body created by an Act of Parliament. It employs all health workers in thePublic Sector. It sets and reviews conditions of service and is responsible for recruitment,advancement, promotion, transfer and disciplinary matters. The HSB, together with theMoHCW, will be responsible for policy formulation. The HSB will, from time to time, ensure thesuccess of this Policy through the issuing of the necessary policy guidelines particularly thoserelated to HRH management and development. The HSB will endeavour to ensure thatresources for the implementation of this Policy are mobilised, and will also establish a co-ordinating mechanism to monitor the implementation of this Policy.
MINISTRY OF HEALTH AND CHILD WELFARE
The MoHCW will ensure the mobilisation of human, material and financial resources for the
2Authors Ankie van den Broek, Ria van Hoewijk, Vuyelwa T. Sidile-Chitimbire and Maria Mbudzi, (Draft May 2010), A
Rapid Assessment of HR Requirements and Training Capacity for the Basic Services Sector in Zimbabwe, DevelopmentPolicy & Practice3
Mark Wheeler, (Draft June 2010), Internal Migration, Ministry of Health4
Feasibility study on the Crown Agents managed Health Worker Retention Scheme

Human Resources for Health Country Profile Zimbabwe
35
successful implementation of this Policy, working closely with hospital management boards andPMDs.
MINISTRY OF FINANCE
The MoF is responsible for setting long-term macro-economic policies and plans. It is alsoresponsible for allocating the financial resources to different expenditure points within thecountry. Salaries and allowances for health workers are financed by the MoF. The success of thisPolicy, to a great extent, will depend on the active support of the MoF.
MINISTRY OF PUBLIC WORKS
The infrastructure in the institutions of MoHCW statutorily belongs to the Ministry of PublicWorks, which is responsible for the installation and maintenance of the infrastructure.Electricity, water and sewer reticulations and boilers, if not properly maintained, will constituteoccupational and health hazards. Functional infrastructure is one of the key motivationalfactors for HRH. Government buildings will need to receive adequate care and maintenance. TheMinistry of Public Works will be engaged to decentralise maintenance and repair of healthinfrastructure to health institutions, while it remains the supervisory agency for all work. ThisMinistry will be expected to play a crucial role in ensuring a conducive working environment forHRH.
MINISTRY OF NATIONAL HOUSING AND SOCIAL AMENITIES
All Government buildings are managed by the Ministry of National Housing and SocialAmenities. It is responsible for the construction of Government buildings, including staffquarters. The HSB intends in collaboration with stakeholders to initiate housing schemes forhealth workers. This Ministry is central to the realisation of this initiative.
MINISTRY OF LANDS AND RESETTLEMENT AND MINISTRY OFAGRICULTURE, MECHANISATION AND IRRIGATION DEVELOPMENT
The Ministry of Lands and Lands Resettlement and the Ministry of Agriculture, Mechanisation andIrrigation Development is responsible for all State land. The initiative to provide health workerswith accommodation, both private and institutional, as well as farming space will require land.These Ministries will be approached by the HSB with a list of its needs.
MINISTRY OF HIGHER AND TERTIARY EDUCATION
The University of Zimbabwe College of Health Sciences (UZ-CHS), NUST and all Polytechniccolleges fall under the MoHTE. The two universities produce undergraduate and postgraduatemedical practitioners. The lecturers play a critical role in the training of vital health workers and theproduction and development of human resources. There is need to strengthen thepartnership between the MoHCW and MoHTE through a co-operation agreement so as toensure success in the implementation of this Policy.
HEALTH PROFESSIONS AUTHORITY AND HEALTH PROFESSIONS COUNCILSThe HPA is an umbrella organisation consisting of seven professional councils: PharmacistsCouncil; Medical Laboratory and Clinical Scientists Council; Medical and Dental PractitionersCouncil; Nurses Council; Environmental Health Practitioners Council; Medical RehabilitationPractitioners Council and the Allied Health Practitioners Council.The ethical conduct of Health Professionals is regulated by different councils, which are theregistration authorities. They are therefore critical stakeholders in instilling professionaldiscipline, curricula development and research.

Human Resources for Health Country Profile Zimbabwe
36
ZIMBABWEAN ASSOCIATION OF CHURCH-RELATED HOSPITALS
These health facilities belong to, and are managed by faith-based institutions. The majority of thehealth workers working in these FBOs are financed through Government grants through theMoHCW. Sixteen hospitals under this Association operate as district referral hospitals. TheMoHCW and ZACH will, therefore, review the legal and procedural framework for theircollaboration and sign a MoU.
INTERNATIONAL AID ORGANIZATIONS AND COOPERATING PARTNERS
The MOHCW/HSB works with cooperating partners and AID organizations such as theWorld Bank , DFID, USAID, European Union, PEPFAR and Global Fund. The internationalorganizations usually bring in both technical and financial assistance into the health sector.
HRH TASKFORCE
HSB will establish and monitor an HRH Taskforce to co-ordinate the financing, implementation andmonitoring of the HRH Policy and Plans. This will be a multi-stakeholder team, with
representatives from identified Ministries, Departments, institutions and organizations. TheHSB will provide the HRH Taskforce with a clear mandate and budget and a time frame. TheTaskforce will meet on a regular basis and report to the HSB on a regular basis.
Human Resources for Health Country Profile Zimbabwe
37
Annex 1: Definition of Health workforce Data
Health Workforce: Aggregated Data
In the aggregated data, the health workforce is grouped into the following 10 categories:
PhysiciansIncludes generalists and specialists.
NursesIncludes professional nurses, auxiliary nurses, enrolled nurses and other nurses, such as dentalnurses and primary care nurses.
MidwivesIncludes professional midwives, auxiliary midwives and enrolled midwives. Traditional birthattendants, who are counted as community health workers, appear elsewhere.
DentistsIncludes dentists, dental assistants and dental technicians
PharmacistsIncludes pharmacists, pharmaceutical assistants and pharmaceutical technicians
Laboratory workersIncludes laboratory scientists, laboratory assistants, laboratory technicians and radiographers.
Environment & public health workersIncludes environmental and public health officers, sanitarians, hygienists, environmental andpublic health technicians, district health officers, malaria technicians, meat inspectors, publichealth supervisors and similar professions.
Community health workersIncludes traditional medicine practitioners, faith healers, assistant/community health educationworkers, community health officers, family health workers, lady health visitors, health extensionpackage workers, community midwives, institution-based personal care workers and traditionalbirth attendants.
Other health workersIncludes a large number of occupations such as dieticians and nutritionists, medical assistants,occupational therapists, operators of medical and dentistry equipment, optometrists andopticians, physiotherapists, podiatrists, prosthetic/orthetic engineers, psychologists, respiratorytherapists, speech pathologists, medical trainees and interns.
Health management and support workersIncludes general managers, statisticians, lawyers, accountants, medical secretaries, gardeners,computer technicians, ambulance staff, cleaning staff, building and engineering staff, skilledadministrative staff and general support staff.

Human Resources for Health Country Profile Zimbabwe
38
Annex2: Detailed HRH Stock Data for Critical cadres (Doctors, Nurses, Pharmacy andLaboratory Staff)
Occupational category/cadre
TotalNumber
HarareBulawa
yoMat
SouthMat
NorthManic a
LandMash
Centra lMashWest
Midlands
Masvingo
MashEast
Establish
ment
Inpo stRate
%
Population12440077 1986949 709058 693715 748841 1666617 1057405 1300921 1555145 1402653 1318774
Doctors 689 349 168 22 15 26 16 29 23 17 24 1567 44%
HOD Specialists 11 6 3 0 0 0 0 0 2 0 0 26 42%
Specialist Consultant 67 27 30 0 0 7 0 1 0 1 1 321 21%
EPI Disease Control Officer/PEDCO 2 0 0 0 0 0 0 1 0 0 1 8 25%
Provincial Maternal & Child Health MedicalOfficer
2 0 0 0 0 0 0 1 0 0 1 8 25%
Medical Superintendent 11 7 0 0 0 0 0 0 2 1 1 3 13 54%
Senior Registrar 27 25 2 0 0 0 0 0 0 0 0 91 30%
Junior Registrar 27 27 0 0 0 0 0 0 0 0 0 93 29%
District Medical Officer 12 0 0 1 1 0 2 1 3 1 3 59 20%
Senior House Officer 30 30 0 0 0 0 0 0 0 0 0 63 48%
Government Medical Officer/Training posts 160 18 5 21 14 19 14 23 17 14 15 425 38%
Hospital Medical Officer 58 24 34 0 0 0 0 0 0 0 0 124 47%
Senior Resident Medical Officer 113 77 36 0 0 0 0 0 0 0 0 172 66%
Junior Resident Medical Officer173 115 58 0 0 0 0 0 0 0 0 164 105%
Nursing Staff 17032 4309 2460 991 947 1476 1160 1184 1684 1606 1215 19356 88%
Deputy Director, Nurse Training andAdministration
0 0 0 0 0 0 0 0 0 0 0 1 0%
Matron 1/Principal Nursing Officer 3 2 1 0 0 0 0 0 0 0 0 6 50%
Provincial Nursing Officer/ Primary CareCoordinator
6 0 0 1 1 1 1 0 1 1 0 8 75%
Principal Tutor(PGH approved ) 8 3 4 0 0 0 0 0 1 0 0 9 89%

Human Resources for Health Country Profile Zimbabwe
39
Occupational category/cadre TotalNumber
HarareBulawa
yoMat
SouthMat
North
Manica Land
MashCentra
l
MashWest
Midlands
Masvingo
MashEast
Establishment
Inpo stRate
%
Nurse Training and Administration Officer0 0 0 0 0 0 0 0 0 0 0 1 0%
Provincial Child Welfare Officer (EPI, IMCI,NPA, OVC) 5 0 0 0 1 0 1 1 1 1 0 8 63%Provincial Reproductive & Mental HealthOfficer 0 0 0 0 0 0 0 0 0 0 0 8 0%
District Nursing Officer 51 0 0 6 6 6 5 6 7 7 8 58 88%
Matron 11/allocation Officer 35 17 12 0 0 1 0 1 2 1 1 42 83%
Clinical Officer/Senior/Principal 35 20 0 0 0 3 4 2 2 1 3 51 69%
Matron111 119 41 22 3 4 9 9 9 9 5 8 142 84%
Nurse Tutor/Senior/Principal 139 54 31 0 6 4 5 8 15 7 9 248 56%
Sister In Charge/Clinical Instructor 609 173 83 15 27 61 48 53 65 53 31 877 69%
Trainee Midwife 9 9 0 0 0 0 0 0 0 0 0 270 3%
Sister/Senior 7092 1707 1065 398 348 704 393 511 721 690 555 7688 92%
State Certified Nurse/ Senior/Principal 1922 98 108 248 336 145 247 212 88 251 189 2182 88%
Student Nurse & Trainee Primary CareNurse 4572 1517 877 89 0 370 218 186 580 466 269 5303 86%
Nurse Aides 2427 668 257 231 218 172 229 195 192 123 142 2454 99%
Primary Care Nurse 2536 NA NA NA NA NA NA NA NA NA NA NA NA
Pharmacy Staff 252 72 28 9 13 29 20 23 14 16 28 585 43%
Deputy Director, Pharmacy Logistics &Research 0 0 0 0 0 0 0 0 0 0 0 1 0%
Pharmacy Logistics & Research Officer 1 1 0 0 0 0 0 0 0 0 0 2 50%
Chief Pharmacist 2 2 0 0 0 0 0 0 0 0 0 5 40%
Pharmacist Senior/Principal (TrainingOfficer) 0 0 0 0 0 0 0 0 0 0 0 6 0%
Provincial Pharmacist 2 0 0 0 0 0 0 1 0 0 1 8 25%
Pharmacist Senior/Principal 40 18 11 0 0 3 1 3 1 0 3 124 32%
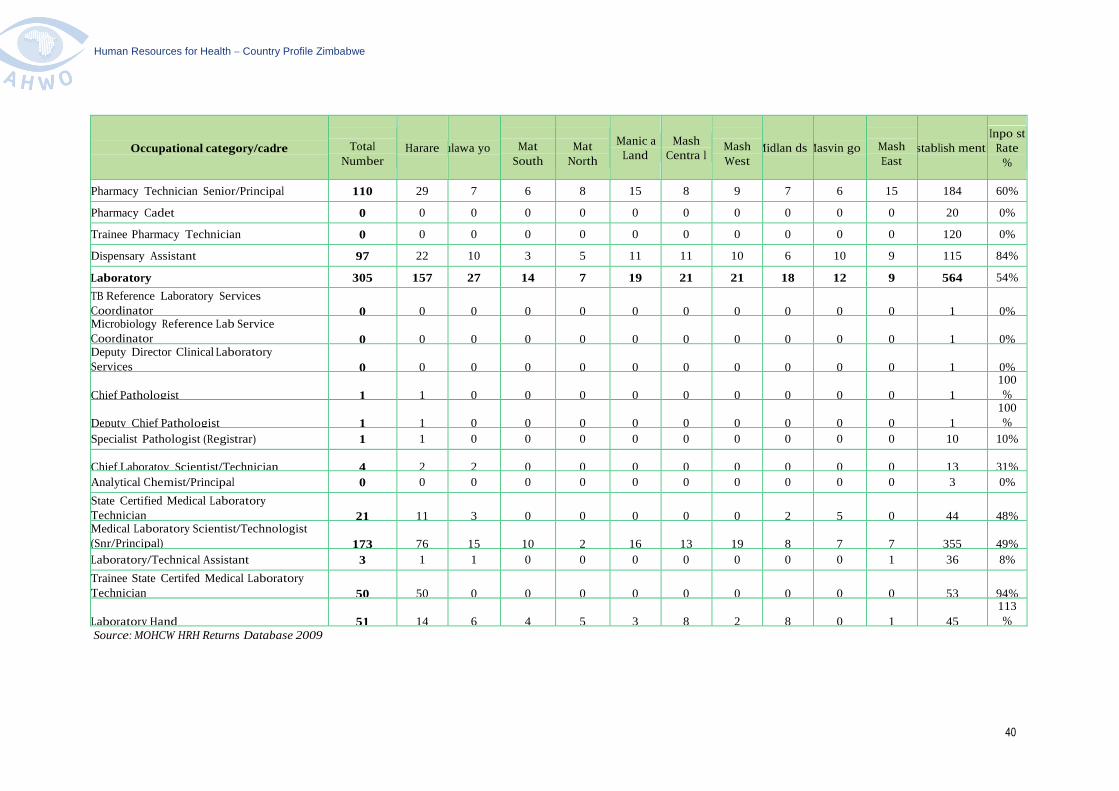
Human Resources for Health Country Profile Zimbabwe
40
Occupational category/cadre TotalNumber
Harare ulawa yo MatSouth
MatNorth
Manic aLand
MashCentra l
MashWest
Midlan dsMasvin go MashEast
stablish mentInpo st
Rate%
Pharmacy Technician Senior/Principal 110 29 7 6 8 15 8 9 7 6 15 184 60%
Pharmacy Cadet 0 0 0 0 0 0 0 0 0 0 0 20 0%
Trainee Pharmacy Technician 0 0 0 0 0 0 0 0 0 0 0 120 0%
Dispensary Assistant 97 22 10 3 5 11 11 10 6 10 9 115 84%
Laboratory 305 157 27 14 7 19 21 21 18 12 9 564 54%
TB Reference Laboratory ServicesCoordinator 0 0 0 0 0 0 0 0 0 0 0 1 0%Microbiology Reference Lab ServiceCoordinator 0 0 0 0 0 0 0 0 0 0 0 1 0%Deputy Director Clinical LaboratoryServices 0 0 0 0 0 0 0 0 0 0 0 1 0%
Chief Pathologist 1 1 0 0 0 0 0 0 0 0 0 1
100%
Deputy Chief Pathologist 1 1 0 0 0 0 0 0 0 0 0 1
100%
Specialist Pathologist (Registrar) 1 1 0 0 0 0 0 0 0 0 0 10 10%
Chief Laboratoy Scientist/Technician 4 2 2 0 0 0 0 0 0 0 0 13 31%
Analytical Chemist/Principal 0 0 0 0 0 0 0 0 0 0 0 3 0%
State Certified Medical LaboratoryTechnician 21 11 3 0 0 0 0 0 2 5 0 44 48%Medical Laboratory Scientist/Technologist(Snr/Principal) 173 76 15 10 2 16 13 19 8 7 7 355 49%
Laboratory/Technical Assistant 3 1 1 0 0 0 0 0 0 0 1 36 8%
Trainee State Certifed Medical LaboratoryTechnician 50 50 0 0 0 0 0 0 0 0 0 53 94%
Laboratory Hand 51 14 6 4 5 3 8 2 8 0 1 45
113%
Source: MOHCW HRH Returns Database 2009

Human Resources for Health Country Profile Zimbabwe
41
Table 3.5 Province distribution of health workers per 1000 population
Occupationalcategory/cadr
TotalNumber Harare Bulawayo Mat South Mat North
ManicaLand
MashCentral
MashWest Midlands Masvingo Mash East
Population 12440077 1986949 709058 693715 748841 1666617 1057405 1300921 1555145 1402653 1318774
Doctors 689 0.1756 0.2369 0.0317 0.0200 0.0156 0.0151 0.0223 0.0148 0.0121 0.0182
Nurses 17032 2.1687 3.4694 1.4285 1.2646 0.8856 1.0970 0.9101 1.0829 1.1450 0.9213
EnvironmentalHealth 1034 0.0000 0.0000 0.1110 0.1696 0.0972 0.1504 0.1030 0.1022 0.0656 0.0940
Pharmacy 252 0.0362 0.0395 0.0130 0.0174 0.0174 0.0189 0.0177 0.0090 0.0114 0.0212
Radiography 174 0.0302 0.0409 0.0115 0.0040 0.0054 0.0123 0.0108 0.0103 0.0071 0.0091
Physiotherapy 350 0.0312 0.0635 0.0101 0.0174 0.0144 0.0265 0.0169 0.0096 0.0143 0.0864
Nutrition 804 0.0861 0.0959 0.0432 0.0494 0.0486 0.0671 0.0623 0.0649 0.0535 0.0675
Orthopaedic 33 0.0096 0.0169 0.0000 0.0000 0.0006 0.0000 0.0008 0.0000 0.0000 0.0000
Oral Health 200 0.0287 0.0127 0.0101 0.0227 0.0102 0.0208 0.0131 0.0154 0.0128 0.0091
Laboratory 305 0.0790 0.0381 0.0202 0.0093 0.0114 0.0199 0.0161 0.0116 0.0086 0.0068
Research Officers 0 0.0000 0.0000 0.0000 0.0000 0.0000 0.0000 0.0000 0.0000 0.0000 0.0000
Health Information 147 0.0352 0.0240 0.0058 0.0040 0.0036 0.0095 0.0092 0.0058 0.0057 0.0061
Health Promotion 36 0.0010 0.0000 0.0014 0.0040 0.0018 0.0028 0.0054 0.0019 0.0036 0.0068
Hospital
equipment 97 0.0257 0.0099 0.0000 0.0067 0.0036 0.0038 0.0031 0.0039 0.0050 0.0053
Administration
General 5983 0.5451 1.1508 0.2897 0.4006 0.3588 0.5211 0.3882 0.4585 0.4420 0.4519
ProgrammeManagers 0 0.0000 0.0000 0.0000 0.0000 0.0000 0.0000 0.0000 0.0000 0.0000 0.0000
Top Management 29 0.0060 0.0169 0.0000 0.0000 0.0000 0.0009 0.0008 0.0006 0.0007 0.0008
Total 27165 3.2583 5.2154 1.9763 1.9897 1.4742 1.9661 1.5797 1.7915 1.7873 1.7046
Source: MoHCW Staff Returns (2009);
NB: The regional distribution excludes Harare, Bulawayo City Health Departments, Town Councils, Uniformed forces and the private sector