Embed Size (px)
Citation preview

., _ ,“W. 1 sp.
United States General Accounting Office
Briefing Report to the Chairman, - Committee on Education and Labor, House of Representatives
1989 EFFECTIVE SCHOOLS PROGRAMS
Their Extent and Characteristics
United States General Accounting Office Washington, D.C. 20548
Human Resources Division
B-235384
September 13, 1989
The Honorable Augustus F. Hawkins Chairman, Committee on Education and Labor House of Representatives
Dear Mr. Chairman:
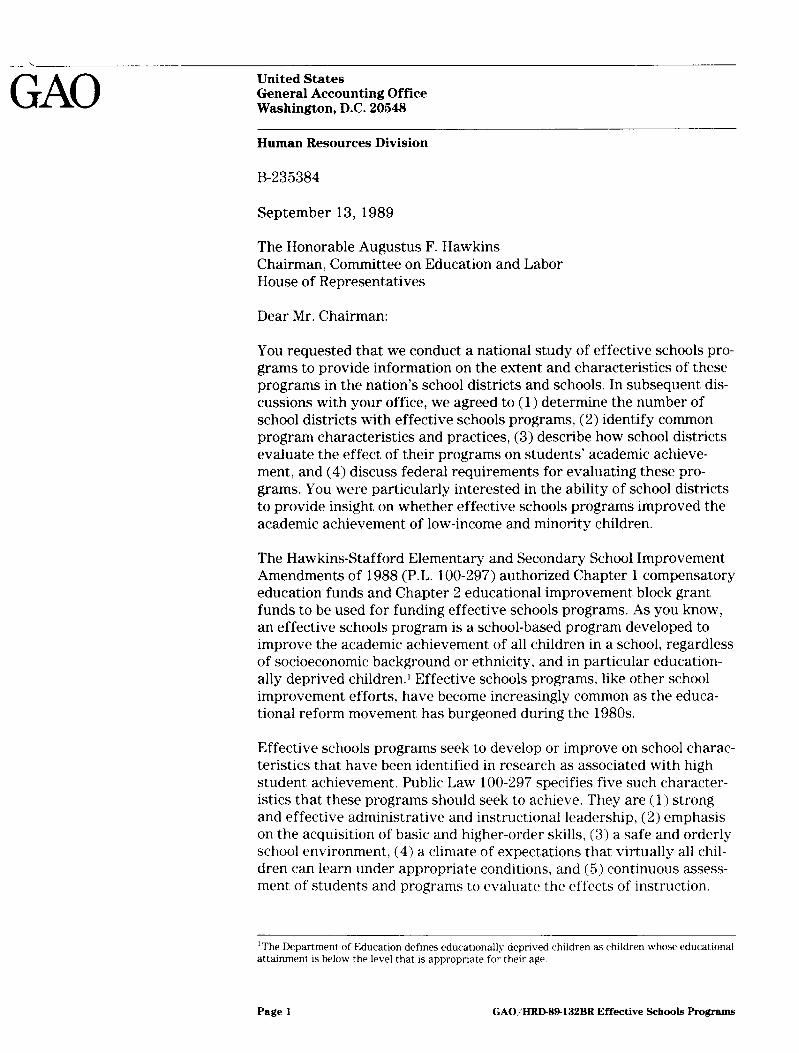
You requested that we conduct a national study of effective schools pro- grams to provide information on the extent and characteristics of these programs in the nation’s school districts and schools. In subsequent dis- cussions with your office, we agreed to (1) determine the number of school districts with effective schools programs, (2) identify common program characteristics and practices, (3) describe how school districts evaluate the effect of their programs on students’ academic achieve- ment, and (4) discuss federal requirements for evaluating these pro- grams. You were particularly interested in the ability of school districts to provide insight on whether effective schools programs improved the academic achievement of low-income and minority children.
The Hawkins-Stafford Elementary and Secondary School Improvement Amendments of 1988 (P.L. 100-297) authorized Chapter 1 compensatory education funds and Chapter 2 educational improvement block grant funds to be used for funding effective schools programs. As you know, an effective schools program is a school-based program developed to improve the academic achievement of all children in a school, regardless of socioeconomic background or ethnicity, and in particular education- ally deprived children.’ Effective schools programs, like other school improvement efforts, have become increasingly common as the educa- tional reform movement has burgeoned during the 1980s.
Effective schools programs seek to develop or improve on school charac- teristics that have been identified in research as associated with high student achievement. Public Law loo-297 specifies five such character- istics that these programs should seek to achieve. They are (1) strong and effective administrative and instructional leadership, (2) emphasis on the acquisition of basic and higher-order skills, (3) a safe and orderly school environment, (4) a climate of expectations that virtually all chil- dren can learn under appropriate conditions, and (5) continuous assess- ment of students and programs to evaluate the effects of instruction.
‘The Department of Education defines educatlonally deprived children as children whose educational attainment is below the level that is appropnate for their age
Page 1 GAO/HRD-89132BR Effective Schools Programs
B-236384
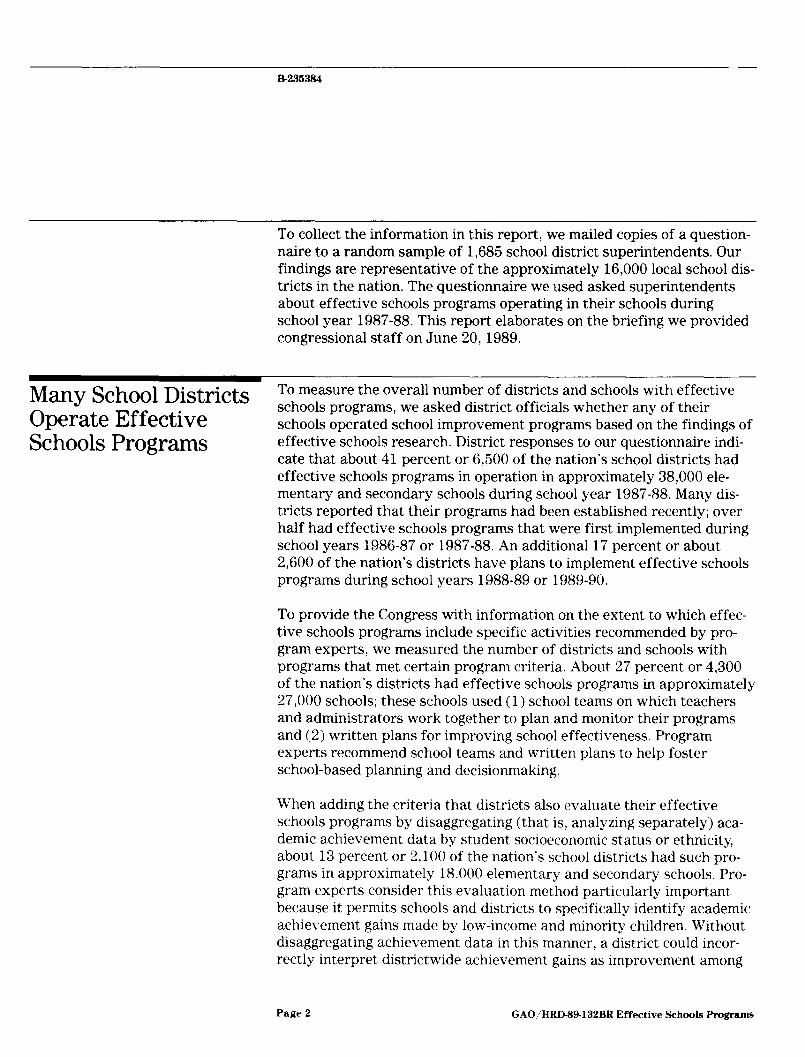
To collect the information in this report we mailed copies of a question- naire to a random sample of 1,685 school district superintendents. Our findings are representative of the approximately 16,000 local school dis- tricts in the nation. The questionnaire we used asked superintendents about effective schools programs operating in their schools during school year 1987-88. This report elaborates on the briefing we provided congressional staff on June 20, 1989.
Many School Districts To measure the overall number of districts and schools with effective
Operate Effective Schools Programs
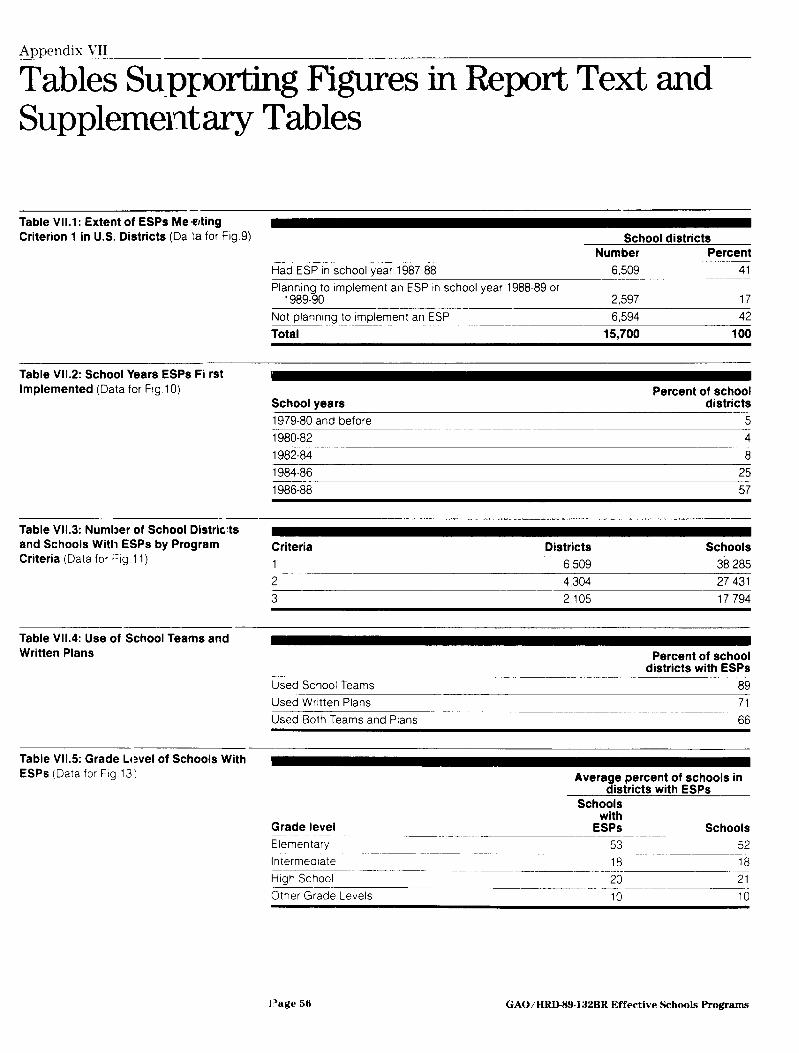
schools programs, we asked district officials whether any of their schools operated school improvement programs based on the findings of effective schools research. District responses to our questionnaire indi- cate that about 41 percent or 6,500 of the nation’s school districts had effective schools programs in operation in approximately 38,000 ele- mentary and secondary schools during school year 1987-88. Many dis- tricts reported that their programs had been established recently; over half had effective schools programs that were first implemented during school years 1986-87 or 1987-88. An additional 17 percent or about 2,600 of the nation’s districts have plans to implement effective schools programs during school years 1988-89 or 1989-90.
To provide the Congress with information on the extent to which effec- tive schools programs include specific activities recommended by pro- gram experts, we measured the number of districts and schools with programs that met certain program criteria. About 27 percent or 4,300 of the nation’s districts had effective schools programs in approximately 27,000 schools; these schools used (1) school teams on which teachers and administrators work together to plan and monitor their programs and (2) written plans for improving school effectiveness. Program experts recommend school teams and written plans to help foster school-based planning and decisionmaking.
When adding the criteria that districts also evaluate their effective schools programs by disaggregating (that is, analyzing separately) aca- demic achievement data by student socioeconomic status or ethnicity, about 13 percent or 2,100 of the nation’s school districts had such pro- grams in approximately 18.000 elementary and secondary schools. Pro- gram experts consider this evaluation method particularly important because it permits schools and districts to specifically identify academic achievTement gains made by low-income and minority children. Without disaggregating achievement data in this manner, a district could incor- rectly interpret districtwide achievement gains as improvement among
Page 2 GAO,%RD89-132BR Effective Schools Programs

-. B235384
all children, when, in fact, those gains were made by only some children, such as those from higher-income families.
Which Schools Have Effective Schoc 11s Programs?
Effective schools programs operate in elementary and secondary schools at an average rate approximately commensurate with districts’ average total percentage of elementary and secondary schools. For example: An average of about 53 percent of effective schools programs operate in elementary schools; similarly, elementary schools make up, on average, 52 percent of the total number of schools in the districts with programs. An average of about 20 percent of effective schools programs operate in high schools; similarly, high schools make up, on average, 21 percent of the total number of schools in the districts with effective schools pro- grams. In addition, these programs commonly serve mixed enrollments of low-income and higher-income children.
Which Districts H Effective Schools Programs?
:ave Effective schools programs are somewhat more likely to operate in large school districts, but are about as common in urban and nonurban areas. For example, although districts with enrollments of 10,000 students and over make up 4 percent of all c’.S. districts, they account for about 8 percent of the districts with effective schools programs. These programs operate in urban school districts, including central city districts, at a rate nearly commensurate with the percentage of such districts in the nation.
Many Districts Require Schools to Implement Effective Schools Programs
Our questionnaire results indicate that in half of all school districts with effective schools programs, some or all schools with the programs were required by their districts to implement them. In the other half of the districts with programs, schools voluntarily implemented them.
Programs Frequently Developed and Implemented With External Assistance
School districts frequently receive external assistance in developing and implementing effective schools programs from state education agencies (SEAS), universities, federally funded regional educational laboratories, and other agencies or individuals outside school districts. Our question- naire results indicate that about 64 percent of the districts with effec- tive schools programs received such external assistance, most often from SEAS. We identified 31 SEAS that assisted districts and schools in developing or implementing effective schools programs.
Page 3 GAO/HRD-89.132BR Effective Schools Program

- B236334
Program Evaluation- Districts Seldom
School districts reported using a variety of student performance meas- ures, ranging from achievement tests to student dropout rates, to evalu- ate their programs’ effect on academic achievement. When conducting
Determine If Programs these evaluations, however, school districts seldom determine whether
Help All Children the academic achievement of low-income or minority children is improved; this is because districts seldom disaggregate academic achievement data by student socioeconomic status or ethnicity.
Approximately 83 percent of all school districts with effective schools programs evaluate their programs using achievement tests, which typi- cally measure basic language arts and mathematics skill levels or assess mastery of specific curriculum objectives. About 75 percent of these dis- tricts use nontest measures, which commonly include grades, dropout rates, attendance, and enrollment rates in advanced and remedial classes. Sixty-six percent of the districts with programs use both test and nontest measures.
Only about 12 percent of the districts with effective schools programs regularly disaggregate achievement test results by student socioeco- nomic status. An even smaller percentage (about 9 percent) do so by ethnicity. Approximately 22 percent of the districts disaggregate nontest measures by student socioeconomic status, and about 29 percent do so by ethnicity.
As requested by your office, we did not obtain official agency comments on this report. We did, however, discuss its contents with Department of Education officials and have incorporated their comments where appro- priate. As arranged with your office, unless you publicly announce its contents earlier, we plan no further distribution of this report for 7 days from its issue date. At that time, copies will be sent to the Secretary of Education and other interested parties. The major contributors to this report are listed in appendix VIII.
Sincerely yours,
William J. Gainer Director, Education and Employment Issues
Page 4 GAO MRD-8%132BR Effective Schools Program@

Page 5 GAO NRD-89-132BR Effective Schools Programs
Contents
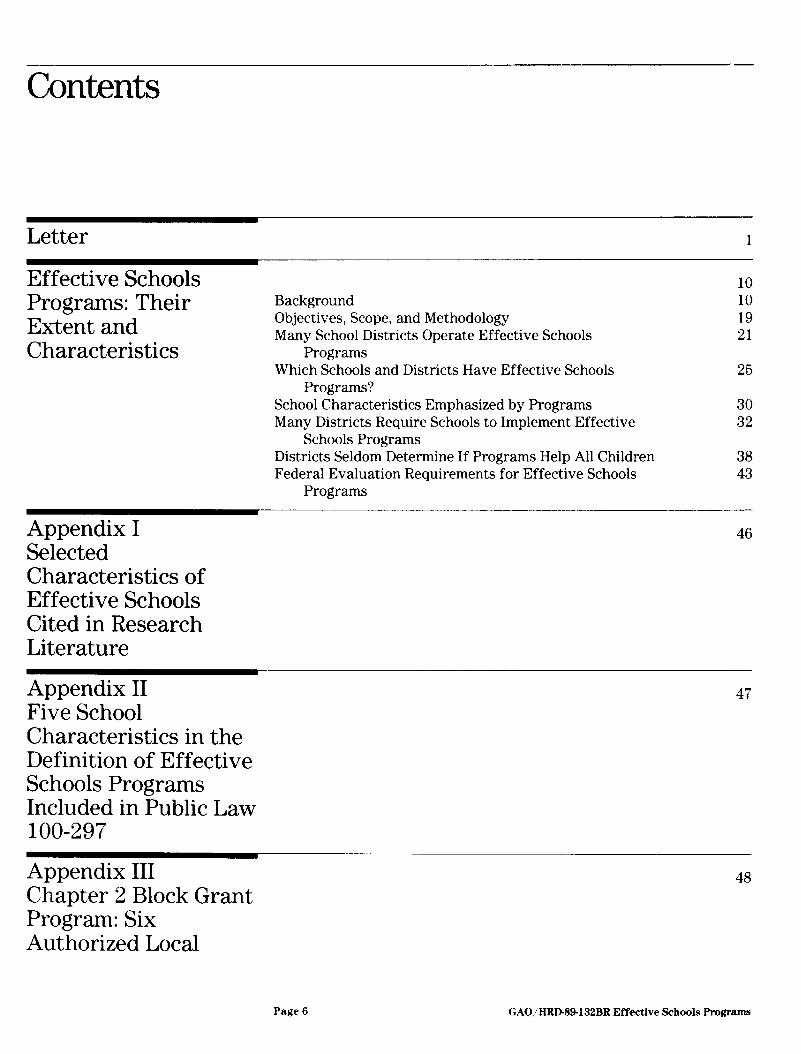
Letter 1
Effective Schools Programs: Their Extent and Characteristics
Background Objectives, Scope, and Methodology Many School Districts Operate Effective Schools
Programs
10 10 19 21
Which Schools and Districts Have Effective Schools Programs?
25
School Characteristics Emphasized by Programs Many Districts Require Schools to Implement Effective
Schools Programs
30 32
Districts Seldom Determine If Programs Help All Children Federal Evaluation Requirements for Effective Schools
Programs
38 43
Appendix I Selected Characteristics of Effective Schools Cited in Research Literature
46
Appendix II Five School Characteristics in the Definition of Effective Schools Programs Included in Public Law 100-297
47
Appendix III Chapter 2 Block Grant Program: Six Authorized Local
48
Page 6 GAO/HRD-SS-132BR Effective Schools Programs

- Contents
Targeted Assistance Programs
Appendix IV Estimates and Confidence Intervals for Selected Questionnaire Responses
Appendix V Effective Schools Programs in the Fifty Largest Cities (School Year 1987-88)
Appendix VI Examples of SEA Assistance to School Districts and Schools for Effective Schools Programs
Appendix VII Tables Supporting Figures in Report Text and Supplementary Tables
56
Appendix VIII Major Contributors to This Report
60
Page 7 GAO/BRD89-132BR Effective Schools Programa
Contents
-
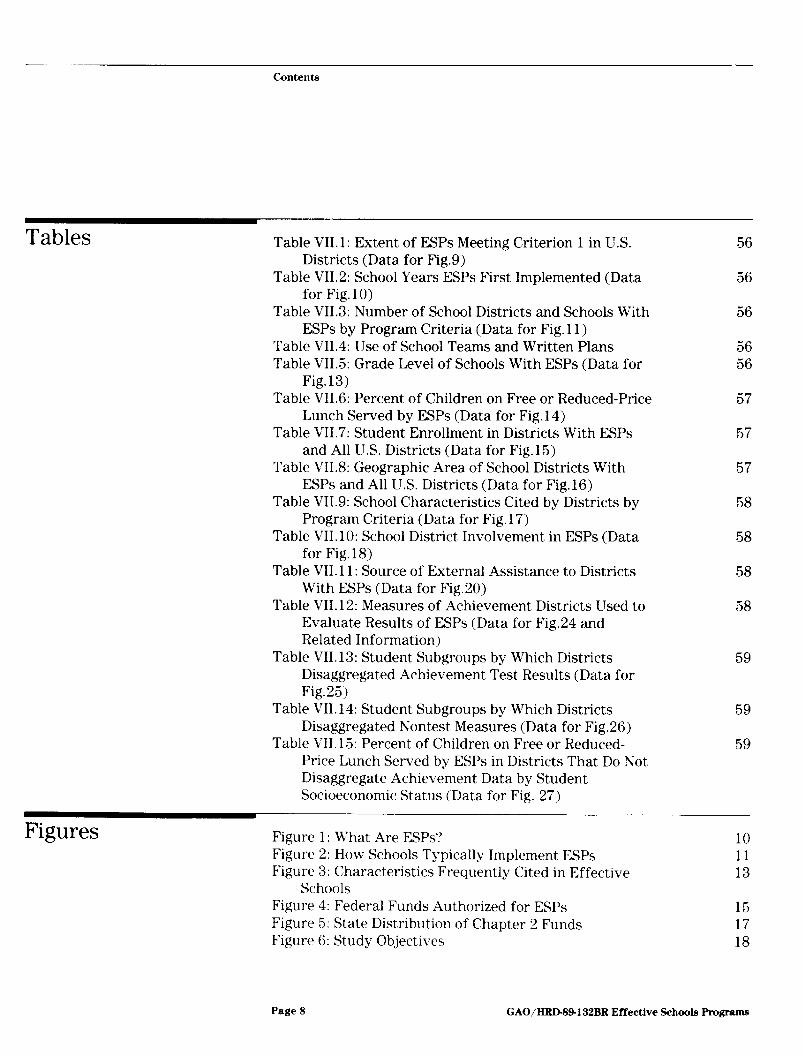
Tables Table VII.l: Extent of ESPs Meeting Criterion 1 in U.S. Districts (Data for Fig.9)
Table VII.2: School Years ESPs First Implemented (Data for Fig. 10)
Table VII.3: Number of School Districts and Schools With ESPs by Program Criteria (Data for Fig. 11)
Table VII.4: Use of School Teams and Written Plans Table VII.5: Grade Level of Schools With ESPs (Data for
Fig. 13) Table VII.6: Percent of Children on Free or Reduced-Price
Lunch Served by ESPs (Data for Fig.14) Table VII.7: Student Enrollment in Districts With ESPs
and All U.S. Districts (Data for Fig. 15) Table VII.8: Geographic Area of School Districts With
ESPs and All U.S. Districts (Data for Fig.16) Table VII.9: School Characteristics Cited by Districts by
Program Criteria (Data for Fig. 17) Table VII.10: School District Involvement in ESPs (Data
for Fig. 18) Table VII. 11: Source of External Assistance to Districts
With ESPs (Data for Fig.20) Table VII.12: Measures of Achievement Districts Used to
Evaluate Results of ESPs (Data for Fig.24 and Related Information)
Table VII.13: Student Subgroups by Which Districts Disaggregated Achievement Test Results (Data for Fig.25)
Table VII. 14: Student Subgroups by Which Districts Disaggregated Nontest Measures (Data for Fig.26)
Table VII. 15: Percent of Children on Free or Reduced- Price Lunch Served by ESPs in Districts That Do Not Disaggregate Achievement Data by Student Socioeconomic Status (Data for Fig. 27)
Figures Figure 1: What Are ESPs? Figure 2: How Schools Typically Implement ESPs Figure 3: Characteristics Frequently Cited in Effective
Schools
10 11 13
Figure 4: Federal Funds Authorized for ESPs 15 Figure 5: State Distribution of Chapter 2 Funds 17 Figure 6: Study Objectives 18
56
56
56
56 56
57
57
57
58
58
58
58
59
59
59
Page 8 GAO/HRD-89.132BR Effective Schools Programs
-~ .-____ Contents
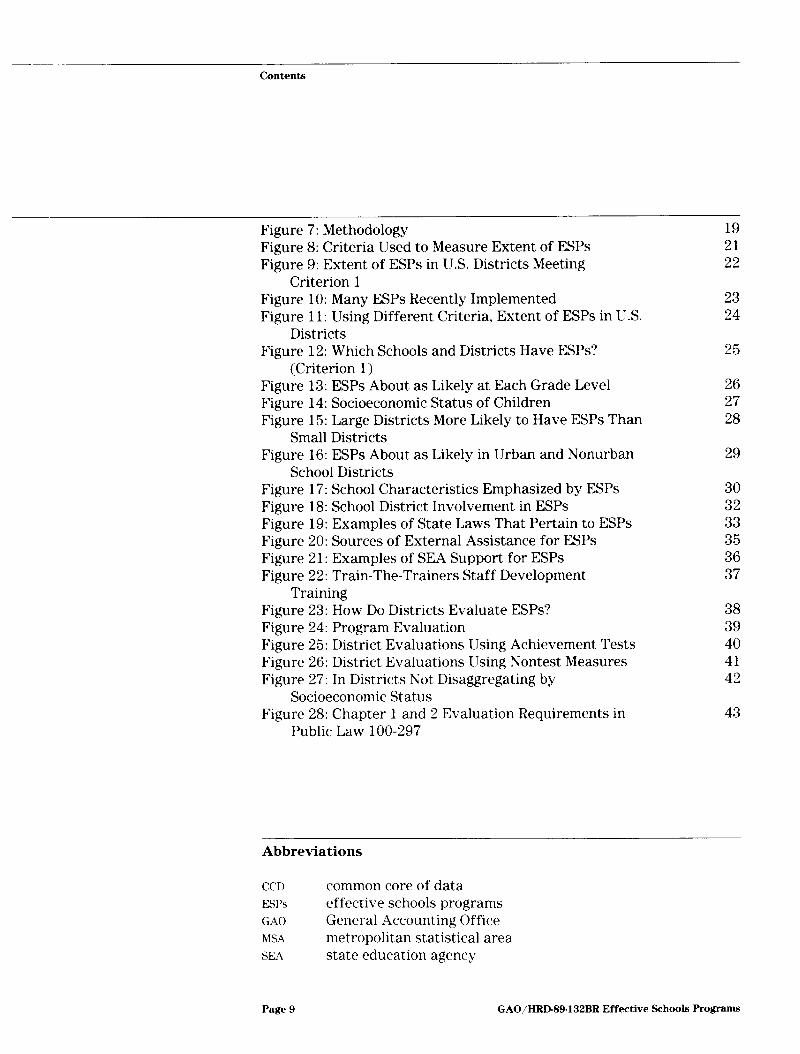
Figure 7: Methodology Figure 8: Criteria Used to Measure Extent of ESPs Figure 9: Extent of ESPs in U.S. Districts Meeting
Criterion 1
19 21 22
Figure 10: Many ESPs Recently Implemented Figure 11: Using Different Criteria, Extent of ESPs in U.S.
Districts
23 24
Figure 12: Which Schools and Districts Have ESPs? (Criterion 1)
25
Figure 13: ESPs About as Likely at Each Grade Level 26 Figure 14: Socioeconomic Status of Children 27 Figure 15: Large Districts More Likely to Have ESPs Than 28
Small Districts Figure 16: ESPs About as Likely in Urban and Nonurban 29
School Districts Figure 17: School Characteristics Emphasized by ESPs 30 Figure 18: School District Involvement in ESPs 32 Figure 19: Examples of State Laws That Pertain to ESPs 33 Figure 20: Sources of External Assistance for ESPs 35 Figure 21: Examples of SEA Support for ESPs 36 Figure 22: Train-The-Trainers Staff Development 37
Training Figure 23: How Do Districts Evaluate ESPs? Figure 24: Program Evaluation Figure 25: District Evaluations Using Achievement Tests Figure 26: District Evaluations Using Eontest Measures Figure 27: In Districts Not Disaggregating by
Socioeconomic Status
38 39 40 41 42
Figure 28: Chapter 1 and 2 Evaluation Requirements in Public Law loo-297
43
Abbreviations
CCD
ESPS
GAO
MSA
SEA
common core of data effective schools programs General Accounting Office metropolitan statistical area st,ate education agency
Page 9 GAO/HRD-89.132BR Effective Schools Programs
Effective Schools Programs: Their Extent and Chamcteristics
Background The Hawkins-Stafford Elementary and Secondary School Improvement Amendments of 1988 (P.L. 100-297) authorized Chapter 1 compensatory education funds and Chapter 2 educational improvement block grant funds to be expended for effective schools programs (ESPS). An effective schools program is a school-based program to improve the academic achievement of all children in a school, regardless of socioeconomic background or ethnicity, and in particular educationally deprived chil- dren (see fig. 1). These programs are also designed to promote school- level planning and decisionmaking and to become formal processes by which schools assess their needs and plan for their own improvement. Effective schools programs, like other school improvement efforts such as parental choice in selecting schools for their children to attend and increased graduation requirements, have become increasingly common as the educational reform movement has burgeoned during the 1980s.
Figure 1
GAQ What are ESPs?
Effective Schools Programs
are school-based programs to improve the academic achievement of all children, regardless of socioeconomic status or ethnicity, and particularly educational deprived children.
Page 10 GAO/HR.D-89.132BR Effective Schools Programs

Effective Schools Programs: Their Extent and Characteristics
Fioure 2
GAO How Schools Typically Implement ESPs
l Acquaint school staffs with research findings
l Establish teams of teachers and administrators
l Assess schoolwide and classroom needs
l Formulate improvement plans
Effective schools programs have been developed by individual schools! school districts, state education agencies (SEAS), federally funded regional educational laboratories, and universities. According to the research literature and experts we interviewed, effective schools pro- grams differ in (1) the amount of technical and financial assistance received from sources outside the school, (2) the amount of training given staff, (3) the emphasis on schoolwide versus classroom character- istics, and (4) the variety and use of school data that are obtained for evaluation purposes. Despite these differences, the literature shows that schools typically implement effective schools programs in a similar man- ner (see fig. 2).
Page 11 GAO/HRD89-132BR Effective Schools Programs
Effective Schools Programs: Their Extent and Characteristics
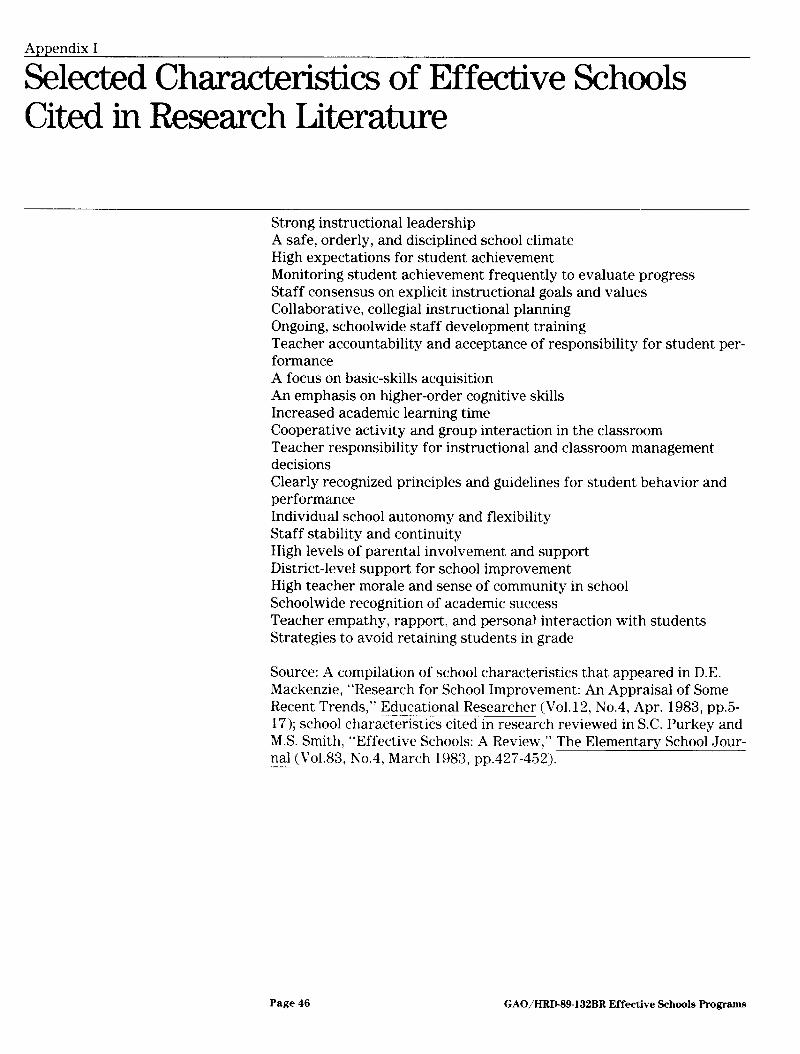
Effective Schools Research Effective schools programs seek to develop or improve on school charac- teristics identified by effective schools research as associated with high student achievement (see app. 1 for a list of 22 such characteristics). This research includes studies on school effectiveness, teacher effective- ness, organizational management, and program implementation, accord- ing to the literature we reviewed.
Most typically, effective schools programs emphasize the findings of studies on school effectiveness.’ In these studies, researchers have iden- tified characteristics present in schools with unexpectedly high stan- dardized student achievement test scores given their students’ socioeconomic background. Most of these studies focused on urban ele- mentary schools serving low-income and minority students. These stud- ies challenged the assumption that schools could have little effect on improving student achievement-a popular interpretation of earlier studies on equality in education, which found a direct relationship between socioeconomic background and student achievement.?
The findings of school effectiveness research were rapidly adopted by schools, districts, and states as models for school improvement pro- grams during the 1980s. The growth of effective schools programs was encouraged, in part, by (1) the belief among educators that schools could make a difference in improving student achievement and (2) school effectiveness researchers who advocated programs based on their research. The most influential researcher and advocate of these pro- grams was the late Ronald Edmonds, who, as a New York City school administrator, launched that city’s effective schools program in 1978.
‘See, for example, W.B. Brookover and L.W. Lezotte. Changes m School Charactenstrcs Coincident with Changes in Student Achievement (East Lansing: Institute for Research on Teaching, Michigan State University. 1979); M.M. Rutter and others, Fifteen-Thousand Hours: ,Secondary Schtxns and their Effects on Children (Cambridge. Mass.: Harvard I’niversity Press. 1979): G. Weber. Inner-Citv Children Can Be Taught to Read: Four Successful Schools (Washington. D.C.: Council for B-a- tion. 1971).
‘James Coleman and others, Equality of Educational Opportunity (Washmgton. D.C National Center for Education Statistics. 1966); Christopher Jenks and others, Inequahty: A Reassessment of the Effect of Family and Schooling in America (New York: Baser Books. 1972)
Page 12 GAO,/HRD89.132BR Effective Schools Programs
Effective Schools Programs: Their Extent and Characteristics
Figure 3
GAQ Characteristics Frequently Cited in Effective Schools
l Strong principal leadership
l A pervasive and broadly understood instructional focus
l Safe & orderly school climate
l High teacher expectations for student achievement
l Student achievement data used for evaluating program success
J
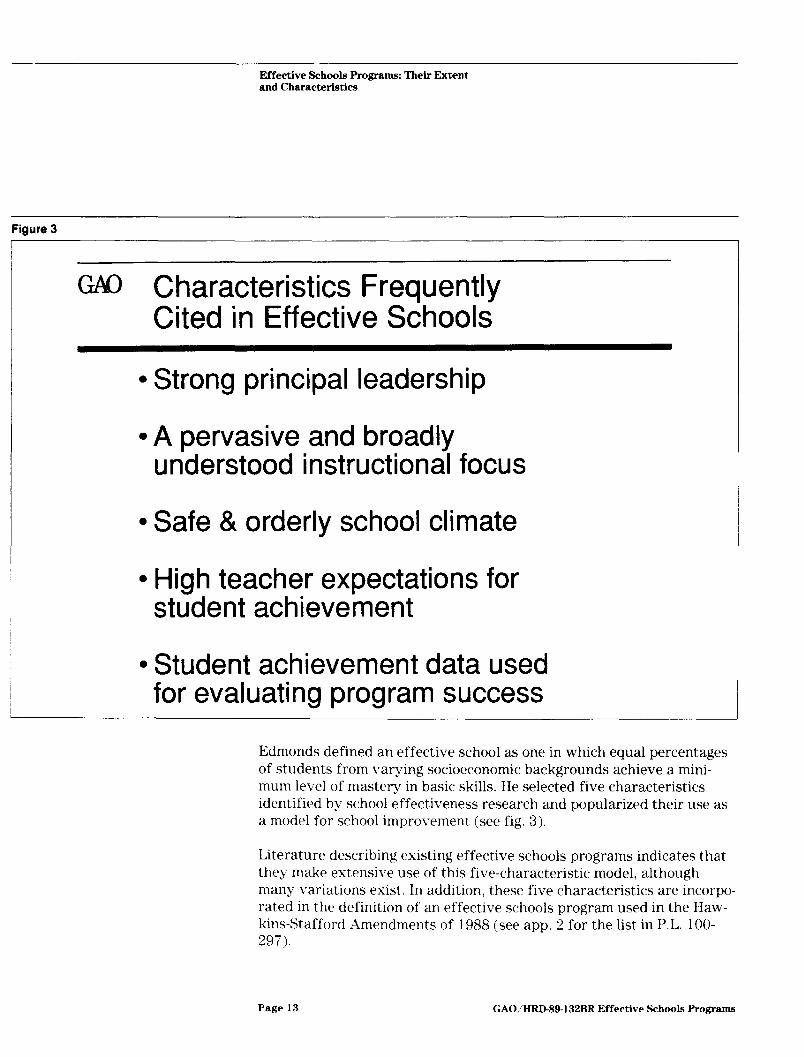
Edmonds defined an effective school as one in which equal percentages of students from varying socioeconomic backgrounds achieve a mini- mum level of mastery in basic skills. He selected five characteristics identified by school effectiveness research and popularized their use as a model for school improvement (see fig. 3).
Literature describing existing effective schools programs indicates that they make extensive use of this five-characteristic model, although many variations exist. In addition, these five characteristics are incorpo- rated in the definition of an effective schools program used in the Haw- kins-Stafford Amendments of 1988 (see app. 2 for the list in P.L. lOO- 297).
Page 13 GAO/HRD89-132BR Effective Schools Programs
Effective Schools Pmgrams: Their Extent and Characteristics
In some of the literature we reviewed, researchers were critical of the widespread growth of programs based on the findings of school effec- tiveness research.3 Criticism of the research is leveled against the (1) reduction of the findings to a set of specific characteristics, including the five just mentioned, to be used as a formula for school improvement; (2) generalization of the findings of studies conducted in urban elemen- tary schools to all levels of schools in urban and nonurban areas; (3) notion that once aware of a set of specific characteristics, schools can simply decide to adopt them; and (4) lack of causal evidence about what actions might bring about these specific characteristics in a school.
Analyzing Academic When schools and districts analyze students’ academic achievement to
Achievement to Evaluate evaluate the results of effective schools programs, both the experts we
Effective Schools interviewed and the literature we reviewed indicated that measures of
Programs academic achievement should be disaggregated (that is, analyzed sepa- rately) by student socioeconomic status and ethnicity.l Distinguishing the academic achievement of low-income and minority students permits schools and districts to determine whether children in these subgroups show improvement. Without separate analyses, achievement data would remain aggregated, and a school or district could incorrectly interpret achievement gains among only some children-for example, those who are nonminority or from higher-income families-as improvement among all children.
How school enrollments are mixed demographically may influence which student subgroups are relevant for disaggregation, according to some experts we interviewed. For example, in districts where schools with the programs by and large serve only children from low-income families: it may not be relevant to disaggregate by student socioeco- nomic status.
%ec. for example, R. Rowan. S. Bossert, D. Dryer, ” Research on Effectrve Schools: A Cautionary Note.” Educational Researcher, Vol. 12, No.4 (April 1983) pp.24-31; S.C. Purkey and M.S. Smith. “Effective Schools: A Review.” The Elementary School Journal. Vol. 83. No. 4 (1983). pp.427~51; M. Cohen, “Instructional Management and Social Conditions in Effective Schools,” in School Finance and School Improvement: Linkages in the 1980s ,4. Odden and L.D. Webb, eds. (Washington. DC.: Amen- can Educational Finance Association, 1983); J. D’Amico. “Each Effective School May Be One of A Kind.” Educatronal Leadership (Dec. 1982). pp.61~62.
‘Student socioeconomic status can be approximated with actual family income, level of parent educa- tron. student participation in the free or reduced-price lunch (or other pubhc assistance) program, and the language spoken at home
Page 14 GAO/HRDW-132BR Effective Schools Programs

Effective Schools Programs: Their Extent and Characteristics
Figure 4
GAQ Federal Funds Authorized for ESPs
ESPs may be funded with
l Chapter 1 funds for schoolwide projects
, l Chapter 2 funds for local and state programs
Some schools and districts with effective schools programs seek to nar- row the performance gap between students; thus, they may establish goals for raising the academic achievement of a certain percentage of lower-achieving students to a higher level. To determine whether such a goal is met, a school or district could analyze achievement measures for students grouped according to their prior achievement level, without disaggregating the data by student socioeconomic status or ethnicity. This method of evaluating program results, however, would not disclose whether subgroups of children (for example, low-income or minority) that were lower achievers in an earlier period show improved perform- ance in a later period.
Page 15 GAO/HRD&W-132BR Effective Schools Programs
Effective Schools Programs: Their Extent and Characteristics
Federal Support for Effective Schools Programs
Public Law loo-297 includes the first Chapter 1 and Chapter 2 program authorizations for effective schools programs (see fig. 4). In fiscal year 1989, a total of $4.6 billion was appropriated for Chapter 1 and $462.8 million for the Chapter 2 block grant program.
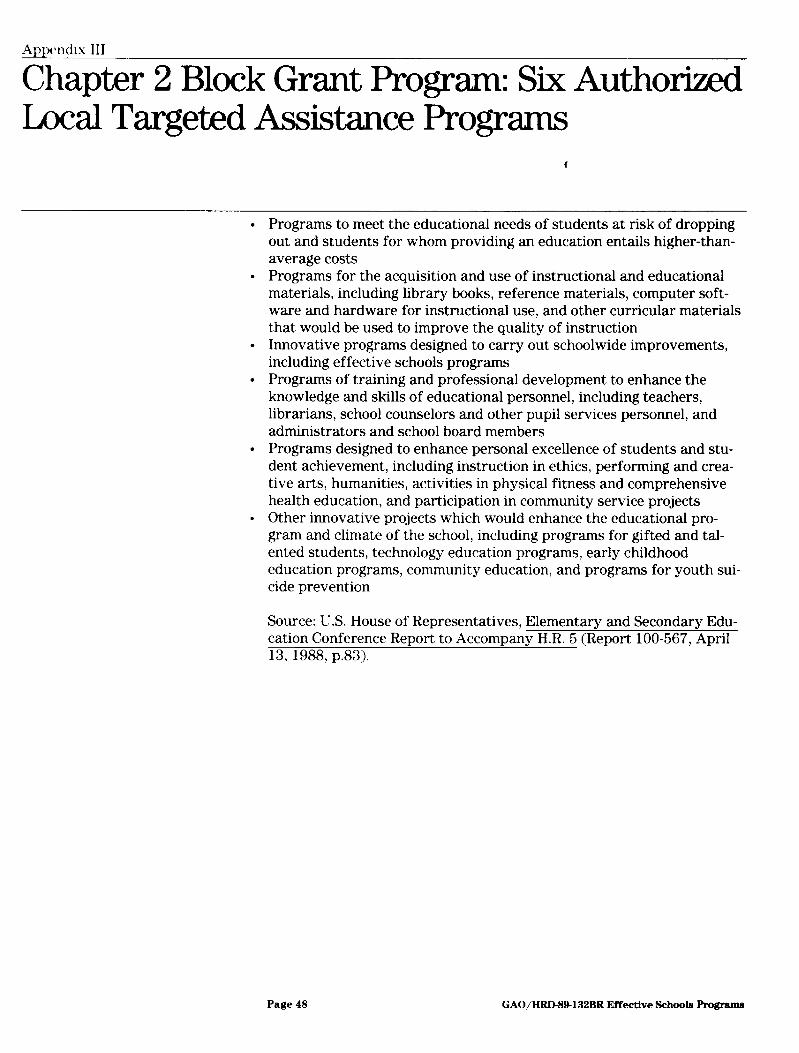
Chapter 1 funds may be used for effective schools programs when dis- tricts fund these programs as schoolwide projects. Such projects may only operate in schools where at least 75 percent of the children enrolled are from low-income families. The purpose of schoolwide projects is to upgrade a school’s entire educational program rather than serve only certain students like other Chapter 1 programs. Chapter 2 funds may be used by districts for effective schools programs as innovative programs to carry out schoolwide improvements-one of six authorized local targeted assistance programs (see app. 3). Public Law loo-297 requires SEAS to use a portion of the Chapter 2 funds they retain for effective schools programs (see fig. 5).
SEAS must distribute at least 80 percent of their Chapter 2 funds to school districts for use among the authorized targeted assistance pro- grams. The other 20 percent is reserved for state programs that include (1) Chapter 2 program administration, (2) assistance to school districts and statewide activities to provide targeted assistance, and (3) assis- tance to school districts and statewide activities to support effective schools programs.
Of Chapter 2 funds reserved for state programs, SEAS are required to use at least 20 percent for effective schools programs, unless a waiver is granted by the Secretary of Education. The Secretary may waive this requirement if a state already spends twice the required amount from nonfederal sources on these programs. The total amount of state Chapter 2 funds available for effective schools programs in fiscal year 1989 was about $18.4 million. Individual state funds available for effec- tive schools programs ranged from about $92,000 in states such as Dela- ware and Vermont to $1.9 million in California.
Page 16 GAO/HRD89-132BR Effective Schools Programs

Effective Schools Programs: Their Extent and Characteristics
Figure 5
GAQ State Distribution of Chapter 2 Funds
SEAS distribute at least 80% of funds to districts -- ~TO be used for six local targeted assistance programs, including ESPs
Remaining 20% of funds reserved for state use -- @States must use a portion for ESPs
Page 17 GAO/HRD-89-132BR Effective Schools Programs

Effective Schools Programs: Their Extent and Characteristics
Figure 6
GAQ Study Objectives
Determine
Identify
Describe
Discuss
Number of U.S. districts with effective schools programs
Common ESP characteristics and practices
How districts evaluate program effect on achievement
Federal requirements for evaluating ESPs
Page 18 GAO/HRDW-132BR Effective Schools Programs
Effective Schools Programs: Their Extent and Characteristics
Figure 7
w Methodology
Interview Federal and state officials Researchers / program experts
Review Effective schools research
Survey A nationally representative sample of school district superintendents
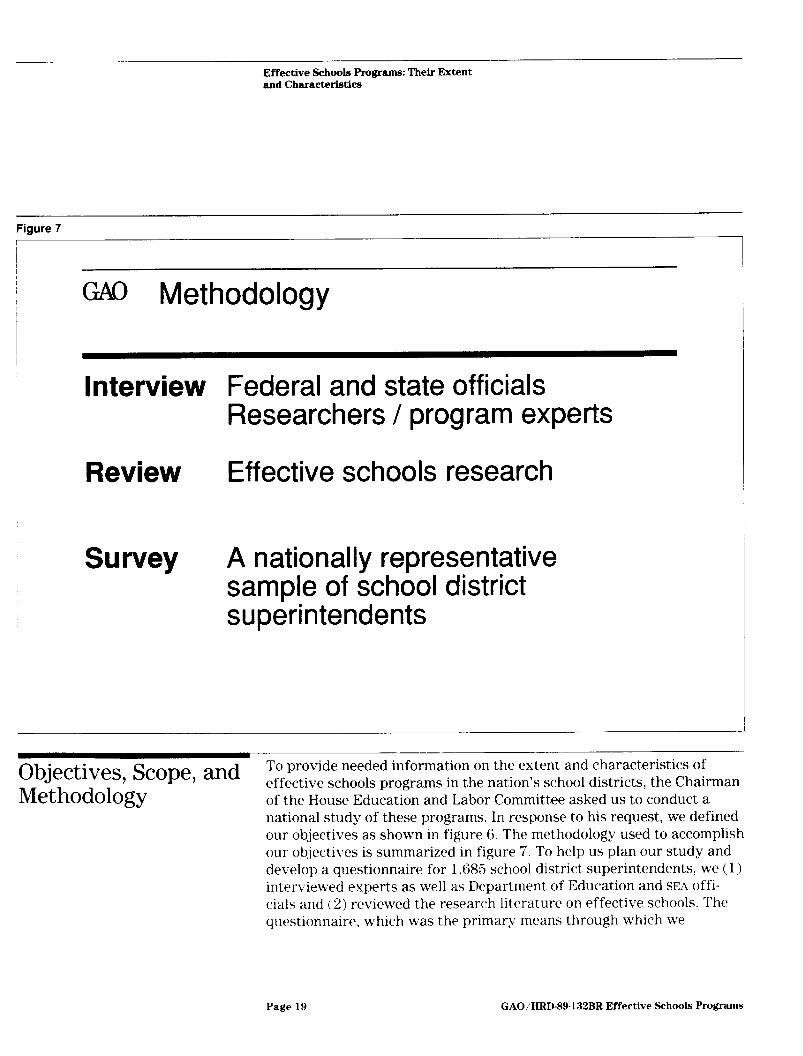
Objectives, Scope, and To provide needed information on the extent and characteristics of
Methodology effective schools programs in the nation’s school districts, the Chairman of the House Education and Labor Committee asked us to conduct a national study of these programs. In response to his request, we defined our objectives as shown in figure 6. The methodology used to accomplish our objectives is summarized in figure 7. To help us plan our study and develop a questionnaire for 1,685 school district superintendents! we (1) interviewed experts as well as Department of Education and SEA offi- cials and (2) reviewed the research literature on effective schools. The questionnaire, which was the primary means through which we
Page 19 GAO/HRD89.132BR Effective Schools Programs
Effective Schools Programs: Their Extent and Characteristics
obtained information about effective schools programs nationwide, cov- ered topics relating to the development, implementation, and evaluation of programs operating in school year 1987-88.
We mailed copies of the questionnaire to the superintendents of a strati- fied random sample of school districts across the country; we received responses from 82 percent of the school districts in our sample. Our findings are representative of the approximately 16,000 school districts in the nation.“, 6 In cases where information was incomplete or discrep- ancies occurred in districts’ responses, we spoke with the respondents and made appropriate changes. We did not visit districts to verify the accuracy of their responses.
We used a stratified sample design to obtain national representativeness and minimize sample size. The strata for our sample consisted of (1) 3 10 school districts, selected randomly from 873 districts identified by experts as having effective schools programs-including school-based planning teams-in which student achievement was disaggregated by student socioeconomic status; (2) 223 school districts, selected randomly from 309 districts identified by experts as having effective schools pro- grams-including school teams-but with unknown evaluation prac- tices; (3) the 50 largest school districts of the nation’s 50 largest cities (see app. V for a list of cities);; and (4) 1,089 school districts, selected randomly from the 1986-87 public education agency universe of the Department of Education’s common core of data (CCD).s
We discussed our questionnaire results with Department of Education officials and incorporated their comments where appropriate. We con- ducted our study during October 1988 through April 1989 in accordance with generally accepted government auditing standards.
‘Our sample only includes local school districts, which do not include regional educatron service agen- cies supetxison union administrative centers. state-operated agencies, and federally operated agen- cies. whrch together total approximately 1.300 districts.. (Source: t‘.S. Department of Education, Center for Education Statistics. )
“The confidence internals for our data are shown in appendix I\
‘Ue selected the fifty largest cittes based on 1986 Bureau of the Census population estimates.
sCCD 1s a universe suney of I’.% schools and districts and is not subJect to sampling error. It consists of data suitted annually by all SEAS m response to SIX sumey mstruments administered by the Center for Educatlon Statistics, whtch mamtams the database The 1986-87 CCD public education agency umverse had a response rate of 9 1 percent
Page 20 GAO/HRD89-132BR Effective Schools Programs
Effective Schools Programs: Their Extent and Characteristics
Fiaure 8
GAO Criteria Used to Measure Extent of ESPs
Criterion 1
Criterion 2
Criterion 3
School improvement programs based on findings of effective schools research
Also use school teams and written improvement plans
Also evaluate ESPs by disaggregating achievement data by student socioeconomic status or ethnicity
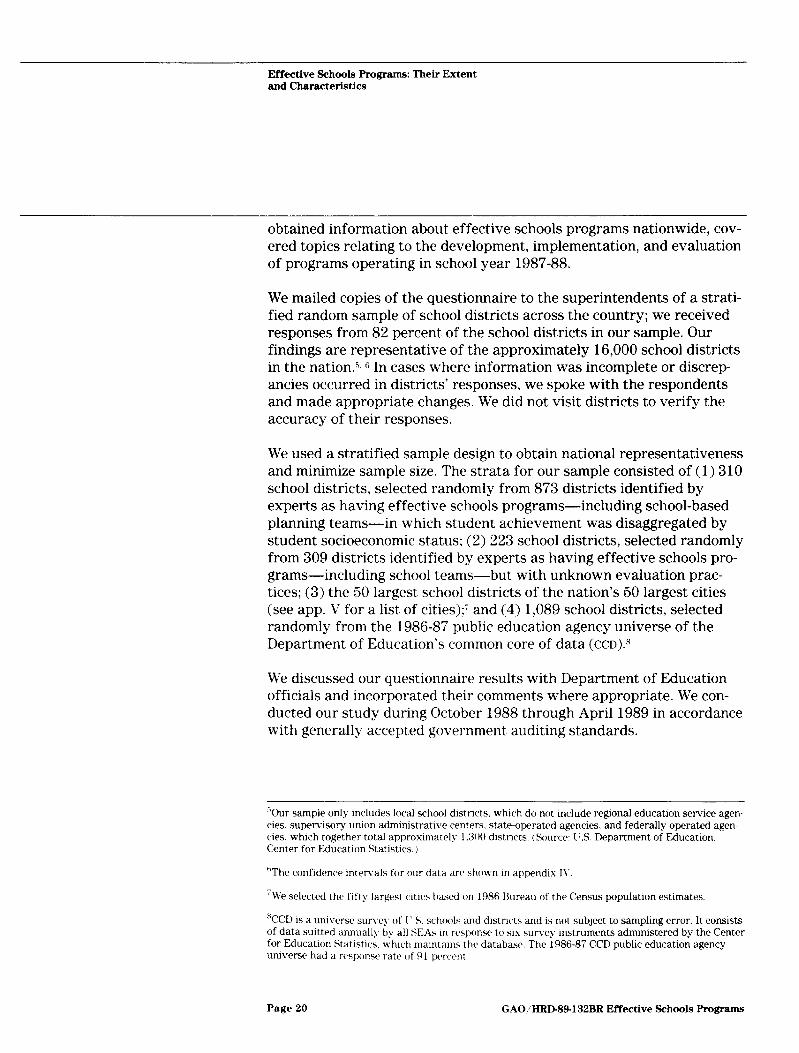
Many School Districts We used various criteria to measure the extent of effective schools pro-
Operate Effective Schools Programs
grams to provide the Congress with information on (1) the overall number of districts and schools with the programs and (2) the extent that these programs include specific activities recommended by program experts (see fig. 8).
Page 2 1 GAO,/HRDSS-132BR Effective Schools IVograms

Effective Schools Programs: Their Extent and Characteristics
Figure 9 -
GAQ Extent of ESPs in U.S. Districts Meeting Criterion 1
Majority have or plan to start programs
Not Planning to Implement an ESP
k 42% Had ESP in School Year 1987-88
Planning to Implement an ESP in School Years 1988-89 or 1989-90
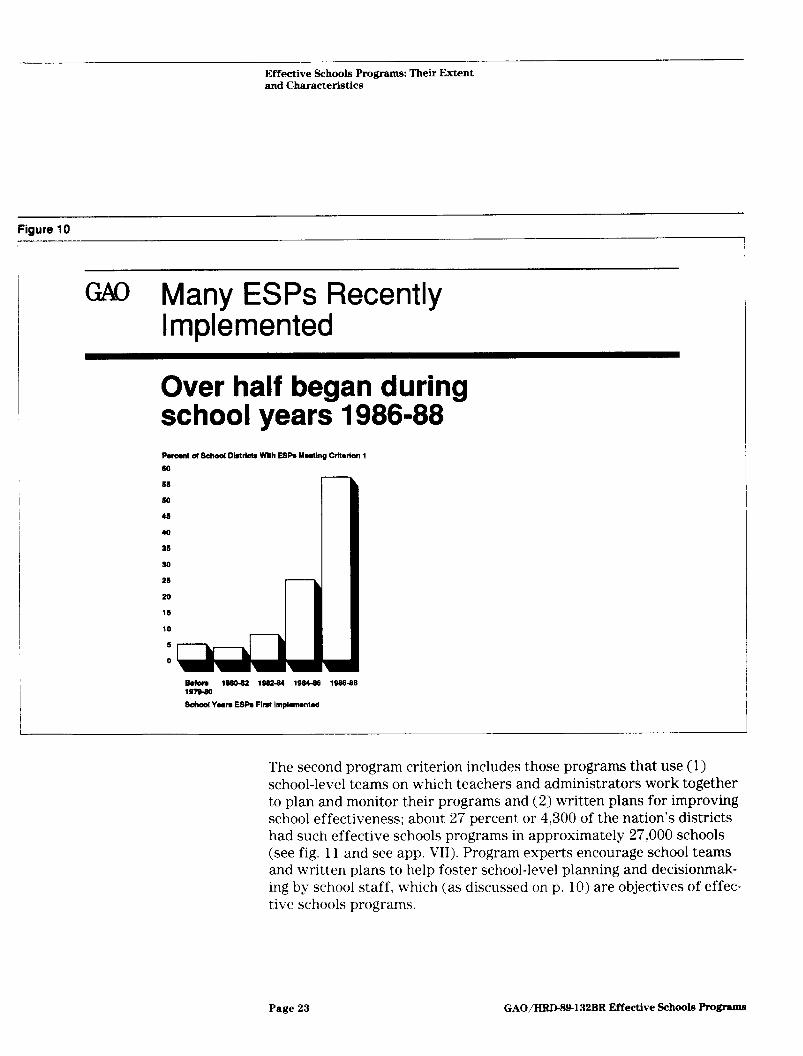
Using the first criterion, which stipulates that the programs be based on the findings of effective schools research, about 41 percent or 6,500 of the nation’s school districts had effective schools programs in operation in approximately 38,000 elementary and secondary schools during school year 1987-88 (see fig. 9). An additional 17 percent or about 2,600 of the nation’s districts have plans to implement effective schools pro- grams during school years 1988-89 or 1989-90. Many of the programs have been recently established (see fig. 10). Over half of the district offi- cials reported that their effective schools programs were first imple- mented during school years 1986-87 or 1987-88.
Page 22 GAO/HRJM9-132BR Effective Schools Programs
Effective Schools Programs: Their Extent and Characteristics
Figure 10
GAQ Many ESPs Recently Implemented
Over half began during school years 1986-88 Pwcm( d School Dbtrkta With ESPs Mnting CrHmdon 1
50
55
45 40
I 35
50
25 20 r’ 15
10
Bdem 1sso-52 105244 1054.55 loss-55 107S50
The second program criterion includes those programs that use (1) school-level teams on which teachers and administrators work together to plan and monitor their programs and (2) written plans for improving school effectiveness; about 2’7 percent or 4,300 of the nation’s districts had such effective schools programs in approximately 27,000 schools (see fig. 11 and see app. VII). Program experts encourage school teams and written plans to help foster school-level planning and decisionmak- ing by school staff, which (as discussed on p, 10) are objectives of effec- tive schools programs.
Page 23 GAO/HRD-89132BR Effective Schools Programs
Effective Schools Programs: Their Extent and Characteristics
Figure 11
w Using Different Criteria, Extent of ESPs in U.S. Districts
45 Pucmt of Schd Didrkts Wh ESR
40 55 30 r-l-
J
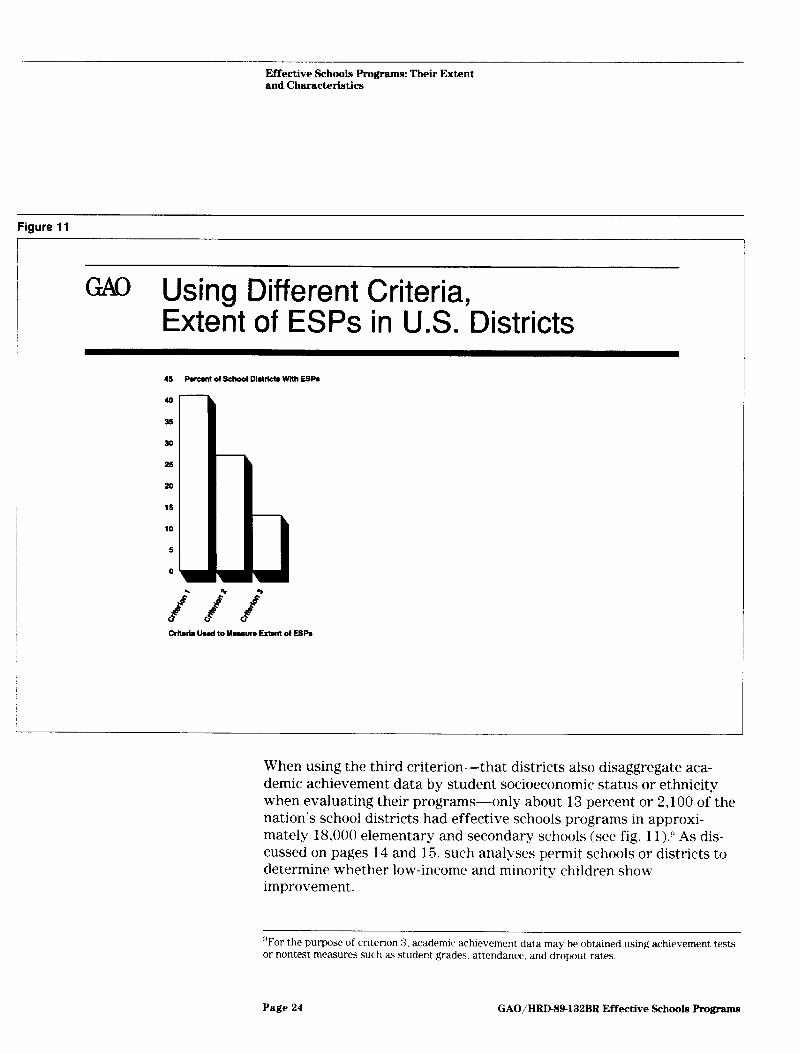
When using the third criterion-that districts also disaggregate aca- demic achievement data by student socioeconomic status or ethnicity when evaluating their programs-only about 13 percent or 2,100 of the nation’s school districts had effective schools programs in approxi- mately 18,000 elementary and secondary schools (see fig. 11)” As dis- cussed on pages 14 and 15, such analyses permit schools or districts to determine whether low-income and minority children show improvement.
“For the purpose of cnterion 3. academic achievement data may be obtained using achievement tests or nontest measures such as student grades. attendance, and dropout rates.
Page 24 GAOjHRJS89-132BR Effective Schools Programs
Effective Schools Programs: Their Extent and Characteristics
Figure 12
r
MO Which Schools and Districts Have ESPs? (Criterion 1)
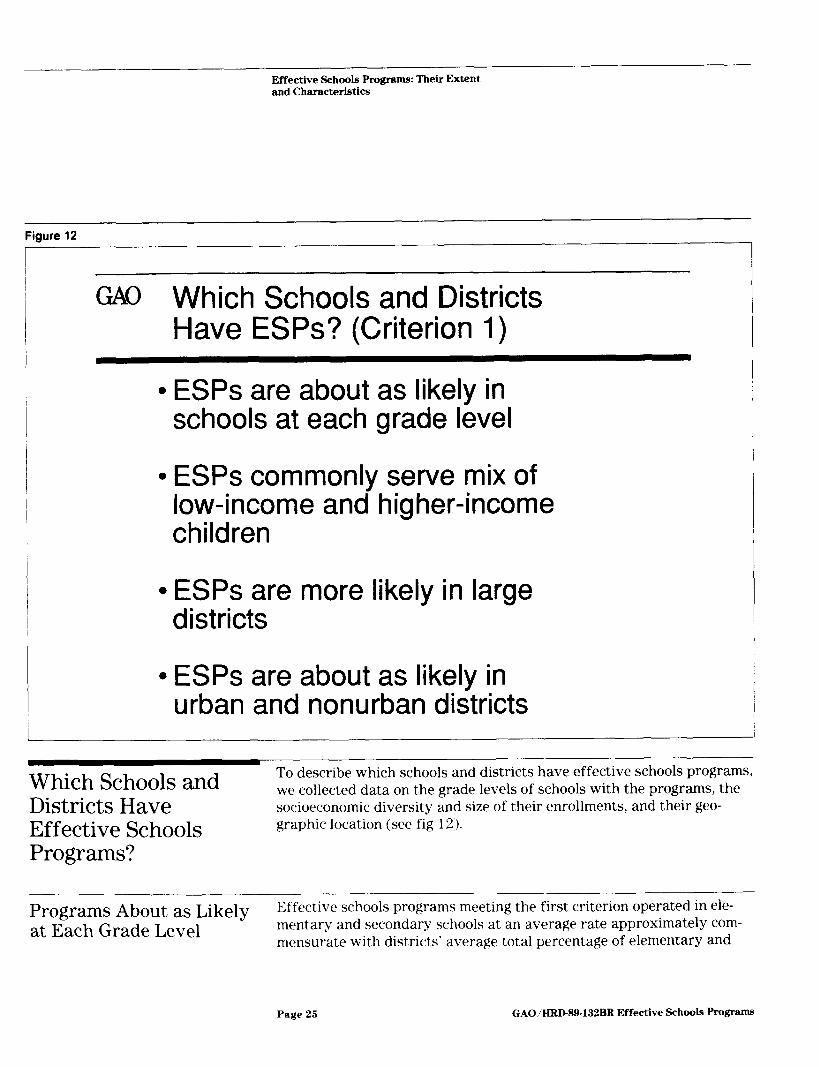
l ESPs are about as likely in schools at each grade level
l ESPs commonly serve mix of low-income and higher-income children
l ESPs are more likely in large districts
l ESPs are about as likely in urban and nonurban districts
Which Schools and Districts Have
we collected data on the grade levels of schools with the programs, the socioeconomic diversity and size of their enrollments, and their geo-
Effective Schools Programs?
graphic location (see fig 12).
Programs About as Likely Effective schools programs meeting the first criterion operated in ele-
at Each Grade Level mentary and secondary schools at an average rate approximately com- mensurate with districts’ average total percentage of elementary and
Page 25 GAO/HRD89-132BR Effective Schools Program

Effective Schools Programs: Their Extent and Characteristics
Fiaure 13
G’GAQ ESPs About as Likely at Each Grade Level
Pwmnt of Schxds in Districts With ESR
55
50
45
40
35
30
25
20
15
10
5
0
Gndm Lawl of Schools In Districts Wfih ESPs
secondary schools, district officials reported (see fig. 13). For example, an average of about 53 percent of effective schools programs operate in elementary schools, with elementary schools making up, on average, 52 percent of the total number of schools in districts with programs. In addition, an average of 20 percent of effective schools programs operate in high schools, with high schools making up, on average, about 21 per- cent of the schools in districts with programs.
Page 26 GAO/HRIM9-132BR Effective Schools Programs

Effective Schools Programs: Their Extent and Characteristics
Figure 14
@ko Socioeconomic Status of Children
ESPs serve mix of low-income and higher-income children Pumnt of School Districts With ESPs 20
15
10
0 l-10 11-20 21-30 31-w 41.50 5140 61-70 Percent of Children on Frm or Reduced-Price Lunch In Schools Wfih ESPs
Programs Commonly Serve Effective schools programs meeting the first criterion commonly serve
Mix of Low-Income and mixed enrollments of low-income and higher-income children, district
Higher-Income Children officials reported (see fig. 14). To estimate the socioeconomic diversity of districts’ school enrollments, we asked district administrators to spec- ify the percentage of children who participated in the free or reduced- price lunch program in those schools with effective schools programs.l”
“‘The percentage of children participating in the free or reduced-price lunch program may underestl- mate the percentage of low-Income children in a school because all eligible children do not participate. Children that receive free lunch have family Incomes of 130 percent or less of the official poverty threshold. which was 59.431 for a 3-person family in 1988; children that receive reduced-price lunch have family incomes of 185 percent or less of the official poverty thrt-;hold. Among all children that recewed free or reduced-price lunchrs during the first 6 months of fiscal year 1989, 85.5 percent received free lunches. (Source: 1’S Lkpartment of Commerce. Bureau of thr Census and U.S. Depan- ment of Agnculture. Child Sutntlon Dlvislon )
Page 27 GAOiHRD89132BR Effective Schools Programs

Effective Schools Programs: Their Extent and Characteristics
Figure 15
w Large Districts More Likely to Have ESPs Than Small Districts Percent of School Districts
60
70
60
50
40
30
20
Programs More Likely in Larger School Districts
Effective schools programs are somewhat more likely to operate in large school districts (enrollments of 2,500 or more). For example, although districts with enrollments of 10,000 students and over make up 4 per- cent of all U.S. districts, these districts account for about 8 percent of the districts with effective schools programs meeting the first criterion (see fig. 15). Likewise, districts with enrollments of 2,500 to 9,999 stu- dents make up 18 percent of all ITS. districts and about 29 percent of the districts with programs.
Page 28 GAOiHRD89-132BR Effective Schools Programs
Effective Schools Programs: Their Extent and Characteristics
Figure 16
GAQ ESPs About as Likely in Urban and Nonurban School Districts
60 Porcenl of School Districts
Primarily MSA but Not centrai city of Prinmtfly MSA Central City
Outsid. of MSA
Geographical Area Served by School Districta
1 School Districts With ESPs 1 I
All U.S. School Districts
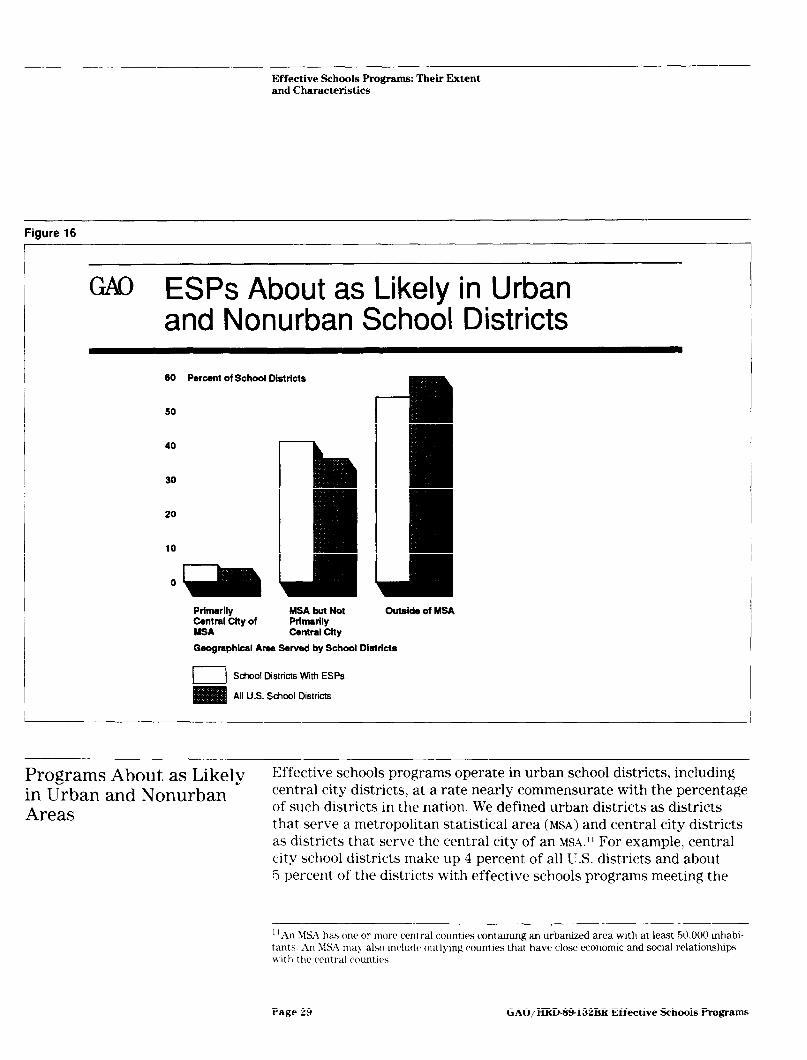
Programs About as Likely Effective schools programs operate in urban school districts, including
in Urban and Nonurban central city districts, at a rate nearly commensurate with the percentage
Areas of such districts in the nation. We defined urban districts as districts that serve a metropolitan statistical area (MSA) and central city districts as districts that serve the central city of an MSA." For example, central city school districts make up 4 percent of all U.S. districts and about 5 percent of the districts with effective schools programs meeting the
’ I.411 MS.4 has one or more central counties contammg an urbanized area wth at least 50.000 inhabi- tants. Xn MS.4 may also mcludc outlymp counties that have close economic and social relationships with the central counties
Page 29 GAO/HRDSS-132BR Effective Schools Programs
Effective Schools Programs: Their Extent and Characteristics
Figure 17
r
GAQ School Characteristics Emphasized by ESPs
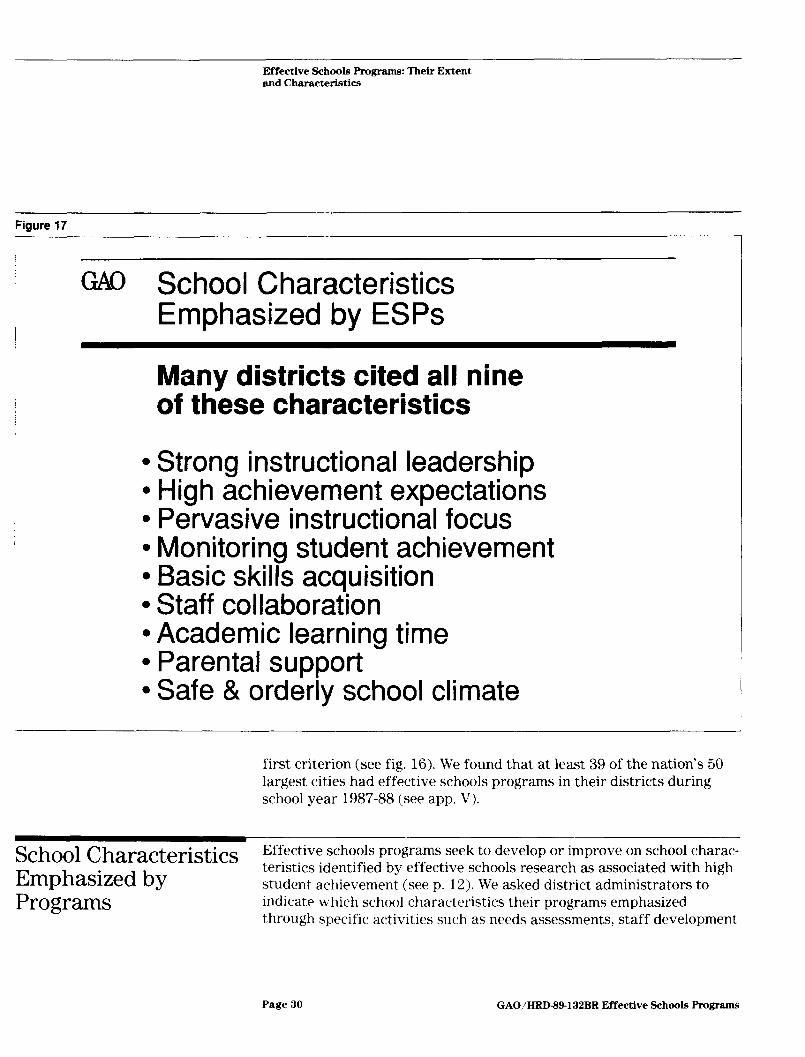
Many districts cited all nine of these characteristics
l Strong instructional leadership l High achievement expectations l Pervasive instructional focus l Monitoring student achievement l Basic skills acquisition l Staff collaboration l Academic learning time l Parental support l Safe & orderly school climate
first criterion (see fig. 16). We found that at least 39 of the nation’s 50 largest cities had effective schools programs in their districts during school year 1987-88 (see app. V).
School Characteristics Effective schools programs seek to develop or improve on school charac-
Emphasized by teristics identified by effective schools research as associated with high student achievement (see p. 12). We asked district administrators to
Programs indicate which school‘characteristics their programs emphasized through specific activities such as needs assessments! staff development
Page 30 GAO/HRD-89132BR Effective Schools Programs
Effective Schools Programs: Their Extent and Characteristics
training, and changes in classroom instruction and school management proceduresL2 According to t,heir responses, in about 88 percent of the 6,500 districts, the programs sought to improve on at least six of nine school characteristics listed in our questionnaire (see fig. 17). The pro- grams in about 67 percent of the districts sought to improve on at least eight characteristics, and the programs in about 53 percent of the dis- tricts emphasized all nine (see app. VII for further details on fig. 17).
A study that used a nationally representative survey of high schools provides another example of effective schools programs emphasizing many different characteristics. 13 In this study, a majority of principals reported that effective schools programs in their schools gave major emphasis to at least 12 characteristics identified by effective schools research. The authors of this study questioned how the schools could devote major emphasis to so many characteristics simultaneously since each one was likely to require considerable effort.
1'011r wonnaire listed rune school charactenstics that were frequently wed in the literature on effectn Y schools research (see fig. 17 ).
“‘SC. Purkey. R.A. Rutter, and FM. Newmann, ” I5 High School Improvement Programs: A Profile from the IIlgh School and Beyond Supplemental Suney.” Metropolitan Education, Vol.3 (Winter 1986-87). pp. 5Wl. The suney used was the 1984 High School and Beyond Supplemental Survey of Principals and ‘Teachers
Page 31 GAO/HRWS132BR Effective Schools Programs
Effective Schools Programs: Their Extent and Characteristics
Figure 18
GAQ School District Involvement in ESPs
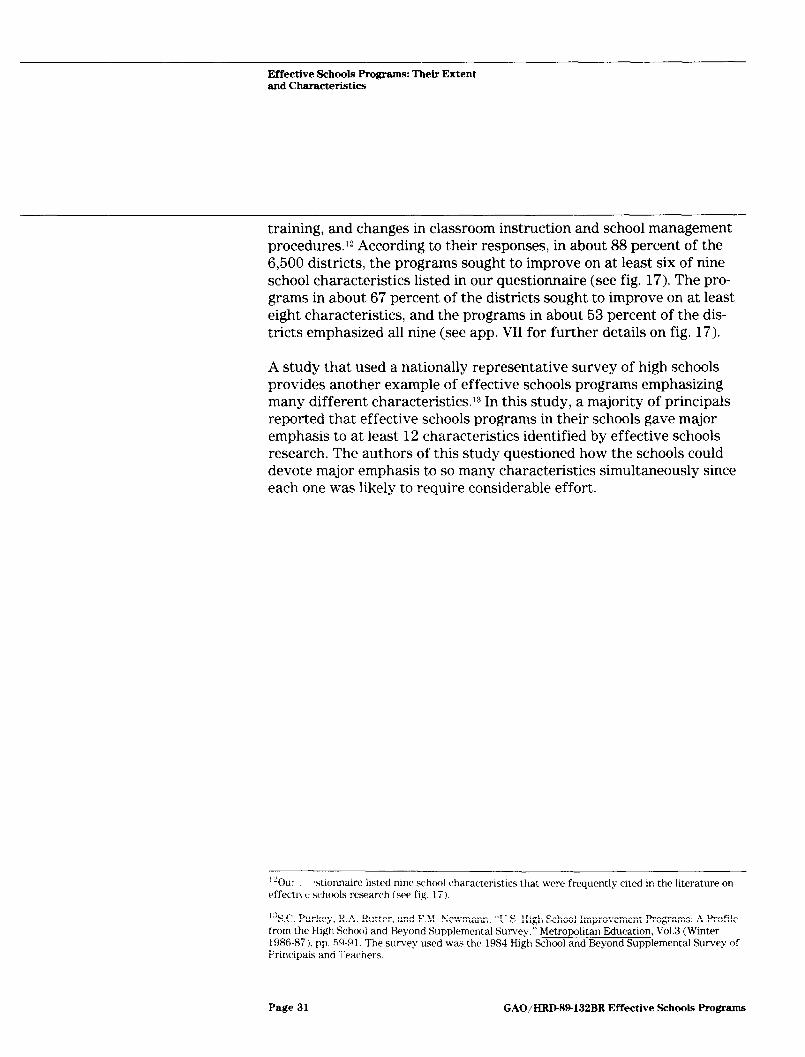
Half of the districts required schools to implement programs
Districts in Which All Schools With ESPs Voluntarily Chose to Have Them
46% Districts in Which All Schools With ESPs Were Required to Have Them
Districts in Which Some Schools With ESPs Were Required to Have Them
Many Districts Require Schools to Implement Effective Schools Programs
Our questionnaire results indicate that in half of the school districts with effective schools programs meeting the first criterion, some or all schools with the programs were required by their districts to implement them (see fig. 18). In the other half of the districts with programs, schools implemented them on a voluntary basis. Some districts that require effective schools programs do so because of state laws that require (or encourage) school improvement programs (see fig. 19).
Page 32 GAO/~89.132BR Effective Schools Programs
Effective Schools Programs: Their Extent and Characteristics
Fiaure 19
@W Examples of State Laws that Pertain to ESPs
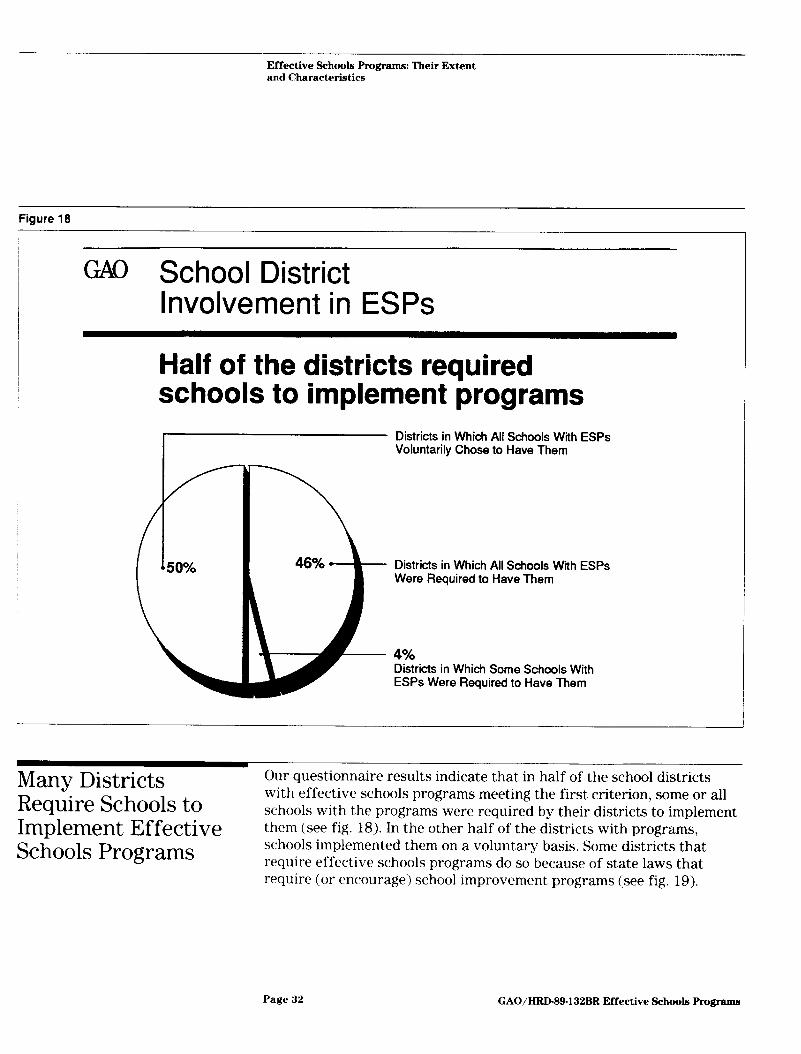
States such as Maine, Indiana New York, and South Carolina,
l Require or fund improvement programs in schools, or
l Require schools to prepare improvement plans, or
l Have accreditation standards that include effective schools objectives
Some of the literature we reviewed discussed the strengths and weak- nesses of approaches in which districts become involved in schools’ deci- sions to implement an effective schools program.14
l Top-down approach: The school district requires schools to implement effective schools programs and determines program content, goals, and expected outcomes, usually focused on achievement tests. A strength
‘%e for example. SC. Purkev and M.S. Smith, “School Reform: The District Policy Implications of the Eifective Schools Literature.” The Elementary School Journal. Vol. 45. No. 3 (Jan. 1985), pp. 353- 63; L. Cuban, “Transforming the Frog into a Prince: Effective Schools Research, Policy, and Practice at the District Level.” Harvard Educational Review. Vol. 54. Ko. 2 (May 1984), pp. 129-37.
Page 33 GAO/lXRD84132BR Effective Schools Programs
Effective Schools Programs: Their Extent and Characteristics
cited in this approach is that reform will be attempted where it is needed. But a weakness may be that the lack of staff choice in program implementation and management, as well as the focus on test scores, may diminish (1) school staffs’ sense of responsibility and commitment toward the program and (2) flexibility in curricula, classroom practices, and program management.
l Bottom-up approach: The school district may provide incentives, such as program funds and teacher-release time from classes for program plan- ning, but each school voluntarily chooses to implement an effective schools program, determines its own agenda, and uses district funds in the manner that staff and parents choose. Choice and flexibility are strengths of this approach, but a weakness cited is that schools that could benefit from the program may choose not to participate or may drop out as staff enthusiasm declines.
l Mixed approaches: This approach combines the strengths of the other two approaches. The district may require schools to implement effective schools programs and provide incentives that encourage staff planning and collaboration, such as funds for substitutes, but then relies on school staffs for program design, implementation, and management.
Programs Frequently Developed and Implemented With External Assistance
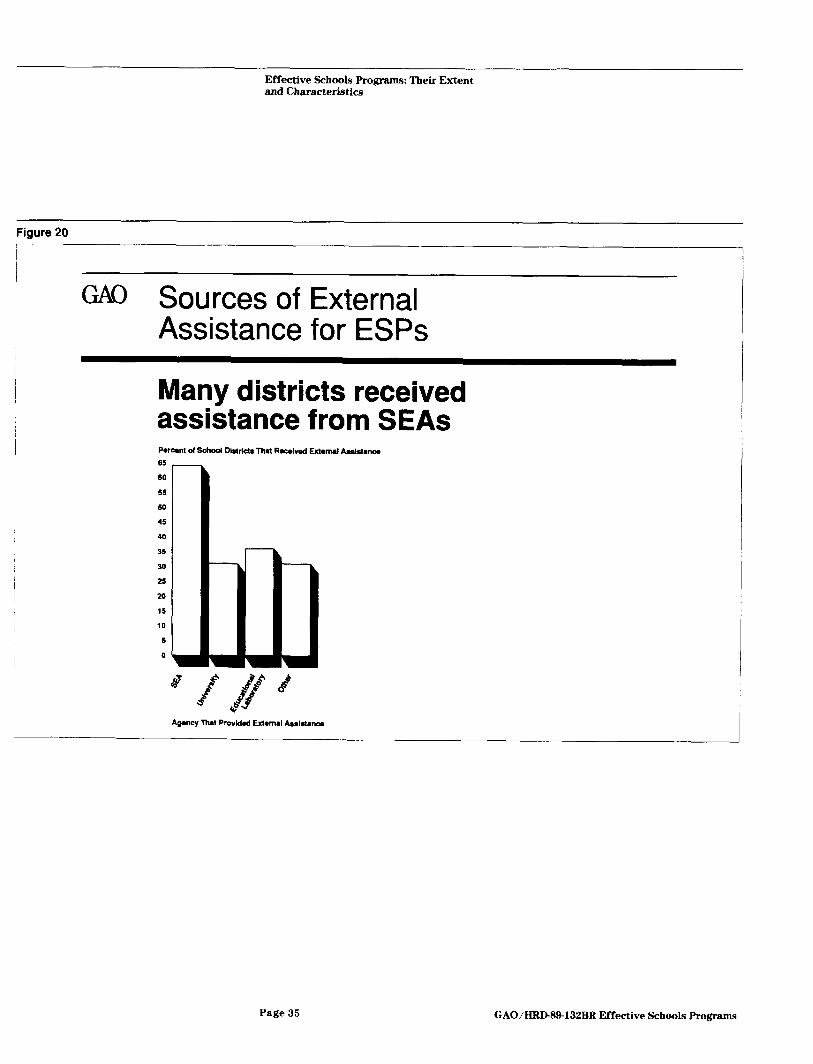
SEAS, universities, federally funded regional educational laboratories, and other agencies or individuals outside of the school district fre- quently assist districts and schools in developing and implementing effective schools programs, according to our survey results and the liter- ature we reviewed. To assist principals and teachers plan and implement their programs! agencies and individuals outside of the school district may develop program models and provide staff training and technical assistance; SEAS may provide financial support to districts and schools. Our questionnaire results indicate that about 64 percent of the districts with effective schools programs meeting the first criterion received external assistance in developing their programs. Many of these pro- grams were developed with assistance from an SEA (see fig. 20).
Page 34 GAO NRD-89.132BR Effective Schools Programs
Effective Schools Programs: Their Extent and Characteristics
Figure 20
GM Sources of External Assistance for ESPs
Many districts received assistance from SEAS Pwsnc of School Dhktr lhl Rocehd Exturul Assishnm
65
60
55 r 50
45
40
35
30
25
20
15
10
5
0
\
-
1
Page 35 GAO/HRD89-132BR Effective Schools Programs
Effective Schools Programs: Their Extent and Characteristics
Figure 21
GZAQ Examples of SEA Support for ESPs
l Connecticut and Minnesota SEAS have ESP model
l New York, Michigan, and Kentucky SEAS provide training and technical assistance
l California, New Jersey, and Wisconsin SEAS provide financial support to schools or districts
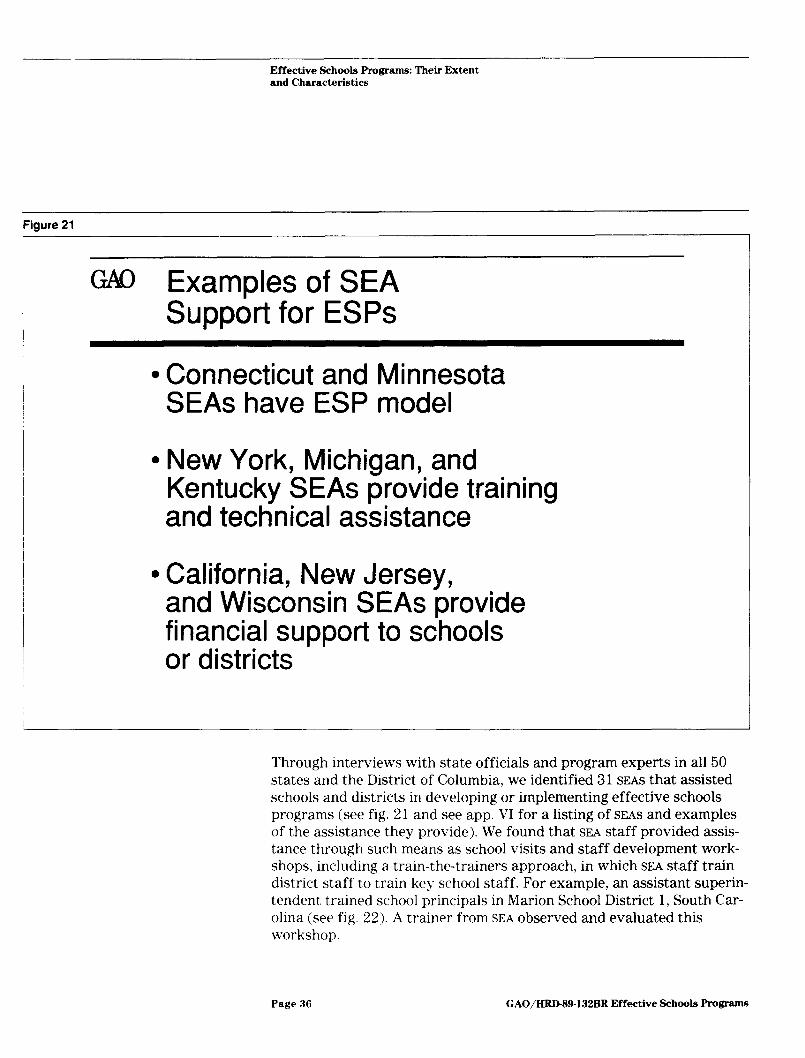
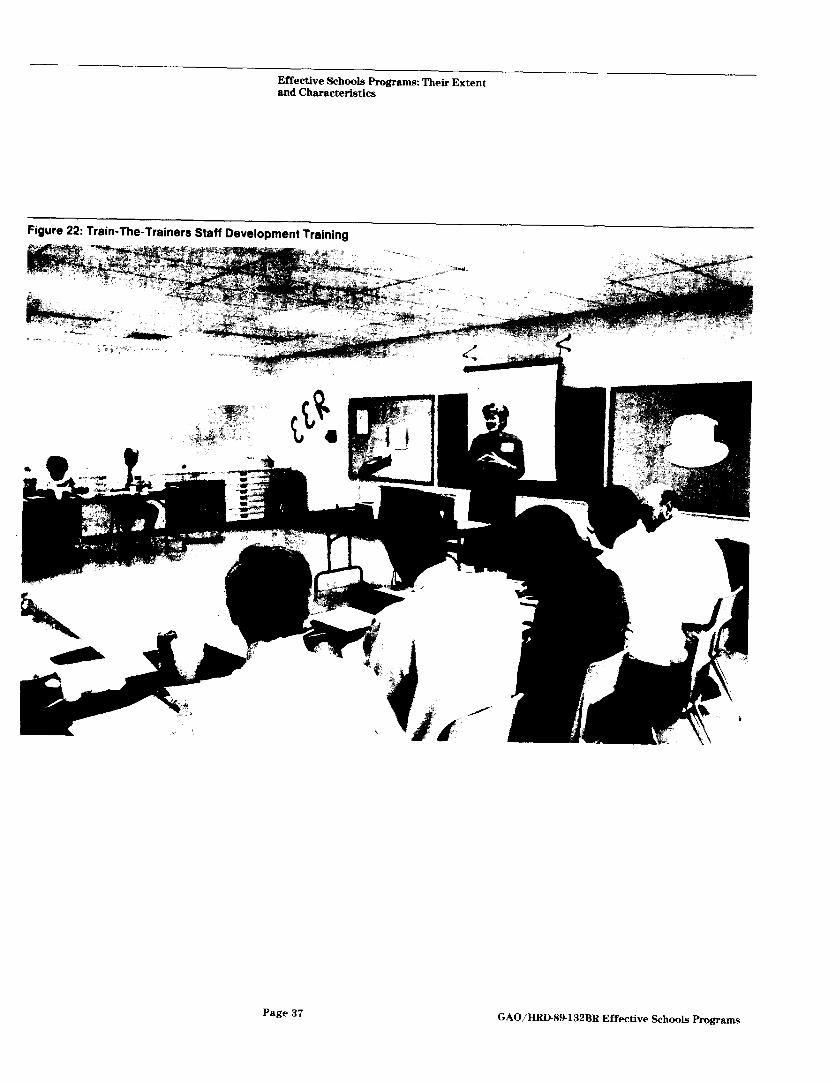
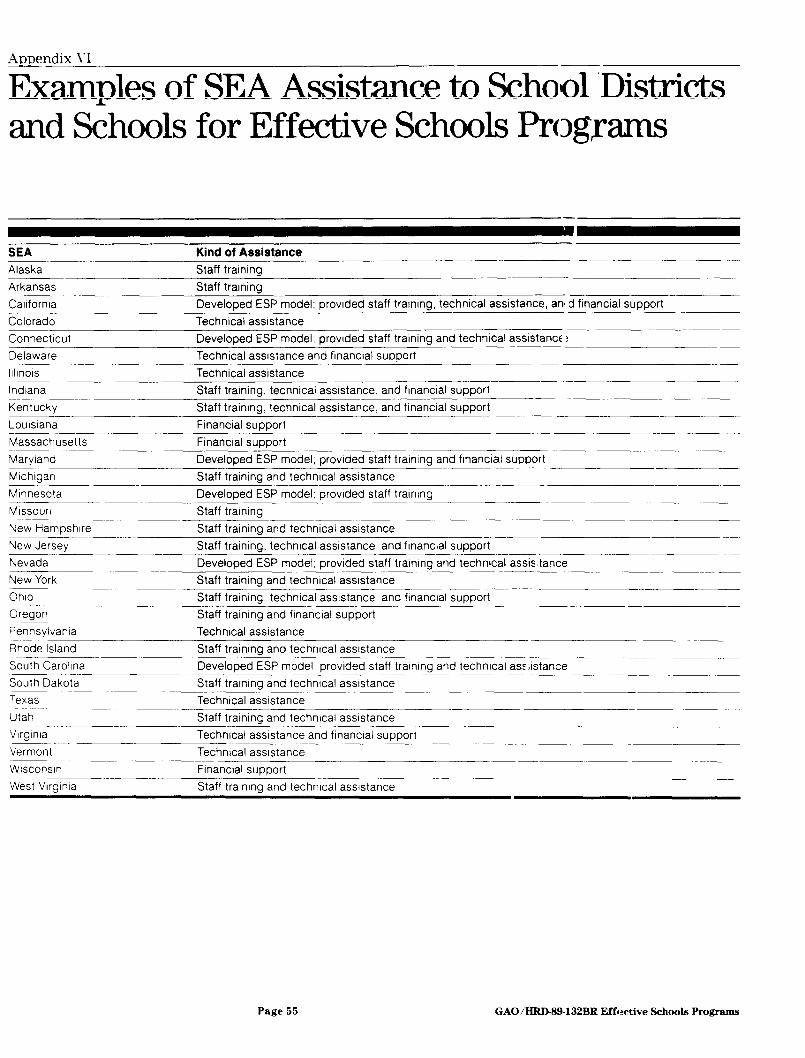
Through interviews with state officials and program experts in all 50 states and the District of Columbia, we identified 31 SEAS that assisted schools and districts in developing or implementing effective schools programs (see fig. 21 and see app. VI for a listing of SEAS and examples of the assistance they provide). We found that SEX staff provided assis- tance through such means as school visits and staff development work- shops, including a train-the-trainers approach, in which SEA staff train district staff to train key school staff. For example, an assistant superin- tendent trained school principals in Marion School District 1, South Car- olina (see fig. 22). A trainer from SEA observed and evaluated this workshop.
Page 36 GAO/HRD-89-132BR Effective Schools Programs
Effective Schools Programs: Their Extent and Characteristics
Figure 22: Train-The-Trainers Staff Development Training
Page 37 GAO/HRD89-132BR Effective Schools Programs
Effective Schools Programs: Their Extent and Characteristics
Fipure 23
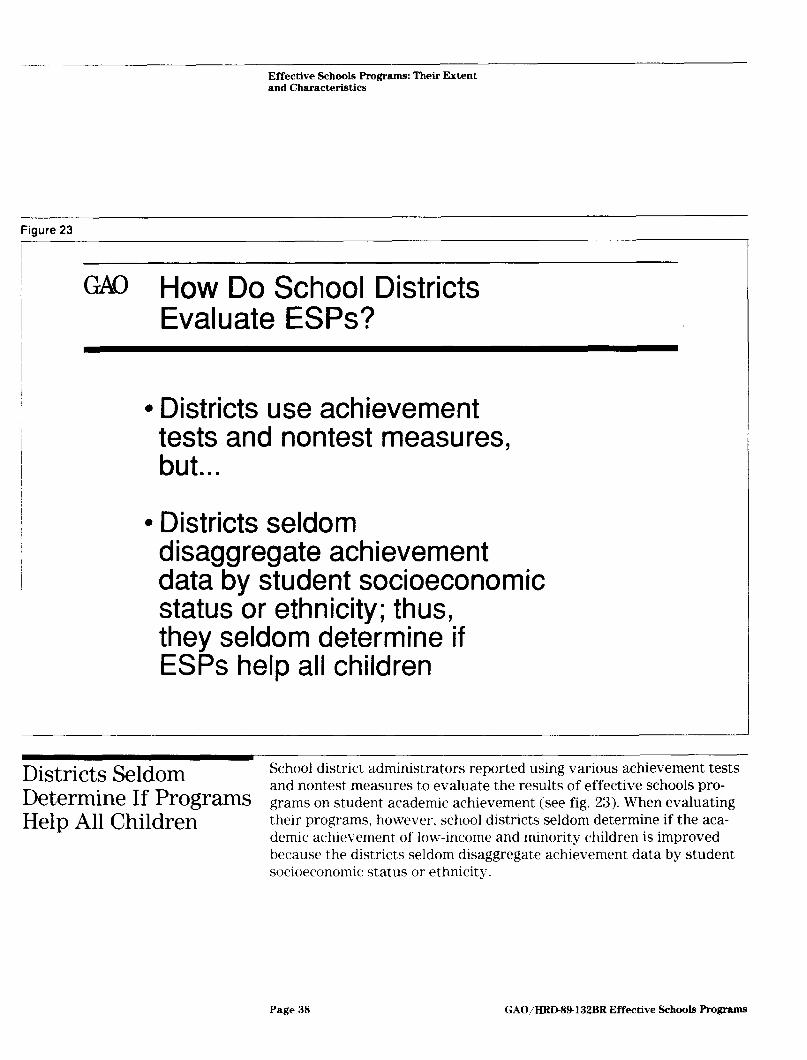
m How Do School Districts Evaluate ESPs?
l Districts use achievement tests and nontest measures, but . . .
l Districts seldom disaggregate achievement data by student socioeconomic status or ethnicity; thus, they seldom determine if ESPs help all children
Districts Seldom School district administrators reported using various achievement tests
Determine If Programs and nontest measures to evaluate the results of effective schools pro- grams on student academic achievement (see fig. 23). When evaluating
Help All Children their programs, however, school districts seldom determine if the aca- demic achievement of low-income and minority children is improved because the districts seldom disaggregate achievement data by student socioeconomic status or ethnicity.
Page 38 GAO/HRD-89132BR Effective Schools Programs
Effective Schools Programs: Their Extent and Characteristics
Figure 24
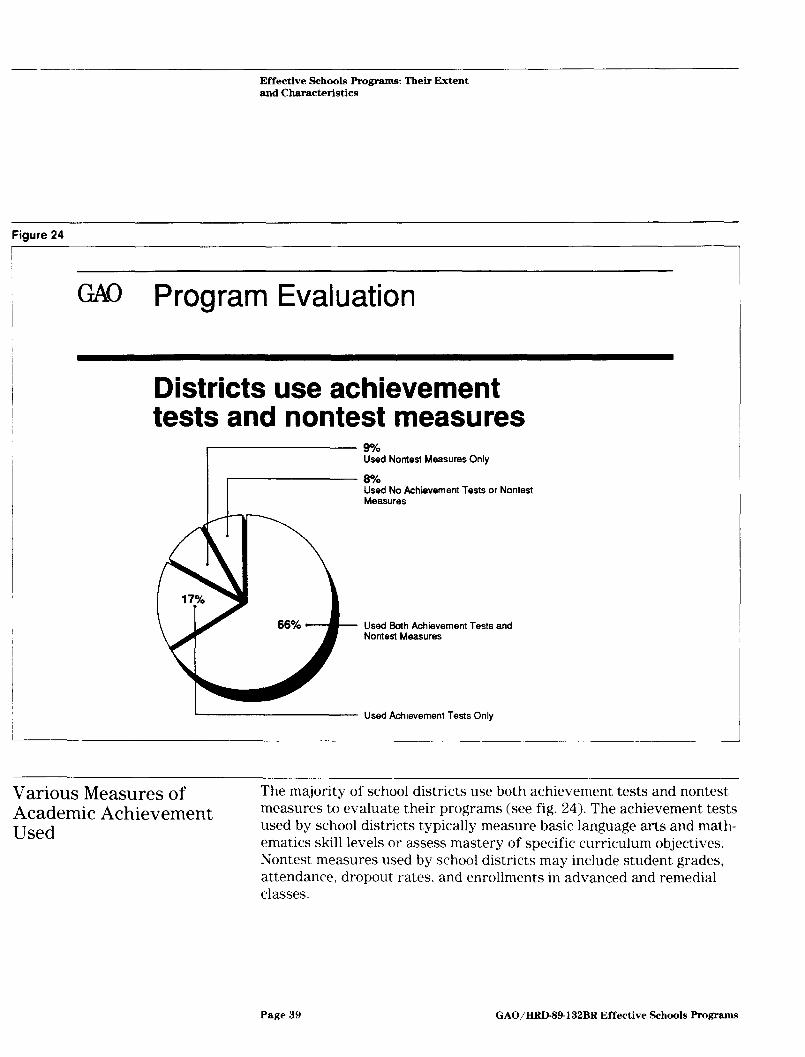
GCAQ Program Evaluation
Districts use achievement tests and nontest measures
1 9%
Used Nontest Measures Only
Used Both Achievement Tests and Nontest Measures
Used Achievement Tests Only
Various Measures of Academic Achievement Used
The majority of school districts use both achievement tests and nontest measures to evaluate their programs (see fig. 24). The achievement tests used by school districts typically measure basic language arts and math- ematics skill levels or assess mastery of specific curriculum objectives. Nontest measures used by school districts may include student grades, attendance, dropout rates, and enrollments in advanced and remedial classes.
Page 39 GAO/KRD-89132BR Effective Schools Programs
Effective Schools Programs: Their Extent and Characteristics
Figure 25
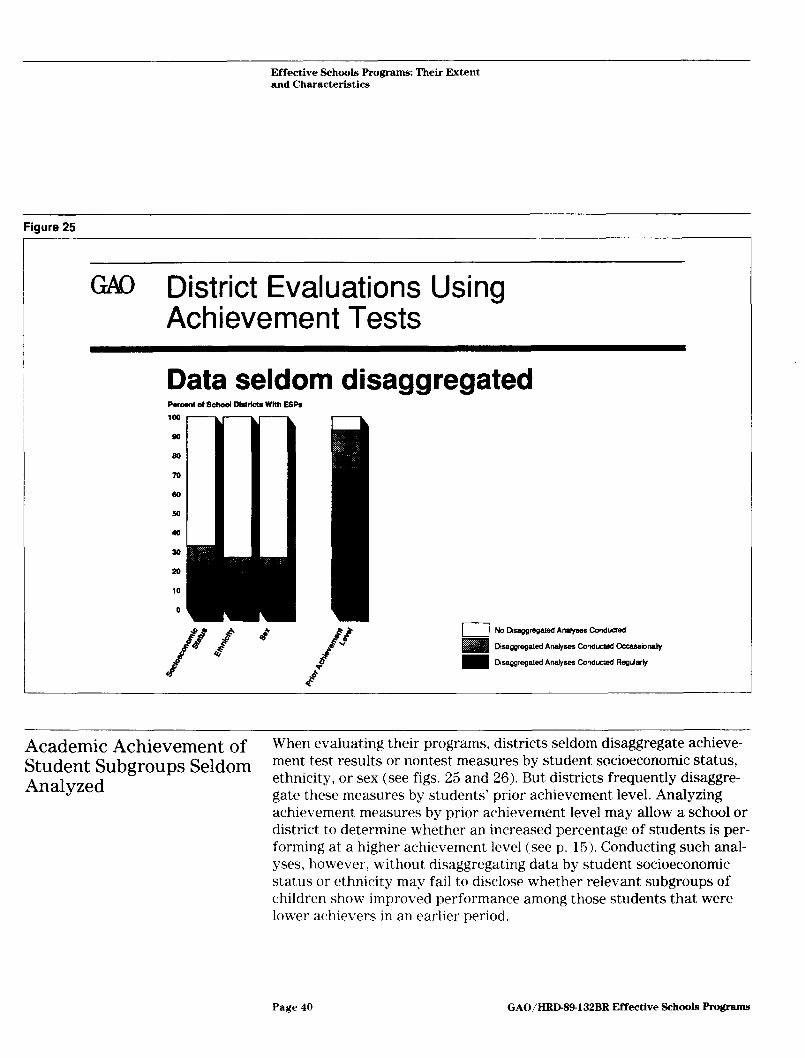
GAQ District Evaluations Using Achievement Tests
Data seldom disaggregated PwcantdSchdDtdrktsWithESF’s
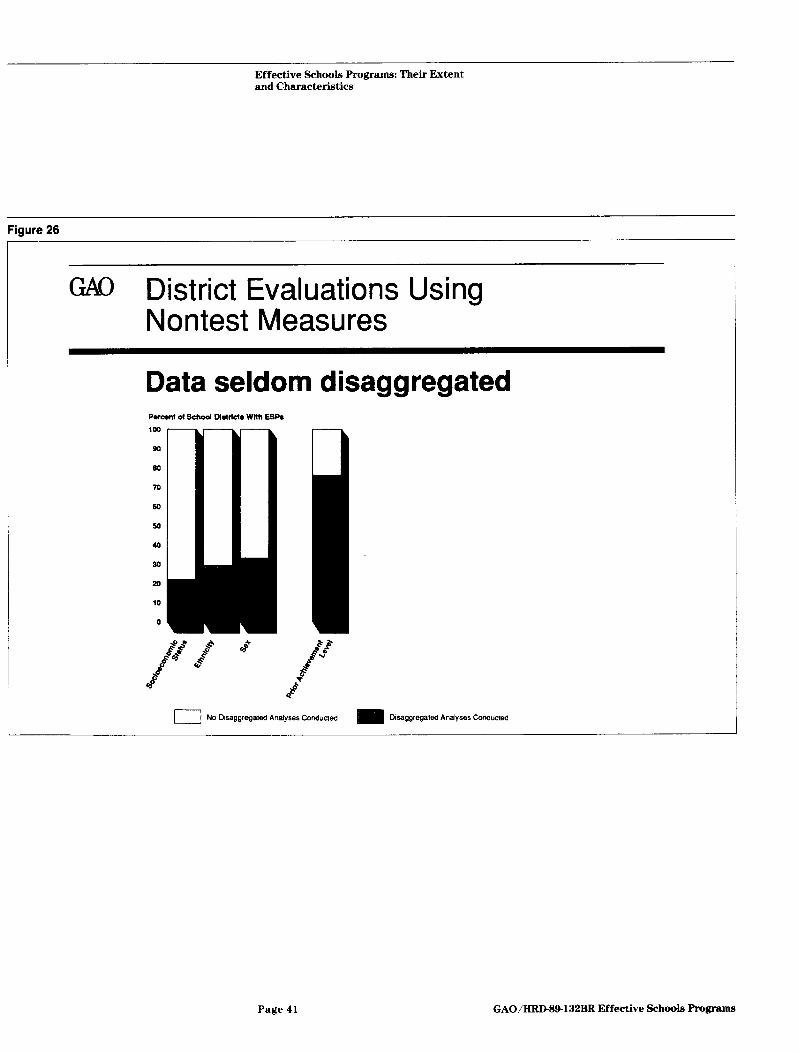
Academic Achievement of When evaluating their programs, districts seldom disaggregate achieve-
Student Subgroups Seldom ment test results or nontest measures by student socioeconomic status,
Analyzed ethnicity, or sex (see figs. 25 and 26). But districts frequently disaggre- gate these measures by students’ prior achievement level. Analyzing achievement measures by prior achievement level may allow a school or district to determine whether an increased percentage of students is per- forming at a higher achievement level (see p. 15). Conducting such anal- yses, however. without disaggregating data by student socioeconomic status or ethnicity may fail to disclose whether relevant subgroups of children show improved performance among those students that were lower achievers in an earlier period.
Page 40 GAOjHRD89-132BR Effective Schools Progmma
Effective Schools Programs: Their Extent and Characteristics
Fiaure 26
GAQ District Evaluations Using Nontest Measures
Data seldom disaggregated P-of School Districts With ESPs
100
90
80
70
60
so
44
30
Page 41 GAO/BRDM-132BR Effective Schools F’rograms
Effective Schools Programs: Their Extent and Characteristics
Figure 27
GAQ In Districts Not Disaggregating By Socioeconomic Status
ESPs serve mix of low-income and higher-income children 25 Porcmt of DIrtrids That Do Not Disaggmgnta Data By Socioeconomic Status
20
15
10
5
0 a
0 l-10 11-20 21-30 31-40 41-50 51a 61-70 71-80 81-90 91-100
Pareont of Chlldmn on Free or Reduced-Prlca Lunch in Schools With ESPs J
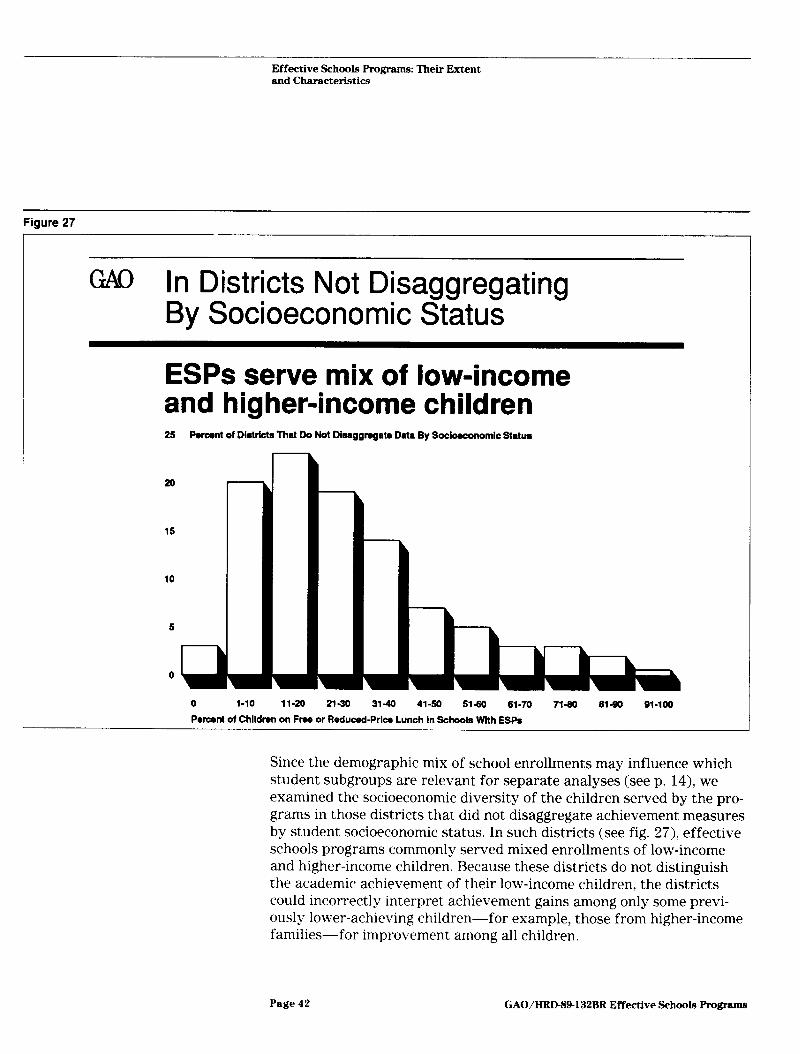
Since the demographic mix of school enrollments may influence which student subgroups are relevant for separate analyses (see p. 14) we examined the socioeconomic diversity of the children served by the pro- grams in those districts that did not disaggregate achievement measures by student socioeconomic status. In such districts (see fig. 27) effective schools programs commonly served mixed enrollments of low-income and higher-income children. Because these districts do not distinguish the academic achievement of their low-income children, the districts could incorrectly interpret achievement gains among only some previ- ously lower-achieving children-for example, those from higher-income families-for improvement among all children.
Page 42 GAO/HRD-89-132BR Effective Schools Programs
Effective Schools Programs: Their Extent and Characteristics
Figure 26
GAQ Chapter 1 and 2 Evaluation Requirements in P.L. loo-297
@The Department must conduct a national study of ESPs funded under Chapter 2
l States must evaluate Chapter 1 and 2 programs and submit evaluations to the Department
l The Department must summarize these state evaluations and periodically report to Congress
Federal Evaluation Requirements for Effective Schools Programs
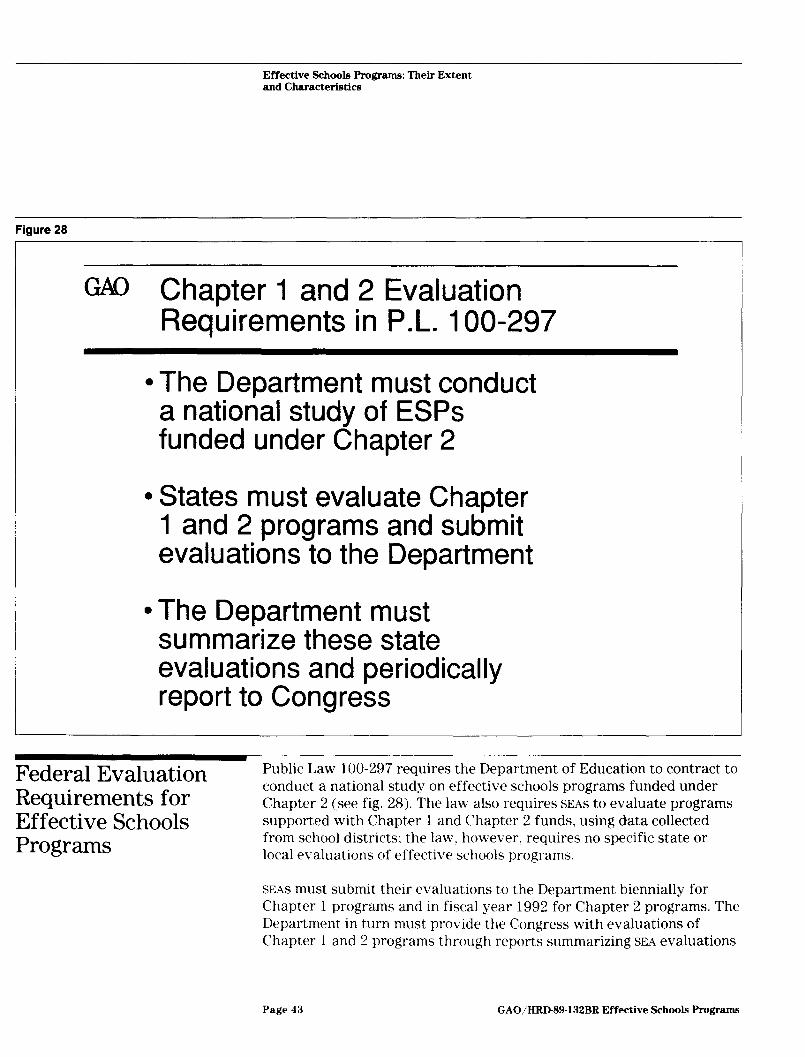
Public Law loo-297 requires the Department of Education to contract to conduct a national study on effective schools programs funded under Chapter 2 (see fig. 28). The law also requires SEAS to evaluate programs supported with Chapter 1 and Chapter 2 funds, using data collected from school districts; the law. however, requires no specific state or local evaluations of effective schools programs.
SEAS must submit their evaluations to the Department biennially for Chapter 1 programs and in fiscal year 1992 for Chapter 2 programs. The Department in turn must provide the Congress with evaluations of Chapter 1 and 2 programs through reports summarizing SEA evaluations
Page 43 GAO/m89.132BR Effective Schools Programs
Effective Schools Programs: Their Extent and Characteristics
of local programs. The Department must submit these reports biennially under Chapter 1 and by October 1, 1992, under Chapter 2. Public Law loo-297 requires the Department to develop (1) national standards for state and local evaluation and reporting purposes under Chapter 1 and (2) a model data collection and reporting system that defines specific data categories to be used by states, at their discretion, for required state evaluations and reports under Chapter 2.
Chapter 1 Reporting
Evaluation and Under Chapter 1, effective schools programs may be funded as school-
Requirements wide projects, which may only operate in schools where at least 75 per- cent of the children enrolled are from low-income families. Public Law loo-297 and Chapter 1 program regulations require districts to annually evaluate schoolwide projects operating in their schools and to make the results, including achievement and other assessment data, available to their SEAS and the public. According to an official in the Department of Education’s planning and evaluation service, the Department plans to examine effective schools programs and their results as part of an implementation study of the Chapter 1 program. The study will include information on (1) the frequency and nature of schoolwide projects and (2) their inclusion of features of effective schools programs. The Depart- ment expects the final report of this study to be available by December 1991.‘”
In addition, Public Law loo-297 and Chapter 1 program regulations require districts to evaluate their Chapter 1 program as a whole at least once every 3 years and to suit the results to their SEAS. SEAS, in turn, must use this information for state-level evaluations that are suitted to the Department. SEAS must also collect data on the race, age, sex, number of children with handicapping conditions, and number of chil- dren by grade level served by Chapter 1 programs; SEAS must annually suit these data to the Department.
Neither Public Law loo-297 nor Chapter 1 program regulations require districts or states to collect information on, or evaluate, effective schools programs separately from other Chapter 1 programs. Public Law lOO- 297 also does not require the Department to separately evaluate effec- tive schools programs funded under Chapter 1. According to the deputy director of compensatory education programs, because districts and states are not required to operate effective schools programs under
15According to the Department. it will also examine effective schools programs and their results in a longitudinal evaluation. begmning dunng school year 199<)-91. of the Chapter 1 program.
Page 44 GAO/HRD89132BR Effective Schools Programs
Effective Schools Programs: Their Extent and Characteristics
Chapter 1, the Department believes that federally required data collec- tion for these programs would be burdensome to SEAS and school districts.
Chapter 2 Evaluation and Under Chapter 2, districts may fund effective schools programs as inno-
Reporting Requirements vative programs to carry out schoolwide improvements-one of six authorized Chapter 2 local targeted assistance programs. Because the Department of Education has not made final decisions on the specific data categories that the Chapter 2 model data collection and reporting system will include, it is uncertain whether any data specifically on effective schools programs will be collected under the state and local evaluation provisions of Chapter 2. Data for these programs will be col- lected, however, for state and local Chapter 2 reporting purposes, according to a draft data collection form we obtained from the Department.
By January 1990, the Department of Education expects to define the model system’s data categories for evaluation purposes. The Depart- ment informed us that it is considering collecting specific data on effec- tive schools programs, but wishes to avoid undue burden on the states. Proposed data categories for state and local reporting purposes were specified during spring 1989. These include (1) the number of children, by grade level, served by each authorized purpose for local targeted assistance, including effective schools programs, (2) the number of schools receiving Chapter 2 funds, and (3) the total amount of Chapter 2 funds used for each targeted assistance purpose.
Concerning the required national study of effective schools programs funded under Chapter 2! the Congress intends data collection for this study to include student achievement outcomes disaggregated by stu- dent socioeconomic status and ethnicity.‘” The Department informed us that it plans to award the contract for the study, if funds are available, during fiscal year 1990 and, if so, expects the study to be completed no later than fiscal year 1992.”
‘“l:.S. Congress House. Elementaq and Secondary Education Conference Report to Accompany H.R. 5 (Rept. 100-567. Apr 13. 1988, p.423)
“The Department said that it also Intends to examine effective schools programs and their results in an ongoing study of effective mstructional practices and curricula in elementary schools with high concentrations of disadvantaged students.
Page 4.5 GAO/HID89132BR Effective Schools F’rograms
Appendix I
Selected Characteristics of Effective Schools Cited in Research Literature
Strong instructional leadership A safe, orderly, and disciplined school climate High expectations for student achievement Monitoring student achievement frequently to evaluate progress Staff consensus on explicit instructional goals and values Collaborative, collegial instructional planning Ongoing, schoolwide staff development training Teacher accountability and acceptance of responsibility for student per- formance A focus on basic-skills acquisition An emphasis on higher-order cognitive skills Increased academic learning time Cooperative activity and group interaction in the classroom Teacher responsibility for instructional and classroom management decisions Clearly recognized principles and guidelines for student behavior and performance Individual school autonomy and flexibility Staff stability and continuity High levels of parental involvement and support District-level support for school improvement High teacher morale and sense of community in school Schoolwide recognition of academic success Teacher empathy, rapport, and personal interaction with students Strategies to avoid retaining students in grade
Source: A compilation of school characteristics that appeared in D.E. Mackenzie, “Research for School Improvement: An Appraisal of Some Recent Trends,” Educational Researcher (Vol.12, No.4, Apr. 1983, pp.5- 17); school characteristics cited in research reviewed in S.C. Purkey and MS. Smith, “Effective Schools: A Review,” The Elementary School Jour- nal (Vol.83, X0.4, March 1983, pp.427-452).
Page 46 GAO/HRD89-132BR Effective Schools Programs
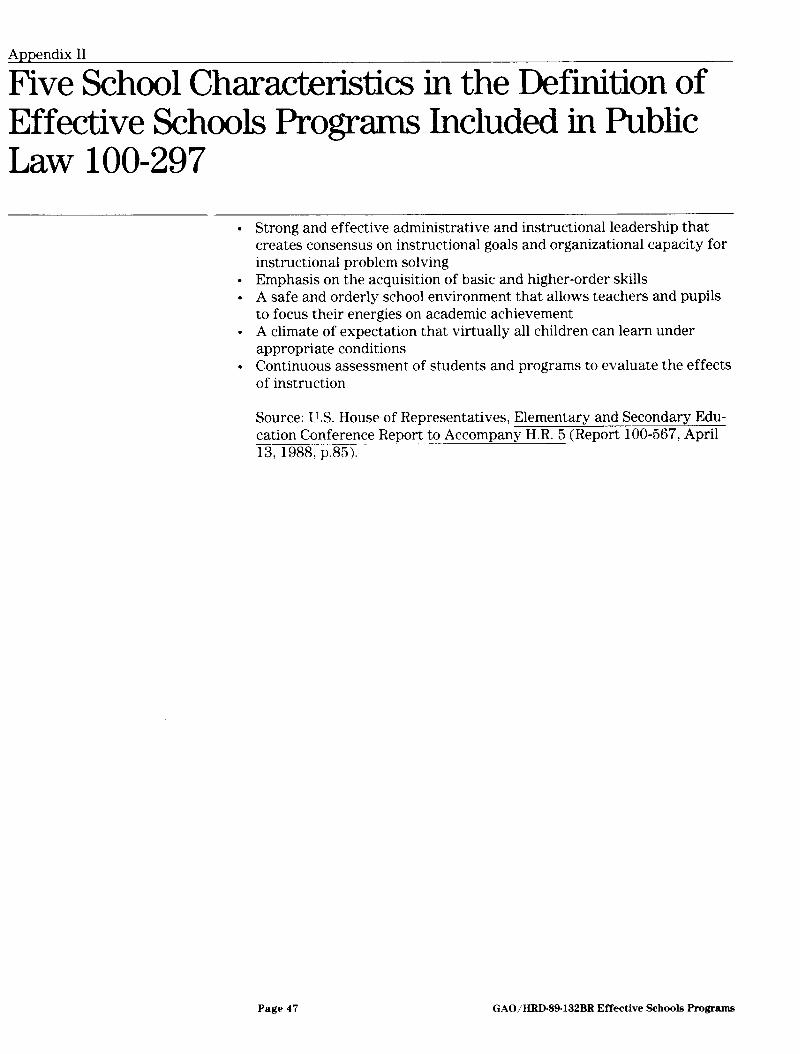
Five School Characteristics in the Definition of Effective Schools Programs Included in Public Law loo-297
l Strong and effective administrative and instructional leadership that creates consensus on instructional goals and organizational capacity for instructional problem solving
. Emphasis on the acquisition of basic and higher-order skills l A safe and orderly school environment that allows teachers and pupils
to focus their energies on academic achievement l A climate of expectation that virtually all children can learn under
appropriate conditions l Continuous assessment of students and programs to evaluate the effects
of instruction
Source: U.S. House of Representatives, Elementary and Secondary Edu- cation Conference Report to Accompany H.R. 5 (Report 100-567, April 13, 1988, p.85).
Page 47 GAOiHRD-89.132BR Effective Schools F’rograms
Appendix 111
Chapter 2 Block Grant Program: Six Authorized Local Targeted Assistance Programs
l Programs to meet the educational needs of students at risk of dropping out and students for whom providing an education entails higher-than- average costs
l Programs for the acquisition and use of instructional and educational materials, including library books, reference materials, computer soft- ware and hardware for instructional use, and other curricular materials that would be used to improve the quality of instruction
l Innovative programs designed to carry out schoolwide improvements, including effective schools programs
l Programs of training and professional development to enhance the knowledge and skills of educational personnel, including teachers, librarians, school counselors and other pupil services personnel, and administrators and school board members
l Programs designed to enhance personal excellence of students and stu- dent achievement, including instruction in ethics, performing and crea- tive arts, humanities, activities in physical fitness and comprehensive health education, and participation in community service projects
l Other innovative projects which would enhance the educational pro- gram and climate of the school, including programs for gifted and tal- ented students, technology education programs, early childhood education programs, community education, and programs for youth sui- cide prevention
Source: U.S. House of Representatives, Elementary and Secondary Edu- cation Conference Report to Accompany H.R. 5 (Report 100-567, April 13, 1988, p.83).
Page 48 GAO/HRD-89132BR EfTective Schools Programs
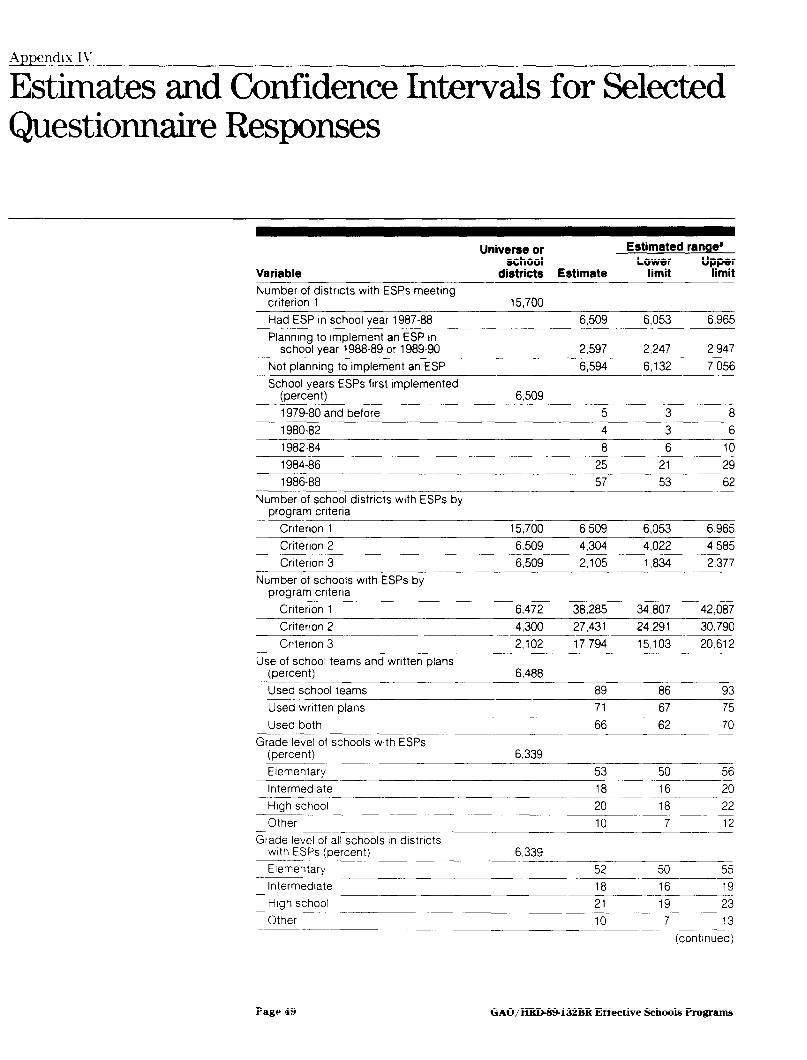
Estimates and Confidence Intervak for Selected Questionnaire Responses
Variable
Universe or Estimated range0 school Lower
districts Estimate limit “1%;
Number of districts wtth ESPs meetrng
Crtterion 3
criterion 1 Had ESP in school vear 1987-88
Planmng to Implement an ESP tn school year 1988-89 or 198990
Not plannrng to implement an ESP
School years ESPs frrst Implemented (percent) 1979-80 and before
1980-82
1982-84
1984-86
1986-88 Number of school districts with ESPs by
program criteria
Criterion 1
Criterion 2
Cnterion 3 Number of schools with ESPs by
program criteria
Critenon 1
Cntenon 2
15,700 6.509 6.053 6,965
2,597 2,247 2,947
6,594 6,132 7,056
6,509 5 3 8
4 3 6
8 6 10
2.102
25
17,794
21
15,103
29
20.612
57 53 62
15,700 6,509 6,053 6,965
6.509 4,304 4,022 4,585
6,509 2,105 1,834 2,377
6,472 38,285 34,807 42,087
4.300 27.431 24.291 30.790
Use of school teams and written plans (percent)
Used school teams 6,488
89 86 93 Used written plans 71 67 75 Used both
Grade level of schools with ESPs (oercent)
66 62 70
6.339 Elementarv 53 50 56 lntermedrate 18 16 20 --____ Hrgh school 20 18 22 ____-. Other 10 7 12
Grade level of all schools In drstncts with ESPs (percent)
-. Elementary ---___- Intermediate
6,339 52 50 55 18 16 19
High school 21 19 23 Other 10 7 13
Page 49 GAO/HRDW-132BR Effective Schools Programs
Appendix N Estimates and Confidence Intervals for !Selected Questionnaire Responses
Variable
Universe or Estimated range0 school Lower
districts Estimate limit “yg
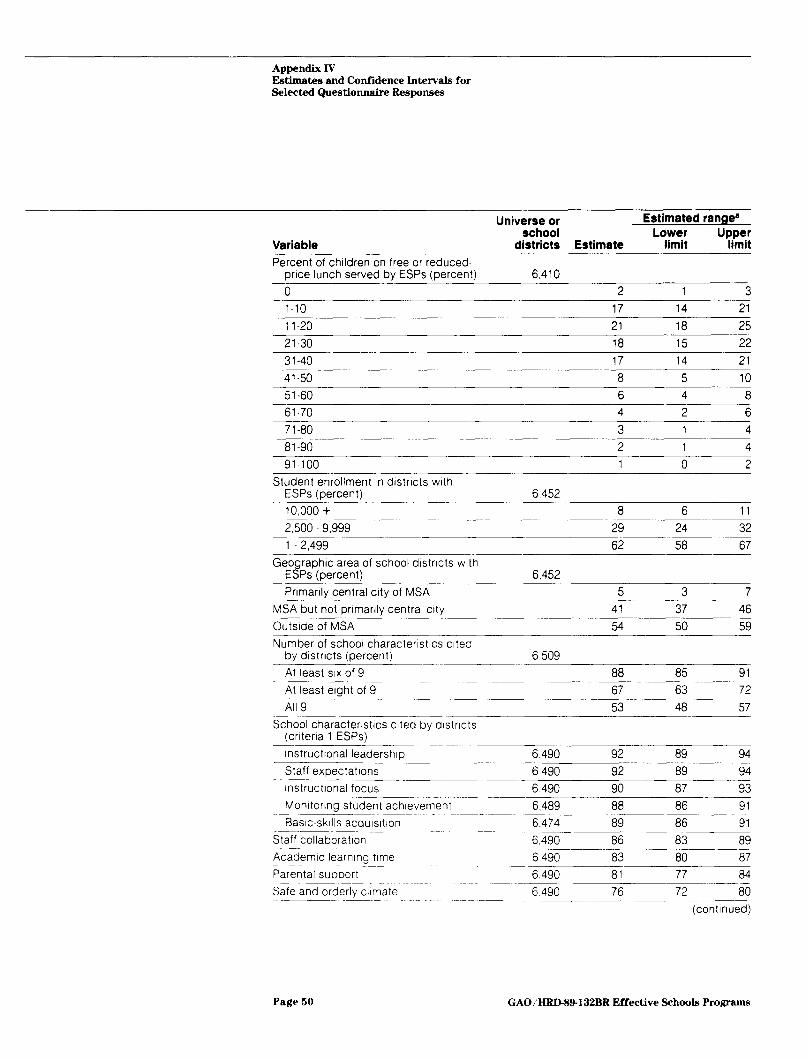
Percent of children on free or reduced- price lunch served bv ESPs (percent) 6,410
0 2 1 3
l-10 17 14 21
11-20 21 18 25
21-30 18 1.5 22
31-40 17 14 21
41-50 8 5 10
51-60 6 4 8
61-70 4 2 6
71-80 3 1 4
81-90 2 1 4
91-100 1 0 2
Student enrollment tn drstncts wrth
Outside of MSA
ESPs (percent) 10.000 + -___ 2,500 - 9,999
1 2,499
Geographic area of school drstncts w;h ESPs (percent) Pnmanly central city of MSA
MSA but not onmanlv central crtv 54
6,452
50 59
8 6 11
29 24 32
62 58 67
6,452 5 3 7
41 37 46
Number of school characterrstrcs cited by drstncts (percent) 6,509 _______- At least SIX of 9 88 85 91
At least eight of 9 67 63 72 -___-______ All 9 53 48 57
School charactenstrcs cited by drstncts (crltena 1 ESPs)
Instructtonal leadership 6,490 92 89 94
Staff expectations 6 490 92
Instructional focus 6,490 90
Monrtonng student achievement 6,489 88
Basrc-skulls acqursltron 6,474 89
Staff collaboration 6,490 86
Academrc learning trme 6,490 83
Parental support 6.490 81
Safe and orderly climate 6 490 76
89 94
87 93
86 91
86 91
83 89 80 87
77 84
72 80 (continued)
Page 50 GAO/HRD+4132BR Effective Schools Programs

Appendix IV E&mates and Confidence Intervals for selected Questionnaire Respomes
Universe or Estimated range’
Variable School characteristics cited by districts
(criteria 2 ESPs) (percent)
Instructional leadership
Staff expectations
lnstructronal focus
Monitonna student achievement
school Lower districts Estimate limit
4,285 92 89
4,285 92 89
4,285 93 90
4,284 90 87
yi$;
96
95
96
93
Basrc-skulls acquisition 4,269 92 89 95
Staff collaboration 4,285 89 85 92
Academtc learnrng trme 4,285 84 80 88
Parental support 4.285 85 81 89
Safe and orderlv climate 4,285 80 75 84
School characteristrcs cited by districts
Staff expectations
(criteria 3 ESPs) (percent)
Instructional leadership 94
2,087
90 98
96 93 99
Instructional focus 97 94 100
Monitoring student achrevement 91 87 96
Basic-skills acauisrtron 96 92 99
Staff collaboration 94 90 97
Academic learning time 89 84 94
Parental support 92 88 96
Safe and orderlv climate 88 82 93
School dtstnct involvement In ESPs (percent)
All schools with ESPs were required to have them
Some schools with ESPs were required to have them
All schools with ESPs voluntanly chose to have them
6,468
46 42 51
4 2 6
50 45 54
Whether distnct developed program
No
with external assistance (percent)
Yes
36
6,505
32 40
64 60- 68
Source of external assistance (percent)
SEA ---___ University Educational laboratory
Other
4.161 64 58- 69
4.142 -31 26 36 4,127 36 30 41
4 149 31 26 36 (continued)
Page 51 GAO/BRD-S9132BR Effective Schools F’rograms
Appendix IV Estlmat.es and Confidence Intervala for selected QuestioNuLre Reaponsea
Universe or Estimated range. school Lower
Variable districts Estimate limit “;;;
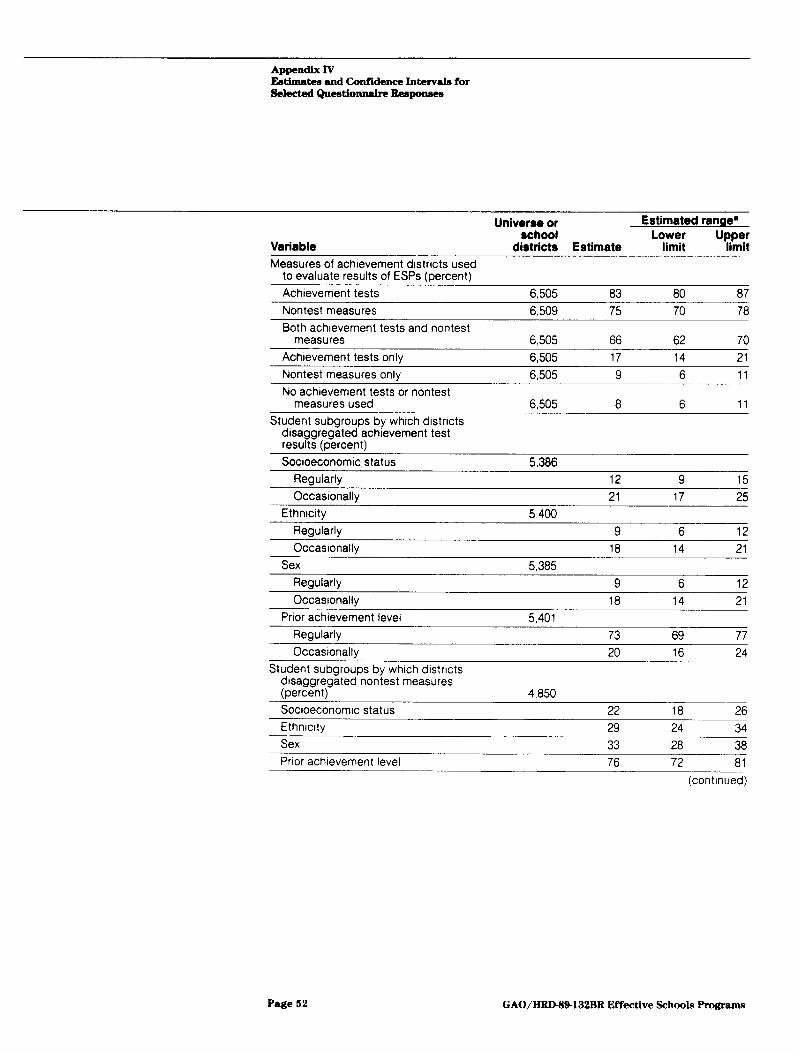
Measures of achievement districts used to evaluate results of ESPs (percent)
Achievement tests 6,505 83 80 87
Nontest measures 6,509 75 70 78 Both achievement tests and nontest
measures 6,505 66 62 70
Achievement tests only 6,505 17 14 21
Nontest measures only 6,505 9 6 11
No achievement tests or nontest measures used 6,505 8 6 11
Student subgroups by which districts disaggregated achievement test results (percent)
Socioeconomic status 5,386
Regularly 12 9 15
Occasionally 21 17 25
Ethnicity 5,400
Regularly 9 6 12
Occasionally 18 14 21
Sex 5,385
Regularly 9 6 12
Occasionally 18 14 21 Prior achievement level 5,401
Regularly 73 69 77
Occasionally 20 16 24 Student subgroups by which districts
dtsaggregated nontest measures (percent) 4,850
Socioeconomic status 22 18 26
Ethnrcrty 29 24 34
Sex 33 28 38
Prior achievement level 76 72 81 (continued)
Page 62 GAO/HBD84132BR Effective Schools Programa
Appendix IV Estimatea and Gmfldence Intervals for selected Questionnaire Responws
31-40
0
Variable
l-10
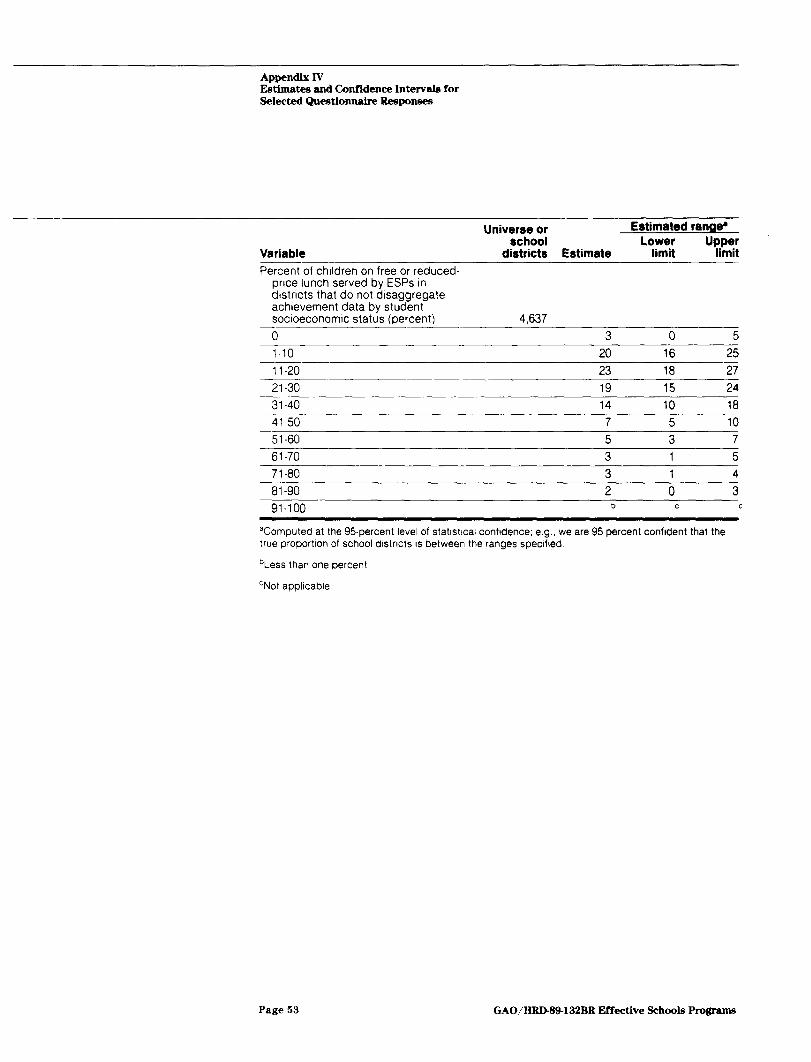
Percent of children on free or reduced-
11-20
price lunch served by ESPs in districts that do not disaggregate achievement data by student socioeconomic status (oercent)
21-30
Universe or
14
3
Estimated range’ school
10
0
Lower
18
5
districts Estimate
20
limit
16
?I%
25
23 18 27
4,637
19 15 24
41-50 7 5 10
51-60 5 3 7
61-70 3 1 5
71-80
81-90
91-100
3 1 4
2 0 3 b c c
%omputed at the 95.percent level of statistical conftdence; e,g., we are 95 percent confident that the true proportlon of school dlstrlcts IS between the ranges specified
bLess than one percent
‘Not applicable
Page 53 GAO/BRDB9-132BR Effective Schools Programs

Amendix 1’
Effective Schools Programs in the Fifty Largest Cities (School Year 1987-88)
Cityb 1 Criteria’
2 3 1 Criteria
2 3
New York, NY Yes Gs .4naeles. CA Yes
Yes
Yes Yes
Yes
Austin, TX
Oklahoma Cltv. OK
Yes
Yes
Yes
No
Yes
Noe Chicago, IL Yes Yes Yes Kansas City, MO Yes Yes Yes Houston. TX Yes Yes Yes Fort Worth, TX
St Louis, MO Atlanta. GA
Yes Yes Yes Philadelphia PA Detroit Ml
Yes
Yes
Yes
Yes No Yes
Yes d
Yes d
Yes d
San Dleqo, CA Yes Yes Yes Lona Beach, CA Yes Yes No Dallas, TX Yes Yes No Portland, OR
Pittsburgh, PA
Miami. FL
Tulsa, OK
Honolu%. HI
Yes Yes Yes San Antonlo, CA
Phoenix. AZ
Baltimore. MD
San Francisco, CA
c
Yes
Yes
Yes
c
Yes
Yes
Yes
c
Yes
Yes
Yes
Yes
Yes
Yes
Yes
Yes
Yes
Yes
Yes
Yes
Yes
No
Yes lndlanapolts, IN
San Jose. CA Memphis. TN
WashIngton. D.C Jacksonville, FL
Milwaukee WI Boston MA
Columbus. OH -.____ New Orleans, LA Cleveland, OH ~_...___ Denver, CO
El Paso TX Seattle. WA
Nashville TN
Yes Yes Yes Clnclnnatl, OH No f f d
d
Yes
d
d
Yes
d
a
Yes
Albuquerque, NM
Tucson, AZ
Oakland, CA
Yes d
Yes
Yes d
Yes
No d
No Yes Yes Yes Mlnneapolls, MN d d d
Yes c
Yes
Yes
Yes c
No
Yes
Yes c
Noe
Yes
Charlotte, NC
Omaha, NE
Toledo, OH
VIralma Beach, VA
Buffalo, NY
Sacramento. CA
Newark, NJ
No I f
Yes Yes Yes
Yes No Noe C C C
Yes
Yes
Yes d
Yes
Yes
Yes
Yes -___ d
____ -- Yes
Yes
Yes
No d
Yes
Yes
Yes
Yes
Yes
Yes
Yes
No
Yes
No
aThese crlterla are shown In figure 10
bCltles are presented tn order of we
“School dlstrlct Intends to Implement program during school year 1988-89 or 1989-90
“No response to questionnaire received
eDlstrlct dlsaggregates academic achievement data by student socloeconomlc status or ethnlclty
‘Not applicable
Page 54 GAO/HID-89-132BR Effective Schools Programs
Appendix \‘I
Examples of SEA Assistance to School ‘Districts and Schools for Effective Schools Pugyams
--
SEA Kind of Assistance
Alaska Staff training
Arkansas Staff trarning California Developed ESP model: provrded staff training, technical assistance, an’ d financial support
Colorado Technical assistance
Connecticut Developed ESP model: provided staff training and technical assrstancc ?
Delaware Technical assrstance and financial support
lllinors Technical assistance lndrana Staff training, technical assrstance, and financial support Kentucky Staff training, technical assrstance. and financial support
Louislana Financial support Massachusetts
Maryland
Mrchrgan
Minnesota ___-- MIssour
New Hampshire -
New Jersey
Nevada New York
6hro Oregon
Pennsylvanra -
Rhode Island
South Carolrna
South Dakota Texas
Utah Vrrginia
Vermont
Wisconsin
West Virginia
Financial support
Developed ESP model; provided staff training and financial support __. Staff training and technical assistance
Developed ESP model: provided staff training
Staff training
Staff training and technical assrstance
Staff training, technrcal assistance, and financial support
Developed ESP model; provided staff trarnrng and technrcal assistance Staff training and technical assistance
Staff training, technical assrstance, and frnancral support
Staff training and financial support
Technrcal assistance
Staff training and techntcal assistance Developed ESP model. provided staff trarnrng and technrcal assiistance
Staff trarnrng and technrcal assistance
Techntcal assrstance
Staff training and technical assrstance
Technical assrstance and financial support ._____ -__ Technical assistance
-
Financral support
Staff trarnrng and technical assstance
Page 55 GAO/HRD89-132BR Effwtive Schools Programs
Appendix 1’11
Tables Suepynrting Figures in Report Text and Supplementary Tables
Table VII.1: Extent of ESPs Mese!ting Criterion 1 in U.S. Districts (Da ta for Fig.9) School districts
Number Percent
Had ESP In school year 1987-88 6,509 41
Planning to implement an ESP tn school year 1988-89 or 1989-90
Not olannlna to lmolement an ESP
2,597 17
6.594 42
Total 15,700 100
Table Vll.2: School Years ESPs Fi rst Implemented (Data for Fig 10)
School vears Percent of school
districts
1979-80 and before 5
1980-82 4
1982-84 8
1984-86 25
1986-88 57
Table VII.3 Numlaer of School Distric:ts and Schools With ESPs by Program Criteria (Data for t-ig 11)
Criteria Districts Schools - 1 6,509 38,285
2 4,304 27,431
3 2,105 17.794
Table Vll.4: Use of School Teams and Written Plans
Used School Teams
Used Written Plans
Used Both Teams and Plans
Percent of school districts with ESPs
89 71
66
Table Vll.5: Grade Llrvel of Schools With ESPs (Data for Fig 13) Average percent of schools in
districts with ESPs Schools
with Grade level ESPs Schools Elementary 53 52 Intermediate 18 18 High School 20 21 ..~.~ Other Grade Levels 10 10
l’age 56 GAO/HRD89-132BR Effective Schools Programs
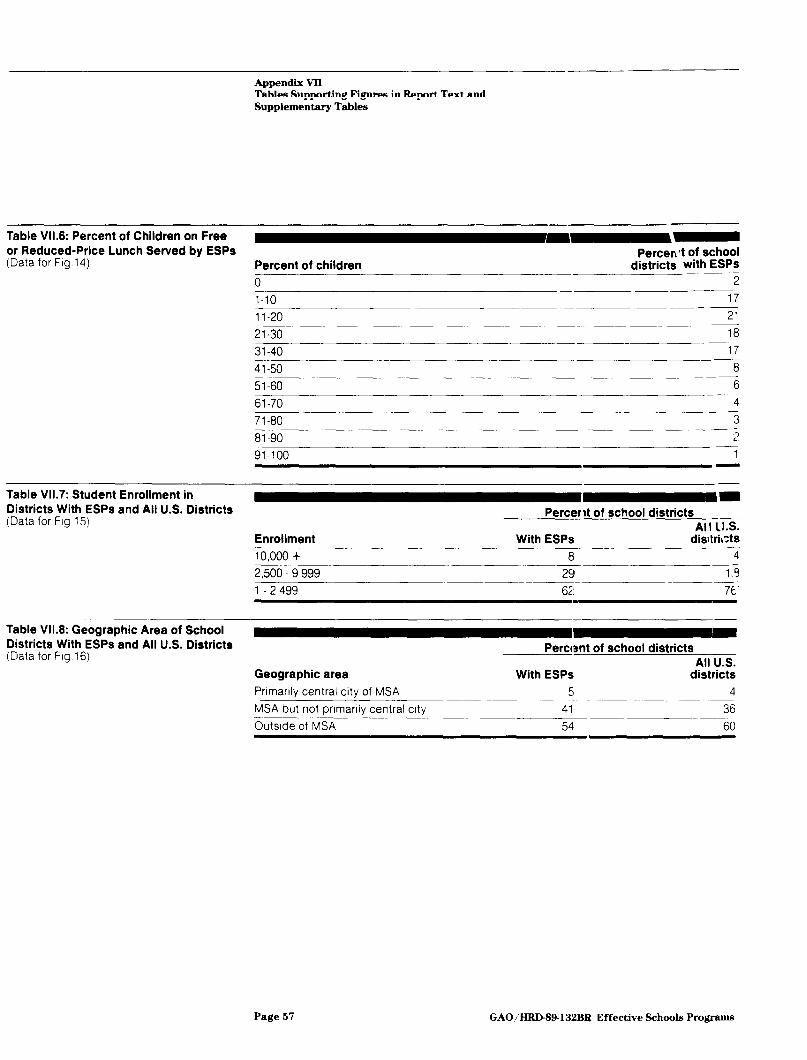
Appendix VII Tables Supporting Fires in Report Text and Supplementary Tables
Table Vll.6: Percent of Children on Free --- or Reduced-Price Lunch Sewed by ESPs Percent of school (Data for Fig 14) Percent of children districts with ESPS
0 2 -~ l-10 17
11-20 -7
21-30 18 31-40 17
41-50 8 -- 51-60 6 61-70 4
71-80 3
81-90 2 91-100 1
Table Vll.7: Student Enrollment in -m Districts With ESPs and All U.S. Districts (Data for Fig 15)
Percerrt of school districts _- Al I 1I.S.
Enrollment With ESPs disitric:ts
10,000 + 8 4 ..___- 2,500 9,999 29 lL5 ~___- 1 - 2.499 6i! 76‘
Table Vll.8: Geographic Area of School Districts With ESPs and All U.S. Districts (Data for Fig 16)
Perccrnt of school districts All U.S.
Geographic area With ESPs districts .~.- Primarily central city of MSA 5- 4
MSA but not prlmarlly central city -- Outside of MSA
41 36
54 60
Page 57 GAO4IRD89-132BR Effective Schools Programs
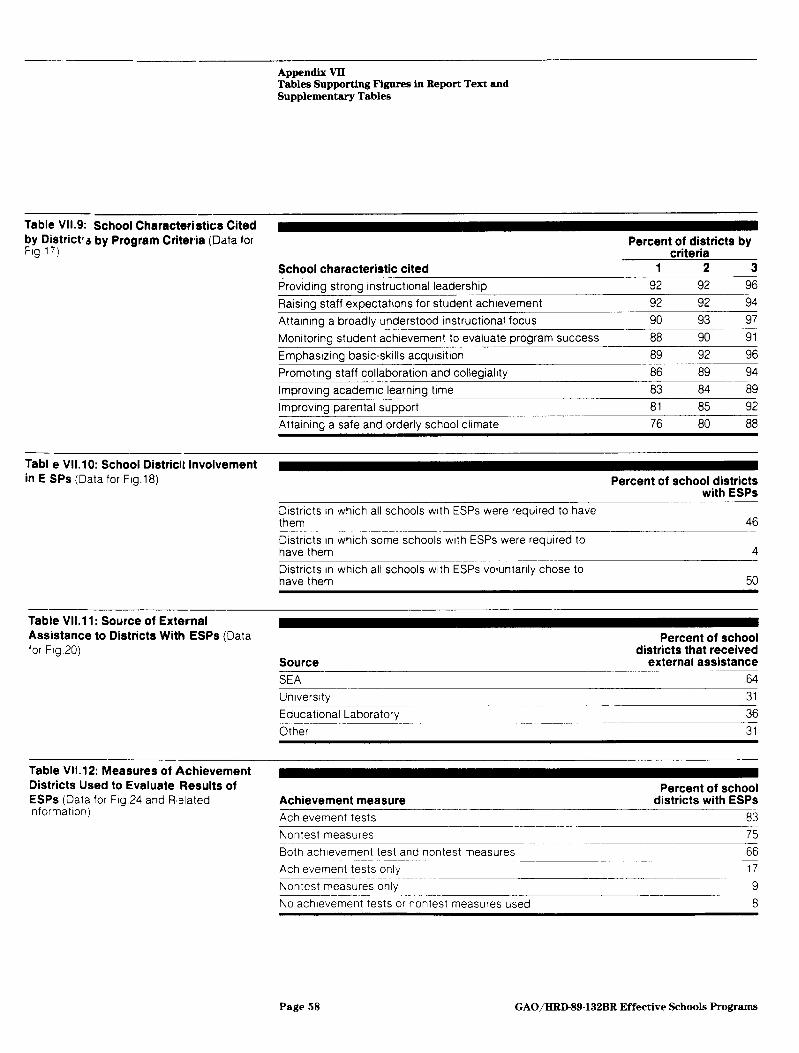
Appendix VII Tables Supporting Figures in Report Text and Supplementary Tables
- Table Vll.9: School Characteristics Cited by District13 by Program Criteria (Data for Frg 17)
Percent of districts by criteria
School characteristic cited 1 2 3
Providing strong instructional leadership 92 92 96
Raising staff expectations for student achrevement 92 92 94
Attarnrng a broadly understood instructional focus 90 93 97
Monitonng student achrevement to evaluate program success 88 90 91
Emohasizina basic-skills acaursition 89 92 96 Promoting staff collaboration and collegialrty 86 89 94
Improving academic learning trme 83 84 89 Improving parental support 81 85 92
Attainina a safe and orderlv school climate 76 80 88
Tab1 e Vll.10: School District Involvement in E SPs (Data for Frg.18) Percent of school districts
with ESPs
Drstncts in which all schools wrth ESPs were required to have them
Districts In which some schools with ESPs were required to have them
46
4
Districts In which all schools wrth ESPs voluntarily chose to have them 50
Table VII.11: Source of External Assistance to Districts With ESPs (Data for Fig 20)
Source
SEA
Percent of school districts that received
external assistance
64
University 31
Educational Laboratory 36
Other 31
Table Vll.12: Measures of rlchievement Districts Used to Evaluate Results of ESPs (Data for Fig.24 and Related Informatron)
Achievement measure Achievement tests
Percent of school districts with ESPs
83
Nontest measures 75 Both achievement test and nontest measures 66
Achrevement tests only 17
Nontest measures only 9 Rio achrevement tests or nontest measures used 8
Page 58 GAO/HRKM9-132BR Effective Schools Programs
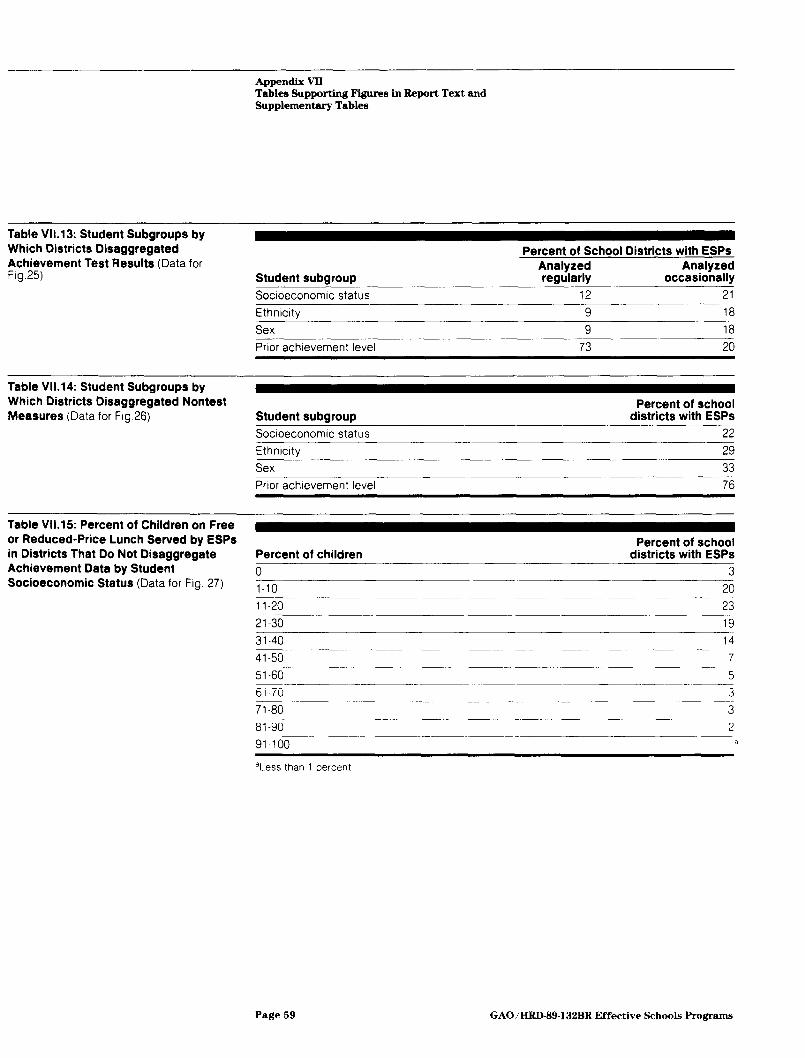
Appendix VII Tables SupportIng Figures in Report Text and Supplementary Tables
Table Vll.13: Student Subgroups by Which Districts Disaggregated Achievement Test Results (Data for Flg.25) Student SubarouD
Percent of School Districts with ESPs Analyzed Analyzed reaularlv occasionally
Socioeconomic status 12 21
Ethnicity 9 18
Sex 9 18
Prior achievement level 73 20
Table Vll.14: Student Subgroups by Which Districts Disaggregated Nontest Measures (Data for Flg.26) Student subgroup
Socioeconomic status
Percent of school districts with ESPs
22
Ethnlcity 29
Pnor achievement level 76
Table VII.15 Percent of Children on Free or Reduced-Price Lunch Sewed by ESPs Percent of school in Districts That Do Not Disaggregate Percent of children districts with ESPs Achievement Data by Student 0 3 Socioeconomic Status (Data for Fig. 27) .~
l-10 20
21-30 19 31-40 14
41-50 7
51-60 5 - _____~. ___~... 61-70 3 ____. 71-80 3 81-90 2
91-100 a
aLess than 1 percent
Page 59 GAO/HRlM9-132BR Effective Schools Programs
Appendix VIII
Major Contributors to This Report
Human Resources Division,
William J. Gainer, Director, Education and Employment Issues,
Washington, DC.
(202) 275-5365 Fred E. Yohey, Jr, Assistant Director Deborah R. Eisenberg, Assignment Manager Richard J. Wenning, Evaluator-in-Charge Joanne R. Frankel, Technical Advisor C. Robert Deroy, Evaluator (Computer Science) Michael J. O’Dell, Social Science Analyst
(206096) Page 60 GAO ‘-89.132BR Effective Schools Programs
Requests for copies of GAO reports should be sent to:
U.S. General Accounting Office Post Office Box 6015 Gaithersburg, Maryland 20877
Telephone 202-275-6241
The first five copies of each report are free. Additional copies are $2.00 each.
There is a 25% discount on orders for 100 or more copies mailed to a single address.
Orders must be prepaid by cash or by check or money order made out to the Superintendent of Documents.
uuited states General Accounting Office Wmhington, D.C. 20548
Uffkial Business Pen&y for Private Use $300
‘aid I
,