Embed Size (px)
Citation preview

Wwch 1887 DISL,oCATED WORKERS -
Local Programs tid Outcomes Under the Job Training Partnership Act
*
I GAb/EDtD43741 I

w

GAO United States General Accounting Office Washington, D.C. 20648
Comptroller General of the United States
B-223485
March 5, 1987
To the President of the Senate and the Speaker of the House of Representatives
This report discusses the characteristics and outcomes of Job Training Partnership Act title III dislocated worker projects operating nationwide. It should assist the Congress in considering proposals to restructure worker assistance programs. We surveyed all title III projects operatmg between October 1982 and March 1985.
Copies of the report are being sent to the appropriate House and Senate committees and subcommittees; the Director, Office of Management and Budget; the Secretary of Labor; title III project operators; and other interested parties.
Charles A. Bowsher Comptroller General of the IJnited States

-- Executive Sunmary
Purpose With the U.S. economy contmually changing, many workers are dislo- cated every year- even in times of economic expansion or recovery from recession. According to the Bureau of Labor Statistics, an esti- mated 2.2 million workers annually were dislocated from their jobs because of business closures or employment cutbacks during the 5-year period from January 1981 to January 1986. (See p. 10.)
In 1982, the Congress created title III of the Job Training Partnership Act specifically to facilitate the reemployment of dislocated workers. The $650 million distributed through the program from its inception through June 30, 1986, has provided assistance to, at most, 7 percent of the eligible workers. (See pp. 12-13.)
To assist the Congress in its oversight of the program, GAO surveyed all title III projects operating between October 1982 and March 1985 to obtain program mformation concerning* (1) results achieved, such as placement rates and average wage levels; (2) assistance provided to par- ticipants, including skill training, direct placement, and support ser- vices; (3) characteristics of participants; and (4) program administration.
This analysis should also assist the Congress in considering the admims- tration plan contained m the fiscal year 1988 budget proposal to restruc- ture existing assistance to dislocated workers under a new program at a much higher funding level.
Background For states to receive title III formula funds, the Job Training Partner- ship Act requires them to match at least part of their allocation with nonfederal resources--either cash or in-kind contributions, such as unemployment compensation, the employer’s share of on-the-job . training wages, and the state’s share of college and vocational center funds. The Congress recently amended the act to prevent the application of the matching requirement to title III funds allocated at the discretion of the Secretary of Labor.
Results in Brief -
Title III projects reported having placed 69 percent of their participants in jobs-a higher rate than was achieved by earlier employment and training programs. The average wage level reported for the jobs in which title III participants were placed was $6 61 per hour-sigmfi- cantly higher than the wage levels reported by other employment and training programs but generally lower than participants’ prior wages
Page 2 GAO/HRD-8741 Dislocated Workers

Executive Summary
and considerably below the $8.62 an hour paid to private sector hourly nonsupervisory workers.
While the services provided to title III participants varied considerably, the predominant service provided was job placement assistance (over 80 percent). Fewer than half of the participants received occupational skill training, and fewer than a quarter received support services.
The characteristics of the title III participants generally paralleled those of the dislocated worker population identified by the Bureau of Labor Statistics. However, title III projects enrolled proportionately fewer older and less educated dislocated workers.
JTPA title III allows states wide latitude in designing dislocated worker programs. The result has been considerable variation in the approaches used to allocate funds to local projects, the organizations operating projects, and the extent to which projects focused on specific business closures or layoffs. Two issues emerged from GAO'S analysis regarding the administration of title III projects. (1) the need to speed up imple- mentation of title III projects in some states and (2) the need to reevaluate the matching requirement.
GAb Analysis GAO analyzed the responses from 563 title III projects operating between October 1982 and March 31, 1985, to a questionnaire concernmg their last 9 months of operation. (See pp. 13-14 )
Placement Rates and Wages Project success rates varied substantially among projects. About a third of the projects had placement rates above 80 percent, while 14 percent of the projects had placement rates below 40 percent. About a quarter II of the projects placed participants in jobs averaging above $7.00 an hour, while about 28 percent had average placement wage levels at $6.00 an hour or less.
Outcomes Vary With Prq ect Characteristics
Outcomes also varied with project characteristics, such as the organiza- tions operating projects, training activities emphasized, or the extent of focus on specific business closures or layoffs. Projects emphasizmg on- the-job training had higher-than-average placement rates, 78 percent. However, the average wage rates for these projects were well below the
Page 3 GAO/HRD-8741 Dislocated Workers

Ekecutive Summary
average. Projects with a focus on a specific business closure had rela- tively higher average wage rates, $7.03 an hour, but lower average placement rates, about 65 percent. (See pp. 66-67.)
Most Participants Received Placement assistance provided to title III participants generally took the
Placement Assistance, form of job counseling and job search assistance. About 84 percent of
Fewer Were Trained the participants received Job counseling, and 66 percent received job search assistance. Occupational classroom skill traming was the most common form of training About 26 percent of the participants received such training. About 16 percent received on-the-job training, and 6 per- cent received remedial training. (See pp. 46-47.)
Participant Characteristics According to the Bureau of Labor Statistics, in January 1984 about 20 percent of the dislocated workers it identified were 56 years of age or older. GAO found that about 8 percent of the workers enrolled in title III were in this age group. The bureau also found that 32 percent of the dislocated workers had less than a high school education. GAO'S analysis showed that 22 percent of the title III enrollees were in this category. (See p. 39.)
The lower representation of older and less educated dislocated workers in title III projects is of particular concern, in GAO'S opinion, because these two groups experience more difficulty in finding new employment than younger or more educated workers.
Syme Problems in Program Because the period immediately following a business closure or layoff is Jdministration the most critical for helping affected workers, the timely start-up of title
III projects is considered especially important. However, the built-in lags b associated with the preparation, submission, and approval of proposals in the “request for proposal” method of funding contributes to the slow- ness of some states’ implementation of then title III projects, States tending to be slow m their expenditure of title III funds were more likely to have used the request for proposal funding method. GAO found that a year following their last fund allocation, 13 states had spent less than 60 percent of their title III funds received since the program began in 1982, and 11 of these states used the request for proposal approach. (See pp. 22-23.)
Page 4 GAO/~N-41 Dislocated Workers

--- --_- - .-_~ -__ --_-~- . .
---- ExecutiveSummary
_- _ _ _ .--- --_-__-- The requirement for nonfederal matching to receive title III funds was also a problem. Most projects satisfied the requirement by using partici- pants’ unemployment compensation, employers’ share of on-the-job training wages, or the states’ share of college and vocational center funds, all of which were existing resources and would have been avail- able to workers anyway Only 20 percent of the projects used newly appropriated funds to satisfy some portion of the match requirements. Since most projects used existing sources to meet the match require- ment, the requirement appears to have influenced the selection of pro- ject participants and services provided. For example, the projects were more likely to enroll participants receiving unemployment insurance benefits or to offer on-the-Job training because funds were already avail- able for those efforts that could be applied against the matching require- ment. (See pp, 24-25.)
Matters for Consideration by the Congress
Given the problems with the existing match requirement, the Congress may want to reevaluate this provision. The matching requirement could be made more meaningful by requiring that resources used to satisfy the match be new ones. If this were done, it would probably be necessary to reduce the current one-for-one match requirement because this level of matching would be more difficult to achieve using only new resources. This change would also reduce the influence of the matching require- ment on selectlon of participants and services provided. But if the Con- grcss is satisfied with the apparent influence that the current matching requirement has on the types of participants and services delivered by projects, then it may not want to make a change. (See p. 33.)
Recommendations to GAO also makes recommendations to the Secretary regarding technical
the Secretary of Labor assistance to facilitate the expeditious funding of projects (see p. 33 ) and rcgardmg obtaining greater participation by older and less educated *
dislocated workers (see p. 44).
1
Agency Comments The Department of Labor concurred with GAO'S recommendations to the Secretary and identified related actions it will take. (See pp. 34 and 44- 45.)
Page 6 GAO/HRD8741 Dislocated Workers

Contents
Executive Summary 2
Chapter 1 Introduction
Chapter 2
Objective and Scope Methodology
10 13 14
18
Program Administration
Funding of Title III Projects 18 Matching Requirements 24 Variations Among Title III Projects 27 Conclusions 32 Matters for Consideration by the Congress 33 Recommendation to the Secretary of Labor 33 Agency Comments and Our Evaluation 34
Chapter 3 Participant Characteristics
Title III Participant Characteristics Older and Less Educated Dislocated Workers Had Lower
Representation in Title III Projects Conclusion Recommendation to the Secretary of Labor Agency Comments and Our Evaluation
36 36 39
44 44 44
Chapter 4 Projkt Activities Few Participants Received Training or Support Services
Assistance Emphasized by Projects Varied
46 46 61
Chapter 5 Project Outcomes Job Placement Rates and Wage Levels
Jobs Found Factors That May Have Influenced Project Outcomes Changes to Different Occupations and Industries
60 60 62 66 68
Appendixes Appendix I JTPA Title III Allocations, October 1982-June 1986
70
Appendix II. Allocations and Expenditures of JTPA Title III Formula Funds by State and Year
72
Page 6 GAO/HRI&874l Dislocated Workers

--- -_ -_-“___ -I~_ -_-~---___ Ckmtents
__-- -_ - ” ___---- ------ Appendix III. Tables Containing Data Supporting Bar
Graphs in Report Text 80
Appendix IV: Characteristics of Title III Participants Identified by GAO and JTLS
83
Appendix V: Title III Projects in GAO Analysis Operating Between October 1982 and March 1985
84
Bibliography
Appendix VI: Comments From the Department of Labor
Tables Table 1.1: JTPA Title III Funding Table 2 1: Comparison of Funding Approaches and
Cumulative Expenditures of Title III Funds Table 2.2: Comparison of Match Requirement and
Participants’ UI Status
12 22
26
Table 2 3. Comparison of Match Requirement and Project Activities
27
Table 2.4: Variations in Title III Project Characteristics Table 2 5: Project Size Table 2.6: Extent of Project Focus on Specific Closures
and Layoffs
28 28 29
Table 2.7: Comparison of Project Operator and Project Focus Table 2.8: Comparison of Project Operator and Project
Job Linkage
30 31
Table 2 9: Projects With Performance Standards Table 3.1: Comparison of Participants’ Characteristics for
Titles III and IIA
31 39
Table 3.2: Comparison of Dislocated Worker Characteristics Table 3.3. Projects With Lower and Higher Than Average
Representation of Older and Less Educated Dislocated Workers
40 42
*
Table 4.1: Title III Activities 47 Table 4.2: Examples of Classroom Training Offered in 48
Title III Projects Table 4.3: Length of Classroom Training 49 Table 4.4: On-the-Job Training Provided 49 Table 4.6: Length of On-the-Job Training 60 Table 4.6: Support Services Offered 51 Table 4.7: Differences in Training Participation Levels 54 Table 4.8: Differences in Placement Assistance 56
Participation Levels
Page 7 GAO/HRB8741 Dislocated Workers

C!ntenta
Table 4.9: Differences in Support Services Participation Levels Table 5.1: Job Placement Rates and Wage Levels by
Project Characteristic Table 6.2: Comparison of Project Emphasis and Percent of
Participants Entering Different Occupations or Industries Table III. 1: Respondent Impressions of Burden to Obtain
and Document Matching Resources (Data for Fig. 2.4) Table 111.2: Participant Characteristics (Data for Fig. 3.2,
Between 22-44 Years Old) Table 111.3: Older Worker Representation m Title III
Projects (Data for Fig. 3.3) Table 111.4: Less Educated Worker Representation in Title
III Projects (Data for Fig. 3.4) Table 111.6: Remedial Training Participation Levels in
Title III Projects (Data for Fig. 4 1) Table 111.6: Classroom Training Participation Levels in
Title III Projects (Data for Fig. 4.2) Table III.7 OJT Participation Levels m Title III Projects
(Data for Fig. 4.3) Table 111.8: Job Placement Assistance Participation Levels
in Title III Projects (Data for Fig. 4.4) Table 111.9: Support Services Participation Levels in Title
III Projects (Data for Fig. 4.5) Table III. 10: Placement Rates for Title III Projects (Data
for Fig. 5.1) Table III. 11: Wage Levels for Title III Projects (Data for
Fig. 5.2) Table III. 12: Percent of Participants Finding Jobs in
Different Occupations (Data for Fig. 5.5) Table 111.13: Percent of Participants Finding Jobs in
Different Industries (Data for Fig. 5.6) Table III. 14: Occupations in Which Title III Participants
Found Jobs (Data for Fig. 6.7)
Figures Figure 1.1: Number of Projects Operating in Each Time Period Figure 2.1: RFP Predominant Funding Method Figure 2.2: RFP Approval Process Figure 2.3: State Cumulative Expenditures as of June 30, 1986 Figure 2.4: Respondent Impressions of Burden to Obtain
and Document Matching Requirement Figure 2.5: Operators of Title III Projects Figure 3.1. Title III Participant Characteristics
68 66
68
80
80
80
80
80
81
81
81
81
81
82
82
82
82 ’
-
14 19 20 23 26
30 37
Page 8 GAO/HRB87-41 Dislocated Workers

contenta
Figure 3.2: Title III Participant Characteristics Figure 3.3: Older Worker Representation in Title III Projects Figure 3.4: Less Educated Worker Representation in Title
III Projects Figure 4.1: Remedial Training Participation Levels in Title
III Projects Figure 4.2: Classroom Training Participation Levels in
Title III Projects Figure 4.3: On-the-Job Training Participation Levels in
Title III Projects Figure 4.4: Job Placement Assistance Participation Levels
in Title III Projects Figure 4.6: Support Services Participation Levels in Title
III Projects Figure 6.1: Placement Rates for Title III Projects Figure 5.2: Wage Levels for Title III Projects Figure 5.3: Percent of Title III Placements Changing
Occupation Figure 6.4: Percent of Title III Placements Changing Industry Figure 6.5: Percent of Participants Finding Jobs in
Different Occupations Figure 6.6: Percent of Participants Finding Jobs in
Different Industries Figure 6.7: Occupations m Which Title III Participants
Found Jobs
38 41 41
62
63
63
66
67
61 62 63
63 64
64
65
Abbreviations
BLS Bureau of Labor Statistics CETA Comprehensive Employment and Training Act CPS Current Population Survey GAO General Accounting Office JTM Job Trainmg Longitudinal Survey JTPA Job Training Partnership Act OJT on-the-job training OIA Office of Technology Assessment PIG private industry council RFP request for proposal SDA service delivery area SJTCC State Job Training Coordinating Council III unemployment insurance
Page 9 GAO/HRIN3741 Dislocated Workers
Y

Chapter 1
Introduction
Each year many U.S. workers lose their jobs because of business clo- sures and permanent layoffs and are faced with the often difficult task of finding a new Job. They come from America’s mainstream work force and represent virtually every major sector of the economy. They lose their jobs because of structural changes in the economy resultmg from a variety of forces, such as increased international competition, shifts in consumer preferences, and technological advances. These persons have come to be known as “dislocated workers.”
Based on data obtained in a supplement to the January 1986 Current Population Survey (cps), the Bureau of Labor Statistics (BUS) reported that 10 8 million workers 20 years of age and over lost their jobs because of plant closings or employment cutbacks during the 5-year period from January 1981 to January 1986. About 5.1 million of these individuals had worked at least 3 years on then- jobs, meeting the BJS
definition of dislocated workers. By January 1986, about 3.4 million of the 6.1 million individuals were reemployed; however, about 900,000 were unemployed and looking for work, and another 800,000 had left the labor force.
Several federal programs are available to assist dislocated workers. The Trade Adjustment Assistance program, authorized under the Trade Act of 1974, provides assistance to those who have lost their jobs due to import competition. This program offers income maintenance allowances, job search assistance, training and related employment ser- vices, and cash assistance to facilitate relocation of workers and their families. The Employment Service program is available to help find jobs for unemployed workers, including dislocated workers. Operated through local offices, this program provides job counseling and referral.
With the enactment of the Job Training Partnership Act (JTPA) (Public * Law 97-300) in October 1982, the Congress created a program specifi- cally directed at helping dislocated workers find new jobs. Administered by the Department of Labor, title III of the act provides funds to state governments for establishing dislocated worker programs tailored to meet their specific needs. States distribute funds to local organizations, such as community-based organizations, educational institutions, unions, employers, or the service delivery area/private industry coun- cils (SDA-PIG)’ to provide the assistance to dislocated workers or they may administer the program through existing state agencies. Title III
‘An SDA IS an administrative unit estabhshed under .JTI’A A PIC IS the governmg body of an SDA
Page 10 GAO/HRD-8741 Diilocated Workers

Chapter 1 Introduction
- provides assistance in the form of training, job placement, worker relo- cation assistance, and supportive services, such as child care and trans- portation while in training.
According to the act, individuals eligible for the title III program are those who
l have been terminated or laid off or who have received a notice of termi- nation or layoff, are eligible for or have exhausted their entitlement to unemployment compensation, and are unlikely to return to their pre- vious industry or occupation;
. have been terminated or who have received a notice of termination of employment as a result of any permanent closure of a plant or facility, or
l are long-term unemployed and have limited opportunities for employ- ment or reemployment in the same or a similar occupation in the area m which such individuals reside, including any older individuals who may have substantial barriers to employment by reason of age.
For the period October 1982 through June 1986, S650 million in federal funds was made available for the title III program The act requires that at least 75 percent of title III funds be allocated to states using the fol- lowing formula:
l One-third shall be allotted on the basis of the relative number of unem- ployed individuals who reside in each state as compared to the total number of unemployed individuals in all the states.
l One-third shall be allotted on the basis of the relative excess number of unemployed individuals who reside in each state as compared to the total excess number of unemployed individuals in all the states. “Excess number” represents unemployed individuals in excess of 4.6 percent of 1, the civilian labor force in the state.
. One-third shall be allotted on the basis of the relative number of individ- uals who have been unemployed for 16 weeks or more and who reside in each state as compared to the total number of such individuals in all the states.
The other 26 percent of the funds appropriated for title III are reserved for allocation to states at the discretion of the Secretary of Labor. These discretionary funds may be used to aid individuals who are affected by mass layoffs, natural disasters, or federal government actions (such as
Page 11 GAO/HRD8741 Dislocated Workers

Chapter 1 Introduction
the relocation of facilities), or who reside in areas of high unemploy- ment or designated enterprise zones.2 A breakdown of the title III funding by funding period is shown in table 1.1. For a more detailed breakdown by state, see appendix I.
Table 1.1: JTPA Title III Funding Dollars m mhons _----- - --- -~---------_ ---. ______-_-- -_-
Formula Discretionary Total ~---~ ___---- Ott 1982-Sept 1983 $82 5 -- --- ----.- -.-.- - ---- --____--~____ d!EL-~.2”“~o __- Ott 1983-June 1984 70 7 23 5 94.2 __ -.__ - _ ___- _ ---~--- - ----___--. ~-l__ ----___ ____. -- July 1984-June 1985 1673 55 7 223.0 ._ __________ _ - -_--.-_------____-________-- -_._ -_--.--__ July 1985June 1986 1673 55 7 223.0 ----. .-- -. --- ---._---- Subtotal 487.8 162.4 650.2 July 1986-June 1987d 71 8 23 9 95.7 - -_ ------_----._----- July 1987-June 1988 1500 50 0 200.0 _- _____ __ - -.----__-__-- Total $709.6 ---$236.3 $945.9
%epartment of Labor estimates for program years 1986 and 1987
For states to receive then- title III formula funds, JTPA requires them to match all or part of theu- formula allocation based on the state’s average unemployment rate. States with an average unemployment rate at or below the national average are required to match title III formula funds with an equal amount of nonfederal resources. The required match for states with unemployment above the national average is reduced by 10 percent for each percent or portion thereof that the state’s unemploy- ment rate exceeds the national average. To meet the match requirement, the law allows states to include such resources as project participants’ unemployment insurance (UI) benefits,3 nonfederal subsidies to college and vocational centers, and employers’ shares of on-the-job training (OJT) wages. The Congress recently amended JTPA to prevent the applica- tion of the matching requirement to title III discretionary funds; how- i) ever, no action was taken regarding the matching requirement for title III formula funds.
A relatively small percentage of workers dislocated by business closures or permanent employment cutbacks appear to be receiving assistance from the title III program. Based on BIS estimates for the 5-year period from January 1981 to January 1986, an average of about 2.2 mllhon
2An enterpnse zone IS an area designated by state or local governments for the purpose of economic development To encourage busmesses to locate or expand III these areas, benefits, such as preferen- tml tax treatment or low mterest loans, are provided
3The .JTPA legislation hmits the use of Ul benefits to no more than 60 percent of the required match
Page 12 GAO/HRD-87-41 Dislocated Workers

Chapter 1 Introduction
workers a year lost their jobs because of business closures or permanent employment cutbacks. During program year 1984 (July 1, 1984, through June 30,1986), the title III program served about 132,000 new enrollees, or 6 percent of the estimated number of workers dislocated annually. For program year 1985 (July 1,1986, through June 30, 1986), about 145,000 new enrollees were served, or about 7 percent of the estimated number of workers dislocated.
Objkctive and Scope To assist the Congress in its oversight of JTPA, we surveyed title III projects operating between October 1982 and March 1985. Our ObJective was to obtain information on (1) how states were using the federal funds made available under JTPA title III to help dislocated workers find jobs and (2) how the different approaches used may have influenced proJect outcomes.
Using information obtained from state JTPA officials, we identified a uni- verse of 716 projects. We asked project officials to respond to a detailed questionnaire concerning their last 9 months of operation before April 1, 1986. Of these projects, 28 were eliminated from our survey because they were developing training materials for use in other projects or were providmg assistance to workers through cable television programs and therefore had no participant information. Another 61 projects were eliminated because they were in the initial planning stages of their pro- gram and had not begun to bring participants into the program or they did not have sufficient numbers of participants to respond to our ques- tionnaire. Of the remaining 626 proJects, 563 (or 90 percent) responded to our questionnaire, and their responses formed the basis for our analysis.4
As of March 31,1985, the cutoff date we used for collecting detailed proJect data, about 25 percent of the 563 projects had completed their operations, while 75 percent were still active. All of the projects sur- veyed operated during one or more of the following title III funding periods:
L
. Before the transition year (Oct. 1982-Sept. 1983). l Transition year 1984 (Ott 1983-June 1984). l The first 9 months of program year 1984 (July 1984-Mar. 1985).
4Thr questIonnan-e used for this survey was deslgned to collect detaded mformatlon on a vanety of program topics Ikcause some topics did not apply to every proJect, all 663 proJects were not expected to provide a response to each questlon Therefore, the statistical data presented m this report are based on the number of proJects respondmg to a speclflc question rather than 563, the total number of proJccts surveyed
Page 13 GAO/HRD-8741 Dislocated Workers

Chapter 1 Introduction
The number of projects operating during each of these three periods is shown in figure 1.1.
_- Figure 1.1: Number of Projects Operating in Each Time Period
Number of Projects
13
277
100
.
1 I I I Prior to Ott 83 Oct. 83 - June 84 July 84 - Mar 85
A list of the number of projects in our analysis by state 1s shown m appendix V.
tiethbdology The responses provided by the 563 projects to our questionnaire were analyzed to identify
* l the variety of approaches used in administering title III projects and the
extent to which these approaches were being used; . characteristics of project participants and comparison of these with the
characteristics of dislocated workers identified by other researchers; l kinds of training activities, placement assistance, and support services
available to project participants and the extent to which each was pro- vided to title III participants; and
. project outcomes measured m terms of placement rates, average wage levels, and the extent to which project participants found Jobs in dif- ferent occupations and industries.
Page 14 GAO/HRD-8741 Dislocated Workers

_-~ ----- I-__~--- ~--___ Chapter 1 Introduction
-
-. _-__-__-_-- ______ ~ Project responses were also analyzed to identify possible patterns or relationships between the way projects were implemented or structured and other project variables Because our questionnaire gathered data at the project level rather than the individual participant level, we cannot identify individual participant data that may have influenced these rela- tionships. However, we believe our analysis provides insight into (1) how projects were administered, (2) who received assistance, (3) what kinds of assistance were provided, and (4) what results were achieved.
To provide reasonable assurance that the information gathered through the questionnaire responses accurately described the projects, then- out- comes, and the opinions of project officials, we:
Visited several title III projects during questionnaire development to assure that the information we were seeking was available and that the necessary records were maintained to support the responses to our questionnaires. Performed internal validity checks on the questionnaire responses and made several hundred follow-up phone calls to assure that we under- stood the responses provided and that corrections were made when we had reason to believe the data were in error. Visited six locations (after we had questionnaire results) to discuss the questionnaire responses with project officials and review individual client records to determine whether the procedures used to compile information in support of their responses were adequate to assure reli- able information.
In addition, to assure that results obtained from the analyses of our questionnaire data were consistent with other sources of information on the activities and outcome of the title III program, we:
Cross-checked aggregate statistics from our questionnaires against data reported by the Department of Labor’s Job Training Longitudinal Survey (.JTIS).
Had our analysis reviewed by a panel of title III administrators and outside experts knowledgeable about the program to obtain then- reac- tions to the results of our work.
Page 16 GAO/HRD8741 Dislocated Workers

Chapter 1 Introduction
We also compared the results of our analysis to the research of others, such as the Office of Technology Assessment (UJYA);~ Westat, Inc.;6 The Urban Institute; the Congressional Research Service; and the Congres- sional Budget Office. For a list of studies used in our analysis, see the bibliography at the end of this report.
While we did not perform a statistical validity check of the information obtained through the questionnaire, we believe that the actions taken provide reasonable assurance that the information gathered through our questionnaire accurately describes the projects, their activities, and their outcomes.
To supplement the information obtained from our questionnaire, we met with project officials at 27 project sites and made telephone follow-up contacts with officials at 30 of the 563 projects in our analysis.
Responses to our questionnaire were obtained from title III project offi- cials between April 1 and June 30, 1985. Our analysis and additional follow-up work was performed between July 1, 1986, and July 30, 1986. All work was done in accordance with generally accepted government audit standards.
“U S Congress, Office of Technology Assessment, Technology and Structural UnemplQment Reem- pQmg Displaced Adults, February 1986
“Westat Inc , State Level Implementation of the Job Trammg Partnership&, 1984
Page 16 GAO/H&D8741 Dislocated Workers

Page 17 GAO/HRD-8741 Dislocated Workers

Chapter 2 --
Program Acbninistratiarl
JTPA title III allows states wide latitude in designing dislocated worker programs, and the Department of Labor has implemented the program to allow maximum state flexibility. Thus, states have been free to develop programs that they believe best meet the needs of their dislo- cated workers. The result has been considerable variation in the approaches used to allocate funds to local projects, the organizations operating projects, and the training provided, as well as the extent to which projects are focused on specific events or subpopulations. Our analysis indicates that such differences may affect the timing of project implementation and the individuals served.
Hased on our analysis of questionnaire responses and discussions with project officials, two issues emerged regarding the administration of title III projects--(l) the slow implementation of the projects and the slow state expenditure of title III program funds and (2) the ineffective- ness of the matching requirement in generating additional nonfederal resources for dislocated worker projects.
Most states funded their title III projects using the request for proposal (HFP) approach, which requires organizations seeking title III grants to develop, submit, and obtain approval of then- proposals prior to funding. The built-in lags associated with this process, however, have likely con- tributed to the slow start-up of many title III projects. In addition, states that tended to be slow in their expenditure of title III allocations were more likely to use the RFP approach than other funding approaches.
As discussed m chapter 1, JTPA rules require states to provide nonfederal matching resources. While the purpose of this requirement is unclear in the law and legislative history, one common purpose of matching requirements is to provide leverage to increase total resources available for programs. Our analysis suggests that the current matching Y requirement for title III has generated little new cash or in-kind contri- butions for the title III program that would not otherwise have been available to help dislocated workers In addition, project officials mdi- cated that the matching requirement has been administratively burden- some for some projects.
Funding of Title III Projects
Local title III projects received their funds from the states through sev- era1 different funding mechanisms. Some projects received funds through a formula allocation or based on solicited noncompetitive pro- posals, but most projects received their funds through the RFP method (see fig. 2.1).
Page 18 GAO/HRD-87-41 Didomt4 Workers

Chapter 2 Program Administration
Flgurcb 2.1: RFP Predominant Funding Method
Formula
Sollclted or Unsollclted
- Request for Proposal
Formula allocation mvolves states allocating funds to SDAS and local entities on the basis of a formula that is often based on local levels of unemployment. Solicited proposals are those submitted by local entities at the request of the state and are funded on a noncompetitive basis to meet specific needs, such as unexpected business closmgs. Because the state initiated the action, the funds are often committed to the area before the specific details of the project are completely developed.
The HFP approach is a competitive process in which local officials, union leaders, or businessmen respond to a formal request from the state by preparing a proposal for assisting dislocated workers and detailing the funding needed. These proposals are typically forwarded for review to * the state title III staff, the State Job Training Coordinating Council (SJTCC),~ and the governor’s office. Proposals under consideration for funding are then sent to the PICK and local elected officials from the pro- ject area for their review and comment. Figure 2.2 illustrates the process for approval of RFPs.
‘JTPA reqmres each atate to establish such a councrl composed of representatives from busmeas, state and local elected offlcmls, and the general pubhc to coordinate employment trammg assistance from JTPA a9 well as other pnvate or public sources
2PICs are a reqmred part of the JTPA admuuatratme framework Each SDA must have a PIC, which must have a maJonty of its members from the pnvate sector Other members may be from organued labor, community-based orgamzationa, economic development agencies, and the pubhc employment aervlce For a more detailed discussion of the admunstratlon of JTPA, see Job Tramng Partnership
Page 19 GAO/HRD8741 Dislocated Workers

Chapter 2 Program Administration
B-j{ Agency m the executive branch
State title III staff, the SJTCC, and the Governor’s office review proposals Those being considered for funding are sent to the PIC and local elected offlclals In the project area for review and comment
States’ widespread use of the RFP approach is apparently related to sev- eral factors. Westat, Inc., a private research corporation under contract with Labor, reported3 that states have found the use of the RFP approach eases the planning burdens associated with implementing a new pro- gram by involvmg the local level in the planning process. States were able to leave the specific targeting, outreach, and service delivery strat- * egies to the organizations submitting the proposals. It also resulted in a “bottom-up” approach to planning, since the state could not grant final approval of a proposed project until the PIC and local officials from the project area had a chance to review and make recommendations on the proposal. The RFP approach gives state officials ultimate control over how title III resources are spent since proposals inconsistent with state plans can be disapproved. Thus, states have discretion in targeting title
Ad Imtml Implementation of Programs for Dwxdvantaged Youth and Adults (GAO/IIRD-85-4, Mar 4, 1986)
‘Westat, Inc The Organlzatlon of Title III of the Job Trammg Partnership Act m fifty-, May 1984 ‘-
Page 20 GAO/HRD87-41 Didocated Workew

-~ Chapter 2 Program Administration
III services to areas with particularly high unemployment rates or spe- cific business closures and can, if they wish, avoid spreading resources too thinly to create effective programs.
The RFP approach also has some drawbacks. (JTA, commenting on the slow start-up of title III drojects, said that the RFP funding method chosen by a number of states to establish title III projects had built-m time lags4 01~ also stated in a later report? that it is not unusual for the implementation of projects to be delayed 3 or 4 months. Westat, Inc., made a similar observation when it reported that the RFP approach lengthened the decision-making process.6 Both reported that because this approach required the involvement of the PIGS and local elected offi- cials, there was a longer application review process. In addition, Westat noted that some projects were delayed because of difficulty in getting proposals to meet state specifications. In one state, 95 percent of the proposals were returned to local officials because they failed to meet state requirements.
A further indication of the impact of the RFP approach on the implemen- tation of the title III program is the rate of expenditure of program funds. Slow state expenditures of title III funds may indicate that some states are not quickly responding to the dislocation of workers by busi- ness closures or permanent layoffs. While 16 states had expended more than 80 percent of their cumulative allocations of title III funds as of June 30, 1985,16 states had expended 60 percent or less, as shown in table 2.1. For the 24 states that did not use the RFP approach for funding title III projects, the average percentage of funds expended was 68 per- cent as of June 30, 1986. For states using the RFP approach, the average percentage of funds expended was 60 percent. While most states using the RFP approach (58 percent) expended 60 percent or more of their title III funds and 8 had expended more than 80 percent, 11 of the 16 states that had expended less than 60 percent of their funds used the RPP
*
funding method.
Initially, the slow expenditure of title III funds was attributed by pro- gram officials to the newness of the program, attention by state officials to other parts of ,JTPA, and delays in the availability of funds from the
41J S CMgress, Office of Technology Assessment, Technology and Structural IJnempl&mwnt Reem- p@mg Displaced Adults, February 1986
“II S Congres, Office of Twhnology Assessment, m Advance Notice and Rapidonsc - F&c~al Ream, UI’A-ITE321, September 1986
"Wcstat. 1984
Page 2 1 GAO/HRD8741 Dislocated Workers

Chapter 2 Program Admhdstration
Department of Labor. According to program officials, as they gained experience with the program, states would accelerate the commitment of title III funds to specific projects and funds would be spent quicker. However, although some states had accelerated their expenditures, as shown in table 2.1 and figure 2.3, as of June 30, 1986, 13 states have expended less than 60 percent of the title III formula funds allocated since the beginning of the program even though a year had passed since their last allotment. Eleven of these states used the RFP funding approach.
TaOle 2.1: Comparlson of Funding Approaches and Cumulative Exfiendltures of Title Ill Funda
Percentage expended as of June 30,1985 Over
Funding approach O-20 21-40 41-80 81-80 80 Total . ___- RFP 1 3 7 7 8 25 __--- .-- ._.- -_ -.- Formula 0 0 3 6 3 12 _-.- Solicited 0 0 1 -3 1 5 __- Mixed 0 0 1 1 3 5 --- . ---- -~--- Other 0 0 0 1 1 2
Total 1 3 12 18 15 50
Percentage expended as of June 30.1988 Over
Funding approach O-20 21-40 41-80 81-80 80 Total -.. _.--.---__ ..~~ _________ RFP 0 2 9 6 9 28 --._ - --.-..-- -- __-- ____~__--- --.__ Formula 0 0 2 4 6 12 Sol&d-- _ ~.
..____-__ 0 0 0 3 2 5 __-... ____
Mixed 0 0 0 1 4 5 -~- -~- Other 0 0 0 1 1 2 Total
__--- 0 2 11 15 22 50
As OTA reported, the slow implementation of the title III projects is a major concern. OTA noted that the days immediately following a business *
closing can be the most critical for helping workers find new jobs or obtain retraining. The timely start-up of title III projects is important
. to facilitate the outreach by project officials to the affected workers,
. to help workers plan their reemployment strategies,
. to provide job search assistance to workers when they are most eager, and
. to provide retraining before income support from IJI and other severance benefits is exhausted.
Page 22 GAO/HRD-8741 Dislocated Workers

- - -_ _I - - _ _I - - ^ _ - . . . - - -
Chapter 2 Yrogmn Administration
Figure 2.3: State Cumulative Expenditures as of June 30,1988 _-- --._-
While some states have implemented their title III projects qurckly, others have not. States slow to expend their resources, most of which use the RW method of funding, may need technical assrstance to identify ways to accelerate their funding mechanism to facilitate the implemen- tation of title III programs and assure that the assistance for dislocated workers is provided in a timely manner.
Page 23 GAO/HR.D-6741 Dislocated Workers

___I-
Chapter 2 Program Administration
klatching Requirements
.
.
.
.
.
.
.
.
.
.
.
As discussed in chapter 1, for states to receive title III formula funds, JTPA requires them to provide nonfederal matching resources.’ Our anal- ysis suggests that the matching requirement, however, generates little new cash or in-kind resources for the program that would not otherwise have been available while resulting in an administrative burden for many projects. In addition, it may restrict participation by certain workers or the use of training approaches that do not generate matching resources.
Generally, the states met the matching requirement by requiring indi- vidual projects to account for the matching resources. According to respondents, 433 (or 77 percent) of the 663 projects in our analysis were required to account for matching resources. These projects used a variety of state, local, and private sources for cash and in-kind contribu- tions to satisfy their match requirement. Eighteen percent of the projects relied exclusively on cash contributions to meet their match requirement, about 38 percent used a combination of cash and in-kind contributions, and the other 44 percent used only in-kind contributions. Common sources of cash and in-kind contributions are:
Funds from participants’ former employer. Funds from participants’ potential employer. Union funds. State appropriated funds. Local funds. Employer’s share of OJT wages. State’s share of college and vocational center expenses. Participants’ UI benefits.
,Office space and facilities. Equipment and supplies Staff time.
7The Congress recently amended JTPA to prevent the apphcatlon of the matchmg requirement to di.scretionary funds, however, no action was taken regardmg the matchmg requirement for title III formula funds
Page 24 GAO/HRD-87-41 Dislocated Workers

~----- ----- Chapter 2 Program Administration
--_-I-_- _- __-_ ” _ __-_^I__-~I_____ Relatively few of the title III projects in our analysis generated new cash to meet the matching requirement. Of the 433 projects required to account for nonfederal matching resources, 50 used funds appropriated specifically by the state to satisfy the matching requirement, and 35 used local funds, The most common in-kind contributions were unem- ployment compensation, the employer’s share of O.JT wages, or the state share of college and vocational center funds, all of which would have been provided to workers anyway.
In commentmg on the availability of resources used for matching, 24 of the 30 project officials we contacted by telephone advised us that the m- kind resources used for their project would have been available even if they had not been required to generate matching resources. According to these officials, generating new resources that were not already available would be extremely difficult, particularly in areas facing high unem- ployment or significant business closures or layoffs. Westat concluded m its report that it was unlikely that the title III matching requirement will increase overall resources for employment and trammg activities.”
UIX reported that the matching requirement is one aspect of title III with which states are most dissatisfied The majority of states, according to WA, must assemble a variety of cash and in-kind contributions ‘) Most state officials said that this way of putting together matching resources imposes a bookkeeping burden. This observation was expressed by state title III admmistrators during a series of public forums conducted by congressional staff m 1984 They said that cash contributions are diffi- cult for states to furnish and in-kind contributions are burdensome and time consuming to document. Program admmistrators responding to our questionnaire pointed out that, in some cases, accounting for matching resources increased their admmistrative burden. As shown in figure 2.4, about 62 percent of the projects required to account for matching b resources reported that staff resources and time were used to either a moderate, great, or very great extent to obtain and document matching resourcesl”
‘Wcrtat, Ttw Orgaru&wn of Title III of the Job Tramng Partnership Act In Fifty-, 1984 - _
“Of1 IW of Twhnology Asswsnent, Technology and Structural IJnemplgment Reempbymg DF- placed Adults, I+bnmry 19%
“‘SW appvndlx III for data supporting bdr graph9 contained In the text of thl> rcpnrt
Page 25 GAO/HRD-8741 Dislocated Workers

_ ___ _-_ -~__-__-__---- ------ Chapter 2 Program Administration
Figure 2.4: Respondent Impressions of Burden to Obtain and Document Matching Requirement Extelli
Moderate
Some
i L
Little or None
0 10 20 30 40
Percent Of Propcts
-- _--- __-
Matdung Requirement May Our analysis showed that projects that were required to account for
Also Influence Who matching funds had a higher percentage of participants receiving III ben-
Participates and the eflts than did projects that were not required to match. As shown in
Assistance Available table 2.2,60 percent of the partlclpants m projects required to match were receiving LJI compared to 40 percent of those in projects not required to match. CYIA reported that 17 of 45 states indicated that the matching reqmrement leads to targeting of services to workers eligible for 1~1.~’ Thus, it is possible that dislocated workers who have exhausted IJI benefits or never received them, and therefore may be in the greatest need of assistance, are less likely to be served by projects SubJect to a 1 matching requirement.
_ _ _- ---_ _ _ ___ - _------- Table 2.2: Comparison of Match Requwement and Partlclpants’ Percentage of participants UI $tatua among projects
UI status Fteq;rt;e Not req;;;;f
Total Recewq UI benefits 60 40 57 Not recetvmq UI benefits 40 60 43
---- ’ ‘01 f 1( c of ‘I’wtmology Awwmcnt , Fcbnrary 1986
Page 26 GAO/HRD-8741 Dislocated Workers

- -
Chapter 2 Program Adminwtration
- - - I _ - -
.______ -_ _ _ _-_--_-l -~- Our analysis also indicates that the matching requirement may influence the services offered. Almost one-third of the projects indicated that the matching requirement determined from a great to a very great extent the selection of the type of activities provided to project participants.12 An example of how the matching requirement may influence project activities was found m our analysis of projects offering OJT We found that projects required to account for matching funds offered OJT more often than projects not required to do so Table 2 3 shows that while 74 percent of the projects required to account for matching funds provided OJT, only 52 percent of those not required to do so provided such training. This may result because the employer’s portion of OJT wages is frequently used by projects to meet their matching requirement. In con- trast, we found less variation in the percentage of projects offering classroom training. Because our study did not address the specific needs of individual project participants, we could not determine whether there were any negative consequences as a result of any bias in the services offered.
-_-~_ -_~ Table 2.3: Comparison of Match Requirement and Project Activities
Types of training available Classroom
OJT --
Percentage of projects R=w;;;E Not req;;wrft
Total 76 81 77 __---___ 74-~--- --52~- .-- ~.
69
Variations Among Title In addition to being funded through the RFP approach and required to
III Projects match title III funds, the majority of the title III projects were (1) rela- tively small; (2) not focused on a specific population, closure, or layoff; (3) not lurked to specific jobs openings, (4) operated by public sector organizations; and (5) required to meet performance standards, Table 2.4 shows the many differences m title III projects.
'%'A &o rcporteti that some state .JTPA dnectors said that the service mix m then- programs IS bldwti by the matching requirement
Page 27 GAO/HRD-87-41 Dislocated Workers

- Chapter 2 Program Admmistration
Table 2.4: Variations in Title Ill Project Characteristics Characteristics
Project size (number enrolled) Percent --.- --. ...~~~.
Focused on specific closures or layoffs Percent
Linkagd td speclflc jobs Percent
Project operator9 Percent
Pfirformance standardi Percent
50 or fewer 38%
Yes
19%
Yes 18%
Public sectorb 52%
Yes 80%
Variations 51 to200 36%
No
62%
E%
SDA-PIC 31%
%%
Over 200 26%
Mlxed
19%
Employer-union 9%
aAbout 8 percent of the projects were operated by unspeclfled orgamzatlons
%cludes 26 percent operated by educat!onal tnstltutlons and 26 percent by other public groups
Project Size In contrast to other employment training programs under .JWA and prior programs under Comprehensive Employment and Training Act (cE:‘I’A), title III projects were relatively small. The average number of enrollees in a CETA project was about 2,300 for fiscal year 1980 and about 1,600 for fiscal year 1982. The JTPA title IIA program for economically disad- vantaged enrolled an average of just over 1,600 participants per project. The average number of enrollees in a title III project was 78, and over a third of the projects had fewer than 50 participants. Table 2.5 shows the distribution of projects by number of enrollees.
_-__- ___ Table 2.5: Project Sue
Number enrolled in project 25 or fewer 2s to 50 ---- - -.-- -. 51 to 100 -.---. - ----. .- -~ - -_--.-. 101 to 200 201 to 500 -- _----~ .~-~ ~~~~-.- 501 to 800 Over 800 Total
Percentage of projects ---~_-. . . 23 15 -- _ -.--_~--- -._~ - -- 20 __.- -. _.~~~~ .~.. 16
-16
5 5
Too
Focus on Specific Closures or Layoffs
While the title III program was established to provide assistance to workers dislocated by busmess closures or permanent layoffs, most projects (62 percent) did not focus on a specific closure or layoff but were open to all eligible dislocated workers who applied for assistance.
Page 28 GAO/HRDS741 Dislocated Workers

Chapter 2 Program Administration
-
---_- -~ As shown in table 2.6, when projects focus on a specific group, it is usu- ally a specific busmess facility or industry.
__ --__ --- -.----~- Table 2.6: Extent of Project Focus on Specific Closures and Layoffs Enrollment focus Percentage of projects _._ - _ ---- -__-__ --_-- ----.-___
Open projects (not event specific) 62 _. -.- - ---..- -. ----- Focused on speclflc population or event 19 Partially focused projects 19 Total - loo
Population definitions of focused projects Number of project9 ---- _--_ -.-_ IGustry speclflc
-___ ___--__- 62
CnTon specific -___-- __- _____--_--- ~~- _
36 Plant or coriqiany specific
---___ ___ --. -~ -~~- - - 141
Demographic charactenstlc specific (age, gender, race) 28
?iorne projects had more than one target crltena, as a result, this column IS not addltlve A total of 204 projects were partially or totally focused
- --- --- ---~-
Job Linkage --
Another significant difference between title III projects and prior employment training programs is the extent to which projects had a lmk to specific job openings for proJect participants. For example, m 18 per- cent of the projects, potential employers were identified before project participants were selected. In addition, nearly half of the OJT slots were identified before project participants were selected
- _- -T‘------------
Project Operators An important aspect of JTPA is the partnership between the public and private sectors. Most title III projects are operated by a variety of public sector organizations, or SDA-PICS, as shown m figure 2.5. Public sector organizations, which operated 52 percent of title III projects, included educational institutions (26 percent), community-based organizations (13 percent), state employment service agencies (9 percent), state ser- vice centers (2 percent), and other state agencies (2 percent). SDA-PIGS operated about 31 percent of the projects. They also operate JTPA title IIA programs for the economically disadvantaged.
About 9 percent of title III projects are operated by either employers, unions, or employer/union consortia. Unions and employers jointly oper- ated about 2 percent of the projects. Unions operated 4 percent of the projects, and past or potential employers operated about 3 percent of the title III projects.
Page 29 GAO/HRD-8741 DLslocated Workrra

maptm 2 Program Administration
Figure 2.5: Operators of Title Ill Projects
SDA-PIC Other
Employer and/or Union
Public Sector
EducatIonal lnstltutlonal
Further analysis of proJect operators and project characteristics showed that, as might be expected, employer/union operators were more likely than projects operated by others to focus on dislocated workers from a closure or layoff at a specific business facility. As shown in table 2 7, about 3 1 percent of the projects that were operated by employer/union groups focused on workers from a specific closure or layoff In contrast, 14 percent of the projects operated by educational institutions focused on a specific event.
Table 2.7: Comoanson of Proiect Operator and P’roject Focus - Percentage of projects that focused on a
specific event Project operator Yes No Mixed Total __^ -. - --.- ~..------- ---__ * Employer/union 31 45 24 100 __.__._.__.__. -_ _____ ______ -._-“-___-~-_-~-_--~-- --.- - ---.- P&k sector l6 62 _ _- .~---~_ _--~-~ -.-- _ __~____ .-22.-- -L!!?o SDA-PIC 21 65 14 100 .__ _.._. _-._ --.-_- _____. _____.- ---____- ----I_ EducatIonal institution 14 68 18 100 _ __-_. _-_ -_--_-_----- --- _._-_ -.------.--- - Other 17 60 23 100
The degree to which job hnkage was present, as evidenced by the per- centage of projects for which specific job openings were identified before project participants were selected, also varied by type of project operator, as shown in table 2.8. For example, as many as 27 percent of the employer/union projects had links to specific Job openings, as did 24
Page 30 GAO/HRD-8741 Dislocated Workers

--- -- - -__----_I__-~-_~- --.- _ --_____ Chapter 2 Program Administration
-
- percent of the public sector and SDA-PIC operated projects In compar- ison, 8 percent of the projects operated by educational institutions had job linkage.
- _ _ --I-_-__ Table 23: Comparison of Project Operator and Project Job Linkage
Project operator Employer/union
Public sector Edu&~ial institution
SiA-PIti dther
Percentage of projects linked to a specific rob
Yes No Total 27 73 100 24 76 100
8 92 100 24 76 100 -- -.~ ------_~_~~- _~~ ~. 11 89 100
- --__“- ----- --___
Performance Standards Although the Department of Labor has not established performance standards for title III projects, states required most local projects to meet one or more standards covering placement, retention, cost per placement, or wage levels. However, the ability to achieve the standards varied among projects.
About 80 percent of the local projects were required to meet state- imposed performance standards. However, not all of these projects were required to meet the same standards, as shown in table 2.9.
_- - _-- -. -~I-_~ Table 2.9: Projects With Performance Standards
Standard Placement -
cost
Wage Retention
Percentage of projects with a standard ---.-~-___-.-. ~~ ~~~ ~-
-96
64 -~- -~-~ - ---~ ~-~-- - 54 __. 26 Y
Of the projects responding to our questionnaire that were required to achieve a placement standard, the rate ranged from 25 to 100 percent, with about half of these projects required to achieve at least a 65-per- cent placement rate. Of the 30 projects we contacted during our follow- up work, 6 had a retention rate standard requiring that between 60 and 100 percent of those placed retain their employment for at least 30 days after entering their new job. The maximum cost per placement standard among these 30 projects ranged from $975 to $9,000, and the average placement wage rate standard ranged from $3 35 to $5 76 per hour.
Page 31 GAO/HRD8741 Dislocated Workers

Chapter 2 Program Administration
Conclusions - .JTPA title III has given states wide latitude to design dislocated worker projects. This has resulted in states using a variety of approaches to implement and administer title III projects. However, two concerns emerged from our analysis regarding the administration of title III projects: (1) the need to promote quicker implementation of title III projects and (2) the need to reevaluate the matching resources requirement.
The days immediately following a business closure or permanent layoff are the most critical for helping workers find new jobs or obtain retraining. The timely start-up of title III projects is especially important because income support from IJI and other severance benefits are gener- ally limited to the few months following layoff. However, the built-in lags associated with the IZFP method of funding appear to contribute to the slowness of some states m implementing title III projects to respond to the dislocation of workers by business closures or permanent layoffs
The HFP method of funding requires a longer application review process, including approval by PIG members and local elected officials. It is not unusual for this process to result in implementation delays of 3 to 4 months. In addition, states tending to be slow using their title III funds were more likely to use the RFP funding method than other methods. We found that 11 of the 13 states that were the slowest in expending funds used the RN' approach. Because of the scope of our review, we did not determine what other problems may be contributing to the slow expend- itures of funds or what problems, if any, may be associated with other funding approaches. However, we believe improvements are needed in the mechanisms used to allocate funds to local projects to facilitate the quicker implementation of title III projects and assure that the assis- tance for dislocated workers is provided in a timely manner. While states that used the IZFP method predominated the list of slowest states * to expend funds, other states that used that method were among the fastest; thus, the RFP approach need not be slow. However, states slow to expend their funds may benefit from technical assistance
Another concern in the admmistratlon of title III projects is the require- mcnt for nonfederal matching resources m order to receive title III funds. Relatively few of the projects in our analysis generated new cash or additional resources to meet the matching requirement. Of the 433 projects required to provide matching resources, only 20 percent used funds specifically appropriated to satisfy the matching requirement. Also, we found that the resources used for the matching requirement,
Page 32 GAO/HBD-8741 Dislocated Workers

Chapter 2 Program Administration
- __----__ -__------- _ according to title III administrators, would have been available to projects even if they had not been required to satisfy the requirement.
To generate new resources that were not already available is extremely difficult, according to title III admmistrators. This problem is particu- larly acute in areas facing high unemployment or significant business closures or layoffs. In addition, accounting for in-kind contributions can be a burdensome and time-consuming process for project operators. About 62 percent of the projects required to account for matching resources indicated that staff resources and time either to a moderate, great, or very great extent were needed to obtain and document matching resources.
In addition, the matching requirement may influence both the character- istics of dislocated workers who participate in title III projects and the assistance they receive. Projects required to meet the requirement were more likely to serve a higher percentage of those dislocated workers who were receiving unemployment insurance benefits and were more likely to offer or? than other projects. Because 171 benefits and the employer’s share of 0~1’ wages were major sources of matching funds, project operators may have been influenced in the design of their pro- grams by the matching requirement as well as the needs of individual dislocated workers
_~ Given the problems with the exlstmg match requirement, the Congress Matters for
Conr)ideracion by the Congress
may want to reevaluate this provision The matching requirement could be made more meaningful by requiring that resources used to satisfy the match be new ones. If this were done, it would probably be necessary to reduce the current one-for-one match requirement because this level of matching would be more difficult to achieve usmg only new resources. This change would also reduce the influence of the matching requn-e- ment on selection of participants and services provided.
E3ut if the Congress is satisfied with the apparent influence that the cur- rent matching rcqun-ement has on the types of participants and services delivered by projects, then it may not want to make a change.
----.
Recommendation to the We recommend that the Secretary provide technical assistance to states
Secretary of Labor that are slow in their expenditure of title III funds The technical assis- tance should focus on ways to speed up the “request for proposal” funding mechanism
Page 33 GAO/HRD-87-41 Diilocated Worken,

Chapter 2 Program Administration
Agency Comments and In commenting on a draft of this report (see app. VII), the Department of
Our Evaluation Labor concurred with our recommendation to the Secretary and noted that Labor and such interest groups as the National Governors’ Associa- tion and the National Alliance of Business are available to provide tech- nical assistance to the states upon request.
Labor does not believe, however, that technical assistance to speed up the HFI’ funding mechanism is necessarily the preferred course of action. It stated that giving the Secretary greater discretionary authority to award title III funds could help alleviate the problem by awarding funds to areas with greater need and not awarding funds to areas with few dislocated workers. In addition, Labor is developing a proactive approach to managing Job trammg programs which includes m-depth management reviews of state program administration, which will be implemented in the summer of 1987. Labor also is conducting a demon- stration project of early mterventlon by labor and management teams in partnership with government. This approach is patterned after the Canadian Industrial Adjustment Service.
Labor noted that the admuustratlon’s fiscal year 1988 budget proposes to replace title III and the Trade Adjustment Assistance program with a new program, which will feature early adjustment assistance and other features that Labor indicates should result m both timely expenditure of funds and improved delivery of services to dislocated workers
We agree that, as Labor stated, there is technical assistance available to states from a variety of sources and that additional steps proposed should also help to alleviate the problem of slow fund expenditure in some states that use the RET funding method. We do not believe, how- ever, that giving the Secretary greater discretionary authority to award title III funds will necessarily correct the problem. Among the states I that we cited as being slow to expend funds, two, Louisiana and Oklahoma, have experienced significant worker dislocation in recent years The west south central region (composed of Texas, Oklahoma, Louisiana, and Arkansas) had the highest rate of business closure and permanent layoffs m 1983 and 1984, affecting 12 percent of estabhsh- ments employing 100 or more workers Thus, the scarcity of dislocated workers does not, m all cases, appear to be the cause of slow expenditures
Page 34 GAO/HRD-87-41 Dislocated Workers

- - -- ------ “~
Page 35 GAO/HRLM7-41 Dislocated Workers

Chapter 3 --- ---
Participant Characteristics
Because title III is designed to specifically assist workers who have lost or may lose their jobs because of business closures or permanent layoffs without regard to their economic status, it differs from the rest of .JTPA, which focuses on the economically disadvantaged. Some observers have suggested that a separate reemployment program is not needed for dis- located workers because existmg programs could meet their reemploy- ment needs. We found, however, that the characteristics of dislocated workers enrolled m title III projects were significantly different from the characteristics of economically disadvantaged individuals served by the JTPA title IIA program Title III participants were more often male, and nonmmorities, who were older and better educated than title IIA participants.
Further analysis of participant characteristics showed significant differ- ences between those m title III projects and the characteristics of the general population of dislocated workers as identified by BIS from the January 1984 Current Population Survey. Of particular note is that par- ticipation by dislocated workers 55 years of age or older and those with less than a high school education -two groups of workers that may experience the most difficulty m reentering the job market-was less in title III projects than their representation in the general population of dislocated workers identified by BLS. While we did not have sufficient data to determine why these groups had a lower representation m title III projects, we did identify several factors-such as type of project operator, focus of project, type of training provided, and whether the project screened applicants-that were associated with the participa- tion levels of these two groups.
Title ‘III Participant Characteristics
-- Overall, title III projects responding to our questionnaire had enrolled over 170,000 dislocated workers through March 3 1, 1985. Our analysis of participant characteristics focused on the 121,000 enrolled during the most recent 9 months of activity for the projects m our survey.’
Participants were predominately white, male, and of prime working age (22 to 44), with at least a high school education. Over half were unem- ployed for 3 months or more and were receiving UI benefits. While they came from a variety of industries, most participants (60 percent) came from the manufacturing sector. (See figs. 3.1 and 3.2.)
‘The number of patilclpants m our analysts differs from Labor’s Job Trammg Longltudmdl Survey becauqX the .JTIS data were based on the fixed penod July 1, 1984, through March 3 1, 1985, while our data were based on the most recent 9 months of proJect activity from the start of JTl’A through March 31, 1985 The pnrtlcipant characterlstlcs we identified matched those ldentlfled by .JTlS, a5 shown m appendix IV
Page 36 GAO/HRD-8741 Dislocated Workers

Chapter 3 Participant Characteristics
Flgure 3.1: Title III Participant Characteristics
ParticlDants Were Generally Hiah School Graduates
Less Than High School
L-l-7 - Education or Trammg Beyond High
L ‘““‘-\ School
\
55%--- - High School Graduate
Likely To Be White -
3% Other
Hispanic
Black
White
Page 37 GAO/HRD-8741 Dislocated Workers

Chapter 3 Partlcipmt CharacteristlcR
Flgure 3.2: Title III Participant Characteristics
Between 2244 Years Old
55andover u-- 45 to 54
I
21 and Under
0 10 20 30 40 50 60 70
And From The Manufacturing Sector -
Manulacturtng
SS?WW2!5
.
60%
9%
Mmmg 7%
Contract Construction 6%
Retail Trade I 5%
Transportat~on/Commun~cat~on/utllltles
Other
401”
9%
A comparison of the characteristics of title III participants and title IIA participants showed that, in addition to the expected differences m work history, there were several other differences between the two groups The most significant difference was m age, the title III partici- pants being generally older. About 40 percent of the title IIA partici- pants were 21 years of age or younger compared to 4 percent of the title III participants There were also significant differences in the educa- tional level of the participants as well as in the percentage of nonminori- ties and the percentage of males. Table 3.1 shows the differences in participant characteristics for title IIA and title III.
Page 38 GAO/HRD-87-41 Dislocated Workers

- -. -_-.---.--.- -_-_- --.-- -____----
Chapter 3 Participant Characteristics
Table 3.1: Comparison of Participants’ Characteristics for Titles Ill and HA Percent of program
participants Title Ill Title llAa
Age 21 at-ii under 4 40 22-44 ._ -~ -~~- -~..
69 53 45-54 - -- -
- - ----. -~~- -~- __--.---~--~~- ~- ~~ .-- 19 4
55 and over 8 3 _ _-- _.. - Educational level
~ --- --.- ~- -.-~ _---~ -- -- --
Less than high-school - - .--
22 39
High school graduate or more 78 61
Gender -~ _- .~ _- ~- .~~ .-~ ~~
Males 60 48 Females 40 52
Race
White -69 54
Mlnontles - ~ ~--_~- ~_.__~. _~ ~~- .~~ -~~ ~~ ~~ ~~ ~~
31 46
“Source U S Department of Labor, Job Tralnlng Longltudlnal Survey, August 1985
Older and Less A comparison of the title III participants’ characteristics identified in
Educated Dislocated our analysis with those of the general population of dislocated workers identified m the BIS analysis showed significant differences m their
Workers Had Lower demographic characteristics. Specifically, workers 55 years of age and
Representation in Title older and those with less than a high school education had a lower rep-
III Ihjects resentation m the title III projects, while females and minorities had higher representation. While all of these groups have experienced diffi- culty finding reemployment, our analysis focused on those who had lower representation m title III projects-specifically those age 55 and older and those with less than a high school education The lower repre- sentation of these two groups in title III projects is of particular concern, m our opinion, because older and less educated workers experienced more difficulty m finding new employment. For example, HLS reported that less than half of the older dislocated workers were employed at the time of its survey In contrast, 72 percent of younger dislocated workers had found new employment.
The January 1984 supplement to cps was conducted by the Bureau of the Census for BIS to gather data on employment and unemployment of dislocated workers. n~s identified 1 3 million dislocated workers who were not working and were seeking employment m January 1984-the
Page 39 GAO/HRDS741 Dislocated Workers

- ---- ._ ___--_. . -_ _ _- -------__---___---__-___ ---- -- Chapter 3 Participant Characteristics
-__. _ _ _ _I _ -_-- __ - ----_I---~ - same time frame during which most of the title III projects m our anal- ysis were operating. As shown m table 3.2, of the 1.3 million dislocated workers in the RIS analysis, about 20 percent were 56 years of age and older. In contrast, about 8 percent of the workers enrolled by title III were m this age group The RLS analysis also showed that 32 percent of the dislocated workers had less than a high school education, while 22 percent of the title III enrollees were in this category.
--- --.__ Table 3.2: Comparison of Dislocated Woirker Characterlstlcs Figures In percents
Age
.-- ~--
Title Ill participants -.-.~__
Unemployed dislocated
workers as of January 1984”
..-.. - .-~-. Under age 55 92 80 Age 55 and over 8 20 - -~~- ___ ~~--. -- - -~ -
Education
Less than high schobl --- --
22 32 ._. -~~ .~ .~ ..- -- .-.---------- .- -. ~~. ~~-~. _.. High school graduate or more 78 68
Gender --. - --___--- ____--_ Males 60 69 -._ Females 40 31 _.__
Race b ____- Whrte 69 79 -____ Mlnontles 31 21
aFrom the supplement to the January 1984 CPS
“Hlspanlcs are included as mrnontles 111 title Ill statlstlcs, but In the CPS data, they may be Included In the totals for either race
Further analysis also showed that most individual title III projects served relatively few dislocated workers that were 55 years of age or I older or who had less than a high school education. As shown m figure 3.3, only about 8 percent of the title III projects served the same per- centage or more of older workers as was found m the CPS (20 percent). Ilowever, about 24 percent of the projects did not serve any participants who were 55 years of age or older and over two-thirds of the projects served less than the average number of older workers served overall (8 percent). Similarly, about 18 percent of the projects served the same percentage or more of workers with less than a high school education as was found m the crs (32 percent). In contrast, over two-thirds of the projects served less than the average number of less educated workers served overall (22 percent) (See fig 3 4.)
Page 40 GAO/HRD-87-41 Dislocated Workers

- ___I
Chapter 3 Participant Characteristics
Figure 3.3: Older Worker Representation in Title ill Projects
Percent Sewed
Over 20
1 to a
None
t
r
0 10
Percent ot Propcts
.
20 30 40 50
Figure 3.4: Less Educated Worker Repreaentatlon in Title Ill Projects
Percent Served
Over 32
23 to 32
None
*
0 10
Percent of Projects
20 30 40 50 60
_____ a _ -_ --- --._- -------
Project Variations May Influence Participation Levels
Several factors appear to influence the level of partlclpatlon of dlslo- cated workers 55 years of age or older or those with less than a high school education Our analysis of proJect level data (see table 3.3) showed that participation levels were
l higher for older workers but lower for less educated workers when proJects were employer/union operated,
Page 4 1 GAO/HRD-87-41 Dislocated Workers

--------- Chapter 3 Participant Characteristics
.
.
.
.
_- --_. _-- - ----- Table-3.3: Prolects With Lower and Higher Than Average Representation of Older and Less Educated Dislocated Workers
lower for older workers and lower for less educated workers when projects were operated by educational mstltutions, higher for older workers and higher for less educated workers when projects focused on specific populations or events, lower for older workers and higher for less educated workers when projects had linkages to specific job openings, lower for older workers and lower for less educated workers when projects provided remedial or classroom trainmg to large percentages of participants, and higher for older workers and higher for less educated workers when projects enrolled all applicants (as opposed to projects where enrollees were screened)
Figures In percents
Project charactermtic All projects
_____---.---.___. ..~.~ Older worker Less educated worker
representation representation Lower than Higher than Lower than Higher than
average average average average 68 32 67 33
Project operator
Employer/union 60 40 78 22
- Public 67 33 5% 42
SDA-PIC 66 34 68 32 -~ EducatIonal tnstltutlon 73 27 71 29
Focused on specific population or event
Yes 54 46 51 49
No 73 27 70 30 Job linkage
Yes -~ ~. _---- .-
81 19 56- 44 No 75 25 78 22 * .---~
Extent of remedial training provided
High 94 6 73 27
Medium 66 34 44 56 Low 67 ~~~-~3.-~-----.-69~ 31
Extent of classroom training provided ~~-. - -- --..- .~. ~. -. ~-~ High 83 17 76 -ii
&dium ______~~-- ._---- --- ---- -- -. - -~~ ~-
63 37 66 34
LOW 60 40 63 37 Enrolled all applicants ---
~---..- ____----.
No 76 24 71 29 .._~ ~ -. .- -- Yes 58 42 63 37
Page 42 GAO/HRD87-41 Dislocated Workers

- - - - I - - . - - - _ - - - - - - -
Chapter 3 Participant Characteristics
The lower representation of workers age 55 and older and those with less than a high school education among title III participants has many possible explanations. During our follow-up telephone interviews, pro- ject officials suggested the followmg reasons for the low representation of such workers in title III projects.
Older or less educated dislocated workers may be apprehensive about participating m remedial or classroom training activities. Applicants may not meet the minimum qualifications to take advantage of the training activities Dislocated workers may be screened out by projects because they have less potential for reemployment. Older workers may have received assistance from other programs, such as the ,JTPA older worker set-aside.
Our analysis showed that projects operated by educational mstitutions and those with high levels of participation in remedial and classroom training had rates of participation for both dislocated workers age 55 or older and those with less than a high school education below the overall averages for these groups. Project officials told us that dislocated workers who have had difficulty m a classroom environment or who had been away from a classroom setting for some time were apprehen- sive about participatmg m such projects.
Another possible explanation for the lower representation of older and less educated dislocated workers is that these workers may lack the mmimum qualifications to take advantage of the training activities available. Some projects required applicants to possess basic math skills or communications skills as a prerequisite for enrollment in their projects. Project applicants who did not meet these minimum quahfica- tions were not accepted mto these projects.
Older and less educated dislocated workers may also have lower repre- sentation in some projects because project officials consider applicants from these groups to be less employable. About 55 percent of the projects reported that, at least to some extent, their selection of partici- pants was influenced by the applicant’s potential for placement. Project officials told us that, based on their experience, employers were reluc- tant to hire workers over age 55 or those with less than a high school education.
Program admmistrators also suggested that older workers may be receiving assistance from other programs, such as those funded under
Page 43 GAO/HRlM7-41 Dislocated Workers

-_ _---.. _-_ -___- ~--~ ----- - Chapter 3 Participant Characteristics
the JTPA older workers set-aside. As a result, some older dislocated workers who were receiving assrstance may not have been included m our analysis
Conclusion While many dislocated workers are able to reenter the labor market and become reemployed, those who are older, less educated, women, or minorities have experienced the most difficulty in obtaining reemploy- ment. Our comparison of JTPA title III dislocated worker program partici- pant characteristics with the characteristics of the general population of dislocated workers identified by BIS, however, showed that older and less educated workers have a somewhat lower representation in the title III program Several reasons for the lower representation of these groups have been offered by program officials; however, a better under- standing of this problem is needed to develop appropriate strategies for increasing the participation of these groups m title III.
Recommendation to the We recommend that the Secretary work with state and local officials to
Secretary of Labor identify the reasons for the lower representation of older and less edu- cated dislocated workers m the JTPA title III program, then develop strat- egies to obtain greater program participation by these workers
Agency Comments and The Department of Labor concurred with our recommendation but
our Evaluation believed that, by and large, the states are conducting sufficient outreach to contact older and less educated dislocated workers. Nevertheless, Labor said it would bring the concern about services to older workers to the attention of the system and urge program operators to continue to make every effort to provide maximum services to this group. Labor contends that the reasons for the lower representation of these groups b in title III are known and include the possible explanations cited in our report. Additionally, for older workers, Labor believes that the desire to retire or obtain only part-time or intermittent work contributes to their lower representation. Labor cites the experience from the JTPA section 124 “3 percent” older worker program as evidence of this belief.
Our conclusion regarding the lower representation of older workers was based on an analysis of unemployed dislocated workers seeking reem- ployment. Therefore, our conclusion is not affected by the proportion of older workers who retire or who are not seeking work In addition,
Page 44 GAO/HRD-8741 Dislocated Workers

chapter 3 Participant Characteristics
-- _-.---.- - - - -~ __-- --I-______
.JTPA'S older worker program 1s restricted to the economically disadvan- taged, not necessarily the same population served by title III. Therefore, the experience from the older worker program may not be applicable to the title III program.
Page 46 GAO/HRD-8741 Dislocated Workers
Chapter 4
project Activities -
- --_ _. - _ -___ - In responding to our questionnaire, title III project officials identified a wide variety of training, Job placement, and support service activities that they offered to title III participants to help them return to work Generally, the training activities were categorized into three forms- remedial, classroom skill training, and OJT The placement assistance consisted primarily of counseling, training in Job search techniques, and job referrals, while the support services offered most frequently were assistance with transportation and child care
While most title III projects said they offered a broad mix of activities, we found that relatively few participants received training or support services. In contrast, nearly all participants received some form of placement assistance. When training was provided, the training period was relatively short and the training approach (classroom or O.JT) gener- ally depended on the organization operating the project For example, 77 percent of the projects operated by educational institutions put a heavy emphasis on classroom training, while only 9 percent emphasized OJT. Project characteristics-such as the organization operating the project, the extent of linkage to specific Job openings, and project size-also appeared to influence the extent to which participants were provided placement assistance and support services.
Few Participants Received Training or Support Services
Officials from 94 percent of the title III projects advised us that training was available to their participants; however, less than half the partici- pants received training and less than a quarter received support ser- vices, In contrast, 84 percent of the projects offered their participants Job placement assistance. Over 80 percent of the participants received job counseling and over 60 percent received Job search assistance Table 4.1 shows the basic forms of title III assistance and the percentage of participants that received each form of assistance. L
Rerncdial Training Although the majority of dislocated workers are high school graduates, 32 percent were high school dropouts, according to ISIS. Other researchers have identified the need for remedial education in basic skills, such as reading, mathematics, and oral or written commumcation, as important to facilitate the reemployment of many dislocated
Page 46 GAO/HRD-87-41 Dislocated Workers

_“““. - _ I i __ _---~ --- --~--- Chapter 4 Project Activities
_- -_ _.--.-__. -- workers I Ilowever, less than a third of the projects offered their partici- pants remedial training, and only about 6 percent of the title III partici- pants actually received remedial training, raising the question of whether title III projects are providing adequate remedial training.
- - -.-*---------___ Table 4.1. Title III Actwlties
Percent of Percent of projects participants
Actiwty Description Median length offering receiving Tralnlng --~
Remedial Basic skill training 2 weeks 30 6 -Cl&bbm -- - New job skills
-__.---~~-- ---- ---. -~~~ 9 weeks 77 -26
OJT - New job skills in 15 weeks 69 16 work environment
Placement assistance
Job counseling Orientation, Ongoing 84 84 assessment, and ldentlflcatlon of employment options
Job search Enhance lob search No fixed time frame- 84 66 skills or job referral 44%, 2 weeks or
more-35%, less than 2 weeks-21 %
Support services Assist b&ipants 67 -~ 23 while enrolled In title Ill
When remedial training was offered to title III participants, the training period was usually short, The median length was about 2 weeks. For the most part, remedial trammg was offered as a part of more extensive training efforts. Of the projects offering remedial training, 130 (or 76 percent) offered such training as an addition to classroom or O.JT. For example, m one state, vocational training courses offered to dislocated workers typically include a brush-up m mathematics and reading at the beginning of the course
‘In its February 1986 report, UI’A found that, m some Instances, 20 percent or more of diskx!&!d worker\ requu-e rcmedlal education before they are consdcred to be available for placement assls- Lance or retrammg
Page 47 GAO/HRD-87-41 Diilocated Workers

Chapter 4 Project Activities
Classroom Skill Training The purpose of classroom skill trammg is to give dislocated workers new Job skills or to enhance their existing skills. While about three quarters of the projects offered participants classroom skill training, only about a quarter of the participants actually received such training. For the most part, title III projects use classroom training programs available through existing institutions, such as community colleges or vocational training centers, rather than developmg specific courses for project participants. Examples of classroom skill trammg offered by title III projects are shown in table 4.2.
Tdble 4.2: Examples of Classroom Trleining Offered in Title III Projects ..~ ---- -.- --
Alrcraft mechanlcal operations AIrline attendant Air-conditioning and heating
mechanic Asbestos handler Auto mechanic Bank teller Boat building Bookkeeper Cabmet maker Cable splicing Carpentry Casino worker Chemical operator Clencal and office work Computer repair, maintenance Construction Culinary arts Data processor Day-care worker Drafting Diesel mechanic Electronics Energy conservation work Fisherman
Golf course mechanic Health and medicine Heavy equipment operator Hotel-motel manager Industrial maintenance lndustnal sewing Institutional attendant Iron pourer Lab technician Landscaping Machine tool and die Machinist MechanIcal, electrical engineer Office machine service Pnntlng and publishing Real estate Retail trade Security guards Statistical process control Telephone technician Truck driving Tourism occupations Upholsterer Welding Xerox technician
The most frequent classroom trammg was m clerical skills. Of the 11 projects offering classroom training, over 60 percent of the projects offered clerical training. Other categories of classroom training that were frequently available include equipment or machme operation (55 percent), technical paraprofessions, such as medical technician (52 per- cent), and skilled craftsmen or tradesmen (48 percent).
Overall, the trammg period for classroom training was more extensive than for remedial training. The median training period for classroom programs was 9 weeks, although about a third of the classroom pro- grams lasted for 5 weeks or less. The length of classroom programs is shown in table 4.3.
Page 48 GAO/HRD87-41 Dislocated Workers

- Chapter 4 Project Activities
Table 4.3: Length of Classroom Training Range of weeks Percent of projects -- --~ ---- - 5 weeks or less 32
- ($6 - - -- .-..-_. ---.-~ ~~_-- .~- _- ._._ ____ ______ ___-~- ._.-- __..
19 --.. ~.. -_..---.-- .__. ~___ -..- _.._ ___-- 1 O-20 30 -.--- - ------- Over 20 19
- I _---_ ------
On-the-Job Training The purpose of OJT is to give title III participants new job skills while they are working. It is a popular training form with both workers and employers because it helps participants get back to work as soon as pos- sible and it gives employers a temporary wage subsidy (usually about 50 percent) while participants are in the program. However, we found that while two-thirds of the projects made OJT available to some of their par- ticipants, only about 16 percent of title III participants actually received such training.
When OJT is provided, the Job skills emphasized are similar to those of classroom training. As shown in table 4.4, more than half the projects offering OJT provided it for such job openings as equipment or machine operators; clerical or office workers; skilled craftsmen, foremen, or tradesmen; and service workers.
-- ------c-_--__--
Table 4,4: On-the-Job Training Provided
Traming Percent of projects
offermg OJT $mlskllled (equipment or machine operator, etc ) 83
Clerical or ofcce worker -.----- ____- - - _- -~ -~- ~.
64
Skilled craftsman, foreman, or tradesman --- - _.-.----_ _ __ ~. 60
Service worker ___ . %ch&l (paraprofessional, medical techtxclan, etc ) ~-.--- ._-- .- .- Sales
L&kllled-(laborer, etc) -~ ~-
Manager and ad&inlstrator
55 42 41
30
29
The median length of OJT was about 15 weeks. However, over 20 percent of the O,JT programs ran for 10 weeks or less. Table 4 5 shows the varia- tions in the length of OJT periods.
Page 49 GAO/HRD-87-41 Dislocated Workers

Chapter 4 Project Activities
-- Table 4.5: Length of On-the-Job Trainmg Range of weeks
IO weeks or less
11-15
Percent of projects -____- -- 21 --___- .-__ ---.--- 29
16-20 28
Over 20 -_-- _---~
22
- ” _.- _ _ -.--I-.-_
,Jq)b Placement Assistance Most projects offered their participants job placement assistance in the form of Job counseling and training in job search techniques. Of the 563 projects in our analysis, about 92 percent offered either job counseling or job search assistance. We found that 84 percent of the participants received job counseling and 66 percent received job search assistance. Job counseling usually consisted of testing and assessing Job skills, assessing occupational interests, and giving participants the opportumty to discuss their concerns and problems.
For example, in one project each participant was asked to meet with a counselor at least once. During that meeting the counselor assessed the potential skill levels of the participant as well as the participant’s Job interests. At this session the counselor also determined whether the par- ticipant’s expectations were realistic and whether the participant was adjusting to the dislocation and was coping adequately In addition, the counselor determined whether the participant needed any additional counseling. If the counselor deemed it appropriate, the participant was referred to a specialist for further help.
*Job search assistance takes several forms but generally includes (1) trainmg to improve participant interviewing techniques, resume writing, and other skills that would enhance the participant’s effectiveness in searching for a new job; (2) assistance in preparing a resume for specific L Job openings; and (3) the identification of specific openings and referrals to those openmgs. In one project, the job search assistance training was a l-week (40-hour) program m which 15 to 20 participants attended classes that included group discussions, role playing, and actual practice in preparing resumes or job applications After the training was com- pleted, the staff worked individually with participants to identify spe- cific job openings and help the participant prepare for interviews and prepare resumes. Depending on the participant’s success in finding another Job, the job referral and assistance provided to a participant could go on over a period of several months, or as long as necessary to get the participant placed.
Page 60 GAO/HRD-87-41 Dislocated Workem

- _-- _ _ .__-__- _-- -~-- Chapter 4
--
Project Activities
Support Services Support services help persons participate m title III training activities. While about two-thirds of the projects said that support services were available, we found that less than a quarter of the participants actually received support services. Even for those receiving support services, the amount of assistance was limited. For the most part, JTPA programs, mcludmg tit,le III, tend to discourage direct stipends for participants. The most common assistance provided was help with transportation to and from training As shown m table 4.6, over three quarters of the projects offered some participants transportation assistance. This assis- tance was generally reimbursements for mileage or public transporta- tion tokens. Other assistance, such as child care, was also provided through reimbursements, while counseling services, health care assls- tancc, and legal assistance were generally provided through referrals to organlzatlons that provided such services at no cost to the participants.
~__ -_- __ -----~- Table 4.6: Supporl Serwces Offered
Percent of projects Support service otfermg the services Transportkon- 80 Child care
.- 48
Personal 0; financial coinselmg 40 kb&tence p&nerds -26 Health care assistance 24 ikgal assistance --
--- ---___ 5
Assistance Emphasized Further analysis of title III project activities showed that the percentage
by Projects Varied of participants enrolled in a specific activity varied depending on the proJect’s characteristics. Although we could not determine whether the activities were needed by those not receiving them, the extreme vari- ance in emphasis between projects suggests that proJect characteristics, such as the operator, the extent of linkage with job openings, the focus on a specific population or event, or the project size, may influence the assistance provided to participants
-l__--_ __ - . -
Differences in Emphasis on Despite concerns that training is needed to improve basic skills or Training develop new Job skills, the percentage of participants receiving training
varied considerably from project to project. For example, while overall about 6 percent of the participants received remedial training, as shown m figure 4 1,68 percent of the projects did not provide remedial training to any participants In contrast, 8 percent of the projects provided reme- dial training to over 25 percent of their participants.
Page 5 1 GAO/HR.D87-41 Dislocated Workers

Chapter 4 Project Activities
Figure 4.1: Remedial Training Partbpation Levels in Title III Projects
Percentage of Parlmpants Recelvmg Tramng
Over 60
11 to 25
None
0 20 40 60 60
Percent of Projects
Similar variations were found in other forms of training. More partici- pants received classroom training (overall about 26 percent); however, as shown m figure 4.2, 22 percent did not provide classroom training to any participants. On the other hand, 29 percent of the projects provided classroom training to over 80 percent of their participants. We also found considerable variation in the level of participation for OJT. (See fig 4.3.) About 33 percent of the projects did not provide O.JT to any participants. In contrast, 16 percent of the projects provided OJT to over 80 percent of their participants.
Page 52 GAO/HRD-8741 Dislocated Workers

Chapter 4 Project Activities
Figure 4.2: Claesroom Training Participation Levels in Title III Projects
Percentage of Participants Receiving Training
I .
Over 60
‘(r 26 to 80
r
c1 11 to 25
I-
.
None
0
Percent of Projects
--- -__- -
Figure 4.3: On-the-Job Training Participation Levels in Title III Projects
Percentage OF Participants Recewng Trammg
Over 60 I
r I 26 to 80
- L 0 10 20 30 40
Percent of Projects
These differences m emphasis appear to be related to project characterw- tics, such as project operator, linkage to potential Job openings, and
Page 63 GAO/HRD8741 Dislocated Workers

--- Chapter 4 Project Activities
_- . . - --------~ project size. For example, as shown in table 4.7, projects with linkage” to specific Job openings were more likely to emphasize OJT, while projects without job linkage were more likely to emphasize classroom training. Similarly, projects operated by educational institutions were more likely to emphasize classroom trammg than other project operators, but rarely did educational institutions emphasize OJT.
Tdble 4.7: Differences In Training Participation Levels ---.------
Remedial Greater Lesser
Project characteristic emphasis emphasis Ali projects 8 92
Percent of projects0 Classroom OJT
Greater Lesser - Greater Lesser emphasis emphasis emphasis emphasis
51 49 32 68
Project operator
Employer/union
Pubk
SDA-PIC
EducatIonal lnstltutlon
Focused on speclflc population or event
Yes
‘No Jdb linkage
Yes No
Project size
Small
Medium
-__ .-~-. 4 96 44 56 34 66
12 88 43 57 33 67
5 95 39 61 51 49 11.
~ -- -- --~-- ___--- -~-. -.~~~- .~~~~ -.-- 89 77 23 9 91 ~~~~. .-____- -__
9 91 49 51 35 65 --__- ____ ---- -- 7 93 52 48 29 71 __. - _- .--_--- ~__.
-- ____ ~~ . .____- ~~ 5 95 23 77 84 16 - . -~ -.- ..~ ~~- - - -- -. -~~~-
11 89 66 34 20 80 - ~~- - ~ ----~. -___-- --- -- . .~- .-----
11 89 58 42 44 56
8 52 58 42 28 72
Larae ---__--- ii 66
%nce few projects provided any form of tralnlng to more than half of their participants, we defined greater emphasis as provldlng the training to 26 percent or more of the participants and lesser emphasis as providing the training to 25 percent or fewer of the participants
One possible explanation for the positive relationship between OJT and *job linkage is that job linkage by definition implies the early rdentifrca- tion of job opportunities Employers with specific job openings are often more interested in making the training specifically related to their job openings through O.JT rather than through the classroom approach.
An explanation for differences in emphasis by project operators may be that the special skills or expertise of operators lead them to specific activities. For example, the high level of participation m classroom training for projects operated by educational institutions should not be
‘A\ dis( USVY.! m &q)ter 2, Job linkage indicates that a proJect IdentlfiedJob openmgs before proJect putlclpants were selected In 5omc cases, potential employers helped select partlclpan&
Page 64 GAO/HIRD87-41 Dislocated Workers

__ __ ._^ -I __ _ - --~_-__ -- Chapter 4 Project Activities
-__. __ --._ .- _-_- --.- - surprising considering that is the focus of educational institutions m general. A project operated by a vocational training center, for instance, established classroom facilities that would teach participants word processing even before the participants were enrolled in the project
__ __-___ --- -- _-----~
Most Projects Stressed I’lacement Assistance
Almost three quarters of the title III projects provided over 80 percent of their participants job counseling, and over half provided 80 percent or more of their participants job search assistance. However, 12 percent of the projects provided no job counseling, and 16 percent provided no job search assistance. Participation levels for job placement activities are shown in figure 4.4.
.- __ --.-,.- -_ _ - -- Flgure 4.4: Job Placement Assistance Patticlp4tion Levels in Title III Projects
60 Percent of ProJects
60
40
None 1 to 10 11 to 25
Percent of Partlclpants Recewng Placement Assistance
/ .::
.::>:
. . * :*: . . . : .::::; 3.q ., : . :, a . . . :.*.*< . . .
Over 80
Job Counseling
Job Search
Page 55 GAO/HRD-87-41 Dislocated Workers

_-_--- ---__ - -~-___ --- -- Chapter 4 Project Activities
-_ _ - ____._ Our analysis also showed that the differences in emphasis on placement assistance appear to be related to project characteristics, such as job linkage and project operator. As shown in table 4.8, projects without linkage to specific job openings were more likely to emphasize job coun- seling and job search assistance t,han projects with job linkage. Slmllarly, title III projects operated by public organizations, such as community- based organizations, state and local agencies, and the employment ser- vice, as well as those operated by educational institutions, were more likely to emphasize job search assistance than projects operated by SDA-
PIGS or employers, unions, or employer-union combinations.
Tqble 4.8: Differences in Placement AWlstance Participation Levels Percent of projects’
Job counseling Job search Greater Lesser Greater Lesser
Project characteristic emphasis emphasis emphasis emphasis All projects --
-_-_ _-.-- -.-- --- --- 75 25 58 42 -.-__ -.
Project operator
Employer/uiion -~-.---__~
70 30 56 44
Public 76 24 6.5 35 ___-__ SDA-PIC 78 22 46 --____ --- 54 --- --__. EducatIonal Institution 70 30 60 40
Focused on speaflc population or event ____- _.-..--~-. -~--~~
--~ _----~- .-. ____---~.. ~~ --- ____-- Yes 74 26 59 41 ______-__ No 75 25 52 48 ~~~ _---- _______---_ -~~ ~~ .~
Job llnkage
Y&s --- 58 42 37 63 ~.- - _~_..... .-~~~ No 76 24 62 38 -. - _ __--. -~--- ..-----________^-_---.~~-.--
Project size Small 73 27 61 39 .- -__.. Medium 77 23 54 ___-- _____--._ - -.. ..___ 46 * Larae 76 24 58 42
%nce most projects provlded placement assistance to more than half their project partupants, we defined greater emphasis as provldlng the specified placement assistance to 76 percent or more of project partupants and lesser emphasis as provtding the specified assistance to 75 percent or fewer of project participants
The explanation for the lower emphasis on job placement assistance by pr0Ject.s with linkages to specific job openings is relatively simple. When project participants already have a link to a specific Job opening, there is little need to develop job search techniques. This is also true if the pro- Ject operator 1s the prospcctlve employer. For example, in a project where the future employer selects the project participants, provides the
Page 56 GAO/HRD-87-41 Dislocated Workers

Chapter 4 Project Activities
classroom training, and provides OJT for specific Job openings, project participants do not need placement assistance.
Few Participants Receive Support Services
As noted earlier, many projects offered support services, but less than a quarter of the title III participants received them. As shown m figure 4.5, more than half of the projects provided support services to 10 per- cent or less of their participants.
--- Figure 4.5: Support Services Particidation Levels in Title III Projects
Percent of Parllclpanls Recewng Support Serwes
Over 80 r------
r
.
28 to 80
11 lo 25
w-
None
-- L
0 10
Percent of Projects
20 30 40 50
Our analysis of the differences m emphasis on support services showed that project characteristics, such as job linkage and project operator, appeared to influence the percentage of participants who were provided support services, such as assistance with transportation or child care costs. As shown m table 4.9, projects with job linkage were less likely to provide participants support services than projects without job linkage In addition, projects operated by employers, unions, or employer-union combinations were less likely to provide support services than projects operated by other organizations, especially educational institutions
Page 67 GAO/HRD87-41 Dislocated Workers

Chapter 4 Project Activities
Table 4.9: Differences in Support Services Participation Levels
Project characteristic .---_-_ _..- -- _-_. - _----. --- All projects
Percent of projectsa Greater Lesser
emphasis emphasis on support on support
services services -- --____-.-. --- 39 61
Project operator _____-_______. _____~~_ -.- Employer/union 24 76 -~ _________ -_-- ---- .-_--- -~~ - Public 39 61 ----.-- SDA-PIC 39 61 Edicatlonal lnstltutron
--____________-__ . _.~. 43 57 _ __-- .-_. -----__
Focused on specific population or event -- _------ - ~~ - Yes 37 63 No 33 67
Job linkage -- ~. -- ____--_ ________ ___- .~ Yes 14 86 ~. _ _--.-- ---- No 53 ‘47 ..~_. -- ~~~
Project size --_-- ---- _-~- Small 42 58 Medium
~___- --__- 36 64 --~__-
Large 38 -62
%nce few projects provided support services to more than half thetr project partupants, we defined greater emphasis as provldlng these services to 26 percent or more of project participants and lesser emphasis as providing support services to 25 percent or fewer of project partupants
One possible reason for the limited use of support services by projects with employer/union operators is that, because these proJects often pro- vide participants OJT that gives the participants income, support ser- vices may be less necessary. In contrast, educational institutions usually provide participant classroom training, which does not give participants income support To enable these participants to attend classroom training, they may need to give a higher percentage of participants assistance with transportation or child care costs.
Page 68 GAO/HIRD-87-41 Dislocated Workers

Page 59 GAO/HRD-8741 Dislocated Workers

C:haJtcr 5 _-__---
Project Outcomes ---~-
.- --._ --..-_ - ____- The primary objective of the title III program is to help dislocated workers return to work. Thus, the indicators of project success are the number of workers fmdmg jobs and the wages they earn. Most title III projects reported high placement rates (more than a third of the projects reported placement rates over 80 percent), with most participants finding Jobs in different occupations or industries (over 70 percent changed occupations and 60 percent changed industries). However, many jobs had relatively low wage levels (28 percent of the projects reported average placement wages of $5 per hour or less)
Analysis of these outcomes showed results that vary considerably from project to project, with certain project characteristics associated with much higher job placement rates or average wage levels than others. The project characteristics that were generally associated with higher placement rates, however, were also associated with lower average wage levels and vice versa. These characteristics include
. project operator, l whether assistance is focused on specific closures or layoffs, . linkage with specific job openings, and l training approach emphasized
Sob Placement Rates z+nd Wage Levels
Overall, the average reported placement rate for title III projects was 69 percent. I3ased on a survey of state level data, OTA reported that for the period October 1983 through June 1984, of the 36 states setting expecta- tions for title III participants entering employment, 30 had exceeded their standard. The title III placement rate was also higher than the placement rates experienced in other federally sponsored employment and training programs. For example, the Work Incentive program- which served primarily economically disadvantaged workers-reported I that about 36 percent of active participants found jobs during fiscal year 1980, and the average placement rate for CETA participants was about 42 percent for fiscal year 1982, the last year of the program.
The average entry-level wage reported for the jobs found by title III par- ticipants was $6 61 per hour, which was significantly higher than the $4.61 average hourly wage that JTPA title IIA participants earned when they entered employment. However, it was generally lower than their prior wage and considerably below the private sector average hourly
Page 60 GAO/HRD-8741 Dislocated Workers
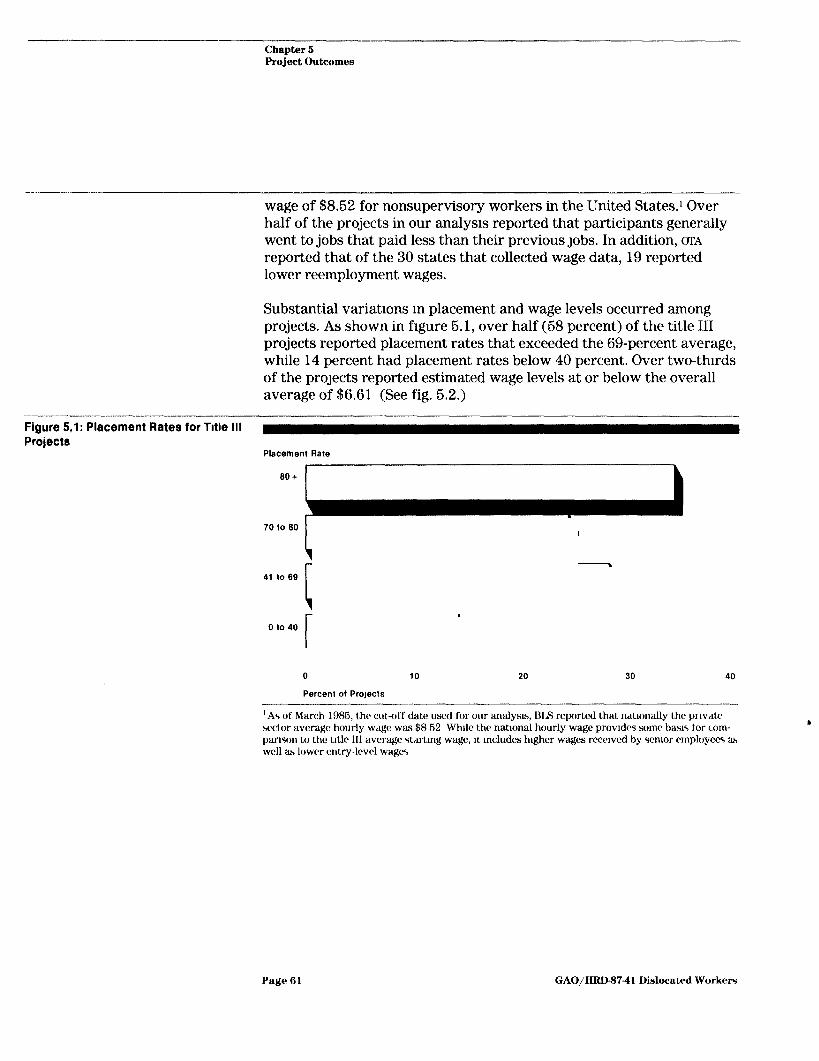
Chapter 6 Project Outcomes
wage of $8.52 for nonsupervisory workers in the United States.’ Over half of the projects in our analysis reported that participants generally went to jobs that paid less than their previous Jobs. In addition, (n'~ reported that of the 30 states that collected wage data, 19 reported lower reemployment wages.
Substantial variations m placement and wage levels occurred among projects. As shown in figure 5.1, over half (58 percent) of the title III projects reported placement rates that exceeded the 69-percent average, while 14 percent had placement rates below 40 percent. Over two-thirds of the proJects reported estimated wage levels at or below the overall average of $6.61 (See fig. 5.2.)
Projects Placement Rate
70 to 60
i
I
- 41 to 69
1
t
0 10 40
r
0 10 20 30 40
Percent of Propcts
‘As of March 1985, the cut-off date used for our analysa, ISIS reported that ndtionally the private s&or average hourly wage w&s $8 52 While the natmnal hourly wage provides some basis for corn- panson to the tltlr III average %uTmg wage, it includes higher wages recclved by seruor employees iI.5 well as lower entry-level wages
Page A 1 GAO/HRD-8741 Dislocated Workerr

Chapter 5 Project Outcomes
Flgure 5.2: Wage Levels for Title III Projects
Wnge Level
I .
$5 00 or Less
. $5 oi- $6 61
$6 62. $7 00
r $7 Ol- $6 00
Otter $6 00
0 IO
Percent of Projects
-
20 30 40 50
Jobs Found Most title III participants returning to work are going into occupations and industries different from the JObS they lost. For example, in one pro- ject, assembly workers from the auto industry were trained and placed in positions as sales managers in the auto parts department for a dis- count department store chain. Overall, an estimated 73 percent went to different occupations and 61 percent went to different industries (see figs. 5.3 and 5.4).
The percentage of participants getting jobs in different occupations varied from project to project. (See fig. 5.5.) For example, 39 percent of the projects placed over 90 percent of their participants in different occupations, while 10 percent placed 26 percent or less in different occu- pations. As shown in figure 5.6, a wide variation between projects also existed with regard to placing participants m different mdustries.
Page 82 GAO/HRD-8741 Dislocated Workers

- ._ _ __ -.--- -__-- - Chapter 6
----- ____--- -
Project Outcame
Figure 5.3: Percent of Title Ill Placements Changing Occupation
Most Changed Occupation
Same Occupation
\
73%= _ Dlfferent Occupation
Figure 5.4: Percent of Title III Placements Changmg Industry
Most Changed Industry
Same Industry
Different Industry
Page 63 GAO/HRD-8741 Dislocated Workers

------- -- ------- Chapter 5 Project Outcomes
---
Figure 5.5: Percent of Participants Finding Jobs In Different Occupations percent of Partwpants In Odlerant Occupatbons
25% or Less
26-50%
74.90%
L
Over 90%
i
0 10
Percent of Projects
20 30 40 50
Figure 5.6: Percent of Participants Finding Jobs in Different Industries
Percent of Partwxoants m Odferent lndustrtes
2661% c
62.60%
[
61.90%
I - --
Over
90%
0 10
Percent of Projects
L
I 20 30 40 50
Page 64 GAO/HRD-87-41 Dislocated Workers

Chapter 5 Pro&et Outcomes
Title III projects reported that their participants found jobs in a variety of skills and occupations. The most frequent occupations obtained were semiskilled equipment or machine operators; skilled craftsmen, foremen, or tradesmen, clerical or office workers; and service workers. (See fig. 5.7.)
I I ._-~-____ ~--__-~_ F&e 5.7: Occupations in Which Title III Partlclpants Found Jobs
Semi-skilled Equipment/ Machine Operator x
c
I
Skilled Craftsman, Forman, Tradesman
.
Clerical or Office Worker
i
i
.
Service Worker
Technlcal (Paraprofessional Technician)
Unskilled Laborer
Manager, Prof
Sales Worker
>
0 IO
Percent of Placements
20 30 40 *
Page 65 GAO/HRD-8741 Dislocated Workers

-- Chapter 5 Project Outcomes
Factors That May Have Our analysis of project-level data suggests that project characteristics,
Influenced Project Outcomes
such as as project operator, whether assistance is focused on a specific closing or layoff, the linkage with specific job openings, or the training approach emphasized, were generally associated with differences in average placement rates and average wage levels. However, project characteristms that were associated with higher average placement rates were also generally associated with lower average wage levels. For example, projects that were not focused on a specific population or clo- sure reported a higher average placement rate but an average wage level of $6.91 compared to $7.03 for projects that targeted a specific population or closure to be served. Our analysis of project factors and their relationship to average placement rates and wage levels reported by projects are summarized in table 5.1 and then discussed mdlvldually.
------ Table 5.1: Job Placement Rates and Wage Levels by Project Characteristic
All ororects
Average Average placement rate wage level
69% $6 61
Project operator ~- __--_____----.- ..-- - Employer/union 71 7 62 - ..-_-- -- Public 69 5 93 ___- ___-__-_____-. - ~- SDA-PIC 66 6 70 _---- EducatIonal institution 70 5 88 -- ----.--~ -- .- - -.-.--
Focused on specrfic population or event ----- -~~ Yes 65 7 03 -. - ____.._________- -- -___ No 69 591 ..~ _-. .__~. -.-..--- __---
Job llnkage --- -__.- -- .- Yes 78 5 44
-No 68 6 24 ---. . . _ --~-~______ ---~-.. .- - --.- -- Classroom training --___--. -______
Hgh emphasis 66 6 66 * - -.-_ --_._ . .-.-______
Medium emphasis 70 6 02 -____ .-__--_- .- -... - ..--.- -- Low emphasis 71 6 17 ____- __.- _-.- ~.~ - -
OJT ~- ___. .- High emphasis 78 5 69 ____ _-- _~~~ - .- Medium emphasis 74 5 80 ___--___--.-_------_- _-.----- -~- ~__ Low emohasls 66 6 52
Page 66 GAO/HRD-8741 Dislocated Worker8
----------__- -- Chapter 5 Project Outcomes
- One of the explanations offered by project officials for the higher place- ment rates and higher average wage levels for projects operated by employers, unions, or employer/union combination is their knowledge of the job market, contacts with other employers, and the fact that many of the specific job openings were identified in advance. For example, one employer/union project operator advised us that the project identified specific job openings before individuals were enrolled in the project. Over a quarter of the employer/union projects had job linkage compared to about 8 percent of the projects operated by educational mstltutlons.
An explanation for lower placement rates by projects that focused assls- tance on specific closures or populations may be that these projects were less selective in enrolling participants. Over half of the projects that focused assistance enrolled all eligible mdivlduals who applied In addl- tion, these projects frequently had higher percentages of participants who could be expected to be more difficult to place in jobs, such as those 55 years of age and older or those who had less than a high school edu- cation As shown in table 3 3,46 percent of the projects that focused on a specific event or population had a higher than average representation of older workers, and 49 percent had a higher than average representa- tion of less educated workers. In contrast, only 27 percent of the projects not focused on a specific event or population had a higher than average representation of older workers, and 30 percent had a higher than average representation of less educated workers While this may explain why focused projects had lower placement rates, it is unclear why these projects were associated with high wage levels
Job linkage implies the early identification of Job opportunities before participants were selected for the project This early identification may result m the number of participants in the project being limited to the number of job openings identified, which could explain the high place- ment rates for projects with job linkage. For example, one project oper- ator said that the 28 mdivlduals selected for the project were guaranteed jobs on completion of training as sales managers in the auto parts departments of a discount department store chain. However, the association of job linkage with lower wage levels is less clear.
Because of the strong job ties between OJT and employment opportuni- ties, high placement rates for projects with high partlcipatlon m such training is not surprising. However, the relationship between high par- ticipation m QJT and low wage levels is less obvious.
Page 67 GAO/HRD-87-41 Dislocated Workers

_- -- --~--- -.-- - Chapter 6 Project Outcomes
-- 1
_ --_ ---.___--~ Outcome patterns for classroom training are less pronounced than for OJT and it 1s unclear why wage levels show little variation for different levels of participation However, one possible explanation for the lower percentage of high placement rates for high classroom participation may be that operators with high classroom participation were frequently educational institutions, which may not assure placement of partlci- pants at the completion of training.
Our analysis shows that projects with higher participation m trammg
(kcupations and Industries
activities have higher percentages of participants obtammg Jobs in occu- pations different from those they worked in before being dislocated. (See table 5 2.) In addition, we found that those projects where a higher proportion of participants received job placement assistance had a higher proportion of their participants obtaining employment in indus- tries different from those from which they were dislocated. One expla- nation for these differences is that project trammg provides participants with new skills, thus enabling them to move from one occupation to another. Projects that emphasized training, therefore, would be expected to have a higher proportion of the participants change occupa- tions By comparison, projects that emphasized placement assistance appear to have enabled participants to use their current skills and market themselves to another industry without the necessity of retraining.
-i_-- Table 5.2: Comparison of Project Emphasis and Percent of Participants Entering Different Occupations or Industries
Percent of participants Going to different Going to different
occupations mdustrles 40% or
8~~ Over 40% or
fewer 80% fewer 8% Oo %“: . __.-- - -____---- ____- Emphasis on tralnlng L -- --____-
Low 25 38 37 27 42 31
Medium 13 34 53 24 44 32 .H,gh-.-.--~--.. -. 14 23 63 32 - 28 40
Emphasis on placement assistance Low 6 16 78 48 22 30 -~--__ - --_ --.- -~~-. . Medium 17 34 49 32 36 32 __- -.--. - . . Hlah 20 29 51 25 37 38
Page 68 GAO/HRD87-41 Dislocated Workers

Page 69 GAO/HRD-8741 Dislocated Workers
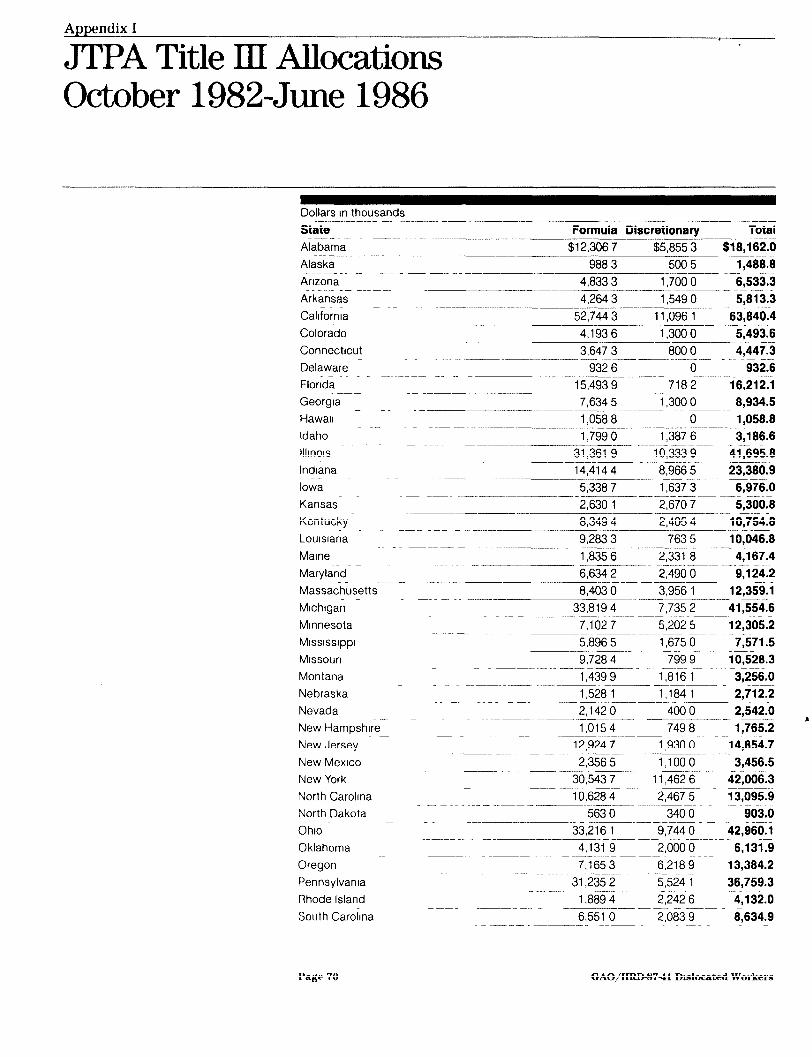
Appendix I
JTPA Title III Allocations October 1982-June 1986
Dollars In thousands --- State Formula Discretionary Total ~- ___~ -_____ ~.--. -. Alabama $12,306 7 $5,855 3 $16,162.0 _------ --- Alaska 9883 5005 1,466.6 -----_------ --_ Anzona 4,8333 1,700 0 6,533.3 Arkansas 4,264 3 -~,549~---%,81ih ~--_- -_-.- ----.---~-. - -.. Callfornla 52,744 3 11,096 1 63,640.4 - -.-___ -- Colorado 4,193 6 I,3000 5,493.6 ---- Connecticut 3,647 3 8000 4,447.3
- Delaware 9326 0 932.6 -______. Flonda 15,493 9 718 2 16,212.1 Georgia 7,634 5 1,300 0 6,934.5
-- -- Hawail 1,058 8 0 1,056.6 ---.- _--_-- Idaho 1,799 0 1,387 6 3,166.6 ---..- __--._ ___---.- _ ._~ Illinois 31,361 9 10,333 9 41,695.6 Indiana 14,414 4 8,966 5 23,360.g Iowa
_--~~-- .-__ 5,338 7 1,637 3 6,976.0
Kansas 2,630 1 2,670 7 5,300.6 __-_-- ___~--_ _~-- - Kentucky 8,349 4 2,4054 10,754.6 Louisiaria
~---. -- -- I_-~--- 9,283 3 7635 10,046.6 ---- ______..-- --
Maine 1,835 6 2,331 8 4,167.4 -- --- Maryland 6,634 2 ,490~--- --gii24.2
Massachusetts 8,403 0 3,956 1 12,359-l ._____ ____..-- _-~. Michigan 33,819 4 7,735 2 41,554.6 -- -.~~-.- .- Minnesota 7,102 7 5,202 5 12,305.2 MISSISSI;~; 5,896 5 1,675 0 7,571.5 Mlssoun
- ~_____ 9,7284 799 9 10,526.3
Montana 1,439 9 1,816 1 3,256.0 -__- --__~~- - --~~ Nebraska 1,528 1 1,184 1 2,712.2 Nevada 2,142 0 4000 2,542.0 - __---- Y New Hampshire 1,0154 7498 1,7655Ti
New Jersey 12,924 7 1,930 0 14,654.7 -~~-___- -.- --- New Mexico 2,356 5 1,lOOO 3,456.5 New York 30,543 7 11,462 6 42,006.3 North Carolina 10,628 4 2,467 5 13,095.g ___ -~~.--. .-~~.-.-. --.. North Dakota 5630 3400 903.0 - ._____~_ Ohio -33,216 1 9,744 0 42,960.l Oklahoma 4,131 9 2,0000 6,131.g Oregon 711653 6,2189 13,364.2 Pennsylvania Rhode Island
South Carolina - --A
6,551 0 2,0839 6,634.g _ ------
31,235 2 5,524 1 36,759:3
1.889 4 2.242 6 4.132.0
Page 70 GAO/HRD-8741 Dwhcated Workers

Appendix I JTPA Title III Allocationa October 1982Junc 1986
- - .---_ State Formula Discretionary Total _____-----~_I__ South Dakota 551 5 ------301,j
~____---_____I -- - Tennessee 11.357 2 1.400 0 ---?:75?.2 ---__- - --- __--
Texas $19,273 7 $6,110 0 $25,383.7 Utah --~--- ---
_____-~ -
_-.-._ - .- 2,190 8 56288 7,819.6 ---_ ----_-----.--.-~.--- ----------. --- --
Vermont 667 1 0 667.1 _--.---. __-__ Vlrgbnia 6,512 5 1,866 9 0,379.4 _ .- __ .- --. -___ ______ -------- Washington 11,554 8 ----4;705 i------I6 260.2 ----.--..--‘-. .- West Vlrgw-ua 6,793 7 3,695 1 10,488.E - -..-----------_ ~___---_-__.--.-- -~. Wisconsin 12,114 6 4,419 5 16,534.l -----. -.. - -- - Wyoming 667 0 0 667.0 -. ---.- ----___--. Total allocation to states $473,707.7 $155,013.8 $628,721S8
aThe difference between the total state allocatlon and the amounts budgeted for title Ill ($650 2 mAllon) IS due to allocations to the Dlstnct of Columbia and U S terntones and amounts retalned by the Depart- ment of Labor
L
Page 7 1 GAO/HRB8741 Dislocated Workers

Alymdix II ---- ~---I__---~- --
Allocations and IZxpendities of JTPA Title ‘III Formula Funds by State and Year
State Alabama
Total Alaska
Total Arizona
Total Arkansas
Total California
Total Colorado
Total Connecticut
Total
Amount Reported Percent Approach Yeald allocated expenditures expended
- --------- RFP FY83 $2,069,540 $2,069,540 100
TY84 1,782,691 1,782,691 100
PY84 4,079,060 4,079,060 100 PY85 4,375,377 2,842,394 65 -____
$12,306,666 $10,773,665 66
RFP FY83 $144,601 $144,601 100
TY84 123,845 56,957 46 --- - ~-- ~__~.~ PY84 296,493 180,692 61 -.. --___-- --- PY85 423,383 0 0 _-- ------ _____---_____
$966,322 $362,250 39
RFP FY83 $806,052 $806,052 100
TY84 803,016 803,016 100 .- --____ --- ____-- PY84 1,900,800 I ,900,800 100 --- PY85 1,323,435 884,172 67 ~~- -- --______
$4,633,303 $4,394,040 91 RFP FY83 $694,274 $694,274 100 ---~
TY84 582,234 582,234 100 ____-- ----- _ PY84 1,340,825 907,933 68
PY 85 1,646,983 0 0 ~--. .____ $4,264,316 $2,164,441 51
Formula FY83 $8,861,374 $8,361,107 94 TY84 7,672,lOO 7,672,lOO 100
PY 84 18,211,123 17,001,609 93 _~.. PY85 17,999,670 0 0
$52,744,267 $33,034,616 -63
RFP FY83 $758,904 $711,989 94 TY 84 676,672 676,672 100
PY 84 1,603,294 837,915 52 1 PY85 1,154,720 0 0
$4,193,590 $2,226,576 53
Mlxed FY83 $721,636 $721,636 100 ___--__ TY 84 611,966 611,966 100 PY84 1,383,095 1,383,095 100
PY85 930,630 559,161 60
$3,647,327 $3,275,656 90
Page 72 GAO/HRD-87-41 Dislocated Workers

Appendix II Allocations and Expenditures of JTPA Title Ill Formula Funds by State. and Year
-- .- _- ----.~ Amount Reported Percent
State Approach YeaP allocated expenditures expended . _~ - -. _-. _ -_-_-_ . . __ - ---. Delaware Formula FY83 $173,267 $173,267 100 -----_____----~ _-~ -.
TY84 139,444 139,444 100 --____- 303,277-----%?ij%---- 100 PY84 -- -.~-. - ____... _______ __.__-_._- -_--_ ~. .~
PY85 316,616 350 0 T%l
-------_.--. .-- ---~- ~ $932,604 $616,336 66
FlorIda RFP FY83 $2,549,381 $1,901,659 75 --..____----__ ------.-~ -_-~-.~ ~~ TY84 2,194,479 2,194,479 100 PY84 5,521,134 77,934 1 _ . . . . -.~.-.~- -~-.-_. PY85 5,228,930 0 0
T&al ~-- $15,493,924 $4,174,072 27
Georgia Sohted FY83 $I,3323344 $874,899 66
TY84 1,140,157 1,140,157 100 ---..~ ---_ --.- ~- -- PY84 2,601,742 2,345,917 90 _ _._~ -- -~.~ ____ ---_--_.. -- _ - -- - --~ PY85 2,560,273 1,850,158 72
Total -~ __- --
$7,634,516 $6,211 ,I 31 61 Hawall Formula FY83 $183,366 $183,366 100
TY84 156,572 156,572 100 - -~ _ ~. - .~ ~--------__ -- --_ PY84 342,631 282,428 82 PY85 376,247 0 0 - - ..~
Total $1,056,616 $622,366 59
Idaho RFP FY83 $300,546 $300,546 100 -.. - TY84 257,937 257,937 100 -
PY84 635,620 635,620 100 PY 85 604,865 290,871 48
- Total $1,796,966 $1,464,974-- 63 Illinois RFP FY83 $5,261,528 $5,261,528 100
TY84 4,496,008 4,496,008 100 _- --.~-_~_~ -- PY84 10,866,051 10,866,051-m 100 --
--PY85 10,738,301 8,164,0% 76
Total $31,361,666 $26,767,609 92 Indiana Solicited FY83 $2,631,958 $2,631,958 100
TY84 2,199,935 2,199,935 100
- PY84 4,810,706 4,810,706 100 - PY-85- 4,771,790 368,275 8
Total $14,414,369 $10,010,674 69
Pagr 73 GAO/HRD-8741 Ihslocated Workers

Appendix II Allocations and Expenditures of JTPA Title Ill Fomwla Funds by State and Year
Amount Reported Percent State Approach YeaP allocated expenditures expended ~~. ___----- Iowa Formula FY83 $942,155 $942,155 100 --~ ~~__ -_-_ __ --- -----._-
TY84 805,263 805,263 100 --~ -_____.- --
--____ PY84 1,853,741 1,853,741-------%ti -~ _ ._-___- _-- PY85 1,737,526 1,519,209 87
Total -----__- $5,338,885 $5,120,388 98
Kansas RFP FY83 $452,763 $452,763 100 --- TY84 398,451 398,451 100 --~~ -. __--_ - -- .----- ____-.-------- PY84 924,805 816,018 88 ---____ ~-_-.~ PY85 854,101 0 0
Total $2,830,12%--7,232 83
Kentucky RFP FY83 $1,313,018 $1,313,018 100
TY 84 1,114,488 p--l,114,488 100 ~- - --_-.--- __--~------ - - ----- ------ PY84 2,680,337 1,916,664 72
- ____-.-.
PY85 3.241.553 0 0
Total $8,349,398 $4,344,170 52
LouIslana RFP FY83 $1,370,460 $1,271,365 93 TY84 1,149,618 1,149,618 100 _.- -- PY84 3,088,379 1,536,167 50 ~~___--.---.----..--- --.--~~~ PY85 3,674,881 0 0 _ ----- --.
Total $9,283,338 $3,957,150 43
Maine Solicited FY83 $290,361 $290,361 100
TY84 262,022 262,022 100
PY84 637,866 637,866 100
- -. - --
PY85 141,439 -645,335 22
Total $1,835,584 $1,331,888 73
Maryland Formula FY83 $1,354,126 $995,719 74 -_____. TY84 1,121,251 1,121,251 ioo
PY84 2,310,360 2,310,360 100
PY85 1,848,488 1,421,074 -17 L _- _---_.. Total $8,834,225 $5,848,404 88
Massachusetts RFP FY83 $1,617,271 $1,617,271 100
TY84 1,405,715 1,405,715 100 -__--- ----- _-- .-----~- - - PY84 2,902,123 2,902,123 100
PY85 2,477,850 2,039,929 82 - - ~.~ Total ~---
_--- _- --------. - $8,402,959 $7,985,038 95
Page 74 GAO/HRD87-41 Dislocated Workers

----_. --. -__~_ -- Appendix II
--
Allocations and Expenditures of JTPA Title III Formula Funds by State and Year
State Approach -. Mlchlgarl ~.-____ RFP - _ _ _ --_--
Amount Reported Percent Yeap allocated expenditures expended __--_----- - - ~-- -..- .- FY83 $6,012,032 $6,012,031 100
TY84 5,059,450 5,059,450 100 PY84 11,578,385 11,578,385 100 _.__ --.-. _ .~. -. - PY85 11,169,526 1,434,518 13
Tota, --- ..---
- ..--.
-.-. -~--.- -_____- --$33,8,g,393$24,084,384~. 71 Minnesota RFP FY83 $1,150,409 $1,150,409 100
100 100 69
69
TY84 1,018,439 1,018,439 -. - _- . ..- - .--. PY84 2,465,109 2,465,109 -. _-- - _-- -..- __-__. ~_.~ ~- PY85 2,468 712 1,694,452
Total $7,102,669 $6,326,409 MISSISSIPPI RFP FY83 $900,540 $900,540 _ - _- ___. --.
TY84 776,145 776,145 ~- ----.--- _ _- _ -~.-_-._ --_.-.- -~ PY 84 --1,932;127 1,932,727
PY 85 2,287,103 1,562,924 -. _---_-_ ---.----__- Tota, $5,696,515 $5,172,336
100 100
100 68
66
Mlssoun Mixed FY83 $1,595,209 $1,595,209 100
TY84 1,349,977 1,349,977 ___---
- --. -. -~ PY84 3.242.489 3.242.489
100
100 ---. -___--- PY85 3,540,734 1,340,560 38
-- _ -- _ -----.-. -----
Total $9,728,409 $7,520,235 77
Montana RFP FY83 $236,950 $232,858 98
TY84 199,215 199,215 100 _ _-. --- -~ --___ - _- - ~~ -~ ---~y~4--- 457,198 457,198
~~ .~ ~~ 100 -. _.--- -~ ---- ----
PY85 546,566 410,518 75
Total -- _-_-_ --~..---- ---__
$1,439,884 $1,290,789 90 Nebraska Formula FY83 $278,590 $269,500 97
TY84 251,099 251,099 100 .
_--- PY 84 574,908 ----574,908 100 -_----- -- ___- ---- --- ~~_~~ -~ ~~ ~~ PY85 423,466 345,938 82 ----- __- .--~.- -.-
Total $1,528,063 $1,441,445 94 Nevada Other FY83 $362,465 $362,465 100 -_ ----______~ .-__
TY84 323,040 323,040 100 --__--.-- PY84 753,523 753,523 100 _ .--.- -__- PY85 702,950 553,768 79
TOG __--.-
$2,141,978 $1,992,706 93
Y
Page 76 GAO/HRD-8741 Dislocated Workers

-- Appendix II Allocations and Expenditures OP JTPA Title III Formula Funds by State and Year
Amount Reported Percent State Approach YeaP allocated expenditures expended NewHampshtre --- ---___ --- ---_ --_---. -.--- Other
FY83 $223,687 $223,687 100 . . ---~-. .~--. ~--- .--- TY84 194,658 194,658 100
PY 84 374,280 332,500 89 PY85 222,742 0 0
- ___- _______
Total $1,015,367 $750,645 74
NewJersey Formula FY83 $2,388,579 $2,237,272 94
TY84 2,025,737 2,025,737 100 _ - _ _ -. ._~ -- .----____-- ---_________-. PY84 4,503,918 2,129,205 47
PY85 4.006.433 80.000 2 _____-- A-p_Lp_ -- .__~~
Total $12,924,667 $6,472,214 50 New Mexico Formula FY83 $373,208 $290,358 78
-_____- TY84 320,663 320,663 100 _____-- -.- PY84 818,114 818,114 100
PY85 844,531 303,634 36 -_________----____------- .-.-. ~.~~. Total $2,356,516 $1,732,769 74
New York RFP FY83 $5,156,969 $4,692,715 91
TY84 4,317,093 4,317,093 100 ---~--~-. ________ PY84 10,422,943 -?,028,662 67 _---- PY85 10,646,683 0 0 __~_________. ---
Total $30,543,666 $16,036,470 53
North Carollna Sobted FY83 $1,871,567 $1,871,567 100 TY84 1,623,683 1,623,683 100 PY84 3,650,676 3,65Or- 100 ~---.- PY85 3,482,448 2,177,324 63
Total --- ____- _- ---.-.~~--
$10,626,374 $9,323,250 66
North Dakota Formula FY83 $95,228 $95,228 100 -.___ -- ____-- -_- ~-. TY84 76,933 76,933 100
PY84 185,629 185,629 100 ~_----- -.~ - -~- PY85 205,258 84,371 41 ~___----._- 1 -.----_---
Total $563,046 $442,161 79
Ohio RFP FY83 $5,677,816 $5,677,816 100
TY84 4,863,925 4,863,925 100
PY84 11,438,077 11,438,077 100 PY85 11,236,251 2,662,182 24
- - Total $33,216,069 $24,642,000 74
Page 76 GAO/HRD-8741 Dislocated Workers

Appendix II Allocations and Expenditures of JTPA Title III Formula Funds by State and Year
State Approach Okiahoma RFP _-I - . . .-.
_~. -- -~- - - .-~- -_-
Amount Reported Percent Yeald allocated expenditures expended FY83 $413,570 $413,570 100 ~-- _____-.-__.- ------ - - TY84 369,099 369,099 100
PY84 - 1,317,932 _------. --
1,317,932 100 -~ .--.--- -_ - ~-_ ._-__ _-_ - ______ ___- PY85 2,031,292 62,569 3 ----_ --- --
Total $4.131.893 $2.183.170 52 , I
Oregon Formula FY83 $1,247,847 . $1,247,847 100 ~-_ TY84 1,073,369 1,073,369 100 -.. -_.---.-._.- --.. ___~- ~- -_ .._ ---~- _ _- PY84 28350,768 2,350,768 100 PY85 __-___
____-.-- -~.-- .~ 2,493,309 2,029,090 81 _ _ -__ --_.-- --------.--__-.______________- _____. - _- .~
Total $7,185,293 $8,701,074 94 Pennsylvania RFP FY83 $4,988,634 $4,186,374 84 . -- __ __.---. - ---- - _--__-_-____--__---___ __-.--- - ~- -
TY84 4,288,753 4,288,753 100 ..-- _-..- - _- -.-_-. -------- -__ PY84 10,823,137 9,809,323 91 ___ -- ---_ - - - .---________-__ PY85 11,134,643 0 0
Total $31,235,167 $18,284,450 59 Rhode Island Mlxed FY83 $358,983 $358,983 100
TY84 --~%6~15--316,615 100 - _- --. --_--. --- ------ PY84 669,235 669,235 100 -~ .-- _--_.-_- _.-.. . PY85 545,213 502,664 92
T&al - . . _ _---.-.----_------ ---.~~_ .--_--
$1,889,446 $1,846,897 98 South Carolina Formula FY83 $1,235,137 $1,235,137 100 -- .-~
TY 84 1,053,909 1,053,909 100 . --___ _~ _-- ..~- PY84 2,315,906 2,315,906 100 PY 85-~,94~8~--i,o19,013 52
- - Total $6,551,032 $5,623,965 86
South Dakota Formula FY83 $97,907 $97,907 100 -.-~ ----.-- ~. ..-.._ ~~. TY84 86,192 86,192 100 -. PY84 206,188 206,188 100
PY85 161,262 158,000 98 ---.-- - Total $551,549 $548,287 99
Tennessee RFP FY83 $1,944,136 $1,708,045 88 . -- ---..-..-~~-.--. TY84 1,672,508 1,672,508 100 -~.- --.-- _ PY84 3,805,859 2,305,131 61
---- PY85 3,934,745 0 0 - --
___---- --.--. ~~ -m57,248 $5,685,684
.- .~ ~ Total 50
*
Page 77 GAO/HRD-8741 Dislocated Workers

- ---~- Appendix II Alhcatlons and Expenditures of JTPA Title III Formula Funds by State and Year
_--. ------ Amount Reported Percent
State Approach Yeap allocated expenditures expended ..-._ ~ ----~-- Texas RFP FY83 $2,692,408 $2,692,408 100 __ -- .__. -- -_------
TY 84 2,387,670 2,387,670 100
---- PY84 6,719,377 6,719,377 100 --___-- PY85 7,474,223 2,077,174 28 --- --.
Total $19,273,676 $13,676,629 72
Utah RFP FY83 $339,726 $339,726 100 -- -~- - ------ TY84 288,3g7-- -2887397 ioo _~- - _-----_---_ --.- -__..-.--
PY 84 758,998 758,998 100 -- PY85 803,640 237,592 30 ___-- -- ___-
Total $2,190,761 $1,624,713 74
Vermont RFP FY83 $113,376 $113,376 100 --- -_____- - ----_-- TY84 96,670 96,670 100 PY84 225,398 225,398 100 ~- _.- ---- PY85 231,705 197,226 85 _. .- - ___. _ ._ _ -------
Total $667,149 $632,670 95
Vlrginla Mixed FY83 $1,334,750 $1,334,750 100 ___ -._ ___ __--- --_ _______-_- TY84 1,165,695 1,165,695 100 --~-- - -~--__-. PY84 2,395,540 2,395,540 100 _______________.~____ --. _- - . PY85 1,616,507 1,094,615 68 __-_________ --_____-
~ -- Total $6,512,492 $5,990,600 92 Washmgton Mixed FY83 $1,985,012 $1,985,012 100 - ----.-~--_ --- ---.-
TY84 1,721,641 1,721,641 100 ~-_____-~- PY84 3,828,532 --3,828,532 100 ------ ______ --__ ___---~-____-- PY85 4,019,601 2,132,225 53 --~ _-- - ~_--. -
Total $11,554,766 $9,667,410 64
West Vlrglnia RFP
~ ._ _.- -----
.- ~.- -- - --_ - -~~-- -- Total
FY83 $955,813 $955,813 100 --. TY84 826,295 826,295 100
PY84 2,24l,181----p 1,421,801 63 _____-- PY85 2,770,400 0 b _- ------.- -- ~- ..- -0
$6,793,669 $3,203,909 47
Wisconsin
Total
RFP FY83 $2,125,542 $2,125,542 100 ----
--- _-__ TY84 1,844,966 1,844,966 100
PY84 4,260,996 4,260,996 100 ---. -~ -_ PY85 3,883,145 1,184,038 30 ~~ ~- -____ ___ -
$12,114,649 $9,415,542 76
Page 78 GAO/HRD8741 Dislocated Workers
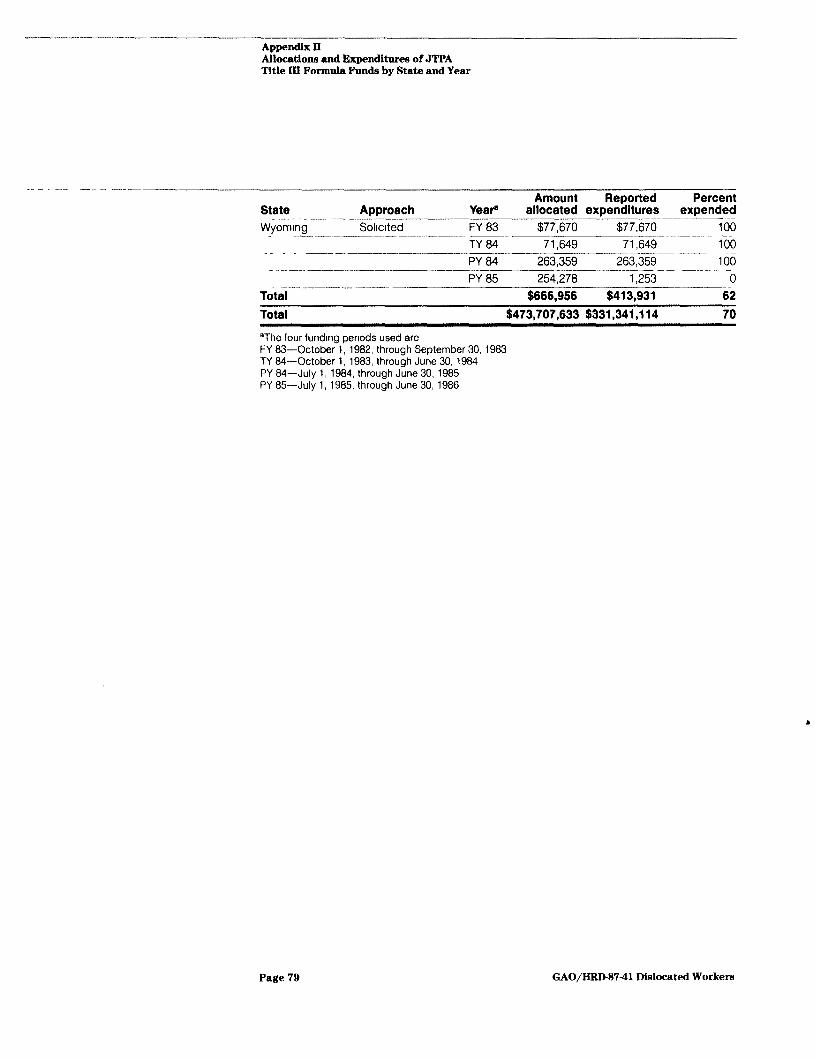
Appendix Il Allocations and Expenditures of JTPA Title III Fomula Funds by State and Year
__ ~_ _ _-- -_ - --_-_--- Amount Reported Percent
State Approach YeaP allocated expenditures expended --__--- Wyoming SokIted FY 83 $77,670
___---_____ -- $77,670 100 - ..- ____ _-.~--- __- ..-_ ------.
TY 84 71,649 71,649 100
- ~~ PY 84 263,359 263,359 100
PY 85 254,278 1,253 0 - --- __--- __ .--- -__ ----~--_____ Total $666,956 $413,931 62
Total $473,707,633 $331,341,114 70
‘The four fundlng pcnods used are FY 8%October 1, 1982, through September 30, 1983 TY 84-October I, 1983, through June 30, 1984 PY 84-July 1, 1984, through June 30, 1985 PY 85-July 1, 1985, through June 30, 1986
Page 79 GAO/HRD-8741 Dislocated Workers

AgEndlx III ___-_ ----__ - ----~--
Tables Containing Data Supporting Bar Grkphs 4 in Report Text
Table 111.1: Respondent Impressions of Burden to Obtatn and Document Matching Resources (Data for Fig 2 4)
Percent of Extent Projects -_______---_____ - -_---- -. ---.-- -~ Little or none 13
Some -- -- 25 ~---~-- - Moderate 35 -------- Great 18
Very great 9
___ _-__---__ Table 111.2: Participant Charactenstics iData for Fig 3 2, Between 22 44 Years Old) Age
21 and under
- - 22-44 45-54
55and over
Percent of Participants
4
69 19
8
- _--I -- --_--- Table 111.3: Older Worker Representatron In Title Ill Projects (Data Percent of for Fig 3 3) Percent served projects ---- ~__- ~-.- _~~~ -- _~
None 24
-- 1-8 44 _---- --- 9 to 20 24
-- ~~- .-.~~ - -__
Over 20 8
-..--- ---_-_---.- Table Ill 4: Less Educated Worker Representation in Title III Projects (Data Percent of for Fig 3 4) Percent served projects
None - --_- ~--- ---- -
11 __.-- ~~- ~~- - -~ 1-22 56
- .__-_~- -.---._. .._- ~~ ~.
23-32 15
Ovet 32 -. -. ~-_____-
18 I
Table 111.5: Remedial Traming Participation Levels in Title Ill Projects Percent of (Data for Fig 4 1) Percent of participants receiving training projects --
None 68 it010 ~- -- 17 __-- ___-- ____..- ___-- .---. ~~ --- - --. - -~ ~. 11 to 25 7
-- 26 to80 5 - Over 80 -3
Page 80 GAO/HRD-87-41 Dislocated Workrm

- Appendix III Tables Containing Data Supporting Bar Graphs in Report Text
Table Ill.& Clebsroom Training Participation Levels m Title III Projects Percent of (Data for Fig 4 2) Percent of participants receiving classroom traming projects
None 22
I to10 .~ _.-- -.-- _-.-____. ------ _ ..-. ~- -~ -~
11
11 to 25
2Bto 80
Over $0
-_ _ __.___--------_--_---.~__----.~---. - _ 16 22
29
“--- .__ --_ Table 111.7: OJT Participation Levels in Title Ill Projects (Data for Fig 4 :)
Percent of participants receiving OJT None
.~- -_-- _-- Percent of
projects 33
1 to10 18 11 to 25 17
~- 26 to 80 16 ___---. - Over 80 16
---_-- ~-- --~ Table 111.8: Job Placement Assistance Participation Levels m Title III Projects Percent of participants receiving Percent of projects (Data for Fig 4 4) job placement assistance Job counseling Job search
None _ .~_. _.---._- ~-~ ~- ~-~ --. -~ ~~
12 16
1 to10 i 3
11 to 25 3 4
26 to 80 10 -23
Over 80 74 -54
__I _ I __.I_ - --. - _-- ~_ Table 111.9: Support Services Participation Levels in Title Ill Projects Percent of (Data far Fig 4 5) Percent of participants receiving support services projects __ _._. ~- _~- -~~ ~. ~~
None 42
1 to10 12
1 I to 25 7
26 to 80 16
Over 80 23
L
_ -_ -_ --_ _ --- ----- Table 111.10: Placement Rates for Title III Projects (Data for Fig 5 1) Percent of
Placement rate projects 40% or less 14
41% to 69% 28
70% to 80% 24
Over 80 34
Page HI GAO/HRD-8741 Dislocated Workern

Appendix Ill Tables Chtaining Data Supporting Bar Graphs in Report Text
Table Ill.1 1: Wage Levels for Title II9 Projects (Data for Fig 5 2) Percent of
Wage levels project5 --- ____ --.~ $5 00 or less 28
$5-01 to $6 61 __.- _ __~_. --._.
40
$6 62 to $7 00 -__--
7
$7 dl to $8 00 ~~- ~--.-_
11 -__ ---- -~~- Over $8 00 14
Table 111.12: Percent of Parhcipants Plnding Jobs In Different Occupations (Data for Fly 5 5)
-- _---_- _- _ - ----- -- Table 111.13: Percent of Participants Finding Jobs In Different Industries (Data for Fig 5 6)
-:---- --- Table 111.14: Occupations in Which Title I99 Participants Found Jobs (Data for Fig 57) I
Percent of participant5 25 or less
26 to 50
51 to73 74 to 90
Over 90
--
--____
Percent of project5
10
13
16 22
-39
Percent of Percent of participant5 project5 ~~ .-___ --__ 25 or less 22 - --.-- - -___ _-~--.--_ 26 to 61 22
62 to 80 19
81 to90 13 --__---~- Over 90 24
Percent of Occupation participants __ --. Sales worker 5 ~-.--~- __ __- _---~ --..- Manager, professional
Unskled-labor ____--- -6 *
8
Technical (paraprofessional technician) 8 ~-- __.-- Service worker 12
Clerlcal or office worker -13
SkIlled craftsman, foreman, tradesman -15 - __-. .__---__- Sem&llled eo&ment/machlne ooerator
-__--- ___-_. __--.__ 33
Page H2 GAO/HR@8741 Dislocated Workers

IV Appmdjx
Characteristics of Title III Participants Identified by GAO and JTLB
Percent of participant5 JTLS data
Characteristics
f+ -- -.-__. - .-. ~~ --.. GAO datab
July 1994- March 1985
21 and under 4 -6
22-z- - -_---. --- ---.- __ .-.-_. - - -
69 73 ._.. --. -45-54
_-. _. .-- .~-.._~...-._-----..---___--------__--- -~ ~~ 19 15
-55 and bvir 8 6 _ .._. -~~~ ~- . . ~-. _-- -.-- ____-- ---~ 100 100
Education level
L&s than high school ~____~
22 20
High school graduate 55 52 - -.. -. _ -. - ~~~ Educatlon/trammg beyond high school 23 28
100 100 Gender --
--
Male
Female
Race -~
-wkite
Black -
t&pa&
Other .- --- ___ .--~
60 62 - ---- 40 38 _____-- _- ____-._ -- ---- --- --~--
100 100 ---- _-_.-_- -----
69 70 --- 21 22 ~~___ - __----.__ .
7 6 __--- 3 2 ___--
100 100
aDepartment of Labor, Job Tralnlng Longltudlnal Survey
‘GAO data based on the most recent 9 months of project actwty from the start of JTPA through March 31, 1985
Page 83 GAO/HRD-87-41 Dislocated Workers

Appendix V ___- -- ,I”-- Title III Projects in GAO Analysis Operating ’ Between October 1982 and March 1985
- ____---- -. --_ --- .-. -- -- Number of
State projects Alabama ^- 12
Alaska 2 .--- _.. _---------__- ____- Arizona 4
Arkansas 4 _. --... - ~. .-.-._- -~- -.-.~--- - - California 67
Ciiorado 11
Connecticut 2
Delaware 1
Floflda 14 - _.-~----- -~~ Georgia 10
Hawaii 3
l&ho -___-- --. --
7
Illinois 22
In&& -.-~ -. - --
11
Iowa 21 - - _-----. Kansas 6 _..~ -- -_ -. --~ - -. Kentucky 11 ---- .-. Louisiana 7
iiini 7
Maryland -- .-. _-. -- -----.__---__ ---. -~_ -~~.-- -- ~-~
11
Massachusetts 12 .____- .--- ~~ Mlchlgan 18
Minnesota 19 .-- ----- ..-_____- MISSISSIPPI 9 Missouri 6 -~~ __- ___- Montana 5 _ -- - _I_-. ~~~~~ Nebraska 5
<eCada -.___ ----. .
1 -- New Hampshire 1
.
New Jersey 19 ____ -.--. ~---- -- -~. --~~~ New Mexico -1 --.-- --- --_ - --~~___- ___-_ -.- New York 76 --..____- -- North Carolina 1 --__-- ____ ~-__ .~~ North Dakota 1
Ohio 43 ~~--__ Oklahoma 4 - _.-_.--- -.-__ Oregon
___-__ 8 _- -_- _- -- ---_ ___- _________~... - --~-- .- _ ~
PennsylvanIa 30 -- -------. Rhode Island 2 -___--
Page 84 GAO/HRD-8741 Dislocated Workers

-- Appendix V ‘Ntle III Projects in GAO Analysis Operating Between October 1982 and March 1985
- . --*--- Number of
State projects .~--- -----_ .-_- -_. - ----- ______- -__. South Carolma 1 __--_ -___------- ---_--.____ South Dakota 1 ----_ ~ -__---- -_- . --____ --. -._--. -~ . Tennessee 8 ~____ -____. Texas 17 __-. _- -__-__---.---_.-.------- __--__. ----.__--- Utah 8 - ~-. .- Vermont 1 -- ..--.----. ..~ - -.___ -___ Vlrglnia 3
i&shlngton ------- -- ---
5 -.- Wist Virginia
--------_-__-----__-- ___-- __--.--- - .-- .- .-~ 7 ____ _ _
WGonsln .-__ - - ---__--_----
16 - ____ -__~-_- ._- I_____-_----__-------~ Wyoming 2 Total 563
Page 86 GAO/HRD-8741 Dislocated Workerx

Comments From the Department of Labor
I I
U.S. Departmenf of Labor
Mr. Richard L. Fogel Assistant Comptroller General Human Resources Division U.S. General Accounting Office Washington, D.C. 20548
Dear Mr. Fogel:
In reply to your letter to Secretary Brock requesting comments on the draft GAO report entitled "Dislocated Workers: Approaches and Outcomes of Job Training Partnership Act Projects," the Department's response is enclosed.
The Department appreciates the opportunity to comment on this report.
/ Sincerely, ,p
>'
4 /‘- nclosure
Page 86 GAO/HRD8741 Dislocated Workers

- -__--- - --- --_-_ Appendix M Comments I+om the Department of Labor
Recommendation:
Response:
U.S. Department of Labor's Response to The Draft General Accounting Office Report Entitled --
Dislocated Workers: Approaches and Outcomes of Job Training Partnership Act Pro]ects
We recommend that the Secretary of Labor provide technical assistance to States that are slow in their expenditure of Title III funds. The technical assistance should focus on ways to speed up the "request for proposal" funding mechanism.
The Department concurs.
It should be noted that the Department's relationship with the States has changed from that under previous training and employment programs. The Job Training Partnership Act (JTPA) establishes a decentralized system, with the Governors having a much greater role in setting policy and administering programs while the Department provides broad programmatic leadership. Within this framework, the Depart- ment itself, and through interest groups such as the National Governors' Association (NGA) and the National Alliance of Business, 1s available to provide needed technical assistance to the States as requested. While the Department con- curs with the thrust of the recommendation--that the rate of expenditure of Title III funds should be increased--the Department does not believe that technical assistance to States to speed up the "request for proposal" funding mechanism is necessarily the preferred course of action.
Congressional appropriations set a reduced funding level of $95 million for Title III ln Program Year 1986. This was a proper interim measure, which the Department anticipates will have the effect of reducing or eliminating the excess carryout of Title III funds from prior program years.
The Department also believes that a mayor source of the problem in expenditure of Title III funds is the formula distribution of funds to States experiencing little or no worker dislocation. This problem could be corrected by providing the Secretary with greater discretionary authority
*
Page 87 GAO/HRlM7-41 Diilocated Workers
_ .-_--- _-- -- -- Appendix VI Comments From the Department of Labor
v1 *
- -. - --..---- -
- 2 -
to award Title III funds, as requested in the Administration's Fiscal Year 1987 budget proposal. This would permit the Secretary to quickly award funds to areas with the greatest need.
Notwithstanding the above, the Department is taking other steps which should result in more rapid and effective delivery of Title III services and in an improved Title III expenditure rate. The Department's Employment and Training Administration is in the process of developing a proactive approach to managing job training programs, including those under Title III. A feature of this activity will be the conduct of in-depth management reviews of State program administration, which will lead to technical assistance where indicated. This activity will be implemented beginning in the summer of 1987.
The Department, in cooperation with NGA and selected States, is conducting a demonstration project to test the adaptability of the Canadian Industrial Adjustment Service approach to serving dislocated workers. This program of government partnership with labor and management features early intervention in the event of a plant closing or layoff. Thirty-five States were introduced to the Canadian program in the spring of 1986 through a series of conferences jointly sponsored by the Department and NGA. The Department plans to share the results of this demonstration pro]ect with interested States.
Recommendation: We recommend that the Secretary of Labor work with State and local officials to identify the reasons for the lower representation of older and less- educated dislocated workers in the JTPA Title III * program, and then develop strategies to obtain greater program participation by these workers.
Response: - The Department concurs.
The Department agrees that lower representation I of older and less educated dislocated workers is a concern in Title III programming. The Department would contend, however, that the
Page 88 GAO/HRD87-41 Dislocated Workers

Appendix VI Comments From the Department of Labor
-3-
major reasons for lower representation of older and less well-educated dislocated workers in Title III programs are known. The report by the General Accounting Office has surfaced some of the reasons. To those surfaced by the GAO, the Department would add for older workers retirement and a desire to obtain part- time or intermittent employment, as evidenced by experience with the JTPA Section 124 "three percent" older worker program, and, for both groups, timing or the ability of a project to get underway before or soon after a layoff or closing.
The Department's position is that, by and large, the States are conducting sufficient outreach to contact older and less-educated dislocated workers, but that the payoff has been poor, in large measure, because of individual reluctance to participate for the reasons stated above.
Nevertheless, the Department will continue to bring its concern about services to older workers to the attention of the system, and to urge program operators to continue to make every effort to provide maximum services to this group. We will also discuss this issue with the JTPA Roundtable and determine if there are approaches being used successfully which may be transmitted throughout the system.
The Department is actively involved in two efforts with the National Association of Broadcasters to overcome individual reluctance to participate in training programs. The first, Project Literacy U.S. (PLUS) is a broad-based effort to increase awareness of the literacy problem, encourage individual action, and foster community efforts to address literacy problems. The second, the “Work Resource and Retraining Initiative," 1s focussed more narrowly on dislocated workers or workers for whom dislocation is likely. This demonstration project will seek to develop media approaches which will encourage workers to seek training assistance. It, too, will seek to better develop community capability to respond to dislocated workers' training needs. The results of these latter projects will be shared with the States.
Page 89 GAO/HRD-8741 Dislocated Workelw

Appendlr VI Chnmenta From the Department of Labor
-*-
w
Comments: -- The Administration's Fiscal Year 1988 Budget proposes to replace the existing JTPA Title III and Trade Adlustment Assistance programs with a more comprehensive program of adjustment assistance for dislocated workers. The new program will feature early adjustment assistance and other features which should result in both timely expenditure of program funds and improved delivery of services to all dislocated workers.
Page 90 GAO/HRD-8741 Dmlocated Workers

------P
Bibliography - -
The Urban Institute, The Role of Public Programs and Private Markets in Reemploying-Workers Dislocated by Economic Change, November 1982.
U.S. Congress, Congressional Budget Office, Dislocated Workers Issues and Federal Options, July 1982.
U.S. Congress, Congressional Budget Office, Economic Growth and Changis Labor Markets Those Left Behind, December 1983.
U.S. Congress, Office of Technology Assessment, Plant Closing: Advance Notice and Rapid Response, September 1986.
U S. Congress, Office of Technology Assessment, Technology and Struc- tural Unempbment Reempbing Displaced Adults, February 1986.
US. General Accounting Office, Job Training Partnership Act: Initial Implementation of Program for Disadvantaged Youth and Adults, GAO/ ~~~-85-4, March 4, 1985.
IJ.S General Accounting Office, Dislocated Workers: Extent of Business Closures, Layoffs, and the Public and Private Response, GAO/IIRD-86- 116BR, July 1986.
Westat, Inc., State Level Implementation of the Job Training Partnership &, May 1984.
Westat, Inc., The Organization of Title III of the Job Trauung Partner- ship Act m Fifty States.
(2ORO416) Page !J 1 GAO/HRD87-41 Dislocated Workers


Requests for copies of GAO reports should be sent to:
U.S. General Accounting Office Post Office Box 60 16 Gaithersburg, Maryland 20877
Telephone 202-276-6241
The first five copies of each report are free. Additional copies are $2.00 each.
There is a 26% discount on orders for 100 or more copies mailed to a single address.
Orders must be prepaid by cash or by check or money order made out to the Superintendent of Documents.

Upited states General Accounting Office N$shington, D.C. 20648
O&cial Business P+nalty for Private Use $300
A@ress Correction Requested