Embed Size (px)
Citation preview

Instrument Science Report ACS 2001-11
HRC AND WFC FLATFIELDS: STANDARD
FILTERS, POLARIZERS,AND CORONOGRAPH
R. C. Bohlin, G. Hartig, and Andre MartelDecember 2001
ABSTRACT
Laboratory flats with simulated sky illumination of the CCD cameras have been obtainedfor supported and many unsupported ACS modes. The ACS HRC flight detector shows atypical sensitivity variation from center to edge of ~10%, while the large format WFCminimum/maximum sensitivity variation is ~15%. The CEI specification of +-10% unifor-mity is met for WFC and HRC. The intrinsic rms variation of sensitivity in the pixel-to-pixel P-flat is 0.5-0.9%, so that observed flats with ~100,000 electrons/px and an rms of~0.3% are required to improve the intrinsic S/N that is possible without a P-flat field refer-ence file These high S/N flats are the P-flats combined with the low frequency L-flat sensi-tivity variation over the field. The 142 measured LP-flats include 13 and 17 single filterflats for WFC and HRC, respectively, 78 polarizer mode flats, and 34 flats of all types forthe HRC coronographic mode. In addition, estimates are made for 15 supported modesthat were not measured directly. All 157 flats are now available as reference files for thepipeline processing of ACS observations from Cycle 11.
1. INTRODUCTION
Longward of its ~3500Å optical cutoff, the Refractive Aberrated Simulator/Hubble Opto-Mechanical Simulator (RAS/HOMS) with a continuum light source was used in 2001February-March to produce flat fields which include both the low frequency L-flat and thehigh frequency pixel-to-pixel P-flat structure (Martel & Hartig 2001). These LP-flats

Instrument Science Report ACS 2001-11
should be appropriate for reduction of on-orbit data with the flight B1 HRC and B4 WFCCCD detectors. The individual data frames are tabulated in Tables 1-5. The HRC flat fieldobservations with standard, non-polarizing filters in Table 1 include the pre-flight databaseentry number of the first image of a set, the observation date, the exposure time in seconds,the number of images in the set, the filter wheel 1 and 2 positions, the CCD temperature,and the intrinsic 1σ rms pixel-to-pixel variation in sensitivity in a selected region of theHRC CCD. The laboratory calibration images are stored on the STScI SNAP5 disk withsearch and retrieval functionality provided by the ACS Instrument Definition Team (IDT)software written in the IDL language. Table 2 contains the same information as Table 1,but for the WFC. In addition, Table 2 specifies the filter wheel offset positions, the x-axissize in pixels, and the CCD amplifier configuration, which determine the location of thesubarray within the 4096x4096 px detector. Subarray flats for the smaller filters are indi-cated by AXIS1=2048. The HRC flats for the polarizer modes are in Table 3, which hasthe same columns as Table 1, except that the rms variation is omitted. Table 4 has the sameinformation as Table 2, but for the WFC polarizers. Similarly, Table 5 lists the corono-graphic flat field observations. Since the intrinsic rms variation is a property of the CCD,the rms values for the polarizing and coronographic modes are similar to those tabulated inTables 1-2.
The LP-flats are produced by combining the set of images for each filter mode with acosmic ray rejection algorithm (acs_cr.pro). The physical overscan regions define the biaslevel. To normalize to unity, the flats are divided by the average number of counts in thecentral 1% of the combined frame. The acs_cr routine also produces the statistical uncer-tainty and data quality arrays for each flat. In the case of full WFC frames, the chip 2images are divided by the chip 1 central value, in order to preserve the overall sensitivitydifference between the two CCD chips across the ~40 pixel gap that separates the twoindependent pieces of the WFC detector. For display of the Figures in this presentationonly, the two pieces of the WFC LP-flats are separately renormalized to the averages ofstrips along the adjacent edges of chips 1 and 2. Because of variation in the illuminatinglamp with time, a special keyword (norm) in acs_cr.pro normalizes the succeeding imagesto the first one of a set by computing an effective exposure time. Without this renormaliza-tion, the typical lamp variation of ~3% causes most pixels in our high S/N flats to have atleast one rejection. A single pass with a 5σ rejection and no sky adjustment in acs_cr.prois used to combine the separate frames. In the case of the 2048x2046 pixel subimages thatare used for the small filters that cover just part of one quadrant of the WFC, an extra linewith unit value is added at the top and bottom of these flats to pad to a standard 2048x2048size. These flats for the small filters are masked to unity below 90% of the central value ofthe data, so that no flat field correction is done on the scattered light outside the physicaledge of the filter. The other two IDL routines used to derive the flats are a driver, lpall.pro,and a subroutine, flatlp.pro, which calls acs_cr and does the normalization to unity, thepadding, the masking, and the header creation. Figures 1-3 are examples of flats for the
2

Instrument Science Report ACS 2001-11
HRC, a WFC subarray, and the full field WFC, respectively. The low order structure of theflats over the field of view (L-flat) is mostly due to the variations in the sensitivity of theCCD detector assembly; but variations in the filter transmissions also contribute, becausethe filters are close to the CCD focal plane.
A translucent mylar diffuser screen at the pupil plane of the RAS/HOMS produces thesame flat field as the sky through the OTA+ACS. See Sparks, et al.(2000) for a descriptionof the role of SKY-flats in the pipeline data reduction. The pipeline data reduction willproduce geometrically corrected images; but our LP-flats are observed sky-flats with nogeometric correction. A direct application of a sky flat would make objects with uniformsurface brightness show a uniform response per pixel. However, a star's total responsewould vary over the field in proportion to the change in the product of the x and y platescales, i.e. in proportion to the geometric correction factor G of Bohlin et al. 1999, Bohlinet al. 2000, & Sparks, et al.(2000) as archived in the Image Distortion Correction (IDC)file.
2. WAVELENGTH DEPENDENCE
2.1 White Light
Both the low frequency (L-flat) and pixel-to-pixel (P-flat) structure of the flats changewith wavelength. This dependence of the flat field structure on the spectral distribution ofthe source may be the limiting factor in the analysis of GO science data with high S/N.
2.1.1 Cosmetic Artifacts
2.1.1.1 The Blob
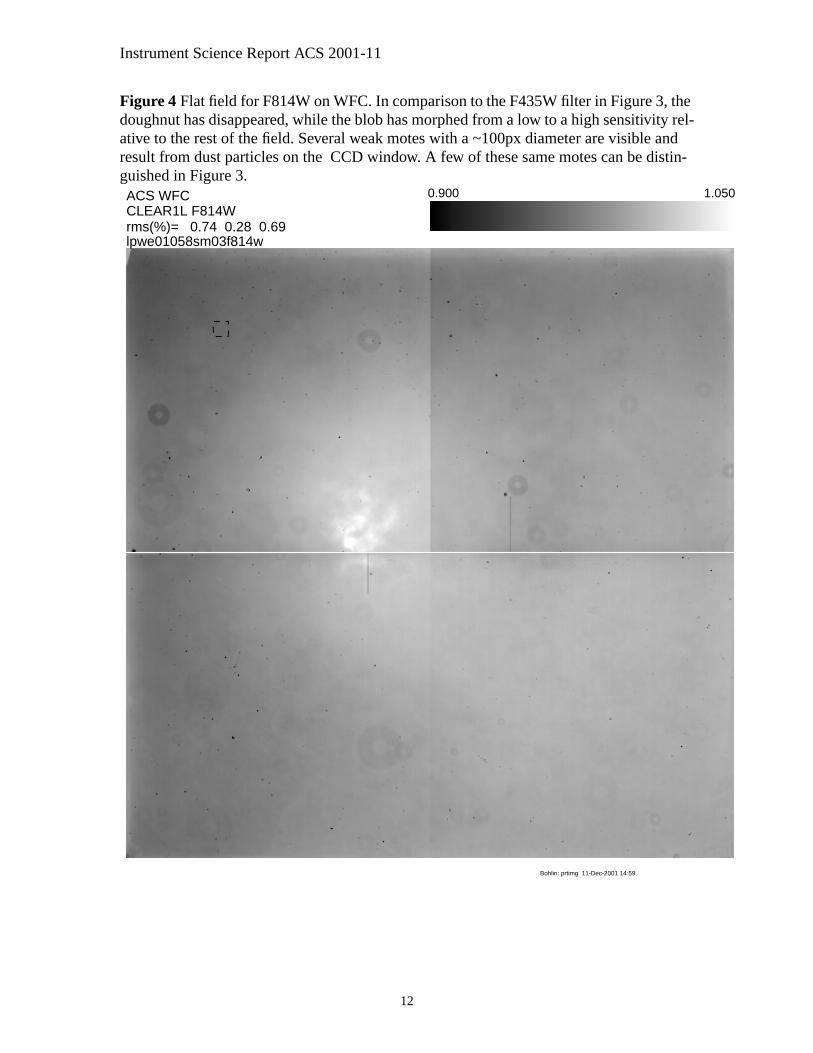
Figure 4 is the white light flat for the F814W filter and shows a more uniform responsethan the F435W flat in Figure 3. The prominent extended doughnut of enhanced sensitiv-ity at F435W has disappeared in F814W, while the blob at the lower left central part ofchip 1 changes from a ~10% deficiency to an enhanced response of ~5%. Even for theadjacent filters, F435W and F475W, the ratio in the region of the blob still shows a relativeenhancement of almost 10% in parts of the white region that are off-scale in the1024x1024 WFC subsection in Figure 5. For HRC, the F475W/F435W ratio changessmoothly by <2%, over the full field of view.
2.1.1.2 The Dust Motes
Several circular patterns of a dark ring with a central brightening are visible on Figures1-4 with typical diameters of ~30px on HRC and ~100px on WFC. These artifacts areshadows of dust on the CCD windows and are weaker on the f/25 WFC than at f/68 forHRC. Several of these dust motes can be seen at the same positions on Figures 3 and 4.
3

Instrument Science Report ACS 2001-11
Since the shapes and depths of these motes are almost independent of wavelength, theireffects will be removed by the flats to <<1%, unless any of these particulate contaminantsmove to different positions on the CCD windows.
2.1.1.3 The Freckles
The small black spots (freckles) with a size of a few pixels can be seen on Figures 1-4;and a few have depths of more than 50%. The depth of the freckles decreases with increas-ing wavelength. However, the ratio of the adjacent wavelength HRC flats F475W/F435Whas only 51 pixels that are more than 1.05. The worst HRC freckle includes pixels 486,608and 488,607 near the image center and might create a false signal in a source with aslightly different spectral distribution than the tungsten lamp used for the white light labo-ratory flats. On the WFC, freckles are even less of a problem over most of the CCD area,as illustrated by the sparsity of small white dots on Figure 5.
The data quality flag 'dq' in third extent of the flat field reference files. is set to 175 forpixel values in the flats of <0.1 or >2.0. Low sensitivity pixels also have an anomalousvalue in the uncertainty image 'err' in the second extent of the reference files.
2.1.2 P-Flat: Pixel-to-Pixel Fine Structure
A relatively blemish free region at (590:690,434:534) on the HRC, at(590:690,1458:1558) on chip 1 of the full frame WFC, or at the same pixel range on thesubarray flats of the WFC is used to study the pixel-to-pixel fine structure of the flats. Therms scatter is calculated in these regions, corrected for the small effect of the counting sta-tistics, and tabulated in the final columns of Tables 1-2 as the intrinsic pixel-to-pixel rmsstructure of the detectors. In order to avoid any significant loss of S/N when applying flatsto science data, the Poisson counting statistics of the flats are in the 0.2 to 0.3% range, i.e.at least 110,000 electrons per pixel. Table 1 shows that the intrinsic rms structure is assmall as 0.5% in the longer wavelength filters on HRC. This intrinsic fine structure isalways <1%; and generally decreases with wavelength, except for the fringing pattern inF892N and except for the longest wavelength F850LP filter on HRC.
In white light, fringing in standard filters is observed only for F892N (see Figure 2).For all astrophysical sources where the continuum flux dominates the line emission withinthe narrow 150Å bandpass of F892N, the typical fringe amplitude is <1% and should beremoved to a small fraction of a percent, because the fringe pattern is stable in monochro-matic images. (See 2.2.1.2 below for a measurement of monochromatic fringe stability.)
Small differences in the effective wavelength of the source spectrum cause only smallresidual noise in flat fielded data. For example, in the standard regions of HRC and WFCthe residuals for F475W/F435W are only 0.12% and 0.15%, respectively, after correctingfor the expected scatter due to counting statistics of 0.32 and 0.37%, respectively.
4

Instrument Science Report ACS 2001-11
2.2 Monochromatic Light
Several monochromatic flats were obtained to compare with the broad band white lightflats that are used in the pipeline ACS data processing.
2.2.1 P-Flat
2.2.1.1 Wavelengths below 6400Å
Table 6 quantifies the rms errors accrued by a monochromatic source after dividing bythe white-light pipeline-reference flat for a selection of the standard broadband filters onWFC. The standard 101x101 pixel regions defined in 2.1.2 are used to compute the Pois-son counting statistics, the actual one σ rms scatter, the intrinsic rms variation (SigmaFlat), and the minimum and maximum value of the flat. The Poisson scatter is removedfrom the 'Actual sigma' to calculate the 'Sigma Flat', which is the intrinsic rms variation ofthe flat itself. The RATIO section of the Table shows the result of correcting the numeratorflat by the denominator flat, where the Poisson statistics are the numerator and denomina-tor Poisson statistics combined in quadrature. The 'Actual sigma' entries are the standarddeviations within the ratio sub-images.
At the shortest monochromatic wavelength of 3880Å in Table 6, the residual of 0.63%is the poorest, because the pixel-to-pixel P-flat structure increases rapidly below ~4000Å.However, the impact is only for monochromatic sources below 4000Å when a S/N ~200per pixel is required. Monochromatic data for HRC in the range 4751-6300Å shows resid-uals similar to the WFC residuals in Table 6 for the same wavelength range. Except for theshortest wavelength of 3880Å, the intrinsic rms structure in the monochromatic flats is<0.9%. This intrinsic scatter is reduced to ~0.2% by application of the broadband flat thatincludes the monochromatic wavelength in its bandpass. Below 6400Å and probably up to7300 or 7400Å, the broadband P-flats obtained with the continuum lamp in the laboratoryare adequate for astronomical objects with any flux distribution.
2.2.1.2 Wavelengths above 7400Å
Fringing patterns with modulations up to ~20% for monochromatic light (see Figures10-11 of Bohlin, Hartig, and Tsvetanov 2000) prevent verification of the above generaliza-tion at longer wavelengths. However, the default external tungsten flats should beadequate, because the P-flats generally show weaker wavelength dependencies at thelonger wavelengths. In any case, fringing will probably limit the measurement precision ofsmall structure in monochromatic sources beyond ~7400Å. Any attempts to remove thefringing signature from images of monochromatic sources will be based on the results ofthe ESA-ECF effort to model and remove fringing effects in the ACS spectral modes. Sta-bility of the fringing pattern is good: At 9200Å, where the modulation is ~20% and theintrinsic rms scatter is 5-6%, the rms of the residual pattern is only ~0.5% when compar-ing fringe flats taken at CCDTEMP1 temperatures that differ by 2C. Further quantification
5

Instrument Science Report ACS 2001-11
of fringing residuals in monochromatic images must await completion of the ESA-ECFmodeling work.
2.2.2 L-Flats
The large scale error introduced by correcting the monochromatic flats of section 2.2.1by the white light flats with the same filter is often less than 1-2%. However, errorsexceeding 20% occur in the WFC blob region at 3880Å. At 4330Å, the blob error hasdropped to ~5%; but 4330Å is still the worst case of overall L-flat error, as illustrated inFigure 6. The L-flat ratio for monochromatic light at 4300Å is 0.95 in the top left corner,and 1.11 in the bottom right corner. In addition, errors exceeding 5% occur at the bottomright for 3880Å, in the blob for 4551Å, at the bottom right for 4770Å, and at the top leftfor 6141 and 6320Å. The HRC monochromatic L-flats divided by the white light flats arewithin ~1% of unity for the seven wavelengths measured between 4751 and 6300Å.
In the IR at 9000Å with the F814W filter, Figure 7 illustrates a ~4% enhancement inthe L-flat at the center of the doughnut and a ~4% drop in the doughnut ring region. Also,illustrated in Figure 7 is the intricate fringe pattern for 9000Å monochromatic light wherethe typical fringe amplitude is +-7%.
In summary, an observer should be wary of errors >2% for the WFC in the blob region,in the doughnut ring in the IR, and at the extremes of the field for all wavelengths. Theamount of possible error depends on the amount of deviation of source spectrum from thatof the smooth continuum of the tungsten filament lamp used in the laboratory flat field cal-ibration program.
3. SHORT WAVELENGTH HRC FLATS WITH THE RAS/CAL
Because the RAS/HOMS optics are opaque below 3500Å, the RAS/CAL system isused with a UV-bright deuterium lamp shining on a piece of reflective diffusing Spec-tralon, which is placed in front of a mirror in RAS/CAL to simulate OTA sky illuminationfor the HRC UV flats. For the one filter in common, F435W, the L-flat from RAS/CALdrops below the RAS/HOMS L-flat by up to ~10% in the upper right hand corner, whilethe deuterium flats are brighter than the RAS/HOMS baseline by ~10% in a region at thelower right side of the field. Thus, 10-20% of the area of the deuterium flats are apparentlyin error by >5%. A RAS/CAL flat with the same setup, except for a tungsten lamp like theone used in RAS/HOMS, shows a similar drop at the upper right but no bright patch. Thedeuterium RAS/CAL flats probably suffer from a specular reflection that causes a spuriousbright patch and from a mis-alignment that causes lower illumination at the upper right.
If the L-flat illumination error for the deuterium lamp is independent of wavelengthdown to the shortest wavelength F220W filter, then these flats can be corrected by the deu-terium illumination error as measured by the ratio D/T of the deuterium F435W flatdivided by the tungsten baseline F435W flat. The pixel-to-pixel intrinsic structure is the
6

Instrument Science Report ACS 2001-11
same for both lamps in F435W. The only fine structure in D/T at F435W is in the dustmotes, where the deuterium illumination causes a typical 1-2% and maximum of 6% errorin a few pixels around the dust motes. Since the dust motes exhibit diffraction rings, D/Tshould show some wavelength dependence in the regions of the dust motes. To estimatethe error in correcting the shortest wavelength F220W filter flat with D/T, the tungstenbaseline flats over a similar factor of two in wavelength from F435W to F814W are com-pared. The two worst motes from dust on the HRC window are at (20,910) and (280,210).There are several pixels within ~10 pixels of these two positions that differ by up to +-3%at the first diffraction ring in the F814W/F435W ratio.
Another complication to the D/T correction technique is that the deuterium F435W flathas a low S/N corresponding to only ~20,000 electrons or a rms Poisson noise of 0.7%,which is comparable to the intrinsic rms structure of 0.8% for the HRC UV flats. In orderto improve the statistics of the D/T correction, both the numerator and denominatorF435W flats are smoothed via a 3x3 pixel box. Since the Poisson statistics of the F220W,F250W, and F330W observations are ~0.35%, the 0.7/3=0.23% noise of the smoothed D/Tcorrection increases their Poisson noise to only ~0.4%. The ~0.9% statistical uncertaintyof the F344N flat is determined by its ~13,000 total counts, i.e. electrons. These four UVflats for HRC are generated by flatfix.pro.
In summary, the extra uncertainty in the P-flats for the four HRC UV filters is limitedto a few percent for a few pixels in the dust mote regions. Evidence that the UV L-flats arecorrect to <5% is provided by the fact that the observed L-flat structure in the originalRAS/CAL deuterium flats is the same to <5% from F220W to F435W.
There are a few supported modes for which no laboratory flat field measurement wasdone. The missing flats are for the three HRC UV filters, F220W, F250W, and F330W incombination with PolUV and with the coronograph. The UV flats with the corono-graph+PolUV are also missing but are not supported modes. Since the UV transmission asa function of position on the PolUV filters and on the coronograph mask is likely to varyand is unconstrained by measurement, a good estimate for the missing UV flats cannot bemade. These UV flats are crudely estimated by correcting the corrected UV flats of section3 by the ratio (PolUV+F435W)/F435W or by (CORON+F435W)/F435W. Although thePOLUV and CORON transmissions change little over the longer wavelength ranges, theUV transmission may change by larger amounts that cannot be estimated in the absense ofactual UV transmission measurements. Perhaps, the missing UV lab flats can be obtainedby observing the bright earth after launch.
4. HRC CORONOGRAPH
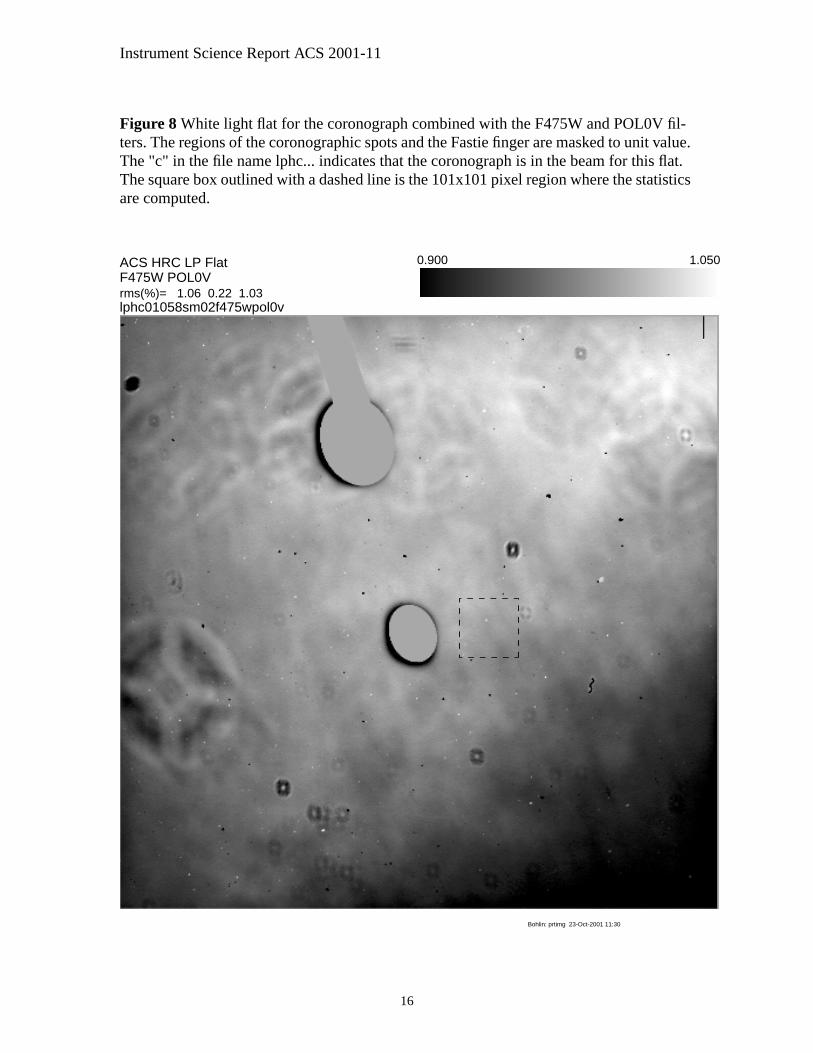
Because the coronographic mode has an apodizer mask that changes the instrumentalPSF, the blemishes have a different diffraction structure, as illustrated in Figures 8-9. TheF475W coronograhic flat with the POL0V filter from Figure 8 is divided by the same flatwithout the coronographic mask to produce Figure 9. Figure 9 shows that the dust mote
7

Instrument Science Report ACS 2001-11
8
and L-flat structure of a coronograph flat does not match the corresponding mode withoutthe coronographic mask because of the different PSF for the coronograph and because ofthe substrate transmission properties of the mask. The worst case differences in the smalldust motes are +-5% for the motes at (278,208) and (672,618). The large blemish on theleft side of Figure 8 with a deviation of +-3% in Figure 9 is the worst case of the bubblesin the optical cement that bonds the two pieces of the curved polarizing filters. However,outside of the bubble and dust mote regions, the coronograph does not change the P-flatstructure, as demonstrated by the reduction of the intrinsic rms structure from ~1% in Fig-ure 8 to 0.4% in Figure 9.
Observations were inadvertently omitted for the HRC coronographic flats for F606Win combination with the three PolV filters with polarization angles of 0, 60, and 120degrees. Since the transmission properties of the coronograph subtrate do not change rap-idly over the 5000-7000Å range, the coronographic contribution to the flats can beestimated by the ratios, R, for the three F555W+PolV filters with the coronograph dividedby the F555W+PolV flats without the coronograph. Substitutes for the missing corono-graphic flats are manufactured by multiplying the existing HRC F606W+PolV flats by theR image for each of the three corresponding polarization angles. To estimate the error forthese three missing flats, the F658N+PolV is corrected by R and compared with the flatsthat are actually measured with the coronograph. The error in the L-flat structure of thismanufactured flat is <1%; and the manufactured coron+F606W+PolV flats should also begood to <1%. The F625W filter could not be used in this process because of a dust particleon the F625W filter, which causes a prominent large feature in the ratios for(coron+F625W+PolV)/(F625W+PolV). Fortunately, the HRC regions for both the F606Wand the neighboring F555W are clean.
5. FUTURE ANALYSIS OF THE LABORATORY FLAT FIELDS
Subsequent publications will deal with the ramp filters and the dispersing modes. Theanomalous results and stability of the flat fields are also deferred to later discussions.
REFERENCES
Bohlin, R. C., Hartig, G., Lindler, D. J., Meurer, G., & Cox, C. 1999, InstrumentScience Report, ACS 99-01, (Baltimore:STScI)
Bohlin, R. C., Hartig, G., & Tsvetanov, Z. 2000, Instrument Science Report,ACS 00-10, (Baltimore:STScI)
Martel, A. & Hartig, G. 2001,http://acs.pha.jhu.edu/instrument/calibration/plans/ rashoms_feb2001/
Sparks, W. B., Jedrzejewski, R., Clampin, M., & Bohlin, R.C. 2000, InstrumentScience Report, ACS 00-03, (Baltimore:STScI)

Instrument Science Report ACS 2001-11
Figure 1 Flat field for F435W on HRC with a stretch from 0.90 to 1.05, as indicated onthe reference calibration bar at the top right. The HRC CCD is 1024x1024 pixels. TheFastie occulting finger is at the top and is masked to unit value on the flat. The numerous~30 px size dark rings with a central bright spot are caused by dust particles on the CCDwindow. The primary filter F435W is written at the top, followed by the secondary filter.The next line of text "rms(%)=" indicates one-σ values in the 101x101 standard region(square outlined by dashed line) for the total pixel-to-pixel scatter, the Poisson countingstatistic, and the intrinsic rms variation of the flat. The fourth line of text is the file nameindicating an LP-flat (lp), h for HRC, e for external illumination, 01057 for the date ofobservation: day 57 in 2001,sm02 for the sum of 2 images taken for cosmic ray rejection,and the filtername f435w.ACS HRC LP Flat F435W CLEAR1S
lphe01057sm02f435w
0.900 1.050
rms(%)= 0.85 0.22 0.82
Bohlin: prtimg 12-Nov-2001 15:10
9

Instrument Science Report ACS 2001-11
.050
Figure 2 Flat field in continuum light for the small F892N narrow band filter on WFC.This subarray is 2048x2048 px and is from Amp B for the right hand half of chip 1 of thetwo 4096x2048 CCD chips that are butted together in the WFC. The fringe pattern with~1% amplitude is caused by interference of light in semi-transparent layers of the CCDsubstrate.
ACS WFC LP Flat F892N CLEAR2L
lpwe01058sm03f892n chip=1
0.900 1
rms(%)= 0.81 0.30 0.75
Bohlin: prtimg 12-Nov-2001 16:19
10

Instrument Science Report ACS 2001-11
.050
Figure 3 Flat field for F435W on WFC. The prominent cosmetic features are a whitedoughnut of enhanced sensitivity with a black blob of reduced sensitivity near the centerof the doughnut. The doughnut and blob are coherent across the ~40 pixel crack that sep-arates the two 4096x2048 pixel chips, because the two wafers are adjacent cuts of thesame silicon boule and are intentionally butted to produce the observed continuity. Smallerrors in the measured relative gain of the two amplifiers used to read each chip cause theweak discontinuity across a vertical line at the center of the image.
ACS WFCCLEAR1L F435W
lpwe01058sm03f435w
0.900 1
rms(%)= 0.95 0.25 0.91
Bohlin: prtimg 11-Dec-2001 14:57
11
Instrument Science Report ACS 2001-11
.050
Figure 4 Flat field for F814W on WFC. In comparison to the F435W filter in Figure 3, thedoughnut has disappeared, while the blob has morphed from a low to a high sensitivity rel-ative to the rest of the field. Several weak motes with a ~100px diameter are visible andresult from dust particles on the CCD window. A few of these same motes can be distin-guished in Figure 3.ACS WFCCLEAR1L F814W
lpwe01058sm03f814w
0.900 1
rms(%)= 0.74 0.28 0.69
Bohlin: prtimg 11-Dec-2001 14:59
12

Instrument Science Report ACS 2001-11
.03
Figure 5 A 1024x1024px region of the WFC ratio image of the F475W/F435W flats. Theblob is prominent on the 0.97 to 1.03 stretch even for these neighboring bandpasses. Awayfrom the blob, the pixel-to-pixel residual scatter of 0.16% demonstrates that these two flatshave almost exactly the same P-flat structure.
F475W CLEAR2L / F435W CLEAR1L
0.97 1ACS WFC RATIO
rms(%)= 0.40 0.37 0.14lpwe01058sm03f475w / lpwe01058sm03f435w 1024x1024 center: 1512, 522
Bohlin: wbloup 13-Nov-2001 12:56
13

Instrument Science Report ACS 2001-11
.050
Figure 6 Ratio of a monochromatic 4330Å flat to a white-light tungsten flat for theF435W on WFC. While the white-light flat provides an excellent (0.2% rms) correction ofthe P-flat structure, the L-flat residuals are a worst case from our limited test set of mono-chromatic flats. About half of the image shows a residual of >2%, while substantialregions differ from unity by >5%. Because of these differential variations in sensitivitywith the spectral flux distribution of the source, caution is advised when attempting to per-form relative photometry over the large WFC field of view.
ACS WFC RATIOF435W CLEAR1L / F435W CLEAR1L
lp4330w01057sm02f435w / lpwe01058sm03f435w
0.950 1
rms(%)= 0.66 0.65 0.15
Bohlin: prtimg 13-Nov-2001 13:02
14

Instrument Science Report ACS 2001-11
50
Figure 7 Monochromatic flat at 9000Å divided by the broadband, white-light F814W flaton WFC. The fringing pattern is prominent; and ~4% large scale L-flat residuals appear inthe doughnut and blob regions. Because of the small scale of the fringing, rms residuals inthe standard 101x101 pixel region are 3.8%.
ACS WFC RATIOF814W CLEAR1L / F814W CLEAR1L
lp9000w25691f814w / lpwe01058sm03f814w
0.950 1.0
rms(%)= 3.87 0.86 3.78
Bohlin: prtimg 13-Nov-2001 15:00
15
Instrument Science Report ACS 2001-11
50
Figure 8 White light flat for the coronograph combined with the F475W and POL0V fil-ters. The regions of the coronographic spots and the Fastie finger are masked to unit value.The "c" in the file name lphc... indicates that the coronograph is in the beam for this flat.The square box outlined with a dashed line is the 101x101 pixel region where the statisticsare computed.
ACS HRC LP Flat F475W POL0V
lphc01058sm02f475wpol0v
0.900 1.0
rms(%)= 1.06 0.22 1.03
Bohlin: prtimg 23-Oct-2001 11:30
16

Instrument Science Report ACS 2001-11
.050
Figure 9 Flat from Figure 8 divided by the same flat without the coronograph. Differencesin the small window dust motes and the large POL0V bubble blemishes are prominentalong with an overall gradient in the L-flat from top left to bottom right.
ACS HRC RATIOF475W POL0V / F475W POL0V
lphc01058sm02f475wpol0v / lphe01057sm02f475wpol0v
0.950 1
rms(%)= 0.50 0.31 0.39
Bohlin: prtimg 23-Oct-2001 11:26
17

Instrument Science Report ACS 2001-11
Table 1. Table 1. HRC Standard Filters with LP Illumination
ENTRY DATE-OBS EXP-TIME N FILTER1 FILTER2 CCD TEMP(C) RMS(%)
33997 23/08/01 1000.0 2 CLEAR1S F250W -80.0 0.80
33999 23/08/01 1000.0 2 CLEAR1S F220W -80.1 0.75
34002 23/08/01 1000.0 2 CLEAR1S F330W -80.0 0.75
34009 23/08/01 1000.0 4 CLEAR1S F344N -80.0 0.77
26107 26/02/01 14.5 2 CLEAR1S F435W -80.9 0.82
26119 26/02/01 35.0 2 CLEAR1S F660N -80.9 0.55
26105 26/02/01 3.0 2 CLEAR1S F814W -80.8 0.52
26103 26/02/01 3.5 2 F475W CLEAR2S -80.8 0.81
26115 26/02/01 86.0 2 F502N CLEAR2S -81.0 0.71
26111 26/02/01 3.8 2 F550M CLEAR2S -80.8 0.71
26093 26/02/01 2.3 2 F555W CLEAR2S -80.9 0.75
26101 26/02/01 0.7 2 F606W CLEAR2S -80.9 0.61
26643 28/02/01 0.7 1 F606W CLEAR2S -80.8 0.61
26097 26/02/01 0.9 2 F625W CLEAR2S -80.9 0.60
26117 26/02/01 15.0 2 F658N CLEAR2S -80.8 0.62
26095 26/02/01 2.8 2 F775W CLEAR2S -80.8 0.46
26099 26/02/01 15.5 2 F850LP CLEAR2S -80.8 0.89
26113 26/02/01 120.0 2 F892N CLEAR2S -80.8 0.93
18

Instrument Science R
eport AC
S 2001-11
19
D AMP CCD TEMP(C) RMS(%)
ABCD -78.8 0.92
ABCD -78.9 0.91
ABCD -78.8 0.80
ABCD -78.9 0.69
ABCD -78.8 0.92
ABCD -78.8 0.94
ABCD -78.8 0.88
ABCD -78.8 0.90
ABCD -78.8 0.81
ABCD -78.7 0.80
ABCD -78.8 0.84
ABCD -78.8 0.79
ABCD -78.8 0.70
ABCD -78.8 0.71
B -78.8 0.75
C -78.7 0.72
Table 2. WFC Standard Filters with LP Illumination
ENTRY DATE-OBS EXP-TIME N FILTER1 FW1 OFF FILTER2 FW2 OFF AXIS1(px) CC
26089 26/02/01 1.0 2 CLEAR1L 0 F435W 0 4096
26313 27/02/01 30.0 3 CLEAR1L 0 F435W 0 4096
26421 27/02/01 23.2 3 CLEAR1L 0 F660N 0 4096
26310 27/02/01 1.3 3 CLEAR1L 0 F814W 0 4096
26307 27/02/01 5.9 3 F475W 0 CLEAR2L 0 4096
26415 27/02/01 132.0 3 F502N 0 CLEAR2L 0 4096
26412 27/02/01 4.3 3 F550M 0 CLEAR2L 0 4096
26291 27/02/01 2.8 3 F555W 0 CLEAR2L 0 4096
26304 27/02/01 0.5 3 F606W 0 CLEAR2L 0 4096
26475 28/02/01 0.5 3 F606W 0 CLEAR2L 0 4096
26297 27/02/01 0.7 3 F625W 0 CLEAR2L 0 4096
26418 27/02/01 9.1 3 F658N 0 CLEAR2L 0 4096
26294 27/02/01 1.4 3 F775W 0 CLEAR2L 0 4096
26300 27/02/01 6.3 3 F850LP 0 CLEAR2L 0 4096
26426 27/02/01 77.0 3 F892N 57 CLEAR2L 0 2048
26430 27/02/01 77.0 3 F892N -61 CLEAR2L 0 2048

Instrument Science Report ACS 2001-11
Table 3. HRC Polarizer Filters with LP IlluminationENTRY DATE-OBS EXP-TIME N FILTER1 FILTER2 CCD TEMP(C)
26123 26/02/01 11.0 2 F475W POL0V -80.9
26125 26/02/01 11.0 2 F475W POL60V -80.9
26127 26/02/01 11.0 2 F475W POL120V -80.9
26681 28/02/01 245.0 2 F502N POL0V -80.8
26683 28/02/01 245.0 2 F502N POL60V -80.9
26685 28/02/01 245.0 2 F502N POL120V -80.8
26657 28/02/01 11.6 2 F550M POL0V -80.9
26659 28/02/01 11.6 2 F550M POL60V -80.9
26661 28/02/01 11.6 2 F550M POL120V -80.9
26129 26/02/01 6.7 2 F555W POL0V -80.8
26131 26/02/01 6.7 2 F555W POL60V -80.8
26133 26/02/01 6.7 2 F555W POL120V -80.8
26675 28/02/01 2.0 2 F606W POL0V -80.9
26677 28/02/01 2.0 2 F606W POL60V -80.9
26679 28/02/01 2.0 2 F606W POL120V -80.9
26141 26/02/01 2.0 2 F625W POL0V -80.9
26143 26/02/01 2.0 2 F625W POL60V -80.9
26145 26/02/01 2.0 2 F625W POL120V -80.8
26147 26/02/01 39.0 2 F658N POL0V -80.9
26149 26/02/01 39.0 2 F658N POL60V -80.9
26151 26/02/01 39.0 2 F658N POL120V -81.0
26135 26/02/01 6.7 2 F775W POL0V -80.9
26137 26/02/01 6.7 2 F775W POL60V -80.9
26139 26/02/01 6.7 2 F775W POL120V -80.8
26663 28/02/01 21.5 2 F850LP POL0V -80.9
26665 28/02/01 21.5 2 F850LP POL60V -80.9
26667 28/02/01 21.5 2 F850LP POL120V -80.8
26669 28/02/01 250.0 2 F892N POL0V -80.9
26671 28/02/01 250.0 2 F892N POL60V -80.8
26673 28/02/01 250.0 2 F892N POL120V -80.9
26155 26/02/01 45.0 2 POL0UV F435W -80.9
26157 26/02/01 45.0 2 POL60UV F435W -80.8
26159 26/02/01 45.0 2 POL120UV F435W -80.9
26645 28/02/01 95.0 2 POL0UV F660N -80.9
26647 28/02/01 95.0 2 POL60UV F660N -80.9
26649 28/02/01 95.0 2 POL120UV F660N -80.9
26161 26/02/01 5.8 2 POL0UV F814W -80.9
26163 26/02/01 5.8 2 POL60UV F814W -80.9
26165 26/02/01 5.8 2 POL120UV F814W -80.9
20

Instrument Science R
eport AC
S 2001-11
21
CCD AMP CCD TEMP(C)
B -78.8
B -78.8
B -78.8
B -78.8
B -78.8
B -78.8
B -78.8
B -78.7
B -78.9
B -78.8
B -78.8
B -78.7
B -78.8
B -78.8
B -78.8
B -78.8
B -78.8
B -78.8
B -78.8
B -78.7
B -78.8
B -78.9
B -78.9
B -78.8
B -78.8
B -78.9
B -78.7
C -78.8
C -78.9
C -78.7
C -78.9
C -78.8
C -78.8
C -78.8
C -78.9
C -78.8
C -78.8
C -78.7
C -78.8
Table 4. WFC Polarizer Filters with LP IlluminationENTRY DATE-OBS EXP-TIME N FILTER1 FW1 OFF FILTER2 FW2 OFF AXIS1(px)
26318 27/02/01 16.0 3 F475W 0 POL0V -57 2048
26324 27/02/01 16.0 3 F475W 0 POL120V -57 2048
26321 27/02/01 16.0 3 F475W 0 POL60V -57 2048
26869 01/03/01 360.0 3 F502N 0 POL0V -57 2048
26875 01/03/01 360.0 3 F502N 0 POL120V -57 2048
26872 01/03/01 360.0 3 F502N 0 POL60V -57 2048
26833 01/03/01 12.0 3 F550M 0 POL0V -57 2048
26839 01/03/01 12.0 3 F550M 0 POL120V -57 2048
26836 01/03/01 12.0 3 F550M 0 POL60V -57 2048
26327 27/02/01 7.4 3 F555W 0 POL0V -57 2048
26333 27/02/01 7.4 3 F555W 0 POL120V -57 2048
26330 27/02/01 7.4 3 F555W 0 POL60V -57 2048
26860 01/03/01 1.7 3 F606W 0 POL0V -57 2048
26866 01/03/01 1.7 3 F606W 0 POL120V -57 2048
26863 01/03/01 1.7 3 F606W 0 POL60V -57 2048
26345 27/02/01 1.7 3 F625W 0 POL0V -57 2048
26351 27/02/01 1.7 3 F625W 0 POL120V -57 2048
26348 27/02/01 1.7 3 F625W 0 POL60V -57 2048
26354 27/02/01 23.0 3 F658N 0 POL0V -57 2048
26360 27/02/01 23.0 3 F658N 0 POL120V -57 2048
26357 27/02/01 23.0 3 F658N 0 POL60V -57 2048
26336 27/02/01 2.9 3 F775W 0 POL0V -57 2048
26342 27/02/01 2.9 3 F775W 0 POL120V -57 2048
26339 27/02/01 2.9 3 F775W 0 POL60V -57 2048
26842 01/03/01 8.5 3 F850LP 0 POL0V -57 2048
26848 01/03/01 8.5 3 F850LP 0 POL120V -57 2048
26845 01/03/01 8.5 3 F850LP 0 POL60V -57 2048
26365 27/02/01 16.0 3 F475W 0 POL0V 61 2048
26371 27/02/01 16.0 3 F475W 0 POL120V 61 2048
26368 27/02/01 16.0 3 F475W 0 POL60V 61 2048
26934 01/03/01 360.0 3 F502N 0 POL0V 61 2048
26940 01/03/01 360.0 3 F502N 0 POL120V 61 2048
26937 01/03/01 360.0 3 F502N 0 POL60V 61 2048
26898 01/03/01 12.0 3 F550M 0 POL0V 61 2048
26904 01/03/01 12.0 3 F550M 0 POL120V 61 2048
26901 01/03/01 12.0 3 F550M 0 POL60V 61 2048
26374 27/02/01 7.4 3 F555W 0 POL0V 61 2048
26380 27/02/01 7.4 3 F555W 0 POL120V 61 2048
26377 27/02/01 7.4 3 F555W 0 POL60V 61 2048

Instrument Science R
eport AC
S 2001-11
22
C -78.9
C -78.7
C -78.8
C -78.8
C -78.9
C -78.8
C -78.8
C -78.9
C -78.9
C -78.7
C -78.7
C -78.8
C -78.7
C -78.8
C -78.9
C -78.9
C -78.7
C -78.8
B -78.8
B -78.8
B -78.9
C -78.9
C -78.8
C -78.9
C -78.8
C -78.7
C -78.9
C -78.8
C -78.8
C -78.7
B -78.8
B -78.7
B -78.8
B -78.9
B -78.8
B -78.7
B -78.8
B -78.8
B -78.8
CCD AMP CCD TEMP(C)
26925 01/03/01 1.7 3 F606W 0 POL0V 61 2048
26931 01/03/01 1.7 3 F606W 0 POL120V 61 2048
26928 01/03/01 1.7 3 F606W 0 POL60V 61 2048
26392 27/02/01 1.7 3 F625W 0 POL0V 61 2048
26398 27/02/01 1.7 3 F625W 0 POL120V 61 2048
26395 27/02/01 1.7 3 F625W 0 POL60V 61 2048
26401 27/02/01 23.0 3 F658N 0 POL0V 61 2048
26407 27/02/01 23.0 3 F658N 0 POL120V 61 2048
26404 27/02/01 23.0 3 F658N 0 POL60V 61 2048
26383 27/02/01 2.9 3 F775W 0 POL0V 61 2048
26389 27/02/01 2.9 3 F775W 0 POL120V 61 2048
26386 27/02/01 2.9 3 F775W 0 POL60V 61 2048
26907 01/03/01 8.5 3 F850LP 0 POL0V 61 2048
26913 01/03/01 8.5 3 F850LP 0 POL120V 61 2048
26910 01/03/01 8.5 3 F850LP 0 POL60V 61 2048
26916 01/03/01 90.0 3 F892N -61 POL0V 61 2048
26922 01/03/01 90.0 3 F892N -61 POL120V 61 2048
26919 01/03/01 90.0 3 F892N -61 POL60V 61 2048
26851 01/03/01 90.0 3 F892N 57 POL0V -57 2048
26857 01/03/01 90.0 3 F892N 57 POL120V -57 2048
26854 01/03/01 90.0 3 F892N 57 POL60V -57 2048
26456 27/02/01 81.0 3 POL0UV -61 F435W 0 2048
26462 28/02/01 81.0 3 POL120UV -61 F435W 0 2048
26459 27/02/01 81.0 3 POL60UV -61 F435W 0 2048
26889 01/03/01 42.0 3 POL0UV -61 F660N 0 2048
26895 01/03/01 42.0 3 POL120UV -61 F660N 0 2048
26892 01/03/01 42.0 3 POL60UV -61 F660N 0 2048
26465 28/02/01 2.4 3 POL0UV -61 F814W 0 2048
26471 28/02/01 2.4 3 POL120UV -61 F814W 0 2048
26468 28/02/01 2.4 3 POL60UV -61 F814W 0 2048
26436 27/02/01 81.0 3 POL0UV 57 F435W 0 2048
26442 27/02/01 81.0 3 POL120UV 57 F435W 0 2048
26439 27/02/01 81.0 3 POL60UV 57 F435W0 0 2048
26824 01/03/01 42.0 3 POL0UV 57 F660N 0 2048
26830 01/03/01 42.0 3 POL120UV 57 F660N 0 2048
26827 01/03/01 42.0 3 POL60UV 57 F660N 0 2048
26445 27/02/01 2.4 3 POL0UV 57 F814W 0 2048
26451 27/02/01 2.4 3 POL120UV 57 F814W 0 2048
26448 27/02/01 2.4 3 POL60UV 57 F814W 0 2048
ENTRY DATE-OBS EXP-TIME N FILTER1 FW1 OFF FILTER2 FW2 OFF AXIS1(px)

Instrument Science Report ACS 2001-11
Table 5. HRC Coronographic LP-flat Data ENTRY DATE-OBS EXP-TIME N FILTER1 FILTER2 CCD TEMP(C)
26169 26/02/01 4.6 2 F555W CLEAR2S -80.9
26171 26/02/01 5.6 2 F775W CLEAR2S -80.9
26173 26/02/01 1.8 2 F625W CLEAR2S -81.0
26175 26/02/01 31.0 2 F850LP CLEAR2S -80.9
26177 26/02/01 1.4 2 F606W CLEAR2S -80.9
26179 26/02/01 7.0 2 F475W CLEAR2S -80.9
26181 26/02/01 6.0 2 CLEAR1S F814W -80.9
26183 26/02/01 29.0 2 CLEAR1S F435W -80.8
26187 26/02/01 7.6 2 F550M CLEAR2S -80.8
26189 26/02/01 240.0 2 F892N CLEAR2S -80.9
26191 26/02/01 172.0 2 F502N CLEAR2S -80.9
26193 26/02/01 30.0 2 F658N CLEAR2S -80.8
26195 26/02/01 70.0 2 CLEAR1S F660N -80.9
26199 27/02/01 22.0 2 F475W POL0V -80.9
26201 27/02/01 22.0 2 F475W POL60V -80.9
26203 27/02/01 22.0 2 F475W POL120V -80.9
26205 27/02/01 13.4 2 F555W POL0V -80.9
26207 27/02/01 13.4 2 F555W POL60V -81.0
26209 27/02/01 13.4 2 F555W POL120V -80.9
26211 27/02/01 13.4 2 F775W POL0V -81.0
26213 27/02/01 13.4 2 F775W POL60V -80.9
26215 27/02/01 13.4 2 F775W POL120V -80.9
26217 27/02/01 4.0 2 F625W POL0V -80.9
26219 27/02/01 4.0 2 F625W POL60V -80.9
26221 27/02/01 4.0 2 F625W POL120V -80.9
26223 27/02/01 78.0 2 F658N POL0V -80.9
26225 27/02/01 78.0 2 F658N POL60V -80.9
26227 27/02/01 78.0 2 F658N POL120V -80.9
26242 27/02/01 90.0 2 POL0UV F435W -80.9
26244 27/02/01 90.0 2 POL60UV F435W -80.9
26246 27/02/01 90.0 2 POL120UV F435W -80.9
26248 27/02/01 11.6 2 POL0UV F814W -80.9
26250 27/02/01 11.6 2 POL60UV F814W -80.8
26252 27/02/01 11.6 2 POL120UV F814W -80.8
23

Instrument Science Report ACS 2001-11
320
625w
NUM
0.32
0.89
0.83
0.87
1.02
625w
DENO
0.26
0.87
0.83
0.85
0.99
R
0.42
0.44
0.16
Table 6. STATISTICS OF THE WFC MONOCHROMATIC FLATS VS. BROADBANDFLATS
3880 4330 4551 4772 5076 5381 5672 5962 6141 6
f435w f435w f475w f475w f475w f555w f606w f606w f625w f
ERATOR
Poisson(%) 1.28 0.60 0.56 0.58 0.67 0.53 0.41 0.35 0.33
Actual sigma(%) 1.79 1.08 1.05 1.08 1.15 1.04 0.97 0.92 0.92
Sigma Flat(%) 1.26 0.90 0.89 0.91 0.93 0.90 0.88 0.85 0.86
Minimum 0.78 0.88 0.88 0.87 0.87 0.86 0.87 0.87 0.87
Maximum 1.06 1.02 1.02 1.02 1.03 1.03 1.02 1.03 1.03
f435w f435w f475w f475w f475w f555w f606w f606w f625w f
MINATOR
Poisson(%) 0.29 0.29 0.26 0.26 0.26 0.26 0.28 0.28 0.26
Actual sigma(%) 0.97 0.97 0.96 0.96 0.96 0.93 0.85 0.85 0.87
Sigma Flat(%) 0.92 0.92 0.92 0.92 0.92 0.89 0.80 0.80 0.83
Minimum 0.89 0.89 0.86 0.86 0.86 0.87 0.87 0.87 0.85
Maximum 1.04 1.04 1.01 1.01 1.01 1.02 1.01 1.01 0.99
ATIO
Poisson(%) 1.31 0.67 0.62 0.64 0.72 0.59 0.49 0.45 0.42
Actual sigma(%) 1.45 0.69 0.65 0.68 0.76 0.62 0.54 0.49 0.45
Resid. sigma(%) 0.63 0.20 0.22 0.24 0.24 0.19 0.21 0.20 0.15
24