Embed Size (px)
Citation preview

H&R Real Estate Investment Trust and H&R Finance Trust Q3 2014 Quarterly Report to Unitholders For the Nine months Ended September 30, 2014
The Bow, Calgary Scotia Plaza, Toronto
Corus Quay, Toronto
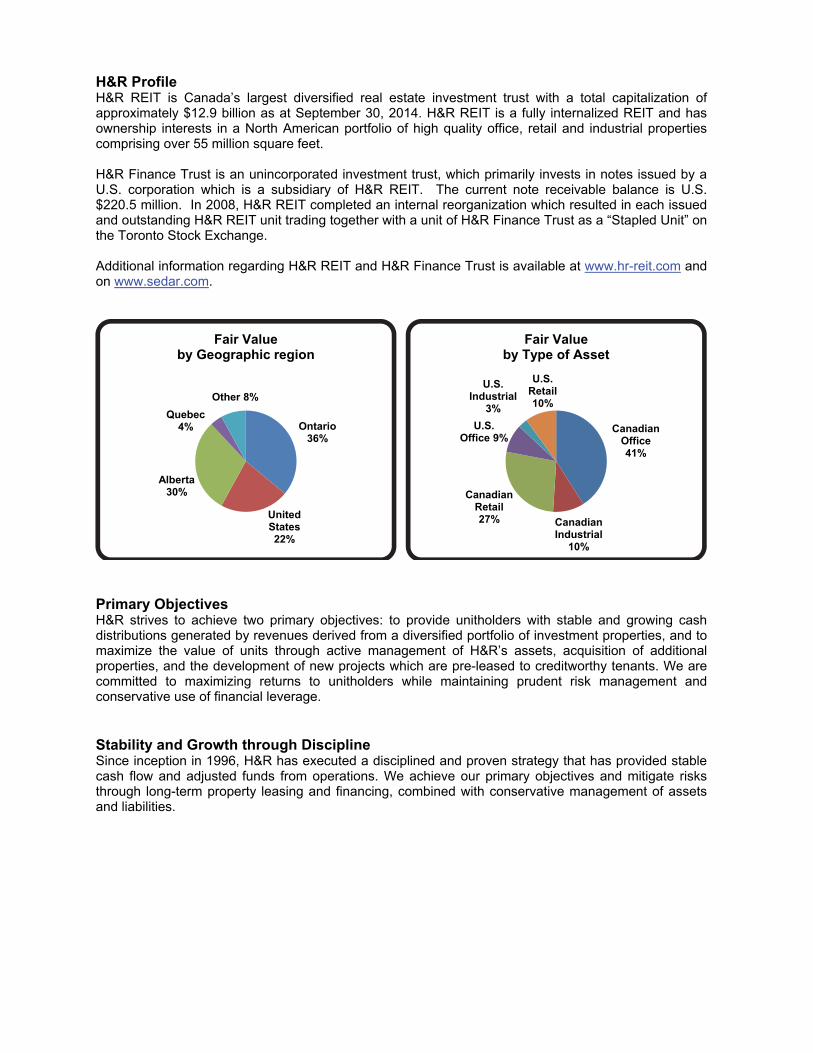
H&R Profile H&R REIT is Canada’s largest diversified real estate investment trust with a total capitalization of approximately $12.9 billion as at September 30, 2014. H&R REIT is a fully internalized REIT and has ownership interests in a North American portfolio of high quality office, retail and industrial properties comprising over 55 million square feet. H&R Finance Trust is an unincorporated investment trust, which primarily invests in notes issued by a U.S. corporation which is a subsidiary of H&R REIT. The current note receivable balance is U.S. $220.5 million. In 2008, H&R REIT completed an internal reorganization which resulted in each issued and outstanding H&R REIT unit trading together with a unit of H&R Finance Trust as a “Stapled Unit” on the Toronto Stock Exchange. Additional information regarding H&R REIT and H&R Finance Trust is available at www.hr-reit.com and on www.sedar.com.
Primary Objectives H&R strives to achieve two primary objectives: to provide unitholders with stable and growing cash distributions generated by revenues derived from a diversified portfolio of investment properties, and to maximize the value of units through active management of H&R’s assets, acquisition of additional properties, and the development of new projects which are pre-leased to creditworthy tenants. We are committed to maximizing returns to unitholders while maintaining prudent risk management and conservative use of financial leverage. Stability and Growth through Discipline Since inception in 1996, H&R has executed a disciplined and proven strategy that has provided stable cash flow and adjusted funds from operations. We achieve our primary objectives and mitigate risks through long-term property leasing and financing, combined with conservative management of assets and liabilities.
Ontario 36%
United States 22%
Alberta 30%
Quebec 4%
Other 8%
Fair Valueby Geographic region
Canadian Office 41%
Canadian Industrial
10%
Canadian Retail 27%
U.S. Office 9%
U.S. Industrial
3%
U.S. Retail 10%
Fair Valueby Type of Asset
Summary Report to Unitholders: Third Quarter 2014 Summary of Significant Q3 2014 Activity Primaris Portfolio Activity In September 2014, the REIT acquired a 50% managing interest in Kildonan Place, an enclosed shopping centre in Winnipeg, MB for $69.7 million, at a capitalization rate of 6% including property management fee income. Kildonan Place is the third largest enclosed shopping centre in Winnipeg. The site has approximately 7.5 acres of excess lands which after rezoning would result in total excess density of approximately 100,000 square feet for potential future development. This transaction, as well as previously announced dispositions in Q2 2014 of a 50% non-managing interest in Regent Mall in Fredericton, NB; McAllister Place in Saint John, NB; and Grant Park in Winnipeg, MB continues to leverage the Primaris management platform as an owner and third party manager of regional shopping centres. H&R Portfolio Dispositions In July 2014, the REIT sold 50 Cambridge St., a 69,020 square foot retail property in Worcester, MA for U.S.$16.0 million. In September 2014, the REIT sold 200 Chisholm Dr., a 91,828 square foot vacant industrial building in Milton, ON for approximately $7.3 million. In September 2014, the REIT sold a four property portfolio for approximately U.S.$29.5 million. These four properties total 163,766 square feet and are located in Tennessee, Georgia and South Carolina. As part of the sale, the REIT repaid the existing mortgages on these properties for U.S.$13.7 million. Development of Airport Road Project The development of the 744,922 square foot state-of-the-art, built-to-suit distribution centre on the Airport Road lands in Mississauga, ON, was completed ahead of schedule and, as a result, the property is now classified in H&R’s Financial Statements as an investment property. Unilever Canada Inc.’s lease for 10 years commenced October 1, 2014 and the REIT is expected to earn a 7% return on its cost. Mortgage Financing and Unencumbered Pool In August 2014, the REIT repaid two mortgages totalling $92.7 million which were bearing interest at a weighted average interest rate of 6.4%. As at September 30, 2014, excluding H&R’s interests in real estate assets included in equity accounted investments, the REIT had 49 unencumbered properties with a fair value of approximately $1.5 billion. Also, due to the REIT’s 18-year history and management’s conservative strategy of securing long-term financing on individual properties, the REIT has numerous other properties with low loan to value ratios. As at September 30, 2014, the REIT had 41 properties valued at approximately $1.8 billion which are encumbered with mortgages totaling $403.6 million. In this pool of assets, the average loan to value is 22.9%, the maximum loan to value is 29.6% and the minimum loan to value is 8.4%. In August 2014, DBRS Limited upgraded H&R’s credit rating from BBB with a Stable trend to BBB (high) with a Stable trend. The REIT believes the rating upgrade is primarily due to the stabilization of the Bow, the successful integration of Primaris and recent high-quality property investments, which have resulted in significant operating income and portfolio growth, lower debt levels, a growing unencumbered asset pool, and an increase in H&R’s coverage ratios.
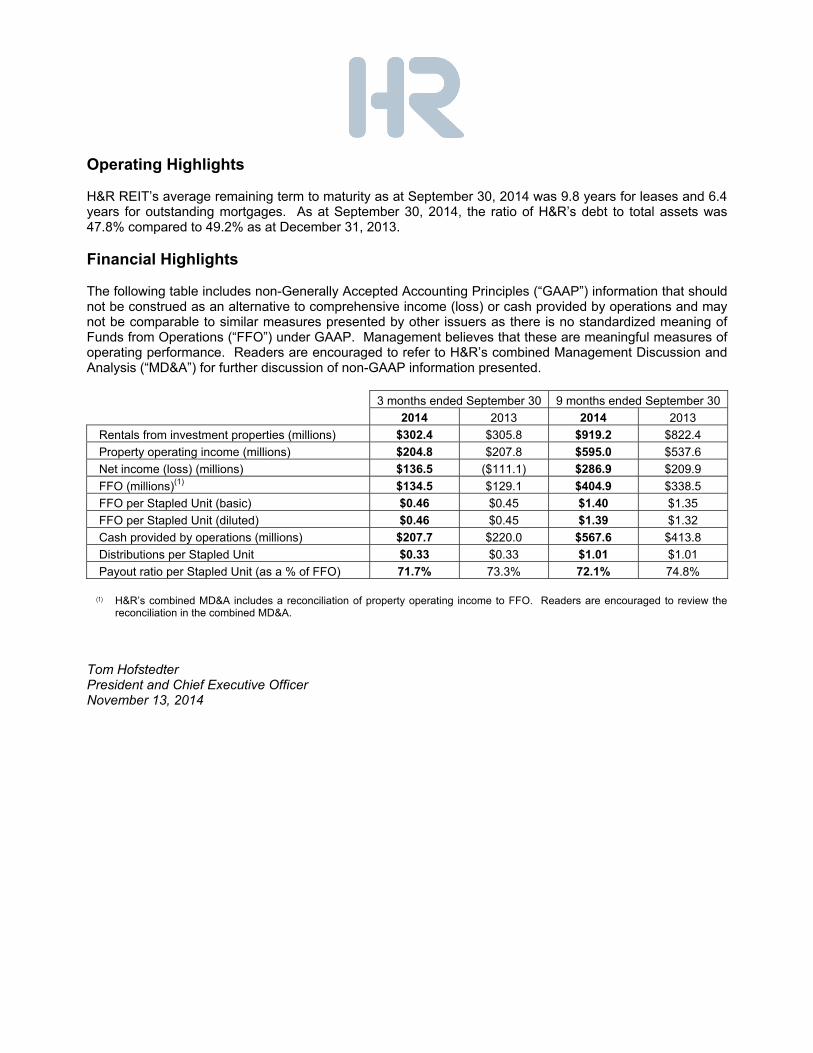
Operating Highlights H&R REIT’s average remaining term to maturity as at September 30, 2014 was 9.8 years for leases and 6.4 years for outstanding mortgages. As at September 30, 2014, the ratio of H&R’s debt to total assets was 47.8% compared to 49.2% as at December 31, 2013. Financial Highlights The following table includes non-Generally Accepted Accounting Principles (“GAAP”) information that should not be construed as an alternative to comprehensive income (loss) or cash provided by operations and may not be comparable to similar measures presented by other issuers as there is no standardized meaning of Funds from Operations (“FFO”) under GAAP. Management believes that these are meaningful measures of operating performance. Readers are encouraged to refer to H&R’s combined Management Discussion and Analysis (“MD&A”) for further discussion of non-GAAP information presented.
3 months ended September 30 9 months ended September 30
2014 2013 2014 2013
Rentals from investment properties (millions) $302.4 $305.8 $919.2 $822.4
Property operating income (millions) $204.8 $207.8 $595.0 $537.6
Net income (loss) (millions) $136.5 ($111.1) $286.9 $209.9
FFO (millions)(1) $134.5 $129.1 $404.9 $338.5
FFO per Stapled Unit (basic) $0.46 $0.45 $1.40 $1.35
FFO per Stapled Unit (diluted) $0.46 $0.45 $1.39 $1.32
Cash provided by operations (millions) $207.7 $220.0 $567.6 $413.8
Distributions per Stapled Unit $0.33 $0.33 $1.01 $1.01
Payout ratio per Stapled Unit (as a % of FFO) 71.7% 73.3% 72.1% 74.8%
(1) H&R’s combined MD&A includes a reconciliation of property operating income to FFO. Readers are encouraged to review the reconciliation in the combined MD&A.
Tom Hofstedter President and Chief Executive Officer November 13, 2014

Unaudited Condensed Combined Interim Financial Statements of
H&R REAL ESTATE INVESTMENT TRUST and
H&R FINANCE TRUST
For the three and nine months ended September 30, 2014 and 2013
1
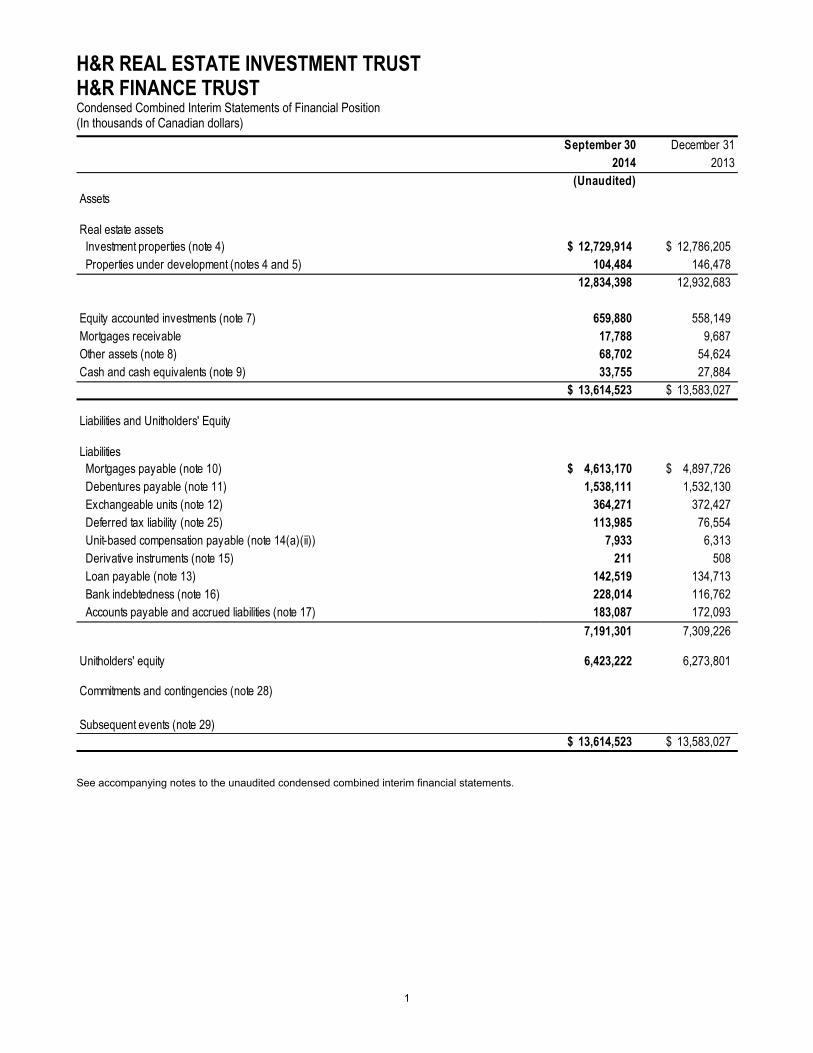
H&R REAL ESTATE INVESTMENT TRUST H&R FINANCE TRUST Condensed Combined Interim Statements of Financial Position (In thousands of Canadian dollars)
September 30 December 312014 2013
(Unaudited)Assets
Real estate assets Investment properties (note 4) 12,729,914 $ 12,786,205 $ Properties under development (notes 4 and 5) 104,484 146,478
12,834,398 12,932,683
Equity accounted investments (note 7) 659,880 558,149 Mortgages receivable 17,788 9,687 Other assets (note 8) 68,702 54,624 Cash and cash equivalents (note 9) 33,755 27,884
13,614,523 $ 13,583,027 $
Liabilities and Unitholders' Equity
Liabilities Mortgages payable (note 10) 4,613,170 $ 4,897,726 $ Debentures payable (note 11) 1,538,111 1,532,130 Exchangeable units (note 12) 364,271 372,427 Deferred tax liability (note 25) 113,985 76,554 Unit-based compensation payable (note 14(a)(ii)) 7,933 6,313 Derivative instruments (note 15) 211 508 Loan payable (note 13) 142,519 134,713 Bank indebtedness (note 16) 228,014 116,762 Accounts payable and accrued liabilities (note 17) 183,087 172,093
7,191,301 7,309,226
Unitholders' equity 6,423,222 6,273,801
Commitments and contingencies (note 28)
Subsequent events (note 29)13,614,523 $ 13,583,027 $
See accompanying notes to the unaudited condensed combined interim financial statements.
2
.
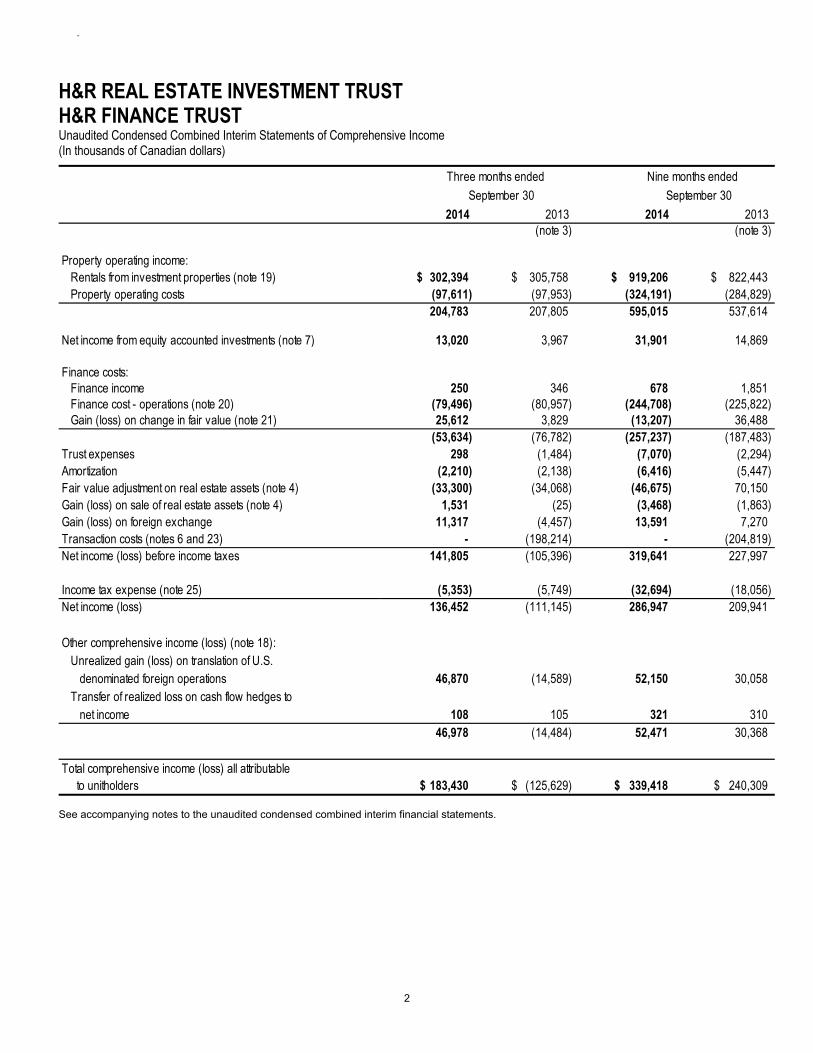
H&R REAL ESTATE INVESTMENT TRUST H&R FINANCE TRUST Unaudited Condensed Combined Interim Statements of Comprehensive Income (In thousands of Canadian dollars)
2014 2013 2014 2013 (note 3) (note 3)
Property operating income: Rentals from investment properties (note 19) 302,394 $ 305,758 $ 919,206 $ 822,443 $ Property operating costs (97,611) (97,953) (324,191) (284,829)
204,783 207,805 595,015 537,614
Net income from equity accounted investments (note 7) 13,020 3,967 31,901 14,869
Finance costs: Finance income 250 346 678 1,851 Finance cost - operations (note 20) (79,496) (80,957) (244,708) (225,822) Gain (loss) on change in fair value (note 21) 25,612 3,829 (13,207) 36,488
(53,634) (76,782) (257,237) (187,483) Trust expenses 298 (1,484) (7,070) (2,294) Amortization (2,210) (2,138) (6,416) (5,447) Fair value adjustment on real estate assets (note 4) (33,300) (34,068) (46,675) 70,150 Gain (loss) on sale of real estate assets (note 4) 1,531 (25) (3,468) (1,863) Gain (loss) on foreign exchange 11,317 (4,457) 13,591 7,270 Transaction costs (notes 6 and 23) - (198,214) - (204,819) Net income (loss) before income taxes 141,805 (105,396) 319,641 227,997
Income tax expense (note 25) (5,353) (5,749) (32,694) (18,056) Net income (loss) 136,452 (111,145) 286,947 209,941
Other comprehensive income (loss) (note 18): Unrealized gain (loss) on translation of U.S. denominated foreign operations 46,870 (14,589) 52,150 30,058 Transfer of realized loss on cash flow hedges to net income 108 105 321 310
46,978 (14,484) 52,471 30,368
Total comprehensive income (loss) all attributable to unitholders 183,430 $ (125,629) $ 339,418 $ 240,309 $
September 30
Nine months ended Three months ended
September 30
See accompanying notes to the unaudited condensed combined interim financial statements.
3
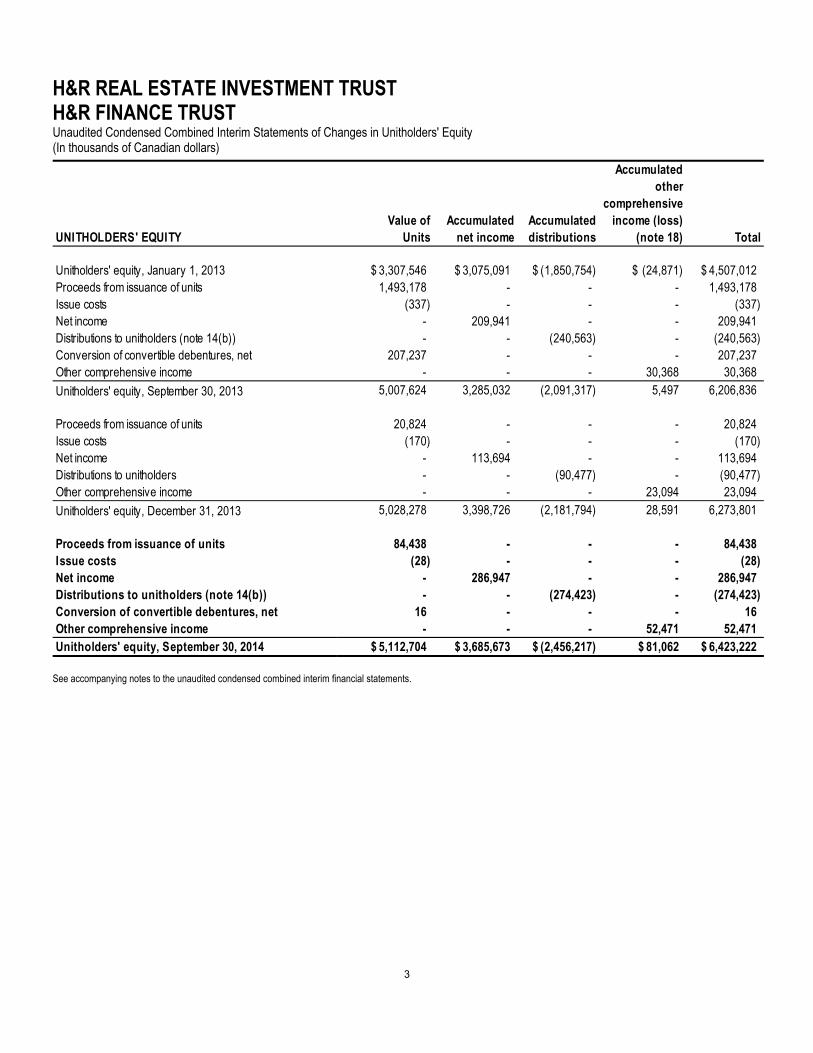
H&R REAL ESTATE INVESTMENT TRUST H&R FINANCE TRUST Unaudited Condensed Combined Interim Statements of Changes in Unitholders' Equity (In thousands of Canadian dollars)
UNITHOLDERS' EQUITYValue of
UnitsAccumulated
net incomeAccumulated distributions
Accumulated other
comprehensive income (loss)
(note 18) Total
Unitholders' equity, January 1, 2013 3,307,546 $ 3,075,091 $ (1,850,754) $ (24,871) $ 4,507,012 $ Proceeds from issuance of units 1,493,178 - - - 1,493,178 Issue costs (337) - - - (337) Net income - 209,941 - - 209,941 Distributions to unitholders (note 14(b)) - - (240,563) - (240,563) Conversion of convertible debentures, net 207,237 - - - 207,237 Other comprehensive income - - - 30,368 30,368
Unitholders' equity, September 30, 2013 5,007,624 3,285,032 (2,091,317) 5,497 6,206,836
Proceeds from issuance of units 20,824 - - - 20,824 Issue costs (170) - - - (170) Net income - 113,694 - - 113,694 Distributions to unitholders - - (90,477) - (90,477) Other comprehensive income - - - 23,094 23,094
Unitholders' equity, December 31, 2013 5,028,278 3,398,726 (2,181,794) 28,591 6,273,801
Proceeds from issuance of units 84,438 - - - 84,438 Issue costs (28) - - - (28) Net income - 286,947 - - 286,947 Distributions to unitholders (note 14(b)) - - (274,423) - (274,423) Conversion of convertible debentures, net 16 - - - 16 Other comprehensive income - - - 52,471 52,471 Unitholders' equity, September 30, 2014 5,112,704 $ 3,685,673 $ (2,456,217) $ 81,062 $ 6,423,222 $ See accompanying notes to the unaudited condensed combined interim financial statements.
4
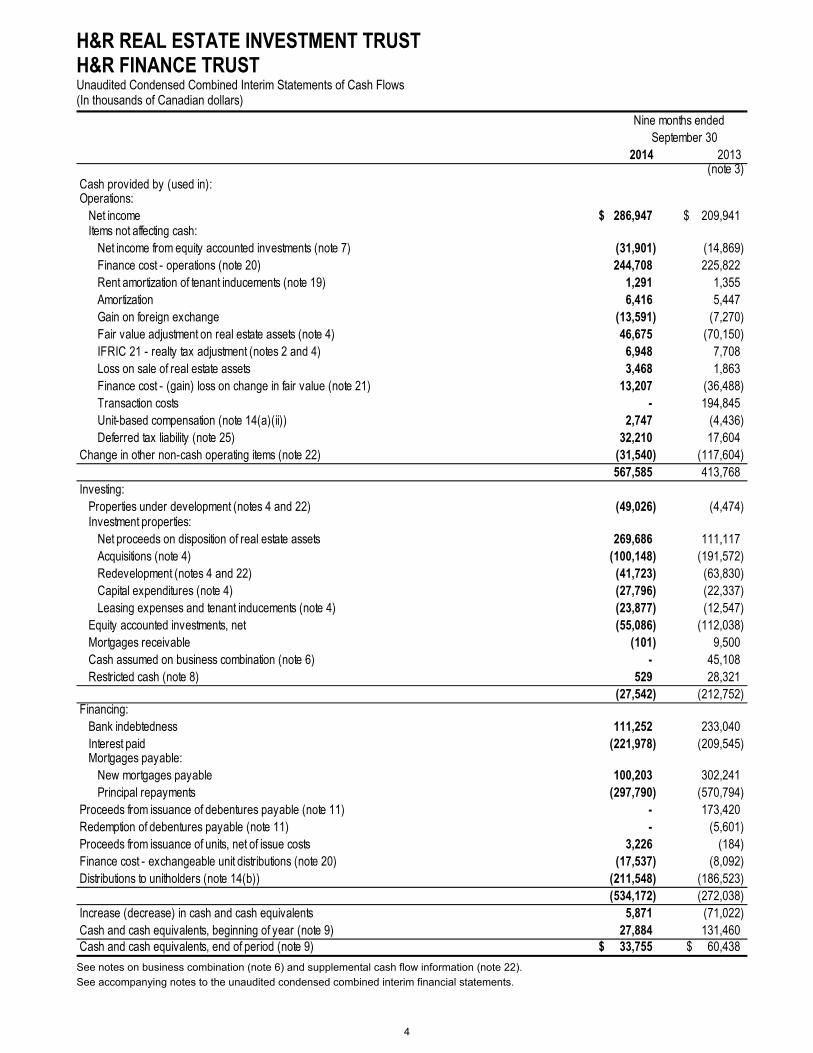
H&R REAL ESTATE INVESTMENT TRUST H&R FINANCE TRUST Unaudited Condensed Combined Interim Statements of Cash Flows (In thousands of Canadian dollars)
2014 2013 (note 3)
Cash provided by (used in):Operations: Net income 286,947 $ 209,941 $ Items not affecting cash: Net income from equity accounted investments (note 7) (31,901) (14,869) Finance cost - operations (note 20) 244,708 225,822 Rent amortization of tenant inducements (note 19) 1,291 1,355 Amortization 6,416 5,447 Gain on foreign exchange (13,591) (7,270) Fair value adjustment on real estate assets (note 4) 46,675 (70,150) IFRIC 21 - realty tax adjustment (notes 2 and 4) 6,948 7,708 Loss on sale of real estate assets 3,468 1,863 Finance cost - (gain) loss on change in fair value (note 21) 13,207 (36,488) Transaction costs - 194,845 Unit-based compensation (note 14(a)(ii)) 2,747 (4,436) Deferred tax liability (note 25) 32,210 17,604 Change in other non-cash operating items (note 22) (31,540) (117,604)
567,585 413,768 Investing: Properties under development (notes 4 and 22) (49,026) (4,474) Investment properties: Net proceeds on disposition of real estate assets 269,686 111,117 Acquisitions (note 4) (100,148) (191,572) Redevelopment (notes 4 and 22) (41,723) (63,830) Capital expenditures (note 4) (27,796) (22,337) Leasing expenses and tenant inducements (note 4) (23,877) (12,547) Equity accounted investments, net (55,086) (112,038) Mortgages receivable (101) 9,500 Cash assumed on business combination (note 6) - 45,108 Restricted cash (note 8) 529 28,321
(27,542) (212,752) Financing: Bank indebtedness 111,252 233,040 Interest paid (221,978) (209,545) Mortgages payable: New mortgages payable 100,203 302,241 Principal repayments (297,790) (570,794) Proceeds from issuance of debentures payable (note 11) - 173,420 Redemption of debentures payable (note 11) - (5,601) Proceeds from issuance of units, net of issue costs 3,226 (184) Finance cost - exchangeable unit distributions (note 20) (17,537) (8,092) Distributions to unitholders (note 14(b)) (211,548) (186,523)
(534,172) (272,038) Increase (decrease) in cash and cash equivalents 5,871 (71,022) Cash and cash equivalents, beginning of year (note 9) 27,884 131,460 Cash and cash equivalents, end of period (note 9) 33,755 $ 60,438 $
Nine months ended September 30
See notes on business combination (note 6) and supplemental cash flow information (note 22).
See accompanying notes to the unaudited condensed combined interim financial statements.
H&R REAL ESTATE INVESTMENT TRUST H&R FINANCE TRUST Notes to Unaudited Condensed Combined Interim Financial Statements (In thousands of Canadian dollars, except unit and per unit amounts) For the Three and Nine Months ended September 30, 2014 and 2013
5
These unaudited condensed combined interim financial statements include the accounts of H&R Real Estate Investment Trust (the "REIT") and H&R Finance Trust ("Finance Trust", together with the REIT, the “Trusts”). The REIT is an unincorporated open-ended trust and Finance Trust is an unincorporated investment trust both domiciled in Canada. The REIT owns, operates and develops commercial properties across Canada and in the United States. The principal office and centre of administration of the Trusts is located at 3625 Dufferin Street, Suite 500, Toronto, Ontario M3K 1N4. Unitholders of each Trust participate pro rata in distributions of income and, in the event of termination of a Trust, participate pro rata in the net assets remaining after satisfaction of all liabilities of such Trust. On October 1, 2008, the REIT completed an internal reorganization pursuant to a Plan of Arrangement (the "Plan of Arrangement") as described in the REIT's information circular dated August 20, 2008, resulting in the stapling of the Trusts' units. The Plan of Arrangement further resulted in, among other things, the creation on October 1, 2008 of Finance Trust. Each unitholder received, for each REIT unit held, a unit of Finance Trust. Each issued and outstanding Finance Trust unit is stapled to a unit of the REIT on a one-for-one basis so as to form stapled units ("Stapled Units"), and such Stapled Units are listed and posted for trading on the Toronto Stock Exchange ("TSX") under the symbol HR.UN. The units of each of the Trusts may only be transferred together as Stapled Units unless an event of "uncoupling" has occurred. On October 24, 2013, the Ontario Securities Commission (on its behalf and on behalf of the other provincial securities regulators) issued a decision which permits the REIT and Finance Trust to file one set of combined financial statements rather than separate financial statements. These unaudited condensed combined interim financial statements are being presented on a basis whereby the assets and liabilities of the REIT and Finance Trust have been combined in accordance with the accounting principles applicable to both the REIT and Finance Trust in accordance with International Financial Reporting Standards (“IFRS”) to reflect the financial position and results of the REIT and Finance Trust on a combined basis. The combined presentation is useful to the unitholders of the Trusts, for the following reasons:
The units of the Trusts are stapled (as noted above), resulting in the Trusts being under common ownership;
A support agreement between the Trusts ensures that until such time as an event of “uncoupling” occurs, when units are issued by the REIT, units must also be issued by Finance Trust simultaneously so as to maintain the stapled unit structure;
The sole activity of Finance Trust is to provide capital funding to H&R REIT (U.S.) Holdings Inc. ("U.S. Holdco"), a wholly owned U.S. subsidiary of the REIT; and
The investment activities of Finance Trust are restricted in its Declaration of Trust to providing such funding to U.S. Holdco and to make temporary investments of excess funds.
1. Basis of preparation:
(a) Statement of compliance
These unaudited condensed combined interim financial statements have been prepared in accordance with International Accounting Standards (“IAS”) 34, Interim Financial Reporting. Accordingly, certain information and note disclosures normally included in annual financial statements prepared in accordance with IFRS have been omitted or condensed. The December 31, 2013 financial information has been derived from the December 31, 2013 audited annual combined financial statements.
The unaudited condensed combined interim financial statements were approved by the Board of Trustees of the REIT on November 13, 2014.
H&R REAL ESTATE INVESTMENT TRUST H&R FINANCE TRUST Notes to Unaudited Condensed Combined Interim Financial Statements (In thousands of Canadian dollars, except unit and per unit amounts) For the Three and Nine Months ended September 30, 2014 and 2013
6
1. Basis of preparation (continued):
(b) Basis of measurement
The unaudited condensed combined interim financial statements have been prepared on the historical cost basis except for the following material items in the unaudited condensed combined interim statements of financial position which have been measured at fair value:
(i) Real estate assets;
(ii) Derivative financial instruments;
(iii) Liabilities for cash-settled unit-based compensation;
(iv) Convertible debentures; and
(v) Exchangeable units.
(c) Functional currency and presentation
These unaudited condensed combined interim financial statements are presented in Canadian dollars, which is the Trusts’ functional currency. All financial information presented in Canadian dollars has been rounded to the nearest thousand.
The Trusts present their unaudited condensed combined interim statements of financial position based on the liquidity method, where all assets and liabilities are presented in ascending order of liquidity.
(d) Use of estimates and judgements
The preparation of these unaudited condensed combined interim financial statements requires management to make judgements, estimates and assumptions that affect the application of accounting policies, the reported amounts of assets, liabilities, income and expenses and disclosure of contingent assets and liabilities at the date of the financial statements. Actual results may differ from these estimates.
(i) Use of estimates
Estimates and underlying assumptions are reviewed on an ongoing basis. Revisions to accounting estimates are recognized in the period in which the estimates are revised and in any future periods affected. Information about assumptions and estimation uncertainties that have a significant risk of resulting in a material adjustment within the next financial year are included in the following notes:
Fair value of real estate assets;
Fair value of financial instruments;
Fair value of cash-settled unit-based compensation;
H&R REAL ESTATE INVESTMENT TRUST H&R FINANCE TRUST Notes to Unaudited Condensed Combined Interim Financial Statements (In thousands of Canadian dollars, except unit and per unit amounts) For the Three and Nine Months ended September 30, 2014 and 2013
7
1. Basis of preparation (continued):
Fair value of convertible debentures; and
Fair value of exchangeable units.
(ii) Use of judgements
The critical judgements made in applying accounting policies that have the most significant effect on the amounts recognized in these unaudited condensed combined interim financial statements are as follows:
Business combinations
Accounting for business combinations under IFRS 3, Business Combinations (“IFRS 3”) is only applicable if it is determined that a business has been acquired. Under IFRS 3, a business is defined as an integrated set of activities and assets conducted and managed for the purpose of providing a return to investors or lower costs or other economic benefits directly and proportionately to the REIT. A business generally consists of inputs, processes applied to those inputs, and resulting outputs that are, or will be, used to generate revenues. In the absence of such criteria, a group of assets is deemed to have been acquired. If goodwill is present in a transferred set of activities and assets, the transferred set is presumed to be a business. Judgement is used by management in determining whether the acquisition of an individual property qualifies as a business combination in accordance with IFRS 3 or as an asset acquisition.
Valuations of real estate assets
Real estate assets, which consist of investment properties and properties under development, are carried on the unaudited condensed combined interim statements of financial position at fair value, as determined by either qualified external valuation professionals or by management. The valuations are based on a number of assumptions, such as appropriate discount rates and capitalization rates and estimates of future rental income, operating expenses and capital expenditures. Valuation of real estate assets is one of the principal estimates and uncertainties of these unaudited condensed combined interim financial statements. Refer to note 4 for further information on estimates and assumptions made in the determination of the fair value of real estate assets.
Leases
The REIT makes judgements in determining whether certain leases, in particular those tenant leases with long contractual terms and long-term ground leases where the REIT is the lessor, are operating or finance leases. The REIT has determined that all of its leases are operating leases.
Income taxes
The REIT is a mutual fund trust and a real estate investment trust pursuant to the Income Tax Act (Canada) (“Tax Act”). Under current tax legislation, the REIT is not liable to pay Canadian income tax provided that its taxable income is fully distributed to unitholders each year. The REIT is a real estate investment trust if it meets prescribed conditions under the Tax Act relating to the nature of its assets and revenue (the "REIT Conditions"). The REIT has reviewed the REIT Conditions and has assessed its interpretation and application to the REIT's assets and revenue, and it has determined that it qualifies as a real estate investment trust pursuant to the Tax Act. The REIT expects to continue to qualify as a real estate investment trust; however, should it no longer qualify it would not be able to flow through its taxable income to unitholders and the REIT would be subject to tax.
H&R REAL ESTATE INVESTMENT TRUST H&R FINANCE TRUST Notes to Unaudited Condensed Combined Interim Financial Statements (In thousands of Canadian dollars, except unit and per unit amounts) For the Three and Nine Months ended September 30, 2014 and 2013
8
1. Basis of preparation (continued):
Tenant improvements
The REIT makes judgements with respect to whether tenant improvements provided in connection with a lease enhance the value of the leased property, which determines whether such amounts are capitalized to investment properties.
Impairment of equity accounted investments
The REIT determines at each reporting date whether there is any objective evidence that the equity accounted investments are impaired. If so, the REIT calculates the amount of impairment as the difference between the recoverable amount of the equity accounted investment and its carrying value and recognizes the amount in net income.
2. Significant accounting policies:
Except as described below, the accounting policies applied by the Trusts in these unaudited condensed combined interim financial statements are the same as those applied by the Trusts in the combined financial statements as at and for the year ended December 31, 2013.
Levies:
Effective January 1, 2014, the REIT has adopted IFRS Interpretations Committee, 21, Levies (“IFRIC 21”). IFRIC 21 provides guidance on accounting for levies in accordance with the requirements of IAS 37, Provisions, Contingent Liabilities and Contingent Assets. For the purposes of IFRIC 21, realty taxes payable by the REIT are considered levies. The adoption of IFRIC 21 requires the REIT to recognize the full amount of annual U.S. realty tax liabilities at the point in time when the realty tax obligation is imposed.
The REIT previously accrued for U.S. property taxes evenly over the year. In accordance with IFRIC 21, the REIT has determined that the liability to pay the U.S. realty taxes should be recognized in full at a single point in time, when the obligating event as stated in the legislation occurs. The impact on these unaudited condensed combined interim financial statements was to recognize the annual U.S. realty tax accrual and corresponding U.S. expense in full in the nine months ended September 30, 2014. The REIT has retrospectively applied the change in accounting policy. There was no impact of the adoption of IFRIC 21 on the unaudited condensed combined interim statements of financial position as at December 31, 2013 and January 1, 2013. The impact of the adoption of IFRIC 21 on the unaudited condensed combined interim statements of comprehensive income for the three months ended September 30, 2013 is to decrease realty taxes expense by $6,232 and decrease fair value adjustment on real estate assets by $6,232. Therefore, there has been no change to net income (loss) and other comprehensive income (loss) for the three months ended September 30, 2013. The impact of the adoption of IFRIC 21 on the unaudited condensed combined interim statements of comprehensive income and cash flows for the nine months ended September 30, 2013 is to increase realty taxes expense by $7,708 and increase fair value adjustment on real estate assets by $7,708. Therefore, there has been no change to net income (loss), other comprehensive income (loss) and cash provided by operations for the nine months ended September 30, 2013.
H&R REAL ESTATE INVESTMENT TRUST H&R FINANCE TRUST Notes to Unaudited Condensed Combined Interim Financial Statements (In thousands of Canadian dollars, except unit and per unit amounts) For the Three and Nine Months ended September 30, 2014 and 2013
9
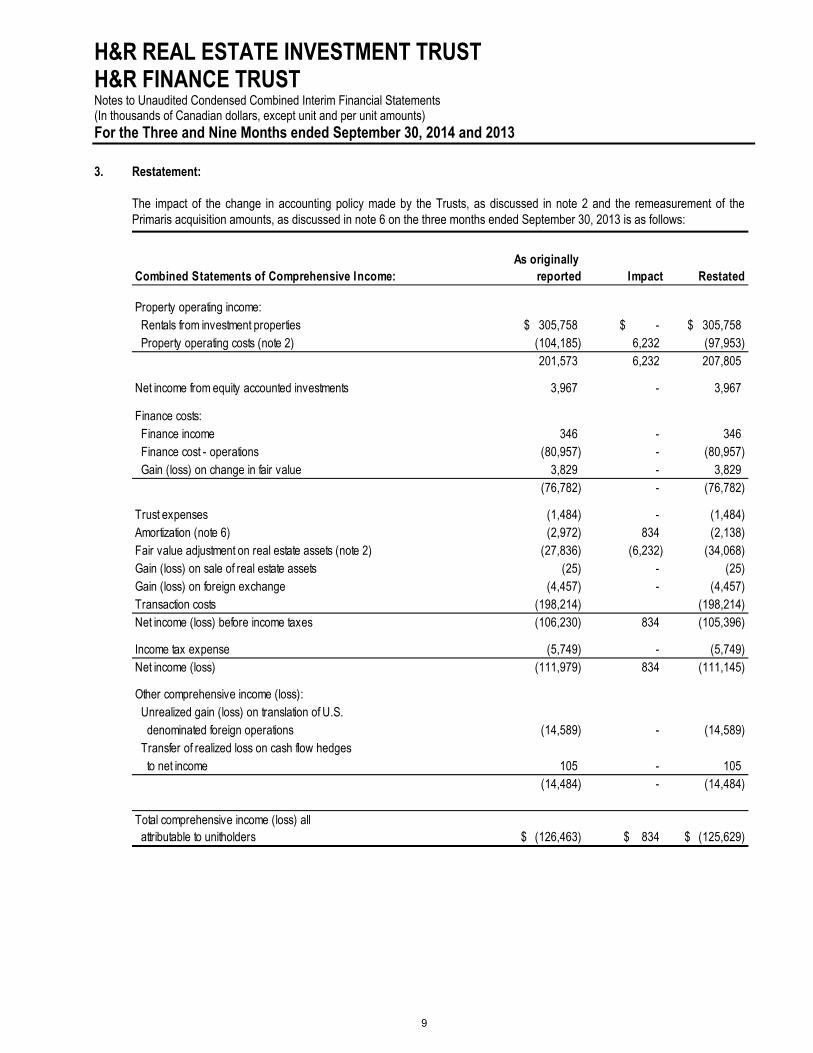
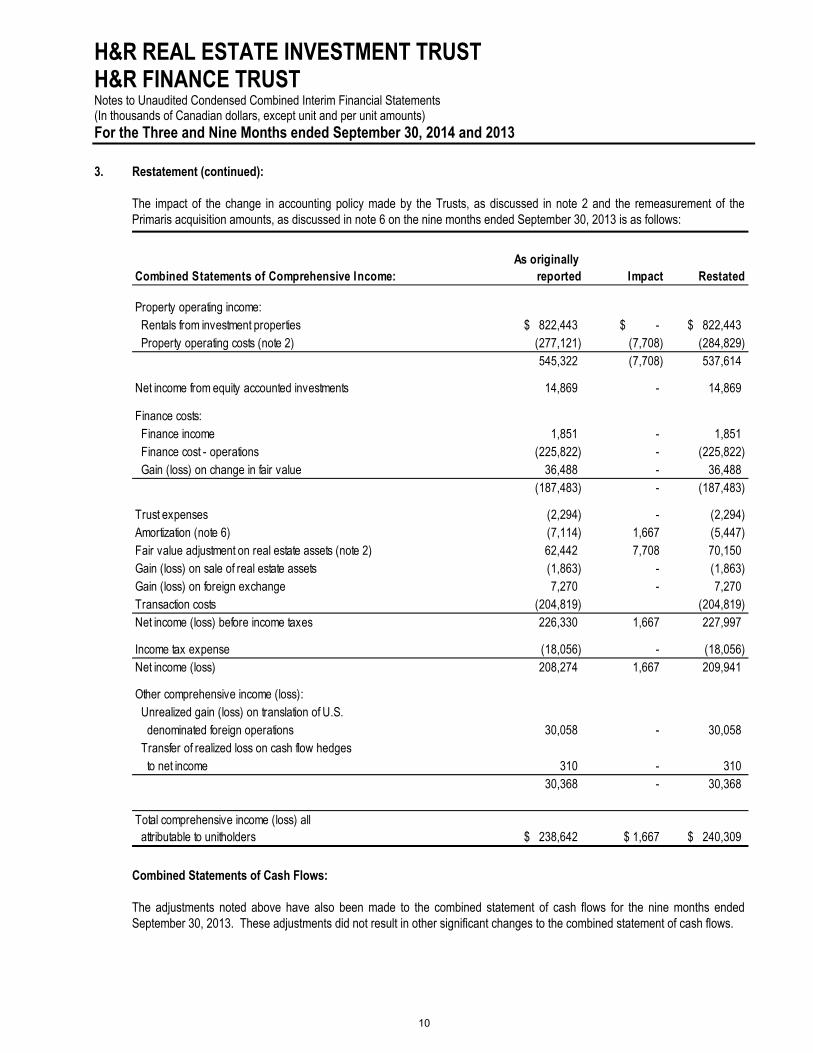
3. Restatement:
The impact of the change in accounting policy made by the Trusts, as discussed in note 2 and the remeasurement of the Primaris acquisition amounts, as discussed in note 6 on the three months ended September 30, 2013 is as follows:
As originally Combined Statements of Comprehensive Income: reported Impact Restated
Property operating income: Rentals from investment properties 305,758 $ $ - 305,758 $ Property operating costs (note 2) (104,185) 6,232 (97,953)
201,573 6,232 207,805
Net income from equity accounted investments 3,967 - 3,967
Finance costs: Finance income 346 - 346 Finance cost - operations (80,957) - (80,957) Gain (loss) on change in fair value 3,829 - 3,829
(76,782) - (76,782)
Trust expenses (1,484) - (1,484) Amortization (note 6) (2,972) 834 (2,138) Fair value adjustment on real estate assets (note 2) (27,836) (6,232) (34,068) Gain (loss) on sale of real estate assets (25) - (25) Gain (loss) on foreign exchange (4,457) - (4,457) Transaction costs (198,214) (198,214) Net income (loss) before income taxes (106,230) 834 (105,396)
Income tax expense (5,749) - (5,749) Net income (loss) (111,979) 834 (111,145)
Other comprehensive income (loss): Unrealized gain (loss) on translation of U.S. denominated foreign operations (14,589) - (14,589) Transfer of realized loss on cash flow hedges to net income 105 - 105
(14,484) - (14,484)
Total comprehensive income (loss) all attributable to unitholders (126,463) $ 834 $ (125,629) $
H&R REAL ESTATE INVESTMENT TRUST H&R FINANCE TRUST Notes to Unaudited Condensed Combined Interim Financial Statements (In thousands of Canadian dollars, except unit and per unit amounts) For the Three and Nine Months ended September 30, 2014 and 2013
10
3. Restatement (continued):
The impact of the change in accounting policy made by the Trusts, as discussed in note 2 and the remeasurement of the Primaris acquisition amounts, as discussed in note 6 on the nine months ended September 30, 2013 is as follows:
As originally Combined Statements of Comprehensive Income: reported Impact Restated
Property operating income: Rentals from investment properties 822,443 $ $ - 822,443 $ Property operating costs (note 2) (277,121) (7,708) (284,829)
545,322 (7,708) 537,614
Net income from equity accounted investments 14,869 - 14,869
Finance costs: Finance income 1,851 - 1,851 Finance cost - operations (225,822) - (225,822) Gain (loss) on change in fair value 36,488 - 36,488
(187,483) - (187,483)
Trust expenses (2,294) - (2,294) Amortization (note 6) (7,114) 1,667 (5,447) Fair value adjustment on real estate assets (note 2) 62,442 7,708 70,150 Gain (loss) on sale of real estate assets (1,863) - (1,863) Gain (loss) on foreign exchange 7,270 - 7,270 Transaction costs (204,819) (204,819) Net income (loss) before income taxes 226,330 1,667 227,997
Income tax expense (18,056) - (18,056) Net income (loss) 208,274 1,667 209,941
Other comprehensive income (loss): Unrealized gain (loss) on translation of U.S. denominated foreign operations 30,058 - 30,058 Transfer of realized loss on cash flow hedges to net income 310 - 310
30,368 - 30,368
Total comprehensive income (loss) all attributable to unitholders 238,642 $ 1,667 $ 240,309 $
Combined Statements of Cash Flows:
The adjustments noted above have also been made to the combined statement of cash flows for the nine months ended September 30, 2013. These adjustments did not result in other significant changes to the combined statement of cash flows.
H&R REAL ESTATE INVESTMENT TRUST H&R FINANCE TRUST Notes to Unaudited Condensed Combined Interim Financial Statements (In thousands of Canadian dollars, except unit and per unit amounts) For the Three and Nine Months ended September 30, 2014 and 2013
11
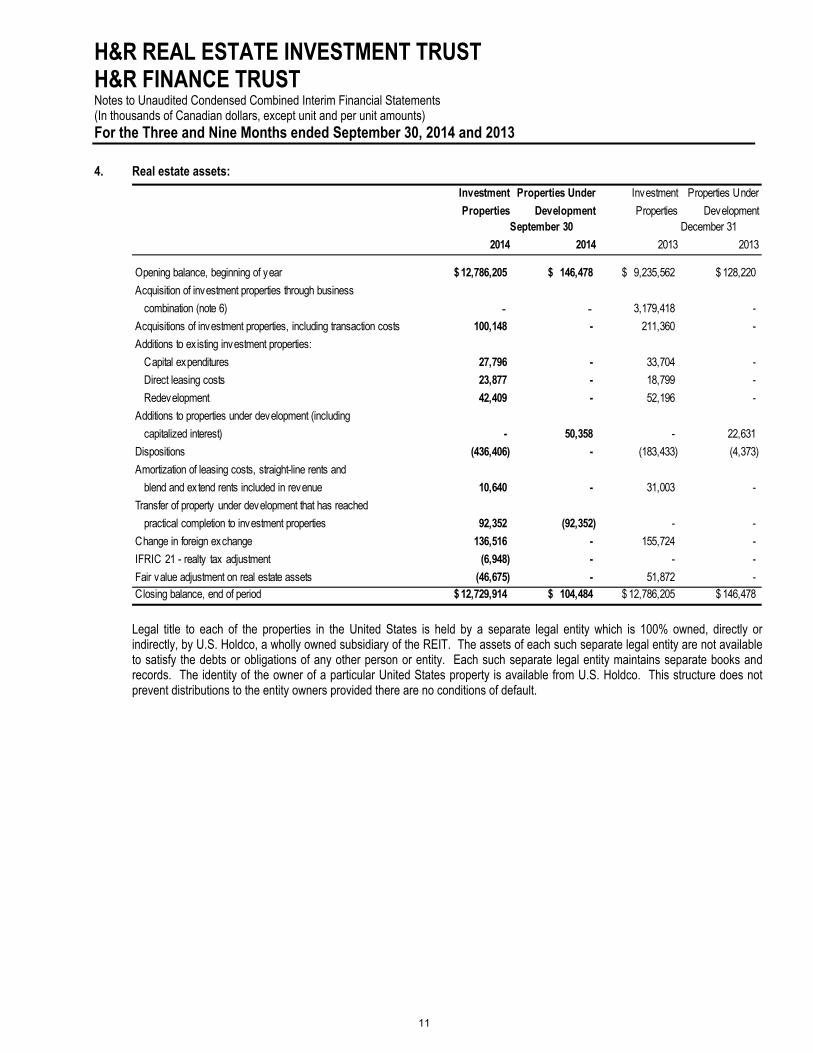
4. Real estate assets:
Investment
Properties
Properties Under
Development
Investment
Properties
Properties Under
Development
2014 2014 2013 2013
Opening balance, beginning of year 12,786,205 $ 146,478 $ 9,235,562 $ 128,220 $
Acquisition of investment properties through business
combination (note 6) - - 3,179,418 -
Acquisitions of investment properties, including transaction costs 100,148 - 211,360 -
Additions to ex isting investment properties:
Capital expenditures 27,796 - 33,704 -
Direct leasing costs 23,877 - 18,799 -
Redevelopment 42,409 - 52,196 -
Additions to properties under development (including
capitalized interest) - 50,358 - 22,631
Dispositions (436,406) - (183,433) (4,373)
Amortization of leasing costs, straight-line rents and
blend and ex tend rents included in revenue 10,640 - 31,003 -
Transfer of property under development that has reached
practical completion to investment properties 92,352 (92,352) - -
Change in foreign exchange 136,516 - 155,724 -
IFRIC 21 - realty tax adjustment (6,948) - - -
Fair value adjustment on real estate assets (46,675) - 51,872 - Closing balance, end of period 12,729,914 $ 104,484 $ 12,786,205 $ 146,478 $
September 30 December 31
Legal title to each of the properties in the United States is held by a separate legal entity which is 100% owned, directly or indirectly, by U.S. Holdco, a wholly owned subsidiary of the REIT. The assets of each such separate legal entity are not available to satisfy the debts or obligations of any other person or entity. Each such separate legal entity maintains separate books and records. The identity of the owner of a particular United States property is available from U.S. Holdco. This structure does not prevent distributions to the entity owners provided there are no conditions of default.
H&R REAL ESTATE INVESTMENT TRUST H&R FINANCE TRUST Notes to Unaudited Condensed Combined Interim Financial Statements (In thousands of Canadian dollars, except unit and per unit amounts) For the Three and Nine Months ended September 30, 2014 and 2013
12
4. Real estate assets (continued):
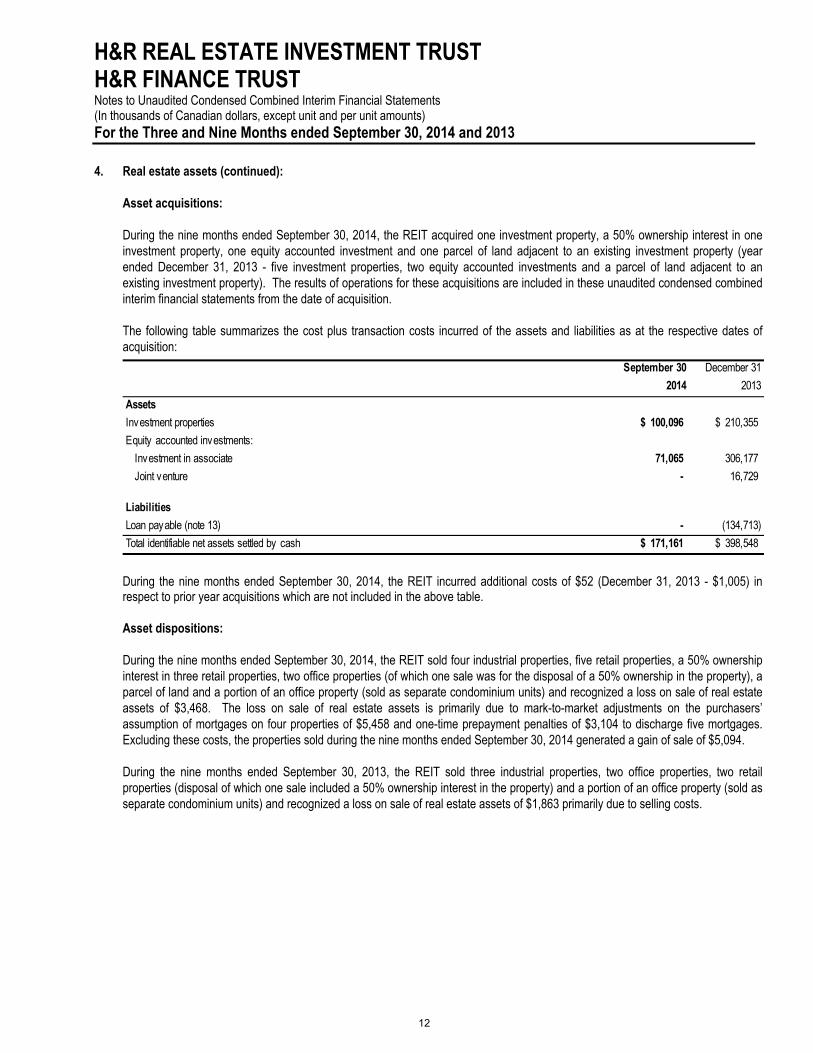
Asset acquisitions:
During the nine months ended September 30, 2014, the REIT acquired one investment property, a 50% ownership interest in one investment property, one equity accounted investment and one parcel of land adjacent to an existing investment property (year ended December 31, 2013 - five investment properties, two equity accounted investments and a parcel of land adjacent to an existing investment property). The results of operations for these acquisitions are included in these unaudited condensed combined interim financial statements from the date of acquisition.
The following table summarizes the cost plus transaction costs incurred of the assets and liabilities as at the respective dates of acquisition:
September 30 December 31
2014 2013
Assets
Investment properties 100,096 $ 210,355 $
Equity accounted investments:
Investment in associate 71,065 306,177
Joint venture - 16,729
Liabilities
Loan payable (note 13) - (134,713)
Total identifiable net assets settled by cash 171,161 $ 398,548 $
During the nine months ended September 30, 2014, the REIT incurred additional costs of $52 (December 31, 2013 - $1,005) in respect to prior year acquisitions which are not included in the above table.
Asset dispositions:
During the nine months ended September 30, 2014, the REIT sold four industrial properties, five retail properties, a 50% ownership interest in three retail properties, two office properties (of which one sale was for the disposal of a 50% ownership in the property), a parcel of land and a portion of an office property (sold as separate condominium units) and recognized a loss on sale of real estate assets of $3,468. The loss on sale of real estate assets is primarily due to mark-to-market adjustments on the purchasers’ assumption of mortgages on four properties of $5,458 and one-time prepayment penalties of $3,104 to discharge five mortgages. Excluding these costs, the properties sold during the nine months ended September 30, 2014 generated a gain of sale of $5,094.
During the nine months ended September 30, 2013, the REIT sold three industrial properties, two office properties, two retail properties (disposal of which one sale included a 50% ownership interest in the property) and a portion of an office property (sold as separate condominium units) and recognized a loss on sale of real estate assets of $1,863 primarily due to selling costs.
H&R REAL ESTATE INVESTMENT TRUST H&R FINANCE TRUST Notes to Unaudited Condensed Combined Interim Financial Statements (In thousands of Canadian dollars, except unit and per unit amounts) For the Three and Nine Months ended September 30, 2014 and 2013
13
4. Real estate assets (continued):
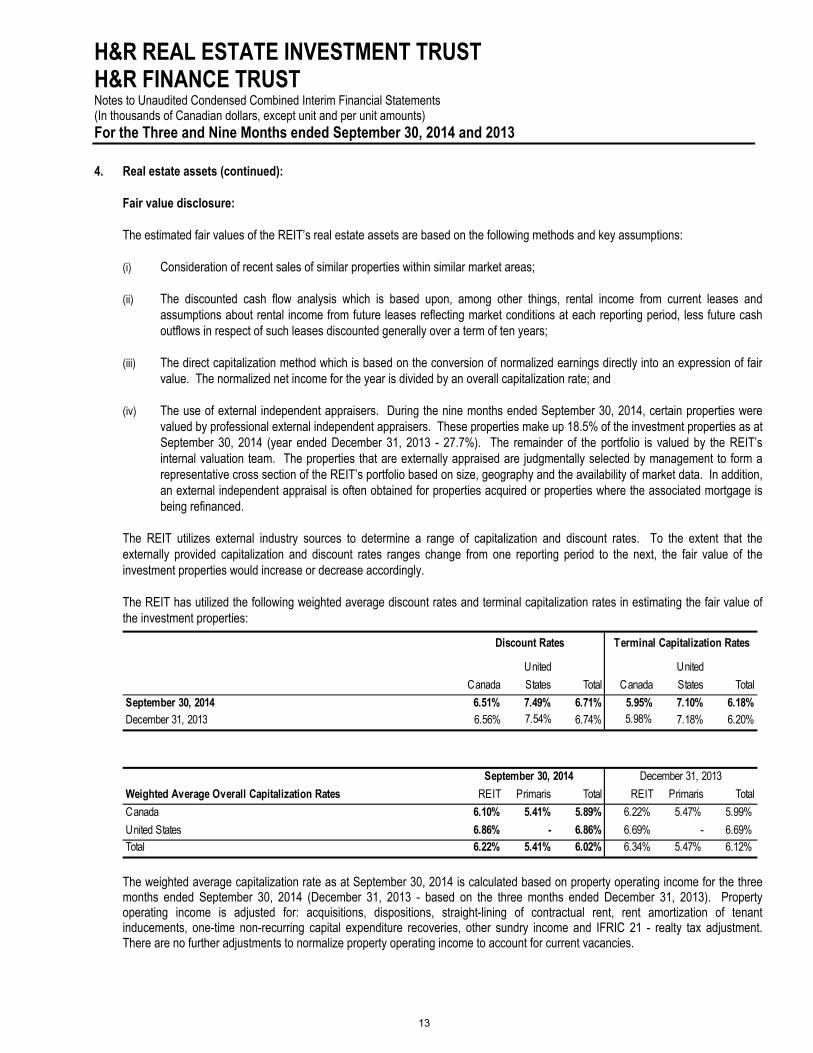
Fair value disclosure:
The estimated fair values of the REIT’s real estate assets are based on the following methods and key assumptions:
(i) Consideration of recent sales of similar properties within similar market areas;
(ii) The discounted cash flow analysis which is based upon, among other things, rental income from current leases and assumptions about rental income from future leases reflecting market conditions at each reporting period, less future cash outflows in respect of such leases discounted generally over a term of ten years;
(iii) The direct capitalization method which is based on the conversion of normalized earnings directly into an expression of fair value. The normalized net income for the year is divided by an overall capitalization rate; and
(iv) The use of external independent appraisers. During the nine months ended September 30, 2014, certain properties were valued by professional external independent appraisers. These properties make up 18.5% of the investment properties as at September 30, 2014 (year ended December 31, 2013 - 27.7%). The remainder of the portfolio is valued by the REIT’s internal valuation team. The properties that are externally appraised are judgmentally selected by management to form a representative cross section of the REIT’s portfolio based on size, geography and the availability of market data. In addition, an external independent appraisal is often obtained for properties acquired or properties where the associated mortgage is being refinanced.
The REIT utilizes external industry sources to determine a range of capitalization and discount rates. To the extent that the externally provided capitalization and discount rates ranges change from one reporting period to the next, the fair value of the investment properties would increase or decrease accordingly.
The REIT has utilized the following weighted average discount rates and terminal capitalization rates in estimating the fair value of the investment properties:
Canada
United
States Total Canada
United
States Total
September 30, 2014 6.51% 7.49% 6.71% 5.95% 7.10% 6.18%December 31, 2013 6.56% 7.54% 6.74% 5.98% 7.18% 6.20%
Terminal Capitalization Rates Discount Rates
Weighted Average Overall Capitalization Rates REIT Primaris Total REIT Primaris Total
Canada 6.10% 5.41% 5.89% 6.22% 5.47% 5.99%
United States 6.86% - 6.86% 6.69% - 6.69%Total 6.22% 5.41% 6.02% 6.34% 5.47% 6.12%
September 30, 2014 December 31, 2013
The weighted average capitalization rate as at September 30, 2014 is calculated based on property operating income for the three months ended September 30, 2014 (December 31, 2013 - based on the three months ended December 31, 2013). Property operating income is adjusted for: acquisitions, dispositions, straight-lining of contractual rent, rent amortization of tenant inducements, one-time non-recurring capital expenditure recoveries, other sundry income and IFRIC 21 - realty tax adjustment. There are no further adjustments to normalize property operating income to account for current vacancies.
H&R REAL ESTATE INVESTMENT TRUST H&R FINANCE TRUST Notes to Unaudited Condensed Combined Interim Financial Statements (In thousands of Canadian dollars, except unit and per unit amounts) For the Three and Nine Months ended September 30, 2014 and 2013
14
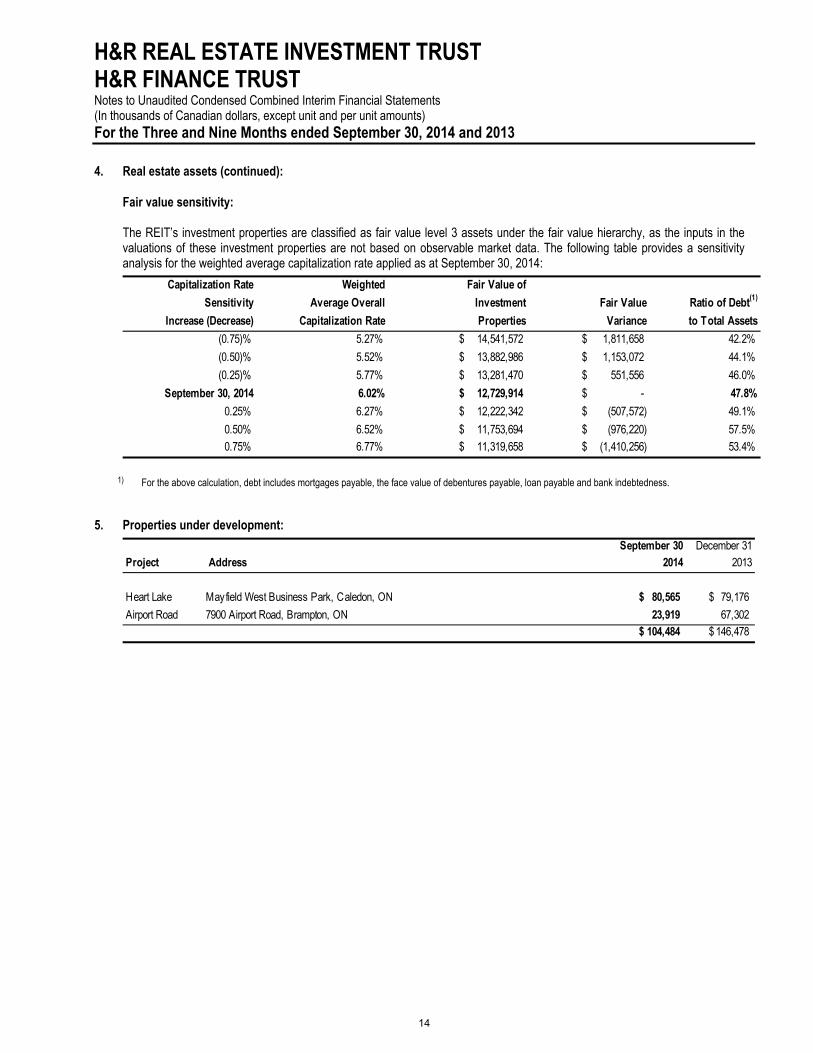
4. Real estate assets (continued):
Fair value sensitivity: The REIT’s investment properties are classified as fair value level 3 assets under the fair value hierarchy, as the inputs in the valuations of these investment properties are not based on observable market data. The following table provides a sensitivity analysis for the weighted average capitalization rate applied as at September 30, 2014:
Capitalization Rate
Sensitivity
Increase (Decrease)
Weighted
Average Overall
Capitalization Rate
Fair Value of
Investment
Properties
Fair Value
Variance
Ratio of Debt(1)
to Total Assets
(0.75)% 5.27% 14,541,572 $ 1,811,658 $ 42.2%
(0.50)% 5.52% 13,882,986 $ 1,153,072 $ 44.1%
(0.25)% 5.77% 13,281,470 $ 551,556 $ 46.0%
September 30, 2014 6.02% 12,729,914 $ - $ 47.8%
0.25% 6.27% 12,222,342 $ (507,572) $ 49.1%
0.50% 6.52% 11,753,694 $ (976,220) $ 57.5%0.75% 6.77% 11,319,658 $ (1,410,256) $ 53.4%
1) For the above calculation, debt includes mortgages payable, the face value of debentures payable, loan payable and bank indebtedness.
5. Properties under development:
September 30 December 31Project Address 2014 2013
Heart Lake Mayfield West Business Park, Caledon, ON 80,565 $ 79,176 $
Airport Road 7900 Airport Road, Brampton, ON 23,919 67,302 104,484 $ 146,478 $
H&R REAL ESTATE INVESTMENT TRUST H&R FINANCE TRUST Notes to Unaudited Condensed Combined Interim Financial Statements (In thousands of Canadian dollars, except unit and per unit amounts) For the Three and Nine Months ended September 30, 2014 and 2013
15
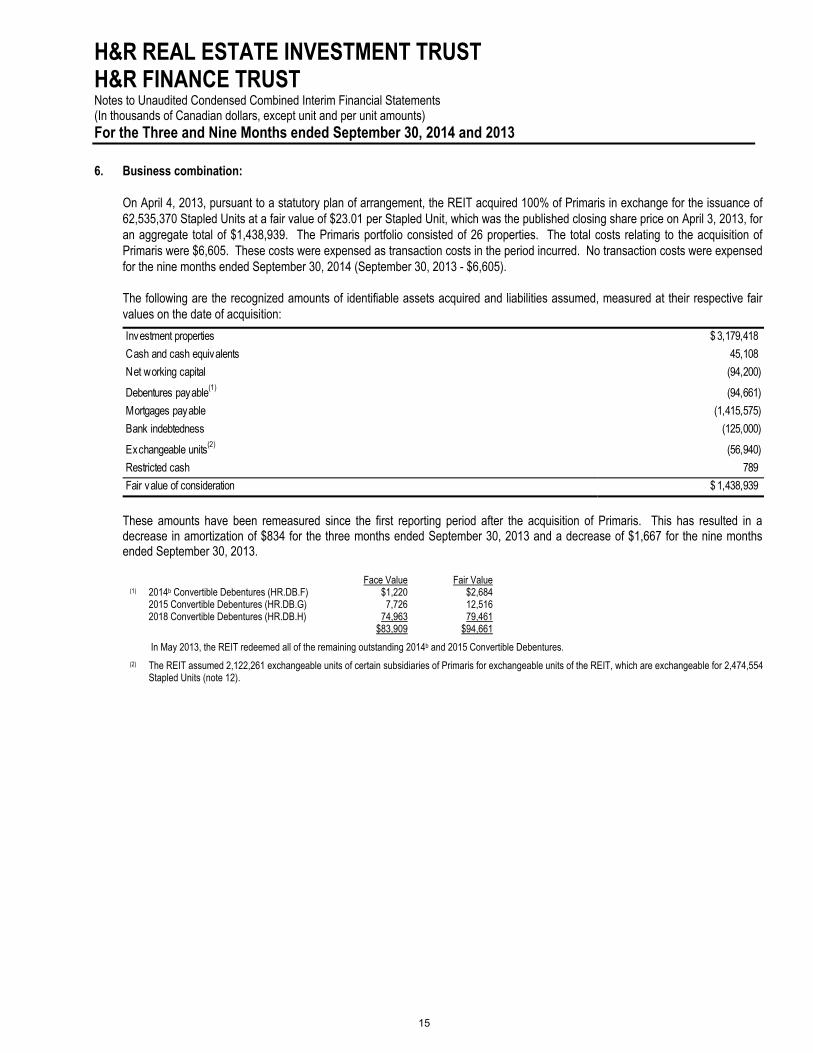
6. Business combination:
On April 4, 2013, pursuant to a statutory plan of arrangement, the REIT acquired 100% of Primaris in exchange for the issuance of 62,535,370 Stapled Units at a fair value of $23.01 per Stapled Unit, which was the published closing share price on April 3, 2013, for an aggregate total of $1,438,939. The Primaris portfolio consisted of 26 properties. The total costs relating to the acquisition of Primaris were $6,605. These costs were expensed as transaction costs in the period incurred. No transaction costs were expensed for the nine months ended September 30, 2014 (September 30, 2013 - $6,605).
The following are the recognized amounts of identifiable assets acquired and liabilities assumed, measured at their respective fair values on the date of acquisition:
Investment properties 3,179,418 $
Cash and cash equivalents 45,108
Net working capital (94,200)
Debentures payable(1) (94,661)
Mortgages payable (1,415,575)
Bank indebtedness (125,000)
Exchangeable units(2) (56,940)
Restricted cash 789
Fair value of consideration 1,438,939 $
These amounts have been remeasured since the first reporting period after the acquisition of Primaris. This has resulted in a decrease in amortization of $834 for the three months ended September 30, 2013 and a decrease of $1,667 for the nine months ended September 30, 2013.
Face Value Fair Value (1) 2014b Convertible Debentures (HR.DB.F) $1,220 $2,684 2015 Convertible Debentures (HR.DB.G) 7,726 12,516 2018 Convertible Debentures (HR.DB.H) 74,963 79,461 $83,909 $94,661
In May 2013, the REIT redeemed all of the remaining outstanding 2014b and 2015 Convertible Debentures.
(2) The REIT assumed 2,122,261 exchangeable units of certain subsidiaries of Primaris for exchangeable units of the REIT, which are exchangeable for 2,474,554 Stapled Units (note 12).
H&R REAL ESTATE INVESTMENT TRUST H&R FINANCE TRUST Notes to Unaudited Condensed Combined Interim Financial Statements (In thousands of Canadian dollars, except unit and per unit amounts) For the Three and Nine Months ended September 30, 2014 and 2013
16
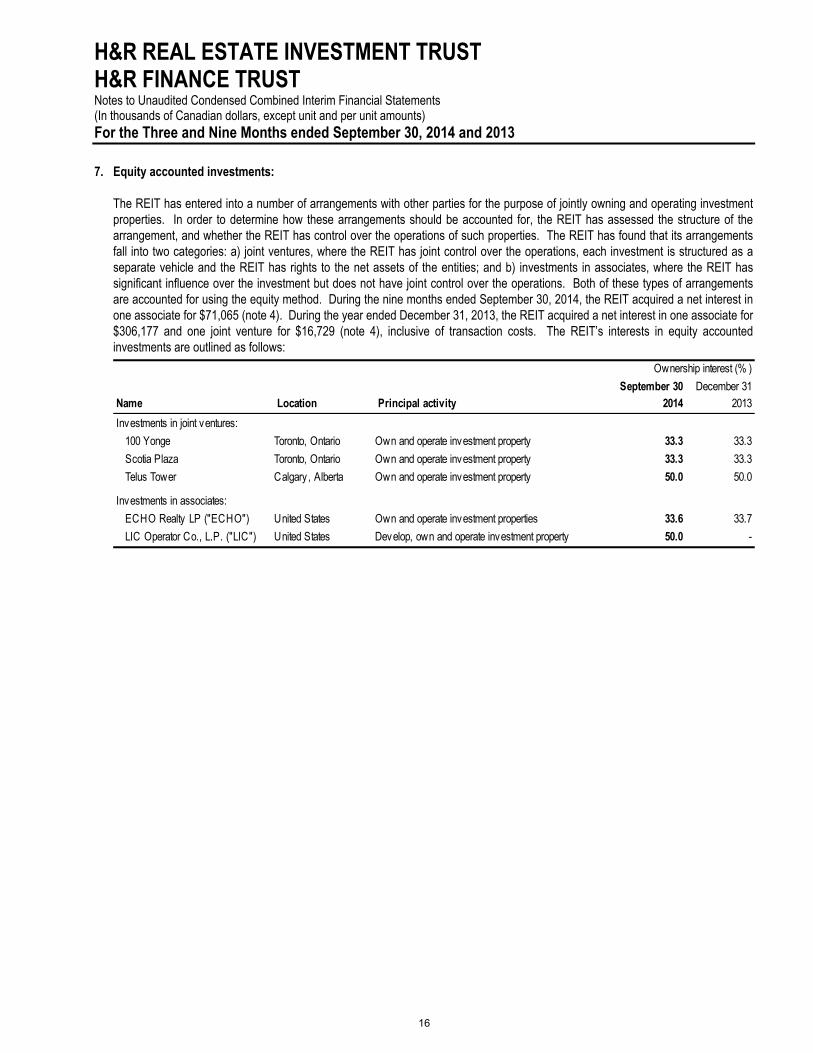
7. Equity accounted investments:
The REIT has entered into a number of arrangements with other parties for the purpose of jointly owning and operating investment properties. In order to determine how these arrangements should be accounted for, the REIT has assessed the structure of the arrangement, and whether the REIT has control over the operations of such properties. The REIT has found that its arrangements fall into two categories: a) joint ventures, where the REIT has joint control over the operations, each investment is structured as a separate vehicle and the REIT has rights to the net assets of the entities; and b) investments in associates, where the REIT has significant influence over the investment but does not have joint control over the operations. Both of these types of arrangements are accounted for using the equity method. During the nine months ended September 30, 2014, the REIT acquired a net interest in one associate for $71,065 (note 4). During the year ended December 31, 2013, the REIT acquired a net interest in one associate for $306,177 and one joint venture for $16,729 (note 4), inclusive of transaction costs. The REIT’s interests in equity accounted investments are outlined as follows:
September 30 December 31Name Location Principal activity 2014 2013
Investments in joint ventures:
100 Yonge Toronto, Ontario Own and operate investment property 33.3 33.3
Scotia Plaza Toronto, Ontario Own and operate investment property 33.3 33.3
Telus Tower Calgary, Alberta Own and operate investment property 50.0 50.0
Investments in associates:
ECHO Realty LP ("ECHO") United States Own and operate investment properties 33.6 33.7
LIC Operator Co., L.P. ("LIC") United States Develop, own and operate investment property 50.0 -
Ownership interest (% )
H&R REAL ESTATE INVESTMENT TRUST H&R FINANCE TRUST Notes to Unaudited Condensed Combined Interim Financial Statements (In thousands of Canadian dollars, except unit and per unit amounts) For the Three and Nine Months ended September 30, 2014 and 2013
17
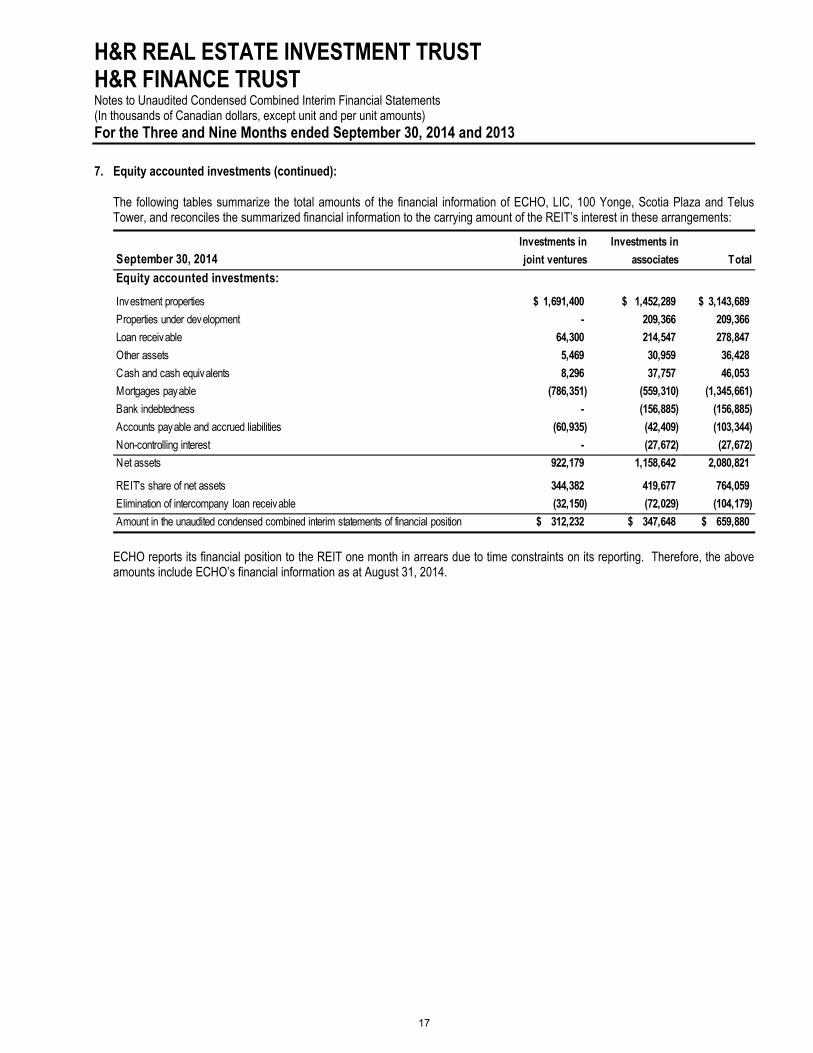
7. Equity accounted investments (continued): The following tables summarize the total amounts of the financial information of ECHO, LIC, 100 Yonge, Scotia Plaza and Telus Tower, and reconciles the summarized financial information to the carrying amount of the REIT’s interest in these arrangements:
September 30, 2014Investments in
joint ventures
Investments in
associates Total
Equity accounted investments:
Investment properties 1,691,400 $ 1,452,289 $ 3,143,689 $
Properties under development - 209,366 209,366
Loan receivable 64,300 214,547 278,847
Other assets 5,469 30,959 36,428
Cash and cash equivalents 8,296 37,757 46,053
Mortgages payable (786,351) (559,310) (1,345,661)
Bank indebtedness - (156,885) (156,885)
Accounts payable and accrued liabilities (60,935) (42,409) (103,344)
Non-controlling interest - (27,672) (27,672)
Net assets 922,179 1,158,642 2,080,821
REIT's share of net assets 344,382 419,677 764,059
Elimination of intercompany loan receivable (32,150) (72,029) (104,179)
Amount in the unaudited condensed combined interim statements of financial position 312,232 $ 347,648 $ 659,880 $
ECHO reports its financial position to the REIT one month in arrears due to time constraints on its reporting. Therefore, the above amounts include ECHO’s financial information as at August 31, 2014.
H&R REAL ESTATE INVESTMENT TRUST H&R FINANCE TRUST Notes to Unaudited Condensed Combined Interim Financial Statements (In thousands of Canadian dollars, except unit and per unit amounts) For the Three and Nine Months ended September 30, 2014 and 2013
18
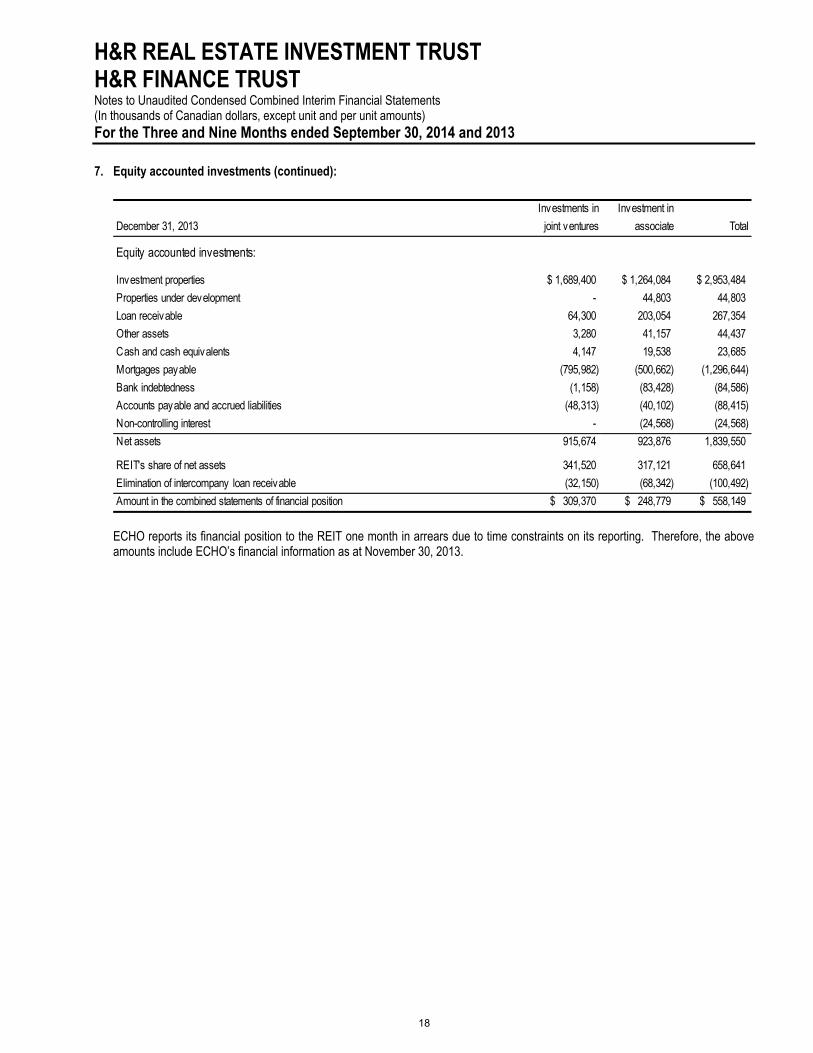
7. Equity accounted investments (continued):
December 31, 2013
Investments in
joint ventures
Investment in
associate Total
Equity accounted investments:
Investment properties 1,689,400 $ 1,264,084 $ 2,953,484 $
Properties under development - 44,803 44,803
Loan receivable 64,300 203,054 267,354
Other assets 3,280 41,157 44,437
Cash and cash equivalents 4,147 19,538 23,685
Mortgages payable (795,982) (500,662) (1,296,644)
Bank indebtedness (1,158) (83,428) (84,586)
Accounts payable and accrued liabilities (48,313) (40,102) (88,415)
Non-controlling interest - (24,568) (24,568)
Net assets 915,674 923,876 1,839,550
REIT's share of net assets 341,520 317,121 658,641
Elimination of intercompany loan receivable (32,150) (68,342) (100,492)
Amount in the combined statements of financial position 309,370 $ 248,779 $ 558,149 $
ECHO reports its financial position to the REIT one month in arrears due to time constraints on its reporting. Therefore, the above amounts include ECHO’s financial information as at November 30, 2013.
H&R REAL ESTATE INVESTMENT TRUST H&R FINANCE TRUST Notes to Unaudited Condensed Combined Interim Financial Statements (In thousands of Canadian dollars, except unit and per unit amounts) For the Three and Nine Months ended September 30, 2014 and 2013
19
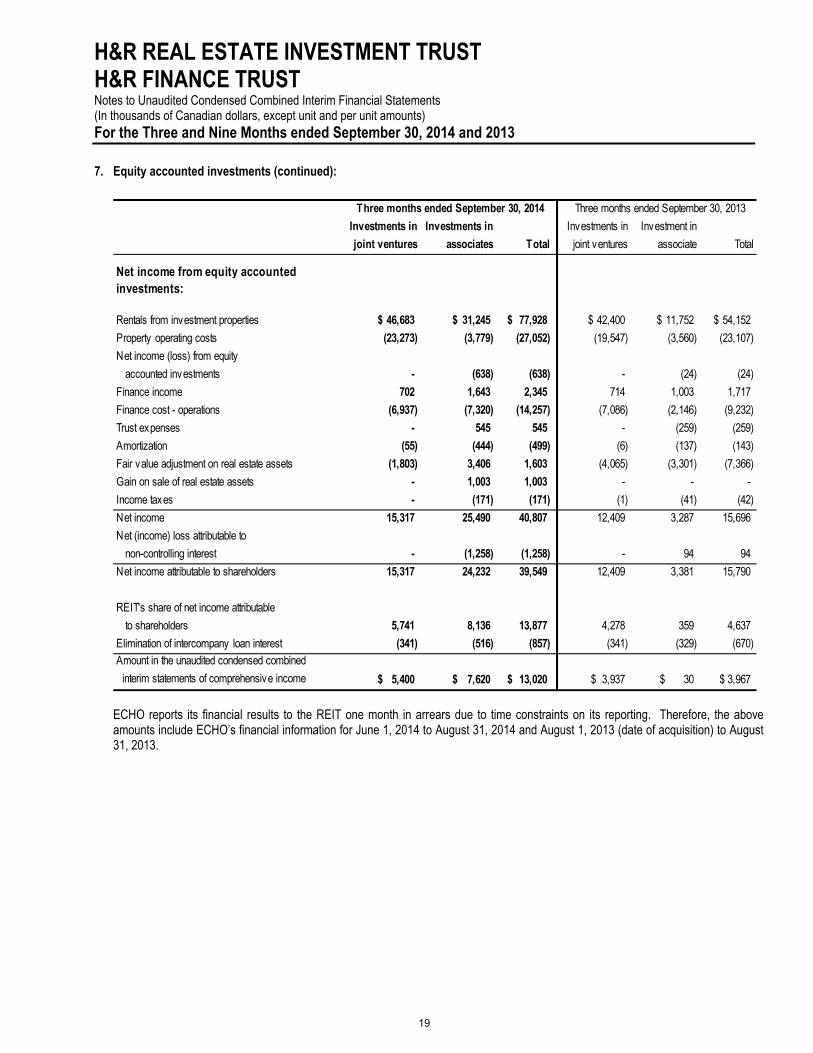
7. Equity accounted investments (continued):
Investments in
joint ventures
Investments in
associates Total
Investments in
joint ventures
Investment in
associate Total
Net income from equity accounted investments:
Rentals from investment properties 46,683 $ 31,245 $ 77,928 $ 42,400 $ 11,752 $ 54,152 $
Property operating costs (23,273) (3,779) (27,052) (19,547) (3,560) (23,107)
Net income (loss) from equity
accounted investments - (638) (638) - (24) (24)
Finance income 702 1,643 2,345 714 1,003 1,717
Finance cost - operations (6,937) (7,320) (14,257) (7,086) (2,146) (9,232)
Trust expenses - 545 545 - (259) (259)
Amortization (55) (444) (499) (6) (137) (143)
Fair value adjustment on real estate assets (1,803) 3,406 1,603 (4,065) (3,301) (7,366)
Gain on sale of real estate assets - 1,003 1,003 - - -
Income taxes - (171) (171) (1) (41) (42)
Net income 15,317 25,490 40,807 12,409 3,287 15,696
Net (income) loss attributable to
non-controlling interest - (1,258) (1,258) - 94 94
Net income attributable to shareholders 15,317 24,232 39,549 12,409 3,381 15,790
REIT's share of net income attributable
to shareholders 5,741 8,136 13,877 4,278 359 4,637
Elimination of intercompany loan interest (341) (516) (857) (341) (329) (670) Amount in the unaudited condensed combined
interim statements of comprehensive income 5,400 $ 7,620 $ 13,020 $ 3,937 $ 30 $ 3,967 $
Three months ended September 30, 2014 Three months ended September 30, 2013
ECHO reports its financial results to the REIT one month in arrears due to time constraints on its reporting. Therefore, the above amounts include ECHO’s financial information for June 1, 2014 to August 31, 2014 and August 1, 2013 (date of acquisition) to August 31, 2013.
H&R REAL ESTATE INVESTMENT TRUST H&R FINANCE TRUST Notes to Unaudited Condensed Combined Interim Financial Statements (In thousands of Canadian dollars, except unit and per unit amounts) For the Three and Nine Months ended September 30, 2014 and 2013
20
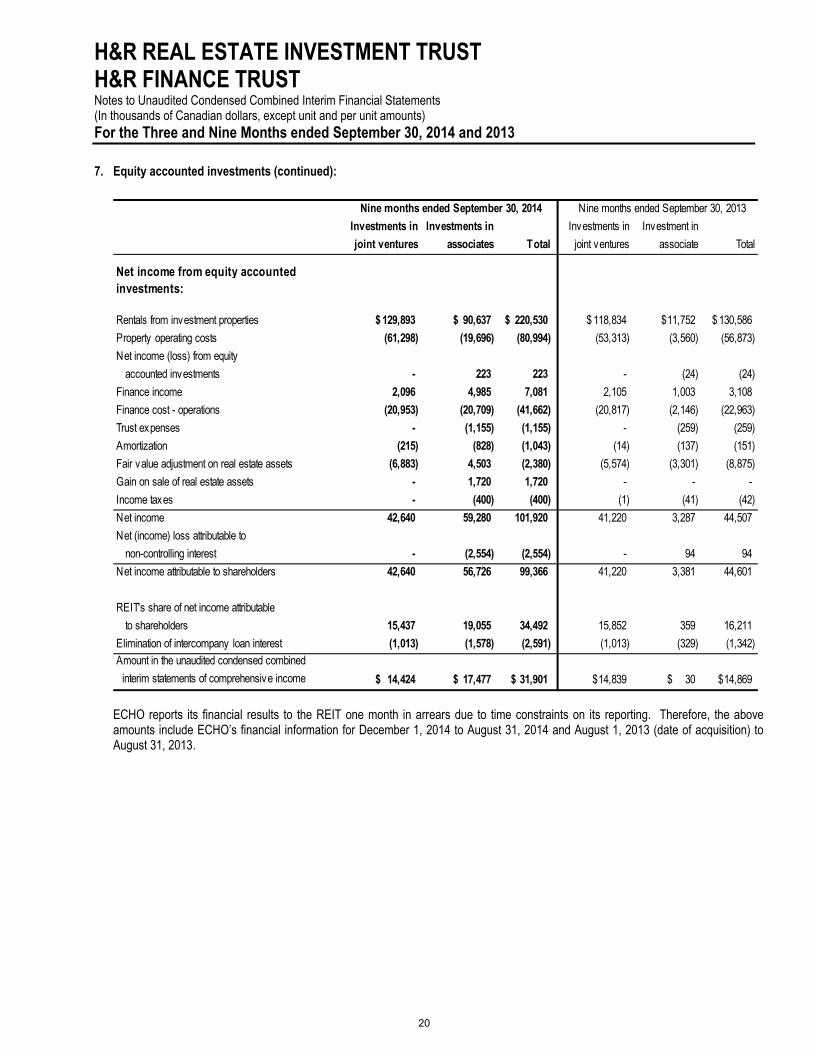
7. Equity accounted investments (continued):
Investments in
joint ventures
Investments in
associates Total
Investments in
joint ventures
Investment in
associate Total
Net income from equity accounted investments:
Rentals from investment properties 129,893 $ 90,637 $ 220,530 $ 118,834 $ 11,752 $ 130,586 $
Property operating costs (61,298) (19,696) (80,994) (53,313) (3,560) (56,873)
Net income (loss) from equity
accounted investments - 223 223 - (24) (24)
Finance income 2,096 4,985 7,081 2,105 1,003 3,108
Finance cost - operations (20,953) (20,709) (41,662) (20,817) (2,146) (22,963)
Trust expenses - (1,155) (1,155) - (259) (259)
Amortization (215) (828) (1,043) (14) (137) (151)
Fair value adjustment on real estate assets (6,883) 4,503 (2,380) (5,574) (3,301) (8,875)
Gain on sale of real estate assets - 1,720 1,720 - - -
Income taxes - (400) (400) (1) (41) (42)
Net income 42,640 59,280 101,920 41,220 3,287 44,507
Net (income) loss attributable to
non-controlling interest - (2,554) (2,554) - 94 94
Net income attributable to shareholders 42,640 56,726 99,366 41,220 3,381 44,601
REIT's share of net income attributable
to shareholders 15,437 19,055 34,492 15,852 359 16,211
Elimination of intercompany loan interest (1,013) (1,578) (2,591) (1,013) (329) (1,342) Amount in the unaudited condensed combined
interim statements of comprehensive income 14,424 $ 17,477 $ 31,901 $ 14,839 $ 30 $ 14,869 $
Nine months ended September 30, 2014 Nine months ended September 30, 2013
ECHO reports its financial results to the REIT one month in arrears due to time constraints on its reporting. Therefore, the above amounts include ECHO’s financial information for December 1, 2014 to August 31, 2014 and August 1, 2013 (date of acquisition) to August 31, 2013.
H&R REAL ESTATE INVESTMENT TRUST H&R FINANCE TRUST Notes to Unaudited Condensed Combined Interim Financial Statements (In thousands of Canadian dollars, except unit and per unit amounts) For the Three and Nine Months ended September 30, 2014 and 2013
21
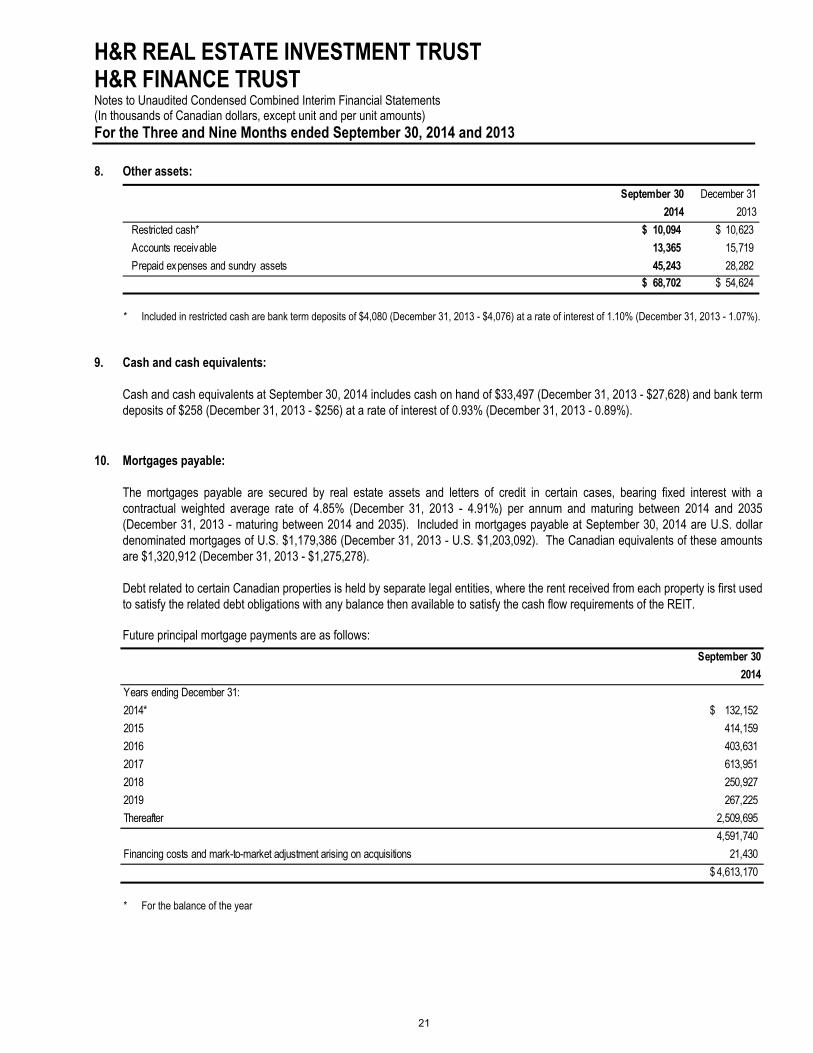
8. Other assets:
September 30 December 31
2014 2013
Restricted cash* 10,094 $ 10,623 $
Accounts receivable 13,365 15,719
Prepaid expenses and sundry assets 45,243 28,282 68,702 $ 54,624 $
* Included in restricted cash are bank term deposits of $4,080 (December 31, 2013 - $4,076) at a rate of interest of 1.10% (December 31, 2013 - 1.07%).
9. Cash and cash equivalents:
Cash and cash equivalents at September 30, 2014 includes cash on hand of $33,497 (December 31, 2013 - $27,628) and bank term deposits of $258 (December 31, 2013 - $256) at a rate of interest of 0.93% (December 31, 2013 - 0.89%).
10. Mortgages payable:
The mortgages payable are secured by real estate assets and letters of credit in certain cases, bearing fixed interest with a contractual weighted average rate of 4.85% (December 31, 2013 - 4.91%) per annum and maturing between 2014 and 2035 (December 31, 2013 - maturing between 2014 and 2035). Included in mortgages payable at September 30, 2014 are U.S. dollar denominated mortgages of U.S. $1,179,386 (December 31, 2013 - U.S. $1,203,092). The Canadian equivalents of these amounts are $1,320,912 (December 31, 2013 - $1,275,278).
Debt related to certain Canadian properties is held by separate legal entities, where the rent received from each property is first used to satisfy the related debt obligations with any balance then available to satisfy the cash flow requirements of the REIT. Future principal mortgage payments are as follows:
September 30
2014
Years ending December 31:
2014* 132,152 $
2015 414,159
2016 403,631
2017 613,951
2018 250,927
2019 267,225
Thereafter 2,509,695
4,591,740
Financing costs and mark-to-market adjustment arising on acquisitions 21,430
4,613,170 $
* For the balance of the year
H&R REAL ESTATE INVESTMENT TRUST H&R FINANCE TRUST Notes to Unaudited Condensed Combined Interim Financial Statements (In thousands of Canadian dollars, except unit and per unit amounts) For the Three and Nine Months ended September 30, 2014 and 2013
22
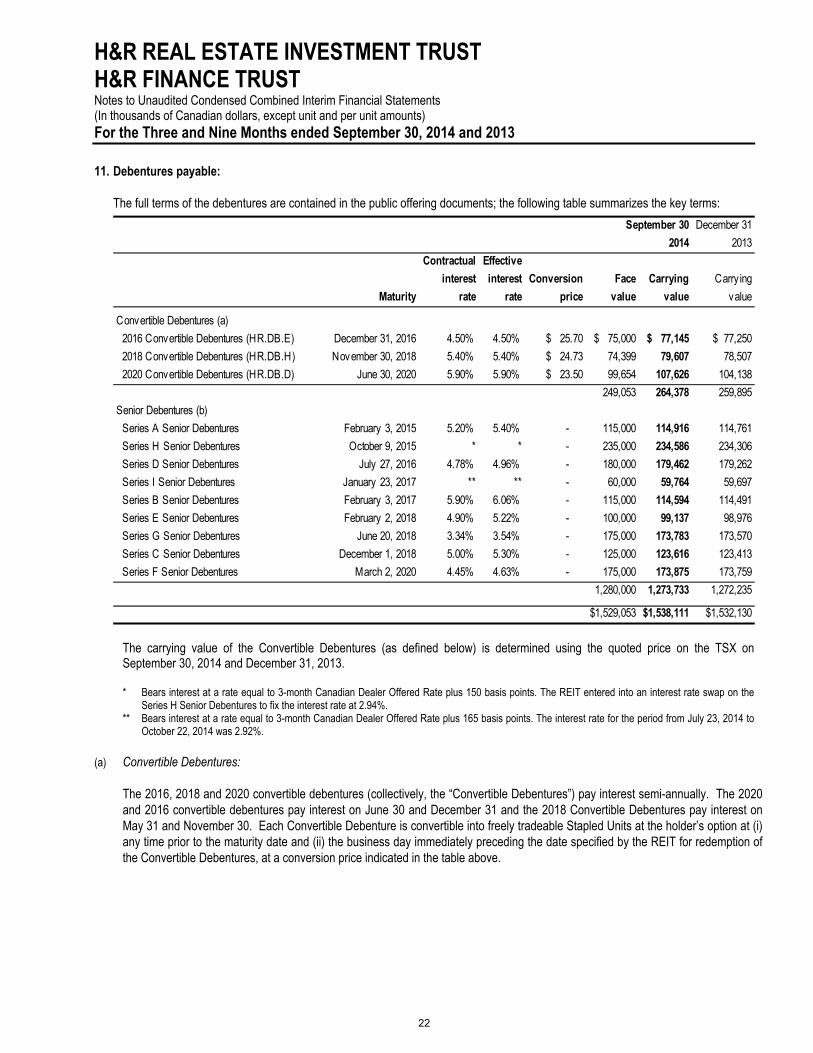
11. Debentures payable:
The full terms of the debentures are contained in the public offering documents; the following table summarizes the key terms:
September 30 December 31
2014 2013
Maturity
Contractual
interest
rate
Effective
interest
rate
Conversion
price
Face
value
Carrying
value
Carry ing
value
Convertible Debentures (a)
2016 Convertible Debentures (HR.DB.E) December 31, 2016 4.50% 4.50% $ 25.70 $ 75,000 $ 77,145 $ 77,250
2018 Convertible Debentures (HR.DB.H) November 30, 2018 5.40% 5.40% $ 24.73 74,399 79,607 78,507
2020 Convertible Debentures (HR.DB.D) June 30, 2020 5.90% 5.90% $ 23.50 99,654 107,626 104,138
249,053 264,378 259,895
Senior Debentures (b)
Series A Senior Debentures February 3, 2015 5.20% 5.40% - 115,000 114,916 114,761
Series H Senior Debentures October 9, 2015 * * - 235,000 234,586 234,306
Series D Senior Debentures July 27, 2016 4.78% 4.96% - 180,000 179,462 179,262
Series I Senior Debentures January 23, 2017 ** ** - 60,000 59,764 59,697
Series B Senior Debentures February 3, 2017 5.90% 6.06% - 115,000 114,594 114,491
Series E Senior Debentures February 2, 2018 4.90% 5.22% - 100,000 99,137 98,976
Series G Senior Debentures June 20, 2018 3.34% 3.54% - 175,000 173,783 173,570
Series C Senior Debentures December 1, 2018 5.00% 5.30% - 125,000 123,616 123,413
Series F Senior Debentures March 2, 2020 4.45% 4.63% - 175,000 173,875 173,759
1,280,000 1,273,733 1,272,235
$1,529,053 $1,538,111 $1,532,130
The carrying value of the Convertible Debentures (as defined below) is determined using the quoted price on the TSX on September 30, 2014 and December 31, 2013. * Bears interest at a rate equal to 3-month Canadian Dealer Offered Rate plus 150 basis points. The REIT entered into an interest rate swap on the
Series H Senior Debentures to fix the interest rate at 2.94%. ** Bears interest at a rate equal to 3-month Canadian Dealer Offered Rate plus 165 basis points. The interest rate for the period from July 23, 2014 to
October 22, 2014 was 2.92%.
(a) Convertible Debentures:
The 2016, 2018 and 2020 convertible debentures (collectively, the “Convertible Debentures”) pay interest semi-annually. The 2020 and 2016 convertible debentures pay interest on June 30 and December 31 and the 2018 Convertible Debentures pay interest on May 31 and November 30. Each Convertible Debenture is convertible into freely tradeable Stapled Units at the holder’s option at (i) any time prior to the maturity date and (ii) the business day immediately preceding the date specified by the REIT for redemption of the Convertible Debentures, at a conversion price indicated in the table above.
H&R REAL ESTATE INVESTMENT TRUST H&R FINANCE TRUST Notes to Unaudited Condensed Combined Interim Financial Statements (In thousands of Canadian dollars, except unit and per unit amounts) For the Three and Nine Months ended September 30, 2014 and 2013
23
11. Debentures payable (continued):
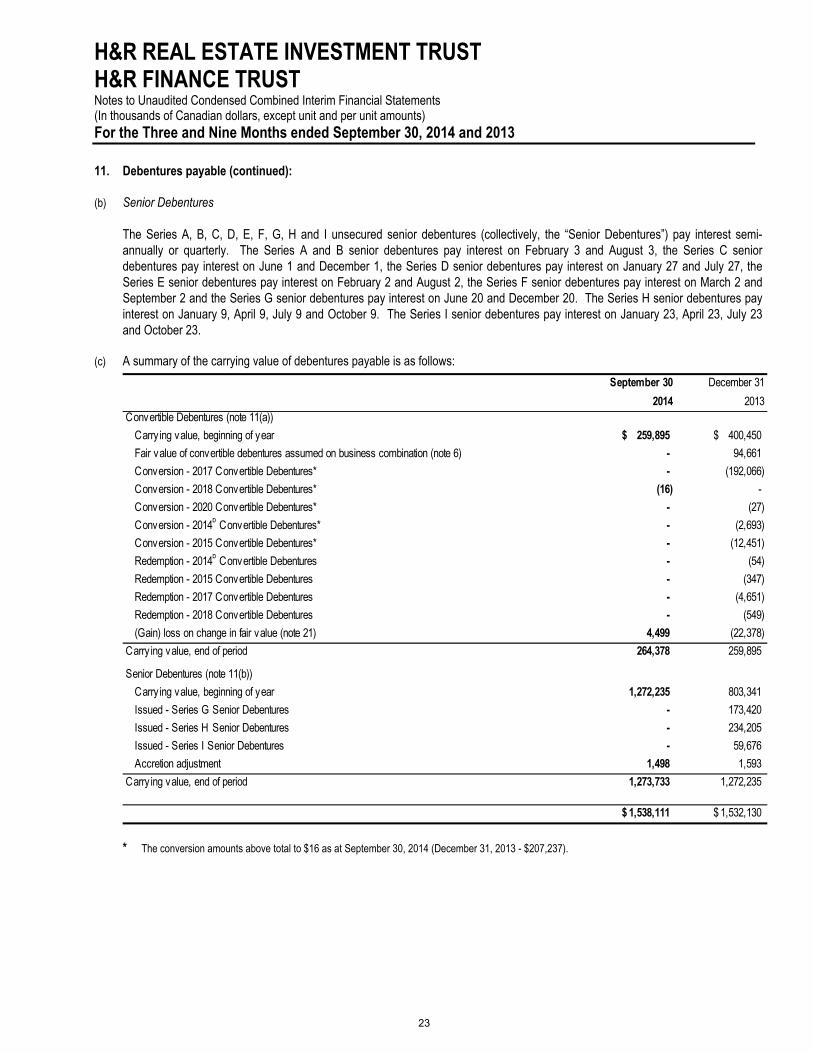
(b) Senior Debentures
The Series A, B, C, D, E, F, G, H and I unsecured senior debentures (collectively, the “Senior Debentures”) pay interest semi-annually or quarterly. The Series A and B senior debentures pay interest on February 3 and August 3, the Series C senior debentures pay interest on June 1 and December 1, the Series D senior debentures pay interest on January 27 and July 27, the Series E senior debentures pay interest on February 2 and August 2, the Series F senior debentures pay interest on March 2 and September 2 and the Series G senior debentures pay interest on June 20 and December 20. The Series H senior debentures pay interest on January 9, April 9, July 9 and October 9. The Series I senior debentures pay interest on January 23, April 23, July 23 and October 23.
(c) A summary of the carrying value of debentures payable is as follows:
September 30 December 31
2014 2013Convertible Debentures (note 11(a))
Carry ing value, beginning of year 259,895 $ 400,450 $
Fair value of convertible debentures assumed on business combination (note 6) - 94,661
Conversion - 2017 Convertible Debentures* - (192,066)
Conversion - 2018 Convertible Debentures* (16) -
Conversion - 2020 Convertible Debentures* - (27)
Conversion - 2014b Convertible Debentures* - (2,693)
Conversion - 2015 Convertible Debentures* - (12,451)
Redemption - 2014b Convertible Debentures - (54)
Redemption - 2015 Convertible Debentures - (347)
Redemption - 2017 Convertible Debentures - (4,651)
Redemption - 2018 Convertible Debentures - (549)
(Gain) loss on change in fair value (note 21) 4,499 (22,378)
Carry ing value, end of period 264,378 259,895
Senior Debentures (note 11(b))
Carry ing value, beginning of year 1,272,235 803,341
Issued - Series G Senior Debentures - 173,420
Issued - Series H Senior Debentures - 234,205
Issued - Series I Senior Debentures - 59,676
Accretion adjustment 1,498 1,593
Carry ing value, end of period 1,273,733 1,272,235
1,538,111 $ 1,532,130 $
* The conversion amounts above total to $16 as at September 30, 2014 (December 31, 2013 - $207,237).
H&R REAL ESTATE INVESTMENT TRUST H&R FINANCE TRUST Notes to Unaudited Condensed Combined Interim Financial Statements (In thousands of Canadian dollars, except unit and per unit amounts) For the Three and Nine Months ended September 30, 2014 and 2013
24
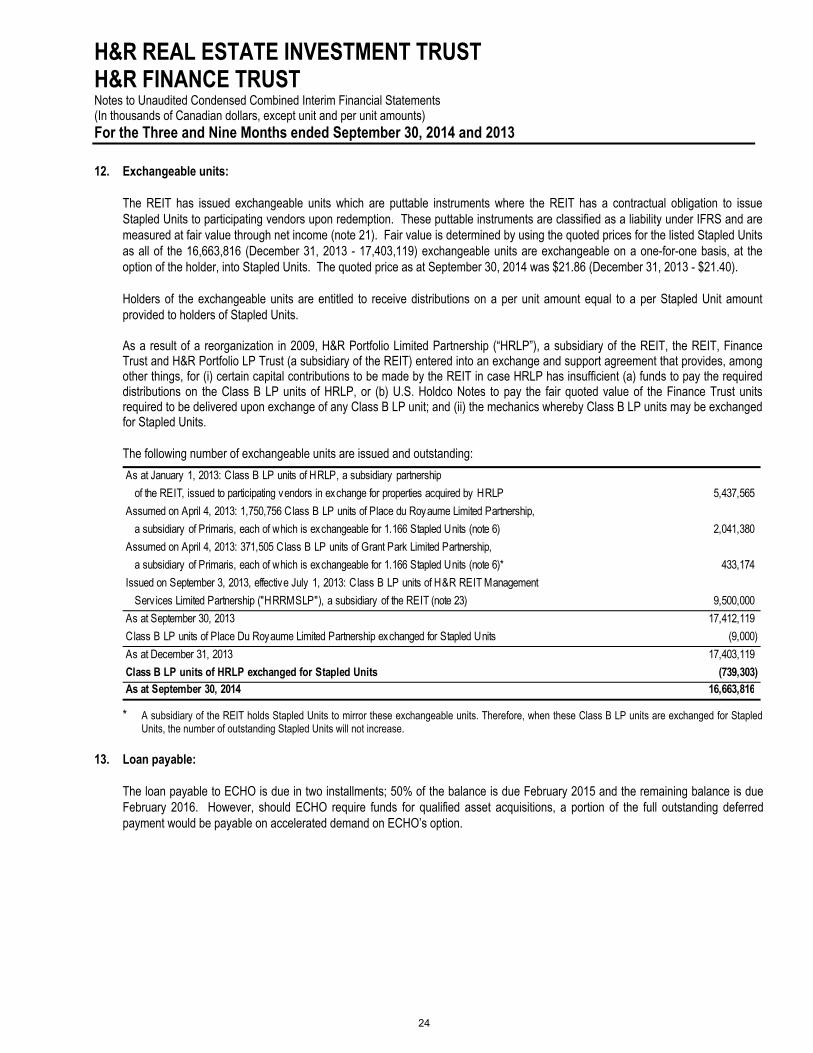
12. Exchangeable units:
The REIT has issued exchangeable units which are puttable instruments where the REIT has a contractual obligation to issue Stapled Units to participating vendors upon redemption. These puttable instruments are classified as a liability under IFRS and are measured at fair value through net income (note 21). Fair value is determined by using the quoted prices for the listed Stapled Units as all of the 16,663,816 (December 31, 2013 - 17,403,119) exchangeable units are exchangeable on a one-for-one basis, at the option of the holder, into Stapled Units. The quoted price as at September 30, 2014 was $21.86 (December 31, 2013 - $21.40).
Holders of the exchangeable units are entitled to receive distributions on a per unit amount equal to a per Stapled Unit amount provided to holders of Stapled Units.
As a result of a reorganization in 2009, H&R Portfolio Limited Partnership (“HRLP”), a subsidiary of the REIT, the REIT, Finance Trust and H&R Portfolio LP Trust (a subsidiary of the REIT) entered into an exchange and support agreement that provides, among other things, for (i) certain capital contributions to be made by the REIT in case HRLP has insufficient (a) funds to pay the required distributions on the Class B LP units of HRLP, or (b) U.S. Holdco Notes to pay the fair quoted value of the Finance Trust units required to be delivered upon exchange of any Class B LP unit; and (ii) the mechanics whereby Class B LP units may be exchanged for Stapled Units.
The following number of exchangeable units are issued and outstanding:
As at January 1, 2013: Class B LP units of HRLP, a subsidiary partnership
of the REIT, issued to participating vendors in exchange for properties acquired by HRLP 5,437,565
Assumed on April 4, 2013: 1,750,756 Class B LP units of Place du Royaume Limited Partnership,
a subsidiary of Primaris, each of which is exchangeable for 1.166 Stapled Units (note 6) 2,041,380
Assumed on April 4, 2013: 371,505 Class B LP units of Grant Park Limited Partnership,
a subsidiary of Primaris, each of which is exchangeable for 1.166 Stapled Units (note 6)* 433,174
Issued on September 3, 2013, effective July 1, 2013: Class B LP units of H&R REIT Management
Serv ices Limited Partnership ("HRRMSLP"), a subsidiary of the REIT (note 23) 9,500,000
As at September 30, 2013 17,412,119
Class B LP units of Place Du Royaume Limited Partnership exchanged for Stapled Units (9,000)
As at December 31, 2013 17,403,119
Class B LP units of HRLP exchanged for Stapled Units (739,303) As at September 30, 2014 16,663,816
* A subsidiary of the REIT holds Stapled Units to mirror these exchangeable units. Therefore, when these Class B LP units are exchanged for Stapled
Units, the number of outstanding Stapled Units will not increase.
13. Loan payable:
The loan payable to ECHO is due in two installments; 50% of the balance is due February 2015 and the remaining balance is due February 2016. However, should ECHO require funds for qualified asset acquisitions, a portion of the full outstanding deferred payment would be payable on accelerated demand on ECHO’s option.
H&R REAL ESTATE INVESTMENT TRUST H&R FINANCE TRUST Notes to Unaudited Condensed Combined Interim Financial Statements (In thousands of Canadian dollars, except unit and per unit amounts) For the Three and Nine Months ended September 30, 2014 and 2013
25
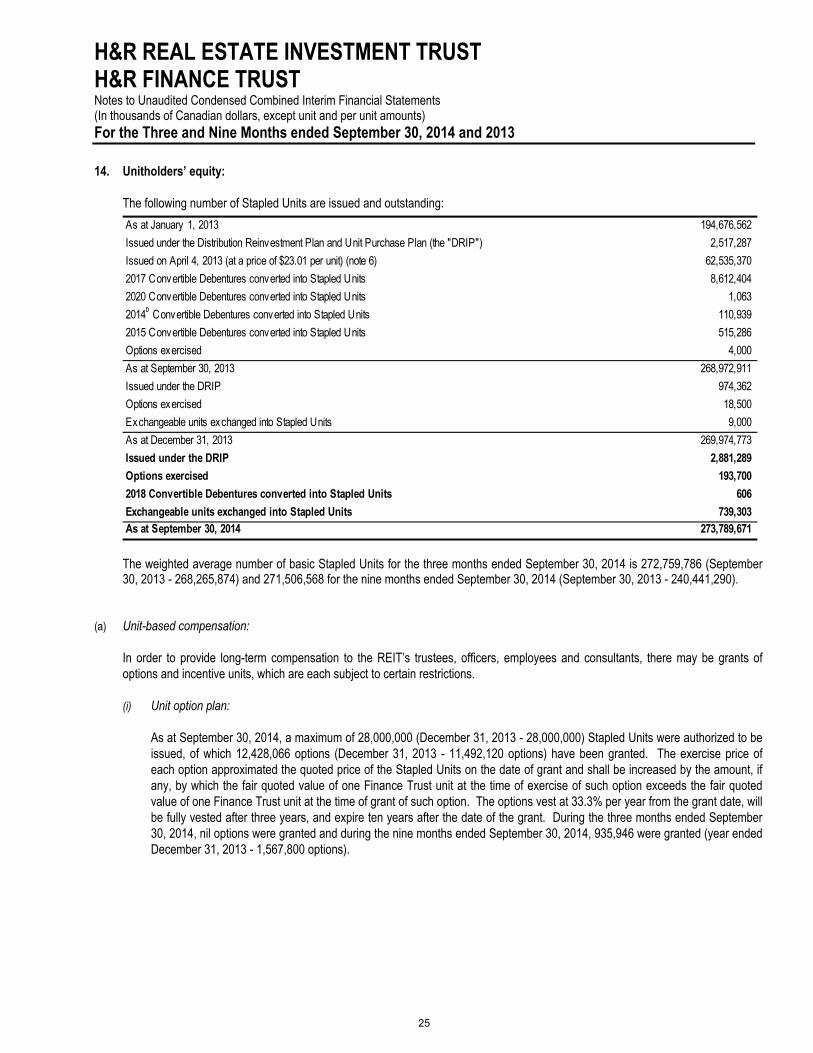
14. Unitholders’ equity:
The following number of Stapled Units are issued and outstanding:
As at January 1, 2013 194,676,562
Issued under the Distribution Reinvestment Plan and Unit Purchase Plan (the "DRIP") 2,517,287
Issued on April 4, 2013 (at a price of $23.01 per unit) (note 6) 62,535,370
2017 Convertible Debentures converted into Stapled Units 8,612,404
2020 Convertible Debentures converted into Stapled Units 1,063
2014b Convertible Debentures converted into Stapled Units 110,939
2015 Convertible Debentures converted into Stapled Units 515,286
Options exercised 4,000
As at September 30, 2013 268,972,911
Issued under the DRIP 974,362
Options exercised 18,500
Exchangeable units exchanged into Stapled Units 9,000
As at December 31, 2013 269,974,773
Issued under the DRIP 2,881,289
Options exercised 193,700
2018 Convertible Debentures converted into Stapled Units 606
Exchangeable units exchanged into Stapled Units 739,303 As at September 30, 2014 273,789,671
The weighted average number of basic Stapled Units for the three months ended September 30, 2014 is 272,759,786 (September 30, 2013 - 268,265,874) and 271,506,568 for the nine months ended September 30, 2014 (September 30, 2013 - 240,441,290).
(a) Unit-based compensation:
In order to provide long-term compensation to the REIT’s trustees, officers, employees and consultants, there may be grants of options and incentive units, which are each subject to certain restrictions.
(i) Unit option plan:
As at September 30, 2014, a maximum of 28,000,000 (December 31, 2013 - 28,000,000) Stapled Units were authorized to be issued, of which 12,428,066 options (December 31, 2013 - 11,492,120 options) have been granted. The exercise price of each option approximated the quoted price of the Stapled Units on the date of grant and shall be increased by the amount, if any, by which the fair quoted value of one Finance Trust unit at the time of exercise of such option exceeds the fair quoted value of one Finance Trust unit at the time of grant of such option. The options vest at 33.3% per year from the grant date, will be fully vested after three years, and expire ten years after the date of the grant. During the three months ended September 30, 2014, nil options were granted and during the nine months ended September 30, 2014, 935,946 were granted (year ended December 31, 2013 - 1,567,800 options).
H&R REAL ESTATE INVESTMENT TRUST H&R FINANCE TRUST Notes to Unaudited Condensed Combined Interim Financial Statements (In thousands of Canadian dollars, except unit and per unit amounts) For the Three and Nine Months ended September 30, 2014 and 2013
26
14. Unitholders’ equity (continued):
A summary of the status of the unit option plan and the changes during the respective periods are as follows:
Units
Weighted
average
exercise price Units
Weighted
average
exercise price
Outstanding, beginning of year 4,553,321 21.04 $ 3,008,021 20.01 $
Granted 935,946 22.17 1,567,800 22.92
Exercised (193,700) 16.42 (22,500) 14.79 Outstanding, end of period 5,295,567 21.41 $ 4,553,321 21.04 $
Options exercisable, end of period 2,906,308 20.37 $ 1,802,642 18.60 $
September 30, 2014 December 31, 2013
The options outstanding at September 30, 2014 are exercisable at varying prices ranging from $9.30 to $23.18 (December 31, 2013 - $9.30 to $23.18) with a weighted average remaining life of 7.6 years (December 31, 2013 - 7.9 years). The vested options are exercisable at varying prices ranging from $9.30 to $23.18 (December 31, 2013 - $9.30 to $23.18) with a weighted average remaining life of 6.8 years (December 31, 2013 - 6.8 years).
(ii) Incentive unit plan:
As at September 30, 2014, a maximum of 5,000,000 (December 31, 2013 - 5,000,000) Stapled Units were authorized to be issued under the incentive unit plan, of which 159,879 incentive units (December 31, 2013 - nil incentive units) have been granted.
Incentive units are recognized based on the grant date fair value. The awards will be satisfied either in Stapled Units issued from treasury or cash, as determined by the REIT’s trustees, with the result that the awards are classified as cash-settled unit-based payments and presented as liabilities. 100% of the incentive units vest on the third anniversary of the grant date and are subject to forfeiture until the recipients of the awards have held office with or provided services to the REIT for a specified period of time. The incentive units may, if specified at the time of grant, accrue cash distributions during the vesting period and accrued distributions will be paid when the incentive units vest. These incentive units are recognized as liabilities, which are indexed to changes in fair value of the Stapled Units. During the three months ended September 30, 2014, 2,354 incentive units were granted and during the nine months ended September 30, 2014, 159,879 were granted (year ended December 31, 2013 - nil incentive units) .
The fair value of the vested unit options and incentive units payable are as follows:
September 30 December 31
2014 2013
Options 6,971 $ 6,313 $
Incentive units 962 -
7,933 $ 6,313 $
H&R REAL ESTATE INVESTMENT TRUST H&R FINANCE TRUST Notes to Unaudited Condensed Combined Interim Financial Statements (In thousands of Canadian dollars, except unit and per unit amounts) For the Three and Nine Months ended September 30, 2014 and 2013
27
14. Unitholders’ equity (continued):
Unit-based compensation expense included in trust expenses is as follows:
2014 2013 2014 2013
Options (2,185) $ (805) $ 1,785 $ (4,436) $
Incentive units 295 - 962 -
(1,890) $ (805) $ 2,747 $ (4,436) $
Three months ended
September 30
Nine months ended
September 30
(b) Distributions:
Under the REIT’s Declaration of Trust, the total amount of income of the REIT to be distributed to unitholders for each calendar month shall be subject to the discretion of the trustees, however, the total income distributed shall not be less than the amount necessary to ensure that the REIT will not be liable to pay income tax under Part I of the Tax Act for any year. The trustees have the discretion to pay the distributions in cash or Stapled Units. For the three months ended September 30, 2014, the REIT declared per unit distributions of $0.30 (September 30, 2013 - $0.31) and for the nine months ended September 30, 2014, the REIT declared per unit distributions of $0.93 (September 30, 2013 - $0.95).
Pursuant to Finance Trust’s Declaration of Trust, unitholders of Finance Trust are entitled to receive all of the Distributable Cash of Finance Trust, as defined in the Declaration of Trust. Distributable Cash means, subject to certain exceptions, all amounts received by Finance Trust less certain costs, expenses or other amounts payable by Finance Trust, and less any amounts which, in the opinion of the trustees, may reasonably be considered to be necessary to provide for the payment of any costs or expenditures that have been or will be incurred in the activities and operations of Finance Trust and to provide for payment of any tax liability of Finance Trust. Finance Trust paid per unit distributions of $0.03 for the three months ended September 30, 2014 (September 30, 2013 - $0.02) and $0.08 for the nine months ended September 30, 2014 (September 30, 2013 - $0.06).
The details of the distributions are as follows:
2014 2013
Cash distributions to unitholders 211,548 $ 186,523 $
Unit distributions (issued under the DRIP) 62,875 54,040 274,423 $ 240,563 $
Nine months ended September 30
(c) Short form base shelf prospectus:
On April 3, 2013, the Trusts filed a short form base shelf prospectus, qualifying the Trusts to offer and issue Stapled Units and the REIT to offer and issue the following securities: (i) preferred units; (ii) unsecured debt securities; (iii) subscription receipts exchangeable for Stapled Units and/or other securities of the REIT; (iv) warrants exercisable to acquire Stapled Units and/or other securities of the REIT; and (v) securities comprised of more than one of Stapled Units, preferred units, debt securities, subscription receipts and/or warrants offered together as a unit, or any combination thereof having an offer price of up to $2,000,000 in aggregate (or the equivalent thereof, at the date of issue, in any other currency or currencies, as the case may be) at any time during the 25-month period that the short form base shelf prospectus (including any amendments) remains valid. As at September 30, 2014, $175,000 of Senior Debentures have been issued under the short form base shelf prospectus.
H&R REAL ESTATE INVESTMENT TRUST H&R FINANCE TRUST Notes to Unaudited Condensed Combined Interim Financial Statements (In thousands of Canadian dollars, except unit and per unit amounts) For the Three and Nine Months ended September 30, 2014 and 2013
28
15. Derivative instruments:
September 30 December 31
2014 2013 2014 2013 2014 2013
Foreign exchange forward contracts (a) $ - (122) $ (1) $ 527 $ 125 $ (1,137) $
Mortgage interest rate swap (b) (211) (386) 69 47 193 189
(211) $ (508) $ 68 $ 574 $ 318 $ (948) $
Fair value (liability ) asset *
Net gain (loss) on derivative
contracts**
Three months ended September 30
Net gain (loss) on derivative
contracts**
Nine months ended September 30
(a) The REIT entered into foreign exchange forward contracts and swaps with Canadian chartered banks effectively locking the REIT’s rate to exchange U.S. dollars into Canadian dollars.
(b) The REIT entered into an interest rate swap on one U.S. mortgage.
* Derivative instruments in asset and liability positions are not presented on a net basis. When a derivative instrument is in an asset position, the amount is recorded in other assets.
** Excludes amounts relating to foreign exchange which have been recorded in accumulated other comprehensive income (loss) (note 18).
16. Bank indebtedness:
The REIT has the following facilities:
(a) A general operating facility which is secured by fixed charges over certain investment properties due on December 31, 2016.The total facility as at September 30, 2014 is $300,000 (December 31, 2013 - $300,000) and can be drawn in either Canadian or U.S. dollars (to a maximum of $150,000 U.S. dollars for U.S. borrowings). The maximum lending value as of September 30, 2014 is $300,000. The amount available at September 30, 2014, after taking into account the bank indebtedness drawn of $201,782 (December 31, 2013 - $101,912) and the outstanding letters of credit and other items, is $45,002 (December 31, 2013 - $151,547). The Canadian dollar bank indebtedness bears interest at rates approximating the prime rate of a Canadian chartered bank. At September 30, 2014, the Canadian prime interest rate was 3.00% (December 31, 2013 - 3.00%) per annum.
Included in bank indebtedness at September 30, 2014 are U.S. dollar denominated amounts of $6,157 (December 31, 2013 - U.S. $78,253). The Canadian equivalents of these amounts are $6,896 (December 31, 2013 - $82,948).
(b) A general operating facility which is secured by fixed charges over certain investment properties due on April 4, 2015. The total facility as at September 30, 2014 is $150,000 (December 31, 2013 - $150,000). The amount available at September 30, 2014, after taking into account the bank indebtedness drawn of $11,382 (December 31, 2013 - nil) and the outstanding letters of credit is $138,063 (December 31, 2013 - $149,446).
(c) A general operating facility which is secured by fixed charges over certain investment properties due on December 20, 2015. The total facility as at September 30, 2014 is $14,850 (December 31, 2013 - $14,850). The amount available at September 30, 2014, after taking into account the bank indebtedness drawn of $14,850 (December 31, 2013 - $14,850), is nil (December 31, 2013 - nil).
H&R REAL ESTATE INVESTMENT TRUST H&R FINANCE TRUST Notes to Unaudited Condensed Combined Interim Financial Statements (In thousands of Canadian dollars, except unit and per unit amounts) For the Three and Nine Months ended September 30, 2014 and 2013
29
17. Accounts payable and accrued liabilities:
September 30 December 31
2014 2013
Current:
Other accounts payable and accrued liabilities 105,481 $ 105,007 $
Accounts payable relating to the Bow 8,144 7,140
Debenture interest payable 14,272 16,382
Prepaid rent 27,956 25,465
Mortgage interest payable 23,398 14,012
Non-current:
Security deposits 3,836 4,087 183,087 $ 172,093 $
18. Accumulated other comprehensive income (loss):
Cash flow Foreign
hedges operations Total
Balance as at January 1, 2013 (1,182) $ (23,689) $ (24,871) $
Transfer of realized loss on cash flow hedges to net income 310 - 310
Unrealized gain on translation of U.S. denominated foreign operation - 30,058 30,058
Balance as at September 30, 2013 (872) 6,369 5,497
Transfer of realized loss on cash flow hedges to net income 104 - 104
Unrealized gain on translation of U.S. denominated foreign operation - 22,990 22,990
Balance as at December 31, 2013 (768) 29,359 28,591
Transfer of realized loss on cash flow hedges to net income 321 - 321
Unrealized gain on translation of U.S. denominated foreign operation - 52,150 52,150 Balance as at September 30, 2014 (447) $ 81,509 $ 81,062 $
19. Rentals from investment properties:
2014 2013 2014 2013
Rental income 298,915 $ 302,741 $ 907,752 $ 795,192 $
Straight-lining of contractual rent 3,899 3,452 12,745 28,606
Rent amortization of tenant inducements (420) (435) (1,291) (1,355) 302,394 $ 305,758 $ 919,206 $ 822,443 $
Nine months ended
September 30
Three months ended
September 30
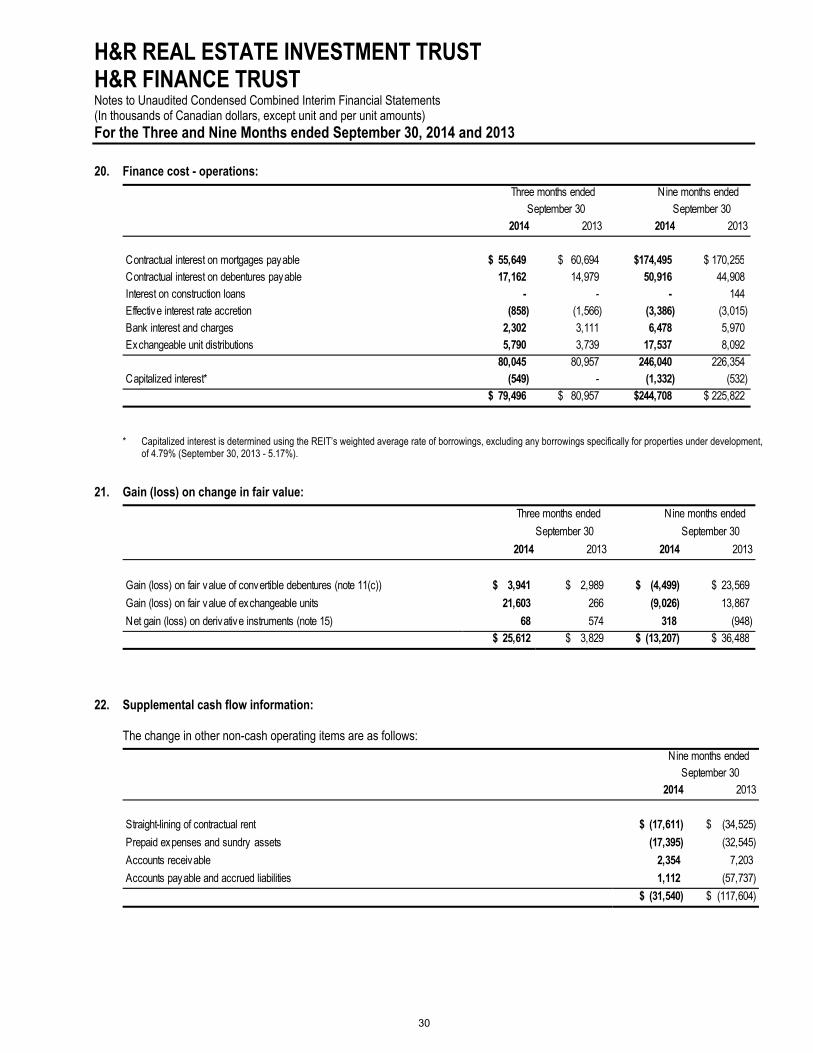
H&R REAL ESTATE INVESTMENT TRUST H&R FINANCE TRUST Notes to Unaudited Condensed Combined Interim Financial Statements (In thousands of Canadian dollars, except unit and per unit amounts) For the Three and Nine Months ended September 30, 2014 and 2013
30
20. Finance cost - operations:
2014 2013 2014 2013
Contractual interest on mortgages payable 55,649 $ 60,694 $ 174,495 $ 170,255 $ Contractual interest on debentures payable 17,162 14,979 50,916 44,908 Interest on construction loans - - - 144 Effective interest rate accretion (858) (1,566) (3,386) (3,015) Bank interest and charges 2,302 3,111 6,478 5,970 Exchangeable unit distributions 5,790 3,739 17,537 8,092
80,045 80,957 246,040 226,354 Capitalized interest* (549) - (1,332) (532)
79,496 $ 80,957 $ 244,708 $ 225,822 $
Nine months ended September 30
Three months ended September 30
* Capitalized interest is determined using the REIT’s weighted average rate of borrowings, excluding any borrowings specifically for properties under development, of 4.79% (September 30, 2013 - 5.17%).
21. Gain (loss) on change in fair value:
2014 2013 2014 2013
Gain (loss) on fair value of convertible debentures (note 11(c)) 3,941 $ 2,989 $ (4,499) $ 23,569 $
Gain (loss) on fair value of exchangeable units 21,603 266 (9,026) 13,867
Net gain (loss) on derivative instruments (note 15) 68 574 318 (948) 25,612 $ 3,829 $ (13,207) $ 36,488 $
Nine months ended
September 30
Three months ended
September 30
22. Supplemental cash flow information:
The change in other non-cash operating items are as follows:
2014 2013
Straight-lining of contractual rent (17,611) $ (34,525) $
Prepaid expenses and sundry assets (17,395) (32,545)
Accounts receivable 2,354 7,203
Accounts payable and accrued liabilities 1,112 (57,737)
(31,540) $ (117,604) $
Nine months ended September 30
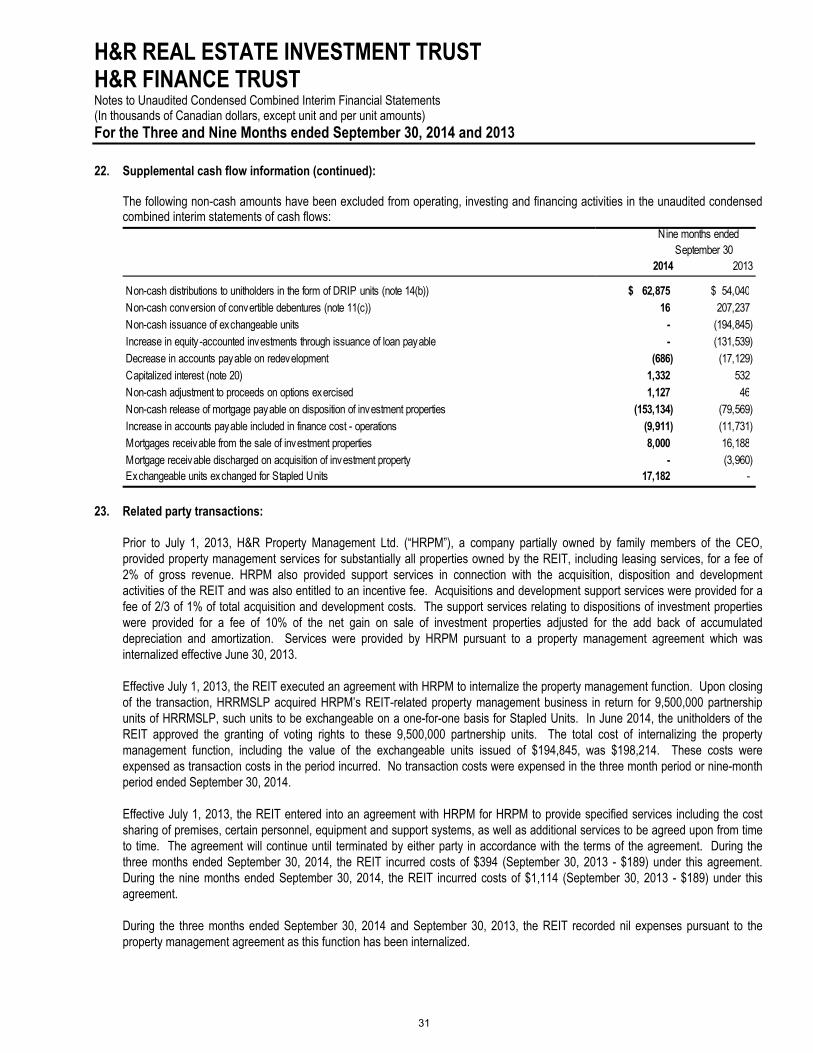
H&R REAL ESTATE INVESTMENT TRUST H&R FINANCE TRUST Notes to Unaudited Condensed Combined Interim Financial Statements (In thousands of Canadian dollars, except unit and per unit amounts) For the Three and Nine Months ended September 30, 2014 and 2013
31
22. Supplemental cash flow information (continued): The following non-cash amounts have been excluded from operating, investing and financing activities in the unaudited condensed combined interim statements of cash flows:
2014 2013
Non-cash distributions to unitholders in the form of DRIP units (note 14(b)) 62,875 $ 54,040 $ Non-cash conversion of convertible debentures (note 11(c)) 16 207,237 Non-cash issuance of exchangeable units - (194,845) Increase in equity-accounted investments through issuance of loan payable - (131,539) Decrease in accounts payable on redevelopment (686) (17,129) Capitalized interest (note 20) 1,332 532 Non-cash adjustment to proceeds on options exercised 1,127 46 Non-cash release of mortgage payable on disposition of investment properties (153,134) (79,569) Increase in accounts payable included in finance cost - operations (9,911) (11,731) Mortgages receivable from the sale of investment properties 8,000 16,188 Mortgage receivable discharged on acquisition of investment property - (3,960) Exchangeable units exchanged for Stapled Units 17,182 -
Nine months ended September 30
23. Related party transactions:
Prior to July 1, 2013, H&R Property Management Ltd. (“HRPM”), a company partially owned by family members of the CEO, provided property management services for substantially all properties owned by the REIT, including leasing services, for a fee of 2% of gross revenue. HRPM also provided support services in connection with the acquisition, disposition and development activities of the REIT and was also entitled to an incentive fee. Acquisitions and development support services were provided for a fee of 2/3 of 1% of total acquisition and development costs. The support services relating to dispositions of investment properties were provided for a fee of 10% of the net gain on sale of investment properties adjusted for the add back of accumulated depreciation and amortization. Services were provided by HRPM pursuant to a property management agreement which was internalized effective June 30, 2013.
Effective July 1, 2013, the REIT executed an agreement with HRPM to internalize the property management function. Upon closing of the transaction, HRRMSLP acquired HRPM’s REIT-related property management business in return for 9,500,000 partnership units of HRRMSLP, such units to be exchangeable on a one-for-one basis for Stapled Units. In June 2014, the unitholders of the REIT approved the granting of voting rights to these 9,500,000 partnership units. The total cost of internalizing the property management function, including the value of the exchangeable units issued of $194,845, was $198,214. These costs were expensed as transaction costs in the period incurred. No transaction costs were expensed in the three month period or nine-month period ended September 30, 2014.
Effective July 1, 2013, the REIT entered into an agreement with HRPM for HRPM to provide specified services including the cost sharing of premises, certain personnel, equipment and support systems, as well as additional services to be agreed upon from time to time. The agreement will continue until terminated by either party in accordance with the terms of the agreement. During the three months ended September 30, 2014, the REIT incurred costs of $394 (September 30, 2013 - $189) under this agreement. During the nine months ended September 30, 2014, the REIT incurred costs of $1,114 (September 30, 2013 - $189) under this agreement.
During the three months ended September 30, 2014 and September 30, 2013, the REIT recorded nil expenses pursuant to the property management agreement as this function has been internalized.
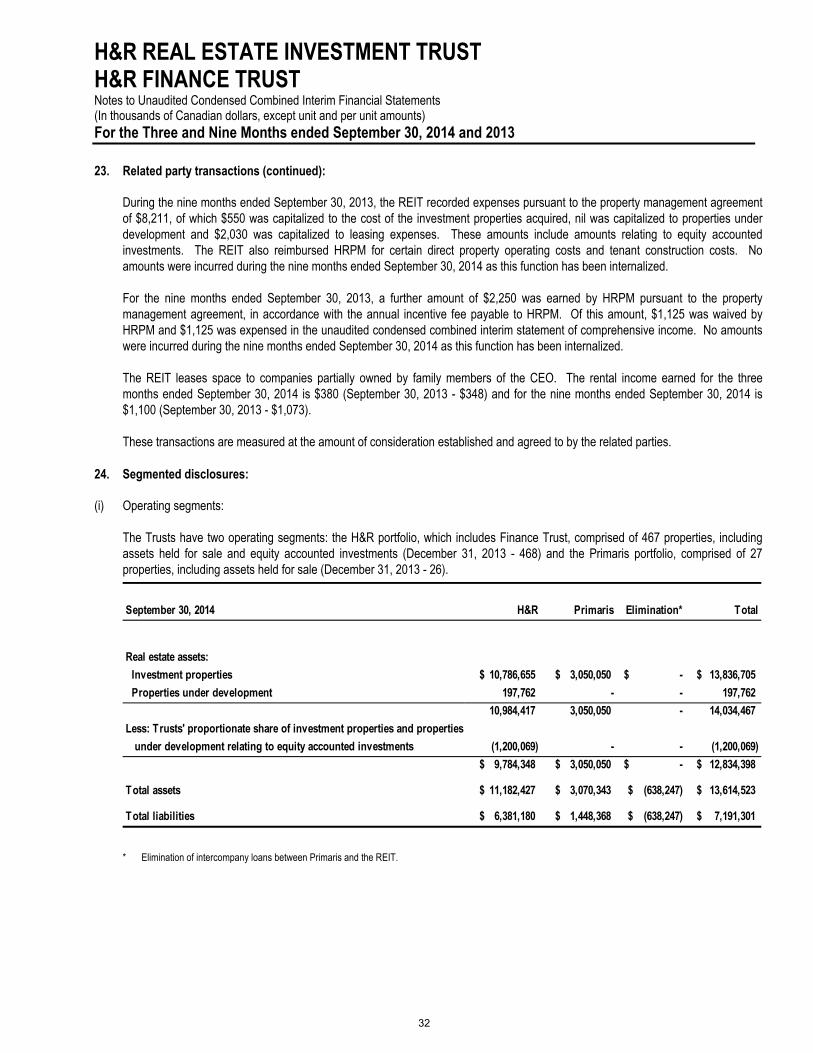
H&R REAL ESTATE INVESTMENT TRUST H&R FINANCE TRUST Notes to Unaudited Condensed Combined Interim Financial Statements (In thousands of Canadian dollars, except unit and per unit amounts) For the Three and Nine Months ended September 30, 2014 and 2013
32
23. Related party transactions (continued):
During the nine months ended September 30, 2013, the REIT recorded expenses pursuant to the property management agreement of $8,211, of which $550 was capitalized to the cost of the investment properties acquired, nil was capitalized to properties under development and $2,030 was capitalized to leasing expenses. These amounts include amounts relating to equity accounted investments. The REIT also reimbursed HRPM for certain direct property operating costs and tenant construction costs. No amounts were incurred during the nine months ended September 30, 2014 as this function has been internalized.
For the nine months ended September 30, 2013, a further amount of $2,250 was earned by HRPM pursuant to the property management agreement, in accordance with the annual incentive fee payable to HRPM. Of this amount, $1,125 was waived by HRPM and $1,125 was expensed in the unaudited condensed combined interim statement of comprehensive income. No amounts were incurred during the nine months ended September 30, 2014 as this function has been internalized.
The REIT leases space to companies partially owned by family members of the CEO. The rental income earned for the three months ended September 30, 2014 is $380 (September 30, 2013 - $348) and for the nine months ended September 30, 2014 is $1,100 (September 30, 2013 - $1,073).
These transactions are measured at the amount of consideration established and agreed to by the related parties.
24. Segmented disclosures:
(i) Operating segments:
The Trusts have two operating segments: the H&R portfolio, which includes Finance Trust, comprised of 467 properties, including assets held for sale and equity accounted investments (December 31, 2013 - 468) and the Primaris portfolio, comprised of 27 properties, including assets held for sale (December 31, 2013 - 26).
September 30, 2014 H&R Primaris Elimination* Total
Real estate assets:
Investment properties 10,786,655 $ 3,050,050 $ $ - 13,836,705 $
Properties under development 197,762 - - 197,762
10,984,417 3,050,050 - 14,034,467
Less: Trusts' proportionate share of investment properties and properties
under development relating to equity accounted investments (1,200,069) - - (1,200,069)
9,784,348 $ 3,050,050 $ $ - 12,834,398 $
Total assets 11,182,427 $ 3,070,343 $ (638,247) $ 13,614,523 $
Total liabilities 6,381,180 $ 1,448,368 $ (638,247) $ 7,191,301 $
* Elimination of intercompany loans between Primaris and the REIT.
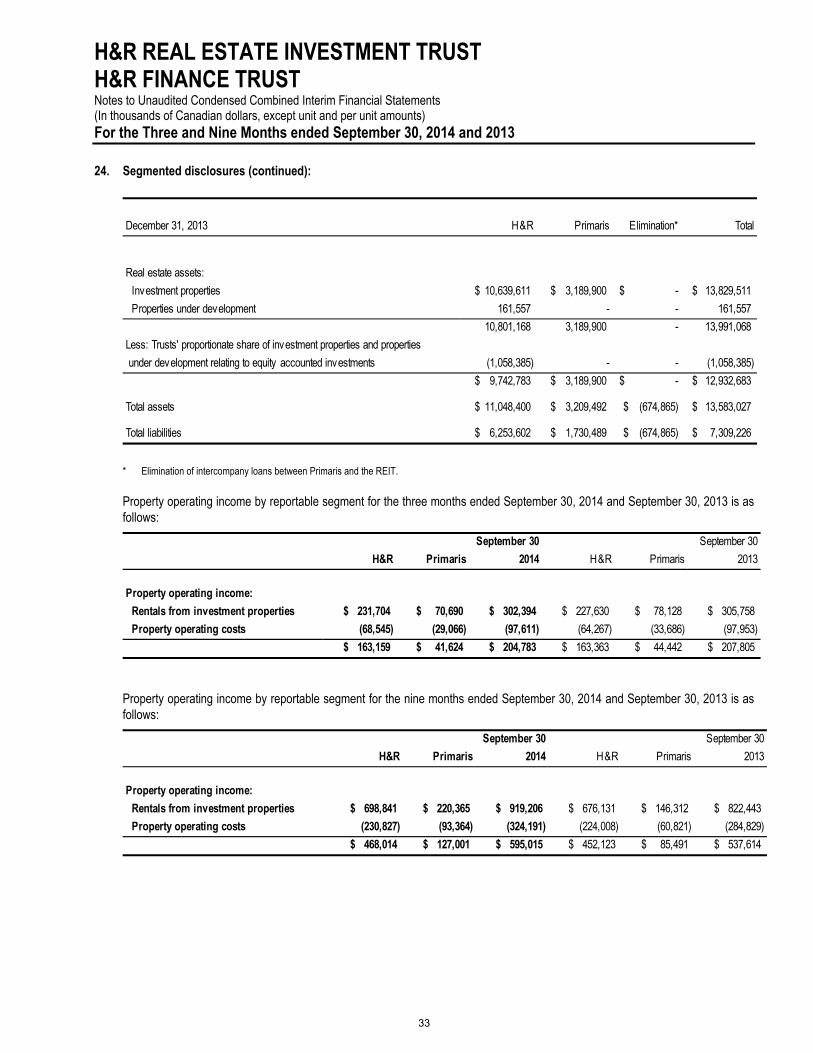
H&R REAL ESTATE INVESTMENT TRUST H&R FINANCE TRUST Notes to Unaudited Condensed Combined Interim Financial Statements (In thousands of Canadian dollars, except unit and per unit amounts) For the Three and Nine Months ended September 30, 2014 and 2013
33
24. Segmented disclosures (continued):
December 31, 2013 H&R Primaris Elimination* Total
Real estate assets:
Investment properties 10,639,611 $ 3,189,900 $ $ - 13,829,511 $
Properties under development 161,557 - - 161,557
10,801,168 3,189,900 - 13,991,068
Less: Trusts' proportionate share of investment properties and properties
under development relating to equity accounted investments (1,058,385) - - (1,058,385)
9,742,783 $ 3,189,900 $ $ - 12,932,683 $
Total assets 11,048,400 $ 3,209,492 $ (674,865) $ 13,583,027 $
Total liabilities 6,253,602 $ 1,730,489 $ (674,865) $ 7,309,226 $
* Elimination of intercompany loans between Primaris and the REIT.
Property operating income by reportable segment for the three months ended September 30, 2014 and September 30, 2013 is as follows:
H&R Primaris
September 30
2014 H&R Primaris
September 30
2013
Property operating income:
Rentals from investment properties 231,704 $ 70,690 $ 302,394 $ 227,630 $ 78,128 $ 305,758 $
Property operating costs (68,545) (29,066) (97,611) (64,267) (33,686) (97,953)
163,159 $ 41,624 $ 204,783 $ 163,363 $ 44,442 $ 207,805 $
Property operating income by reportable segment for the nine months ended September 30, 2014 and September 30, 2013 is as follows:
H&R Primaris
September 30
2014 H&R Primaris
September 30
2013
Property operating income:
Rentals from investment properties 698,841 $ 220,365 $ 919,206 $ 676,131 $ 146,312 $ 822,443 $
Property operating costs (230,827) (93,364) (324,191) (224,008) (60,821) (284,829)
468,014 $ 127,001 $ 595,015 $ 452,123 $ 85,491 $ 537,614 $
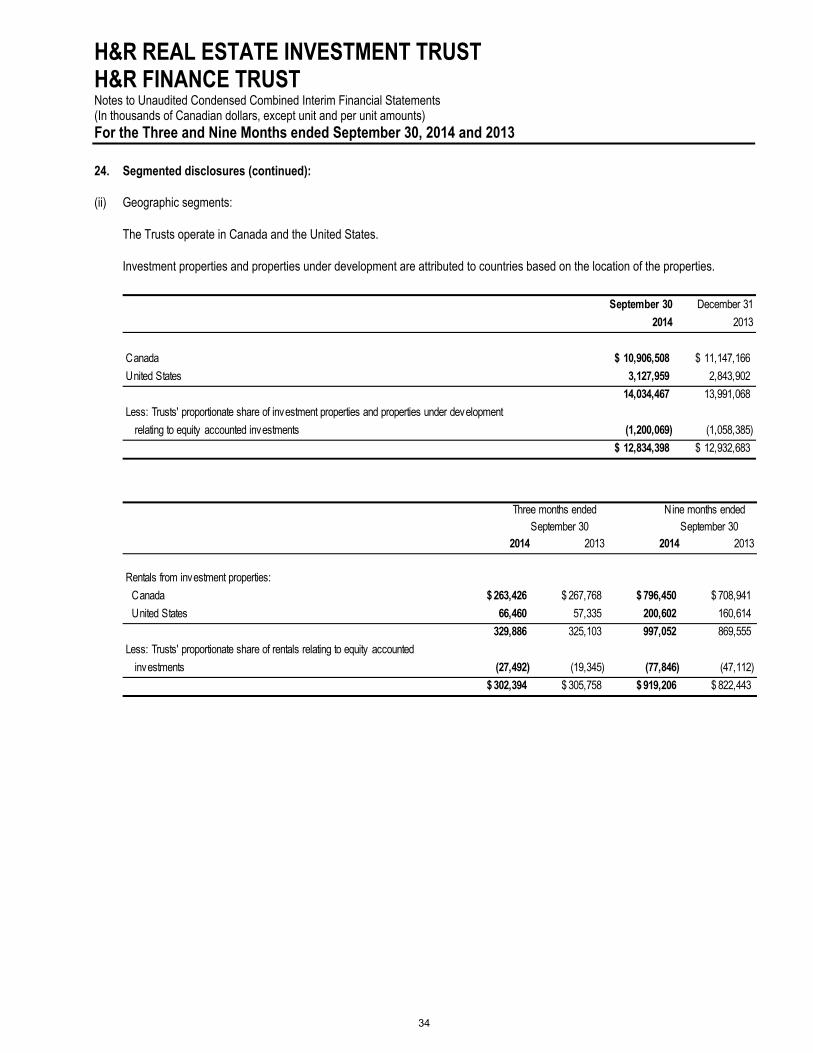
H&R REAL ESTATE INVESTMENT TRUST H&R FINANCE TRUST Notes to Unaudited Condensed Combined Interim Financial Statements (In thousands of Canadian dollars, except unit and per unit amounts) For the Three and Nine Months ended September 30, 2014 and 2013
34
24. Segmented disclosures (continued):
(ii) Geographic segments:
The Trusts operate in Canada and the United States.
Investment properties and properties under development are attributed to countries based on the location of the properties.
September 30 December 31
2014 2013
Canada 10,906,508 $ 11,147,166 $
United States 3,127,959 2,843,902
14,034,467 13,991,068
Less: Trusts' proportionate share of investment properties and properties under development
relating to equity accounted investments (1,200,069) (1,058,385)
12,834,398 $ 12,932,683 $
2014 2013 2014 2013
Rentals from investment properties:
Canada 263,426 $ 267,768 $ 796,450 $ 708,941 $
United States 66,460 57,335 200,602 160,614
329,886 325,103 997,052 869,555
Less: Trusts' proportionate share of rentals relating to equity accounted
investments (27,492) (19,345) (77,846) (47,112)
302,394 $ 305,758 $ 919,206 $ 822,443 $
Nine months ended September 30
Three months ended September 30
H&R REAL ESTATE INVESTMENT TRUST H&R FINANCE TRUST Notes to Unaudited Condensed Combined Interim Financial Statements (In thousands of Canadian dollars, except unit and per unit amounts) For the Three and Nine Months ended September 30, 2014 and 2013
35
25. Income tax expense:
2014 2013 2014 2013
Income tax computed at the Canadian statutory rate of nil applicable to
the REIT for 2014 and 2013 $ - $ - $ - $ -
Current U.S. income taxes 94 81 484 452
Deferred income taxes applicable to U.S. Holdco 5,259 5,668 32,210 17,604 Income tax expense in the determination of net income 5,353 $ 5,749 $ 32,694 $ 18,056 $
Nine months ended
September 30
Three months ended
September 30
The Tax Act contains legislation (the “SIFT Rules”) affecting the tax treatment of “specified investment flow-through” (“SIFT”) trusts. A SIFT includes a publicly-traded trust. Under the SIFT Rules, distributions of certain income by a SIFT are not deductible in computing the SIFT’s taxable income, and a SIFT is subject to tax on such income at a rate that is substantially equivalent to the general tax rate applicable to a Canadian corporation. The SIFT Rules do not apply to a publicly-traded trust that qualifies as a real estate investment trust under the Tax Act. The REIT completed the necessary tax restructuring to qualify as a real estate investment trust effective June 30, 2010.
The REIT has certain subsidiaries in the United States that are subject to tax on their taxable income at a rate of approximately 38%. The tax effects of temporary differences that give rise to significant portions of the deferred tax assets and deferred tax liabilities are presented below:
September 30 December 31
2014 2013
Deferred tax assets: Net operating losses and deferred interest deductions 89,667 $ 84,434 $
Accounts payable and accrued liabilities 2,449 1,865
Derivative instruments 81 195
Other assets 195 158
92,392 86,652
Deferred tax liabilities: Investment properties 202,590 162,055
Equity accounted investments 3,787 1,151
206,377 163,206
Deferred tax liability (113,985) $ (76,554) $
H&R REAL ESTATE INVESTMENT TRUST H&R FINANCE TRUST Notes to Unaudited Condensed Combined Interim Financial Statements (In thousands of Canadian dollars, except unit and per unit amounts) For the Three and Nine Months ended September 30, 2014 and 2013
36
26. Fair value measurement:
Financial instruments measured at fair value in the unaudited condensed combined interim statements of financial position, or disclosed in the notes to the financial statements, are categorized using a fair value hierarchy that reflects the significance of the inputs used in determining the fair values. Level 1: quoted prices (unadjusted) in active markets for identical assets or liabilities; Level 2: inputs other than quoted prices included within level 1 that are observable for the asset or liability, either directly (i.e.
as prices) or indirectly (i.e. derived from prices); and Level 3: inputs for the asset or liability that are not based on observable market data (unobservable inputs).
September 30, 2014 Level 1 Level 2 Level 3 Total
Assets measured at fair valueInvestment properties $ - $ - 12,729,914 $ 12,729,914 $ Properties under development - - 104,484 104,484
- - 12,834,398 12,834,398 Liabilities measured at fair valueConvertible debentures (note 11) (264,378) - - (264,378) Exchangeable units (364,271) - - (364,271) Derivative instruments liabilities - (211) - (211)
Liabilities for which fair values are disclosedMortgages payable (note 27) - - (4,822,294) (4,822,294) Senior debentures (note 27) - - (1,343,834) (1,343,834)
(628,649) (211) (6,166,128) (6,794,988)
(628,649) $ (211) $ 6,668,270 $ 6,039,410 $
December 31, 2013 Level 1 Level 2 Level 3 Total
Assets measured at fair valueInvestment properties $ - $ - 12,786,205 $ 12,786,205 $ Properties under development - - 146,478 146,478
- - 12,932,683 12,932,683 Liabilities measured at fair valueConvertible debentures (note 11) (259,895) - - (259,895) Exchangeable units (372,427) - - (372,427) Derivative instruments liabilities - (508) - (508)
Liabilities for which fair values are disclosedMortgages payable (note 27) - - (4,956,307) (4,956,307) Senior debentures (note 27) - - (1,321,378) (1,321,378)
(632,322) (508) (6,277,685) (6,910,515)
(632,322) $ (508) $ 6,654,998 $ 6,022,168 $
H&R REAL ESTATE INVESTMENT TRUST H&R FINANCE TRUST Notes to Unaudited Condensed Combined Interim Financial Statements (In thousands of Canadian dollars, except unit and per unit amounts) For the Three and Nine Months ended September 30, 2014 and 2013
37
27. Financial instruments carried at amortized cost:
The fair values of the Trusts’ mortgages receivable, accounts receivable, cash and cash equivalents, bank indebtedness and accounts payable and accrued liabilities approximate their carrying amounts due to the relatively short periods to maturity of these financial instruments.
The fair value of the mortgages payable has been determined by discounting the cash flows of these financial obligations using market rates for debt of similar terms and credit risks. Based on these assumptions, the fair value of mortgages payable at September 30, 2014 has been estimated at $4,822,294 (December 31, 2013 - $4,956,307) compared with the carrying value of $4,613,170 (December 31, 2013 - $4,897,726).
The fair value of the Senior Debentures payable has been measured based on the ask price of each series of Senior Debenture similar terms and credit risks. Based on these assumptions, the fair value of the Senior Debentures payable at September 30, 2014 has been estimated at $1,343,834 (December 31, 2013 - $1,321,378) compared with the carrying value of $1,273,733 (December 31, 2013 - $1,272,235).
The fair value of the loan payable to ECHO approximates the carrying value.
28. Commitments and contingencies:
(a) In the normal course of operations, the REIT has issued letters of credit in connection with developments, financings, operations and acquisitions. As at September 30, 2014, the REIT has outstanding letters of credit totalling $53,746 (December 31, 2013 - $47,070), including $17,639 (December 31, 2013 - $17,438) which has been pledged as security for certain mortgages payable. Of these letters of credit, $48,095 (December 31, 2013 - $41,419) are secured in the same manner as the bank indebtedness (notes 16(a) and 16(b)) and $5,651 (December 31, 2013 - $5,651) by a specific investment property.
(b) The REIT provides guarantees on behalf of third parties, including co-owners. As at September 30, 2014, the REIT issued guarantees amounting to $67,945 (December 31, 2013 - $69,766), which expire in 2016 (December 31, 2013 - expire in 2016), relating to the co-owner’s share of mortgage liability. In addition, the REIT continues to guarantee certain debt assumed by purchasers in connection with past dispositions of properties, and will remain liable until such debts are extinguished or the lenders agree to release the REIT’s covenants. At September 30, 2014, the estimated amount of debt subject to such guarantees, and therefore the maximum exposure to credit risk, is $218,642 (December 31, 2013 - $224,377) which expires between 2014 and 2020 (December 31, 2013 - expires between 2014 and 2020). There have been no defaults by the primary obligor for debts on which the REIT has provided its guarantees, and as a result, no contingent loss on these guarantees has been recognized in these unaudited condensed combined interim financial statements.
Credit risks arise in the event that these parties default on repayment of their debt since they are guaranteed by the REIT. These credit risks are mitigated as the REIT has recourse under these guarantees in the event of a default by the borrowers, in which case the REIT’s claim would be against the underlying real estate investments.
(c) The REIT is involved in litigation and claims in relation to the investment properties that arise from time to time in the normal course of business. In the opinion of management, any liability that may arise from such contingencies would not have a significant adverse effect on the unaudited condensed combined interim financial statements.
H&R REAL ESTATE INVESTMENT TRUST H&R FINANCE TRUST Notes to Unaudited Condensed Combined Interim Financial Statements (In thousands of Canadian dollars, except unit and per unit amounts) For the Three and Nine Months ended September 30, 2014 and 2013
38
29. Subsequent events:
(a) In October 2014, the REIT repaid two U.S. mortgages of approximately U.S. $19,000 bearing interest at a weighted average rate of 5.36%.
(b) In October and November 2014, the REIT repaid 11 Canadian mortgages of approximately $70,000 bearing interest at a weighted average rate of 5.80%.
COMBINED MANAGEMENT’S DISCUSSION AND ANALYSIS OF H&R REAL ESTATE
INVESTMENT TRUST AND H&R FINANCE TRUST
For the Three and Nine Months ended September 30, 2014
Dated: November 13, 2014
TABLE OF CONTENTS
SECTION I Other Income and Expense Items 17
Basis of Presentation 1 Assets 21
Forward-Looking Disclaimer 1 Liabilities 25
Non-GAAP Financial Measures 2 Equity 27
Overview 3 Funds from Operations 28
Change in Accounting Policy 4 Adjusted Funds from Operations 31
SECTION II Liquidity and Capital Resources 33
Financial Highlights 5 Off-Balance Sheet Items 35
Key Performance Drivers 5 Financial Instruments and Other Instruments 36
Portfolio Overview 6 SECTION IV
Summary of Significant Q3 2014 Activity 8 Critical Accounting Estimates and Judgements 36
Selected Annual Information 9 Internal Control over Financial Reporting 38
Summary of Quarterly Results 9 SECTION V
SECTION III Risks and Uncertainties 38
Results of Operations 10 Outstanding Unit Data 39
Property Operating Income 12 Additional Information 39
Segmented Information 13 Subsequent Events 39
H&R REIT AND H&R FINANCE TRUST - MD&A - SEPTEMBER 30, 2014
Page 1 of 39
SECTION I BASIS OF PRESENTATION Financial data included in this combined Management’s Discussion and Analysis (“MD&A”) of combined results of operations and combined financial position of H&R Real Estate Investment Trust (the “REIT”) and H&R Finance Trust (“Finance Trust” and together with the REIT, the “Trusts”) for the three and nine months ended September 30, 2014 includes material information up to November 13, 2014. Financial data provided has been prepared in accordance with International Financial Reporting Standards (“IFRS”) as issued by the International Accounting Standards Board (“IASB”). This MD&A should be read in conjunction with the unaudited condensed combined interim financial statements of the Trusts and appended notes for the three and nine months ended September 30, 2014 (“Trusts’ Financial Statements”), together with the combined financial statements of the Trusts and appended notes and MD&A for the year ended December 31, 2013. All amounts in this MD&A are in thousands of Canadian dollars, except where otherwise stated. Historical results, including trends which might appear, should not be taken as indicative of future operations or results. Certain prior period items have been reclassified to conform with the new accounting standards adopted in the current period. On October 24, 2013, the Ontario Securities Commission (on its behalf and on behalf of the other provincial securities regulators) issued a decision which permits the REIT and Finance Trust to file one set of combined financial statements rather than separate financial statements. The Trusts’ Financial Statements have been presented on a basis whereby the assets and liabilities of the REIT and Finance Trust have been combined in accordance with the accounting principles applicable to both the REIT and Finance Trust in accordance with IFRS to reflect the financial position and results of the REIT and Finance Trust on a combined basis. This same decision permits the REIT and Finance Trust to file one combined MD&A which has been done for the three and nine months ended September 30, 2014. FORWARD-LOOKING DISCLAIMER Certain information in this MD&A contains forward-looking information within the meaning of applicable securities laws (also known as forward-looking statements) including, among others, statements made or implied under the headings “Results of Operations”, “Liquidity and Capital Resources”, “Outlook”, “Risks and Uncertainties” and “Subsequent Events” relating to the Trusts’ objectives, strategies to achieve those objectives, the Trusts’ beliefs, plans, estimates, projections and intentions, and similar statements concerning anticipated future events, results, circumstances, performance or expectations that are not historical facts. Forward-looking statements generally can be identified by words such as “outlook”, “objective”, “may”, “will”, “expect”, “intend”, “estimate”, “anticipate”, “believe”, “should”, “plans”, “project”, “budget” or “continue” or similar expressions suggesting future outcomes or events. Such forward-looking statements reflect the Trusts’ current beliefs and are based on information currently available to management. Forward-looking statements are provided for the purpose of presenting information about management’s current expectations and plans relating to the future and readers are cautioned that such statements may not be appropriate for other purposes. These statements are not guarantees of future performance and are based on the Trusts’ estimates and assumptions that are subject to risks and uncertainties, including those described below under “Risks and Uncertainties” and those discussed in the Trusts’ materials filed with the Canadian securities regulatory authorities from time to time, which could cause the actual results and performance of the Trusts to differ materially from the forward-looking statements contained in this MD&A. Those risks and uncertainties include, among other things, risks related to: unit price risk; real property ownership; credit risk and tenant concentration; interest and other debt-related risk; ability to access capital markets; lease rollover risk; joint arrangements risk; currency risk; construction risks; availability of cash for distributions; environmental risk; tax risk; tax consequences to U.S. holders; dilution; unitholder liability; redemption right risk and risks relating to debentures. Material factors or assumptions that were applied in drawing a conclusion or making an estimate set out in the forward-looking statements include that the general economy is stable; local real estate conditions are stable; interest rates are relatively stable; and equity and debt markets continue to provide access to capital. The Trusts caution that this list of factors is not exhaustive. Although the forward-looking statements contained in this MD&A are based upon what the Trusts believe are reasonable assumptions, there can be no assurance that actual results will be consistent with these forward-looking statements. Readers are also urged to examine the REIT and Finance Trust’s materials filed with the Canadian securities regulatory authorities from time to time as they may contain discussions on risks and uncertainties which could cause the actual results and performance of the REIT and Finance Trust to differ materially from the forward-looking statements contained in this MD&A. Neither Finance Trust nor any of its trustees or officers, assumes any responsibility for the completeness of the information contained in the REIT’s materials filed with the Canadian securities regulatory authorities or for any failure of the REIT or its trustees or officers to disclose events or facts which may have occurred or which may affect the significance or accuracy of any such information. Neither the REIT nor any of its trustees or officers, assumes any responsibility for the completeness of the information contained in Finance Trust’s materials filed with the Canadian securities regulatory authorities or for any failure of Finance Trust or its trustees or officers to disclose events or facts which may have occurred or which may affect the significance or accuracy of any such information.
H&R REIT AND H&R FINANCE TRUST - MD&A - SEPTEMBER 30, 2014
Page 2 of 39
All forward-looking statements in this MD&A are qualified by these cautionary statements. These forward-looking statements are made as of November 13, 2014 and the Trusts, except as required by applicable law, assume no obligation to update or revise them to reflect new information or the occurrence of future events or circumstances. NON-GAAP FINANCIAL MEASURES The Trusts’ Financial Statements are prepared in accordance with IFRS. However, in this MD&A, a number of measures which do not have a meaning recognized under IFRS or Canadian Generally Accepted Accounting Principles (“GAAP”) are presented. These measures, as well as the reasons why management believes these measures are useful to investors, are described below: The Trusts’ Interests Effective January 1, 2013, the Trusts adopted IFRS 11, Joint Arrangements which resulted in the Trusts no longer proportionately consolidating certain joint ventures and investments in associates. The Trusts now apply the equity method of accounting to joint ventures and investments in associates, and this change in accounting policy has been applied retrospectively. Throughout this MD&A, any references to the “Trusts’ Financial Statements” refer to amounts as reported under IFRS and any references to “The Trusts’ interests” are non-GAAP measures which include amounts per the Trusts’ Financial Statements plus equity accounted investments. These non-GAAP financial measures take into account the Trusts’ proportionate share of the financial position and results of operations of the Trusts’ entire portfolio, under the assumption that all investments in joint ventures and associates have been proportionately consolidated. Property Operating Income, Same-Asset Property Operating Income and Adjusted Property Operating Income Property operating income is the rental revenue generated from the REIT’s investment properties, net of the property operating expenses incurred. Management believes that this is a useful measure for investors as it provides a snapshot of how the REIT’s properties are performing before financing costs and other sources of income and expenditures which are not directly related to the day-to-day operations of a property. Property operating income should not be construed as an alternative to net income calculated in accordance with IFRS. Same-asset property operating income is a non-GAAP financial measure used by the REIT which management believes is a measure useful for investors as it reports period-over-period performance for properties owned by the REIT throughout both periods. This typically excludes acquisitions, business combinations, dispositions, equity accounted investments and transfers of properties under development to investment properties. Adjusted property operating income is a non-GAAP measure. Effective January 1, 2014, the REIT adopted IFRS Interpretations Committee 21, Levies (“IFRIC 21”). Adjusted property operating income excludes the impact of this change in accounting policy which relates to the timing of the liability recognition for U.S. realty taxes. Management believes that adjusted property operating income is an important non-GAAP measure as, by excluding the impact of IFRIC 21, it evenly matches U.S. realty taxes with realty tax recoveries throughout the year. Funds from Operations (“FFO”) FFO is a non-GAAP financial measure widely used in the real estate industry as a measure of operating performance. The Trusts present their combined FFO calculations in accordance with the Real Property Association of Canada (REALpac) guidelines however, this method of calculating FFO may differ when comparing to other issuers. Management believes this to be a useful measure for investors as it adjusts for items included in net income that are not recurring including gain (loss) on sale of real estate assets, as well as non-cash items such as the fair value adjustments on investment properties. FFO should not be construed as an alternative to net income or cash flows provided by operating activities calculated in accordance with IFRS. See “Funds from Operations” for a reconciliation of property operating income to FFO and see “Adjusted Funds from Operations (“AFFO”)” for a reconciliation of FFO to AFFO and AFFO to Cash Provided by Operations. AFFO AFFO is also a widely used measure in the real estate industry to assess the sustainability of cash distributions. AFFO is calculated by adjusting FFO for non-cash items such as: straight-lining of contractual rent, rent amortization of tenant inducements, effective interest rate accretion and unit-based compensation. Non-recurring costs that impact operating cash flow may be adjusted, and capital and tenant expenditures incurred and capitalized in the period by the Trusts are deducted. There is no standard industry definition of AFFO, and as a result, the Trusts’ calculation of combined AFFO may differ from other issuers’ calculations. AFFO should not be construed as an alternative to net income or cash provided by operations calculated in accordance with IFRS. See AFFO for a reconciliation of AFFO to cash provided by operations.
H&R REIT AND H&R FINANCE TRUST - MD&A - SEPTEMBER 30, 2014
Page 3 of 39
None of these non-GAAP financial measures should be construed as an alternative to financial measures calculated in accordance with GAAP. Further, the Trusts’ method of calculating these supplemental non-GAAP financial measures may differ from the methods of other real estate investment trusts or other issuers, and accordingly, these measures may not be comparable to those measures presented by other real estate investment trusts or issuers. OVERVIEW The REIT is an unincorporated open-ended trust created by a declaration of trust (the “REIT Declaration of Trust”) and governed by the laws of the Province of Ontario. Unitholders are entitled to have their REIT units comprising part of the Stapled Units (as defined below) redeemed at any time on demand payable in cash (subject to monthly limits) and/or in specie, provided that the corresponding Finance Trust units are being contemporaneously redeemed. Finance Trust is an unincorporated investment trust. Finance Trust was established pursuant to a Plan of Arrangement (the “Plan of Arrangement”) on October 1, 2008, as described in the REIT’s information circular dated August 20, 2008, as an open-ended limited purpose unit trust pursuant to its declaration of Trust (the “Finance Trust Declaration of Trust”). Each issued and outstanding Finance Trust unit is “stapled” to a unit of the REIT on a one-for-one basis such that Finance Trust units and the REIT units trade together as stapled units (“Stapled Units”), and such Stapled Units are listed and posted for trading on the Toronto Stock Exchange (“TSX”). Apart from provisions necessary to achieve such stapling, each REIT unit and Finance Trust unit retains its own separate identity and is separately listed (but not posted for trading) on the TSX (unless there is an event of uncoupling, in which case Finance Trust units will cease to be listed on the TSX). The REIT has two primary objectives:
to provide unitholders with stable and growing cash distributions, generated by the revenue it derives from a diversified portfolio of income producing real estate assets; and
to maximize unit value through ongoing active management of the REIT’s assets, acquisition of additional properties and the development and construction of projects which are pre-leased to creditworthy tenants.
The REIT’s strategy to accomplish these two objectives is to accumulate a diversified portfolio of high quality investment properties in Canada and the United States occupied by creditworthy tenants. With the acquisition of Primaris Retail Real Estate Investment Trust (“Primaris”) on April 4, 2013, the Trusts now have two operating segments. The properties owned and operated by the Trusts prior to the acquisition of Primaris are defined as one segment (“the H&R portfolio”), which consists of office, industrial and retail properties throughout Canada and the United States which focuses on creditworthy tenants with long-term leases as well as Finance Trust. Subsequent acquisitions of similar properties are included in this segment. Primaris is considered by the Trusts to be a second segment (the “Primaris portfolio”) which operates enclosed shopping centres and multi-tenant retail plazas throughout Canada with shorter-term leases than the H&R portfolio. Subsequent acquisitions of enclosed shopping centres and multi-tenant plazas in Canada are included in this segment. The chief operating decision maker, determined to be the Chief Executive Officer (“CEO”), reviews the results of the H&R portfolio and the Primaris portfolio separately. The primary purpose of Finance Trust is to be a flow-through vehicle to allow the REIT to indirectly access the capital markets in a tax-efficient manner by indirectly borrowing money from the REIT’s unitholders. Finance Trust’s primary activity is to hold debt issued by H&R REIT (U.S.) Holdings Inc. (“U.S. Holdco”), a wholly owned U.S. subsidiary of the REIT. As at September 30, 2014, Finance Trust holds U.S. $220.5 million of aggregate principal amount of notes payable by U.S. Holdco (“U.S. Holdco Notes”). Subject to cash flow requirements, Finance Trust intends to distribute to its unitholders, who are also unitholders of the REIT, all of its cash flow, consisting primarily of interest paid by U.S. Holdco, less administrative and other expenses and amounts to satisfy liabilities. The U.S. Holdco Notes are eliminated in the Trusts’ Financial Statements, however the related foreign exchange difference is not eliminated upon combination as it flows through net income (loss) on the Finance Trust financial statements and other comprehensive income (loss) on the REIT financial statements. Mechanics of “Stapling” the Units of Finance Trust and the REIT Pursuant to the provisions of the Declarations of Trust for Finance Trust and the REIT at all times each REIT unit must be ‘‘stapled’’ to a Finance Trust unit (and each Finance Trust unit must be ‘‘stapled’’ to a REIT unit) unless there is an “event of uncoupling” (as described below). As part of the Plan of Arrangement, the REIT and Finance Trust entered into a support agreement (the “Support Agreement”) which provided, among other things, for the co-ordination of the declaration and payment of all distributions so as to provide for simultaneous record dates and payment dates; for co-ordination so as to permit the REIT to perform its obligations
H&R REIT AND H&R FINANCE TRUST - MD&A - SEPTEMBER 30, 2014
Page 4 of 39
pursuant to the REIT’s Declaration of Trust, Unit Option Plan, Incentive Unit Plan, Distribution Reinvestment Plan and Unit Purchase Plan (“DRIP”) and Unitholder Rights Plan; for Finance Trust to take all such actions and do all such things as are necessary or desirable to enable and permit the REIT to perform its obligations arising under any security issued by the REIT (including securities convertible, exercisable or exchangeable into Stapled Units); for Finance Trust to take all such actions and do all such things as are necessary or desirable to enable the REIT to perform its obligations or exercise its rights under its convertible debentures; and for Finance Trust to take all such actions and do all such things as are necessary or desirable to issue Finance Trust units simultaneously (or as close to simultaneously as possible) with the issue of REIT units and to otherwise ensure at all times that each holder of a particular number of REIT units holds an equal number of Finance Trust units, including participating in and cooperating with any public or private distribution of Stapled Units by, among other things, executing prospectuses or other offering documents. In the event that the REIT issues additional REIT units, pursuant to the Support Agreement, the REIT and Finance Trust will coordinate so as to ensure that each subscriber receives both REIT units and Finance Trust units, which shall trade together as Stapled Units. Prior to such event, the REIT shall provide notice to Finance Trust to cause Finance Trust to issue and deliver the requisite number of Finance Trust units to be received by and issued to, or to the order of, each subscriber as the REIT directs. In consideration of the issuance and delivery of each such Finance Trust unit, the REIT (solely as agent for and on behalf of the purchaser) or the purchaser, as the case may be, shall pay (or arrange for the payment of) a purchase price equal to the fair market value (as determined by Finance Trust in consultation with the REIT) of each such Finance Trust unit at the time of such issuance. The remainder of the subscription price for Stapled Units shall be allocated to the issuance of REIT units by the REIT. The proceeds received by Finance Trust from any such issuance shall be invested in additional notes of the same series as the U.S. Holdco Notes or distributed to unitholders of Finance Trust. An event of uncoupling (“Event of Uncoupling”) shall occur only: (a) in the event that unitholders of the REIT vote in favour of the uncoupling of units of Finance Trust and units of the REIT such that the two securities will trade separately; or (b) at the sole discretion of the trustees, but only in the event of the bankruptcy, insolvency, winding-up or reorganization (under an applicable law relating to insolvency) of the REIT or U.S. Holdco or the taking of corporate action by the REIT or U.S. Holdco in furtherance of any such action or the admitting in writing by the REIT or U.S. Holdco of its inability to pay its debts generally as they become due. Investment Restrictions Under Finance Trust Declaration of Trust, the assets of Finance Trust may be invested only in:
(a) U.S. Holdco Notes; and
(b) temporary investments in cash, term deposits with a Canadian chartered bank or trust company registered under the laws of a province of Canada, short-term government debt securities, or money market instruments (including banker’s acceptances) of, or guaranteed by, a Schedule 1 Canadian bank (“Cash Equivalents”), but only if each of the following conditions are satisfied: (a) if the Cash Equivalents have a maturity date, the trustees hold them until maturity; (b) the Cash Equivalents are required to fund expenses of Finance Trust, a redemption of units, or distributions to unitholders, in each case before the next distribution date; and (c) the purpose of holding the Cash Equivalents is to prevent funds from being non-productive, and not to take advantage of market fluctuations.
The Finance Trust Declaration of Trust provides that Finance Trust shall not make any investment, take any action or omit to take any action which would result in the units of Finance Trust not being considered units of a ‘‘mutual fund trust’’ for purposes of the Income Tax Act (Canada) (the “Tax Act”) or that would disqualify Finance Trust as a “fixed investment trust” under the Internal Revenue Code of 1986 as amended (the “Code”) and the applicable regulations. In order to qualify as a ‘‘fixed investment trust’’ under the Code, Finance Trust generally may not acquire assets other than the U.S. Holdco Notes or certain investments in cash or cash equivalents. CHANGE IN ACCOUNTING POLICY Except as described below, the accounting policies applied by the Trusts as at and for the three and nine months ended September 30, 2014, are the same as those applied in the Trusts’ combined financial statements as at and for the year ended December 31, 2013. Effective January 1, 2014, the REIT has adopted IFRIC 21. Refer to note 2 of the Trusts’ Financial Statements for a detailed description and quantitative impact of this change in accounting policy.
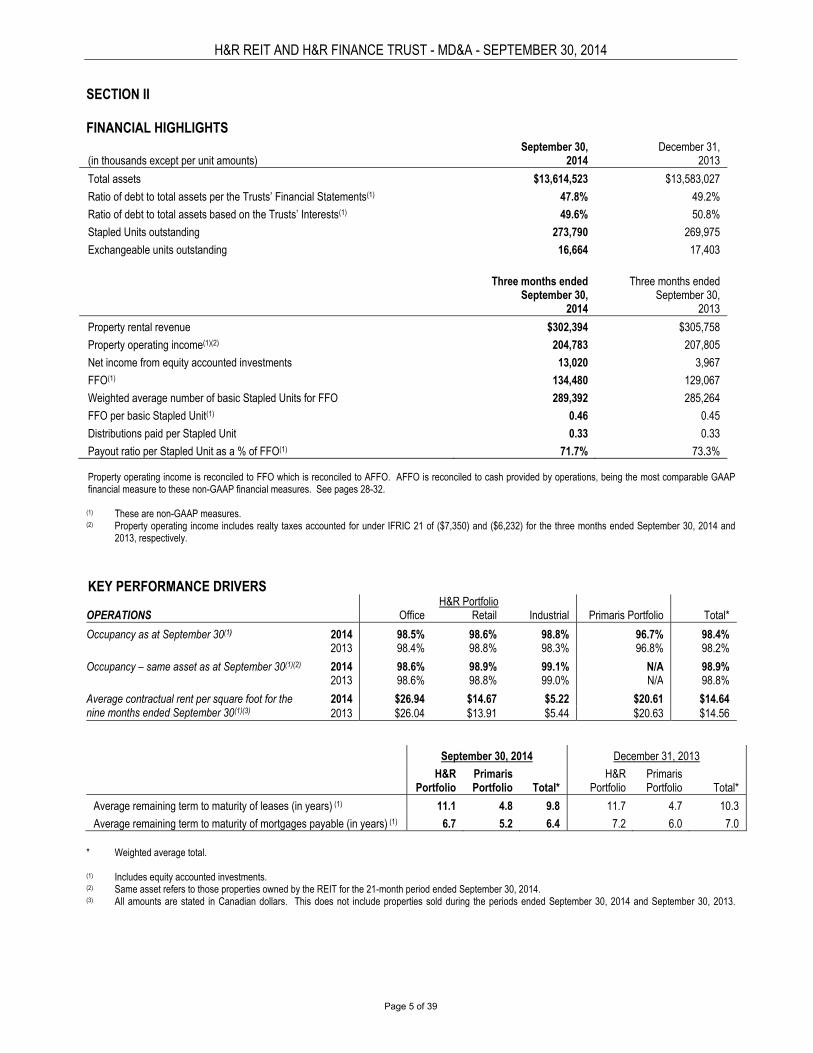
H&R REIT AND H&R FINANCE TRUST - MD&A - SEPTEMBER 30, 2014
Page 5 of 39
SECTION II FINANCIAL HIGHLIGHTS (in thousands except per unit amounts)
September 30, 2014
December 31, 2013
Total assets $13,614,523 $13,583,027
Ratio of debt to total assets per the Trusts’ Financial Statements(1) 47.8% 49.2%
Ratio of debt to total assets based on the Trusts’ Interests(1) 49.6% 50.8%
Stapled Units outstanding 273,790 269,975
Exchangeable units outstanding
16,664 17,403
Three months ended September 30,
2014
Three months ended September 30,
2013
Property rental revenue $302,394 $305,758
Property operating income(1)(2) 204,783 207,805
Net income from equity accounted investments 13,020 3,967
FFO(1) 134,480 129,067
Weighted average number of basic Stapled Units for FFO 289,392 285,264
FFO per basic Stapled Unit(1) 0.46 0.45
Distributions paid per Stapled Unit 0.33 0.33
Payout ratio per Stapled Unit as a % of FFO(1) 71.7% 73.3% Property operating income is reconciled to FFO which is reconciled to AFFO. AFFO is reconciled to cash provided by operations, being the most comparable GAAP financial measure to these non-GAAP financial measures. See pages 28-32.
(1) These are non-GAAP measures. (2) Property operating income includes realty taxes accounted for under IFRIC 21 of ($7,350) and ($6,232) for the three months ended September 30, 2014 and
2013, respectively.
KEY PERFORMANCE DRIVERS
H&R Portfolio OPERATIONS Office Retail Industrial Primaris Portfolio Total*
Occupancy as at September 30(1) 2014 98.5% 98.6% 98.8% 96.7% 98.4% 2013 98.4% 98.8% 98.3% 96.8% 98.2%
Occupancy – same asset as at September 30(1)(2) 2014 98.6% 98.9% 99.1% N/A 98.9% 2013 98.6% 98.8% 99.0% N/A 98.8%
Average contractual rent per square foot for the nine months ended September 30(1)(3)
2014 $26.94 $14.67 $5.22 $20.61 $14.64 2013 $26.04 $13.91 $5.44 $20.63 $14.56
September 30, 2014 December 31, 2013
H&R Portfolio
Primaris Portfolio
Total*
H&R Portfolio
Primaris Portfolio
Total*
Average remaining term to maturity of leases (in years) (1) 11.1 4.8 9.8 11.7 4.7 10.3
Average remaining term to maturity of mortgages payable (in years) (1) 6.7 5.2 6.4 7.2 6.0 7.0 * Weighted average total. (1) Includes equity accounted investments. (2) Same asset refers to those properties owned by the REIT for the 21-month period ended September 30, 2014. (3) All amounts are stated in Canadian dollars. This does not include properties sold during the periods ended September 30, 2014 and September 30, 2013.
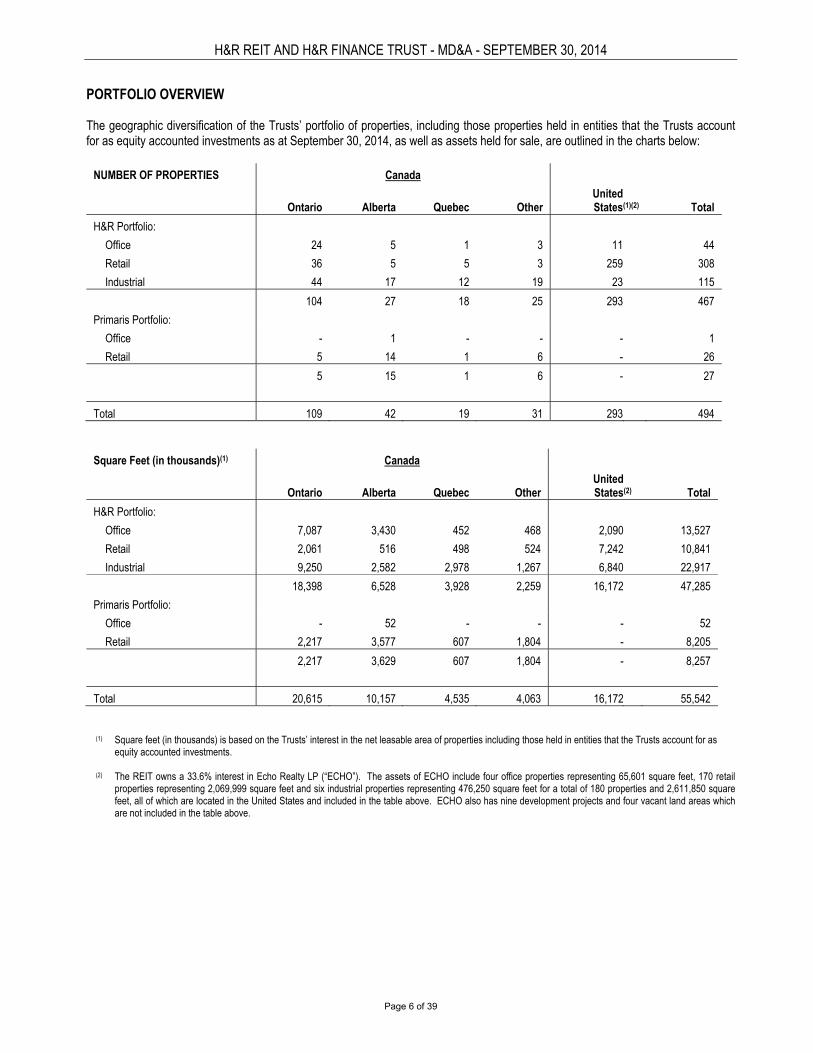
H&R REIT AND H&R FINANCE TRUST - MD&A - SEPTEMBER 30, 2014
Page 6 of 39
PORTFOLIO OVERVIEW The geographic diversification of the Trusts’ portfolio of properties, including those properties held in entities that the Trusts account for as equity accounted investments as at September 30, 2014, as well as assets held for sale, are outlined in the charts below:
NUMBER OF PROPERTIES Canada
Ontario
Alberta
Quebec
Other
United States
(1)(2)
Total
H&R Portfolio:
Office 24 5 1 3 11 44
Retail 36 5 5 3 259 308
Industrial 44 17 12 19 23 115
104 27 18 25 293 467
Primaris Portfolio:
Office - 1 - - - 1
Retail 5 14 1 6 - 26
5 15 1 6 - 27
Total 109 42 19 31 293 494
Square Feet (in thousands)(1) Canada
Ontario
Alberta
Quebec
Other
United States
(2)
Total
H&R Portfolio:
Office 7,087 3,430 452 468 2,090 13,527
Retail 2,061 516 498 524 7,242 10,841
Industrial 9,250 2,582 2,978 1,267 6,840 22,917
18,398 6,528 3,928 2,259 16,172 47,285
Primaris Portfolio:
Office - 52 - - - 52
Retail 2,217 3,577 607 1,804 - 8,205
2,217 3,629 607 1,804 - 8,257
Total 20,615 10,157 4,535 4,063 16,172 55,542
(1) Square feet (in thousands) is based on the Trusts’ interest in the net leasable area of properties including those held in entities that the Trusts account for as
equity accounted investments.
(2) The REIT owns a 33.6% interest in Echo Realty LP (“ECHO”). The assets of ECHO include four office properties representing 65,601 square feet, 170 retail properties representing 2,069,999 square feet and six industrial properties representing 476,250 square feet for a total of 180 properties and 2,611,850 square feet, all of which are located in the United States and included in the table above. ECHO also has nine development projects and four vacant land areas which are not included in the table above.
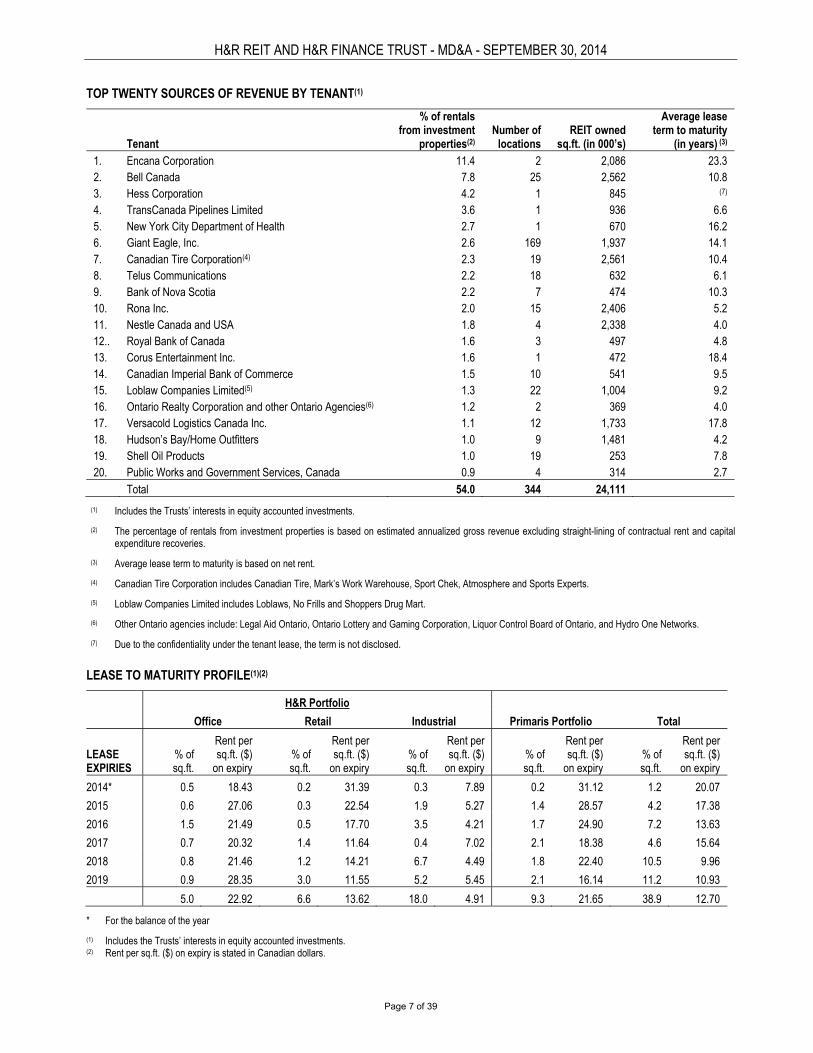
H&R REIT AND H&R FINANCE TRUST - MD&A - SEPTEMBER 30, 2014
Page 7 of 39
TOP TWENTY SOURCES OF REVENUE BY TENANT(1)
Tenant
% of rentals from investment
properties(2)
Number of
locations
REIT owned
sq.ft. (in 000’s)
Average lease term to maturity
(in years) (3) 1. Encana Corporation 11.4 2 2,086 23.3 2. Bell Canada 7.8 25 2,562 10.8 3. Hess Corporation 4.2 1 845 (7)
4. TransCanada Pipelines Limited 3.6 1 936 6.6 5. New York City Department of Health 2.7 1 670 16.2 6. Giant Eagle, Inc. 2.6 169 1,937 14.1 7. Canadian Tire Corporation(4) 2.3 19 2,561 10.4 8. Telus Communications 2.2 18 632 6.1 9. Bank of Nova Scotia 2.2 7 474 10.3 10. Rona Inc. 2.0 15 2,406 5.2 11. Nestle Canada and USA 1.8 4 2,338 4.0 12.. Royal Bank of Canada 1.6 3 497 4.8 13. Corus Entertainment Inc. 1.6 1 472 18.4 14. Canadian Imperial Bank of Commerce 1.5 10 541 9.5 15. Loblaw Companies Limited(5) 1.3 22 1,004 9.2 16. Ontario Realty Corporation and other Ontario Agencies(6) 1.2 2 369 4.0 17. Versacold Logistics Canada Inc. 1.1 12 1,733 17.8 18. Hudson’s Bay/Home Outfitters 1.0 9 1,481 4.2 19. Shell Oil Products 1.0 19 253 7.8 20. Public Works and Government Services, Canada 0.9 4 314 2.7 Total 54.0 344 24,111
(1) Includes the Trusts’ interests in equity accounted investments.
(2) The percentage of rentals from investment properties is based on estimated annualized gross revenue excluding straight-lining of contractual rent and capital expenditure recoveries.
(3) Average lease term to maturity is based on net rent.
(4) Canadian Tire Corporation includes Canadian Tire, Mark’s Work Warehouse, Sport Chek, Atmosphere and Sports Experts.
(5) Loblaw Companies Limited includes Loblaws, No Frills and Shoppers Drug Mart.
(6) Other Ontario agencies include: Legal Aid Ontario, Ontario Lottery and Gaming Corporation, Liquor Control Board of Ontario, and Hydro One Networks.
(7) Due to the confidentiality under the tenant lease, the term is not disclosed.
LEASE TO MATURITY PROFILE(1)(2)
H&R Portfolio
Office Retail Industrial Primaris Portfolio Total
LEASE EXPIRIES
% of sq.ft.
Rent per sq.ft. ($)
on expiry
% of sq.ft.
Rent per sq.ft. ($)
on expiry
% of sq.ft.
Rent per sq.ft. ($)
on expiry
% of sq.ft.
Rent per sq.ft. ($)
on expiry
% of sq.ft.
Rent per sq.ft. ($)
on expiry
2014* 0.5 18.43 0.2 31.39 0.3 7.89 0.2 31.12 1.2 20.07
2015 0.6 27.06 0.3 22.54 1.9 5.27 1.4 28.57 4.2 17.38
2016 1.5 21.49 0.5 17.70 3.5 4.21 1.7 24.90 7.2 13.63
2017 0.7 20.32 1.4 11.64 0.4 7.02 2.1 18.38 4.6 15.64
2018 0.8 21.46 1.2 14.21 6.7 4.49 1.8 22.40 10.5 9.96
2019 0.9 28.35 3.0 11.55 5.2 5.45 2.1 16.14 11.2 10.93
5.0 22.92 6.6 13.62 18.0 4.91 9.3 21.65 38.9 12.70
* For the balance of the year
(1) Includes the Trusts’ interests in equity accounted investments. (2) Rent per sq.ft. ($) on expiry is stated in Canadian dollars.
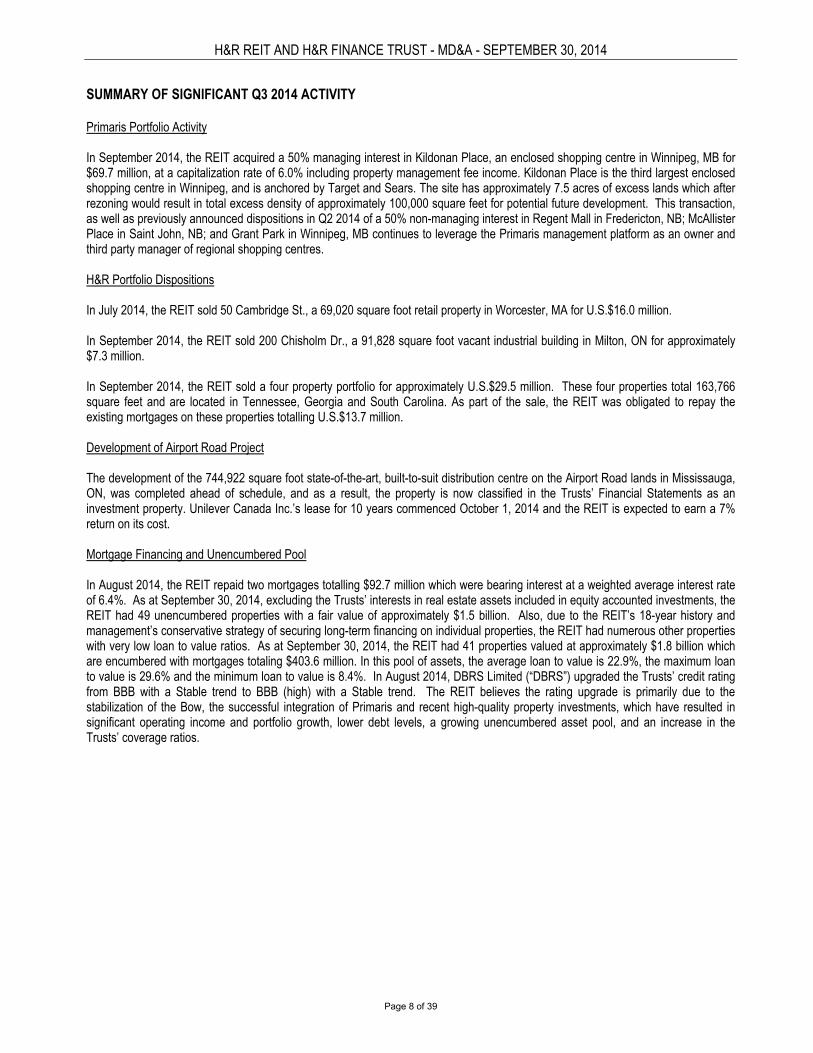
H&R REIT AND H&R FINANCE TRUST - MD&A - SEPTEMBER 30, 2014
Page 8 of 39
SUMMARY OF SIGNIFICANT Q3 2014 ACTIVITY Primaris Portfolio Activity In September 2014, the REIT acquired a 50% managing interest in Kildonan Place, an enclosed shopping centre in Winnipeg, MB for $69.7 million, at a capitalization rate of 6.0% including property management fee income. Kildonan Place is the third largest enclosed shopping centre in Winnipeg, and is anchored by Target and Sears. The site has approximately 7.5 acres of excess lands which after rezoning would result in total excess density of approximately 100,000 square feet for potential future development. This transaction, as well as previously announced dispositions in Q2 2014 of a 50% non-managing interest in Regent Mall in Fredericton, NB; McAllister Place in Saint John, NB; and Grant Park in Winnipeg, MB continues to leverage the Primaris management platform as an owner and third party manager of regional shopping centres. H&R Portfolio Dispositions In July 2014, the REIT sold 50 Cambridge St., a 69,020 square foot retail property in Worcester, MA for U.S.$16.0 million. In September 2014, the REIT sold 200 Chisholm Dr., a 91,828 square foot vacant industrial building in Milton, ON for approximately $7.3 million. In September 2014, the REIT sold a four property portfolio for approximately U.S.$29.5 million. These four properties total 163,766 square feet and are located in Tennessee, Georgia and South Carolina. As part of the sale, the REIT was obligated to repay the existing mortgages on these properties totalling U.S.$13.7 million. Development of Airport Road Project The development of the 744,922 square foot state-of-the-art, built-to-suit distribution centre on the Airport Road lands in Mississauga, ON, was completed ahead of schedule, and as a result, the property is now classified in the Trusts’ Financial Statements as an investment property. Unilever Canada Inc.’s lease for 10 years commenced October 1, 2014 and the REIT is expected to earn a 7% return on its cost. Mortgage Financing and Unencumbered Pool In August 2014, the REIT repaid two mortgages totalling $92.7 million which were bearing interest at a weighted average interest rate of 6.4%. As at September 30, 2014, excluding the Trusts’ interests in real estate assets included in equity accounted investments, the REIT had 49 unencumbered properties with a fair value of approximately $1.5 billion. Also, due to the REIT’s 18-year history and management’s conservative strategy of securing long-term financing on individual properties, the REIT had numerous other properties with very low loan to value ratios. As at September 30, 2014, the REIT had 41 properties valued at approximately $1.8 billion which are encumbered with mortgages totaling $403.6 million. In this pool of assets, the average loan to value is 22.9%, the maximum loan to value is 29.6% and the minimum loan to value is 8.4%. In August 2014, DBRS Limited (“DBRS”) upgraded the Trusts’ credit rating from BBB with a Stable trend to BBB (high) with a Stable trend. The REIT believes the rating upgrade is primarily due to the stabilization of the Bow, the successful integration of Primaris and recent high-quality property investments, which have resulted in significant operating income and portfolio growth, lower debt levels, a growing unencumbered asset pool, and an increase in the Trusts’ coverage ratios.
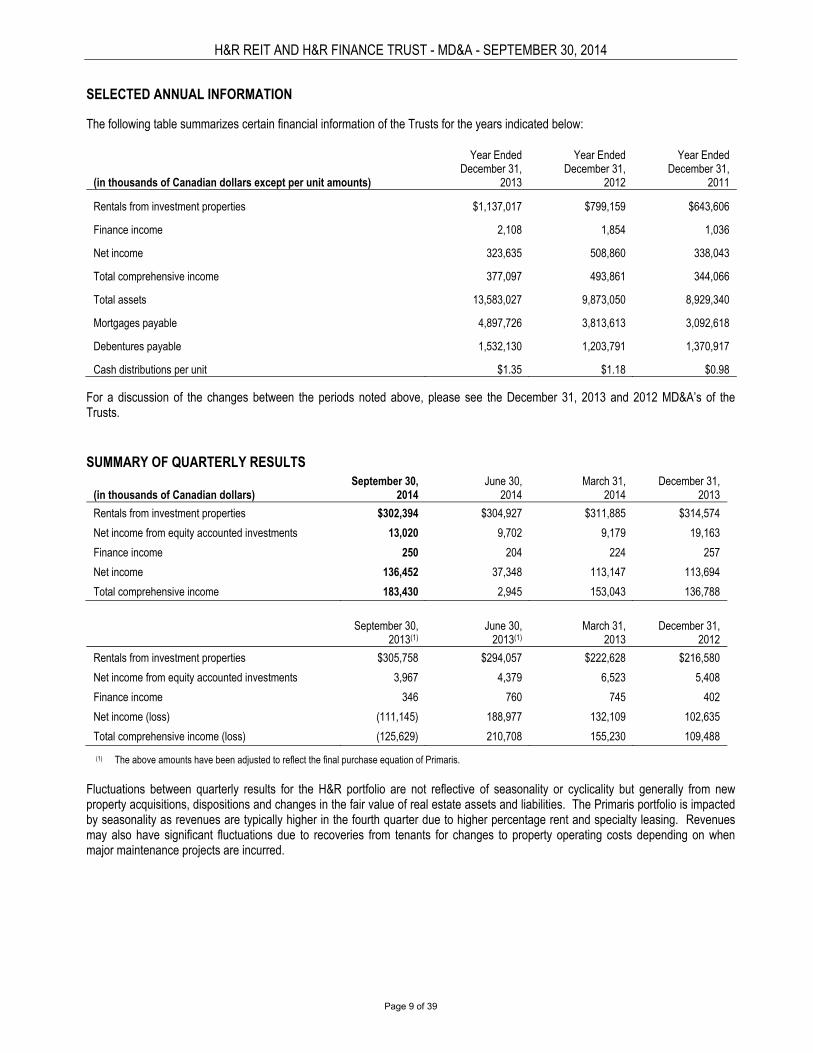
H&R REIT AND H&R FINANCE TRUST - MD&A - SEPTEMBER 30, 2014
Page 9 of 39
SELECTED ANNUAL INFORMATION The following table summarizes certain financial information of the Trusts for the years indicated below:
(in thousands of Canadian dollars except per unit amounts)
Year Ended December 31,
2013
Year Ended December 31,
2012
Year Ended December 31,
2011
Rentals from investment properties $1,137,017 $799,159 $643,606
Finance income 2,108 1,854 1,036
Net income 323,635 508,860 338,043
Total comprehensive income 377,097 493,861 344,066
Total assets 13,583,027 9,873,050 8,929,340
Mortgages payable 4,897,726 3,813,613 3,092,618
Debentures payable 1,532,130 1,203,791 1,370,917
Cash distributions per unit $1.35 $1.18 $0.98 For a discussion of the changes between the periods noted above, please see the December 31, 2013 and 2012 MD&A’s of the Trusts. SUMMARY OF QUARTERLY RESULTS
(in thousands of Canadian dollars)
September 30, 2014
June 30, 2014
March 31, 2014
December 31, 2013
Rentals from investment properties $302,394 $304,927 $311,885 $314,574
Net income from equity accounted investments 13,020 9,702 9,179 19,163
Finance income 250 204 224 257
Net income 136,452 37,348 113,147 113,694
Total comprehensive income 183,430 2,945 153,043 136,788
September 30, 2013(1)
June 30, 2013(1)
March 31, 2013
December 31, 2012
Rentals from investment properties $305,758 $294,057 $222,628 $216,580
Net income from equity accounted investments 3,967 4,379 6,523 5,408
Finance income 346 760 745 402
Net income (loss) (111,145) 188,977 132,109 102,635
Total comprehensive income (loss) (125,629) 210,708 155,230 109,488
(1) The above amounts have been adjusted to reflect the final purchase equation of Primaris. Fluctuations between quarterly results for the H&R portfolio are not reflective of seasonality or cyclicality but generally from new property acquisitions, dispositions and changes in the fair value of real estate assets and liabilities. The Primaris portfolio is impacted by seasonality as revenues are typically higher in the fourth quarter due to higher percentage rent and specialty leasing. Revenues may also have significant fluctuations due to recoveries from tenants for changes to property operating costs depending on when major maintenance projects are incurred.
H&R REIT AND H&R FINANCE TRUST - MD&A - SEPTEMBER 30, 2014
Page 10 of 39
SECTION III RESULTS OF OPERATIONS Three months ended September 30
2014 2013 (in thousands of Canadian dollars)
Amounts per the Trusts’
Financial Statements
Equity
accounted investments
The Trusts’ interests
Amounts per the Trusts’
Financial Statements
Equity
accounted investments
The Trusts’ interests
Property operating income:
Rentals from investment properties $302,394 $27,492 $329,886 $305,758 $19,314 $325,072
Property operating costs (97,611) (9,605) (107,216) (97,953) (8,160) (106,113)
204,783 17,887 222,670 207,805 11,154 218,959
Net income from equity accounted investments 13,020 (13,234) (214) 3,967 (3,975) (8)
Finance costs:
Finance income 250 44 294 346 20 366
Finance cost - operations (79,496) (5,015) (84,511) (80,957) (3,325) (84,282)
Gain on change in fair value 25,612 - 25,612 3,829 - 3,829
(53,634) (4,971) (58,605) (76,782) (3,305) (80,087)
Trust expenses 298 183 481 (1,484) (86) (1,570)
Amortization (2,210) (171) (2,381) (2,138) (48) (2,186)
Fair value adjustment on real estate assets (33,300) 449 (32,851) (34,068) (3,756) (37,824)
Gain (loss) on sale of real estate assets 1,531 337 1,868 (25) - (25)
Gain (loss) on foreign exchange 11,317 - 11,317 (4,457) - (4,457)
Transaction costs - - - (198,214) - (198,214)
Net income (loss) before income taxes 141,805 480 142,285 (105,396) (16) (105,412)
Income tax expense (5,353) (57) (5,410) (5,749) (15) (5,764)
Net income (loss) attributable to the Trusts’ unitholders
136,452
423
136,875
(111,145)
(31)
(111,176)
Non-controlling interest - (423) (423) - 31 31
Net income (loss) 136,452 - 136,452 (111,145) - (111,145)
Other comprehensive income (loss):
Unrealized gain (loss) on translation of U.S. denominated foreign operations
46,870
-
46,870
(14,589)
-
(14,589)
Transfer of realized loss on cash flow hedges to net income
108
-
108
105
-
105
46,978 - 46,978 (14,484) - (14,484)
Total comprehensive income (loss) all attributable to unitholders
$183,430
$ -
$183,430
($125,629)
$ -
($125,629)
The increase in net income before income taxes for the three months ended September 30, 2014 as compared to the three months ended September 30, 2013 is primarily due to a decrease in transaction costs, the gain on change in fair value and the gain (loss) on foreign exchange.
H&R REIT AND H&R FINANCE TRUST - MD&A - SEPTEMBER 30, 2014
Page 11 of 39
RESULTS OF OPERATIONS Nine months ended September 30
2014 2013 (in thousands of Canadian dollars)
Amounts per the Trusts’
Financial Statements
Equity
accounted investments
The Trusts’ interests
Amounts per the Trusts’
Financial Statements
Equity
accounted investments
The Trusts’ interests
Property operating income:
Rentals from investment properties $919,206 $77,846 $997,052 $822,443 $47,081 $869,524
Property operating costs (324,191) (28,718) (352,909) (284,829) (20,246) (305,075)
595,015 49,128 644,143 537,614 26,835 564,449
Net income from equity accounted investments 31,901 (31,826) 75 14,869 (14,877) (8)
Finance costs:
Finance income 678 124 802 1,851 39 1,890
Finance cost - operations (244,708) (14,673) (259,381) (225,822) (8,401) (234,223)
Gain (loss) on change in fair value (13,207) - (13,207) 36,488 - 36,488
(257,237) (14,549) (271,786) (187,483) (8,362) (195,845)
Trust expenses (7,070) (388) (7,458) (2,294) (86) (2,380)
Amortization (6,416) (378) (6,794) (5,447) (52) (5,499)
Fair value adjustment on real estate assets (46,675) (1,573) (48,248) 70,150 (3,474) 66,676
Gain (loss) on sale of real estate assets (3,468) 578 (2,890) (1,863) - (1,863)
Gain on foreign exchange 13,591 - 13,591 7,270 - 7,270
Transaction costs - - - (204,819) - (204,819)
Net income before income taxes 319,641 992 320,633 227,997 (16) 227,981
Income tax expense (32,694) (134) (32,828) (18,056) (15) (18,071)
Net income attributable to the Trusts’ unitholders 286,947 858 287,805 209,941 (31) 209,910
Non-controlling interest - (858) (858) - 31 31
Net income 286,947 - 286,947 209,941 - 209,941
Other comprehensive income:
Unrealized gain on translation of U.S. denominated foreign operations
52,150
-
52,150
30,058
-
30,058
Transfer of realized loss on cash flow hedges to net income
321
-
321
310
-
310
52,471 - 52,471 30,368 - 30,368
Total comprehensive income all attributable to unitholders
$339,418
$ -
$339,418
$240,309
$ -
$240,309
The increase in net income before income taxes for the nine months ended September 30, 2014 as compared to the nine months ended September 30, 2013 is primarily due to a decrease in transaction costs and an increase in property operating income due to acquisitions, including Primaris, offset by the fair value adjustment on real estate assets, higher finance costs - operations and the gain (loss) on change in fair value.

H&R REIT AND H&R FINANCE TRUST - MD&A - SEPTEMBER 30, 2014
Page 12 of 39
PROPERTY OPERATING INCOME
Property operating income consists of rentals from investment properties (“rentals”) less property operating costs. Rentals include all amounts earned from tenants related to lease agreements, including basic rent, parking income, operating costs and realty tax recoveries. Property operating costs primarily consist of realty taxes, maintenance and utilities. Maintenance includes costs relating to items such as cleaning, interior and exterior building repairs and maintenance, elevator, HVAC, security and wages and benefits. Adjusted property operating income adjusts property operating income to exclude the realty tax adjustment accounted for under IFRIC 21. “Same-asset” refers to those properties owned by the REIT for the 21-month period ended September 30, 2014. “Transactions” refers to property operating income earned from acquisitions, business combinations, dispositions and transfers of properties under development to investment properties.
Three months ended September 30, 2014 Three months ended September 30, 2013
(in thousands of Canadian dollars) Same-Asset Transactions Total Same-Asset Transactions Total
Rentals $187,181 $110,495 $297,676 $181,528 $119,758 $301,286
Percentage rent 143 676 819 362 658 1,020
Straight-lining of contractual rent 1,092 2,807 3,899 1,447 2,005 3,452
Total rentals 188,416 113,978 302,394 183,337 122,421 305,758
Property operating costs (54,250) (43,361) (97,611) (50,499) (47,454) (97,953)
Property operating income 134,166 70,617 204,783 132,838 74,967 207,805
Realty taxes accounted for under IFRIC 21
(7,183)
(167)
(7,350)
(6,376)
144
(6,232)
Adjusted property operating income $126,983 $70,450 $197,433 $126,462 $75,111 $201,573
Same-asset adjusted property operating income increased by $0.5 million in Q3 2014 compared to Q3 2013 primarily due to the strengthening of the U.S. dollar compared to the Canadian dollar. Adjusted property operating income earned from transactions decreased by $4.7 million for the three months ended September 30, 2014 compared to the three months ended September 30, 2013 primarily due to the disposition of an interest in several properties in 2014.
Nine months ended September 30, 2014 Nine months ended September 30, 2013
(in thousands of Canadian dollars) Same-Asset Transactions Total Same-Asset Transactions Total
Rentals $556,215 $348,569 $904,784 $538,716 $253,166 $791,882
Percentage rent 411 1,266 1,677 964 991 1,955
Straight-lining of contractual rent 4,581 8,164 12,745 1,843 26,763 28,606
Total rentals 561,207 357,999 919,206 541,523 280,920 822,443
Property operating costs (183,177) (141,014) (324,191) (177,932) (106,897) (284,829)
Property operating income 378,030 216,985 595,015 363,591 174,023 537,614
Realty taxes accounted for under IFRIC 21
6,885
63
6,948
7,590
118
7,708
Adjusted property operating income $384,915 $217,048 $601,963 $371,181 $174,141 $545,322 Same-asset adjusted property operating income increased by $13.7 million or 3.7% for the nine months ended September 30, 2014 compared to the nine months ended September 30, 2013 primarily due to the strengthening of the U.S. dollar compared to the Canadian dollar and the termination of the REIT’s external property management contract. Included in same-asset adjusted property operating income for the nine months ended September 30, 2013 is a one-time adjustment to straight-lining of contractual rent of $2.4 million. Without this one-time adjustment, same-asset straight-lining of contractual rent would have been $4.3 million and same-asset adjusted property operating income would have been $373.6 million for the nine months ended September 30, 2013.
H&R REIT AND H&R FINANCE TRUST - MD&A - SEPTEMBER 30, 2014
Page 13 of 39
Adjusted property operating income earned from Transactions increased by $42.9 million for the nine months ended September 30, 2014 compared to the nine months ended September 30, 2013 primarily due to the REIT acquiring the Primaris portfolio on April 4, 2013, offset by property dispositions throughout 2013 and 2014. Included in same-asset adjusted property operating income are the following items which although they occur regularly, can be a source of significant variances between different periods:
Three months ended September 30 Nine months ended September 30
(in thousands of Canadian dollars) 2014 2013 Change 2014 2013 Change
Additional recoveries net of capital expenditures $2,087 $2,503 ($416) $6,364 $6,166 $198
Sundry income 507 279 228 1,146 1,680 (534)
Effect on same-asset - property operating income $2,594 $2,782 ($188) $7,510 $7,846 ($336)
Additional recoveries net of capital expenditures vary from period to period as many of the REIT’s properties are single-tenant buildings with triple net leases, which allows for certain items to be recovered from tenants even if the cost of the work is capitalized to investment properties. Sundry income typically includes one-time, non-recurring items such as lease termination payments. Refer to the “Segmented Information” section of this MD&A for further details on property operating income. SEGMENTED INFORMATION
Operating Segments: The Trusts have two operating segments: the H&R portfolio and the Primaris portfolio. The investment policy of the H&R portfolio, which includes office, industrial and mostly single tenanted retail properties in Canadian and the United States, is to lease its properties on a long-term basis to creditworthy tenants. The Primaris portfolio consists of enclosed shopping centres and multi-tenant retail plazas in Canada. These Primaris assets are managed separately from those in the H&R portfolio, and the CEO who is the chief operating decision maker, assesses the results of these operations separately. The CEO primarily measures the performance of investment properties based on property operating income as this is a key indicator of the REIT’s performance. Further disclosure of segmented information by operating segment can be found in the Trusts’ Financial Statements.
Property operating income for the three months ended September 30, 2014 (in thousands of Canadian dollars)
H&R Portfolio
Primaris Portfolio
Total per the Trusts’
Financial Statements
Equity
accounted investments
The Trusts’ interests
Rentals from investment properties $231,704 $70,690 $302,394 $27,492 $329,886
Property operating costs (68,545) (29,066) (97,611) (9,605) (107,216)
Property operating income 163,159 41,624 204,783 17,887 222,670
Realty taxes accounted for under IFRIC 21 (7,350) - (7,350) (1,049) (8,399)
Adjusted property operating income $155,809 $41,624 $197,433 $16,838 $214,271
H&R REIT AND H&R FINANCE TRUST - MD&A - SEPTEMBER 30, 2014
Page 14 of 39
Property operating income for the three months ended September 30, 2013 (in thousands of Canadian dollars)
H&R Portfolio
Primaris Portfolio
Total per the Trusts’
Financial Statements
Equity
accounted investments
The Trusts’ interests
Rentals from investment properties $227,630 $78,128 $305,758 $19,314 $325,072
Property operating costs (64,267) (33,686) (97,953) (8,160) (106,113)
Property operating income 163,363 44,442 207,805 11,154 218,959
Realty taxes accounted for under IFRIC 21 (6,232) - (6,232) (296) (6,528)
Adjusted property operating income $157,131 $44,442 $201,573 $10,858 $212,431
Property operating income for the nine months ended September 30, 2014 (in thousands of Canadian dollars)
H&R Portfolio
Primaris Portfolio
Total per the Trusts’
Financial Statements
Equity
accounted investments
The Trusts’ interests
Rentals from investment properties $698,841 $220,365 $919,206 $77,846 $997,052
Property operating costs (230,827) (93,364) (324,191) (28,718) (352,909)
Property operating income 468,014 127,001 595,015 49,128 644,143
Realty taxes accounted for under IFRIC 21 6,948 - 6,948 253 7,201
Adjusted property operating income $474,962 $127,001 $601,963 $49,381 $651,344
Property operating income for the nine months ended September 30, 2013 (in thousands of Canadian dollars)
H&R Portfolio
Primaris Portfolio
Total per the Trusts’
Financial Statements
Equity
accounted investments
The Trusts’ interests
Rentals from investment properties $676,131 $146,312 $822,443 $47,081 $869,524
Property operating costs (224,008) (60,821) (284,829) (20,246) (305,075)
Property operating income 452,123 85,491 537,614 26,835 564,449
Realty taxes accounted for under IFRIC 21 7,708 - 7,708 (296) 7,412
Adjusted property operating income $459,831 $85,491 $545,322 $26,539 $571,861 Property Operating Income – Primaris portfolio: Property operating income from the Primaris portfolio decreased by $2.8 million for the three months ended September 30, 2014 compared to the three months ended September 30, 2013 primarily due to the four partial dispositions that occurred in the second quarter of 2014 and the third quarter of 2013, partially offset by the acquisition of Kildonan Place in September 2014 and Peter Pond Mall in July 2013. The decrease in property operating income is due to the following: the net impact of these transactions contributing $4.4 million partially offset by the remainder of the same property portfolio which increased $1.6 million. Property operating income from the Primaris portfolio increased by $41.5 million for the nine months ended September 30, 2014 compared to the nine months ended September 30, 2013 primarily due to the fact that the Primaris portfolio was acquired on April 4, 2013 and therefore contributed slightly less than a full six months of property operating income in 2013 compared to a full nine months of property operating income in 2014. For the 11 enclosed shopping centres within the Primaris portfolio, sales per square foot, on a same-tenant basis, for Commercial Retail Units (“CRU”), have decreased to $500 per square foot for the twelve months ended August 31, 2014 from $504 in the comparative period. For the same 11 properties within the Primaris portfolio, all store sales decreased by 1.2%. These figures only include enclosed shopping centres owned by Primaris for the entire rolling 24-month period ending August 31, 2014.
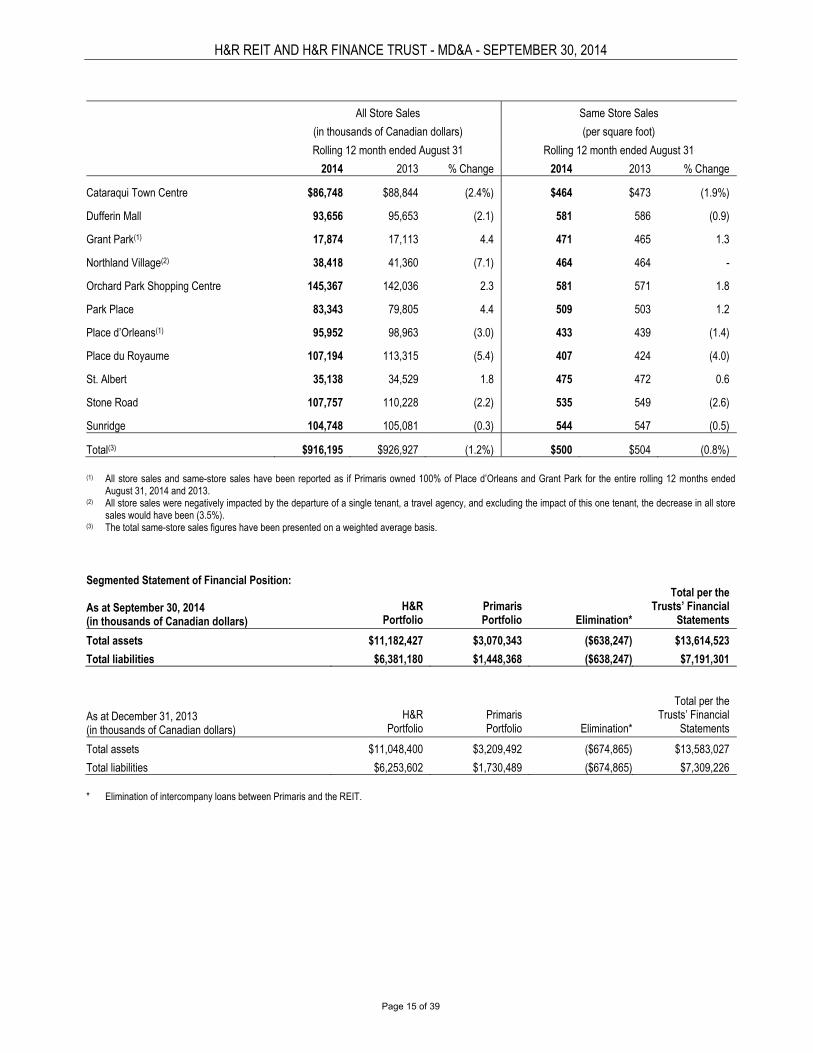
H&R REIT AND H&R FINANCE TRUST - MD&A - SEPTEMBER 30, 2014
Page 15 of 39
All Store Sales Same Store Sales
(in thousands of Canadian dollars) (per square foot)
Rolling 12 month ended August 31 Rolling 12 month ended August 31
2014 2013 % Change 2014 2013 % Change
Cataraqui Town Centre $86,748 $88,844 (2.4%) $464 $473 (1.9%)
Dufferin Mall 93,656 95,653 (2.1) 581 586 (0.9)
Grant Park(1) 17,874 17,113 4.4 471 465 1.3
Northland Village(2) 38,418 41,360 (7.1) 464 464 -
Orchard Park Shopping Centre 145,367 142,036 2.3 581 571 1.8
Park Place 83,343 79,805 4.4 509 503 1.2
Place d’Orleans(1) 95,952 98,963 (3.0) 433 439 (1.4)
Place du Royaume 107,194 113,315 (5.4) 407 424 (4.0)
St. Albert 35,138 34,529 1.8 475 472 0.6
Stone Road 107,757 110,228 (2.2) 535 549 (2.6)
Sunridge 104,748 105,081 (0.3) 544 547 (0.5)
Total(3) $916,195 $926,927 (1.2%) $500 $504 (0.8%) (1) All store sales and same-store sales have been reported as if Primaris owned 100% of Place d’Orleans and Grant Park for the entire rolling 12 months ended
August 31, 2014 and 2013. (2) All store sales were negatively impacted by the departure of a single tenant, a travel agency, and excluding the impact of this one tenant, the decrease in all store
sales would have been (3.5%). (3) The total same-store sales figures have been presented on a weighted average basis.
Segmented Statement of Financial Position: As at September 30, 2014 (in thousands of Canadian dollars)
H&R Portfolio
Primaris Portfolio
Elimination*
Total per the Trusts’ Financial
Statements
Total assets $11,182,427 $3,070,343 ($638,247) $13,614,523
Total liabilities $6,381,180 $1,448,368 ($638,247) $7,191,301
As at December 31, 2013 (in thousands of Canadian dollars)
H&R
Portfolio
Primaris Portfolio
Elimination*
Total per the Trusts’ Financial
Statements
Total assets $11,048,400 $3,209,492 ($674,865) $13,583,027
Total liabilities $6,253,602 $1,730,489 ($674,865) $7,309,226 * Elimination of intercompany loans between Primaris and the REIT.
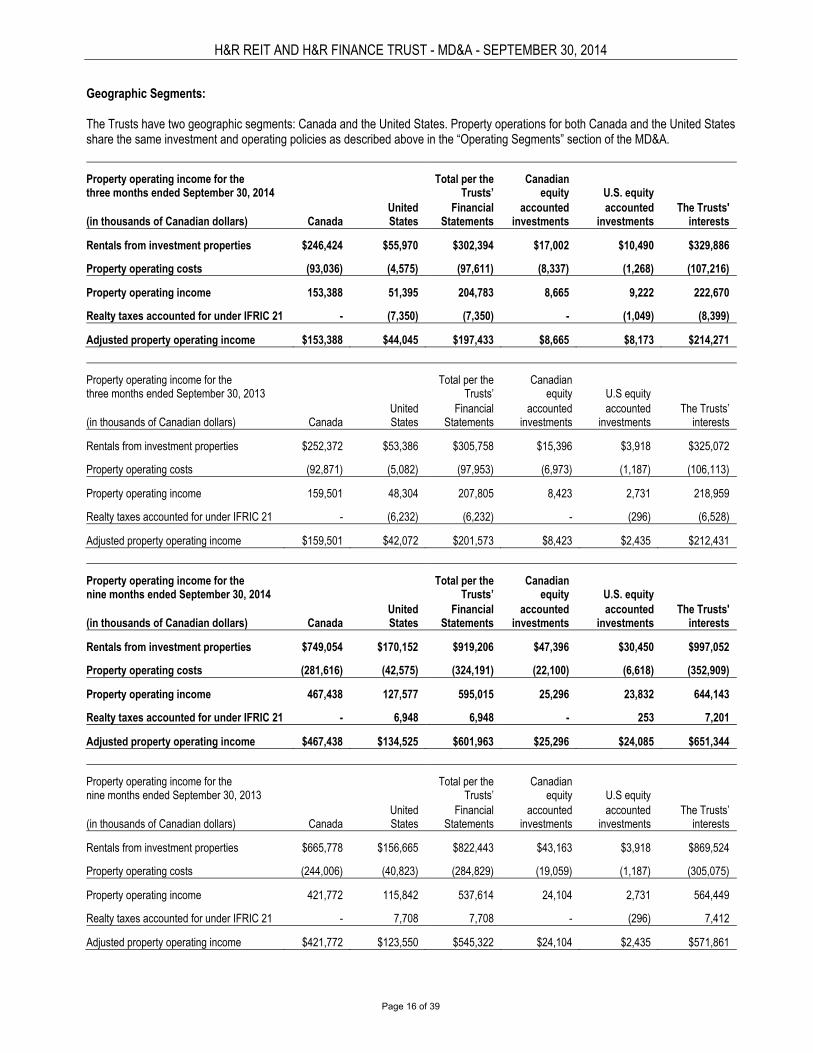
H&R REIT AND H&R FINANCE TRUST - MD&A - SEPTEMBER 30, 2014
Page 16 of 39
Geographic Segments: The Trusts have two geographic segments: Canada and the United States. Property operations for both Canada and the United States share the same investment and operating policies as described above in the “Operating Segments” section of the MD&A.
Property operating income for the
Total per the Canadian
three months ended September 30, 2014 Trusts’ equity U.S. equity United Financial accounted accounted The Trusts' (in thousands of Canadian dollars) Canada States Statements investments investments interests
Rentals from investment properties $246,424 $55,970 $302,394 $17,002 $10,490 $329,886
Property operating costs (93,036) (4,575) (97,611) (8,337) (1,268) (107,216)
Property operating income 153,388 51,395 204,783 8,665 9,222 222,670
Realty taxes accounted for under IFRIC 21 - (7,350) (7,350) - (1,049) (8,399)
Adjusted property operating income $153,388 $44,045 $197,433 $8,665 $8,173 $214,271
Property operating income for the
Total per the Canadian
three months ended September 30, 2013 Trusts’ equity U.S equity United Financial accounted accounted The Trusts’ (in thousands of Canadian dollars) Canada States Statements investments investments interests
Rentals from investment properties $252,372 $53,386 $305,758 $15,396 $3,918 $325,072
Property operating costs (92,871) (5,082) (97,953) (6,973) (1,187) (106,113)
Property operating income 159,501 48,304 207,805 8,423 2,731 218,959
Realty taxes accounted for under IFRIC 21 - (6,232) (6,232) - (296) (6,528)
Adjusted property operating income $159,501 $42,072 $201,573 $8,423 $2,435 $212,431
Property operating income for the
Total per the Canadian
nine months ended September 30, 2014 Trusts’ equity U.S. equity United Financial accounted accounted The Trusts' (in thousands of Canadian dollars) Canada States Statements investments investments interests
Rentals from investment properties $749,054 $170,152 $919,206 $47,396 $30,450 $997,052
Property operating costs (281,616) (42,575) (324,191) (22,100) (6,618) (352,909)
Property operating income 467,438 127,577 595,015 25,296 23,832 644,143
Realty taxes accounted for under IFRIC 21 - 6,948 6,948 - 253 7,201
Adjusted property operating income $467,438 $134,525 $601,963 $25,296 $24,085 $651,344
Property operating income for the
Total per the Canadian
nine months ended September 30, 2013 Trusts’ equity U.S equity United Financial accounted accounted The Trusts’ (in thousands of Canadian dollars) Canada States Statements investments investments interests
Rentals from investment properties $665,778 $156,665 $822,443 $43,163 $3,918 $869,524
Property operating costs (244,006) (40,823) (284,829) (19,059) (1,187) (305,075)
Property operating income 421,772 115,842 537,614 24,104 2,731 564,449
Realty taxes accounted for under IFRIC 21 - 7,708 7,708 - (296) 7,412
Adjusted property operating income $421,772 $123,550 $545,322 $24,104 $2,435 $571,861
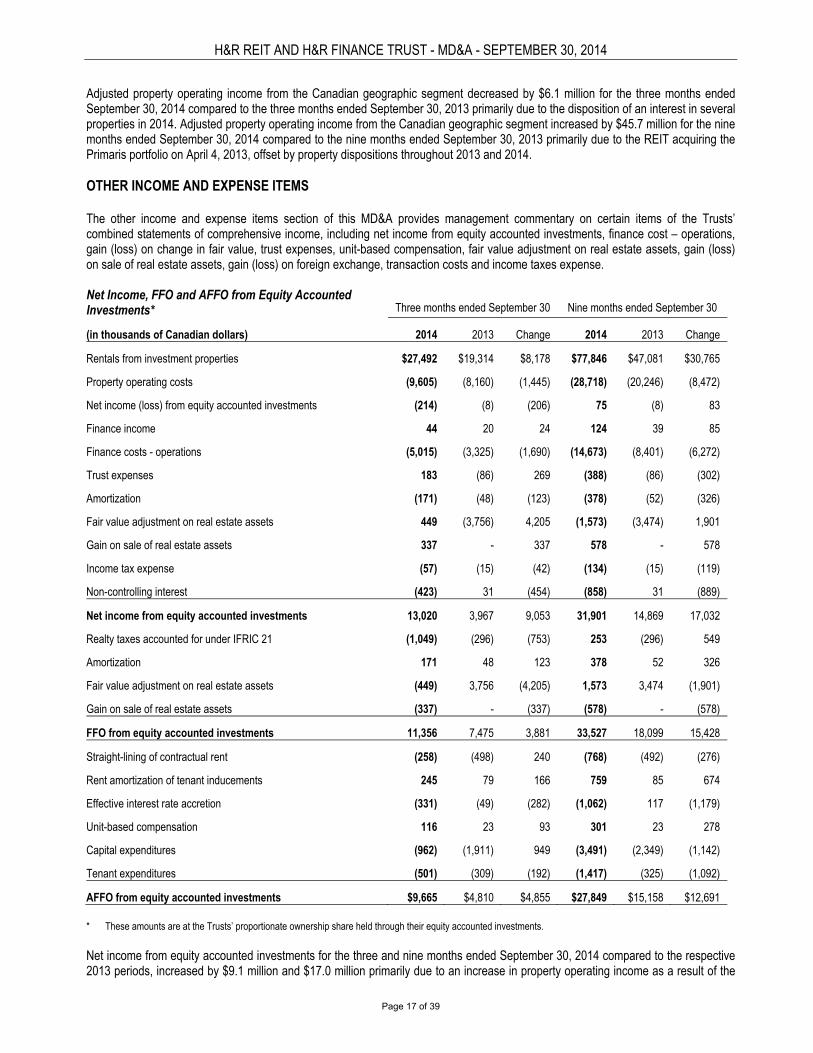
H&R REIT AND H&R FINANCE TRUST - MD&A - SEPTEMBER 30, 2014
Page 17 of 39
Adjusted property operating income from the Canadian geographic segment decreased by $6.1 million for the three months ended September 30, 2014 compared to the three months ended September 30, 2013 primarily due to the disposition of an interest in several properties in 2014. Adjusted property operating income from the Canadian geographic segment increased by $45.7 million for the nine months ended September 30, 2014 compared to the nine months ended September 30, 2013 primarily due to the REIT acquiring the Primaris portfolio on April 4, 2013, offset by property dispositions throughout 2013 and 2014. OTHER INCOME AND EXPENSE ITEMS The other income and expense items section of this MD&A provides management commentary on certain items of the Trusts’ combined statements of comprehensive income, including net income from equity accounted investments, finance cost – operations, gain (loss) on change in fair value, trust expenses, unit-based compensation, fair value adjustment on real estate assets, gain (loss) on sale of real estate assets, gain (loss) on foreign exchange, transaction costs and income taxes expense. Net Income, FFO and AFFO from Equity Accounted Investments*
Three months ended September 30
Nine months ended September 30
(in thousands of Canadian dollars) 2014 2013 Change 2014 2013 Change
Rentals from investment properties $27,492 $19,314 $8,178 $77,846 $47,081 $30,765
Property operating costs (9,605) (8,160) (1,445) (28,718) (20,246) (8,472)
Net income (loss) from equity accounted investments (214) (8) (206) 75 (8) 83
Finance income 44 20 24 124 39 85
Finance costs - operations (5,015) (3,325) (1,690) (14,673) (8,401) (6,272)
Trust expenses 183 (86) 269 (388) (86) (302)
Amortization (171) (48) (123) (378) (52) (326)
Fair value adjustment on real estate assets 449 (3,756) 4,205 (1,573) (3,474) 1,901
Gain on sale of real estate assets 337 - 337 578 - 578
Income tax expense (57) (15) (42) (134) (15) (119)
Non-controlling interest (423) 31 (454) (858) 31 (889)
Net income from equity accounted investments 13,020 3,967 9,053 31,901 14,869 17,032
Realty taxes accounted for under IFRIC 21 (1,049) (296) (753) 253 (296) 549
Amortization 171 48 123 378 52 326
Fair value adjustment on real estate assets (449) 3,756 (4,205) 1,573 3,474 (1,901)
Gain on sale of real estate assets (337) - (337) (578) - (578)
FFO from equity accounted investments 11,356 7,475 3,881 33,527 18,099 15,428
Straight-lining of contractual rent (258) (498) 240 (768) (492) (276)
Rent amortization of tenant inducements 245 79 166 759 85 674
Effective interest rate accretion (331) (49) (282) (1,062) 117 (1,179)
Unit-based compensation 116 23 93 301 23 278
Capital expenditures (962) (1,911) 949 (3,491) (2,349) (1,142)
Tenant expenditures (501) (309) (192) (1,417) (325) (1,092)
AFFO from equity accounted investments $9,665 $4,810 $4,855 $27,849 $15,158 $12,691 * These amounts are at the Trusts’ proportionate ownership share held through their equity accounted investments. Net income from equity accounted investments for the three and nine months ended September 30, 2014 compared to the respective 2013 periods, increased by $9.1 million and $17.0 million primarily due to an increase in property operating income as a result of the
H&R REIT AND H&R FINANCE TRUST - MD&A - SEPTEMBER 30, 2014
Page 18 of 39
acquisition of a 33.6% interest in ECHO in August 2013. ECHO reports its financial results to the REIT one month in arrears due to time constraints on its reporting. Therefore, the 2013 financial results for ECHO in the table above only represent one month’s activity. The above amounts for the three months ended September 30, 2014 include ECHO’s financial information from June 1, 2014 to August 31, 2014 and the above amounts for the nine months ended September 30, 2014 include ECHO’s financial information from December 1, 2013 to August 31, 2014.
Finance Cost - Operations Three months ended September 30 Nine months ended September 30
(in thousands of Canadian dollars) 2014 2013 Change 2014 2013 Change
Contractual interest on mortgages payable $55,649 $60,694 ($5,045) $174,495 $170,255 $4,240
Contractual interest on debentures payable 17,162 14,979 2,183 50,916 44,908 6,008
Interest on construction loans - - - - 144 (144)
Effective interest rate accretion (858) (1,566) 708 (3,386) (3,015) (371)
Bank interest and charges 2,302 3,111 (809) 6,478 5,970 508
Exchangeable unit distributions 5,790 3,739 2,051 17,537 8,092 9,445
80,045 80,957 (912) 246,040 226,354 19,686
Capitalized interest (549) - (549) (1,332) (532) (800)
Finance cost - operations $79,496 $80,957 ($1,461) $244,708 $225,822 $18,886 The decrease in contractual interest on mortgages payable for the three months ended September 30, 2014 as compared to the respective 2013 period is primarily due to mortgages being assumed and discharged upon the disposal of properties and the repayment of mortgages due upon maturity. The increase in contractual interest on mortgages payable for the nine months ended September 30, 2014 as compared to the respective 2013 period is primarily due to the REIT acquiring the Primaris portfolio in April 2013 and the issuance of the Series C Bow Bonds in June 2013. This was offset by mortgages being assumed and discharged upon the disposal of properties and the repayment of mortgages due upon maturity. The increase in contractual interest on debentures payable of $2.2 million and $6.0 million for the three and nine months ended September 30, 2014 compared to the respective 2013 periods is due to the issuance of the Series G, Series H and Series I senior debentures in 2013, as well as the assumption of the 2018 convertible debentures from Primaris in 2013. This was offset by the redemption of the 2017 convertible debentures in July 2013. Exchangeable unit distributions increased by $2.1 million and $9.4 million for the three and nine months ended September 30, 2014 compared to the respective 2013 periods due to the issuance of exchangeable units as part of the property management internalization effective July 2013 and the exchangeable units assumed as part of the acquisition of Primaris in April 2013.
Finance Cost – Gain (Loss) on Change in Fair Value Three months ended September 30 Nine months ended September 30
(in thousands of Canadian dollars) 2014 2013 Change 2014 2013 Change
Gain (loss) on fair value of convertible debentures $3,941 $2,989 $952 ($4,499) $23,569 ($28,068)
Gain (loss) on fair value of exchangeable units 21,603 266 21,337 (9,026) 13,867 (22,893)
Net gain (loss) on derivative instruments 68 574 (506) 318 (948) 1,266
Finance cost - gain (loss) on change in fair value $25,612 $3,829 $21,783 ($13,207) $36,488 ($49,695)
The REIT has elected to measure the outstanding convertible debentures at fair value. The REIT uses the quoted prices on the TSX to determine the fair value of each series of convertible debentures as permitted under IFRS 13, Fair Value Measurement. The fluctuation in fair value between each period is recorded as a gain (loss) on change in fair value. Under IFRS, the exchangeable units are considered puttable instruments which are valued and classified as a financial liability. The gain (loss) on fair value of exchangeable units is due to the change in the exchangeable unit fair value during the respective quarter. At the end of each quarter, the fair value of each exchangeable unit is measured based on the quoted prices of the Stapled Units on
H&R REIT AND H&R FINANCE TRUST - MD&A - SEPTEMBER 30, 2014
Page 19 of 39
the TSX. For the three and nine months ended September 30, 2014, the change in fair value is based on the quoted price of Stapled Units which was $21.86 as at September 30, 2014 (June 30, 2014 - $23.16, December 31, 2013 - $21.40). For the three and nine months ended September 30, 2013, the change in fair value is based on the quoted price of Stapled Units which was $21.19 as at September 30, 2013 (June 30, 2013 - $22.04, December 31, 2012 - $24.10).
Trust Expenses Three months ended September 30 Nine months ended September 30
(in thousands of Canadian dollars) 2014 2013 Change 2014 2013 Change
Other expenses $5,453 $5,636 ($183) $15,745 $13,183 $2,562
Unit-based compensation - as reported under IFRS (1,890) (805) (1,085) 2,747 (4,436) 7,183
Management fees received from the Primaris portfolio (3,861) (3,347) (514) (11,422) (6,453) (4,969)
Trust expenses ($298) $1,484 ($1,782) $7,070 $2,294 $4,776
Other expenses are primarily comprised of salaries, professional fees, trustee fees and corporate overhead expenses. The REIT’s Unit Option Plan is considered to be cash-settled under IFRS 2, Share-based Payments and as a result, is measured at each reporting period and settlement date at its fair value as defined by IFRS 2. The impact of the fair value adjustment to unit-based compensation is as follows:
Unit-based Compensation Three months ended September 30 Nine months ended September 30
(in thousands of Canadian dollars) 2014 2013 Change 2014 2013 Change
Unit-based compensation $629 $739 ($110) $3,648 $1,831 $1,817
Fair value adjustment to unit-based compensation (2,519) (1,544) (975) (901) (6,267) 5,366
Unit-based compensation - as reported under IFRS ($1,890) ($805) ($1,085) $2,747 ($4,436) $7,183
Unit-based compensation increased by $1.8 million for the nine months ended September 30, 2014 compared to the respective 2013 period primarily due to a one-time catch up adjustment of $1.7 million in Q1 2014 relating to the calculation of how unit options vest over their three year period. The fair value adjustment to unit-based compensation is comprised of the following two compensation plans: (i) the Unit Option Plan, which is measured based on the quoted price of the Stapled Units compared to the exercise price of each option on the date of grant and (ii) the Incentive Unit Plan, which is measured based on the quoted price of the Stapled Units compared to the market price of the Stapled Units on the date of grant. The quoted price of Stapled Units was $21.86 as at September 30, 2014 (June 30, 2014 - $23.16, December 31, 2013 - $21.40). The quoted price of Stapled Units was $21.19 as at September 30, 2013 (June 30, 2013 - $22.04, December 31, 2012 - $24.10).
Fair Value Adjustment on Real Estate Assets Three months ended September 30 Nine months ended September 30
(in thousands of Canadian dollars) 2014 2013 Change 2014 2013 Change
Fair value adjustment on real estate assets ($33,300) ($34,068) $768 ($46,675) $70,150 ($116,825)
The REIT records its real estate assets at fair value. The changes of $0.8 million and ($116.8 million) for the three and nine months ended September 30, 2014 compared to the respective 2013 periods are due to changes in market assumptions used in the property valuations from quarter to quarter, IFRIC 21, capital and tenant expenditures and straight-lining of contractual rent. Refer to note 4 in the Trusts’ Financial Statements for further details on the valuation of the portfolio.
H&R REIT AND H&R FINANCE TRUST - MD&A - SEPTEMBER 30, 2014
Page 20 of 39
Gain (Loss) on Sale of Real Estate Assets Three months ended September 30 Nine months ended September 30
(in thousands of Canadian dollars) 2014 2013 Change 2014 2013 Change
Gain (loss) on sale of real estate assets $1,531 ($25) $1,556 ($3,468) ($1,863) ($1,605)
The gain on sale of real estate assets of $1.6 million for the three months ended September 30, 2014 is primarily due to the sale of 1628 Station St., a parcel of land sold in July 2014, which generated a gain on sale of $1.9 million. The loss on sale of real estate assets of $3.5 million for the nine months ended September 30, 2014 is primarily due to mark-to-market adjustments on the purchasers’ assumption of mortgages on four properties of $5.5 million and one-time prepayment penalties of $3.1 million to discharge the mortgages from the sale of 1618 Station St. and the four properties tenanted by U.S. grocer Bi-Lo. Excluding these losses, the properties sold during the nine months ended September 30, 2014 generated a gain on sale of $5.1 million.
Gain (Loss) on Foreign Exchange Three months ended September 30 Nine months ended September 30
(in thousands of Canadian dollars) 2014 2013 Change 2014 2013 Change
Gain (loss) on foreign exchange $11,317 ($4,457) $15,774 $13,591 $7,270 $6,321
The amounts in the table above were recorded by Finance Trust due to the translation of the U.S. Holdco Notes into Canadian dollars. The U.S. Holdco Notes are eliminated in the Trusts’ Financial Statements however, the related foreign exchange difference is not eliminated on combination as it flows through net income of Finance Trust and other comprehensive income (loss) of the REIT. This is because U.S. Holdco is a subsidiary of the REIT and forms part of its net investment in the United States. U.S. Holdco is not a subsidiary of Finance Trust.
Transaction Costs Three months ended September 30 Nine months ended September 30
(in thousands of Canadian dollars) 2014 2013 Change 2014 2013 Change
Transaction costs on business combination $ - $ - $ - $ - $6,605 ($6,605)
Transaction costs on property management internalization - 198,214 (198,214) - 198,214 (198,214)
Transaction costs $ - $198,214 ($198,214) $ - $204,819 ($204,819)
As a result of the acquisition of Primaris, which was accounted for as a business combination, for the nine months ended September 30, 2013, the REIT incurred $6.6 million in transaction costs relating to this acquisition which were expensed as incurred. During the quarter ended September 30, 2013, H&R REIT Management Services LP (“HRRMSLP”), a subsidiary of the REIT, acquired H&R Property Management Ltd.’s (“HRPM”) REIT-related property management business in return for 9.5 million limited partnership units of HRRMSLP, which are exchangeable on a one-for-one basis for Stapled Units. The limited partnership units of the REIT’s subsidiary were issued on September 3, 2013 at a quoted price of $20.51 for a total value of $194.8 million. Since the internalization transaction was effective July 1, 2013, exchangeable unit distributions on these limited partnership units for the months of July and August totalling $2.1 million were included in transaction costs. The remaining $1.3 million of transaction costs in connection with the internalization transaction relate to professional fees.
Income Tax Expense Three months ended September 30 Nine months ended September 30
(in thousands of Canadian dollars) 2014 2013 Change 2014 2013 Change
Current income taxes $94 $81 $13 $484 $452 $32
Deferred income taxes 5,259 5,668 (409) 32,210 17,604 14,606
Total income taxes $5,353 $5,749 ($396) $32,694 $18,056 $14,638
The REIT is generally subject to tax in Canada under the Tax Act with respect to its taxable income each year, except to the extent such taxable income is paid or made payable to unitholders and deducted by the REIT for tax purposes. The REIT’s current income tax expense is primarily due to U.S. state taxes.
H&R REIT AND H&R FINANCE TRUST - MD&A - SEPTEMBER 30, 2014
Page 21 of 39
The REIT’s deferred income tax expense is recorded in respect of U.S. Holdco and arose due to taxable temporary differences between the tax and accounting bases of assets and liabilities net of the benefit of unused tax credits, deferred interest deductions and losses that are available to be carried forward to future tax years to the extent that it is probable that the unused tax credits, deferred interest deductions and losses can be realized. Deferred tax assets and liabilities are measured at the tax rates that are expected to apply when the assets are realized or the liabilities are settled, based on the tax laws that have been enacted or substantively enacted at the statement of financial position date. Deferred income tax relating to items recognized in equity will also be recognized in equity. As at September 30, 2014, the REIT had net deferred tax liabilities of $114.0 million (December 31, 2013 - $76.6 million) primarily related to taxable temporary differences between the tax and accounting bases of U.S. investment properties. ASSETS Real Estate Assets The following table below shows the change in real estate assets for the nine months ended September 30, 2014 and for the year ended December 31, 2013 per the Trusts’ Financial Statements:
September 30, 2014 December 31, 2013
Investment Properties
Properties Under Development
Investment Properties
Properties Under Development
Opening balance, beginning of year $12,786,205 $146,478 $9,235,562 $128,220
Acquisitions of investment properties, through business combination
-
-
3,179,418
-
Acquisition of investment properties including transaction costs
100,148
-
211,360
-
Additions to existing investment properties:
Capital expenditures 27,796 - 33,704 -
Direct leasing costs 23,877 - 18,799 -
Redevelopment 42,409 - 52,196 -
Additions to properties under development (including capitalized interest)
-
50,358
-
22,631
Dispositions (436,406) - (183,433) (4,373)
Amortization of leasing costs, straight-line rents and blend and extend rents included in revenue
10,640
-
31,003
-
Transfer of property under development that has reached practical completion to investment properties
92,352
(92,352)
-
-
Change in foreign exchange 136,516 - 155,724 -
IFRIC 21 - realty tax adjustment (6,948) - - -
Fair value adjustment on real estate assets (46,675) - 51,872 -
Closing balance, end of period $12,729,914 $104,484 $12,786,205 $146,478 Legal title to each of the properties in the United States is held by a separate legal entity which is 100% owned, directly or indirectly, by U.S. Holdco, a wholly owned subsidiary of the REIT. The assets of each such separate entity are not available to satisfy the debts or obligations of any other person or entity. Each such separate entity maintains separate books and records. The identity of the owner of a particular United States property is available from U.S. Holdco. This structure does not prevent distributions to U.S. entity owners provided there are no conditions of default.
H&R REIT AND H&R FINANCE TRUST - MD&A - SEPTEMBER 30, 2014
Page 22 of 39
2014 Acquisitions During the nine months ended September 30, 2014, the REIT acquired a parcel of land adjacent to an existing investment property, one retail property a 50% ownership interest in a retail property and one equity accounted investment. During the year ended December 31, 2013, in addition to Primaris, the REIT acquired five retail properties, two equity accounted investments and one parcel of land adjacent to an existing investment property.
Property/Acquisition
Year Built
Property Type
Date Acquired
Square Footage
Cash Purchase
Price ($ Millions)
Anchor/Major Tenants
Average Remaining
Lease Term (years)(1)
3621 Dufferin St., Toronto, ON - H&R - Land Feb 6, 2014 (2) $14.3 N/A N/A
12975 Collier Blvd., Naples, FL 2009 H&R - Retail Feb 19, 2014 65,941 15.3 Publix Supermarkets Inc. 11.6
Long Island City, NY Development
-
H&R - Residential development
June 16, 2014
-
70.3(3)
N/A
N/A
Kildonan Place, Winnipeg, MB
1980/2013
Primaris - Retail
Sep 17, 2014
228,261(3)
69.7(3)
Target, Sears
4.7
Total 294,202 $169.6
(1) Average remaining lease term is based on net rent at the time of acquisition. (2) Approximately 4.2 acres of land adjacent to an office property was purchased. (3) Square footage and cash purchase price are based on the REIT’s interests.
2014 Dispositions: During the nine months ended September 30, 2014, the REIT sold four industrial properties, five retail properties, a 50% ownership interest in three retail properties, an office property including an adjacent parcel of land, a 50% ownership interest in an office property and a portion of an office property (sold as separate condominium units). During the year ended December 31, 2013, the REIT sold three industrial properties, two office properties (of which one sale was for the disposal of a 50% ownership interest in the property), a portion of an office property (sold as separate condominium units) and a parcel of land held for development. Property
Property
Type
Date Sold
Square
Feet
Gross Proceeds
($ Millions)
Ownership Interest
Sold
1618 Station St., Vancouver, BC H&R - Office Mar 17, 2014 73,197 $30.5 100%
2780-2800 Skymark Ave., Mississauga, ON H&R - Office Q2 and Q3 2014 27,280 4.1 100%
Regent Mall, Fredericton, NB(1) Primaris - Retail May 15, 2014 249,655 102.5 50%
McAllister Place, Saint John, NB(1) Primaris - Retail May 15, 2014 246,546 70.0 50%
115 Belfield Rd., Toronto, ON H&R - Industrial May 27, 2014 47,990 3.4 100%
Grant Park Shopping Centre, Winnipeg, MB(1) Primaris - Retail June 13, 2014 198,961 46.5 50%
2928-16th St., N.E., Calgary, AB H&R - Industrial June 25, 2014 163,280 29.3 100%
3620-32nd St., N.E., Calgary, AB H&R - Industrial June 25, 2014 65,120 10.1 100%
3777 Kingsway St., Burnaby, BC(1) H&R - Office June 30, 2014 343,085 86.5 50%
50 Cambridge St., Worcester, MA H&R – Retail July 18, 2014 69,020 17.1 100%
1628 Station St., Vancouver, BC H&R – Land July 28, 2014 -(2) 4.5 100%
200 Chisholm Dr., Milton, ON H&R - Industrial Sep 24, 2014 91,828 7.3 100%
417 Blue Ridge St., Blairsville, GA H&R – Retail Sept 30, 2014 36,524 6.3 100%
420 Market St., Dayton, TN H&R – Retail Sept 30, 2014 45,983 6.0 100%
6951 Lee Hwy., Chattanooga, TN H&R – Retail Sept 30, 2014 48,261 10.1 100%
819 W. Carolina Ave., Hartsville, SC H&R – Retail Sept 30, 2014 32,998 10.6 100%
Total 1,739,728 $444.8
(1) Square feet and gross proceeds are based on the ownership interest disposed. (2) Approximately 1.25 acres of land adjacent to 1618 Station St. in Vancouver, BC was sold.
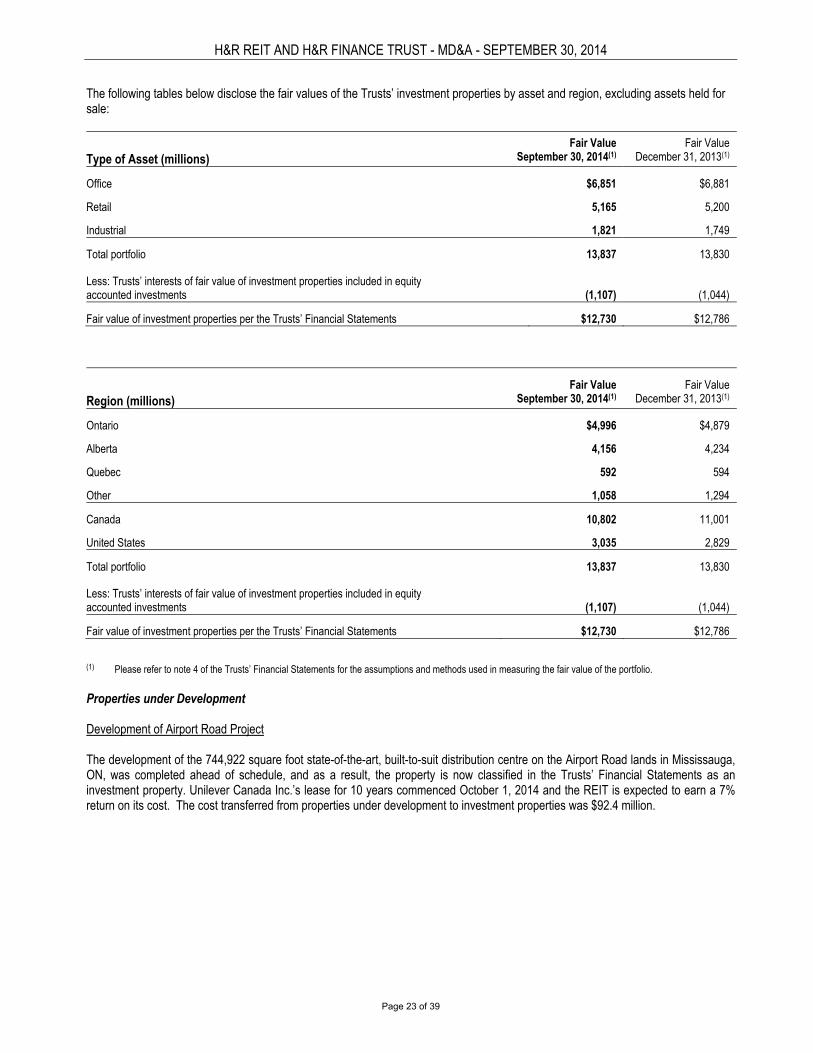
H&R REIT AND H&R FINANCE TRUST - MD&A - SEPTEMBER 30, 2014
Page 23 of 39
The following tables below disclose the fair values of the Trusts’ investment properties by asset and region, excluding assets held for sale:
Type of Asset (millions)
Fair Value September 30, 2014(1)
Fair Value December 31, 2013(1)
Office $6,851 $6,881
Retail 5,165 5,200
Industrial 1,821 1,749
Total portfolio 13,837 13,830
Less: Trusts’ interests of fair value of investment properties included in equity accounted investments
(1,107)
(1,044)
Fair value of investment properties per the Trusts’ Financial Statements $12,730 $12,786
Region (millions)
Fair Value September 30, 2014(1)
Fair Value December 31, 2013(1)
Ontario $4,996 $4,879
Alberta 4,156 4,234
Quebec 592 594
Other 1,058 1,294
Canada 10,802 11,001
United States 3,035 2,829
Total portfolio 13,837 13,830
Less: Trusts’ interests of fair value of investment properties included in equity accounted investments
(1,107)
(1,044)
Fair value of investment properties per the Trusts’ Financial Statements $12,730 $12,786 (1) Please refer to note 4 of the Trusts’ Financial Statements for the assumptions and methods used in measuring the fair value of the portfolio. Properties under Development Development of Airport Road Project The development of the 744,922 square foot state-of-the-art, built-to-suit distribution centre on the Airport Road lands in Mississauga, ON, was completed ahead of schedule, and as a result, the property is now classified in the Trusts’ Financial Statements as an investment property. Unilever Canada Inc.’s lease for 10 years commenced October 1, 2014 and the REIT is expected to earn a 7% return on its cost. The cost transferred from properties under development to investment properties was $92.4 million.
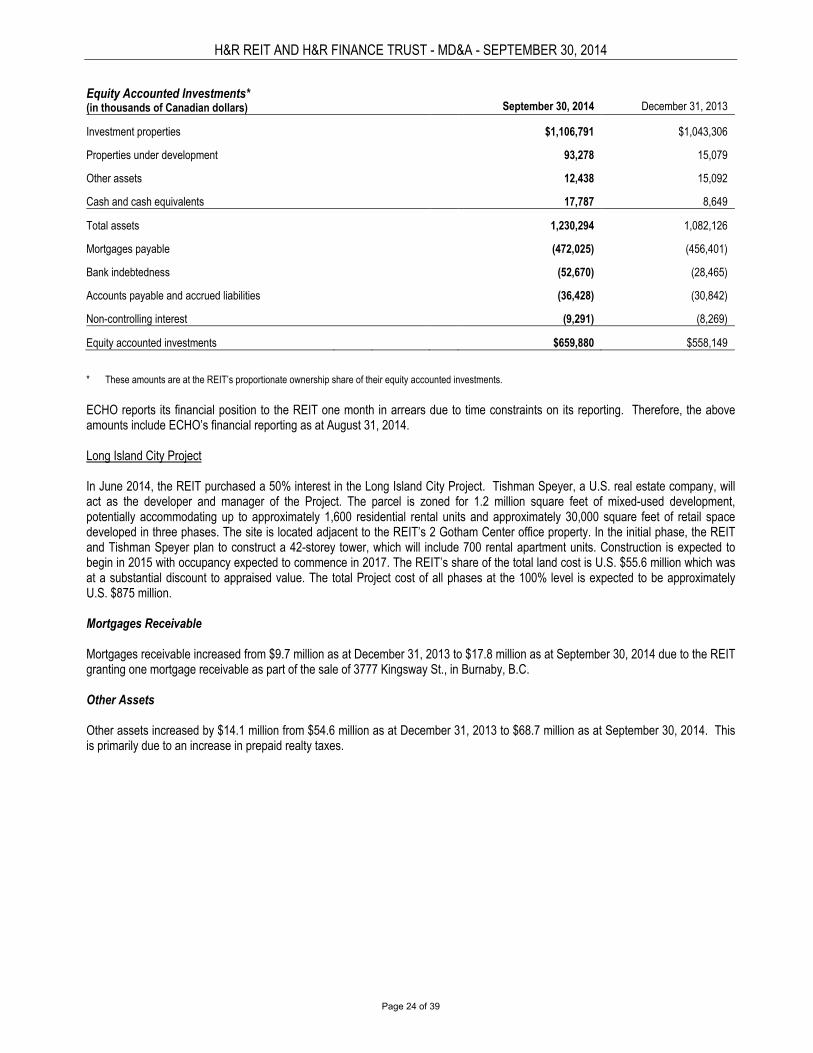
H&R REIT AND H&R FINANCE TRUST - MD&A - SEPTEMBER 30, 2014
Page 24 of 39
Equity Accounted Investments* (in thousands of Canadian dollars)
September 30, 2014
December 31, 2013
Investment properties $1,106,791 $1,043,306
Properties under development 93,278 15,079
Other assets 12,438 15,092
Cash and cash equivalents 17,787 8,649
Total assets 1,230,294 1,082,126
Mortgages payable (472,025) (456,401)
Bank indebtedness (52,670) (28,465)
Accounts payable and accrued liabilities (36,428) (30,842)
Non-controlling interest (9,291) (8,269)
Equity accounted investments $659,880 $558,149
* These amounts are at the REIT’s proportionate ownership share of their equity accounted investments.
ECHO reports its financial position to the REIT one month in arrears due to time constraints on its reporting. Therefore, the above amounts include ECHO’s financial reporting as at August 31, 2014. Long Island City Project In June 2014, the REIT purchased a 50% interest in the Long Island City Project. Tishman Speyer, a U.S. real estate company, will act as the developer and manager of the Project. The parcel is zoned for 1.2 million square feet of mixed-used development, potentially accommodating up to approximately 1,600 residential rental units and approximately 30,000 square feet of retail space developed in three phases. The site is located adjacent to the REIT’s 2 Gotham Center office property. In the initial phase, the REIT and Tishman Speyer plan to construct a 42-storey tower, which will include 700 rental apartment units. Construction is expected to begin in 2015 with occupancy expected to commence in 2017. The REIT’s share of the total land cost is U.S. $55.6 million which was at a substantial discount to appraised value. The total Project cost of all phases at the 100% level is expected to be approximately U.S. $875 million. Mortgages Receivable Mortgages receivable increased from $9.7 million as at December 31, 2013 to $17.8 million as at September 30, 2014 due to the REIT granting one mortgage receivable as part of the sale of 3777 Kingsway St., in Burnaby, B.C. Other Assets Other assets increased by $14.1 million from $54.6 million as at December 31, 2013 to $68.7 million as at September 30, 2014. This is primarily due to an increase in prepaid realty taxes.
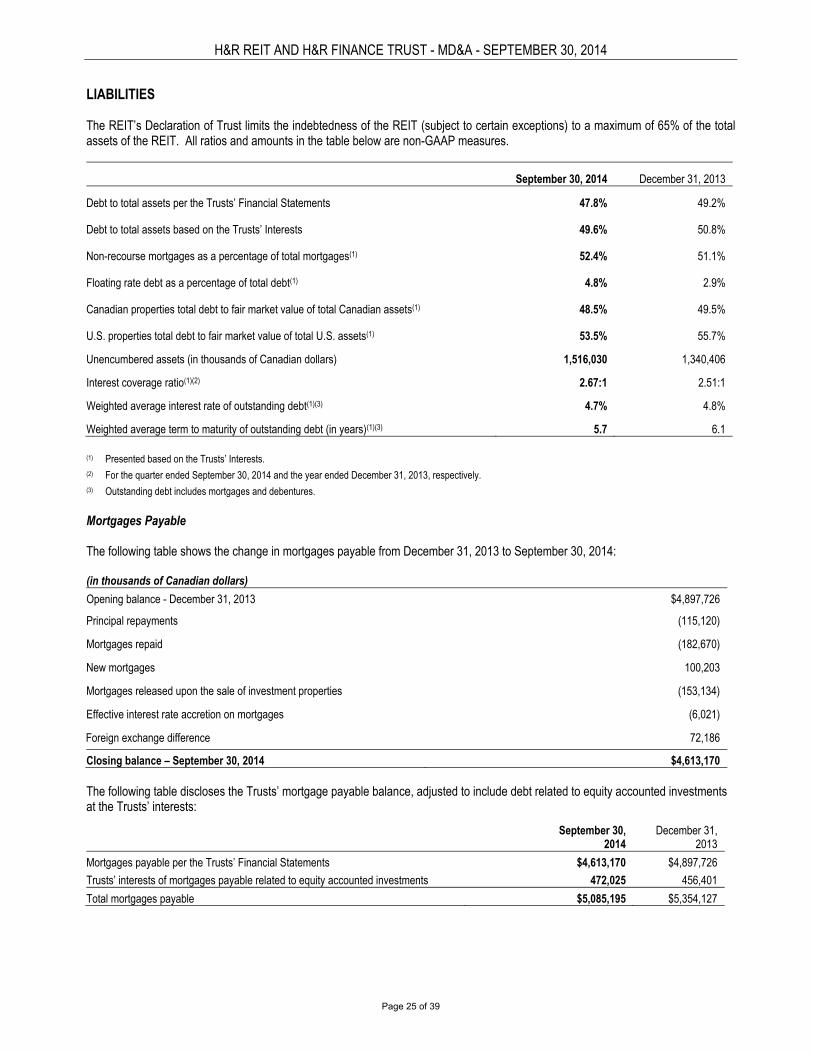
H&R REIT AND H&R FINANCE TRUST - MD&A - SEPTEMBER 30, 2014
Page 25 of 39
LIABILITIES
The REIT’s Declaration of Trust limits the indebtedness of the REIT (subject to certain exceptions) to a maximum of 65% of the total assets of the REIT. All ratios and amounts in the table below are non-GAAP measures.
September 30, 2014 December 31, 2013
Debt to total assets per the Trusts’ Financial Statements 47.8% 49.2%
Debt to total assets based on the Trusts’ Interests 49.6% 50.8%
Non-recourse mortgages as a percentage of total mortgages(1) 52.4% 51.1%
Floating rate debt as a percentage of total debt(1) 4.8% 2.9%
Canadian properties total debt to fair market value of total Canadian assets(1) 48.5% 49.5%
U.S. properties total debt to fair market value of total U.S. assets(1) 53.5% 55.7%
Unencumbered assets (in thousands of Canadian dollars) 1,516,030 1,340,406
Interest coverage ratio(1)(2) 2.67:1 2.51:1
Weighted average interest rate of outstanding debt(1)(3) 4.7% 4.8%
Weighted average term to maturity of outstanding debt (in years)(1)(3) 5.7 6.1
(1) Presented based on the Trusts’ Interests. (2) For the quarter ended September 30, 2014 and the year ended December 31, 2013, respectively. (3) Outstanding debt includes mortgages and debentures. Mortgages Payable The following table shows the change in mortgages payable from December 31, 2013 to September 30, 2014: (in thousands of Canadian dollars)
Opening balance - December 31, 2013 $4,897,726
Principal repayments (115,120)
Mortgages repaid (182,670)
New mortgages 100,203
Mortgages released upon the sale of investment properties (153,134)
Effective interest rate accretion on mortgages (6,021)
Foreign exchange difference 72,186
Closing balance – September 30, 2014 $4,613,170 The following table discloses the Trusts’ mortgage payable balance, adjusted to include debt related to equity accounted investments at the Trusts’ interests:
September 30, 2014
December 31, 2013
Mortgages payable per the Trusts’ Financial Statements $4,613,170 $4,897,726
Trusts’ interests of mortgages payable related to equity accounted investments 472,025 456,401
Total mortgages payable $5,085,195 $5,354,127
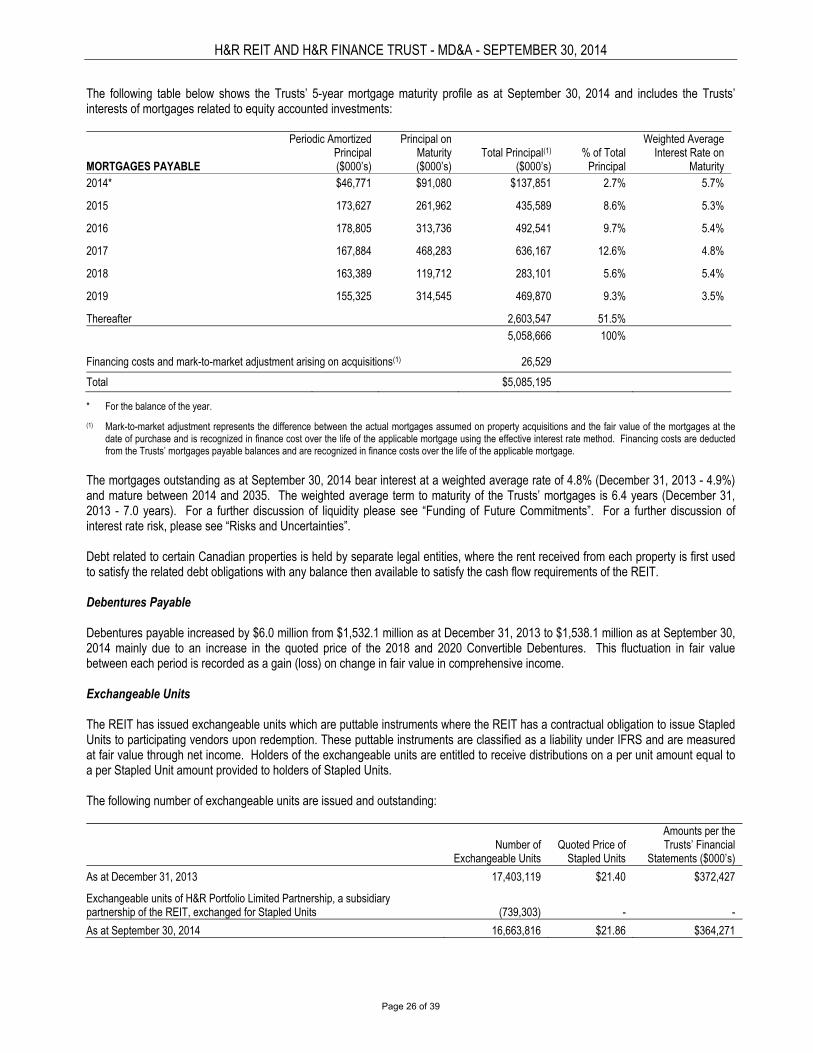
H&R REIT AND H&R FINANCE TRUST - MD&A - SEPTEMBER 30, 2014
Page 26 of 39
The following table below shows the Trusts’ 5-year mortgage maturity profile as at September 30, 2014 and includes the Trusts’ interests of mortgages related to equity accounted investments:
MORTGAGES PAYABLE
Periodic Amortized Principal ($000’s)
Principal on Maturity ($000’s)
Total Principal(1)
($000’s)
% of Total
Principal
Weighted Average Interest Rate on
Maturity 2014* $46,771 $91,080 $137,851 2.7% 5.7%
2015 173,627 261,962 435,589 8.6% 5.3%
2016 178,805 313,736 492,541 9.7% 5.4%
2017 167,884 468,283 636,167 12.6% 4.8%
2018 163,389 119,712 283,101 5.6% 5.4%
2019 155,325 314,545 469,870 9.3% 3.5%
Thereafter 2,603,547 51.5% 5,058,666 100%
Financing costs and mark-to-market adjustment arising on acquisitions(1) 26,529
Total $5,085,195
* For the balance of the year.
(1) Mark-to-market adjustment represents the difference between the actual mortgages assumed on property acquisitions and the fair value of the mortgages at the date of purchase and is recognized in finance cost over the life of the applicable mortgage using the effective interest rate method. Financing costs are deducted from the Trusts’ mortgages payable balances and are recognized in finance costs over the life of the applicable mortgage.
The mortgages outstanding as at September 30, 2014 bear interest at a weighted average rate of 4.8% (December 31, 2013 - 4.9%) and mature between 2014 and 2035. The weighted average term to maturity of the Trusts’ mortgages is 6.4 years (December 31, 2013 - 7.0 years). For a further discussion of liquidity please see “Funding of Future Commitments”. For a further discussion of interest rate risk, please see “Risks and Uncertainties”. Debt related to certain Canadian properties is held by separate legal entities, where the rent received from each property is first used to satisfy the related debt obligations with any balance then available to satisfy the cash flow requirements of the REIT. Debentures Payable Debentures payable increased by $6.0 million from $1,532.1 million as at December 31, 2013 to $1,538.1 million as at September 30, 2014 mainly due to an increase in the quoted price of the 2018 and 2020 Convertible Debentures. This fluctuation in fair value between each period is recorded as a gain (loss) on change in fair value in comprehensive income. Exchangeable Units The REIT has issued exchangeable units which are puttable instruments where the REIT has a contractual obligation to issue Stapled Units to participating vendors upon redemption. These puttable instruments are classified as a liability under IFRS and are measured at fair value through net income. Holders of the exchangeable units are entitled to receive distributions on a per unit amount equal to a per Stapled Unit amount provided to holders of Stapled Units. The following number of exchangeable units are issued and outstanding:
Number of Exchangeable Units
Quoted Price of
Stapled Units
Amounts per the Trusts’ Financial
Statements ($000’s)
As at December 31, 2013 17,403,119 $21.40 $372,427
Exchangeable units of H&R Portfolio Limited Partnership, a subsidiary partnership of the REIT, exchanged for Stapled Units
(739,303)
-
-
As at September 30, 2014 16,663,816 $21.86 $364,271
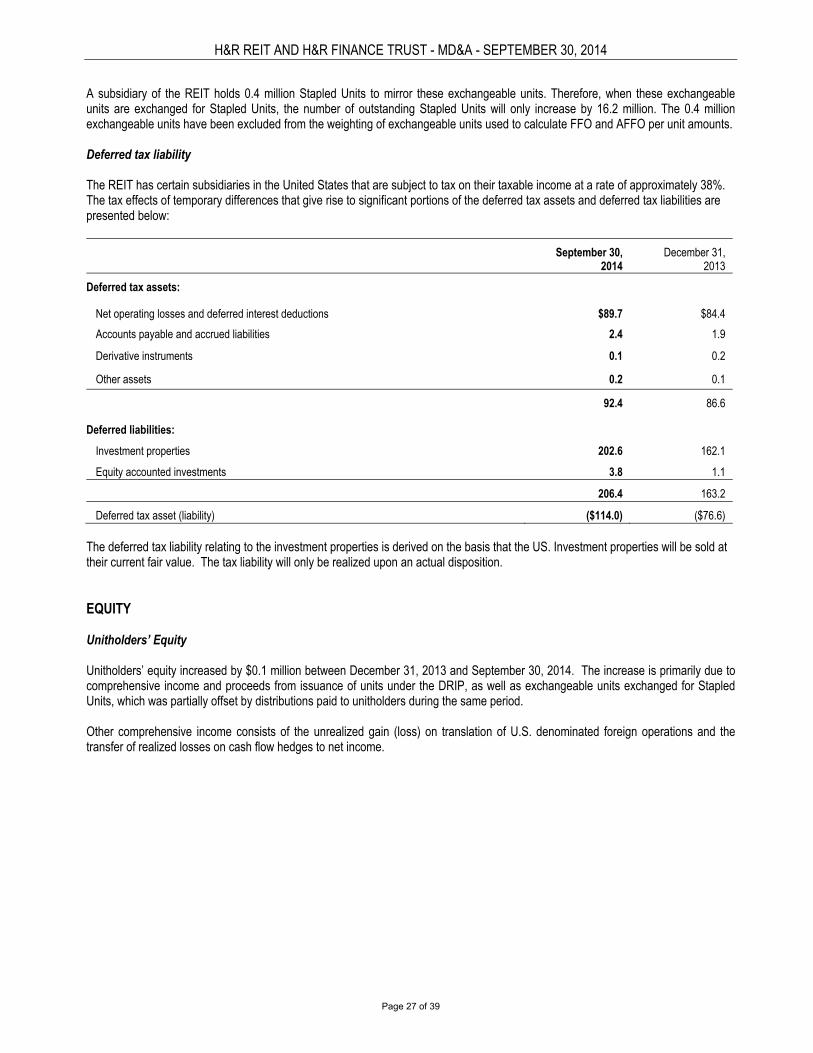
H&R REIT AND H&R FINANCE TRUST - MD&A - SEPTEMBER 30, 2014
Page 27 of 39
A subsidiary of the REIT holds 0.4 million Stapled Units to mirror these exchangeable units. Therefore, when these exchangeable units are exchanged for Stapled Units, the number of outstanding Stapled Units will only increase by 16.2 million. The 0.4 million exchangeable units have been excluded from the weighting of exchangeable units used to calculate FFO and AFFO per unit amounts. Deferred tax liability The REIT has certain subsidiaries in the United States that are subject to tax on their taxable income at a rate of approximately 38%. The tax effects of temporary differences that give rise to significant portions of the deferred tax assets and deferred tax liabilities are presented below:
September 30, 2014
December 31, 2013
Deferred tax assets:
Net operating losses and deferred interest deductions $89.7 $84.4
Accounts payable and accrued liabilities 2.4 1.9
Derivative instruments 0.1 0.2
Other assets 0.2 0.1
92.4 86.6
Deferred liabilities:
Investment properties 202.6 162.1
Equity accounted investments 3.8 1.1
206.4 163.2
Deferred tax asset (liability) ($114.0) ($76.6) The deferred tax liability relating to the investment properties is derived on the basis that the US. Investment properties will be sold at their current fair value. The tax liability will only be realized upon an actual disposition. EQUITY
Unitholders’ Equity
Unitholders’ equity increased by $0.1 million between December 31, 2013 and September 30, 2014. The increase is primarily due to comprehensive income and proceeds from issuance of units under the DRIP, as well as exchangeable units exchanged for Stapled Units, which was partially offset by distributions paid to unitholders during the same period. Other comprehensive income consists of the unrealized gain (loss) on translation of U.S. denominated foreign operations and the transfer of realized losses on cash flow hedges to net income.
H&R REIT AND H&R FINANCE TRUST - MD&A - SEPTEMBER 30, 2014
Page 28 of 39
FUNDS FROM OPERATIONS FFO is a recognized measure that is widely used by the real estate industry, particularly by those publicly traded entities that own and operate investment properties. FFO is a financial measure which should not be considered as an alternative to net income, cash flow from operations, or any other operating or liquidity measure prescribed under IFRS. The Trusts present FFO in accordance with the REALpac White Paper on Funds From Operations. The use of FFO, combined with the required IFRS presentations, has been included for the purpose of improving the understanding of the operating results of the Trusts. FFO provides an operating performance measure that when compared period over period reflects the impact on operations of trends in occupancy levels, rental rates, property operating costs, acquisition activities and finance costs, that is not immediately apparent from net income determined in accordance with IFRS. In April 2014, REALpac revised their definition of FFO to add an adjustment for property taxes accounted for under IFRIC 21 and an adjustment for incremental leasing costs of full-time or salaried staff. Realty taxes accounted for under IFRIC 21: As a result of the requirements of IFRIC 21 wherein the obligating event that gives rise to the property tax liability (where such property taxes meet the definition of a levy in IFRIC 21) does not occur over a period of time, an adjustment is made to FFO to reflect a pro-rata expense over the period of ownership. Incremental leasing costs: Leasing costs of full-time or salaried staff, and related internal costs, that can be directly attributed to signed leases, and that would otherwise be capitalized if incurred from external sources are added back to profit or loss in determining FFO. The purpose of this adjustment is to achieve consistency between entities that use internal leasing personnel and those that use external leasing personnel.
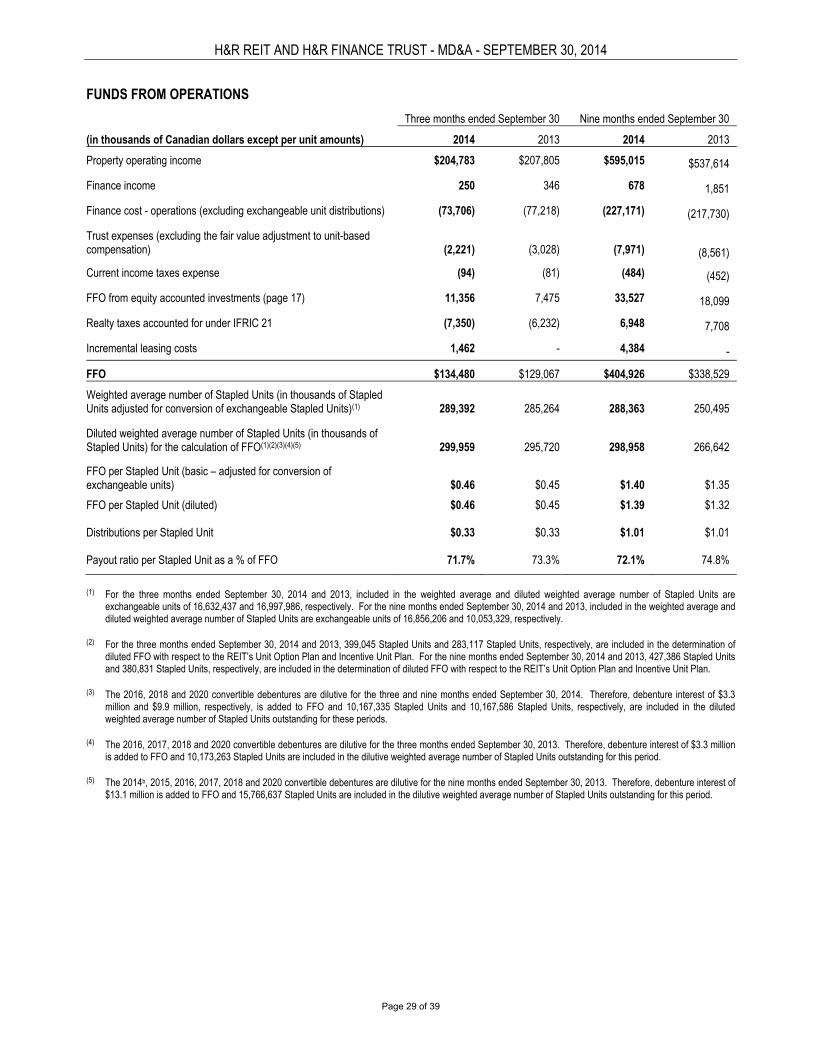
H&R REIT AND H&R FINANCE TRUST - MD&A - SEPTEMBER 30, 2014
Page 29 of 39
FUNDS FROM OPERATIONS
Three months ended September 30 Nine months ended September 30
(in thousands of Canadian dollars except per unit amounts) 2014 2013 2014 2013
Property operating income $204,783 $207,805 $595,015 $537,614
Finance income 250 346 678 1,851
Finance cost - operations (excluding exchangeable unit distributions) (73,706) (77,218) (227,171) (217,730)
Trust expenses (excluding the fair value adjustment to unit-based compensation)
(2,221)
(3,028)
(7,971)
(8,561)
Current income taxes expense (94) (81) (484) (452)
FFO from equity accounted investments (page 17) 11,356 7,475 33,527 18,099
Realty taxes accounted for under IFRIC 21 (7,350) (6,232) 6,948 7,708
Incremental leasing costs 1,462 - 4,384 -
FFO $134,480 $129,067 $404,926 $338,529
Weighted average number of Stapled Units (in thousands of Stapled Units adjusted for conversion of exchangeable Stapled Units)(1)
289,392
285,264
288,363
250,495
Diluted weighted average number of Stapled Units (in thousands of Stapled Units) for the calculation of FFO(1)(2)(3)(4)(5)
299,959
295,720
298,958
266,642
FFO per Stapled Unit (basic – adjusted for conversion of exchangeable units)
$0.46
$0.45
$1.40
$1.35
FFO per Stapled Unit (diluted) $0.46 $0.45 $1.39 $1.32
Distributions per Stapled Unit $0.33 $0.33 $1.01 $1.01
Payout ratio per Stapled Unit as a % of FFO 71.7% 73.3% 72.1% 74.8%
(1) For the three months ended September 30, 2014 and 2013, included in the weighted average and diluted weighted average number of Stapled Units are
exchangeable units of 16,632,437 and 16,997,986, respectively. For the nine months ended September 30, 2014 and 2013, included in the weighted average and diluted weighted average number of Stapled Units are exchangeable units of 16,856,206 and 10,053,329, respectively.
(2) For the three months ended September 30, 2014 and 2013, 399,045 Stapled Units and 283,117 Stapled Units, respectively, are included in the determination of diluted FFO with respect to the REIT’s Unit Option Plan and Incentive Unit Plan. For the nine months ended September 30, 2014 and 2013, 427,386 Stapled Units and 380,831 Stapled Units, respectively, are included in the determination of diluted FFO with respect to the REIT’s Unit Option Plan and Incentive Unit Plan.
(3) The 2016, 2018 and 2020 convertible debentures are dilutive for the three and nine months ended September 30, 2014. Therefore, debenture interest of $3.3
million and $9.9 million, respectively, is added to FFO and 10,167,335 Stapled Units and 10,167,586 Stapled Units, respectively, are included in the diluted weighted average number of Stapled Units outstanding for these periods.
(4) The 2016, 2017, 2018 and 2020 convertible debentures are dilutive for the three months ended September 30, 2013. Therefore, debenture interest of $3.3 million
is added to FFO and 10,173,263 Stapled Units are included in the dilutive weighted average number of Stapled Units outstanding for this period. (5) The 2014b, 2015, 2016, 2017, 2018 and 2020 convertible debentures are dilutive for the nine months ended September 30, 2013. Therefore, debenture interest of
$13.1 million is added to FFO and 15,766,637 Stapled Units are included in the dilutive weighted average number of Stapled Units outstanding for this period.
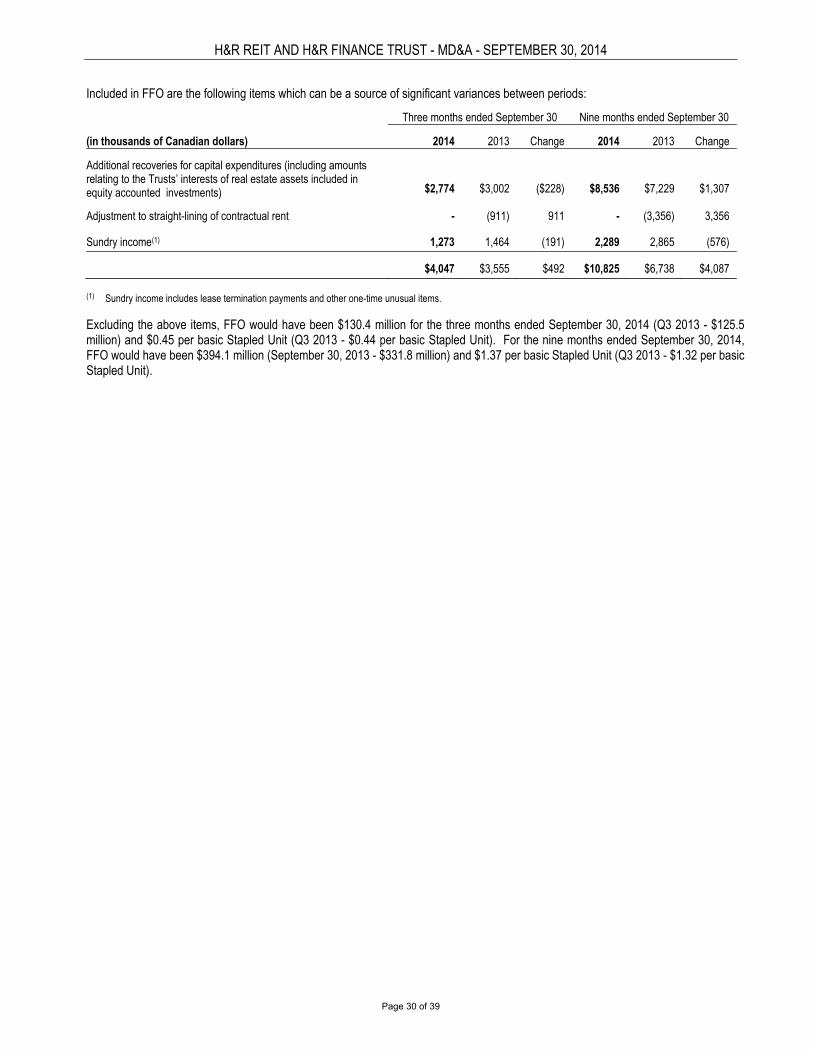
H&R REIT AND H&R FINANCE TRUST - MD&A - SEPTEMBER 30, 2014
Page 30 of 39
Included in FFO are the following items which can be a source of significant variances between periods:
Three months ended September 30 Nine months ended September 30
(in thousands of Canadian dollars) 2014 2013 Change 2014 2013 Change
Additional recoveries for capital expenditures (including amounts relating to the Trusts’ interests of real estate assets included in equity accounted investments)
$2,774
$3,002
($228)
$8,536
$7,229
$1,307
Adjustment to straight-lining of contractual rent - (911) 911 - (3,356) 3,356
Sundry income(1) 1,273 1,464 (191) 2,289 2,865 (576)
$4,047 $3,555 $492 $10,825 $6,738 $4,087
(1) Sundry income includes lease termination payments and other one-time unusual items.
Excluding the above items, FFO would have been $130.4 million for the three months ended September 30, 2014 (Q3 2013 - $125.5 million) and $0.45 per basic Stapled Unit (Q3 2013 - $0.44 per basic Stapled Unit). For the nine months ended September 30, 2014, FFO would have been $394.1 million (September 30, 2013 - $331.8 million) and $1.37 per basic Stapled Unit (Q3 2013 - $1.32 per basic Stapled Unit).
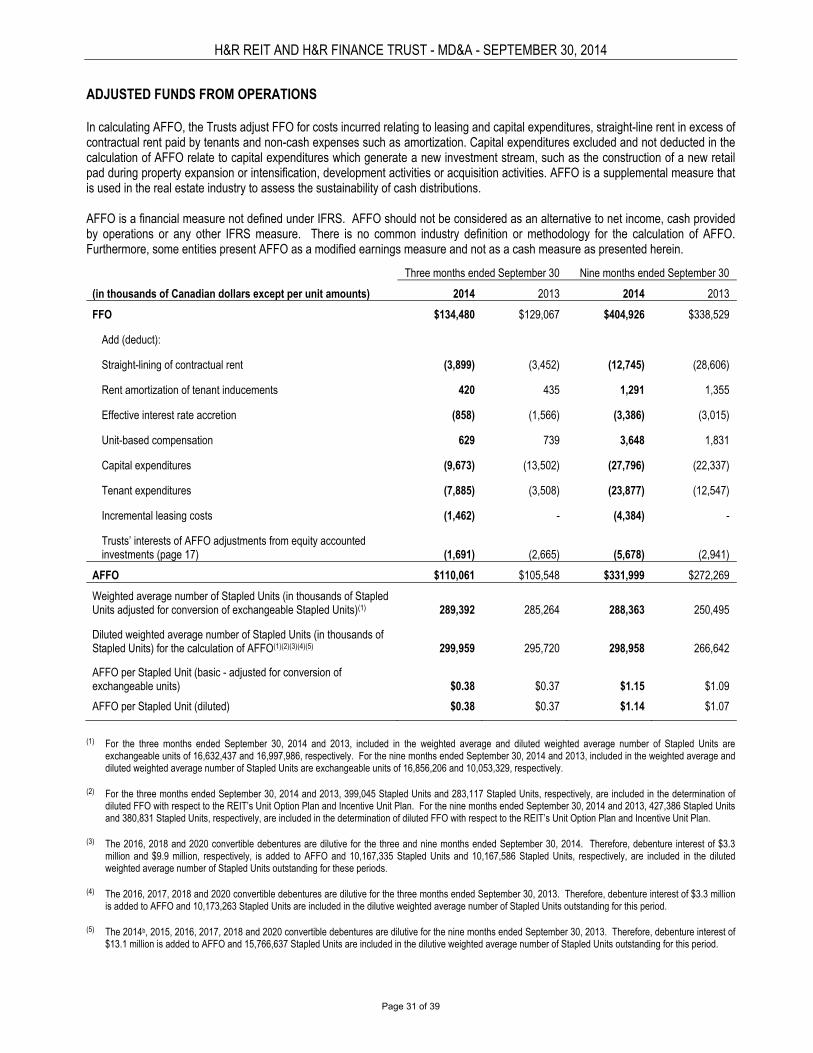
H&R REIT AND H&R FINANCE TRUST - MD&A - SEPTEMBER 30, 2014
Page 31 of 39
ADJUSTED FUNDS FROM OPERATIONS In calculating AFFO, the Trusts adjust FFO for costs incurred relating to leasing and capital expenditures, straight-line rent in excess of contractual rent paid by tenants and non-cash expenses such as amortization. Capital expenditures excluded and not deducted in the calculation of AFFO relate to capital expenditures which generate a new investment stream, such as the construction of a new retail pad during property expansion or intensification, development activities or acquisition activities. AFFO is a supplemental measure that is used in the real estate industry to assess the sustainability of cash distributions. AFFO is a financial measure not defined under IFRS. AFFO should not be considered as an alternative to net income, cash provided by operations or any other IFRS measure. There is no common industry definition or methodology for the calculation of AFFO. Furthermore, some entities present AFFO as a modified earnings measure and not as a cash measure as presented herein.
Three months ended September 30 Nine months ended September 30
(in thousands of Canadian dollars except per unit amounts) 2014 2013 2014 2013
FFO $134,480 $129,067 $404,926 $338,529
Add (deduct):
Straight-lining of contractual rent (3,899) (3,452) (12,745) (28,606)
Rent amortization of tenant inducements 420 435 1,291 1,355
Effective interest rate accretion (858) (1,566) (3,386) (3,015)
Unit-based compensation 629 739 3,648 1,831
Capital expenditures (9,673) (13,502) (27,796) (22,337)
Tenant expenditures (7,885) (3,508) (23,877) (12,547)
Incremental leasing costs (1,462) - (4,384) -
Trusts’ interests of AFFO adjustments from equity accounted investments (page 17)
(1,691)
(2,665)
(5,678)
(2,941)
AFFO $110,061 $105,548 $331,999 $272,269
Weighted average number of Stapled Units (in thousands of Stapled Units adjusted for conversion of exchangeable Stapled Units)(1)
289,392
285,264
288,363
250,495
Diluted weighted average number of Stapled Units (in thousands of Stapled Units) for the calculation of AFFO(1)(2)(3)(4)(5)
299,959
295,720
298,958
266,642
AFFO per Stapled Unit (basic - adjusted for conversion of exchangeable units)
$0.38
$0.37
$1.15
$1.09
AFFO per Stapled Unit (diluted) $0.38 $0.37 $1.14 $1.07
(1) For the three months ended September 30, 2014 and 2013, included in the weighted average and diluted weighted average number of Stapled Units are
exchangeable units of 16,632,437 and 16,997,986, respectively. For the nine months ended September 30, 2014 and 2013, included in the weighted average and diluted weighted average number of Stapled Units are exchangeable units of 16,856,206 and 10,053,329, respectively.
(2) For the three months ended September 30, 2014 and 2013, 399,045 Stapled Units and 283,117 Stapled Units, respectively, are included in the determination of diluted FFO with respect to the REIT’s Unit Option Plan and Incentive Unit Plan. For the nine months ended September 30, 2014 and 2013, 427,386 Stapled Units and 380,831 Stapled Units, respectively, are included in the determination of diluted FFO with respect to the REIT’s Unit Option Plan and Incentive Unit Plan.
(3) The 2016, 2018 and 2020 convertible debentures are dilutive for the three and nine months ended September 30, 2014. Therefore, debenture interest of $3.3 million and $9.9 million, respectively, is added to AFFO and 10,167,335 Stapled Units and 10,167,586 Stapled Units, respectively, are included in the diluted weighted average number of Stapled Units outstanding for these periods.
(4) The 2016, 2017, 2018 and 2020 convertible debentures are dilutive for the three months ended September 30, 2013. Therefore, debenture interest of $3.3 million is added to AFFO and 10,173,263 Stapled Units are included in the dilutive weighted average number of Stapled Units outstanding for this period.
(5) The 2014b, 2015, 2016, 2017, 2018 and 2020 convertible debentures are dilutive for the nine months ended September 30, 2013. Therefore, debenture interest of
$13.1 million is added to AFFO and 15,766,637 Stapled Units are included in the dilutive weighted average number of Stapled Units outstanding for this period.
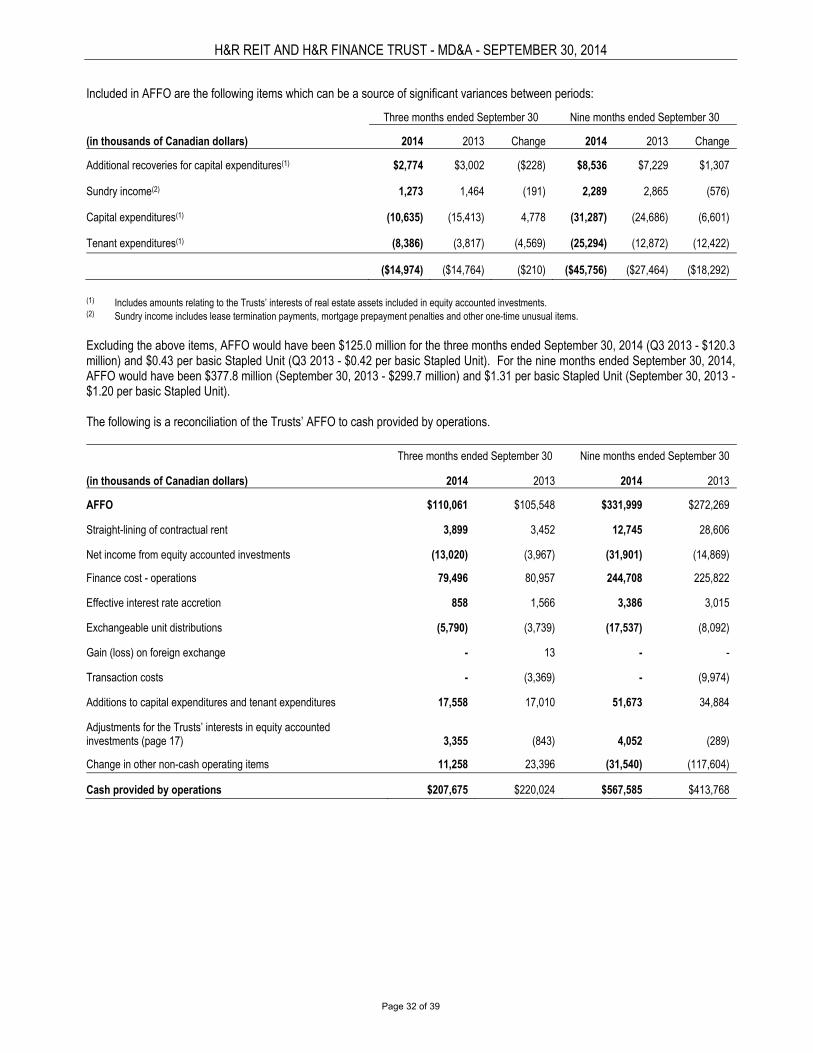
H&R REIT AND H&R FINANCE TRUST - MD&A - SEPTEMBER 30, 2014
Page 32 of 39
Included in AFFO are the following items which can be a source of significant variances between periods:
Three months ended September 30 Nine months ended September 30
(in thousands of Canadian dollars) 2014 2013 Change 2014 2013 Change
Additional recoveries for capital expenditures(1) $2,774 $3,002 ($228) $8,536 $7,229 $1,307
Sundry income(2) 1,273 1,464 (191) 2,289 2,865 (576)
Capital expenditures(1) (10,635) (15,413) 4,778 (31,287) (24,686) (6,601)
Tenant expenditures(1) (8,386) (3,817) (4,569) (25,294) (12,872) (12,422)
($14,974) ($14,764) ($210) ($45,756) ($27,464) ($18,292)
(1) Includes amounts relating to the Trusts’ interests of real estate assets included in equity accounted investments. (2) Sundry income includes lease termination payments, mortgage prepayment penalties and other one-time unusual items. Excluding the above items, AFFO would have been $125.0 million for the three months ended September 30, 2014 (Q3 2013 - $120.3 million) and $0.43 per basic Stapled Unit (Q3 2013 - $0.42 per basic Stapled Unit). For the nine months ended September 30, 2014, AFFO would have been $377.8 million (September 30, 2013 - $299.7 million) and $1.31 per basic Stapled Unit (September 30, 2013 - $1.20 per basic Stapled Unit). The following is a reconciliation of the Trusts’ AFFO to cash provided by operations.
Three months ended September 30 Nine months ended September 30
(in thousands of Canadian dollars) 2014 2013 2014 2013
AFFO $110,061 $105,548 $331,999 $272,269
Straight-lining of contractual rent 3,899 3,452 12,745 28,606
Net income from equity accounted investments (13,020) (3,967) (31,901) (14,869)
Finance cost - operations 79,496 80,957 244,708 225,822
Effective interest rate accretion 858 1,566 3,386 3,015
Exchangeable unit distributions (5,790) (3,739) (17,537) (8,092)
Gain (loss) on foreign exchange - 13 - -
Transaction costs - (3,369) - (9,974)
Additions to capital expenditures and tenant expenditures 17,558 17,010 51,673 34,884
Adjustments for the Trusts’ interests in equity accounted investments (page 17)
3,355
(843)
4,052
(289)
Change in other non-cash operating items 11,258 23,396 (31,540) (117,604)
Cash provided by operations $207,675 $220,024 $567,585 $413,768
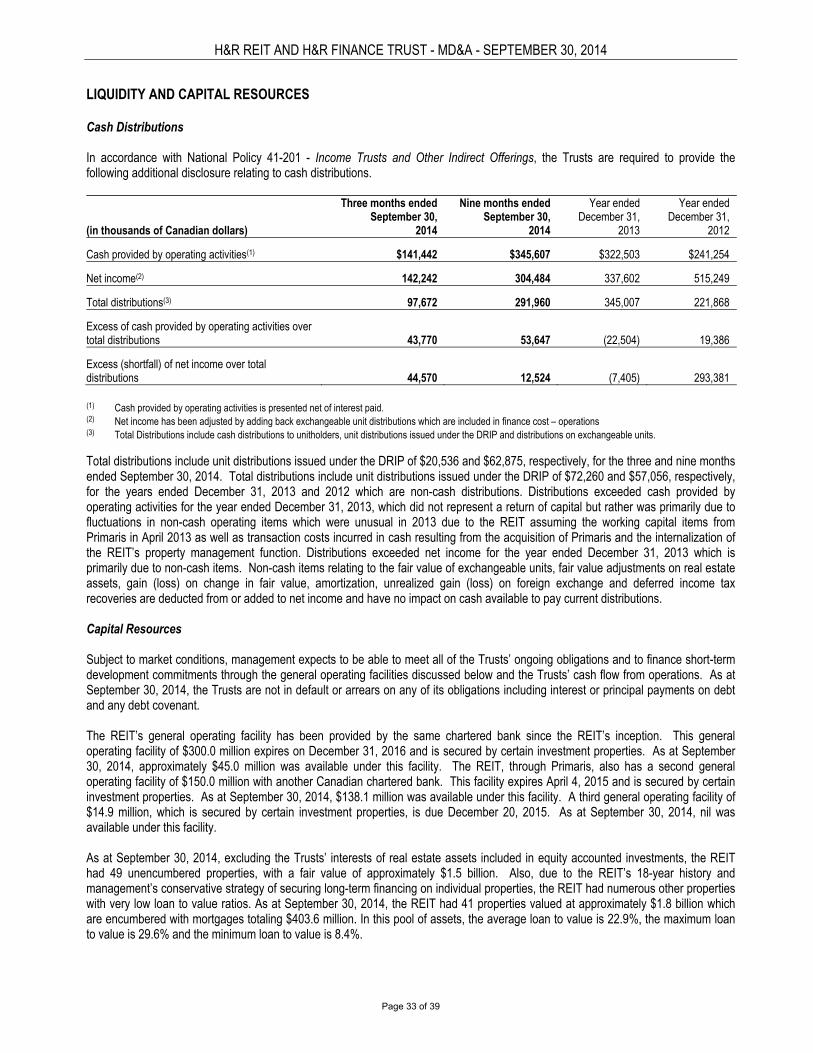
H&R REIT AND H&R FINANCE TRUST - MD&A - SEPTEMBER 30, 2014
Page 33 of 39
LIQUIDITY AND CAPITAL RESOURCES Cash Distributions In accordance with National Policy 41-201 - Income Trusts and Other Indirect Offerings, the Trusts are required to provide the following additional disclosure relating to cash distributions. (in thousands of Canadian dollars)
Three months ended September 30,
2014
Nine months ended September 30,
2014
Year ended December 31,
2013
Year ended December 31,
2012
Cash provided by operating activities(1) $141,442 $345,607 $322,503 $241,254
Net income(2) 142,242 304,484 337,602 515,249
Total distributions(3) 97,672 291,960 345,007 221,868
Excess of cash provided by operating activities over total distributions
43,770
53,647
(22,504)
19,386
Excess (shortfall) of net income over total distributions
44,570
12,524
(7,405)
293,381
(1) Cash provided by operating activities is presented net of interest paid. (2) Net income has been adjusted by adding back exchangeable unit distributions which are included in finance cost – operations (3) Total Distributions include cash distributions to unitholders, unit distributions issued under the DRIP and distributions on exchangeable units.
Total distributions include unit distributions issued under the DRIP of $20,536 and $62,875, respectively, for the three and nine months ended September 30, 2014. Total distributions include unit distributions issued under the DRIP of $72,260 and $57,056, respectively, for the years ended December 31, 2013 and 2012 which are non-cash distributions. Distributions exceeded cash provided by operating activities for the year ended December 31, 2013, which did not represent a return of capital but rather was primarily due to fluctuations in non-cash operating items which were unusual in 2013 due to the REIT assuming the working capital items from Primaris in April 2013 as well as transaction costs incurred in cash resulting from the acquisition of Primaris and the internalization of the REIT’s property management function. Distributions exceeded net income for the year ended December 31, 2013 which is primarily due to non-cash items. Non-cash items relating to the fair value of exchangeable units, fair value adjustments on real estate assets, gain (loss) on change in fair value, amortization, unrealized gain (loss) on foreign exchange and deferred income tax recoveries are deducted from or added to net income and have no impact on cash available to pay current distributions. Capital Resources Subject to market conditions, management expects to be able to meet all of the Trusts’ ongoing obligations and to finance short-term development commitments through the general operating facilities discussed below and the Trusts’ cash flow from operations. As at September 30, 2014, the Trusts are not in default or arrears on any of its obligations including interest or principal payments on debt and any debt covenant. The REIT’s general operating facility has been provided by the same chartered bank since the REIT’s inception. This general operating facility of $300.0 million expires on December 31, 2016 and is secured by certain investment properties. As at September 30, 2014, approximately $45.0 million was available under this facility. The REIT, through Primaris, also has a second general operating facility of $150.0 million with another Canadian chartered bank. This facility expires April 4, 2015 and is secured by certain investment properties. As at September 30, 2014, $138.1 million was available under this facility. A third general operating facility of $14.9 million, which is secured by certain investment properties, is due December 20, 2015. As at September 30, 2014, nil was available under this facility. As at September 30, 2014, excluding the Trusts’ interests of real estate assets included in equity accounted investments, the REIT had 49 unencumbered properties, with a fair value of approximately $1.5 billion. Also, due to the REIT’s 18-year history and management’s conservative strategy of securing long-term financing on individual properties, the REIT had numerous other properties with very low loan to value ratios. As at September 30, 2014, the REIT had 41 properties valued at approximately $1.8 billion which are encumbered with mortgages totaling $403.6 million. In this pool of assets, the average loan to value is 22.9%, the maximum loan to value is 29.6% and the minimum loan to value is 8.4%.
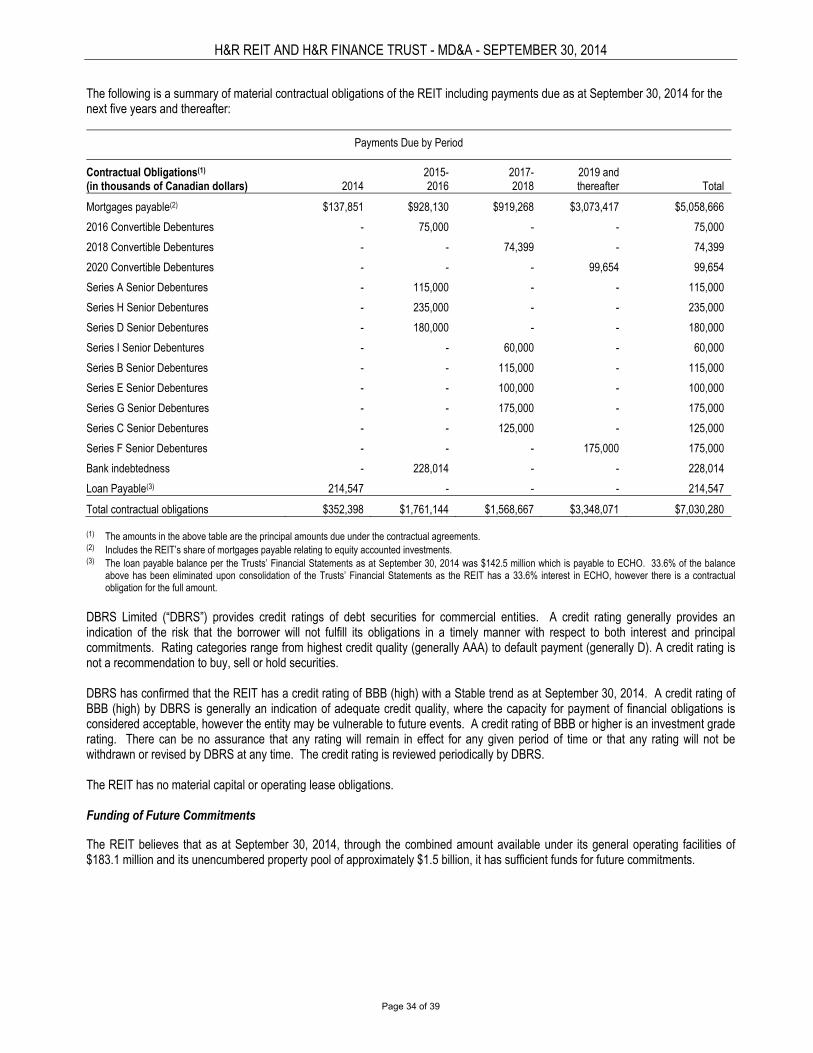
H&R REIT AND H&R FINANCE TRUST - MD&A - SEPTEMBER 30, 2014
Page 34 of 39
The following is a summary of material contractual obligations of the REIT including payments due as at September 30, 2014 for the next five years and thereafter:
Payments Due by Period
Contractual Obligations(1) (in thousands of Canadian dollars)
2014
2015-2016
2017-2018
2019 and thereafter
Total
Mortgages payable(2) $137,851 $928,130 $919,268 $3,073,417 $5,058,666
2016 Convertible Debentures - 75,000 - - 75,000
2018 Convertible Debentures - - 74,399 - 74,399
2020 Convertible Debentures - - - 99,654 99,654
Series A Senior Debentures - 115,000 - - 115,000
Series H Senior Debentures - 235,000 - - 235,000
Series D Senior Debentures - 180,000 - - 180,000
Series I Senior Debentures - - 60,000 - 60,000
Series B Senior Debentures - - 115,000 - 115,000
Series E Senior Debentures - - 100,000 - 100,000
Series G Senior Debentures - - 175,000 - 175,000
Series C Senior Debentures - - 125,000 - 125,000
Series F Senior Debentures - - - 175,000 175,000
Bank indebtedness - 228,014 - - 228,014
Loan Payable(3) 214,547 - - - 214,547
Total contractual obligations $352,398 $1,761,144 $1,568,667 $3,348,071 $7,030,280 (1) The amounts in the above table are the principal amounts due under the contractual agreements. (2) Includes the REIT’s share of mortgages payable relating to equity accounted investments. (3) The loan payable balance per the Trusts’ Financial Statements as at September 30, 2014 was $142.5 million which is payable to ECHO. 33.6% of the balance
above has been eliminated upon consolidation of the Trusts’ Financial Statements as the REIT has a 33.6% interest in ECHO, however there is a contractual obligation for the full amount.
DBRS Limited (“DBRS”) provides credit ratings of debt securities for commercial entities. A credit rating generally provides an indication of the risk that the borrower will not fulfill its obligations in a timely manner with respect to both interest and principal commitments. Rating categories range from highest credit quality (generally AAA) to default payment (generally D). A credit rating is not a recommendation to buy, sell or hold securities. DBRS has confirmed that the REIT has a credit rating of BBB (high) with a Stable trend as at September 30, 2014. A credit rating of BBB (high) by DBRS is generally an indication of adequate credit quality, where the capacity for payment of financial obligations is considered acceptable, however the entity may be vulnerable to future events. A credit rating of BBB or higher is an investment grade rating. There can be no assurance that any rating will remain in effect for any given period of time or that any rating will not be withdrawn or revised by DBRS at any time. The credit rating is reviewed periodically by DBRS. The REIT has no material capital or operating lease obligations. Funding of Future Commitments
The REIT believes that as at September 30, 2014, through the combined amount available under its general operating facilities of $183.1 million and its unencumbered property pool of approximately $1.5 billion, it has sufficient funds for future commitments.
H&R REIT AND H&R FINANCE TRUST - MD&A - SEPTEMBER 30, 2014
Page 35 of 39
The following summarizes the estimated loan to value ratios that will be outstanding on properties whose mortgages mature over the next five years, including investments in the Trusts’ share of mortgages relating to equity accounted investments:
Year
Number of Properties
Mortgage Debt due on Maturity ($000’s)(1)
Weighted Average Interest Rate on Maturity
Fair Value of Investment Properties ($000’s)(1)
Loan to Value
2014* 14 $91,080 5.7% $171,257 53%
2015 20 261,962 5.3% 664,123 39%
2016 46 313,736 5.4% 656,158 48%
2017 21 468,283 4.8% 959,911 49%
2018 36 119,712 5.4% 498,280 24%
2019 22 314,545 3.5% 861,388 37%
159 $1,569,318 4.8% $3,811,117 41% * For the balance of the year. (1) Converting U.S. dollars to Canadian dollars at an exchange rate of $1.12 as at September 30, 2014.
Based on the low percentage of the projected loan to values of the maturing mortgages, the REIT is confident it will be able to refinance these mortgages upon maturity should it choose to do so. OFF-BALANCE SHEET ITEMS
The REIT has co-owners and partners in various projects. As a rule the REIT does not provide guarantees or indemnities for these co-owners pursuant to property acquisitions because should such guarantees be provided, recourse would be available against the REIT in the event of a default of the co-owners. In such case, the REIT would have a claim against the underlying real estate investment. However, in certain circumstances, subject to compliance with the REIT’s Declaration of Trust and the determination by management that the fair value of the co-owners’ investment is greater than the mortgages payable for which the REIT has provided guarantees, such guarantees will be provided. At September 30, 2014, such guarantees amounted to $67.9 million expiring in 2016 (December 31, 2013 - $69.8 million, expiring in 2016), and no amount has been provided for in the Trusts’ Financial Statements for these items. These amounts arise where the REIT has guaranteed a co-owner’s share of the mortgage liability. The REIT, however, customarily guarantees or indemnifies the obligations of its nominee companies which hold separate title to each of its properties owned. In addition, the REIT continued to guarantee certain debt assumed by purchasers in connection with past dispositions of properties, and will remain liable thereunder until such debts are extinguished or the lenders agree to release the REIT’s guarantee. At September 30, 2014, the estimated amount of debt subject to such guarantees, and therefore the maximum exposure to credit risk is approximately $218.6 million, expiring between 2014 and 2020 (December 31, 2013 - $224.4 million, expiring between 2014 and 2020). There have been no defaults by the primary obligor for debts on which the REIT has provided its guarantees, and as a result, no contingent loss on these guarantees has been recognized in the Trusts’ Financial Statements. Related Party Transactions Prior to July 1, 2013, HRPM, a company partially owned by family members of the CEO, provided property management services for substantially all properties owned by the REIT, including leasing services, for a fee of 2% of gross revenue. HRPM also provided support services in connection with the acquisition, disposition and development activities of the REIT and was also entitled to an incentive fee. Acquisitions and development support services were provided for a fee of 2/3 of 1% of total acquisition and development costs. The support services relating to dispositions of investment properties were provided for a fee of 10% of the net gain on sale of investment properties adjusted for the add back of accumulated depreciation and amortization. Services were provided by HRPM pursuant to a property management agreement which was internalized effective June 30, 2013. Effective July 1, 2013, the REIT executed an agreement with HRPM to internalize the property management function. Upon closing of the transaction, HRRMSLP acquired HRPM’s REIT-related property management business in return for 9.5 million partnership units of HRRMSLP, such units to be exchangeable on a one-for-one basis for Stapled Units. In June 2014, the unitholders of the REIT approved the granting of voting rights to these 9.5 million partnership units. The cost of internalizing the property management function, including the value of exchangeable units of $194.8 million issued, was $198.2 million. These costs were expensed as transaction costs in the period incurred. No transaction costs were expensed in the three month period or nine-month period ended September 30, 2014.
H&R REIT AND H&R FINANCE TRUST - MD&A - SEPTEMBER 30, 2014
Page 36 of 39
Effective July 1, 2013, the REIT entered into an agreement with HRPM for HRPM to provide specified services including the cost sharing of premises, certain personnel, equipment and support systems, as well as additional services to be agreed upon from time to time. The agreement will continue until terminated by either party in accordance with the terms of the agreement. During the three months ended September 30, 2014, the REIT incurred costs of $0.4 million (September 30, 2013 - $0.2 million) under this agreement. During the nine months ended September 30, 2014, the REIT incurred costs of $1.1 million (September 30, 2013 - $0.2 million) under this agreement. During the three months ended September 30, 2014 and September 30, 2013, the REIT recorded nil expenses pursuant to the property management agreement as this function has been internalized. During the nine months ended September 30, 2013, the REIT recorded expenses pursuant to the property management agreement of $8.2 million, of which $0.6 million was capitalized to the cost of the investment properties acquired, nil was capitalized to properties under development and $2.0 million was capitalized to leasing expenses. These amounts include amounts relating to equity accounted investments. The REIT also reimbursed HRPM for certain direct property operating costs and tenant construction costs. No amounts were incurred during the nine months ended September 30, 2014 as this function has been internalized. For the nine months ended September 30, 2013, a further amount of $2.3 million was earned by HRPM pursuant to the property management agreement, in accordance with the annual incentive fee payable to HRPM. Of this amount, $1.1 million was waived by HRPM and $1.1 million was expensed in the unaudited condensed combined interim statement of comprehensive income. No amounts were incurred during the nine months ended September 30, 2014 as this function has been internalized. The REIT leases space to companies partially owned by family members of the CEO. The rental income earned for the three months ended September 30, 2014 is $0.4 million (September 30, 2013 - $0.3 million) and for the nine months ended September 30, 2014 is $1.1 million (September 30, 2013 - $1.1 million). These transactions are measured at the amount of consideration established and agreed to by the related parties. FINANCIAL INSTRUMENTS AND OTHER INSTRUMENTS Where appropriate, the REIT uses forward contracts to lock-in lending rates on certain anticipated mortgages. This strategy provides certainty to the rate of interest on borrowings when the REIT is involved in transactions that may close further into the future than usual for typical transactions. The REIT has entered into an interest rate swap on one U.S. mortgage which effectively locked the interest rate at 5.25%. At the end of each reporting period, this interest rate swap is marked-to-market, resulting in an unrealized gain or loss recorded in net income. Where appropriate, the REIT uses forward exchange contracts to lock-in foreign exchange rates. This strategy provides certainty in the foreign exchange rates on transactions that will occur in the future. SECTION IV CRITICAL ACCOUNTING ESTIMATES AND JUDGEMENTS
Preparation of the Trusts’ Financial Statements requires management to make estimates and judgements that affect the reported amounts of assets and liabilities, disclosure of contingent assets and liabilities at the date of the financial statements and reported amounts of revenue and expenses during the reporting period. Management believes the policies which are subject to greater estimation and judgement are outlined below. For a detailed description of these and other accounting policies refer to notes 1 and 2 of the Trusts’ Financial Statements and notes 1, 2 and 3 of the Trust’s December 31, 2013 combined financial statements.
H&R REIT AND H&R FINANCE TRUST - MD&A - SEPTEMBER 30, 2014
Page 37 of 39
Use of Estimates Information about assumption and estimation uncertainties that have a significant risk of resulting in a material adjustment within the next financial year are: Fair value of real estate assets; Fair value of financial instruments; Fair value of cash-settled unit-based compensation;
Fair value of convertible debentures; and
Fair value of exchangeable units. Use of Judgements Business combinations
Accounting for business combinations under IFRS 3, Business Combinations (“IFRS 3”) is only applicable if it is determined that a business has been acquired. Under IFRS 3, a business is defined as an integrated set of activities and assets conducted and managed for the purpose of providing a return to investors or lower costs or other economic benefits directly and proportionately to the REIT. A business generally consists of inputs, processes applied to those inputs and resulting outputs that are, or will be, used to generate revenues. In the absence of meeting such criteria, a group of assets is deemed to have been acquired. If goodwill is present in a transferred set of activities and assets, the transferred set is presumed to be a business. Judgement is used by management in determining whether the acquisition of an individual property qualifies as a business combination in accordance with IFRS 3 or as an asset acquisition. The acquisition of Primaris on April 4, 2013 has been recorded as a business combination. See note 6 of the Trusts’ Financial Statements.
Valuations of real estate assets
Real estate assets, which consist of investment properties and properties under development, are carried on the unaudited condensed combined interim statements of financial position at fair value, as determined by either qualified external valuation professionals or by management. The valuations are based on a number of assumptions, such as appropriate discount rates and capitalization rates and estimates of future rental income, operating expenses and capital expenditures. Valuation of real estate assets is one of the principal estimates and uncertainties of the REIT. Refer to note 4 of the Trusts’ Financial Statements for further information on estimates and assumptions made in the determination of the fair value of real estate assets.
Leases
The REIT’s policy for property rental revenue recognition is described in note 2(g) of the December 31, 2013 combined financial statements of the Trusts. The REIT makes judgements in determining whether certain leases, in particular those tenant leases with long contractual terms and long-term ground leases where the REIT is the lessor, are operating or finance leases. The REIT has determined that all of its leases are operating leases.
Income taxes
The REIT currently qualifies as a real estate investment trust and a mutual fund trust for Canadian income tax purposes. A real estate investment trust will not be subject to the tax levied on “specified investment flow-through” (“SIFT”) trusts provided it continues to meet prescribed conditions under the Tax Act, including with respect to the nature of its assets and revenue, (the “REIT Conditions”) at all times throughout a taxation year. Accordingly, no provision for current or deferred income taxes has been recorded by the REIT at September 30, 2014 in respect of its Canadian entities. The REIT will not be subject to income tax in a year to the extent that it continues to qualify as a real estate investment trust and distributes all of its taxable income to its unitholders. Income allocated to unitholders will be taxed at the unitholder level. The
H&R REIT AND H&R FINANCE TRUST - MD&A - SEPTEMBER 30, 2014
Page 38 of 39
REIT currently distributes, and is required to distribute, all of its income to its unitholders. Accordingly, for financial statement reporting purposes, the tax deductibility of the REIT’s distributions is treated as an exemption from taxation. Deferred income taxes are recognized in respect of U.S. Holdco for the temporary differences between the financial statement carrying amounts of assets and liabilities and their respective tax bases. Deferred income tax assets and liabilities are measured using enacted or substantively enacted tax rates and laws that are expected to apply to taxable income in the years in which those temporary differences are expected to be reversed or settled. The effect on deferred income tax assets and liabilities of a change in tax rate is recognized in income or unitholders’ equity, as appropriate, in the period that includes the date of enactment or substantive enactment. Deferred tax assets are recognized for all deductible temporary differences, unused tax credits and unused tax losses to the extent that it is probable that taxable profit will be available against which these tax benefits can be utilized.
Tenant improvements
The REIT makes judgements with respect to whether tenant improvements provided in connection with a lease enhance the value of the leased property, which determines whether such amounts are capitalized to investment properties.
Impairment of equity accounted investments The REIT determines at each reporting date whether there is any objective evidence that the equity accounted investments are impaired. If so, the REIT calculates the amount of impairment as the difference between the recoverable amount of the equity accounted investment and its carrying value and recognizes the amount in net income.
INTERNAL CONTROL OVER FINANCIAL REPORTING Each of the Trust’s CEO and CFO has designed, or caused to be designed under their direct supervision, the applicable Trusts’ disclosure controls and procedures (as defined in National Instrument 52-109 - Certification of Disclosure in Issuers’ Annual and Interim Filings (“NI 52-109”), adopted by the Canadian Securities Administrators to provide reasonable assurance that: (i) material information relating to the applicable Trust, including its consolidated subsidiaries, is made known to them by others within those entities, particularly during the period in which the annual filings are being prepared; and (ii) material information required to be disclosed in the annual filings is recorded, processed, summarized and reported on a timely basis. The Trusts’ Financial Statements and this MD&A were reviewed and approved by the REIT’s Audit Committee and the Board of Trustees prior to this publication. Management of each Trust has reviewed its internal control over financial reporting on an annual basis. The Trusts have developed their internal control over financial reporting in accordance with the Integrated COSO Framework (1992). In 2013, the Committee of Sponsoring Organizations of the Treadway Commission issued an updated Internal Control Integrated Framework known as COSO (2013). The Trusts expect to transition to this updated framework on or before December 15, 2014, the required transition date, and are currently considering the impact that COSO 2013 will have on their internal controls over financing reporting. No changes were made to the design of either Trust’s internal control over financial reporting during the three months ended September 30, 2014 that have materially affected, or are reasonably likely to materially affect, the Trusts’ internal control over financial reporting. Each Trust’s management, including the CEO and CFO, does not expect that the applicable Trusts’ controls and procedures will prevent or detect all misstatements due to error or fraud. Due to the inherent limitations in all control systems, an evaluation of controls can provide only reasonable, not absolute assurance, that all control issues and instances of fraud or error, if any, within the Trusts have been detected. The Trusts are continually evolving and enhancing their systems of controls and procedures. SECTION V RISKS AND UNCERTAINTIES
All real estate assets are subject to a degree of risk and uncertainty. They are affected by various factors including general market conditions and local market circumstances. An example of general market conditions would be the availability of long-term mortgage financing whereas local conditions would relate to factors affecting specific properties such as an oversupply of space or a reduction in demand for real estate in a particular area. Management attempts to manage these risks through geographic, type of asset and tenant diversification in the REIT’s portfolio. The major risk factors including detailed descriptions are included in the “Risks and Uncertainties” section of the December 31, 2013 annual MD&A and in the “Risk Factors” section of the REIT’s 2013 Annual Information Form.
H&R REIT AND H&R FINANCE TRUST - MD&A - SEPTEMBER 30, 2014
Page 39 of 39
OUTSTANDING UNIT DATA The beneficial interests in each of the Trusts are represented by a single class of units of each Trust respectively, which are unlimited in number. Each such unit carries a single vote at any meeting of unitholders of the respective Trust. As at November 10, 2014, there were 274,170,669 Stapled Units issued and outstanding (each comprised of a REIT unit and a Finance Trust unit). As at September 30, 2014, the maximum number of units authorized to be granted under the REIT’s Unit Option Plan was 28,000,000. Of this amount, 12,428,066 had been granted and 7,132,499 had been exercised and expired. As at November 10, 2014, there were 5,295,567 options to purchase Stapled Units outstanding of which 2,906,308 are fully vested. As at September 30, 2014, the maximum number of units authorized to be granted under the REIT’s Incentive Unit Plan was 5,000,000. Of this amount, 159,879 Stapled Units have been granted. As at November 10, 2014, 160,687 Stapled Units have been granted. The following table lists the principal outstanding balance of the REIT’s convertible debentures as at November 10, 2014 and the number of Stapled Units required to convert the convertible debentures to equity:
Convertible Debentures
Principal outstanding as at November 10, 2014
Maximum number of Stapled Units issuable
2016 Convertible Debentures (HR.DB.E) $75.0 million 2,918,287
2018 Convertible Debentures (HR.DB.H) 74.4 million 3,008,451
2020 Convertible Debentures (HR.DB.D) 99.7 million 4,240,595
SUBSEQUENT EVENTS (a) In October 2014, the REIT repaid two U.S. mortgages of approximately U.S. $19.0 million, bearing interest at a weighted average
rate of 5.4%.
(b) In October and November 2014, the REIT repaid 11 Canadian mortgages of approximately $70.0 million bearing interest at a weighted average rate of 5.8%.
ADDITIONAL INFORMATION Additional information relating to the REIT and Finance Trust, including the REIT’s Annual Information Form, is available on SEDAR at www.sedar.com.

Unitholder Distribution Reinvestment Plan and Unit Purchase Plan
Since January 1, 2000, H&R has offered registered holders of stapled units resident in Canada the opportunity to participate in its Unitholder Distribution Reinvestment Plan (the "DRIP") and Unit Purchase Plan.
The DRIP allows participants to have their monthly cash distributions reinvested in additional stapled units at the weighted average price of the stapled units on the TSX for the five trading days (the "Average Market Price") immediately preceding the cash distribution date. In addition, participants will be entitled to receive an additional distribution equal to 3% of each cash distribution reinvested pursuant to the DRIP which will be reinvested in additional stapled units.
The Unit Purchase Plan allows participants to purchase additional stapled units on a monthly basis at the Average Market Price subject to a minimum purchase of $250 per month (up to a maximum of $13,500 per year) for each participant.
For more information on the DRIP and/or the Unit Purchase Plan, please contact us by email through the "Contact Us" webpage of our website or contact the plan agent: CST Trust Company, P.O. Box 7010, Adelaide Street Postal Station, Toronto, Ontario M5C 2W9, Tel: 416-643-5500 (or for callers outside of the 416 area code: 1-800-387-0825), Fax: 416-643-5501, Email: [email protected], Website: www.canstockta.com.
Corporate Information H&R REIT Board of Trustees Thomas J. Hofstedter (1), President and Chief Executive Officer, H&R Real Estate Investment Trust Robert Dickson (1,2,3,4), Strategic financial consultant, marketing communications industry Edward Gilbert (1,2,3,4), Chief Operating Officer, Firm Capital Mortgage Investment Trust Laurence A. Lebovic (1,2, 3,4), Chief Executive Officer, Runnymede Development Corporation Ltd. Ronald C. Rutman (1,2,3,4), Partner, Zeifman & Company, Chartered Accountants H&R Finance Trust Board of Trustees Thomas J. Hofstedter, President and Chief Executive Officer, H&R Real Estate Investment Trust Shimshon (Stephen) Gross (2), President, LRG Holdings Inc. Marvin Rubner (2), Manager and Founder, YAD Investments Limited. Neil Sigler (2), Vice President, Gold Seal Management Inc. (1) Investment Committee (2) Audit Committee (3) Compensation and Governance Committee (4) Nominating Committee Officers Thomas J. Hofstedter, President and Chief Executive Officer Larry Froom, Chief Financial Officer Nathan Uhr, Chief Operating Officer (H&R REIT) Pat Sullivan, Chief Operating Officer (Primaris) Cheryl Fried, Executive Vice-President, Finance (H&R REIT) Lesley Gibson, Executive Vice-President, Finance (Primaris) Blair Kundell, Vice-President, Operations (H&R REIT) Jason Birken, Vice-President, Finance (H&R REIT) Auditors: KPMG LLP Legal Counsel: Blake, Cassels & Graydon LLP Taxability of Distributions: 53% of the distributions made by H&R REIT and 5% of the distributions made by H&R Finance Trust to unitholders during 2013 were tax deferred. Plan Eligibility: RRSP, RRIF, DPSP, RESP, RDSP, TFSA Stock Exchange Listing: Stapled Units and debentures of H&R are listed on the Toronto Stock Exchange under the trading symbols HR.UN; HR.DB.D, HR.DB.E and HR.DB.H. Unitholder Distribution Reinvestment Plan and Direct Unit Purchase Plan: Since January 2000, H&R REIT has offered registered holders of its units resident in Canada the opportunity to participate in its Unitholder Distribution Reinvestment Plan (the “DRIP”) and Direct Unit Purchase Plan. The DRIP allows participants to have their monthly cash distributions of H&R REIT reinvested in additional Stapled Units of H&R at a 3% discount to the weighted average price of the Stapled Units on the TSX for the five trading days (the “Average Market Price”) immediately preceding the cash distribution date. The Direct Unit Purchase Plan allows participants to purchase additional Stapled Units on a monthly basis at the Average Market Price subject to a minimum purchase of $250 per month (up to a maximum of $13,500 per year) for each participant. For more information on the DRIP and/or the Direct Unit Purchase Plan, please contact us by email through the “Contact Us” webpage of our website, or contact our Registrar and Transfer Agent. Registrar and Transfer Agent: CST Trust Company, P.O. Box 7010, Adelaide Street Postal Station, Toronto, Ontario, Canada M5C 2W9 Telephone: 416-643-5500 within the Toronto area or 1-800-387-0825, Fax: 416-643-5501, E-mail: [email protected], Website: www.canstockta.com. Contact Information: Investors, investment analysts and others seeking financial information should go to our website at www.hr-reit.com, or e-mail [email protected], or call 416-635-7520 and ask for Larry Froom, Chief Financial Officer, or fax 416-398-0040, or write to H&R Real Estate Investment Trust, 3625 Dufferin Street, Suite 500, Toronto, Ontario, Canada, M3K 1N4

H&R Real Estate Investment Trust and H&R Finance Trust
www.HR-REIT.com
The Bow, Calgary Scotia Plaza, Toronto
Corus Quay, Toronto


![R Q3 / Q1 Flowkesko-onninen-pim-resources-production.s3-website-eu-west-1.amaz… · Flow rate sensor Q3 [m3/h] 1.6 / 2.5 / 4.0 R Q3 / Q1 Q3 1.6: 250 / 315 Q3 2.5: 250 / 400 Q3 4.0:](https://img.pdfslide.us/doc/110x75/5f73fc3957c683618b067c22/r-q3-q1-flowkesko-onninen-pim-resources-productions3-website-eu-west-1amaz.jpg)